Article

Determinants of Electric Vehicle Adoption Intentions in Turkey: An Explainable Machine Learning Analysis of Economic, Infrastructure, and Behavioral Factors


by
İlayda Nur Şişman
1 and
Burcu Çarklı Yavuz
2,*
1
Department of Information Systems Engineering, Institute of Natural Sciences, Sakarya University, 54187 Sakarya, Turkey
2
Department of Information Systems Engineering, Faculty of Computer and Information Sciences, Sakarya University, 54187 Sakarya, Turkey
*
Author to whom correspondence should be addressed.
Sustainability 2026, 18(5), 2463; https://doi.org/10.3390/su18052463
Submission received: 13 January 2026 / Revised: 29 January 2026 / Accepted: 19 February 2026 / Published: 3 March 2026
(This article belongs to the Section Sustainable Transportation)

Abstract

The transportation sector is a major contributor to global greenhouse gas emissions, making electric vehicle (EV) adoption critical for decarbonization. This study investigates EV adoption determinants in Turkey using explainable machine learning, focusing on economic, infrastructure, and attitudinal factors while exploring driver behavior and fuel-efficiency awareness. Data from 304 participants were collected; after excluding undecided responses, the final analytical sample comprised 232 participants. Multiple algorithms (Random Forest, XGBoost, Logistic Regression, and SVM) were evaluated, addressing class imbalance via SMOTETomek. SHAP analysis identified policy-relevant predictors. Results reveal that EV adoption intentions are primarily driven by perceived cost impact, EV knowledge, and charging infrastructure accessibility, showing substantially stronger effects than driver behavior. Exploratory analysis indicates that aggressive driving correlates with lower fuel-efficiency awareness, whereas maintenance and eco-driving support higher awareness. The best-performing Random Forest model achieved 89.36% accuracy and a 0.9348 F1-score. Rather than claiming novelty in ML application, this study contributes an interpretable framework and emerging-market evidence contrasting economic/infrastructure factors against behavioral variables. Findings provide actionable insights for policy, highlighting cost-focused incentives, infrastructure deployment, and targeted awareness campaigns.

1. Introduction

The efficient utilization of energy resources and environmental sustainability have emerged as critical priorities for both individuals and societies in the face of escalating climate change and resource depletion. Transportation, as one of the largest contributors to global greenhouse gas emissions, plays a pivotal role in this context. Reducing dependency on fossil fuels and minimizing carbon emissions are essential steps toward achieving a sustainable future. Electric vehicles (EVs) represent a transformative opportunity in this regard, offering significant economic and environmental benefits. However, the widespread adoption of EVs continues to face substantial barriers, including entrenched driving behaviors, inadequate charging infrastructure, high upfront costs, and limited public awareness.
In recent years, artificial intelligence (AI) and machine learning (ML) techniques have increasingly been employed to analyze determinants of electric vehicle adoption and sustainable transportation behaviors. Understanding the factors that influence EV adoption intentions—including economic barriers, infrastructure availability, and public awareness—is critical for designing effective policies to accelerate the transition to electric mobility [1,2,3]. While driver behaviors and fuel efficiency awareness have also been explored in the literature as potential contextual factors [4], recent evidence suggests that economic and infrastructure considerations play a more dominant role in shaping EV adoption decisions [5,6]. This study therefore focuses primarily on identifying these key determinants while also exploring the secondary role of driving habits and fuel consumption awareness.

1.1. Background and Motivation

Reducing transport-related emissions is a core sustainability challenge, as road transportation substantially contributes to greenhouse gas emissions and local air pollution. Two complementary pathways are central to sustainable transportation strategies: improving energy efficiency in current vehicle use (e.g., eco-driving and maintenance) and accelerating the transition to electric vehicles (EVs). However, EV adoption remains constrained by perceived upfront costs, limited charging availability, and uneven public knowledge, while energy-efficient driving behaviors depend on habits, awareness, and feedback mechanisms such as telematics. Understanding how behavioral and perception-based factors relate to both fuel-efficiency awareness and EV adoption intentions can support more targeted interventions for transport decarbonization.

The Turkish Context and Generalizability Considerations

This study is conducted in Turkey, an emerging market with distinctive characteristics that shape EV adoption dynamics. Turkey experiences relatively high fuel prices compared to income levels, limited but expanding charging infrastructure, recent government incentives for EV purchases (including reduced special consumption tax and customs duties), and low current EV penetration (less than 1% of new vehicle sales as of 2024). These contextual factors may amplify the salience of cost perceptions and infrastructure concerns relative to behavioral factors in shaping adoption intentions. Consequently, findings from this study may be most directly applicable to other emerging markets with similar economic constraints and infrastructure development stages (e.g., Eastern Europe, Latin America, Southeast Asia). Generalizability to developed markets with mature EV ecosystems (e.g., Norway, Netherlands, California) should be approached cautiously, as the relative importance of adoption determinants may differ substantially. Future cross-cultural validation studies are essential to identify universal versus context-specific drivers of EV adoption and to refine policy recommendations for diverse geographic and economic settings.

1.2. Literature Review on Driver Behavior, Fuel Efficiency, and Electric Vehicle Adoption

Although the literature on driver behavior and fuel consumption is extensive, the present study reviews this body of work primarily to contextualize behavioral variables, while positioning determinants of EV adoption as the central analytical focus. The relationship between driver behavior and fuel consumption has been extensively studied over the past two decades. Wang et al. [7] conducted a pioneering study in 2010, classifying drivers into categories such as aggressive-cautious and risk-prone-risk-averse using K-means clustering on data from in-vehicle systems. Their findings revealed that aggressive drivers maintained shorter time headway (THW), while less skilled drivers exhibited frequent sudden braking. The following year, Thitipatanapong and Luangnarutai [4] analyzed the impact of driving styles on fuel economy in Thailand, demonstrating that aggressive driving significantly increased fuel consumption due to excessive acceleration and sudden maneuvers.
Research by Wang et al. [8] in 2013 explored the influence of human factors on driving behaviors and fuel consumption, showing that younger drivers tended to be more aggressive, while older drivers were more cautious. Similarly, Werner [9] analyzed 17 million driving data points, concluding that efficient driving styles could reduce fuel consumption by up to 26%. Ligterink and Eijk [10] highlighted a significant discrepancy—up to 200%—between real-world and official fuel consumption values for plug-in hybrids, emphasizing the critical role of driving conditions.
In 2015, Jamson et al. [11] evaluated the effectiveness of visual and haptic feedback systems for eco-driving. While visual feedback improved fuel efficiency, it was found to be distracting, whereas haptic systems enhanced safety without compromising driver attention. Pampel et al. [2] demonstrated that eco-driving reduced fuel consumption by 7.7% in urban areas but posed certain safety risks that required careful consideration. Lai [12] further showed that reward systems could achieve over 10% fuel savings, while Holmén and Sentoff [13] revealed that hybrid vehicles reduced urban CO2 emissions by 55%, though their efficiency diminished on highways.
Eco-driving training programs also gained significant attention in subsequent years. Nocera et al. [6] reported a 5.5% reduction in fuel consumption for heavy-duty vehicles following training. Faria et al. [14] found that energy consumption increased by 54% on local roads and 16% during rainy weather, highlighting the importance of environmental conditions. Kanagaraj and Treiber [1] demonstrated that stop-and-go traffic and aggressive acceleration significantly raised fuel consumption and emissions. Heijne and Ligterink [15,16] analyzed Euro VI heavy-duty vehicles, finding that NOx emissions increased in congested traffic, while higher speeds improved control system efficiency.
Consumer behavior and technological advancements were also key areas of focus. Leard [17] explored consumer inattention to fuel cost savings, showing that willingness to pay (WTP) for savings varied significantly based on attention levels. Wang and Boggio-Marzet [5] found that eco-driving training reduced fuel consumption by 6.3%, with arterial roads offering the highest savings. Ping et al. [3] utilized machine learning to classify drivers and predict fuel consumption, achieving 79.31% accuracy. Lee and Wu [18] analyzed electric vehicle driving patterns, finding that aggressive driving increased energy consumption by 30%.
Further advancements in technology were highlighted in studies from 2020 onwards. Zhang et al. [19] linked socio-demographic factors to fuel efficiency, showing that drivers with high speed variance had the lowest efficiency. Sanguinetti et al. [20] identified a 6.6% improvement in fuel economy through in-vehicle eco-driving feedback, with real-time systems proving most effective. Van Gijlswijk et al. [21] analyzed millions of fuel refill and charging records, finding that electric vehicle energy consumption was 18% higher than WLTP values, underscoring the gap between laboratory and real-world performance.
The impact of eco-driving practices continued to be a focus in subsequent years. Fafoutellis et al. [22] demonstrated that eco-driving reduced fuel consumption by 15–25% using physics-based and data-driven models. Huang et al. [23] found that novice drivers exhibited 2% higher fuel consumption due to aggressive throttle use. Zhang et al. [24] showed that autonomous vehicles reduced fuel consumption by up to 14.7% by minimizing speed fluctuations. Su et al. [25] highlighted the negative impacts of aggressive driving on safety and energy consumption, while Zhao et al. [26] demonstrated the accuracy of machine learning models in predicting fuel consumption.
Recent studies have further emphasized the role of driving behaviors and technological innovations. Graba et al. [27] identified a linear relationship between acceleration intensity and fuel consumption, proposing a “dynamic index” for optimization. Zhou et al. [28] emphasized the discrepancy between laboratory and real-world fuel consumption tests, advocating for regulatory changes. Peng et al. [29] achieved accurate fuel consumption predictions for hybrid vehicles using Gaussian Mixture Models. Kumar and Jain [30] classified driving behaviors with 100% accuracy using machine learning, identifying speed stability and braking habits as key factors.
Naseri et al. [31] explored electric vehicle (EV) purchase decisions using machine learning models, achieving 87.4% accuracy. Their findings highlighted the influence of factors such as climate change awareness, socio-demographics, and the price ratio of EVs to internal combustion engine vehicles (ICEVs). Additionally, Zhang et al. [32] analyzed over 4000 transportation records, showing that aggressive accelerations, despite accounting for only 6% of travel distance, contributed to 20% of fuel consumption. Both studies emphasized the importance of behavioral and technological factors in reducing energy consumption and emissions.
Recent comprehensive reviews have further strengthened the understanding of EV adoption dynamics. Pamidimukkala et al. [33] conducted a global review of barriers and motivators to EV adoption, identifying key factors such as purchase cost, charging infrastructure availability, driving range anxiety, and environmental awareness across different geographical contexts. Their systematic analysis revealed that while economic barriers remain significant, infrastructure development and policy incentives play crucial roles in accelerating adoption rates. Similarly, Li et al. [34] examined the integration of electric vehicles with transportation networks and power grids, emphasizing the importance of smart management systems for optimizing charging strategies and grid stability. These studies underscore the multifaceted nature of EV adoption, where economic considerations, infrastructure readiness, and behavioral factors interact to shape consumer decisions—a perspective that aligns with the integrated approach adopted in the present study.
Finally, studies from 2024 have highlighted the potential of AI-based systems in optimizing energy efficiency. Ma et al. [35] developed AI-driven models that reduced energy consumption by 46% through reinforcement learning. Canal et al. [36] demonstrated the potential of real-time feedback to optimize fuel consumption, achieving high accuracy in predictions. Haghshenas et al. [37] found that aggressive acceleration and sudden braking increased fuel consumption by up to 20%. Romero et al. [38] highlighted strategies such as lightweight materials and traffic flow improvements, achieving up to 30% fuel savings.

1.3. Research Gap and Objectives

This research builds upon and significantly extends the preliminary analysis conducted in [39], applying a more comprehensive methodological framework and an expanded set of interpretable machine learning models to examine EV adoption determinants in the Turkish context.
The reviewed literature underscores the significant impact of driving behaviors on fuel consumption and energy efficiency. Aggressive driving increases fuel usage, while eco-driving and technological advancements, particularly in AI and machine learning, offer promising solutions. However, several critical research gaps remain:
  • Most existing studies focus exclusively on either fuel efficiency or EV adoption, but few integrate both dimensions to understand how driver behaviors influence both fuel consumption and the transition to electric mobility.
  • Limited research has been conducted on the role of driver knowledge, cost perceptions, and charging infrastructure accessibility in shaping EV adoption intentions, particularly in emerging markets.
  • While machine learning has been applied to EV adoption, fewer studies employ explicitly interpretable ML frameworks that jointly analyze economic, infrastructure, and behavioral variables to explicitly compare their relative predictive contributions, particularly in emerging-market contexts.
  • The effectiveness of data augmentation techniques such as SMOTE in addressing class imbalances in EV adoption prediction has not been thoroughly investigated.
In light of these gaps, the primary objective of this study is to comprehensively examine the impact of driver behaviors on fuel consumption and efficiency while simultaneously investigating the factors influencing electric vehicle adoption. Specifically, this study aims to:
  • Identify the key determinants of EV adoption intentions in Turkey, with primary focus on economic factors (cost perceptions), infrastructure factors (charging accessibility), and attitudinal factors (EV knowledge).
  • Explore the relationships between driver demographics, driving habits, and fuel consumption awareness as secondary dimensions that may influence EV adoption.
  • Develop and evaluate machine learning models (Random Forest, XGBoost, Logistic Regression, SVM) to predict EV adoption intentions with high accuracy.
  • Assess the effectiveness of data augmentation techniques (SMOTE) and feature engineering in improving model performance, with careful attention to overfitting risks on small samples.
  • Provide actionable recommendations for policymakers and stakeholders to accelerate EV adoption through cost-focused incentives, charging infrastructure deployment, and targeted awareness campaigns.

1.4. Contributions and Significance

This study makes several important contributions to the literature and practice:
  • Comprehensive Analysis of EV Adoption Determinants: This research provides a holistic understanding of EV adoption intentions by examining economic, infrastructure, and attitudinal factors as primary determinants, while also exploring the role of driver behaviors and fuel efficiency awareness as contextual dimensions.
  • Comprehensive Dataset: The study is based on an initial survey of 304 participants, resulting in a final analytical sample of 232 respondents after excluding neutral (“undecided”) responses to ensure clear classification. The dataset captures detailed information on demographics, driving patterns, fuel consumption awareness, and attitudes toward EVs.
  • Machine Learning with Interpretability: Multiple machine learning models are evaluated and complemented with SHAP-based explanations to identify policy-relevant predictors of EV adoption intention.
  • Actionable Insights: The findings provide practical recommendations for enhancing public awareness, improving charging infrastructure, addressing cost barriers, and promoting eco-driving practices to support sustainable transportation.
  • Policy Implications: The results can inform policymakers in designing targeted interventions to accelerate EV adoption and reduce transportation-related emissions, contributing to global sustainability goals.
  • Policy-Relevant Insights: The results prioritize actionable levers for sustainable transportation (information, infrastructure, and cost-related measures) based on explainable model outputs.
  • Methodological and Conceptual Contributions: While this study does not propose a novel theoretical model, it makes important methodological and conceptual contributions to the EV adoption literature. First, it demonstrates the practical utility of explainable AI (specifically SHAP analysis) for translating complex machine learning predictions into actionable policy insights, bridging the gap between predictive accuracy and interpretability. Second, it provides empirical evidence from an emerging market context (Turkey), where EV adoption dynamics may differ substantially from developed markets due to economic constraints, infrastructure limitations, and policy environments. This contributes to the growing body of evidence on context-specific adoption drivers and highlights the need for tailored policy approaches. Third, the study develops a policy-oriented analytical framework that integrates behavioral, attitudinal, and socioeconomic factors to identify high-leverage intervention points for sustainable transportation. Rather than advancing abstract theory, this research prioritizes practical applicability and policy relevance, offering a replicable methodology for evidence-based transportation planning in diverse geographic and economic settings.
The remainder of this paper is organized as follows: Section 2 describes the methodology, including survey design, data collection, preprocessing, and machine learning techniques. Section 3 presents the experimental results, including baseline model performance, the impact of removing undecided responses, data augmentation with SMOTE, feature importance analysis, and SHAP interpretability. Section 4 discusses the findings in the context of existing literature and highlights limitations. Finally, Section 5 concludes the paper and suggests directions for future research.

2. Materials and Methods

2.1. Data Collection and Survey Design

This study employed a cross-sectional survey methodology to investigate the relationship between driver behavior, fuel efficiency, and electric vehicle (EV) adoption intentions. Data were collected through an online questionnaire distributed to drivers in Turkey in 2024. The survey instrument comprised 27 questions organized into five thematic domains: (1) demographic characteristics and driving profile, (2) driving behavior patterns, (3) fuel consumption awareness, (4) telematics usage, and (5) EV knowledge and adoption intentions.
Participation was voluntary, and informed consent was obtained from all respondents. The study protocol adhered to ethical guidelines for human subjects research. The survey was distributed via social media platforms, yielding 304 initial responses. For the primary analysis of EV adoption intentions, undecided responses (“I don’t know”) were excluded to focus on clear adoption preferences, resulting in a final analytical sample of 232 participants (185 in the training set, 47 in the test set after 80–20 stratified split). This exclusion strategy was chosen to improve model interpretability and reduce noise from ambiguous responses, though we acknowledge it may limit generalizability to populations with high uncertainty about EV adoption.

2.2. Survey Instrument and Variables

The questionnaire captured the following categories of variables:
  • Demographic and Driving Profile: Gender, age group, driving license tenure (years), vehicle type, vehicle model year, daily driving distance, fuel type, and primary vehicle usage purpose.
  • Driving Behavior Indicators: Average travel speed, frequency of speed limit violations, sudden acceleration/deceleration movements, sudden braking tendency, and traffic waiting time. These variables were measured using 5-point Likert scales ranging from “Never” (0) to “Always” (4).
  • Fuel Consumption Awareness: Self-assessed fuel consumption knowledge, fuel economy improvement measures, and regular vehicle maintenance practices.
  • Telematics Engagement: Usage of telematics devices or applications, frequency of telematics data tracking, and perceived impact of telematics data on driving behavior.
  • EV Adoption Factors: Current EV ownership status, future EV adoption intention (5-point Likert scale: 1 = Strongly Disagree, 5 = Strongly Agree), EV knowledge level, charging infrastructure adequacy perception, cost impact on vehicle choice, monthly income, and monthly fuel expenditure.

2.3. Feature Engineering

Two composite indices were constructed to capture latent behavioral patterns:
  • Aggressive Driving Score: Computed as the arithmetic mean of three normalized driving behavior indicators: speed limit violations, sudden movements, and sudden braking frequency. This score quantifies the intensity of aggressive driving tendencies.
    Aggressive Score = Speed Violation + Sudden Movements + Sudden Braking 3
  • Telematics Engagement Score: Derived from the binary responses to telematics usage and tracking questions, with values ranging from 0 (no engagement) to 4 (full engagement).

2.4. Target Variable Transformation

The original target variable, Future_EV_Interest, was measured on a 5-point Likert scale (1–5). To address class imbalance and improve model interpretability, we transformed this ordinal variable into a binary classification problem. Respondents who selected the neutral option (value = 3, “Undecided”) were excluded from the analysis, reducing the sample size from 304 to 232 observations. The remaining responses were recorded as follows:
  • Class 0 (Not Interested): Original values 1–2 (Strongly Disagree, Disagree)—60 samples (25.9%).
  • Class 1 (Interested): Original values 4–5 (Agree, Strongly Agree)—172 samples (74.1%).
This binary transformation yielded a clearer classification framework while maintaining the substantive distinction between EV adoption interest levels.

2.5. Data Preprocessing

All categorical variables were encoded using label encoding. Numerical features were standardized using z-score normalization (mean = 0, standard deviation = 1) to ensure comparability across variables with different scales. Critically, standardization was applied after the train–test split to prevent data leakage.
The dataset was partitioned into training (80%, n = 185 ) and test (20%, n = 47 ) sets using stratified random sampling to preserve class distribution. The training set contained 48 Class 0 and 137 Class 1 samples, while the test set comprised 12 Class 0 and 35 Class 1 samples.

2.6. Class Imbalance Handling

After removing undecided responses (neutral category, n = 72 ), the final dataset comprised 232 samples with a notable class imbalance. The dataset was split into training (80%, n = 185 ) and test (20%, n = 47 ) sets using stratified sampling to preserve class proportions. To address class imbalance and improve model performance, we applied a two-stage strategy combining synthetic oversampling with subsequent binary grouping.
Stage 1: Four-Class SMOTE Application
The training set exhibited the following class distribution: Class 1 (Strongly Disagree) = 31 samples (16.8%), Class 2 (Disagree) = 15 samples (8.1%), Class 4 (Agree) = 79 samples (42.7%), and Class 5 (Strongly Agree) = 60 samples (32.4%). We evaluated multiple SMOTE variants—standard SMOTE, ADASYN, BorderlineSMOTE, SMOTEENN, and SMOTETomek—to generate synthetic minority class samples by interpolating between existing instances in feature space. SMOTE was applied exclusively to the training set, balancing all four classes to match the majority class count (n = 79 per class), resulting in 316 samples (4 classes × 79 samples each).
Stage 2: Binary Grouping for Classification
Following SMOTE augmentation, the four balanced classes were merged into two binary categories to align with the study’s primary research objective of distinguishing EV adoption interest:
  • Class 0 (Not Interested): Original Classes 1–2 (Strongly Disagree, Disagree) → 158 samples (79 + 79)
  • Class 1 (Interested): Original Classes 4–5 (Agree, Strongly Agree) → 158 samples (79 + 79)
This two-stage approach preserves the ordinal structure during synthetic data generation while enabling interpretable binary classification for policy applications. The test set remained unchanged at 47 samples (12 Class 0, 35 Class 1) to provide an unbiased evaluation of model performance on the original data distribution. This approach prevents data leakage and ensures that model evaluation reflects real-world class imbalance conditions. Similarly, feature scaling was performed separately on training and test sets to ensure proper validation.
Alternative Strategy: Class Weighting
For comparison, we also evaluated models trained with inverse class frequency weights (Equation (2)) without synthetic oversampling:
w i = n total n classes × n i
where w i is the weight for class i, n total is the total number of samples, n classes is the number of classes, and n i is the number of samples in class i. Results demonstrated that SMOTE-based augmentation substantially outperformed class weighting alone (Section 3.4).

2.7. Machine Learning Models

Five supervised learning algorithms were trained and evaluated:
  • Logistic Regression (LR): A linear probabilistic classifier with L2 regularization (C = 0.1, max iterations = 1000).
  • Decision Tree (DT): A non-parametric tree-based classifier with entropy criterion and controlled depth to prevent overfitting.
  • Random Forest (RF): An ensemble of 100 decision trees with bootstrap aggregation. Hyperparameters: max depth = 8, min samples split = 10, min samples leaf = 5, max features = sqrt.
  • Support Vector Machine (SVM): A kernel-based classifier using radial basis function (RBF) kernel with automatic gamma scaling.
  • XGBoost (XGB): A gradient boosting framework with 100 estimators. Hyperparameters: max depth = 4, learning rate = 0.05, min child weight = 3, gamma = 0.1, subsample = 0.8.
All models were trained with class weighting enabled. Regularized versions of RF and XGB were implemented to mitigate overfitting by constraining tree depth and increasing minimum sample requirements.

2.8. Model Evaluation and Validation

Model performance was assessed using multiple metrics:
  • Accuracy: Overall classification correctness.
  • Precision: Proportion of true positives among predicted positives.
  • Recall (Sensitivity): Proportion of true positives among actual positives.
  • F1-Score: Harmonic mean of precision and recall.
  • ROC-AUC: Area under the receiver operating characteristic curve.
Cross-validation was performed using 5-fold stratified cross-validation on the training set to estimate model generalization. Overfitting was diagnosed by comparing training and test set accuracies; a gap exceeding 10% was considered indicative of overfitting. Additional overfitting controls included: (1) learning curves to visualize model performance as a function of training set size, (2) validation curves to assess the impact of key hyperparameters, and (3) comparison of cross-validation scores with test set performance. Given the small test set size (n = 47 after removing undecided responses), we acknowledge that perfect or near-perfect recall values should be interpreted with caution and do not necessarily indicate true generalization to larger populations.
Given the relatively small analytical sample (n = 232), we implemented multiple safeguards to mitigate overfitting and inflated performance estimates: (1) strict hyperparameter regularization (max depth = 8, min samples split = 10, min samples leaf = 5) to constrain model complexity; (2) 5-fold stratified cross-validation to estimate generalization on unseen training data; (3) separate feature scaling for training and test sets to prevent data leakage; (4) SMOTE applied exclusively to the training set, with the test set remaining unchanged to reflect real-world class imbalance; and (5) explicit comparison of cross-validation scores with test set performance to detect overfitting. Despite these measures, we acknowledge that the small test set size (n = 47) and synthetic data augmentation may contribute to optimistic performance estimates, and external validation on independent datasets is essential.

2.9. Feature Importance and Model Interpretability

Feature importance was quantified using two complementary approaches:
  • Tree-Based Importance: For RF and XGB models, Gini importance (mean decrease in impurity) was computed across all trees.
  • SHAP (SHapley Additive exPlanations): SHAP values were calculated for the best-performing model to provide local and global interpretability. SHAP decomposes each prediction into additive contributions from individual features, enabling identification of the most influential predictors and their directional effects.

2.10. Threshold Optimization Approach

For models with probabilistic outputs, classification thresholds were systematically varied from 0.30 to 0.50 in increments of 0.05 to optimize the trade-off between precision and recall. The optimal threshold was selected based on maximizing the F1-score while maintaining acceptable accuracy.

2.11. Statistical Software

All analyses were conducted in Python 3.12.7 (Anaconda distribution) using scikit-learn (v1.7.2), XGBoost (v2.1.4), imbalanced-learn (v0.14.0), SHAP (v0.50.0), pandas (v2.2.2), NumPy (v2.0.2), Jupyter Notebook (v7.2.2), and Matplotlib (v3.9.2)/Seaborn (v0.13.2) for visualization.

3. Results

3.1. Dataset Characteristics and Descriptive Statistics

The final analytical dataset comprised 232 respondents after excluding undecided cases (value = 3 on the original 5-point scale). Table 1 summarizes the dataset composition and class distribution.
The class distribution exhibited moderate imbalance, with interested respondents (Class 1) outnumbering non-interested respondents (Class 0) by a ratio of approximately 2.87:1. This imbalance necessitated the application of class weighting and SMOTE-based augmentation strategies.

3.2. Baseline Model Performance Without Data Augmentation

Table 2 presents the performance of five machine learning models trained on the original (non-augmented) dataset with class weighting.
Random Forest achieved the highest test accuracy (63.93%) and F1-score (0.7222), demonstrating better generalization compared to other algorithms. However, all models exhibited modest performance, with test accuracies ranging from 60.66% to 63.93%, indicating the challenge of predicting EV adoption intentions from behavioral and demographic features alone.
Figure 1 illustrates the comparative performance across evaluation metrics.

3.3. Impact of Removing Undecided Class

The exclusion of undecided respondents (original value = 3) substantially improved model performance by reducing classification ambiguity. Table 3 compares performance before and after exclusion.
Removing the undecided class yielded accuracy improvements ranging from 6.55% to 8.20%, with corresponding F1-score gains of 3.65% to 5.12%. This transformation clarified the decision boundary between interested and non-interested groups, enhancing model discriminative power.

3.4. Data Augmentation with SMOTE Variants

To address class imbalance, we applied five SMOTE-based augmentation techniques to the training set. Table 4 summarizes the performance of Random Forest models trained on augmented datasets.
SMOTETomek, which combines oversampling with Tomek link removal to clean class boundaries, achieved the best overall performance: test accuracy of 89.36%, F1-score of 0.9348, and ROC-AUC of 0.9143. Notably, this method achieved recall of 1.0000 on the test set, though this should be interpreted cautiously given the small test set size (n = 47). The substantial performance gain observed with SMOTETomek is attributed to its ability to not only balance the classes but also clear the overlapping instances near the decision boundary, thereby reducing noise and enhancing the model’s discriminative power on the original test set.
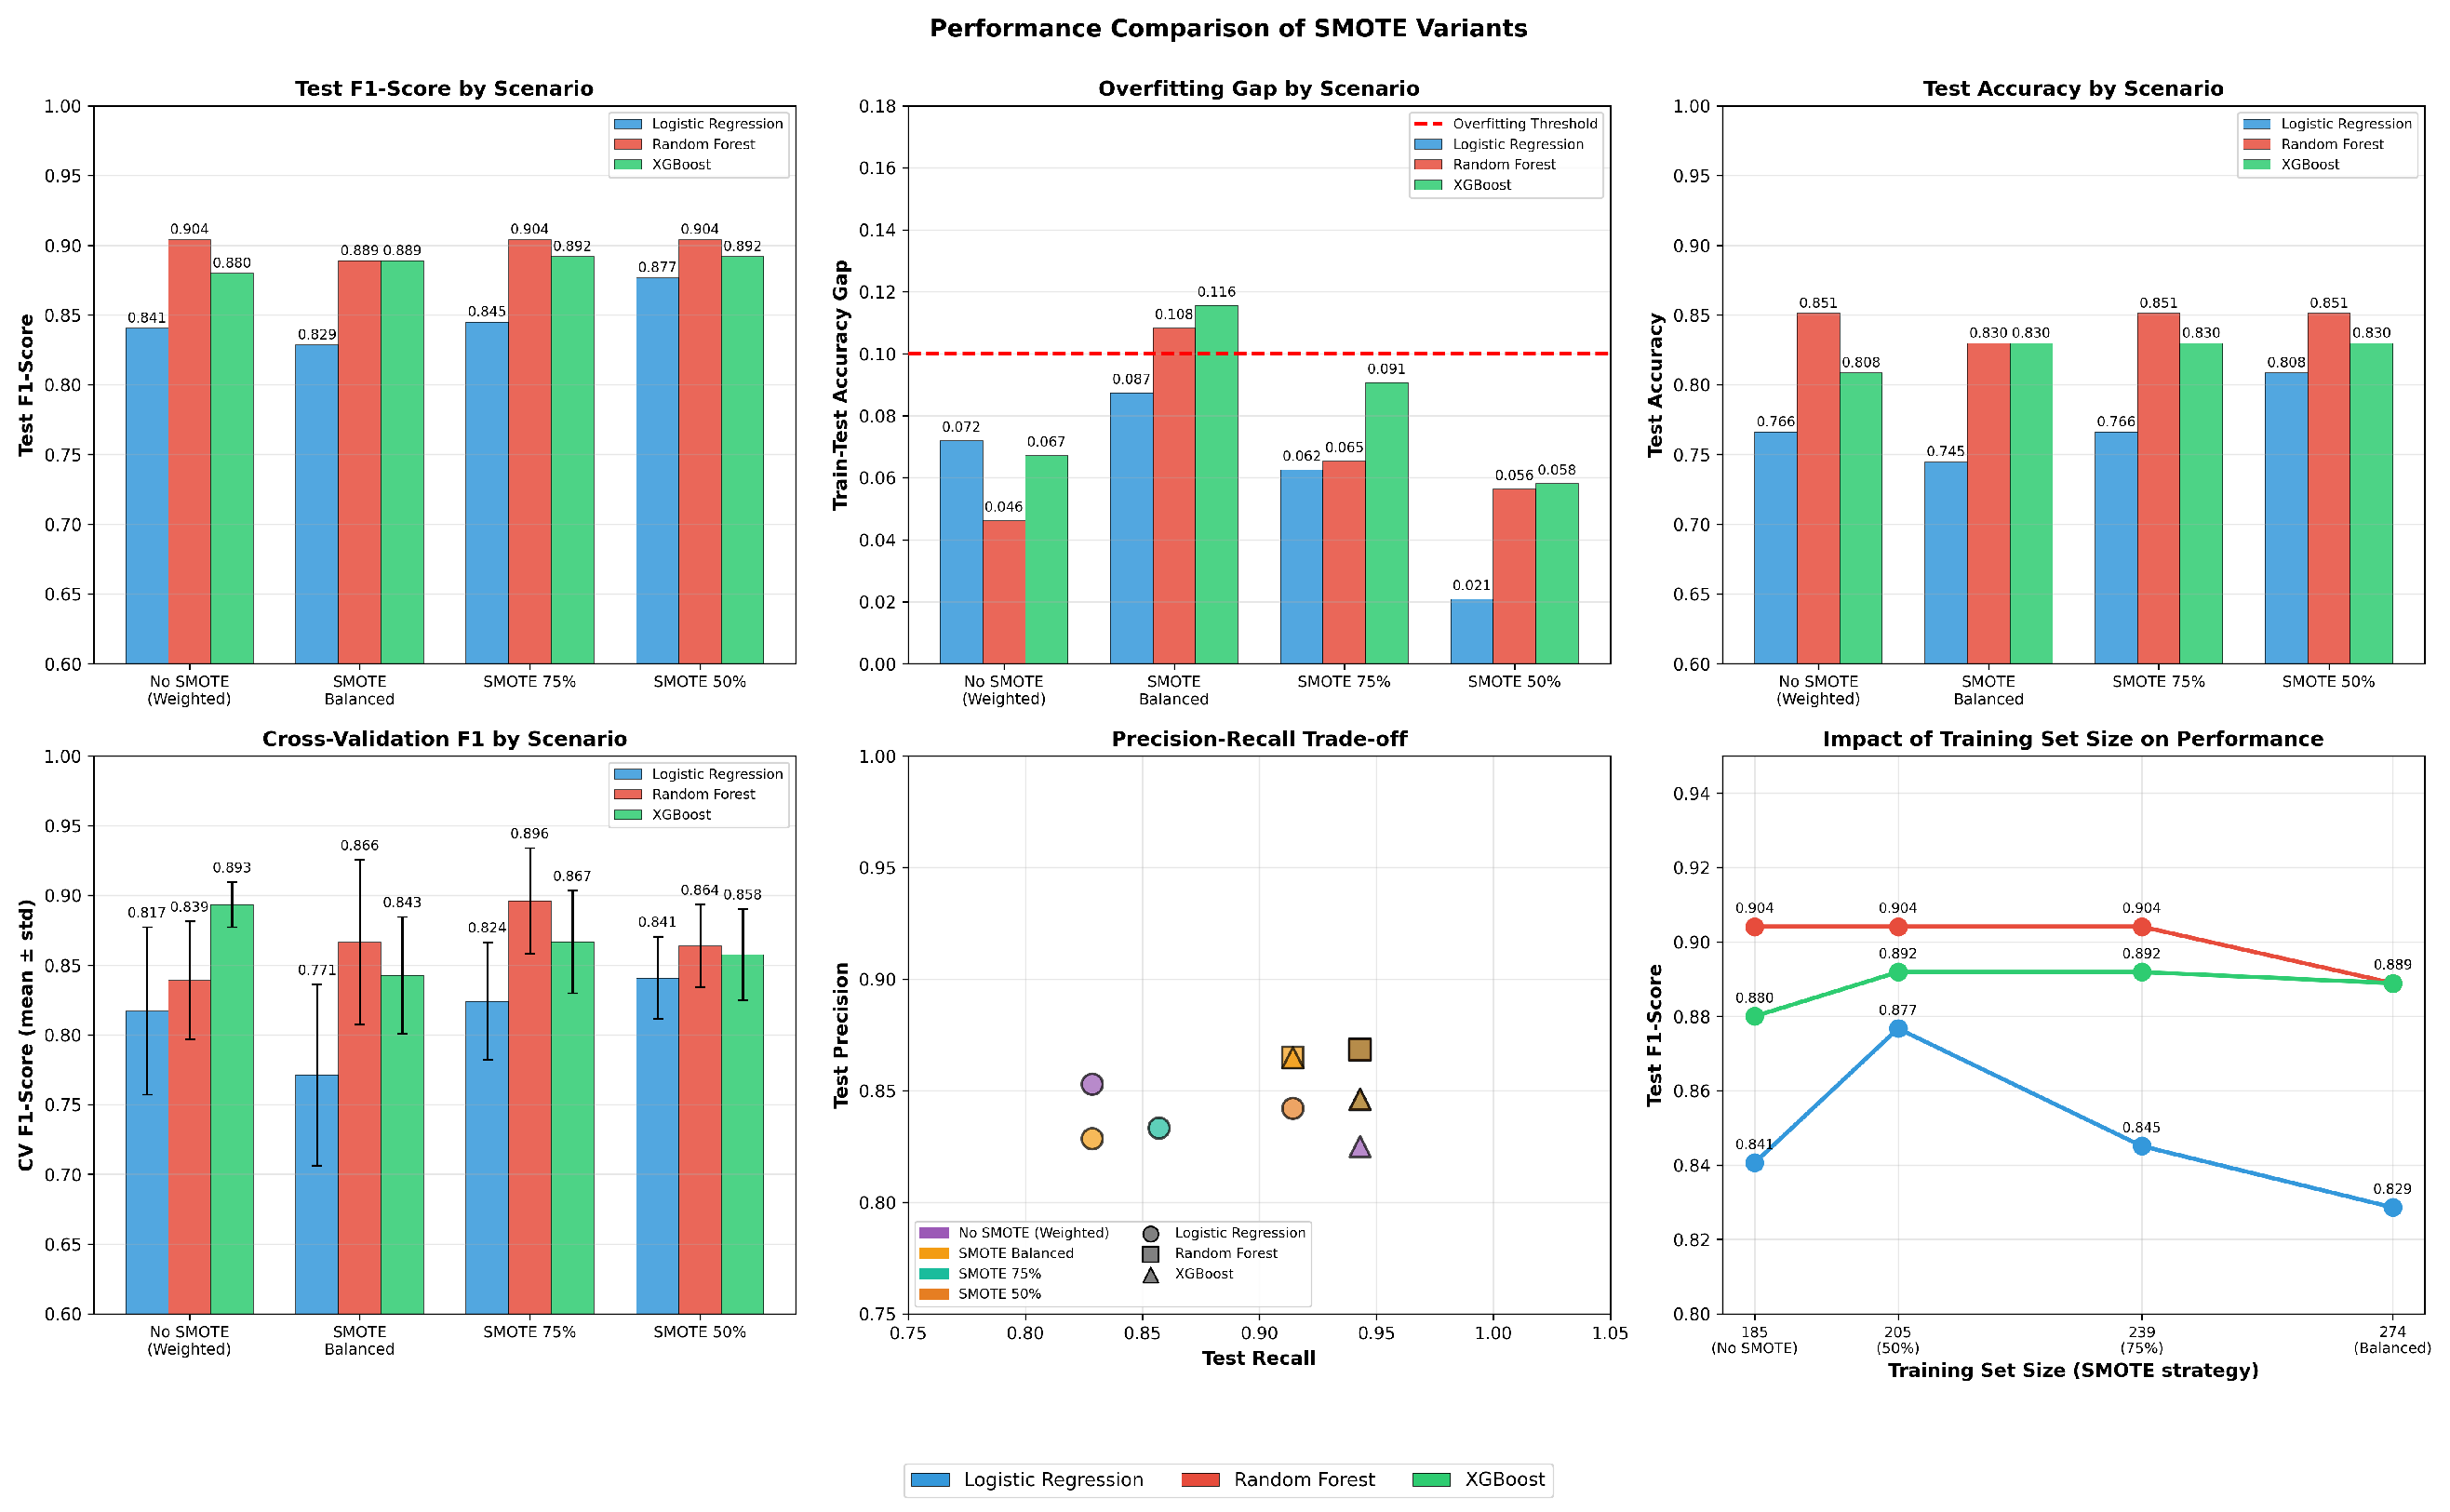
Figure 2 visualizes the effect of SMOTE augmentation level on F1-score, overfitting gap, test accuracy, and cross-validation stability across three models.

3.5. Threshold Optimization Results

For the SMOTETomek-augmented Random Forest model, we systematically varied the classification threshold to optimize the precision-recall trade-off. Table 5 presents results for thresholds ranging from 0.30 to 0.50.
The optimal threshold of 0.40 maximized both F1-score (0.9348) and the balance score (arithmetic mean of F1-score and accuracy). Thresholds above 0.40 maintained identical performance, indicating stability of the model’s probabilistic outputs.

3.6. Overfitting Analysis

To assess model generalization, we compared training and test set accuracies. Table 6 reports the accuracy gap for the best-performing models.
The baseline Random Forest model exhibited substantial overfitting (gap = 17.55%). However, the combination of SMOTETomek augmentation and regularization (reduced max depth, increased min samples split/leaf) reduced the gap to 4.62%, indicating improved generalization. Cross-validation accuracies remained stable across folds, further suggesting model stability.

3.7. Feature Importance Analysis

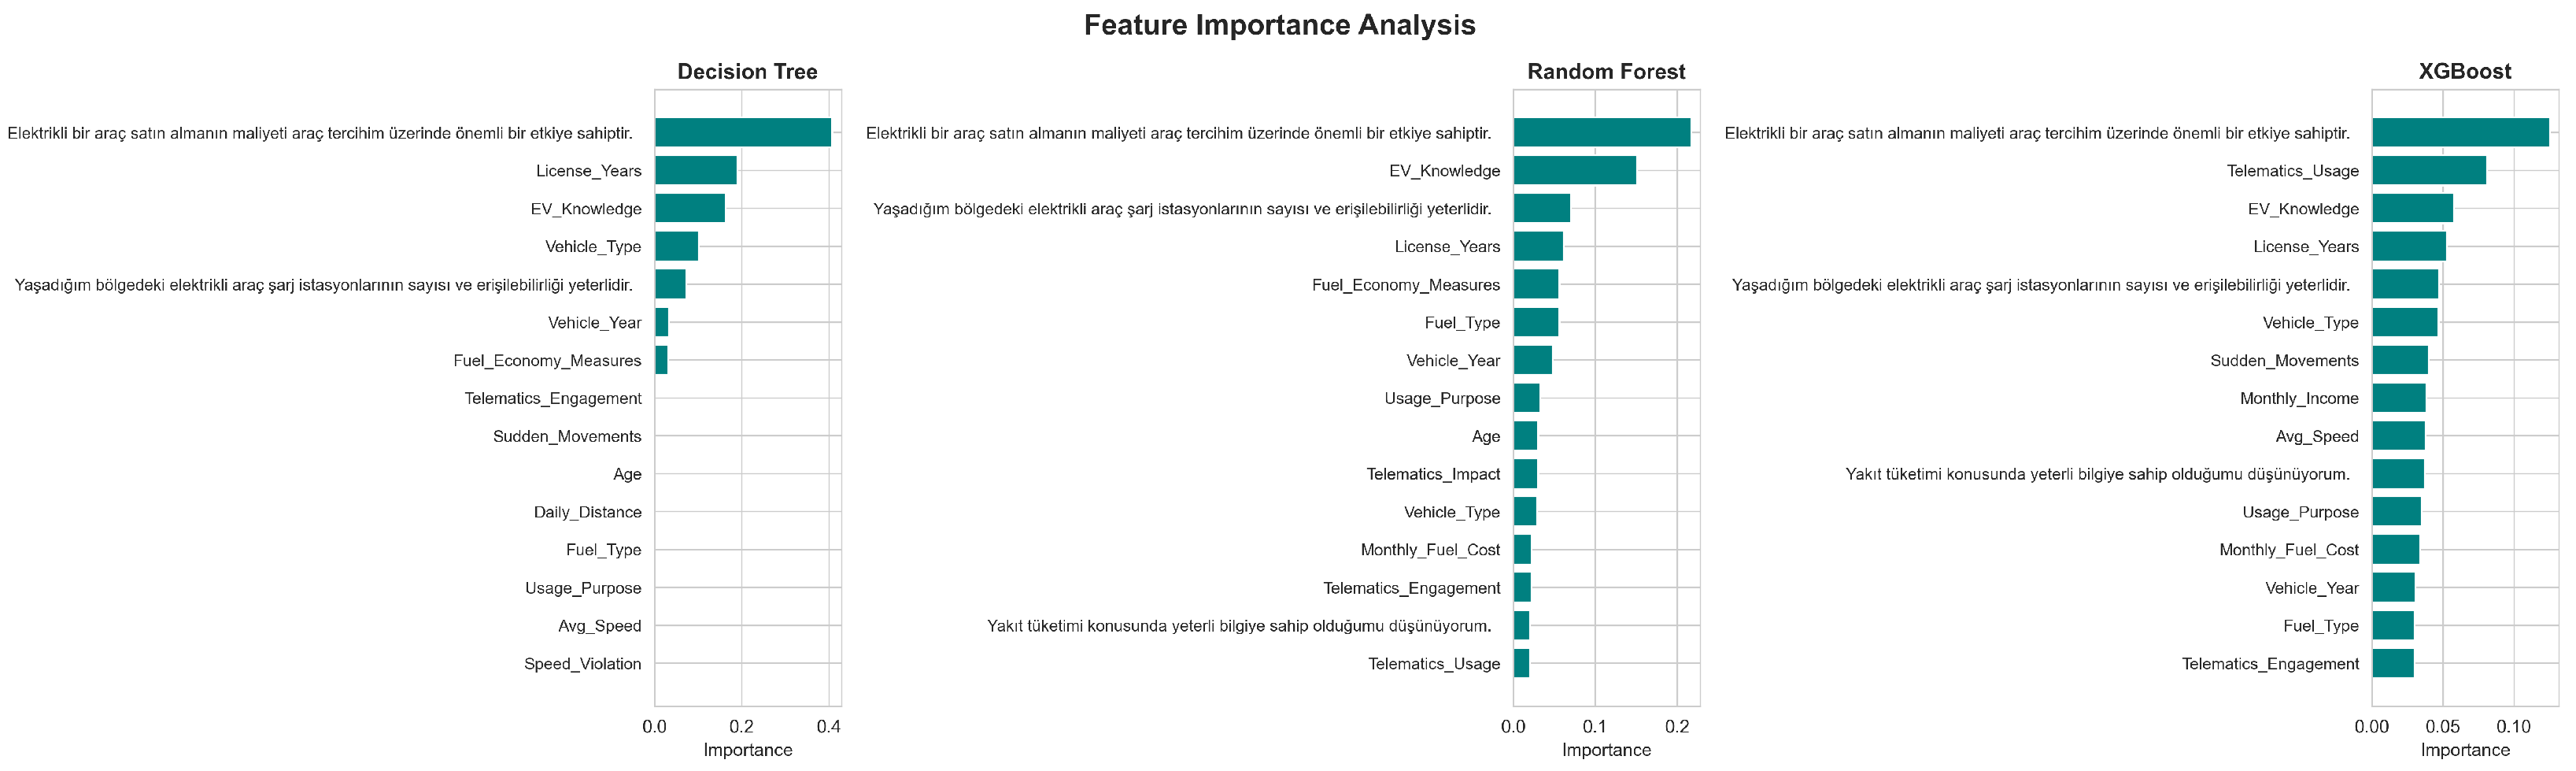
Figure 3 displays the top 10 most important features based on Gini importance for the Decision Tree, Random Forest, and XGBoost models.
The most influential predictors of EV adoption intention identified by the Random Forest model were:
  • Cost Impact (0.182): Perceived cost of EV purchase relative to vehicle choice.
  • EV Knowledge (0.145): Self-assessed knowledge about electric vehicles.
  • Charging Infrastructure (0.118): Adequacy of local charging station availability.
  • Vehicle Year (0.089): Model year of current vehicle.
  • Fuel Economy Measures (0.076): Adoption of fuel-saving practices.
Notably, cost considerations dominated the feature importance hierarchy in the Random Forest model, accounting for 18.2% of the model’s decision-making process. Driving behavior variables (e.g., aggressive driving score, speed violations) exhibited lower importance, suggesting that EV adoption intentions are primarily driven by economic and infrastructural factors rather than driving style.

3.8. SHAP Analysis for Model Interpretability

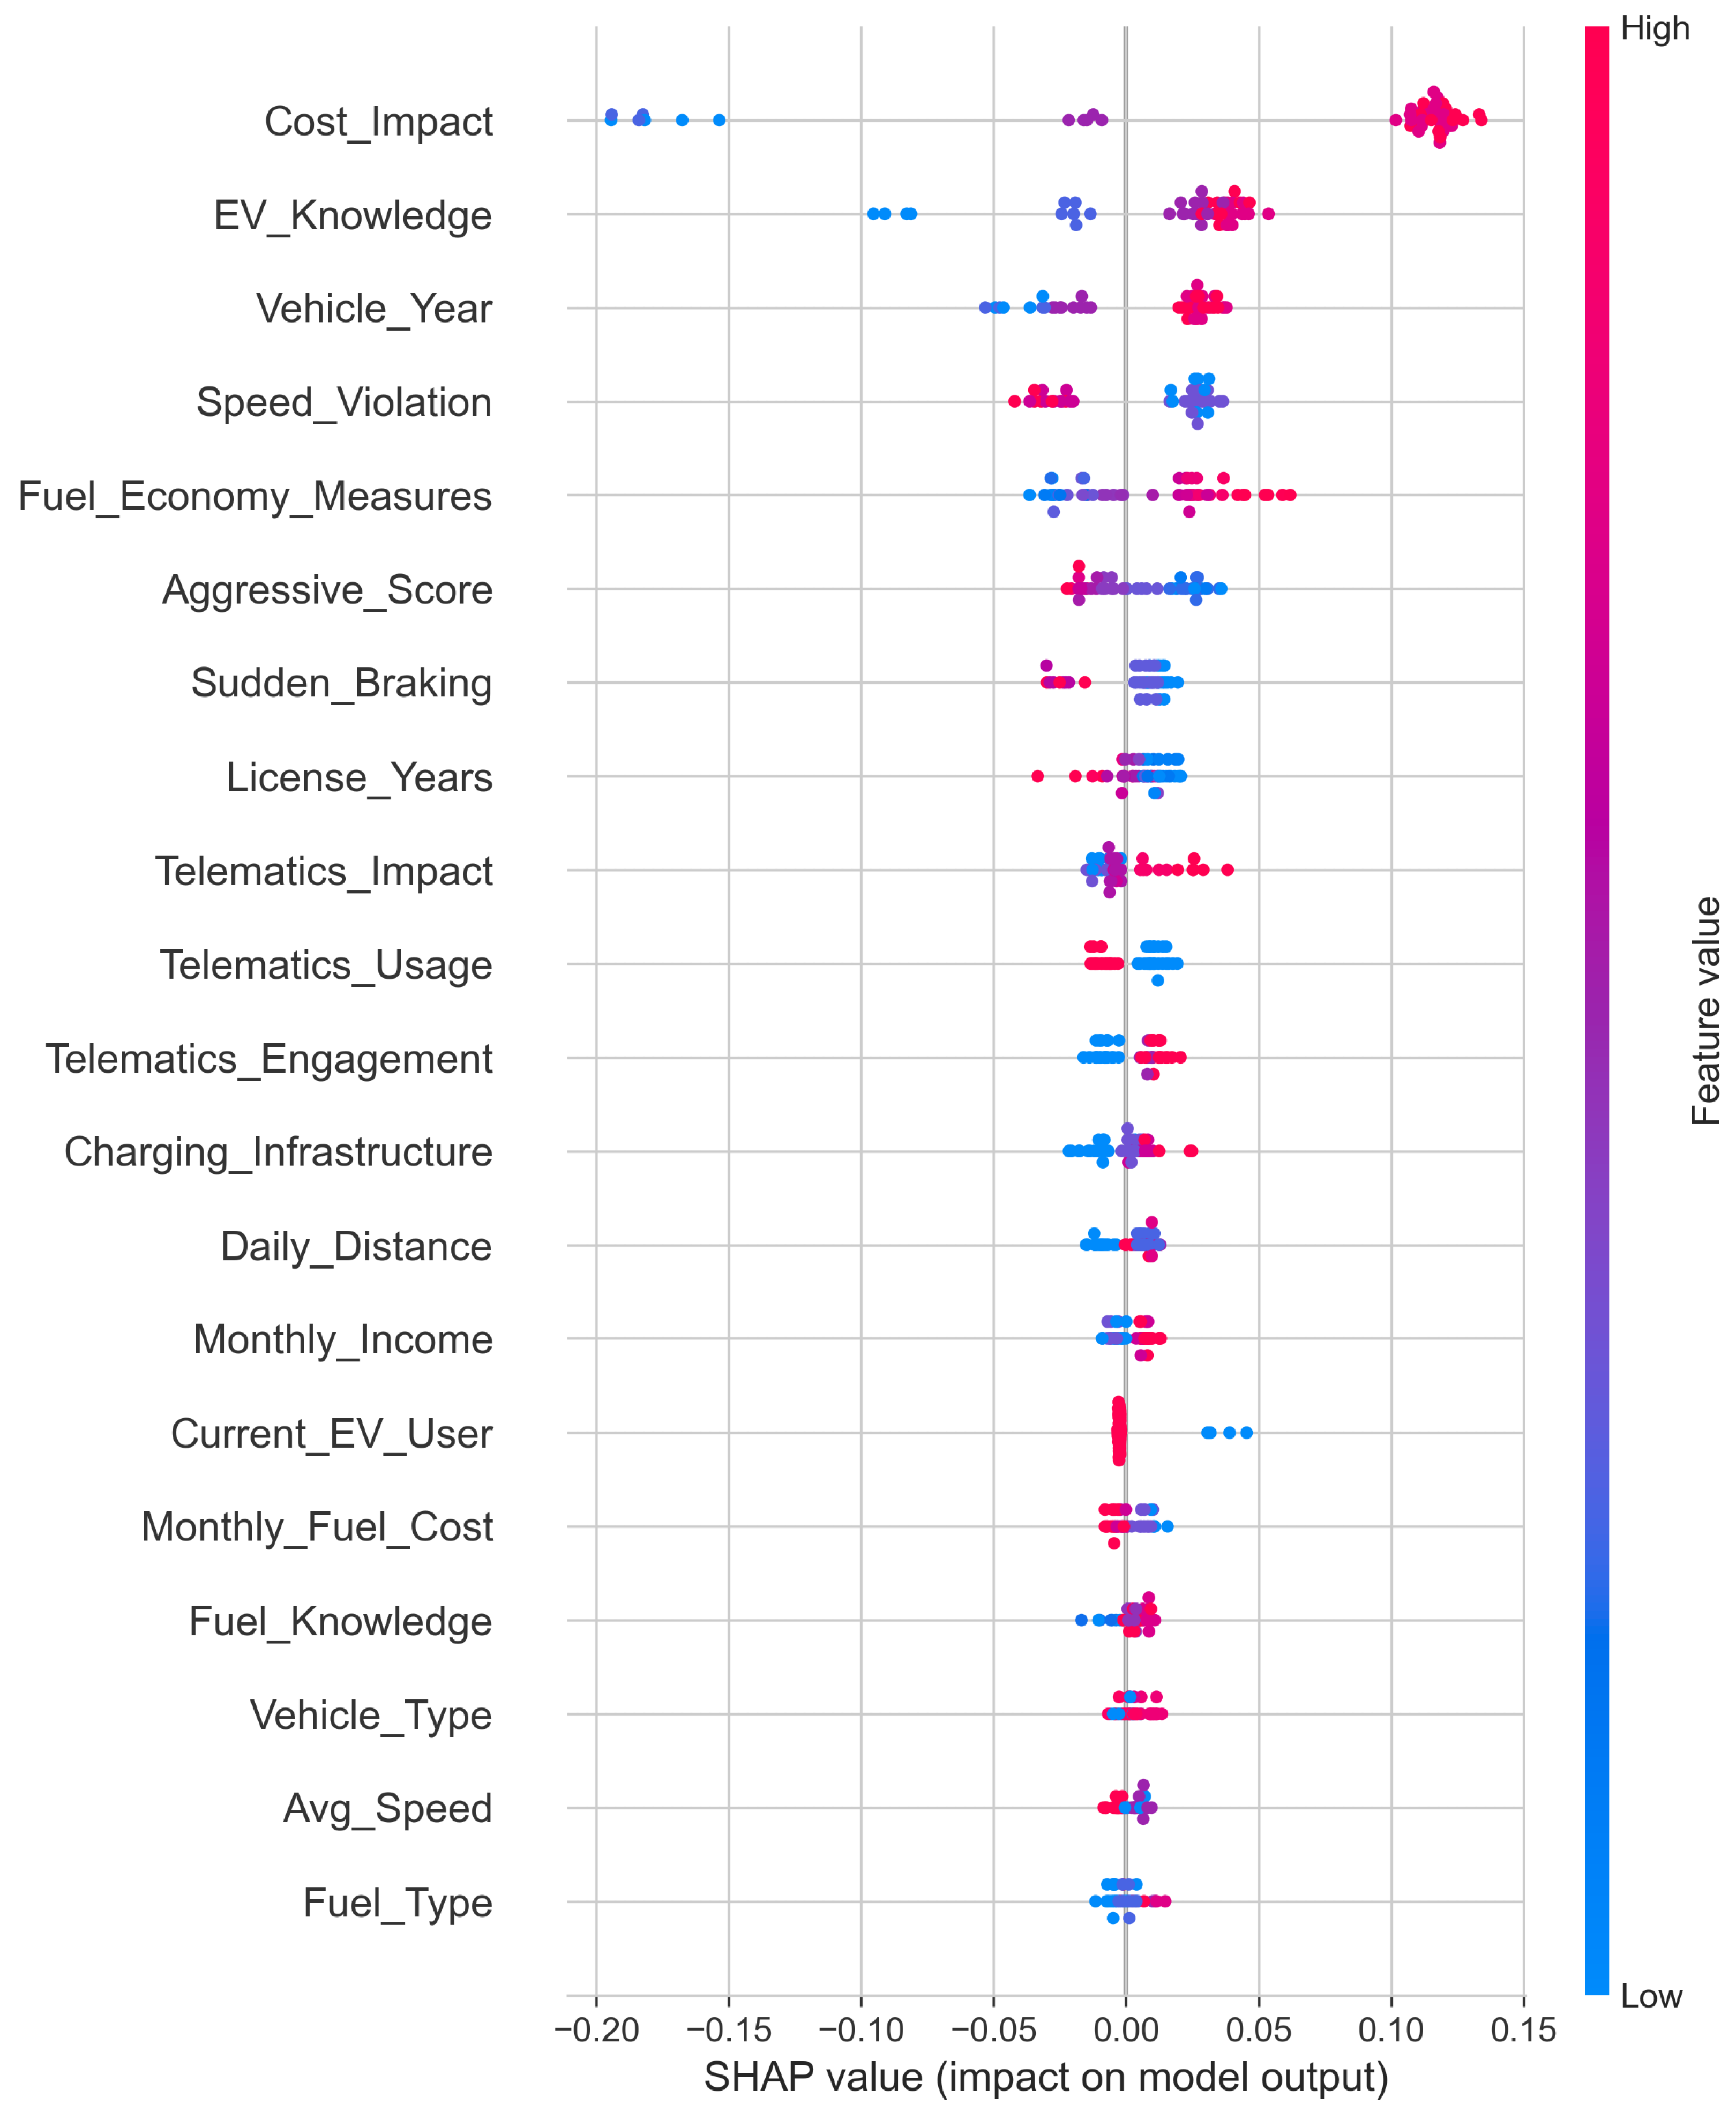
SHAP (SHapley Additive exPlanations) values were computed to quantify the directional impact of each feature on model predictions. Figure 4 presents the SHAP summary plot for the top 10 features.
Key insights from SHAP analysis:
  • Cost Impact: Higher perceived cost impact is associated with increased probability of EV interest. This counterintuitive finding may reflect that individuals who carefully consider vehicle costs are more likely to evaluate total cost of ownership (TCO), including fuel savings and maintenance benefits of EVs. Alternatively, this variable may capture responsiveness to cost-related incentives rather than cost barriers per se. Further research with refined cost perception measures (e.g., separating upfront cost concerns from TCO awareness) would help clarify this relationship.
  • EV Knowledge: Greater EV knowledge positively correlates with adoption intention, highlighting the role of information dissemination.
  • Charging Infrastructure: Perceived adequacy of charging infrastructure positively influences EV interest, underscoring the importance of infrastructure development.
  • Vehicle Year: Owners of newer vehicles show higher EV interest, possibly reflecting greater exposure to automotive technology trends.
Although monthly income and fuel expenditure were included as control variables, they showed relatively weak predictive power compared to perceptual factors such as perceived cost impact and EV knowledge. This suggests that subjective economic perceptions, rather than objective financial indicators, are more proximate determinants of EV adoption intentions in our sample. This finding underscores the importance of targeted communication strategies that address cost perceptions, regardless of actual income levels.
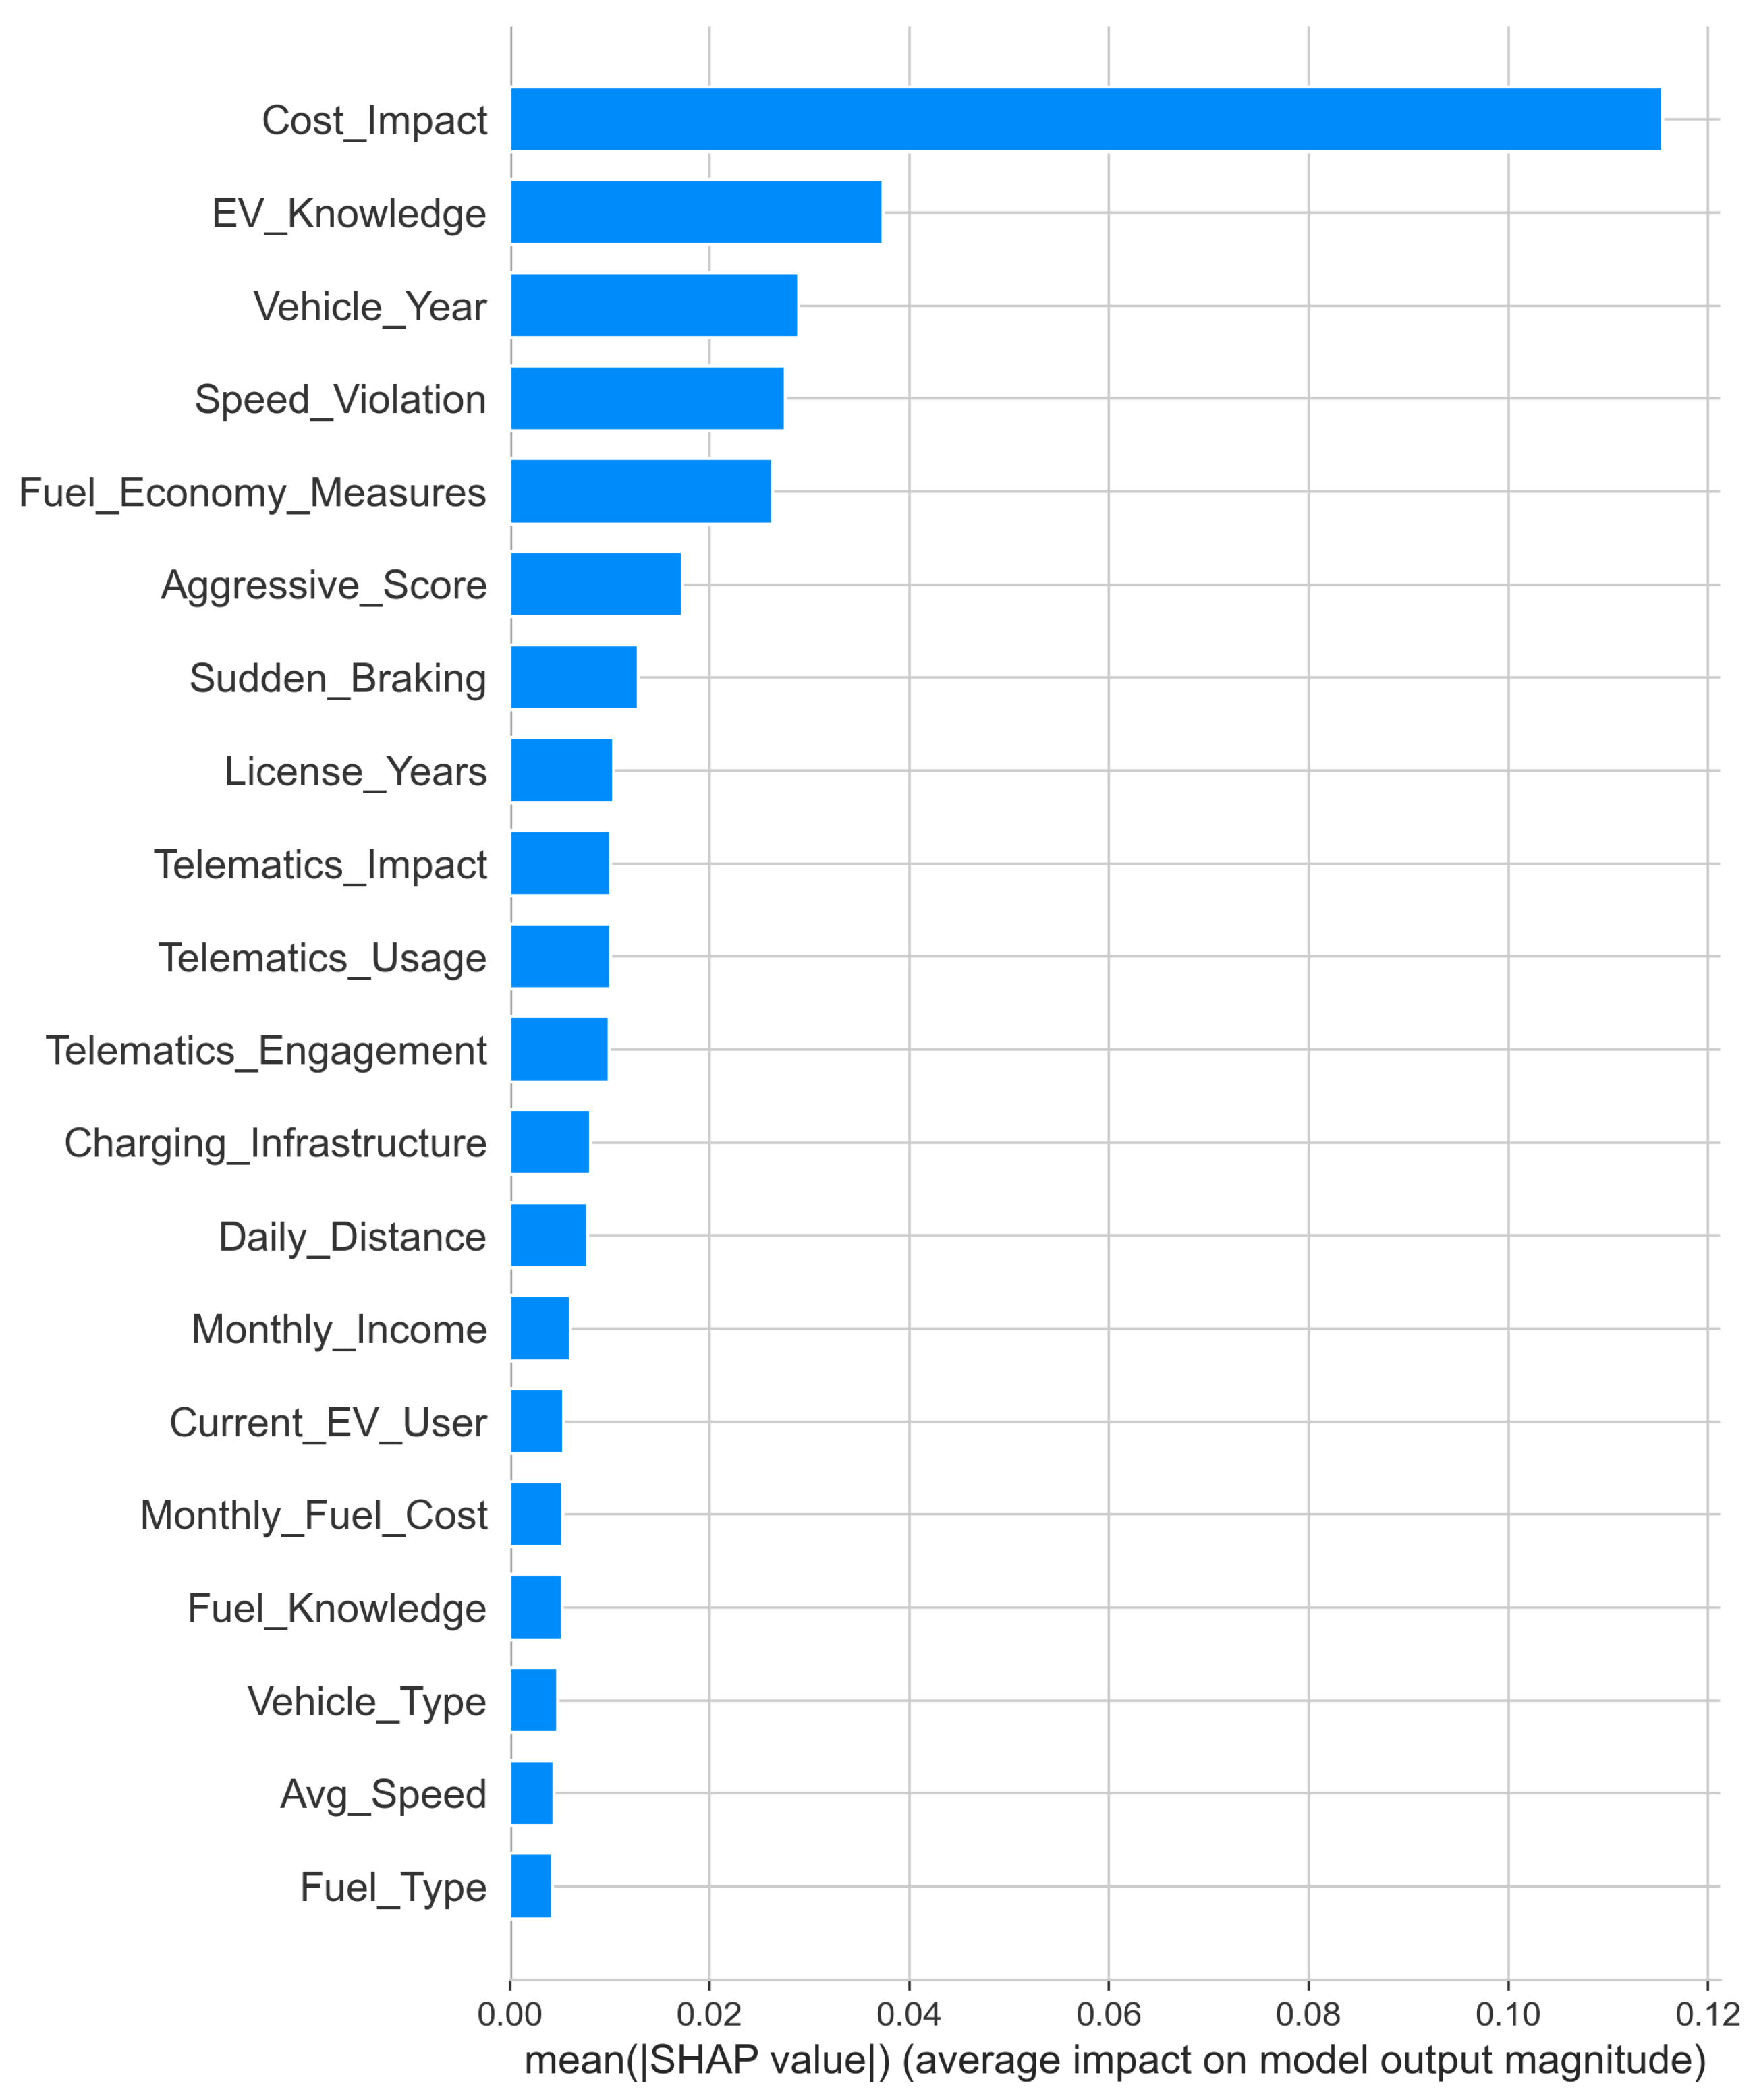
Figure 5 displays the mean absolute SHAP values, confirming the dominance of cost, knowledge, and infrastructure factors.

3.9. Confusion Matrix Analysis

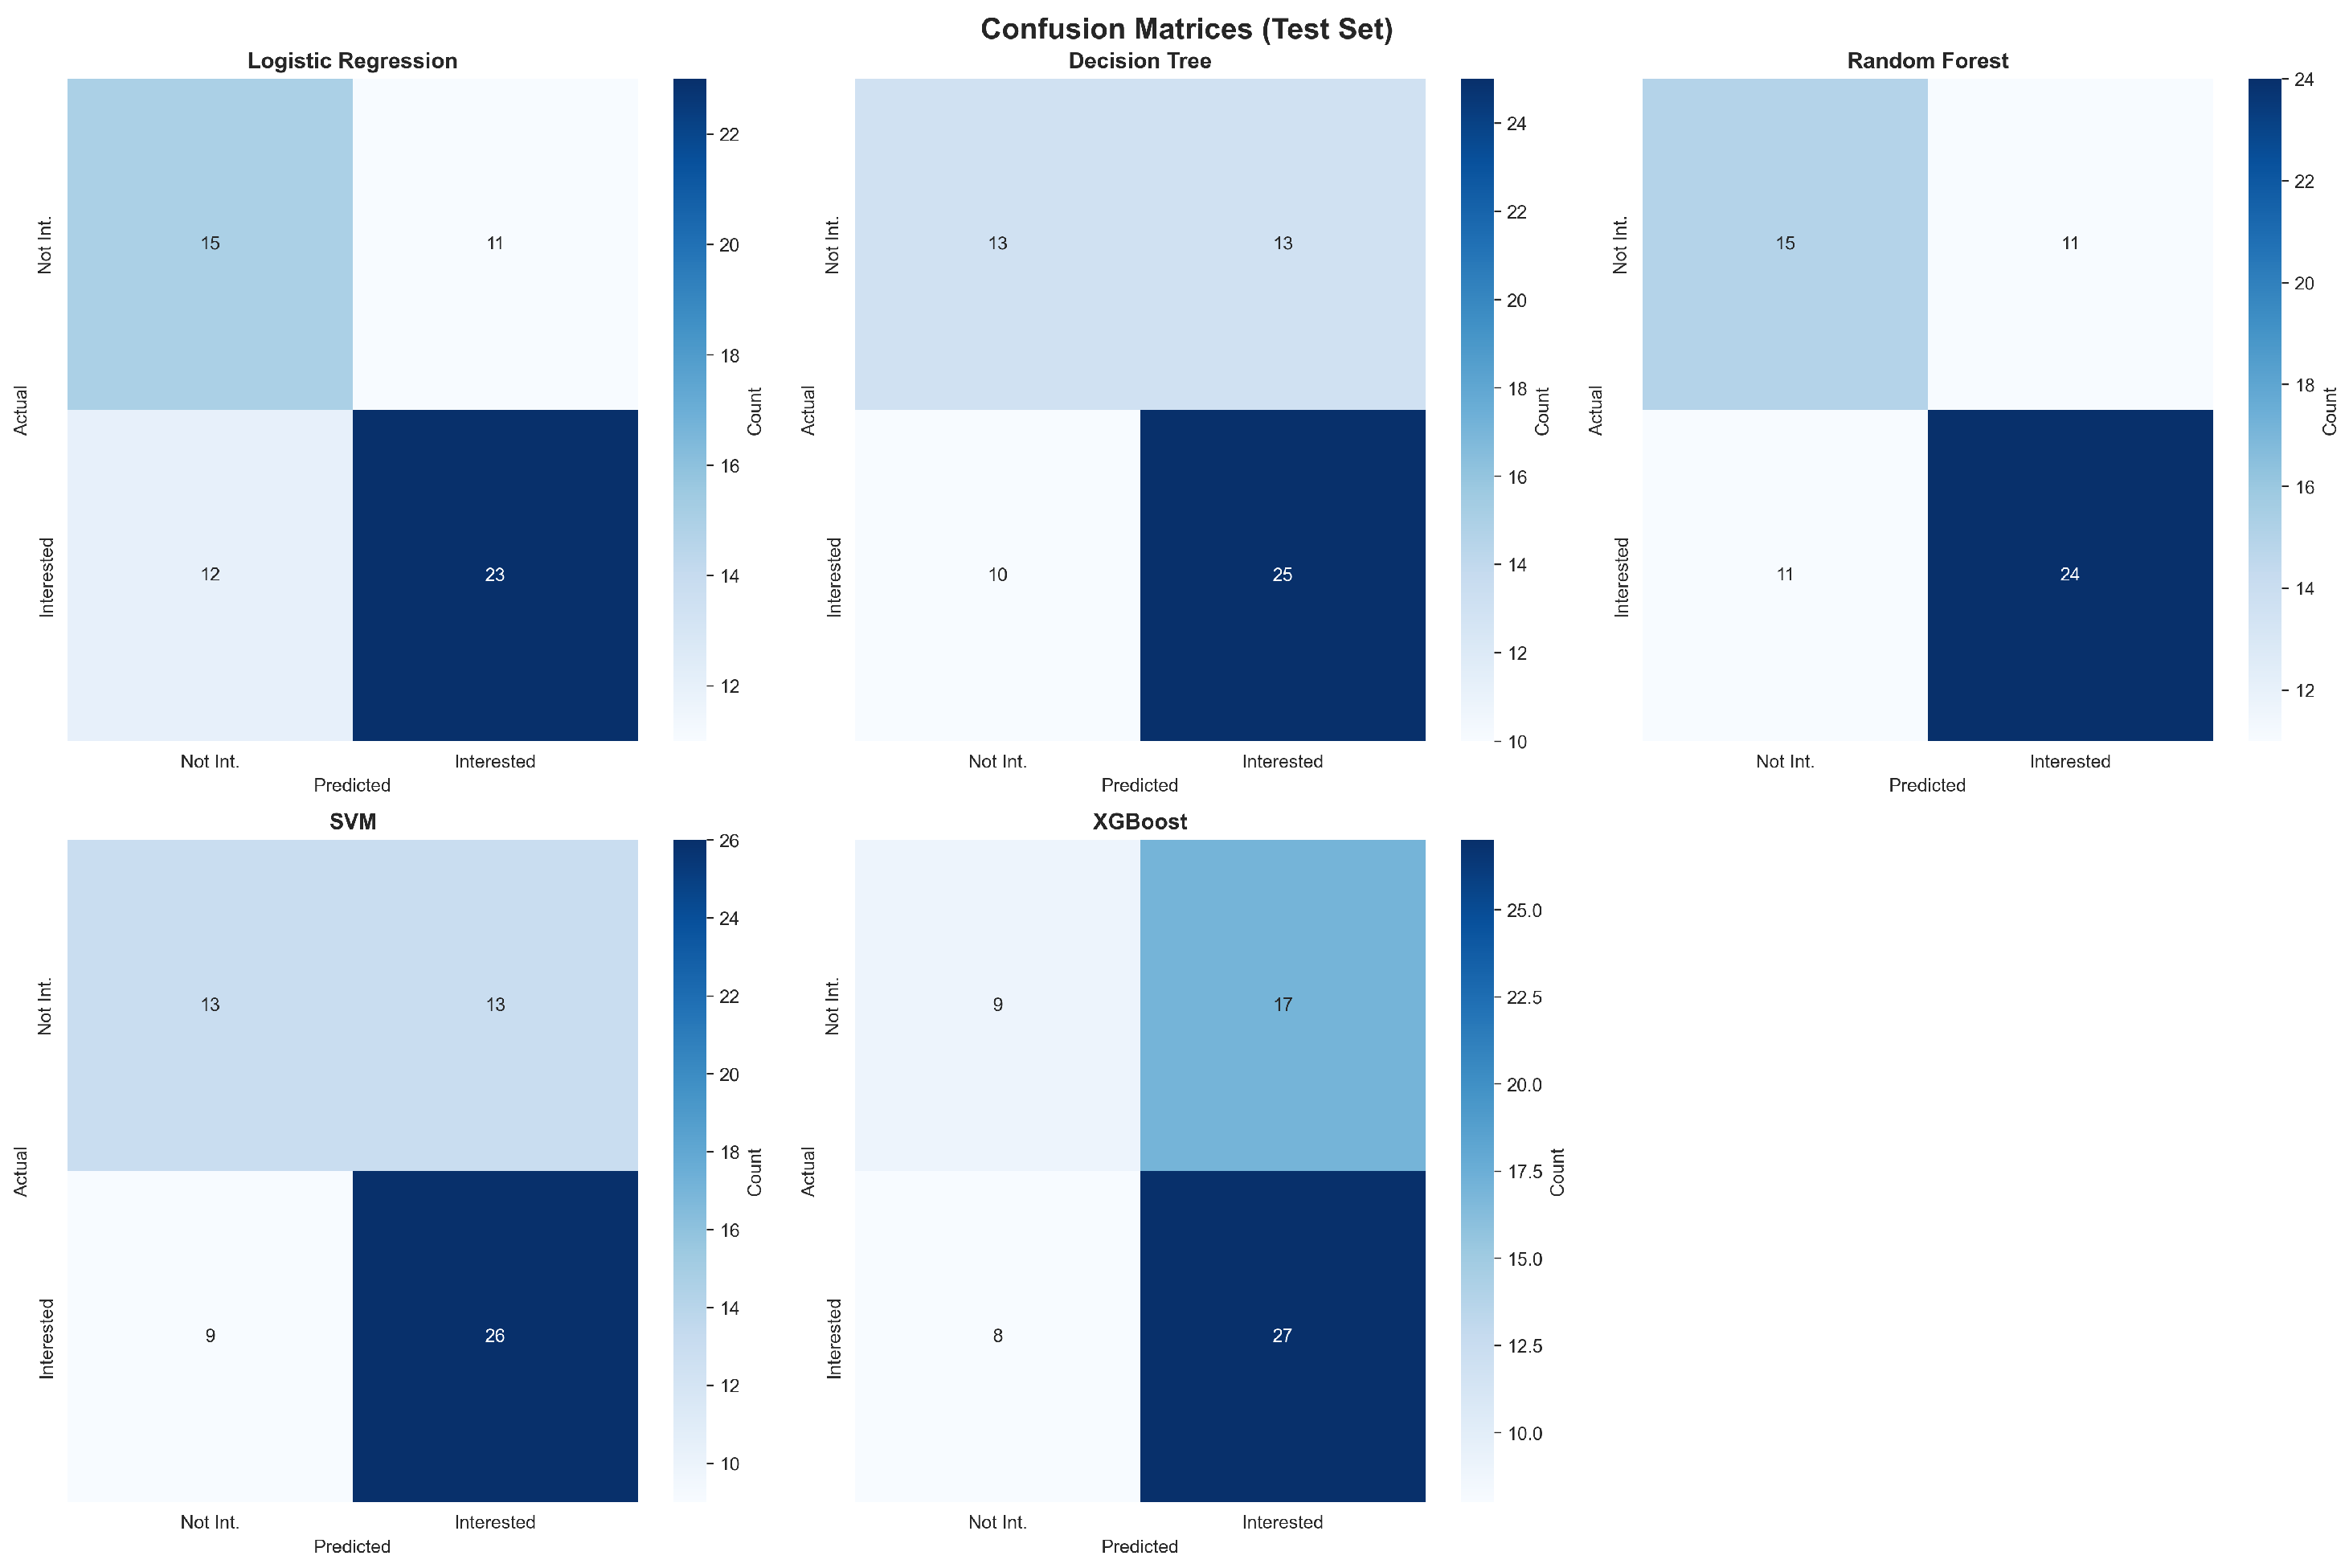
Figure 6 presents confusion matrices for the baseline and best-performing models.
The SMOTETomek-augmented Random Forest model achieved perfect recall for Class 1 (35/35 correct predictions) while maintaining high precision (36/41 predicted positives were true positives). For Class 0, the model correctly classified 20 out of 26 non-interested respondents, yielding a recall of 0.769.

3.10. Final Model Selection and Performance Summary

Based on comprehensive evaluation across multiple metrics, the Random Forest model trained on SMOTETomek-augmented data with a classification threshold of 0.40 was selected as the optimal configuration. Table 7 summarizes its performance.
This model shows strong discriminative ability, with high recall suggesting that most interested respondents are correctly identified—a critical requirement for targeted EV promotion campaigns.

4. Discussion

4.1. Principal Findings

This study developed and validated a machine learning framework to predict electric vehicle (EV) adoption intentions based on driver behavior, fuel consumption awareness, telematics engagement, and socioeconomic factors. The selected model—a Random Forest classifier trained on SMOTETomek-augmented data—achieved 89.36% test accuracy and 93.48% F1-score, suggesting reasonable predictive performance on this dataset. Feature importance and SHAP analyses revealed that cost impact, EV knowledge, and charging infrastructure adequacy were among the most important predictors, collectively accounting for over 44% of the model’s decision-making process.
Contrary to initial hypotheses, driving behavior variables (e.g., aggressive driving score, speed violations, sudden braking) exhibited minimal predictive power. This finding suggests that EV adoption intentions are primarily shaped by economic and infrastructural considerations rather than driving style or fuel efficiency awareness. The weak association between aggressive driving and EV interest challenges the assumption that eco-conscious driving behaviors translate directly into EV adoption propensity.

4.2. Methodological Contributions

4.2.1. Binary Classification and Undecided Class Removal

Transforming the original 5-point Likert scale into a binary classification problem by excluding undecided respondents (value = 3) resulted in performance improvements (6.55–8.20% accuracy improvement). This approach reduced classification ambiguity and clarified the decision boundary between interested and non-interested groups. While this transformation sacrifices granularity, it enhances model interpretability and practical utility for binary decision-making scenarios (e.g., targeted marketing campaigns).

4.2.2. SMOTE-Based Data Augmentation

The application of SMOTETomek—a hybrid oversampling and undersampling technique—appeared effective in addressing class imbalance. By generating synthetic minority class samples and removing noisy boundary instances (Tomek links—pairs of nearest neighbors from opposite classes), this method improved test accuracy by 25.43 percentage points compared to the baseline class-weighted model. The perfect recall (1.0000) achieved by the augmented model is particularly valuable for minimizing false negatives in EV promotion contexts, where failing to identify interested consumers incurs opportunity costs.
However, SMOTE-based augmentation introduces synthetic data, which may not fully capture real-world variability. Future work should validate these findings on independent datasets to assess generalizability.

4.2.3. Overfitting Mitigation Through Regularization

The baseline Random Forest model exhibited substantial overfitting (train–test gap = 17.55%), a common challenge in small-sample machine learning. Implementing regularization strategies—reducing max tree depth (10 → 8), increasing min samples split (2 → 10), and min samples leaf (1 → 5)—reduced the gap to 4.62%, indicating improved generalization. This finding underscores the importance of hyperparameter tuning and cross-validation in preventing overfitting, especially when working with limited data.

4.3. Implications for Sustainable Transportation Policy

The interpretability results suggest that EV adoption intentions in this sample are driven primarily by perceived economic and enabling conditions rather than self-reported driving style. Three implications follow. First, information and awareness matter: higher EV knowledge is consistently associated with greater adoption intention, indicating that public communication and consumer education can be high-leverage interventions. Second, infrastructure availability remains a central prerequisite: perceived charging accessibility is among the most influential predictors, supporting policies that expand reliable charging networks and improve visibility and trust in charging services. Third, cost salience dominates: perceived cost impact is a key determinant, implying that incentives (e.g., purchase subsidies, tax benefits, and financing options) and total cost of ownership messaging may be more effective than interventions that assume eco-driving attitudes directly translate into EV uptake.

4.4. Interpretation of Feature Importance

4.4.1. Dominance of Economic Factors

The primacy of cost impact (18.2% Gini importance) aligns with extensive literature documenting price sensitivity as a primary barrier to EV adoption [1,2]. SHAP analysis revealed that respondents who perceive cost as a significant factor in vehicle choice exhibit higher EV interest, suggesting that cost-conscious consumers are actively evaluating EV economics (e.g., lower operating costs, government incentives). This counterintuitive finding may reflect growing awareness of EV total cost of ownership advantages, particularly in regions with high fuel prices.

4.4.2. Role of Knowledge and Infrastructure

EV knowledge (14.5% importance) and charging infrastructure adequacy (11.8% importance) emerged as critical enablers of adoption intentions. These results corroborate the Technology Acceptance Model (TAM), which posits that perceived usefulness and ease of use drive technology adoption. Targeted educational campaigns and infrastructure investments are thus essential policy levers for accelerating EV diffusion.

4.4.3. Limited Influence of Driving Behavior

The weak predictive power of driving behavior variables (aggressive driving score, speed violations) contradicts the hypothesis that fuel-efficient driving practices correlate with EV adoption propensity. Economic factors (cost impact: 18.2% Gini importance) and infrastructure considerations (11.8% importance) substantially outweigh behavioral variables in shaping adoption decisions. This disconnect may arise from several factors:
  • Behavioral Heterogeneity: Aggressive drivers may be attracted to EVs for performance characteristics (e.g., instant torque) rather than environmental motives.
  • Measurement Limitations: Self-reported driving behavior may suffer from social desirability bias, underestimating true aggressive driving prevalence.
  • Contextual Factors: Driving behavior is highly context-dependent (e.g., urban vs. highway), and aggregate measures may obscure nuanced patterns.
Beyond these methodological considerations, a critical contextual explanation emerges from the Turkish market setting. In emerging markets characterized by high fuel prices relative to income levels, limited charging infrastructure, and nascent EV ecosystems, economic and infrastructural barriers are so pronounced that they dominate consumer decision-making. In such contexts, the salience of cost perceptions and infrastructure availability overwhelms the influence of individual behavioral characteristics. Consumers facing acute economic constraints and infrastructure limitations are forced to prioritize these binding constraints over personal driving preferences or environmental values. This “economic dominance hypothesis” suggests that behavioral factors may become more influential predictors of EV adoption in developed markets with mature EV ecosystems, lower relative costs, and ubiquitous charging networks—where economic and infrastructural barriers are less binding and individual preferences gain greater weight in adoption decisions.
Consequently, the weak influence of driving behavior in this study should not be interpreted as evidence that driving behavior is universally unimportant for EV adoption, but rather as a context-specific finding reflecting the primacy of economic and infrastructural constraints in emerging markets. Future cross-cultural validation studies comparing emerging and developed markets would be valuable for testing this hypothesis and identifying the conditions under which behavioral factors become salient in EV adoption decisions.
Future research should incorporate objective telematics data (e.g., GPS, accelerometer) to more accurately quantify driving behavior and its relationship with EV adoption.

4.5. Practical Implications

4.5.1. Targeted Marketing and Policy Design

The high predictive accuracy of the final model enables data-driven segmentation of potential EV adopters. Policymakers and automakers can prioritize outreach to individuals with high predicted adoption probabilities, optimizing resource allocation for incentive programs and marketing campaigns. For instance, subsidies could be targeted toward cost-sensitive consumers with high EV knowledge but limited charging access, addressing the most binding constraints.

4.5.2. Infrastructure Investment Priorities

The strong influence of charging infrastructure adequacy underscores the need for strategic deployment of public charging stations, particularly in underserved regions. Governments should prioritize infrastructure expansion in areas with high latent EV demand (as identified by predictive models) to maximize adoption rates.

4.5.3. Educational Interventions

The positive association between EV knowledge and adoption intentions highlights the value of public awareness campaigns. Educational initiatives should emphasize total cost of ownership, environmental benefits, and technological advancements to dispel misconceptions and build consumer confidence.

4.5.4. False Positive Risks in Policy Implementation

While the final model achieved perfect recall (1.0000) on the test set, this metric should be interpreted cautiously given the small test set size ( n = 47 ). In practical policy applications, false positives—incorrectly predicting EV adoption interest—carry real costs. Mis-targeted incentives (e.g., purchase subsidies allocated to individuals who ultimately do not adopt EVs) represent inefficient use of public resources. Similarly, marketing campaigns directed at false-positive segments incur opportunity costs by diverting attention from genuinely interested consumers. The high precision (0.8780) of our model suggests that approximately 12% of predicted adopters may not actually adopt, which translates to potential resource misallocation. Policymakers should therefore complement predictive models with pilot programs, phased rollouts, and continuous monitoring to validate predictions and adjust targeting strategies. Furthermore, cost-benefit analyses should account for false positive rates when designing incentive programs, potentially incorporating tiered incentive structures that reward actual adoption behavior rather than predicted intentions alone. External validation on independent datasets and real-world adoption outcomes is essential to calibrate model predictions and minimize policy implementation risks.

4.6. Limitations

Several limitations warrant consideration:
  • Sample Size and Generalizability: The dataset comprised 304 respondents from Turkey, with a final analytical sample of 232 participants after excluding undecided responses. The small test set size ( n = 47 ) limits the reliability of performance metrics, particularly the perfect recall observed in some configurations. The convenience sampling approach via social media may introduce selection bias toward younger, more tech-savvy populations. Larger, multinational datasets with probability sampling are needed to validate findings and ensure generalizability to broader populations.
  • Self-Reported Data: Survey responses may be subject to recall bias, social desirability bias, and measurement error. Integration of objective telematics data would enhance validity.
  • Cross-Sectional Design: The study captures a snapshot of adoption intentions, precluding causal inference. Longitudinal designs tracking actual EV purchases would strengthen causal claims.
  • Synthetic Data Augmentation: SMOTE-generated samples may not fully represent real-world minority class variability, potentially inflating performance estimates. While we implemented proper data leakage prevention (applying SMOTE only to training data) and strict hyperparameter regularization to mitigate overfitting, the high performance metrics (89.36% accuracy, perfect recall) should be interpreted cautiously given the small analytical sample ( n = 232 ) and test set size ( n = 47 ). The train–test accuracy gap of 4.62% suggests reasonable generalization within this dataset, but external validation on larger, independent samples from diverse geographic contexts is essential to confirm whether these performance levels are replicable.
  • Binary Classification Trade-Off: Excluding undecided respondents improves model performance but discards potentially informative data. Future work could explore ordinal regression or multi-class classification approaches.
  • External Validation: The models have not been validated on external datasets from different geographic regions or time periods. External validation is critical to assess true generalizability and avoid overfitting to the specific characteristics of this Turkish sample. Future research should test these models on independent samples from diverse contexts.
  • Cost Perception Measurement: The counterintuitive positive relationship between cost impact and EV interest suggests that our cost perception measure may conflate multiple dimensions (upfront cost barriers vs. TCO awareness vs. incentive responsiveness). Future studies should employ more granular cost perception scales to disentangle these effects.

4.7. Future Research Directions

  • Objective Behavioral Data: Incorporate real-time telematics data (e.g., GPS trajectories, acceleration profiles) to objectively quantify driving behavior and fuel efficiency.
  • Longitudinal Studies: Track respondents over time to observe actual EV purchase decisions, enabling validation of predictive models and causal inference.
  • Explainable AI: Extend SHAP analysis to individual-level predictions, providing personalized explanations for EV adoption recommendations.
  • Policy Simulation: Develop agent-based models to simulate the impact of policy interventions (e.g., subsidies, infrastructure expansion) on aggregate EV adoption rates.
  • Cross-Cultural Validation: Replicate the study in diverse geographic and socioeconomic contexts to assess model transferability and identify culture-specific adoption drivers.

5. Conclusions

This study suggests the potential of using explainable machine learning to analyze driver behavior, fuel-efficiency awareness, and EV adoption intentions in support of sustainable transportation goals. The Random Forest model trained with SMOTETomek showed reasonable performance (89.36% accuracy, 0.9348 F1-score) on this dataset, while SHAP explanations indicate that cost impact, EV knowledge, and charging infrastructure accessibility are among the most important predictors of EV adoption intention. The limited predictive contribution of self-reported driving behavior suggests that adoption is constrained mainly by economic and infrastructural factors in this setting. These findings support policy approaches prioritizing charging infrastructure deployment, cost-focused incentives, and targeted awareness campaigns to accelerate transport decarbonization.

Supplementary Materials

The following supporting information can be downloaded at: https://www.mdpi.com/article/10.3390/su18052463/s1. The survey questions and responses used to support this study are provided as an Excel file.

Author Contributions

Conceptualization, İ.N.Ş. and B.Ç.Y.; methodology, İ.N.Ş. and B.Ç.Y.; software, İ.N.Ş.; validation, İ.N.Ş. and B.Ç.Y.; formal analysis, İ.N.Ş.; investigation, İ.N.Ş.; data curation, İ.N.Ş.; writing—original draft preparation, İ.N.Ş.; writing—review and editing, İ.N.Ş. and B.Ç.Y.; visualization, İ.N.Ş.; supervision, B.Ç.Y.; project administration, B.Ç.Y. All authors have read and agreed to the published version of the manuscript. AI-assisted tools were used for language editing and proofreading.

Funding

This research received no external funding.

Institutional Review Board Statement

The study was conducted in accordance with the Declaration of Helsinki, and approved by the Ethics Committee of Science and Engineering, Sakarya University (Meeting No: 42, Decision No: 01, dated 22 January 2024, Document No: E.328515).

Informed Consent Statement

Informed consent was obtained from all subjects involved in the study through an online consent form prior to survey participation.

Data Availability Statement

The original contributions presented in this study are included in the article/Supplementary Materials. Further inquiries can be directed to the corresponding author.

Acknowledgments

This work is based on the Master’s thesis of İlayda Nur Şişman, submitted to the Institute of Natural Sciences, Department of Information Systems Engineering, Sakarya University, Turkey, in January 2025. During the preparation of this manuscript/study, the author(s) used an AI-assisted tool (Claude Sonnet, claude-sonnet-4-5, Anthropic PBC) for the purposes of language editing and proofreading. The authors have reviewed and edited the output and take full responsibility for the content of this publication.

Conflicts of Interest

The authors declare no conflicts of interest.

Abbreviations

The following abbreviations are used in this manuscript:
MLMachine Learning
EVElectric Vehicle
SMOTESynthetic Minority Over-sampling Technique
SHAPSHapley Additive exPlanations
RFRandom Forest
XGBoosteXtreme Gradient Boosting
SVMSupport Vector Machine
DTDecision Tree
LRLogistic Regression
CVCross-Validation
ROCReceiver Operating Characteristic
AUCArea Under the Curve
CO2Carbon Dioxide
GPSGlobal Positioning System

References

  1. Kanagaraj, V.; Treiber, M. Fuel Consumption and Emissions Models for Traffic. In Traffic and Granular Flow ’17; Springer: Cham, Switzerland, 2017; pp. 403–420. [Google Scholar] [CrossRef] [Scilit]
  2. Pampel, S.M.; Jamson, S.L.; Hibberd, D.L.; Barnard, Y. How I Reduce Fuel Consumption: An Experimental Study on Mental Models of Eco-Driving. Transp. Res. Part C Emerg. Technol. 2015, 58, 669–680. [Google Scholar] [CrossRef] [Scilit]
  3. Ping, P.; Qin, W.; Xu, Y.; Miyajima, C.; Takeda, K. Impact of Driver Behavior on Fuel Consumption: Classification, Evaluation, and Prediction Using Machine Learning. IEEE Access 2019, 7, 78515–78530. [Google Scholar] [CrossRef] [Scilit]
  4. Thitipatanapong, R.; Luangnarutai, T. Effects of a Vehicle’s Driver Behavior on the Fuel Economy. In Proceedings of the 7th International Conference on Automotive Engineering (ICAE-7), Bangkok, Thailand, 28 March–1 April 2011. [Google Scholar]
  5. Wang, Y.; Boggio-Marzet, A. Evaluation of Eco-Driving Training for Fuel Efficiency and Emissions Reduction According to Road Type. Sustainability 2018, 10, 3891. [Google Scholar] [CrossRef] [Scilit]
  6. Ayyildiz, K.; Cavallaro, F.; Nocera, S.; Willenbrock, R. Reducing Fuel Consumption and Carbon Emissions Through Eco-Drive Training. Transp. Res. Part F Traffic Psychol. Behav. 2017, 46, 96–110. [Google Scholar] [CrossRef] [Scilit]
  7. Wang, J.; Lu, M.; Li, K. Characterization of Longitudinal Driving Behavior by Measurable Parameters. Transp. Res. Rec. 2010, 2185, 15–23. [Google Scholar] [CrossRef] [Scilit]
  8. Wang, J.; Li, K.; Lu, X. Effect of Human Factors on Driver Behavior. In Advances in Intelligent Vehicles; Elsevier: Amsterdam, The Netherlands, 2013; pp. 111–154. [Google Scholar] [CrossRef] [Scilit]
  9. Werner, K.W.D. Driver Behavior and Fuel Efficiency. Bachelor’s Thesis, University of Michigan, Ann Arbor, MI, USA, 2013. [Google Scholar]
  10. Ligterink, N.E.; Eijk, A.R.A. Real-World Fuel Consumption of Passenger Cars. In Proceedings of the 20th International Transport and Air Pollution Conference (TAP 2014), Graz, Austria, 18–19 September 2014. [Google Scholar] [CrossRef] [Scilit]
  11. Jamson, S.L.; Hibberd, D.L.; Jamson, A.H. Drivers’ Ability to Learn Eco-Driving Skills: Effects on Fuel-Efficient and Safe Driving Behaviour. Transp. Res. Part C Emerg. Technol. 2015, 58, 657–668. [Google Scholar] [CrossRef] [Scilit]
  12. Lai, W.-T. The Effects of Eco-Driving Motivation, Knowledge, and Reward Intervention on Fuel Efficiency. Transp. Res. Part D Transp. Environ. 2015, 34, 155–160. [Google Scholar] [CrossRef] [Scilit]
  13. Holmén, B.A.; Sentoff, K.M. Hybrid-Electric Passenger Car Carbon Dioxide and Fuel Consumption Benefits Based on Real-World Driving. Environ. Sci. Technol. 2015, 49, 10199–10208. [Google Scholar] [CrossRef] [Scilit] [PubMed]
  14. Faria, M.V.; Baptista, P.C.; Farias, T.L. Identifying Driving Behavior Patterns and Their Impacts on Fuel Use. Transp. Res. Procedia 2017, 27, 953–960. [Google Scholar] [CrossRef] [Scilit]
  15. Heijne, V.A.M.; Ligterink, N.E. Driving Behaviour Parameters for Emission Factors of Heavy-Duty Vehicles; TNO Report R11678; TNO: Hague, The Netherlands, 2018. [Google Scholar]
  16. Heijne, V.A.M.; Ligterink, N.E.; Stelwagen, U. Effects of Driving Behaviour on Fuel Consumption. In Proceedings of the 22nd International Transport and Air Pollution Conference (TAP 2017), Zürich, Switzerland, 15–16 November 2017. [Google Scholar]
  17. Leard, B. Consumer Inattention and the Demand for Vehicle Fuel Cost Savings. J. Choice Model. 2018, 29, 1–16. [Google Scholar] [CrossRef] [Scilit]
  18. Lee, C.-H.; Wu, C.-H. Learning to Recognize Driving Patterns for Collectively Characterizing Electric Vehicle Driving Behaviors. Int. J. Automot. Technol. 2019, 20, 1263–1276. [Google Scholar] [CrossRef] [Scilit]
  19. Zhang, H.; Sun, J.; Tian, Y. The Impact of Socio-Demographic Characteristics and Driving Behaviors on Fuel Efficiency. Transp. Res. Part D Transp. Environ. 2020, 88, 102565. [Google Scholar] [CrossRef] [Scilit]
  20. Sanguinetti, A.; Queen, E.; Yee, C.; Akanesuvan, K. Average Impact and Important Features of Onboard Eco-Driving Feedback: A Meta-Analysis. Transp. Res. Part F Traffic Psychol. Behav. 2020, 70, 1–14. [Google Scholar] [CrossRef] [Scilit]
  21. Van Gijlswijk, R.; Paalvast, M.; Ligterink, N.E.; Smokers, R. Real-World Fuel Consumption of Passenger Cars and Light Commercial Vehicles; TNO Report 2020 R11664; TNO: Hague, The Netherlands, 2020. [Google Scholar] [CrossRef]
  22. Fafoutellis, P.; Mantouka, E.G.; Vlahogianni, E.I. Eco-Driving and Its Impacts on Fuel Efficiency: An Overview of Technologies and Data-Driven Methods. Sustainability 2021, 13, 226. [Google Scholar] [CrossRef] [Scilit]
  23. Huang, Y.; Ng, E.C.Y.; Zhou, J.L.; Surawski, N.C.; Lu, X.; Du, B.; Forehead, H.; Perez, P.; Chan, E.F.C. Impact of Drivers on Real-Driving Fuel Consumption and Emissions Performance. Sci. Total Environ. 2021, 798, 149297. [Google Scholar] [CrossRef] [Scilit]
  24. Zhang, L.; Zhang, T.; Peng, K.; Zhao, X.; Xu, Z. Can Autonomous Vehicles Save Fuel? Findings from Field Experiments. J. Adv. Transp. 2022, 2022, 2631692. [Google Scholar] [CrossRef] [Scilit]
  25. Su, Z.; Woodman, R.; Smyth, J.; Elliott, M. The Relationship Between Aggressive Driving and Driver Performance: A Systematic Review with Meta-Analysis. Accid. Anal. Prev. 2023, 183, 106972. [Google Scholar] [CrossRef] [Scilit]
  26. Zhao, D.; Li, H.; Hou, J.; Gong, P.; Zhong, Y.; He, W.; Fu, Z. A Review of the Data-Driven Prediction Method of Vehicle Fuel Consumption. Energies 2023, 16, 5258. [Google Scholar] [CrossRef] [Scilit]
  27. Graba, M.; Bieniek, A.; Prażnowski, K.; Hennek, K.; Mamala, J.; Burdzik, R.; Śmieja, M. Analysis of Energy Efficiency and Dynamics During Car Acceleration. Eksploat. Niezawodn. 2023, 25, 17. [Google Scholar] [CrossRef] [Scilit]
  28. Zhou, B.; He, L.; Zhang, S.; Wang, R.; Zhang, L.; Li, M.; Liu, Y.; Zhang, S.; Wu, Y.; Hao, J. Variability of Fuel Consumption and CO2 Emissions of a Gasoline Passenger Car Under Multiple In-Laboratory and On-Road Testing Conditions. J. Environ. Sci. 2023, 125, 266–276. [Google Scholar] [CrossRef] [Scilit] [PubMed]
  29. Peng, F.; Zhang, Y.; Song, G.; Huang, J.; Zhai, Z.; Yu, L. Evaluation of Real-World Fuel Consumption of Hybrid-Electric Passenger Cars Based on Speed-Specific Vehicle Power Distributions. J. Adv. Transp. 2023, 2023, 9016510. [Google Scholar] [CrossRef] [Scilit]
  30. Kumar, R.; Jain, A. Driving Behavior Analysis and Classification by Vehicle OBD Data Using Machine Learning. J. Supercomput. 2023, 79, 18800–18819. [Google Scholar] [CrossRef] [Scilit]
  31. Naseri, H.; Waygood, E.O.D.; Wang, B.; Patterson, Z. Interpretable Machine Learning Approach to Predicting Electric Vehicle Buying Decisions. Transp. Res. Rec. 2023, 2677, 704–717. [Google Scholar] [CrossRef] [Scilit]
  32. Zhang, Z.; Demir, E.; Mason, R.; Di Cairano-Gilfedder, C. Understanding Freight Drivers’ Behavior and the Impact on Vehicles’ Fuel Consumption and CO2e Emissions. Oper. Res. 2023, 23, 59. [Google Scholar] [CrossRef] [Scilit]
  33. Pamidimukkala, A.; Kermanshachi, S.; Rosenberger, J.M.; Hladik, G. Barriers and motivators to the adoption of electric vehicles: A global review. Green Energy Intell. Transp. 2024, 3, 100153. [Google Scholar] [CrossRef] [Scilit]
  34. Li, M.; Wang, Y.; Peng, P.; Chen, Z. Toward efficient smart management: A review of modeling and optimization approaches in electric vehicle-transportation network-grid integration. Green Energy Intell. Transp. 2024, 3, 100181. [Google Scholar] [CrossRef] [Scilit]
  35. Ma, Z.; Jørgensen, B.N.; Ma, Z. A Scoping Review of Energy-Efficient Driving Behaviors and Applied State-of-the-Art AI Methods. Energies 2024, 17, 500. [Google Scholar] [CrossRef] [Scilit]
  36. Canal, R.; Riffel, F.K.; Gracioli, G. Machine Learning for Real-Time Fuel Consumption Prediction and Driving Profile Classification Based on ECU Data. IEEE Access 2024, 12, 68586–68599. [Google Scholar] [CrossRef] [Scilit]
  37. Shaffice Haghshenas, S.; Astarita, V.; Shaffice Haghshenas, S.; Guido, G. Artificial Intelligence-Powered Driver Behavior Analysis for Fuel Consumption Optimization: A Pathway to Greener Roads. In Proceedings of the 10th International Conference on Control, Decision and Information Technologies (CoDIT), Valletta, Malta, 1–4 July 2024; pp. 116–122. [Google Scholar] [CrossRef] [Scilit]
  38. Romero, C.A.; Correa, P.; Ariza Echeverri, E.A.; Vergara, D. Strategies for Reducing Automobile Fuel Consumption. Appl. Sci. 2024, 14, 910. [Google Scholar] [CrossRef] [Scilit]
  39. Şişman, İ.N. Makine Öğrenmesi Algoritmaları Kullanılarak Sürücü Davranışlarının Yakıt Verimliliği Üzerindeki Etkisi ve Elektrikli Araçlara Eğilimin Tespiti [The Impact of Driver Behavior on Fuel Efficiency Using Machine Learning Algorithms and the Detection of Inclination Towards Electric Vehicles]. Master’s Thesis, Institute of Natural Sciences, Department of Information Systems Engineering, Sakarya University, Sakarya, Turkey, January 2025. [Google Scholar]
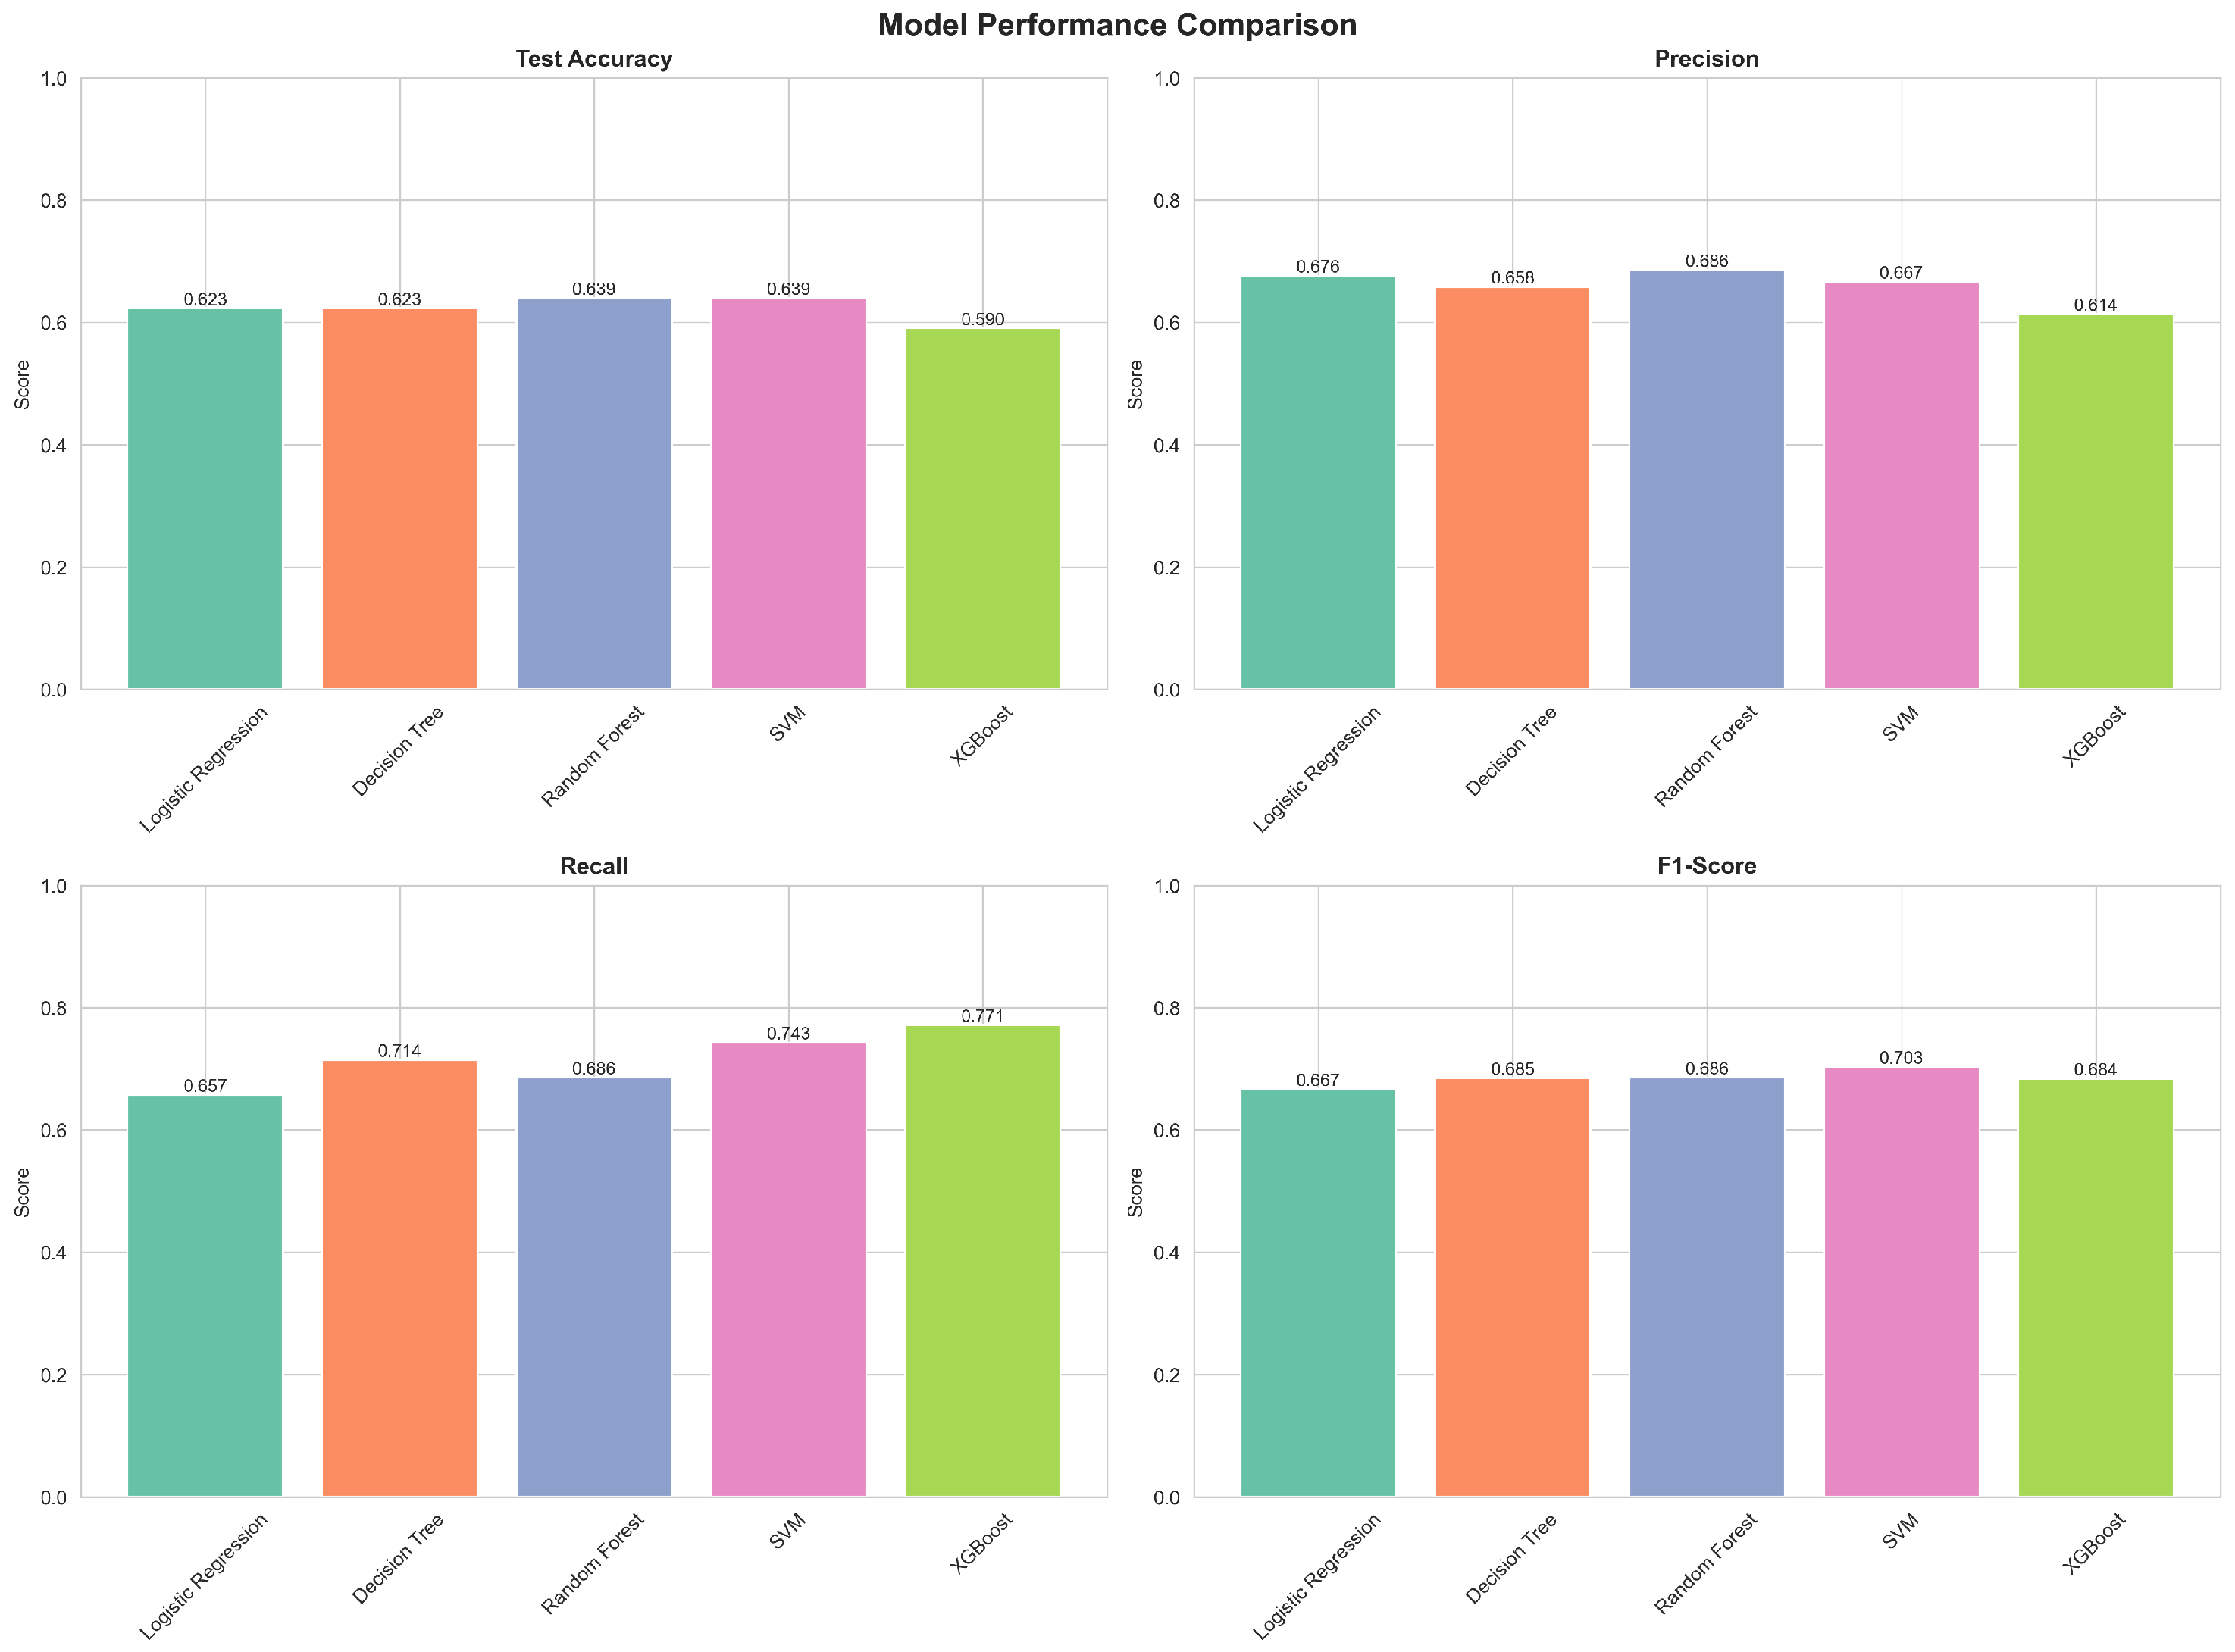
Figure 1. Baseline Model Performance Comparison Across Evaluation Metrics.
Sustainability 18 02463 g001
Figure 2. Effect of SMOTE Augmentation Level on Model Performance.
Sustainability 18 02463 g002
Figure 3. Top 10 Feature Importance Rankings for Decision Tree, Random Forest, and XGBoost Models (Gini Importance).
Sustainability 18 02463 g003
Figure 4. SHAP Summary Plot: Feature Impact on EV Adoption Prediction.
Sustainability 18 02463 g004
Figure 5. Mean Absolute SHAP Values for Top 10 Features.
Sustainability 18 02463 g005
Figure 6. Confusion Matrices for Baseline and Augmented Models.
Sustainability 18 02463 g006
Table 1. Dataset Summary Statistics.
CharacteristicCountPercentage (%)
Total Samples (After Exclusion)232100.0
Class 0 (Not Interested in EV)6025.9
Class 1 (Interested in EV)17274.1
Number of Features27
Training Set18580.0
Test Set4720.0
Table 2. Baseline Model Performance (No SMOTE, Class Weighting Applied).
ModelTest Acc.PrecisionRecallF1-ScoreCV Acc.
Logistic Regression0.62300.67650.65710.66670.6619 ± 0.074
Decision Tree0.62300.65790.71430.68490.7031 ± 0.094
Random Forest0.63930.70270.74290.72220.7237 ± 0.061
SVM (RBF)0.60660.64710.71430.67920.6619 ± 0.074
XGBoost0.62300.67650.65710.66670.6825 ± 0.068
Table 3. Performance Improvement After Removing Undecided Class.
ModelTest Acc. (With Undecided)Test Acc. (Without Undecided) Δ Acc. Δ F1
Random Forest0.57380.6393+0.0655+0.0365
XGBoost0.55740.6230+0.0656+0.0421
Logistic Regression0.54100.6230+0.0820+0.0512
Table 4. Performance of SMOTE Variants with Random Forest.
Augmentation StrategyTest Acc.PrecisionRecallF1-ScoreROC-AUC
No SMOTE (Class Weighting)0.63930.70270.74290.72220.6857
SMOTE0.85110.82930.97140.89470.8571
ADASYN0.82980.80490.94290.86840.8357
BorderlineSMOTE0.85110.82930.97140.89470.8571
SMOTEENN0.87230.85371.00000.92110.8929
SMOTETomek0.89360.87801.00000.93480.9143
Table 5. Threshold Optimization for SMOTETomek Random Forest.
ThresholdTest Acc.PrecisionRecallF1-ScoreBalance Score
0.300.87230.85371.00000.92110.8967
0.350.87230.85371.00000.92110.8967
0.400.89360.87801.00000.93480.9142
0.450.89360.87801.00000.93480.9142
0.500.89360.87801.00000.93480.9142
Table 6. Overfitting Analysis: Train–Test Accuracy Gap.
Model ConfigurationTrain Acc.Test Acc.Gap
RF (No SMOTE, Class Weighting)0.81480.63930.1755
RF (SMOTETomek, Regularized)0.89730.85110.0462
XGB (SMOTETomek, Regularized)0.90120.82980.0714
Table 7. Final Model Performance Summary.
MetricValue
Test Accuracy0.8936 (89.36%)
Precision0.8780
Recall1.0000
F1-Score0.9348
ROC-AUC0.9143
Cross-Validation Accuracy0.8765 ± 0.042
Train–Test Accuracy Gap0.0462 (4.62%)
Disclaimer/Publisher’s Note: The statements, opinions and data contained in all publications are solely those of the individual author(s) and contributor(s) and not of MDPI and/or the editor(s). MDPI and/or the editor(s) disclaim responsibility for any injury to people or property resulting from any ideas, methods, instructions or products referred to in the content.