


Abstract
Under the “dual carbon” goals, this study focuses on realizing energy exchange among multiple microgrids via shared energy storage to promote sustainable energy transition. Accordingly, a distributed robust optimwhichization strategy is proposed in this paper. Addressing the uncertainty of distributed renewable energy sources within microgrids, the scenario set generated by the Wasserstein generative adversarial network with gradient penalty and pruned by the K-means++ clustering algorithm serves as the initial renewable energy scenario for the distributed robust optimization set. Combining Nash theory, a cooperative game operation model is constructed. The benefit distribution model based on contribution factors ensures a fair benefit allocation scheme. The parallelizable column and constraint generation algorithm is employed to enhance computational efficiency. Case studies demonstrate that compared to scenes produced by other methods, the proposed model has the lowest alliance operating cost. It more effectively captures renewable energy uncertainty and lowers system operational costs. The respective efficiency improvement rates for each microgrid are as follows: 4.6%, 5.0%, and 4.1%, ensuring a fair profit distribution scheme. This study provides a technical reference for realizing the sustainable development of a multiple microgrid system, contributing to the global goal of low-carbon energy transition and sustainable development.
1. Introduction
Sustainability has become a core guiding principle for global energy development, and the efficient integration of renewable energy through microgrid systems is a critical pathway to achieve sustainable energy supply, reduce greenhouse gas emissions, and mitigate climate change impacts [1]. The intermittency of renewable energy generation and the high penetration of power electronic interfaces render microgrids vulnerable to random disturbances and model uncertainties. Targeted control strategies have been proposed in relevant studies to address these stability and anti-disturbance issues [2,3]. Energy storage systems store surplus renewable energy during high output and release it when generation is insufficient, smoothing power fluctuations, balancing microgrid supply and demand, and enhancing system stability and reliability [4]. However, owing to substantial capital requirements and limited operational flexibility, energy storage systems built within individual microgrids are not fully utilized [5]. In response to these constraints, the shared energy storage (SES) model has been practically promoted [6]. The collaborative utilization of energy storage across multiple microgrids (MMGs) has markedly enhanced both operational cost-effectiveness and asset utilization efficiency [7]. Nevertheless, the fluctuations of renewable resources, the systemic structure among multiple energy systems, multi-energy flows, and interest conflicts present significant challenges to the optimization of operational strategies for MMG-SES systems.
Currently, many scholars have carried out in-depth research on the planning and configuration, trading model, and cooperative scheduling regarding multiple microgrids-shared energy storage (MMG-SES) with the goal of economy [8,9,10]. In the context of this framework, SES is deemed an essential element. Its functions include promoting the integration of intermittent energy sources, enhancing the adequacy of the power system, providing reliable backup power support, and improving power quality by suppressing frequency and voltage oscillations [11]. SES managed by operators typically provides two primary service models: capacity leasing and charging/discharging services [12]. The capacity leasing model allows users to rent a specific amount of storage capacity for a defined period, granting them autonomy over its use under a long-term contractual framework [13]. Conversely, the charging/discharging service model is more transactional, where operators directly meet users’ power demands, with billing based on actual consumption patterns [14].
Most SES systems are independently operated in a non-cooperative manner, prioritizing self-interest over system efficiency, which can lead to market inefficiencies [15]. Game theory has thus emerged as a key tool for resolving these benefit allocation conflicts [16]. Non-cooperative game models [17,18,19,20] improve power allocation efficiency but only yield local optima and lack fairness in benefit distribution. Stackelberg game models [21,22] address hierarchical coordination by empowering leaders to guide microgrid behavior; however, this structure often results in unfair benefit distribution for passive followers. In contrast, cooperative game models [23,24] maximize overall system welfare and incentivize long-term collaboration through fair profit-sharing mechanisms. Despite their efficiency in scheduling, existing cooperative game frameworks fail to sufficiently account for the inherent fluctuations of renewable energy generation.
Renewable generation uncertainty is primarily addressed using stochastic programming (SP) [25] and robust optimization (RO) [26]. SP relies on accurate probability distributions and scenario sampling, which risks either over-optimism or intractable computation, compounded by the difficulty of identifying true distributions. RO avoids probabilistic assumptions by using uncertainty sets, but often produces overly conservative worst-case solutions. DRO combines its strengths, constructing data-driven ambiguity sets for the worst-case distribution without predefined parameters. Recent studies have applied Wasserstein distance-based DRO to MMG scheduling for DSO-MG interactions [27], multi-source uncertainty [28], and EV integration [29], while others used norm-constrained sets for renewable variability [30]. However, few studies have integrated DRO with cooperative game theory specifically for MMG-SES systems.
The state-of-the-art techniques for modeling renewable generation scenarios primarily consist of two distinct classes: parametric and non-parametric methodologies. Parametric methods are mainly the Monte Carlo (MC) method [31], Latin Hypercubic Sampling (LHS) method [32], and Conjugate Function Sampling method [33]. These models first determine the corresponding parameters based on historical data of renewable energy output, and then use specific sampling methods to generate the initial set of scenarios. However, these methods fail to fully consider the spatial and temporal correlation of new energy-generation sequences and other unknown information. Therefore, in complex practical application environments, scene generation methods based on parametric methods lack wide applicability.
Non-parametric methods do not involve distributions and have attracted significant research attention in the recent literature. The distance matching method [34] and moment matching method [35] construct scenarios through optimal alignment of predicted features with realized results. These approaches typically employ distance indices to eliminate unrepresentative scenarios or those failing to meet error constraints. However, such methodology may inadvertently discard statistically rare but operationally critical scenarios [36]. Recent advances have introduced machine learning approaches for renewable energy scenario generation [37]. Reference [38] proposed a novel radial basis function neural network–particle swarm optimization (RBFNN-PSO) framework for synthetic scenario creation using weather prediction models. Reference [39] trained neural networks to model stochastic processes or slope event probabilities for wind power. Although these data-driven techniques outperform conventional Copula and time-series methods in capturing nonlinear generation dynamics, their practical application remains constrained by feature selection sensitivity and operational reliability concerns.
Generative adversarial networks (GANs) have emerged as a promising non-parametric approach for renewable energy scenario generation, attracting significant research interest [40], and they are considered a novel class of generative frameworks for generating renewable scenarios. Reference [41] developed a GAN-based method to synthesize renewable scenarios by modeling historical data distributions, explicitly incorporating spatio-temporal dependencies across geographically dispersed sites. Reference [42] designed a Bayesian GAN to model diverse renewable generation patterns from historical data. Reference [43] proposed an unsupervised GAN-based scenario prediction method for creating an ensemble of possible future realizations. In order to enforce the Lipschitz constraints, reference [44] incorporated gradient penalty regularization into the GAN framework. These advanced deep generative approaches demonstrate superior capability in automatically learning probabilistic distributions and spatio-temporal dependencies from historical operational data through semi-supervised learning paradigms, eliminating reliance on manual annotation. The GAN-based methods enable more precise characterization of renewable generation dynamics compared to conventional generative techniques. However, existing studies have less frequently applied them to DRO modeling. The characteristics of the main works discussed above are summarized in Table 1.
Table 1.
Feature comparison between this study and related works.
The optimal operation of MMG-SES systems is critical for leveraging distributed energy, yet its development is hindered by unresolved technical and operational challenges. First, renewable energy intermittency complicates scheduling: parametric scenario methods fail to capture spatio-temporal correlations and tail characteristics, while GANs often suffer from mode collapse, leading to suboptimal economic or robust decisions. Second, conflicting interests among heterogeneous microgrids and operators lack coordination; non-cooperative games yield local optima, Stackelberg games risk unfairness, and traditional cooperative games cannot sustain long-term stability. Third, existing uncertainty methods are flawed: SP requires impractical distribution data, robust optimization RO is overly conservative, and single-norm DRO lacks flexibility. Finally, the complex MMG-SES model demands high computational efficiency, and centralized solvers pose privacy risks. This study thus aims to develop a systematic optimization framework to address these gaps and advance MMG-SES practicality.
Against this backdrop of challenges, this study proposes an economic operation model for MMG-SES based on Nash negotiation theory, which fully accounts for renewable generation uncertainty. This collaborative framework enables participants in the integrated system to form cooperative alliances through Nash bargaining, facilitating energy sharing while safeguarding information security across all entities. The key innovations of this research are as follows:
- To better capture the stochastic nature of renewable generation, a typical renewable energy scenario obtained by Wasserstein generative adversarial networks with gradient penalty (WGAN-GP) scenario generation, and K-means++ clustering is proposed for generating the initial renewable energy scenarios for the DRO set. A data-driven DRO model is constructed with composite norm-based ambiguity sets.
- Combining the DRO method with Nash negotiation to model the cooperative game of the MMG-SES system for optimal energy trading. Compared with the traditional Nash bargaining model, this paper allocates cooperative benefits according to the energy contribution factors, effectively stimulating the enthusiasm of microgrid entities to participate in energy trading.
- By decomposing the cooperative game model into two subproblems of system benefit maximization and electric energy transaction payment, the process from autonomous optimization to power exchange management among microgrid participants is realized. For subproblem 1, a parallelizable column and constraint generation (C&CG) algorithm is employed, which significantly enhances the computational efficiency of the model. Subproblem 2 is addressed via a distributed alternating direction method of multipliers (ADMM) implementation, thereby ensuring privacy preservation for all participating entities. Finally, cases are carried out to demonstrate the validity of the presented framework.
This paper proceeds with the following structure: Section 2 elaborates on the proposed system structure. Section 3 proposes a typical renewable energy scenario obtained by WGAN-GP scene generation and K-means++ clustering. Section 4 presents a data-driven two-stage DRO model for the MMG-SES system. The cooperative model considering DRO is presented in Section 5. Section 6 utilizes empirical case analysis to verify the developed framework. Section 7 provides key findings and discusses potential future directions.
2. System Framework
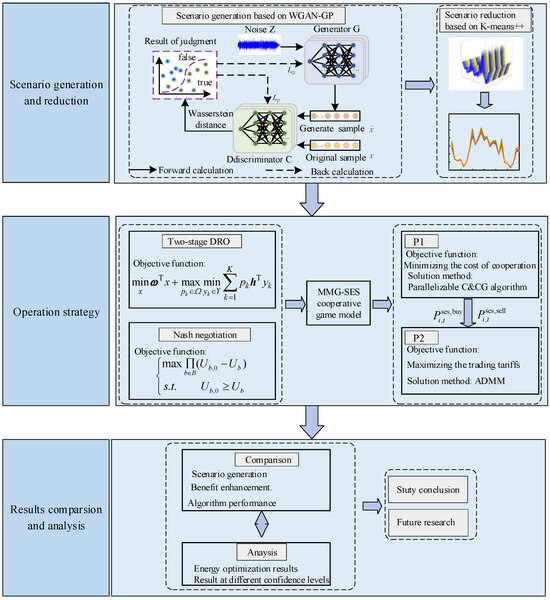
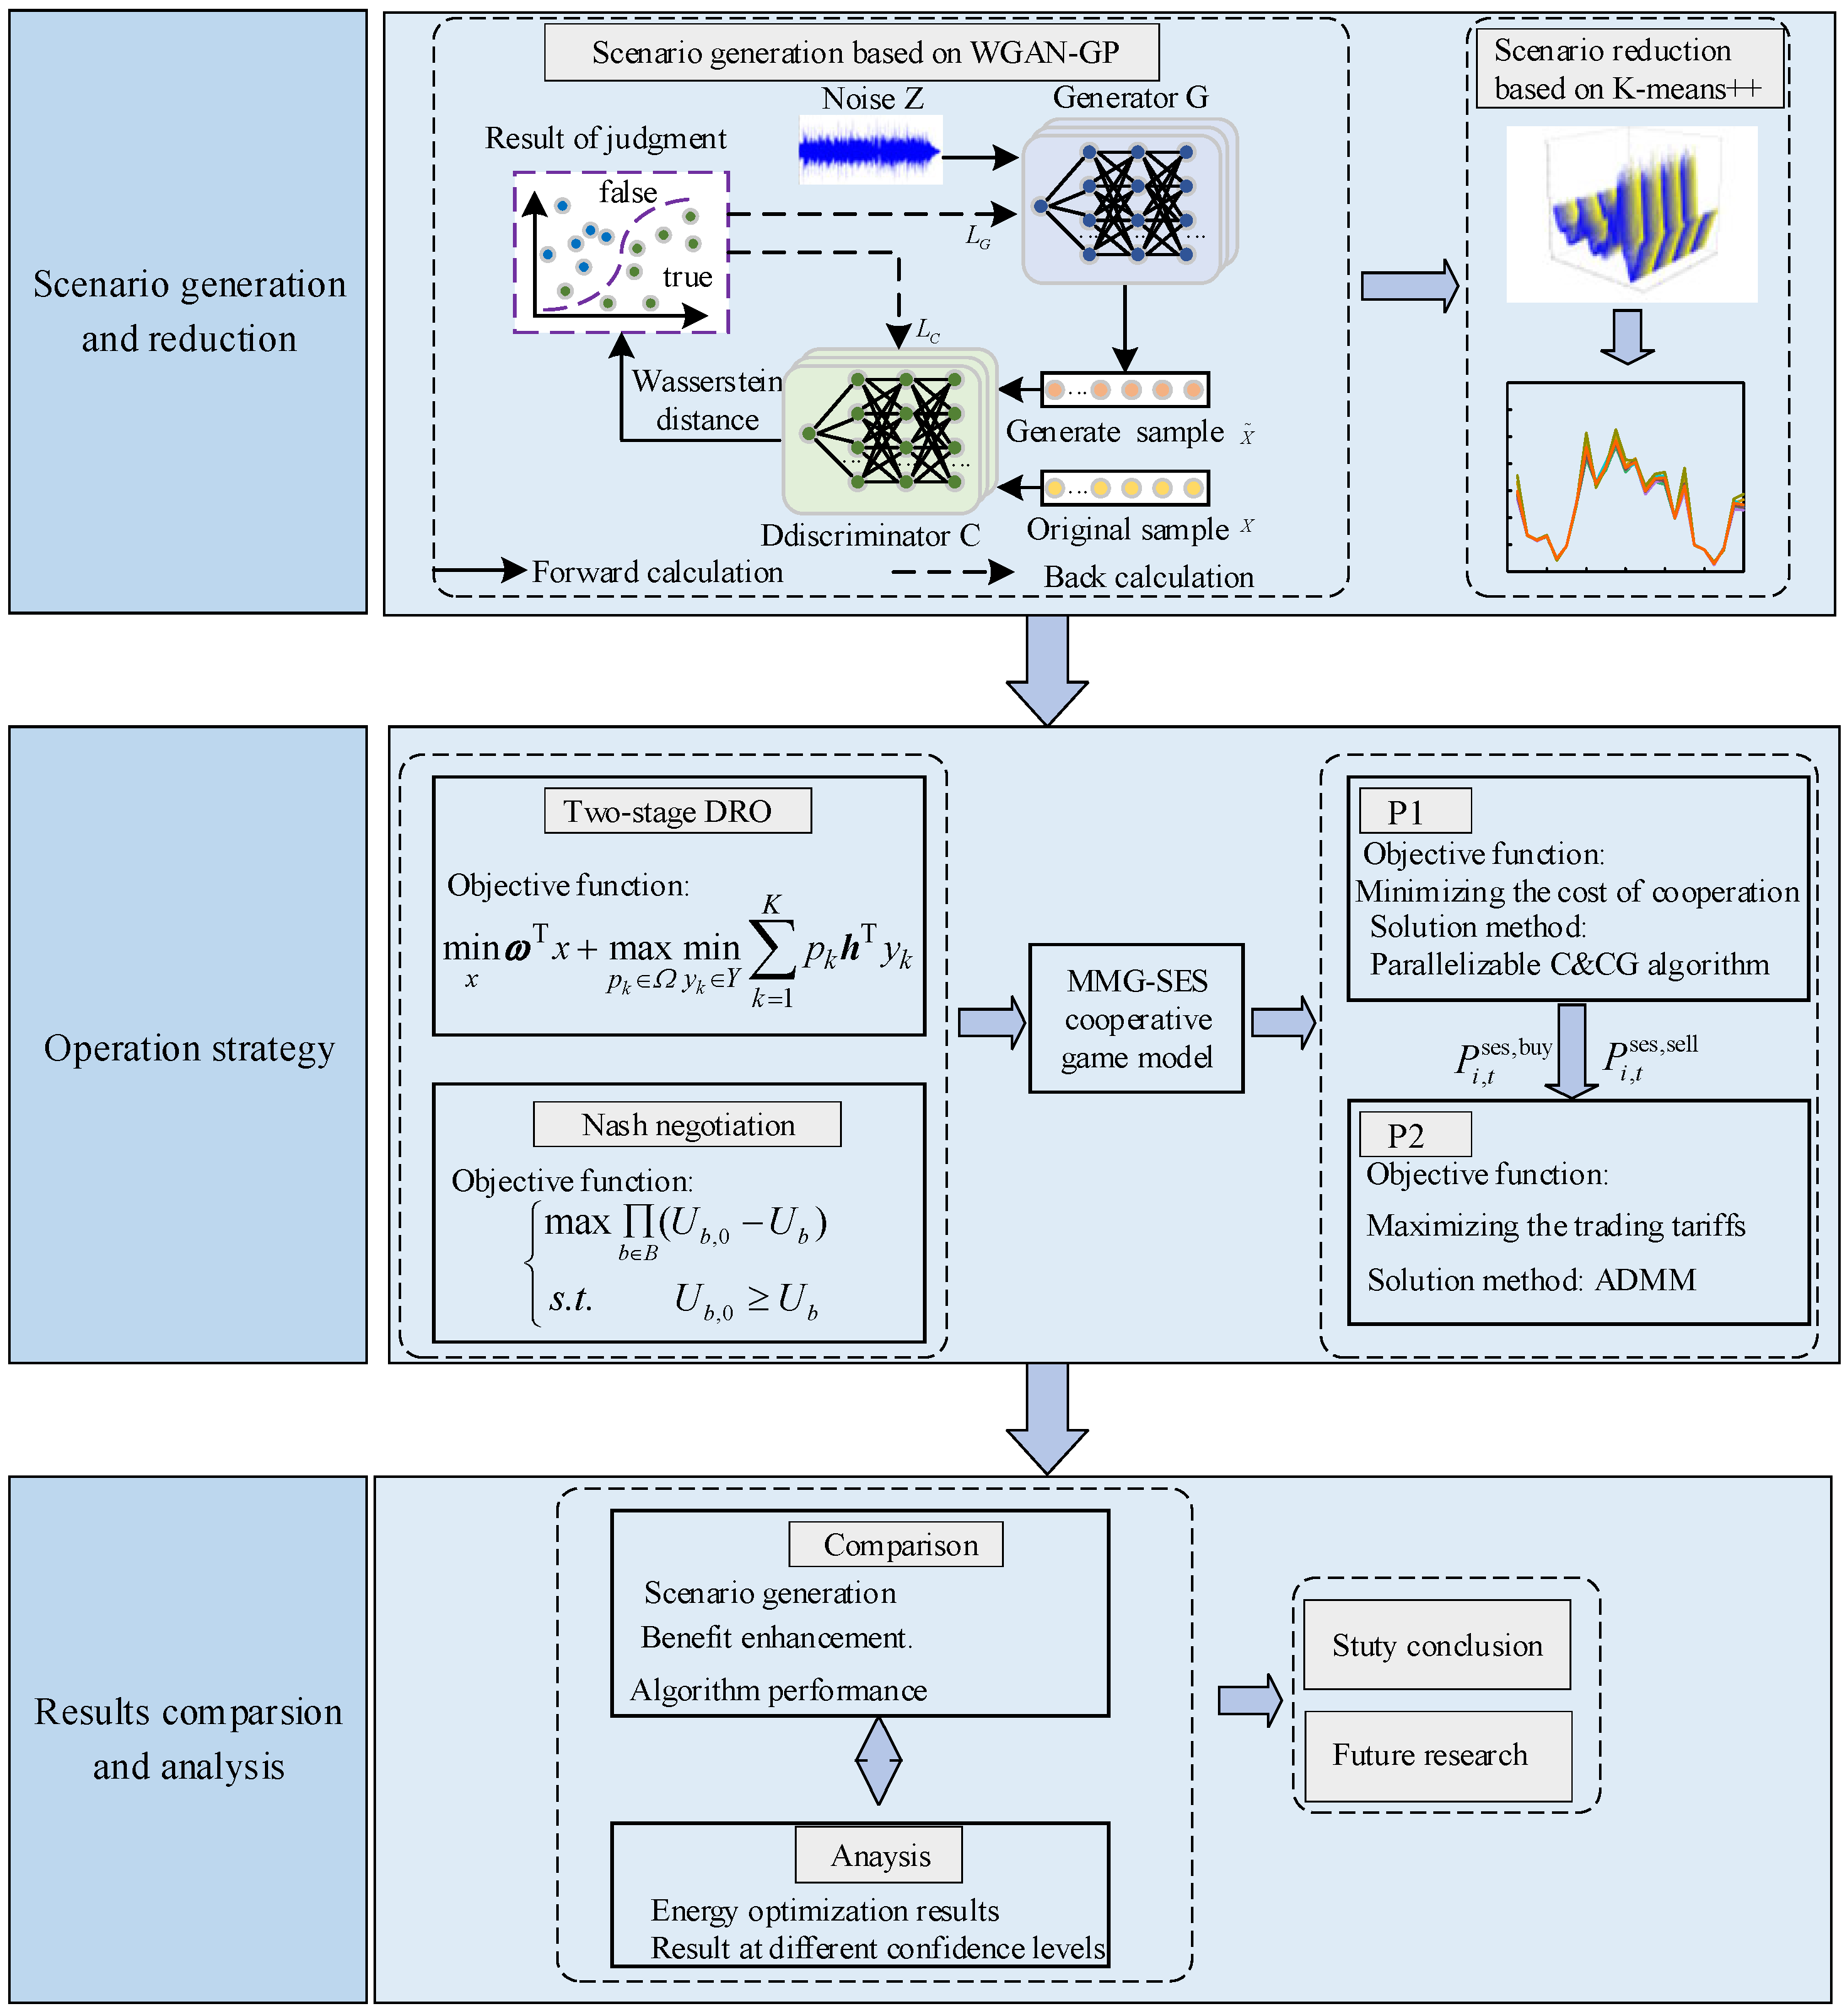
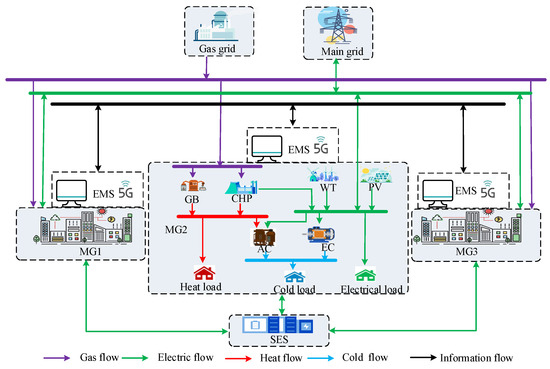
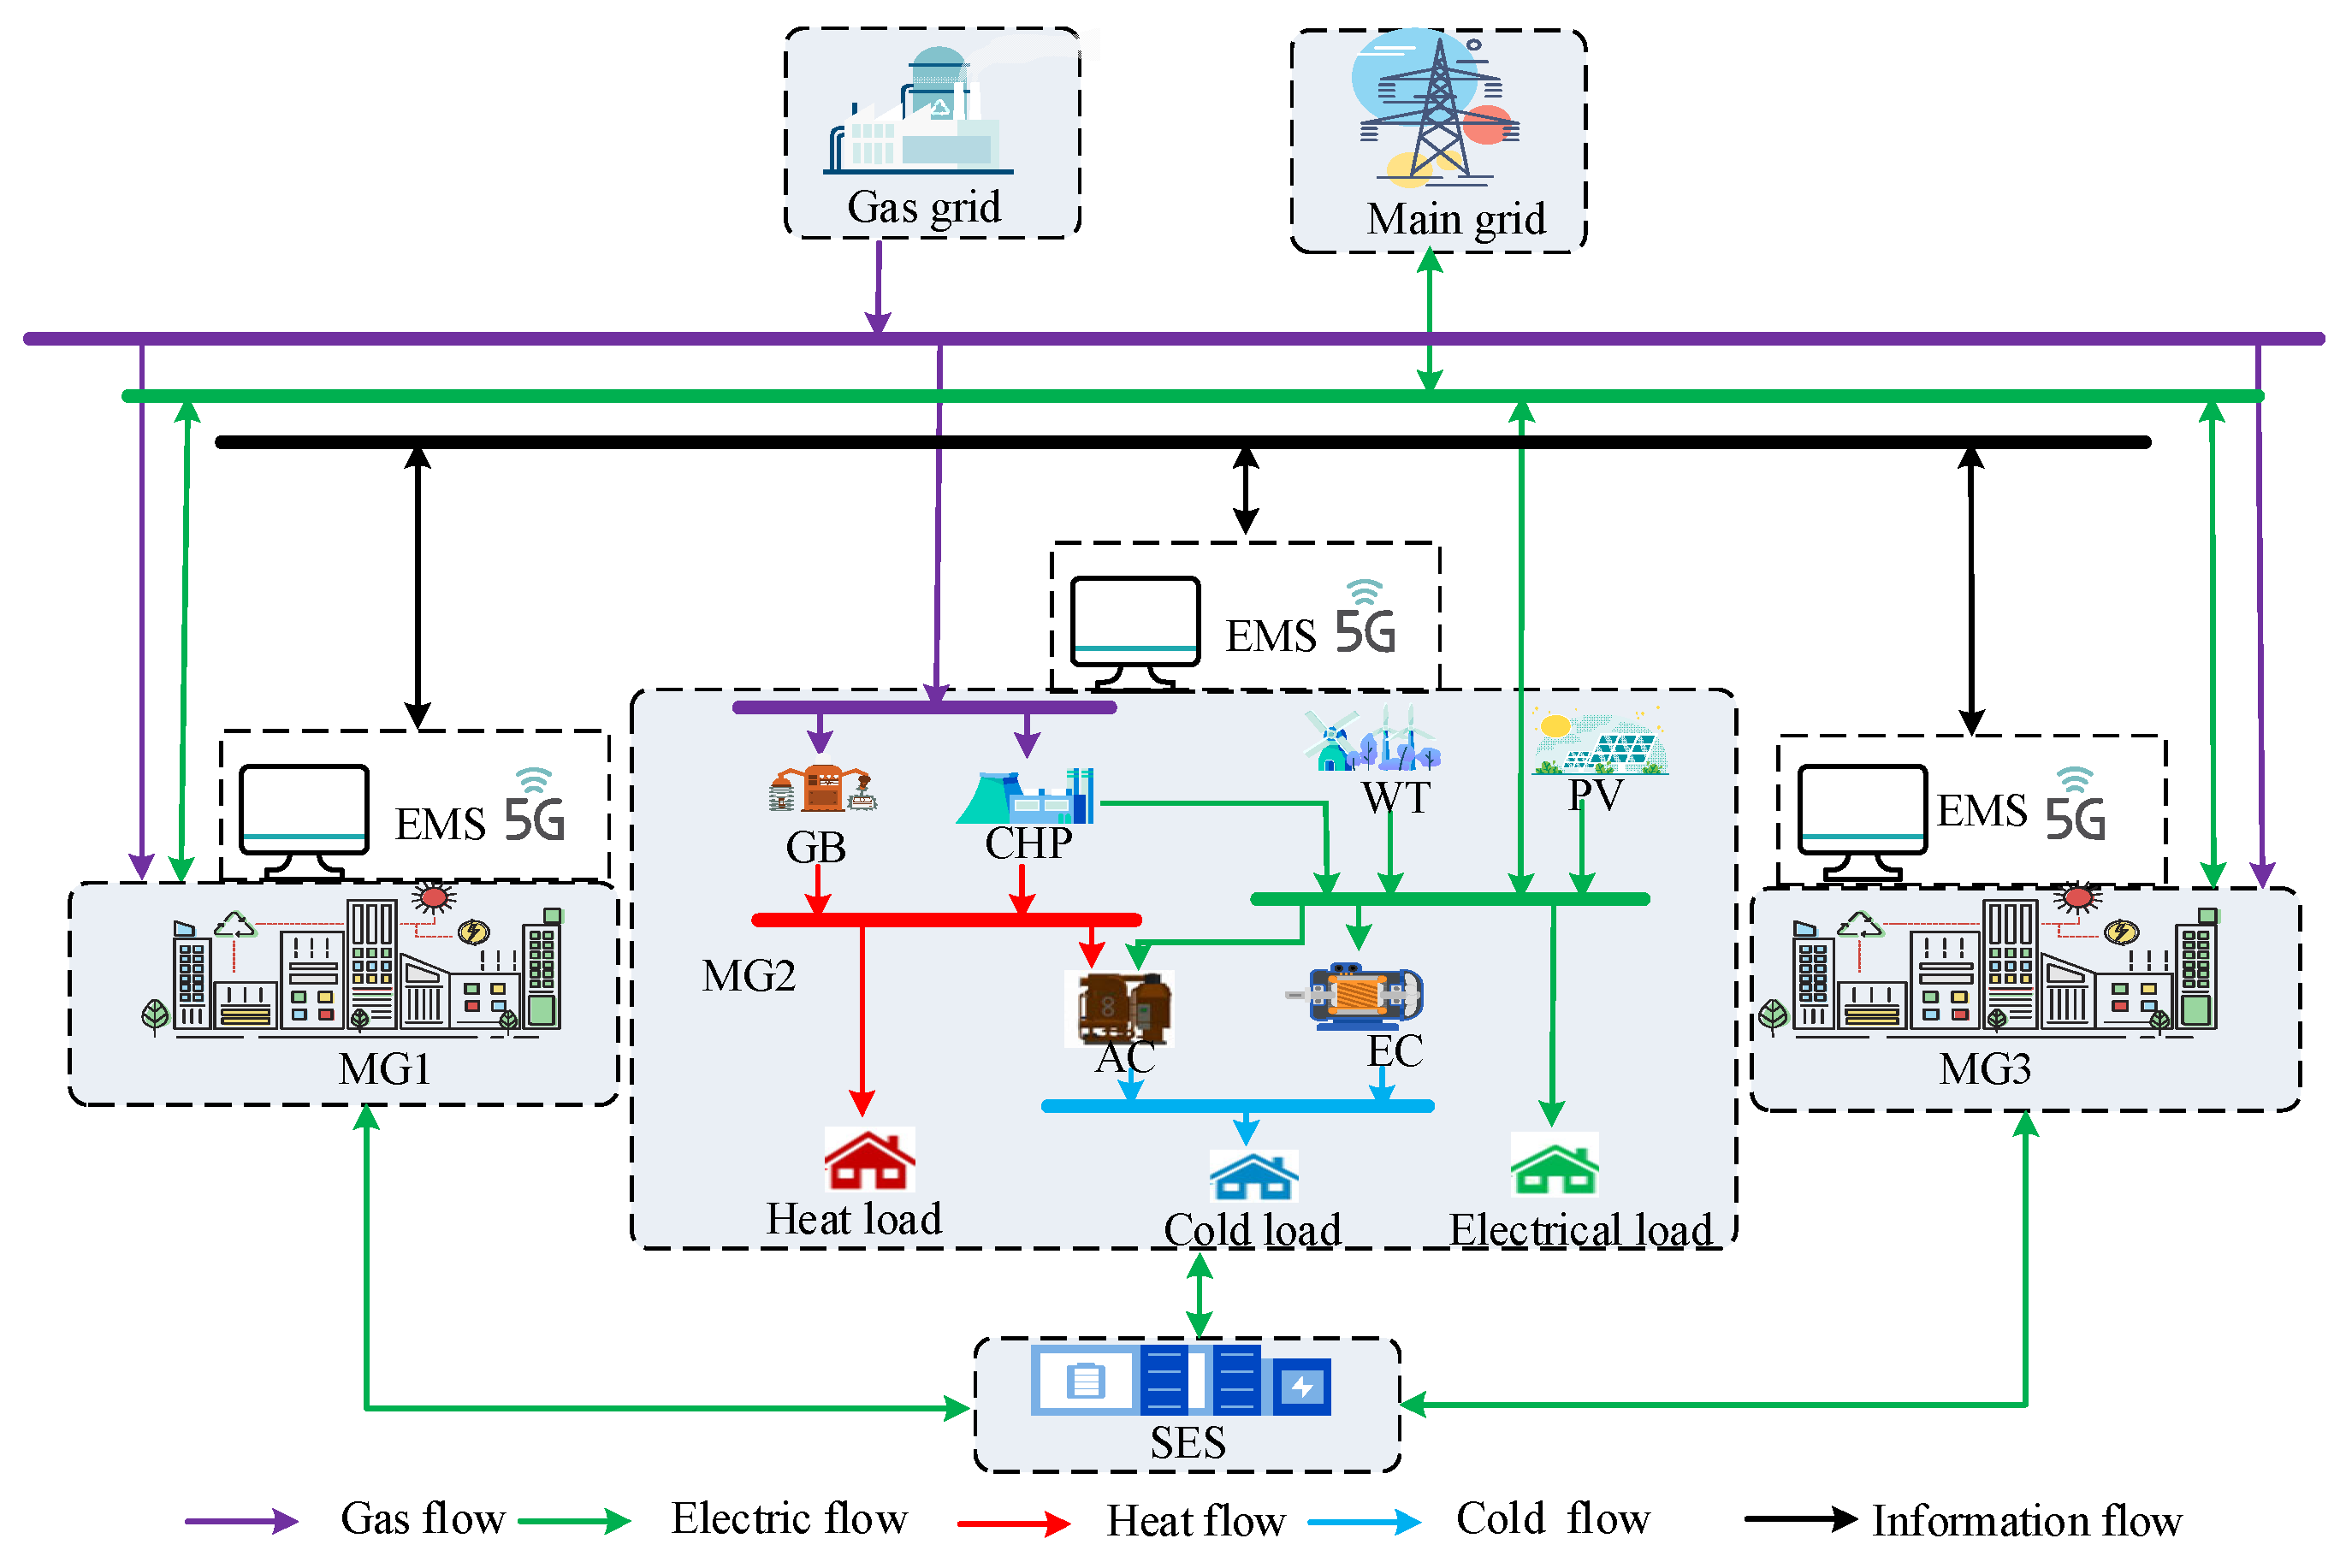
Figure 1 provides a graphical outline of the research methodology. Figure 2 is a system operation framework diagram. As depicted in Figure 2, the MMG-SES framework under investigation is built upon three essential modules: a SES operator, main grid, and three interconnected microgrids. Each microgrid incorporates the following key equipment: wind turbines (WT), photovoltaic (PV) systems, combined heat and power (CHP) units, gas boilers (GBs), absorption chillers (ACs), and electric coolers (ECs).
Figure 1.
The research framework of the study.
Figure 2.
System operation framework diagram.
Within the MMG system, when renewable energy generation exceeds demand, excess power generation may be traded with the SES system and subsequently redistributed to other microgrids when needed. The SES exclusively engages in energy transactions with internal MG entities within the system, maintaining no direct interaction with external distribution networks. In this architecture, all energy transactions between MGs and the SES system follow a standardized process: each MG first integrates its electrical, heat, and cold energy outputs over a given time period before initiating any energy exchange. Additionally, each microgrid is equipped with an energy management system (EMS) that utilizes advanced 5G communication technology to enable real-time energy interaction and price transmission, ensuring high efficiency while simultaneously meeting microgrid privacy protection requirements.
3. Scenario Production and Reduction
3.1. Basic Principles of WGAN-GP
Generative adversarial networks (GANs) are an unsupervised learning framework based on adversarial training [45]. This framework produces synthetic samples that closely match real data distributions via competitive optimization between two neural networks: a generator and a discriminator [46]. The generator maps random noise inputs to synthetic samples, while the discriminator evaluates sample authenticity. The adversarial process is mathematically governed by Jensen–Shannon (JS) divergence minimization, where the mathematical objective takes the following form:
where is the generator loss function; is the expectation function; is the generator function; is the discriminator function; is the distribution of the noisy data; is the input noisy data.
The discriminator loss function is as follows:
where is the discriminator loss function; is the real data distribution. Based on the two aforementioned loss functions, the objective function for the generator–discriminator adversarial game can be formulated as:
where is the generated samples’ probability density function. is JS divergence.
From Equation (3), it can be seen that the optimal discriminator for measuring equivalence between sample distributions is equivalent to the JS divergence. However, using the JS divergence as a probability distribution distance measure and discriminator loss function has a fundamental flaw. When and have no overlap whatsoever, , . That is, the JS divergence consistently describes the distance between non-overlapping probability distributions as a constant value, while it effectively characterizes the distance between distributions with overlapping regions.
In order to address the challenge of gradient vanishing during GAN training, WGAN introduces the Wasserstein distance instead of JS scattering as the optimization objective, which can provide stable gradient signals without overlapping between the model-generated data and the empirical data distribution, avoiding the problem of gradient vanishing, and at the same time, its optimization objective is smoother, which makes the generator able to optimize and learn the data distribution efficiently, thus enhance the model’s convergence reliability and output fidelity [47]. To guarantee Lipschitz continuity in Wasserstein distance computation, WGAN adopts weight truncation to constrain the evaluator parameters, limiting them to a fixed range [48]. However, this method may lead to anomalous gradient updates, thus affecting the learning ability of the evaluator.
To further optimize the stability of WGAN training, WGAN-GP enforces the Lipschitz condition through gradient penalty regularization, replacing the weight truncation adopted by WGAN. The generator loss function is expressed as:
The expression for the WGAN-GP model discriminator loss function is given below:
where is the number of p norms; is the gradient operator; is the penalty term coefficient; represents stochastic linear interpolation between the empirical data distribution and the generated data distribution, ; obeys a uniform distribution in the range of [0, 1]; represents uniform linear interpolation between samples from the true data distributions and generated data distribution.
3.2. Steps for Generating Scenes Using WGAN-GP
The operation mechanism of WGAN-GP achieves sample generation by alternately optimizing the generator and evaluator, and its core objective is to gradually approximate the empirical data distribution. The steps are as follows:
- Data sampling. Samples from the empirical distribution and the model-generated data distribution are used as inputs to the evaluator.
- Discriminator optimization. The discriminator parameters are optimized by minimizing the composite loss incorporating the Wasserstein metric and gradient penalty constraints.
- Generator optimization. Inputting a random noise vector, the generator generates new data samples and minimizes the loss function in order to produce high-quality data and gradually approximate the true distribution.
- Alternating updates. In each round of training, the discriminator parameters are prioritized to be updated multiple times, followed by updating the generator parameters to ensure that the discriminator achieves the ability to provide a stable gradient signal to the generator.
- Convergence of the judgment. When the Wasserstein distance stabilizes, and the loss fluctuations of the generator and the discriminator converge, the training of the model is judged to be complete.
Through the above mechanism, WGAN-GP is able to realize efficient training in complex data generation tasks, establishing a robust foundation for subsequent photovoltaic scenario modeling.
3.3. Scenario Reduction Based on K-Means++
The basic K-means clustering algorithm has a major defect: it requires the number of clusters to be given as an input [49]. Furthermore, it randomly selects the initial cluster centers. The K-means++ algorithm is an enhanced variant of traditional K-means. It uses an optimized centroid initialization to overcome the original method’s sensitivity to initial cluster positions [50]. In this study, we utilize K-means++ to classify the extensive scenario set produced by WGAN-GP, with the detailed procedure outlined below:
- The initial clustering center is determined by random selection from the entire data population .
- Compute the Euclidean metric between each sample and initialized centroids retaining the minimal distance for each sample, denoted as .
- Calculate the probability that each sample may be selected as the next clustering center. The sample maximizing the selection probability is designated as the new centroid. This procedure iterates until K clusters are identified, whose associated centroids are . The expression for is given as follows:
- 4.
- For each data point , compute its Euclidean distance to the K cluster centers, and assign to the cluster corresponding to the clustering center with the smallest distance.
- 5.
- For each cluster , recalculate the clustering center for that category, and the expression of is shown as follows:
- 6.
- Iterate steps 4 and 5 until cluster centroids converge.
4. Data-Driven Two-Stage DRO Modeling
4.1. SES Modeling
4.1.1. Objective Function
The total cost of SES includes charge and discharge loss cost , the electricity traded cost between the SES and MMG , and maintenance cost . The expression is as follows:
where is the rated power; is the rated capacity; is the number of days of use of the SES equipment; and are the operation costs of the SES unit power and capacity respectively; and are the charging and discharging power of SES at time t; is the charging and discharging unit power loss coefficient; is the expectation power that SES expects to interact with MG ; is the tariff that SES expects to interact with MG ; is the number of microgrids; T is the scheduling period, which is taken as 24 h.
4.1.2. Constraints
- State operational constraints
- 2.
- State operational constraints
- 3.
- Power balance constraints
4.2. Microgrid Operator Model
4.2.1. Objective Function
Individual MG cost includes the purchased electricity cost , the purchased gas cost , the demand response cost , the operation and maintenance cost , and the electricity traded cost between the MG and SES . The expression is given below:
where and are the purchase and sale prices of electricity with the main grid; and are the purchased and sold electricity for the main grid, respectively; is the gas price from the natural gas network; is the purchased gas power; , , and are the unit demand response costs for transferable electric loads, curtailable electric loads, and curtailable heat loads, respectively; is the transferable electric load; is the curtailable electric load; is the curtailable heat load; , , , and are the unit operation cost for CHP, GB, EC and AC, respectively; is the gas consumption power of the CHP; is the gas consumption power of GB; is the electric power consumption of EC; is heat consumption power of AC; is the tariff that MG i expects to interact with SES; is the expectation power that MG i expects to interact with SES.
4.2.2. Constraints
- CHP operational constraints
- 2.
- GB operational constraints
- 3.
- EC/AC operational constraints
- 4.
- Demand response constraints
- 5.
- Interaction constraints with external energy
- 6.
- Power balance constraints
4.3. Two-Stage DRO Model Based on Scene Probability
The objective function for constructing a two-stage robust optimization model for MMG-SES is:
where is the total number of clustered scenarios; is the probability of scenario k; is the confidence interval for the composite paradigm; and represent the decision variable sets in the first stage and the second stage, respectively.
The two-stage DRO model is expressed compactly as follows:
where , , , , and represent the coefficient matrices associated with the decision variables for each constraint set, and , are the constant coefficient column vectors.
Scenario clustering yields an imperfect probability distribution. To better approximate real data, we construct an uncertainty confidence set anchored to the initial distribution. Using combined 1-norm and ∞-norm constraints, we determine worst-case probability distributions for each scenario via the confidence interval:
where is the initial probability of scenario k; M is the count of samples generated; and are the permitted probability deviations under the 1-norm and ∞-norm, respectively; and are the uncertainty probability confidence levels.
5. MMG-SES Cooperative Game Model and Solution
5.1. The Nash Negotiation Principle
The standard Nash negotiation model is shown below:
where is the set of members involved in the negotiation; is the pre-cooperation cost of member , i.e., the point at which the Nash negotiation breaks down; is the running cost of member after it has conducted the negotiation.
5.2. MMG-SES Cooperative Game Modeling
In MMG-SES, each subject wants to find the best strategy through negotiation to maximize its own benefits. Therefore, rationally determining the trading quantity and price of electric energy between SES and MG becomes a key issue of concern for both parties. Under the cooperative game framework, the Nash negotiation method can ensure fair and reasonable resource allocation while balancing individual interests and overall benefits, thus optimizing the overall benefits. Following Nash bargaining theory, we formulate the model as:
where and are the costs before and after SES participation in the cooperative operation; and are the costs before and after MG participation in the cooperative operation, respectively.
Aiming at the characteristics of the non-convex nonlinear optimization problem of the above equation, which is difficult to analyze, this paper decomposes the original problem into two simpler subproblems based on the principle of mean value inequality [51,52].
Subproblem 1: minimizing the cost of cooperation:
Subproblem 2: maximizing the payment benefit:
Subproblem 2 completes transaction payments through cooperative bargaining based on the interactive power obtained from solving subproblem 1. Due to limitations in the charging/discharging efficiency of shared energy storage equipment, the state of charge of the SES also decreases when the alliance achieves an internal power purchase and sale balance. Therefore, this paper considers the energy contribution of each MG in the energy cooperation and the change in the state of charge of the SES to implement asymmetric bargaining. A nonlinear function based on the natural logarithm is adopted to quantify the contribution size of different stakeholders in the energy cooperation. Within the alliance, cooperative bargaining is conducted based on each entity’s contribution level as bargaining power to determine the electricity transaction prices between each MG and SES, thereby reasonably allocating cooperative benefits. The contribution levels and bargaining factors for each MG and SES during the energy cooperation process are shown in Equations (26) and (27), respectively:
where and represent the electricity supplied and received by each microgrid, respectively; and represent the decrease and increase in the state of charge of the SES, respectively; and denote the maximum electricity supplied and received by each MG, respectively; and represent the contribution factors of each MG and the SES, respectively.
Each MG contributes positively when receiving and supplying electricity, but supplying electricity yields a greater contribution than receiving it. During the dispatch period, SES receives a contribution greater than 1 when its state of charge decreases, with the contribution increasing as the decrease in state of charge grows. Conversely, it receives a contribution less than 1 when its state of charge increases, with the contribution decreasing as the increase in state of charge grows. Finally, substituting the above results into the equation and equivalently converting it to logarithmic form yields the objective function for the subproblem based on the improved Nash bargaining:
where and are the optimal solutions found in subproblem 1.
5.3. Model Solution
5.3.1. Solution of Subquestion 1
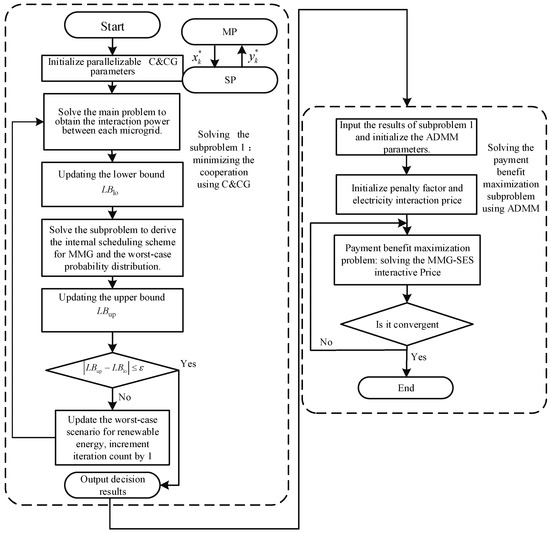
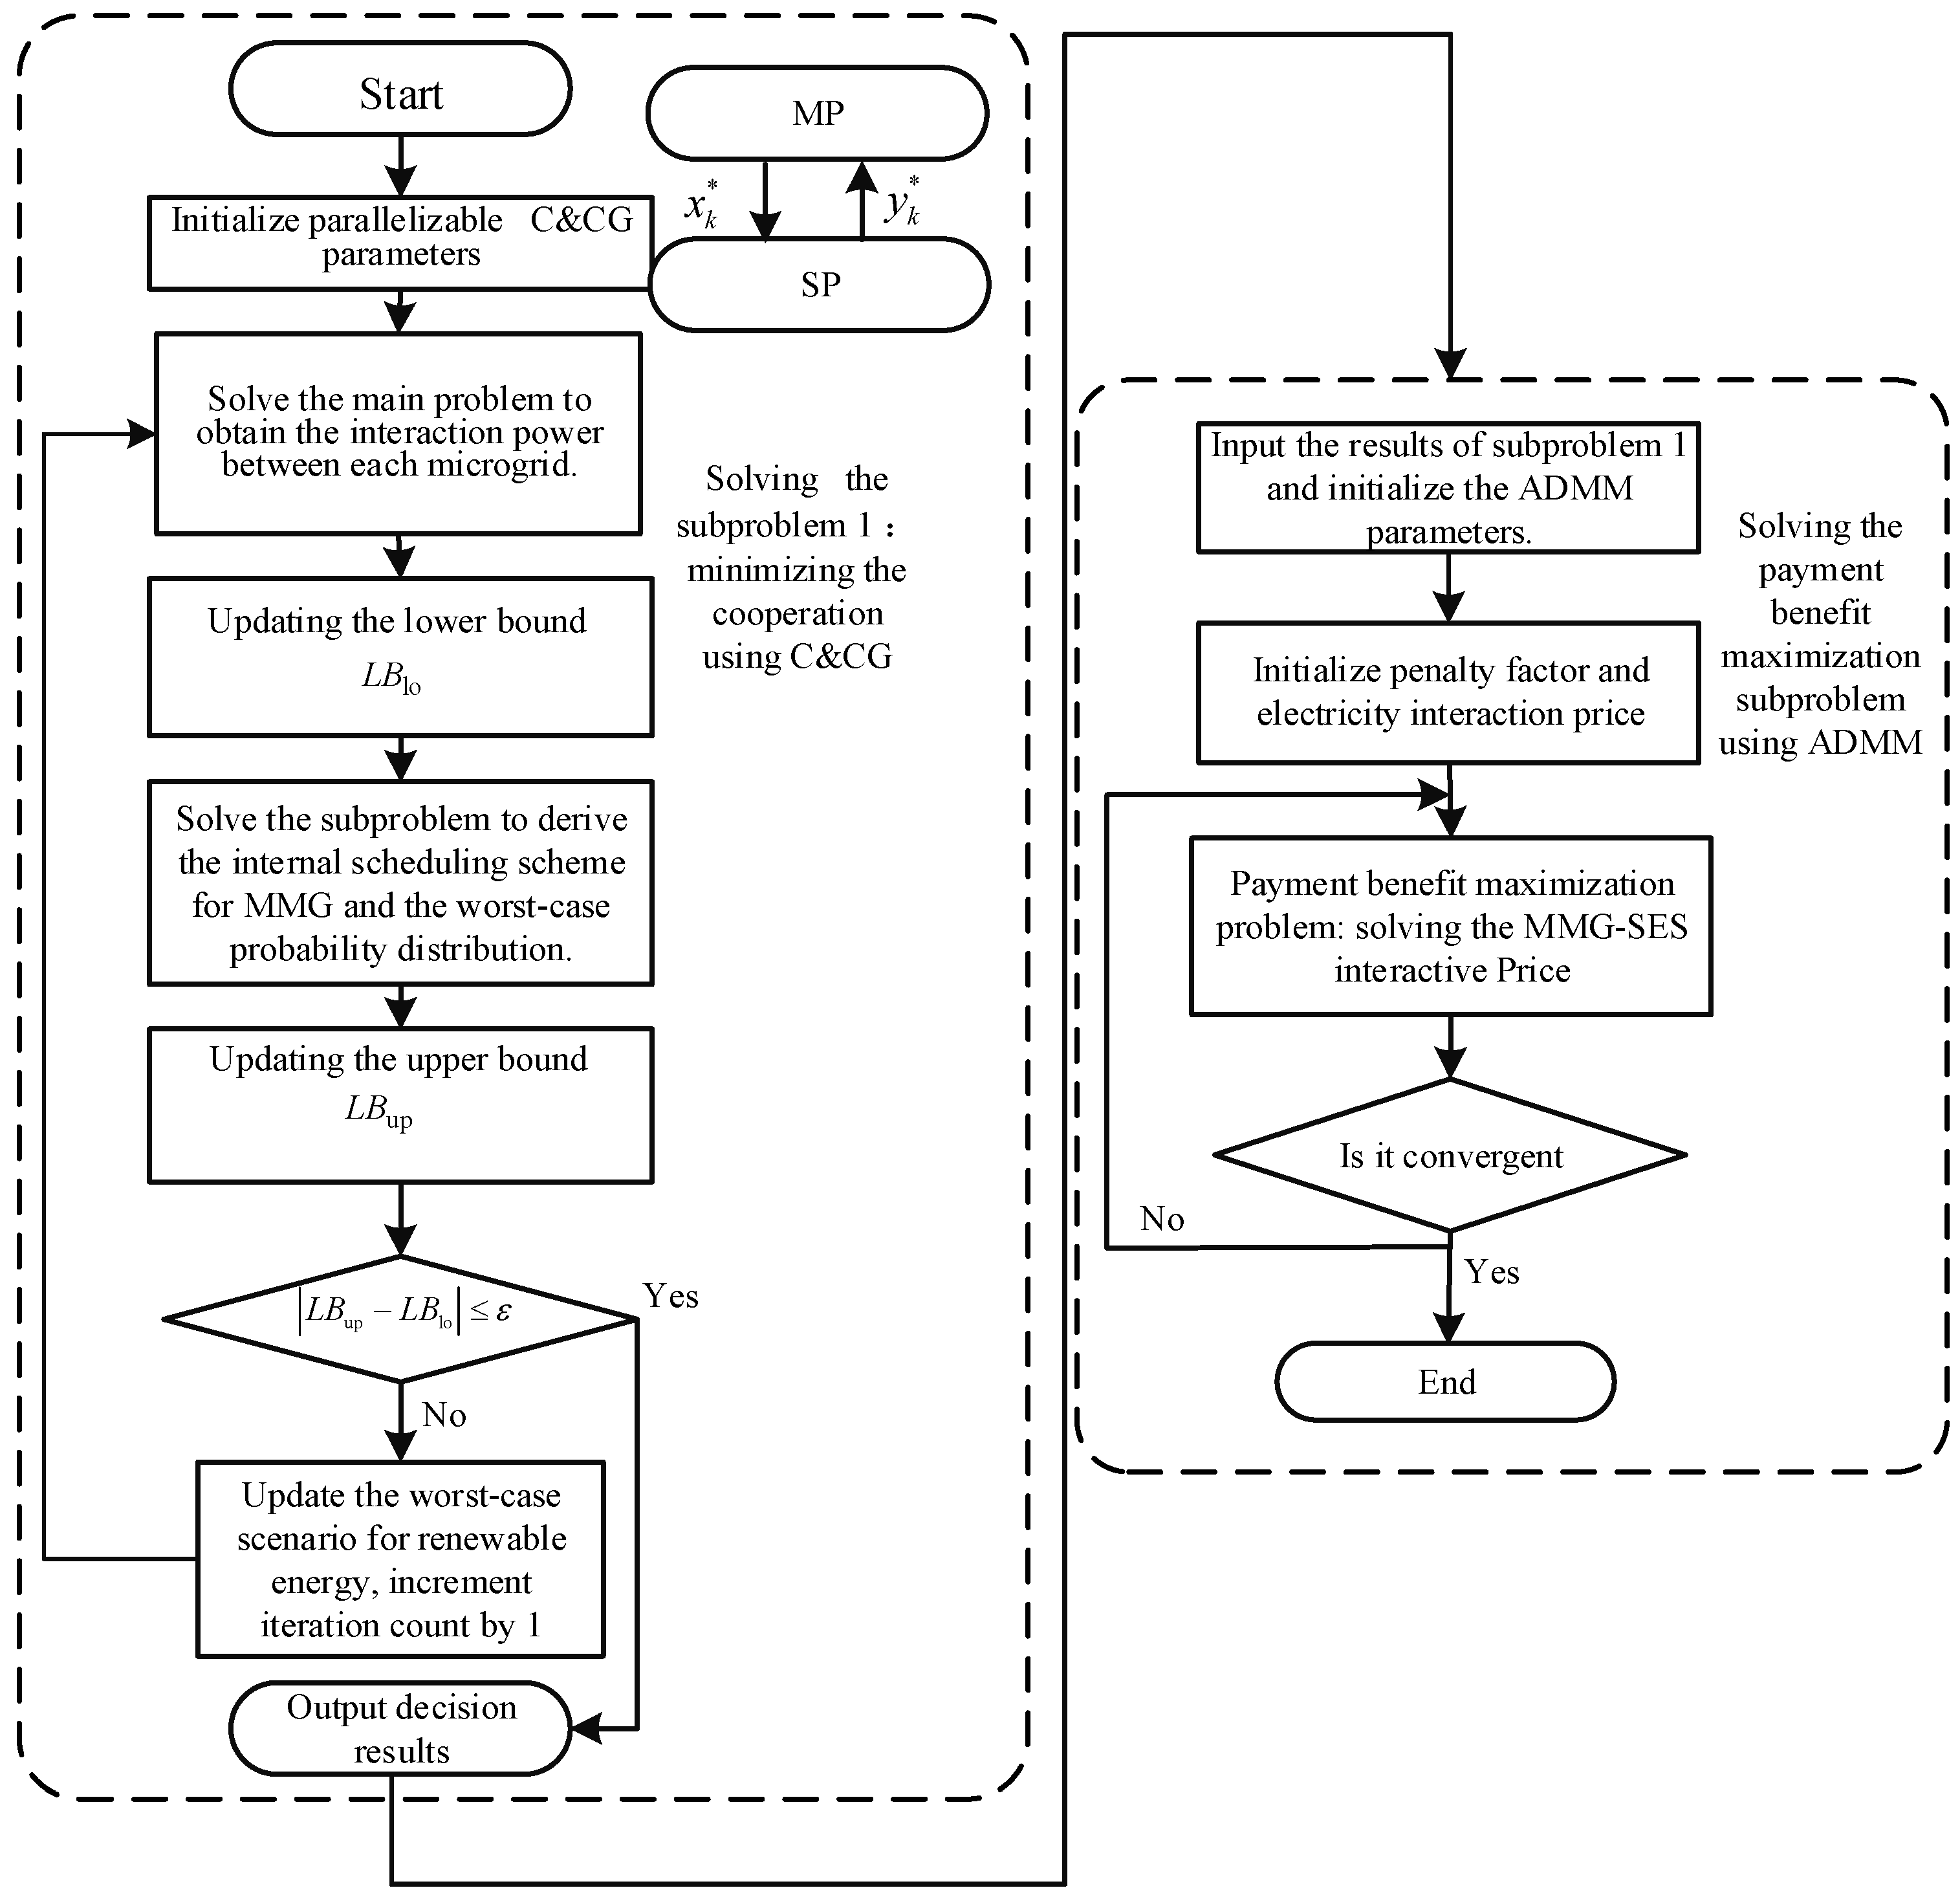
In this paper, the solution methodology adopts a parallelizable C&CG algorithm to handle the two-stage DRO model. The first stage min problem decides the energy trading plan with the outside world before the uncertainty occurs, which is called the pre-scheduling stage; the second stage max–min problem is to find the scheduling plan considering worst-case probabilities, and then feeds back to the first stage to re-adjust the decision to adapt to the scenario, which is called the re-scheduling stage. The two-stage optimization iterates between phases until first-stage solutions achieve feasibility across all uncertainty set realizations. The parallelizable C&CG algorithm decomposes the proposed two-stage robust model into a master problem (MP) and a subproblem (SP) for iterative solution.
MP:
where L is the introduced auxiliary variable; is the result of the optimization of the worst-case probability distribution obtained from the subproblem.
SP:
where represents the optimal solution derived from the primary optimization, serving as a fixed parameter in the SP. The objective function has a bilinear term, which is a product of and , but the max and min problems are structurally separable because their respective decision variables are absent from each other’s constraint formulations. Given the scenario-wise independence of inner-layer decision variables, the subproblem’s inner optimization decomposes into K separable problems amenable to parallel solving. The formulation for scenario k is:
where represents the extremal objective value obtained from solving the scenario-specific subproblem for each realization k. By incorporating this into Equation (33), we derive both the adversarial probability distribution and the SP’s optimal objective value:
In the SP, the adversarial renewable generation distribution is identified to establish an upper bounding estimate, LBup, for the optimization model. The lower bound value LBlo is obtained from the master problem MP. Algorithm convergence occurs upon meeting the stopping criterion specified in Equation (33):
where is the convergence accuracy.
5.3.2. Solution of Subquestion 2
After solving subproblem 1, the optimal power of electricity trading between each MG and SES can be obtained at the same time, and then the bargaining power can be calculated. Substituting these values into the revenue-sharing problem can solve the electricity trading price between them. The ADMM is a computational framework for solving convex optimization problems with separability. It can achieve favorable solutions while preserving the privacy of all participating entities.
Utilizing the decomposability of the objective function, ADMM can be used to solve subproblem 2 with the following steps.
Equation (28) contains the coupling variable for the tariff, and since the expectations of both parties for the transaction need to remain equal, the following auxiliary variables are introduced to decouple the model:
Introduce the Lagrange multipliers and penalty factors , and construct the augmented Lagrange function for problem 2. The shared energy storage and microgrid membership-distributed optimization model can be expressed as follows:
- (1)
- Optimization model for SES distribution operation
- (2)
- Optimization model for MG distribution operation
The subproblem 2 algorithm solution process is as follows.
- Parameter initialization: Define the maximum iteration limit: k = 100, the starting count of iterations: k = 0, the convergence accuracy: , and the initial amount of power interactions between MG and SES: .
- For the SES, receive the desired interactive tariff from each microgrid subject , and obtain the desired interactive tariff .
- For each microgrid subject, receive the desired interactive tariff from the SES, and solve Equation (37) to obtain the desired interactive tariff.
- Update Lagrange multipliers following this mathematical representation:
- 5.
- Update the number of iterations according to the following equation:
- 6.
- Judge the convergence of the algorithm according to the following equation:
If Equation (39) is fulfilled, the iteration process will be halted. Alternatively, the procedure loops back to step 2, and the calculations are repeated until Equation (39) is fulfilled.
The solution flowchart of the entire model is shown in Figure 3.
Figure 3.
Flowchart for the model.
6. Case Study
6.1. Basic Parameters
Based on the relevant parameters from reference [53], this paper constructs a case connecting three MGs with SES. Using two-year PV and WT generation records from North China, we allocate 80% for training and 20% for testing, with = 0.5 and = 0.8. The load–power curves of each microgrid are shown in Figure A1 of Appendix A; the parameters of SES are listed in Table A1 of Appendix A; and the capacity and operating parameters of the equipment in the microgrid are shown in Table A2 of Appendix A. The WGAN-GP-based operational scenario prediction method was implemented using Pytorch and accelerated through CUDA parallel computing by invoking the GPU. The experimental hardware configuration comprised an Intel Core i5-12400F CPU (2.50 GHz) and an NVIDIA GeForce RTX 4060 GPU. The proposed MMG-SES model approach is validated using the commercial solver GUROBI within the MATLAB 2021A environment, integrated with the YALMIP toolkit. A two-year dataset of daily power forecasts and actual power data for PV and WT in a North China region serves as the sample set, with a 1 h data interval. Of this dataset, 80% is allocated for model training and 20% for testing.
6.2. Scenario Generation and Validity Verification Based on WGAN-GP
6.2.1. Scenario Generation Based on WGAN-GP
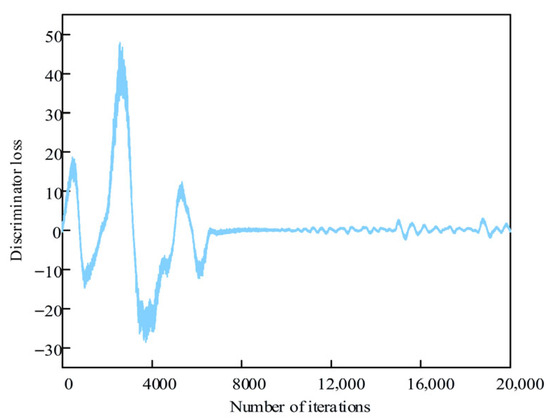
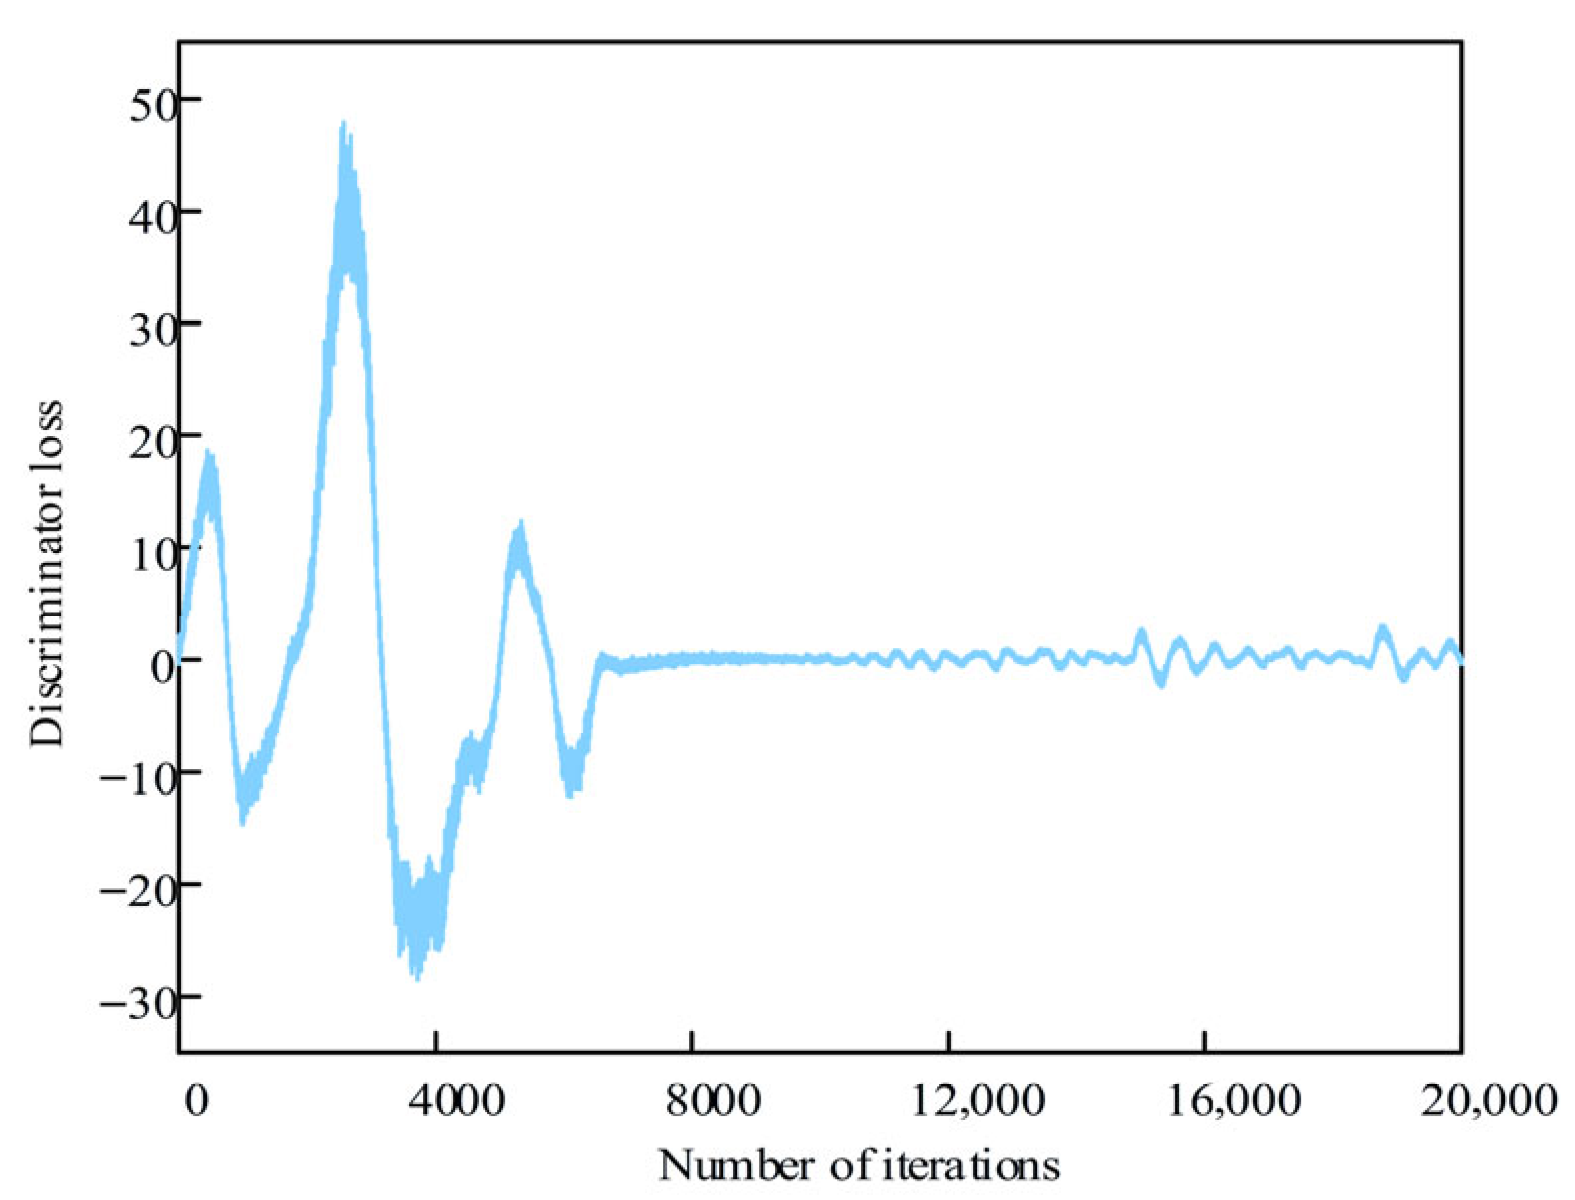
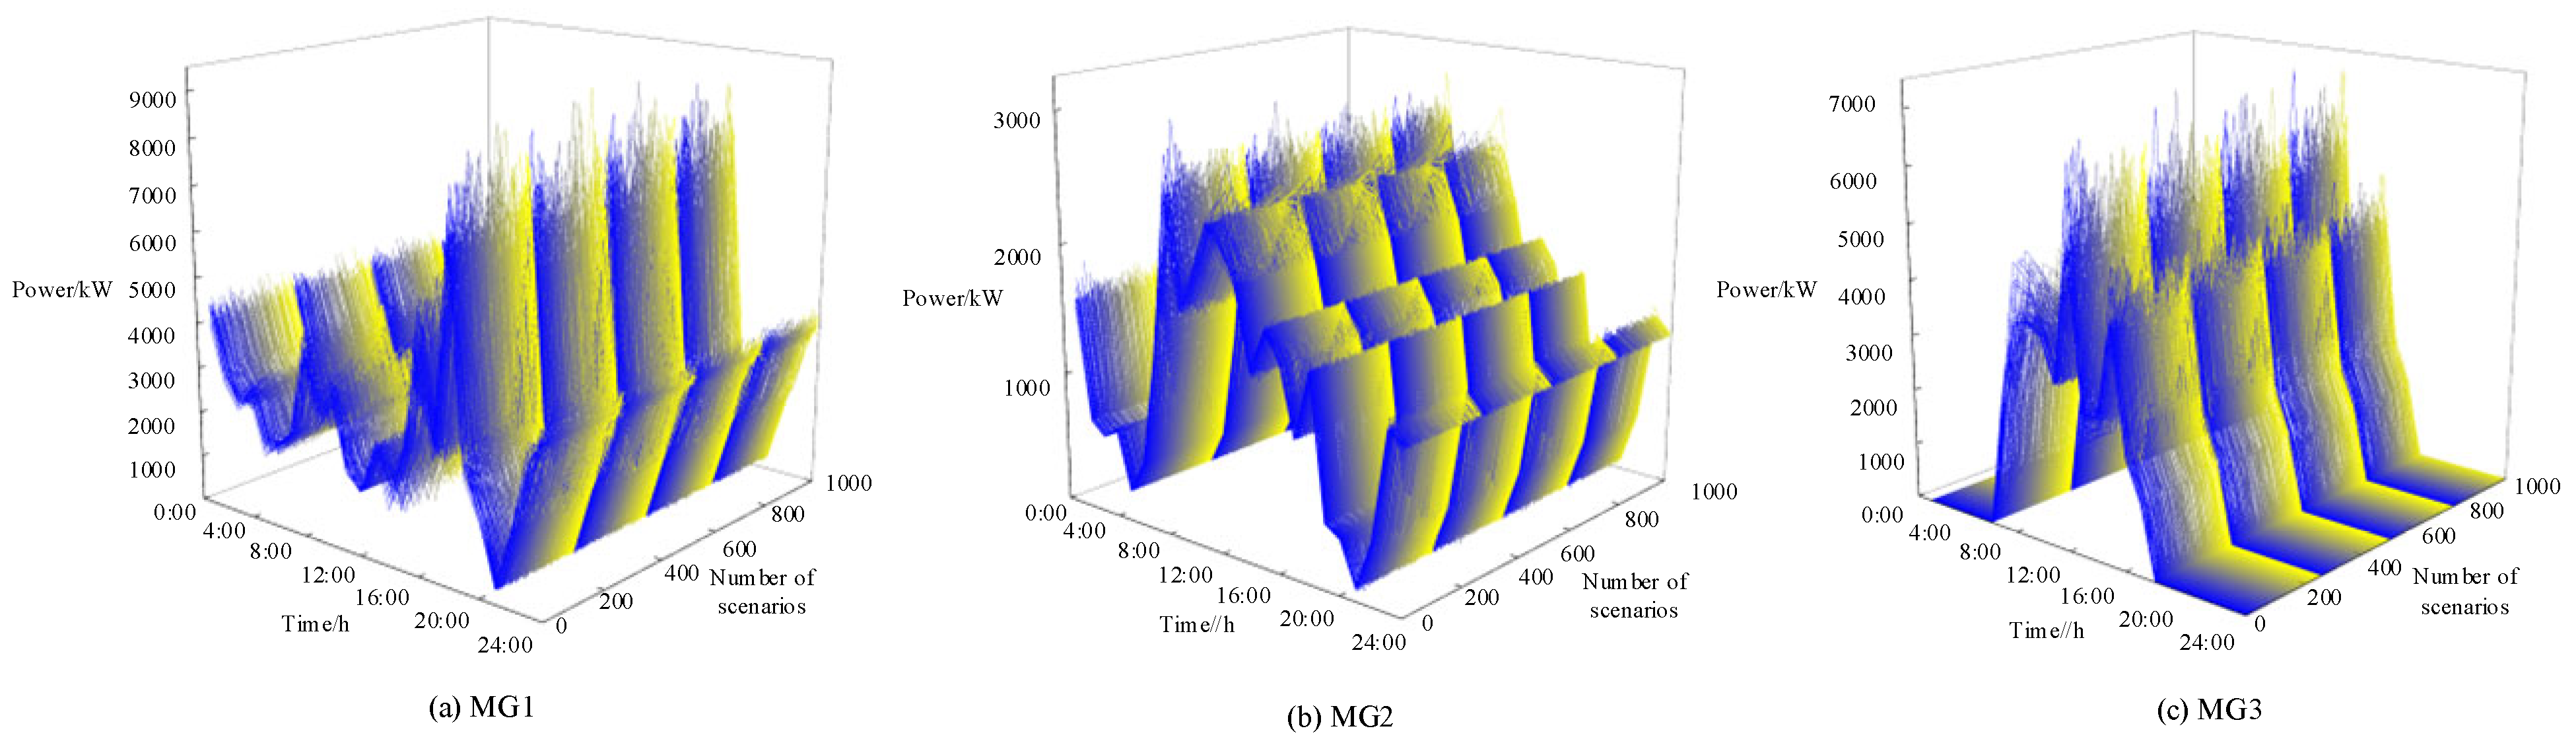
According to reference [47], the hyperparameters for WGAN-GP were set as shown in Table 2. The trend of the discriminator loss function of the WGAN-GP network is shown in Figure 4. At the beginning of training, the distribution of random noise and real samples is different, but at this time, the discriminator has almost no discriminative ability, so the loss function value of the discrimination is close to 0; as training proceeds, the discriminative ability is gradually enhanced, and at this time, the discriminator effectively differentiates between empirical data and the model-generated data, while the magnitude of the oscillation of the loss function value increases, and it reaches its maximum when the training iteration reaches 3000. Thereafter, the discriminator gradually cannot distinguish between empirical and the model-generated data, and the loss function value oscillation amplitude also begins to gradually decrease; after the 8000th iteration, the loss function value is close to 0, and the training of the WGAN-GP model gradually reaches convergence, and at this time, the new energy outflow scenarios can be generated by the WGAN-GP as in Figure 5.
Table 2.
Hyperparameters of WGAN-GP.
Figure 4.
The trend of the discriminator loss function of the WGAN-GP network.
Figure 5.
Scenario generation for each microgrid.
6.2.2. Validation of Effectiveness
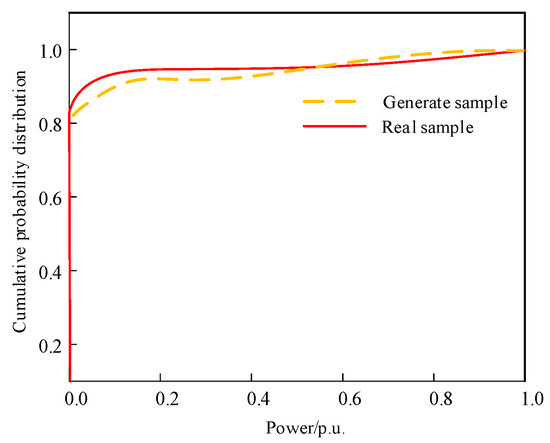
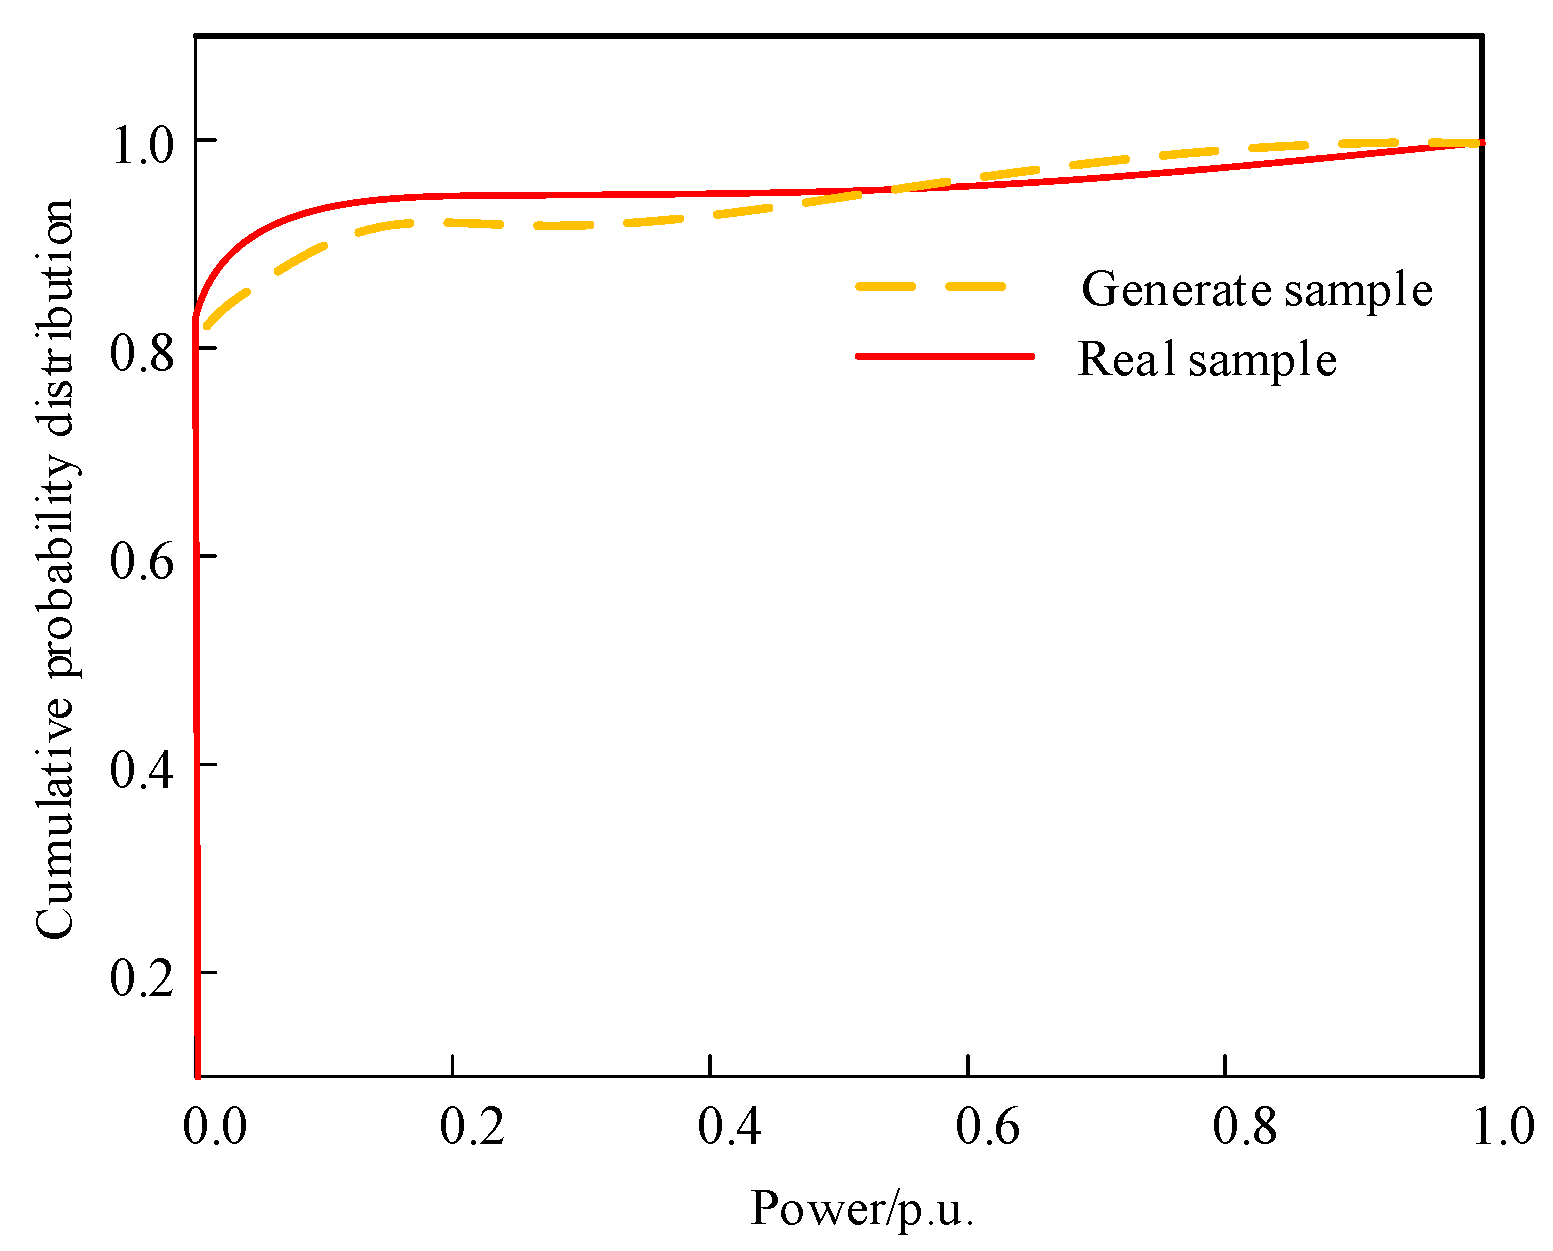
To better demonstrate the efficacy of the produced scenarios, some of the datasets generated by WGAN-GP are selected as examples of MG 1 to compare with the LHS and MC generation methods. The model-generated data and actual data were statistically evaluated using the following metrics: the kurtosis difference, skewness difference, Kolmogorov–Smirnov (KS) statistic, and Wasserstein distance. Table 3 presents the results. Additionally, to verify the distribution characteristics, Figure 6 displays the empirical cumulative probability distribution of the generated sample and actual sample. In terms of statistical distribution characteristics, the proposed method exhibits a kurtosis difference of 0.42 and a skewness difference of 0.13, which are significantly lower than those of the comparative methods. This indicates its superior capability in accurately capturing the asymmetry and tail characteristics of renewable power output data. The KS statistic is 0.075, lower than the 0.088 of traditional LHS and 0.092 of the MC method, further quantitatively validating the outstanding performance of the proposed method in overall probability distribution fitting. Additionally, the proposed method demonstrates excellent performance in distribution similarity for generated scenarios, achieving a Wasserstein distance of only 0.13 from the real scenarios, which is significantly lower than the 0.37 of LHS and 0.48 of the MC method. This highlights its clear advantage in accurately capturing the geometric structure of the data distribution.
Table 3.
Generate evaluation indicators for scenarios under different methods.
Figure 6.
Empirical cumulative probability distributions for generated and historical data.
Table 3 and Figure 6 reveal that WGAN-GP generates a cumulative distribution function that closely approximates the distribution of real samples by learning from historical data on new energy output. Through implicit learning, the approach captures renewable output distributions, generating data closer to actual wind/solar profiles. This confirms that the proposed method effectively captures the desired probability distribution.
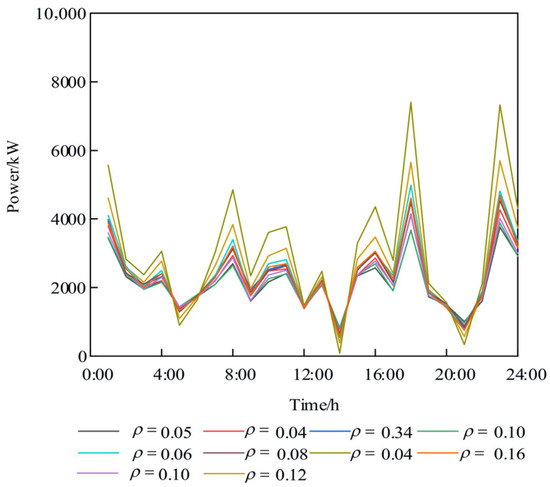
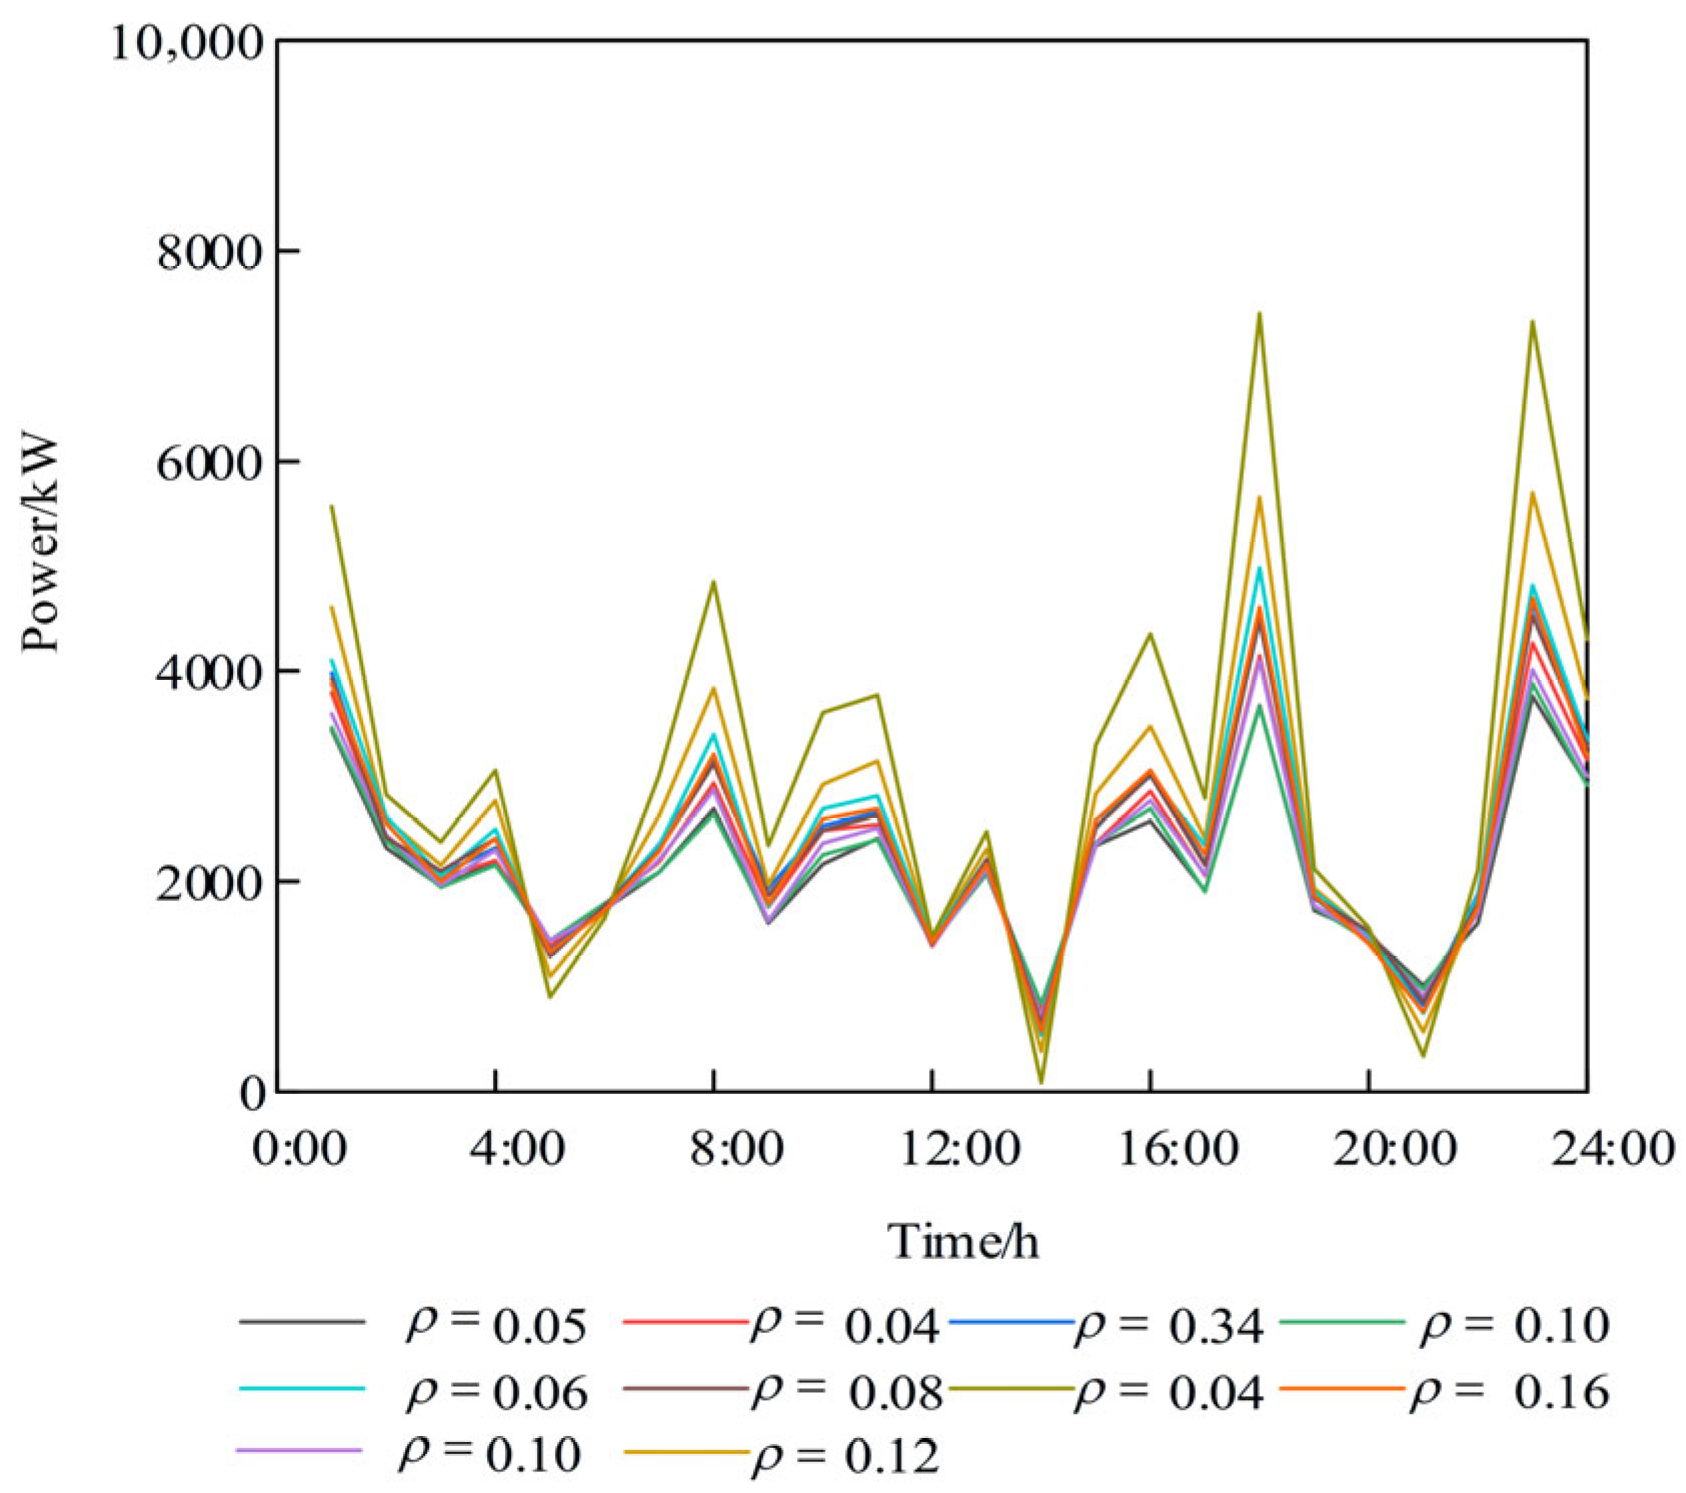
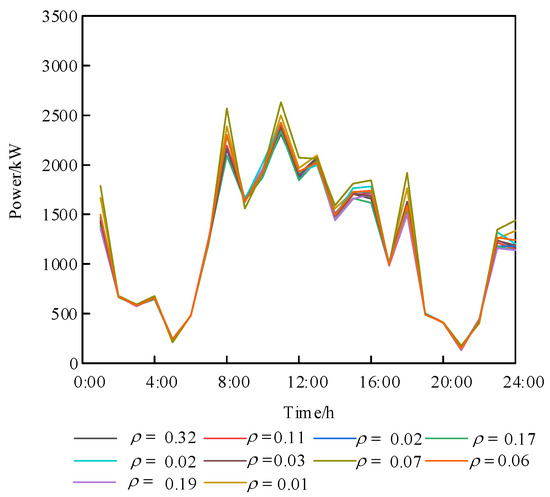
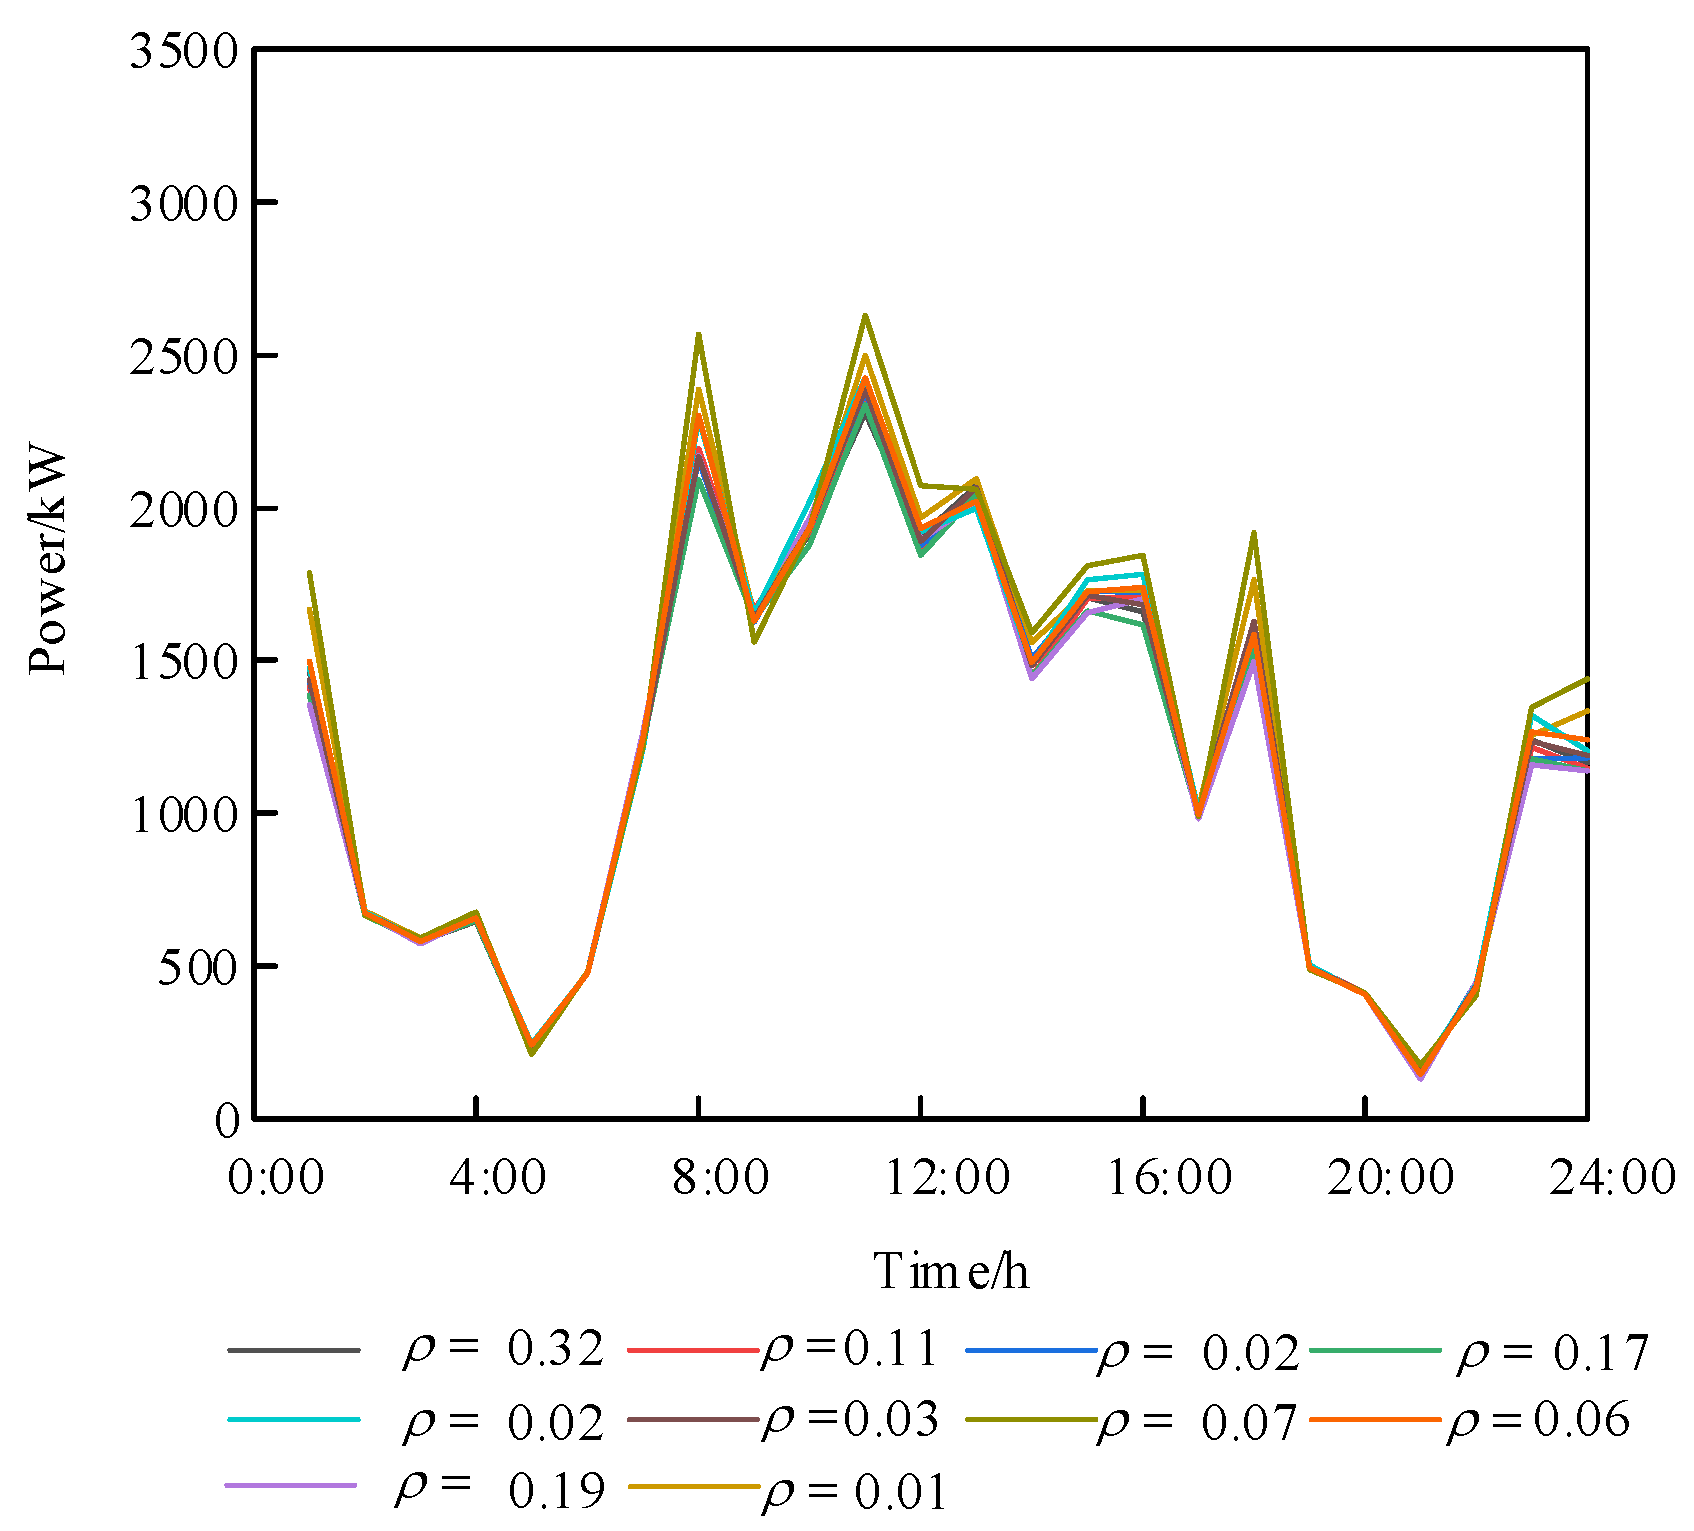
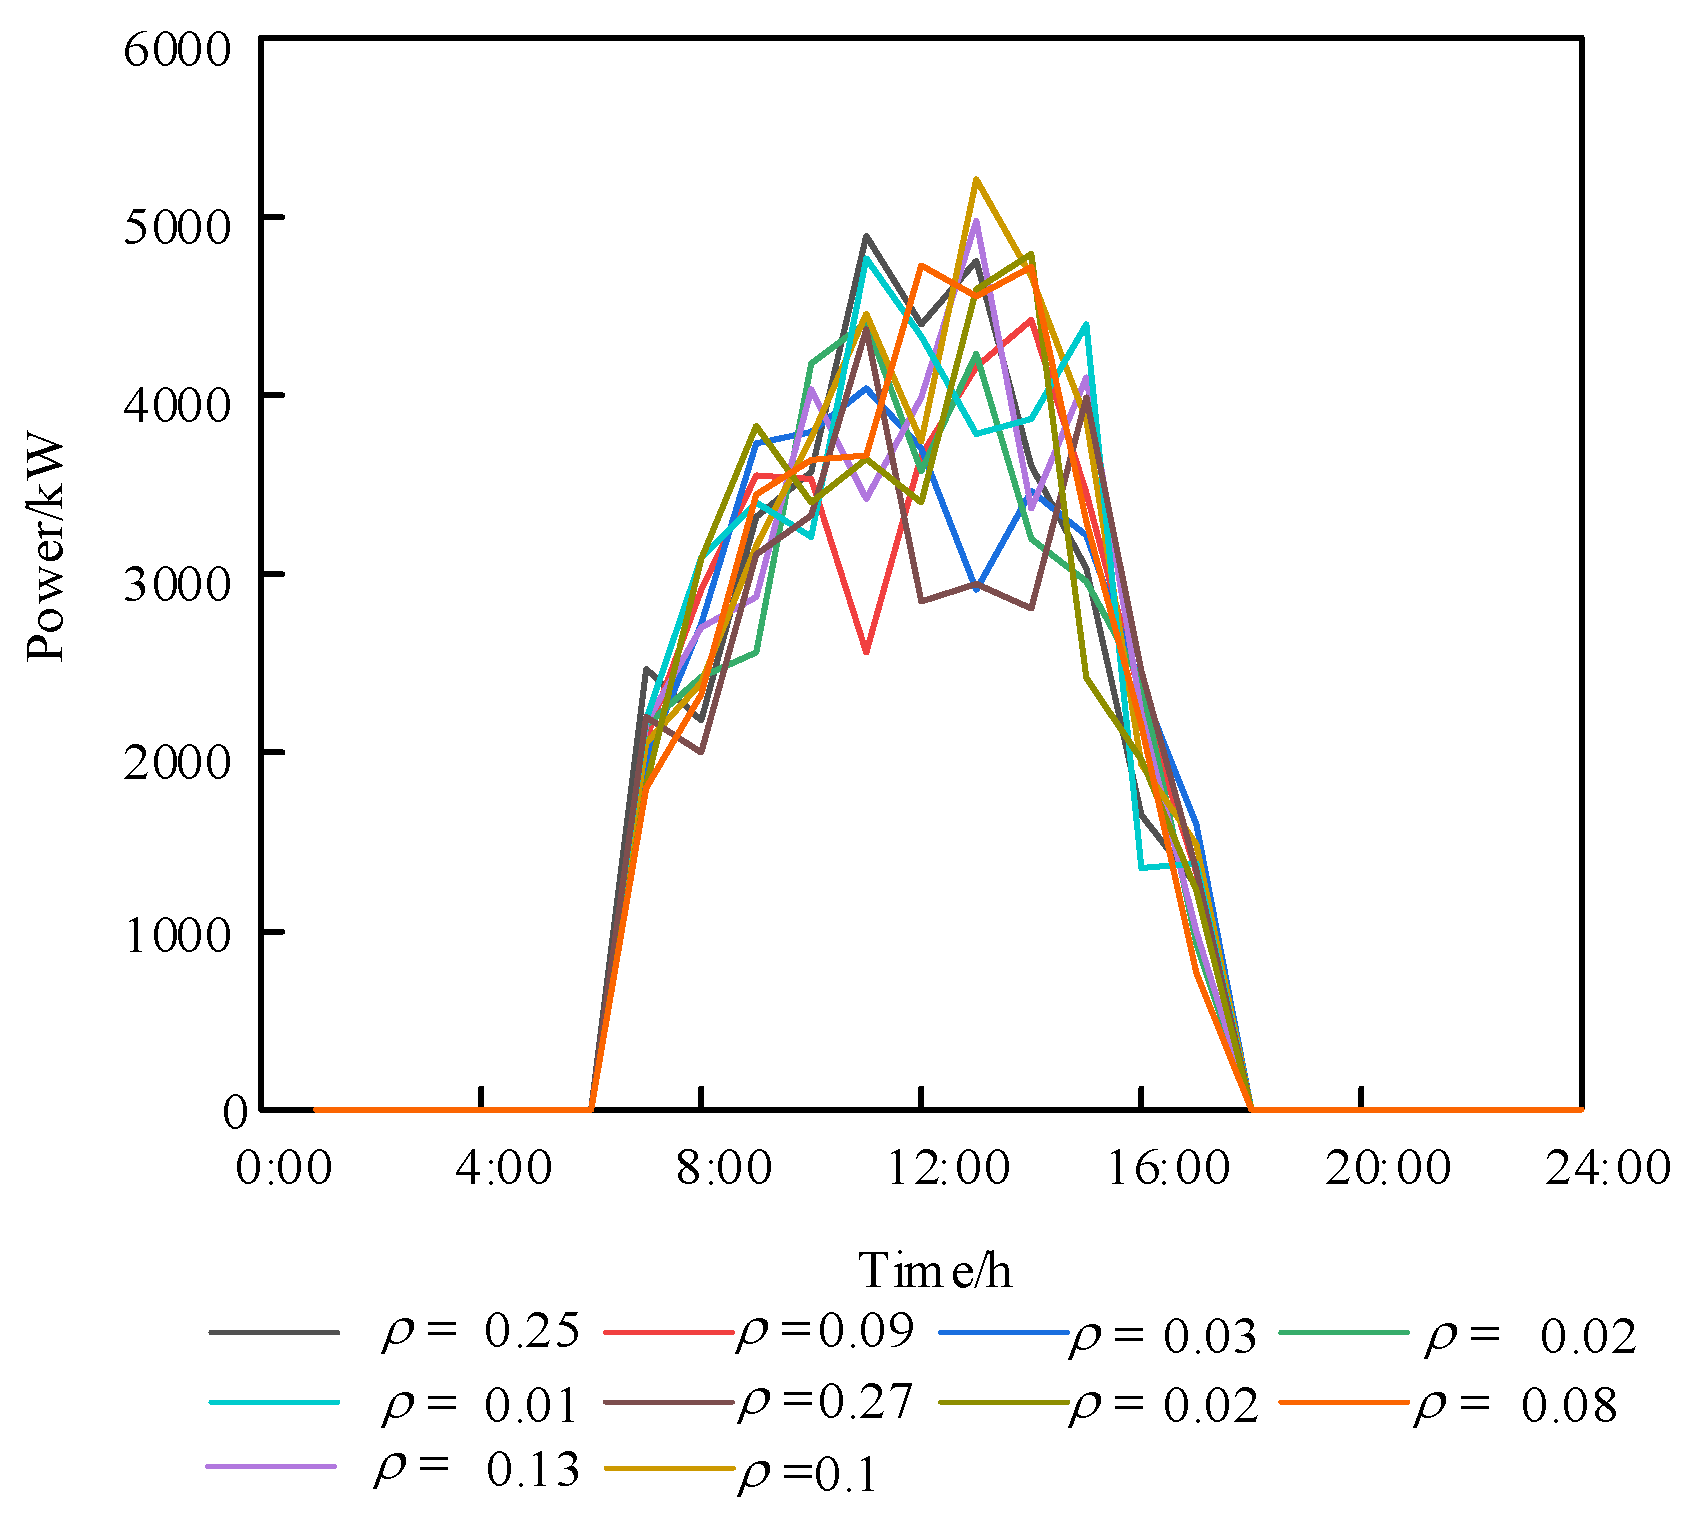
Figure 7, Figure 8 and Figure 9 present representative renewable energy output scenarios and their associated probabilities, derived from clustering WGAN-GP-generated samples via K-means++. This provides accurate basic data for solving the problem of optimizing the operation strategy of MMG.
Figure 7.
Scenario clustering results for MG 1.
Figure 8.
Scenario clustering results for MG 2.
Figure 9.
Scenario clustering results for MG 3.
6.3. Simulation Results Analysis
6.3.1. Analysis of Electricity Transactions Between Various Entities
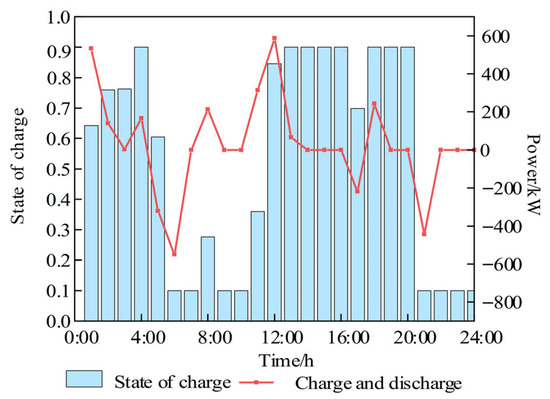
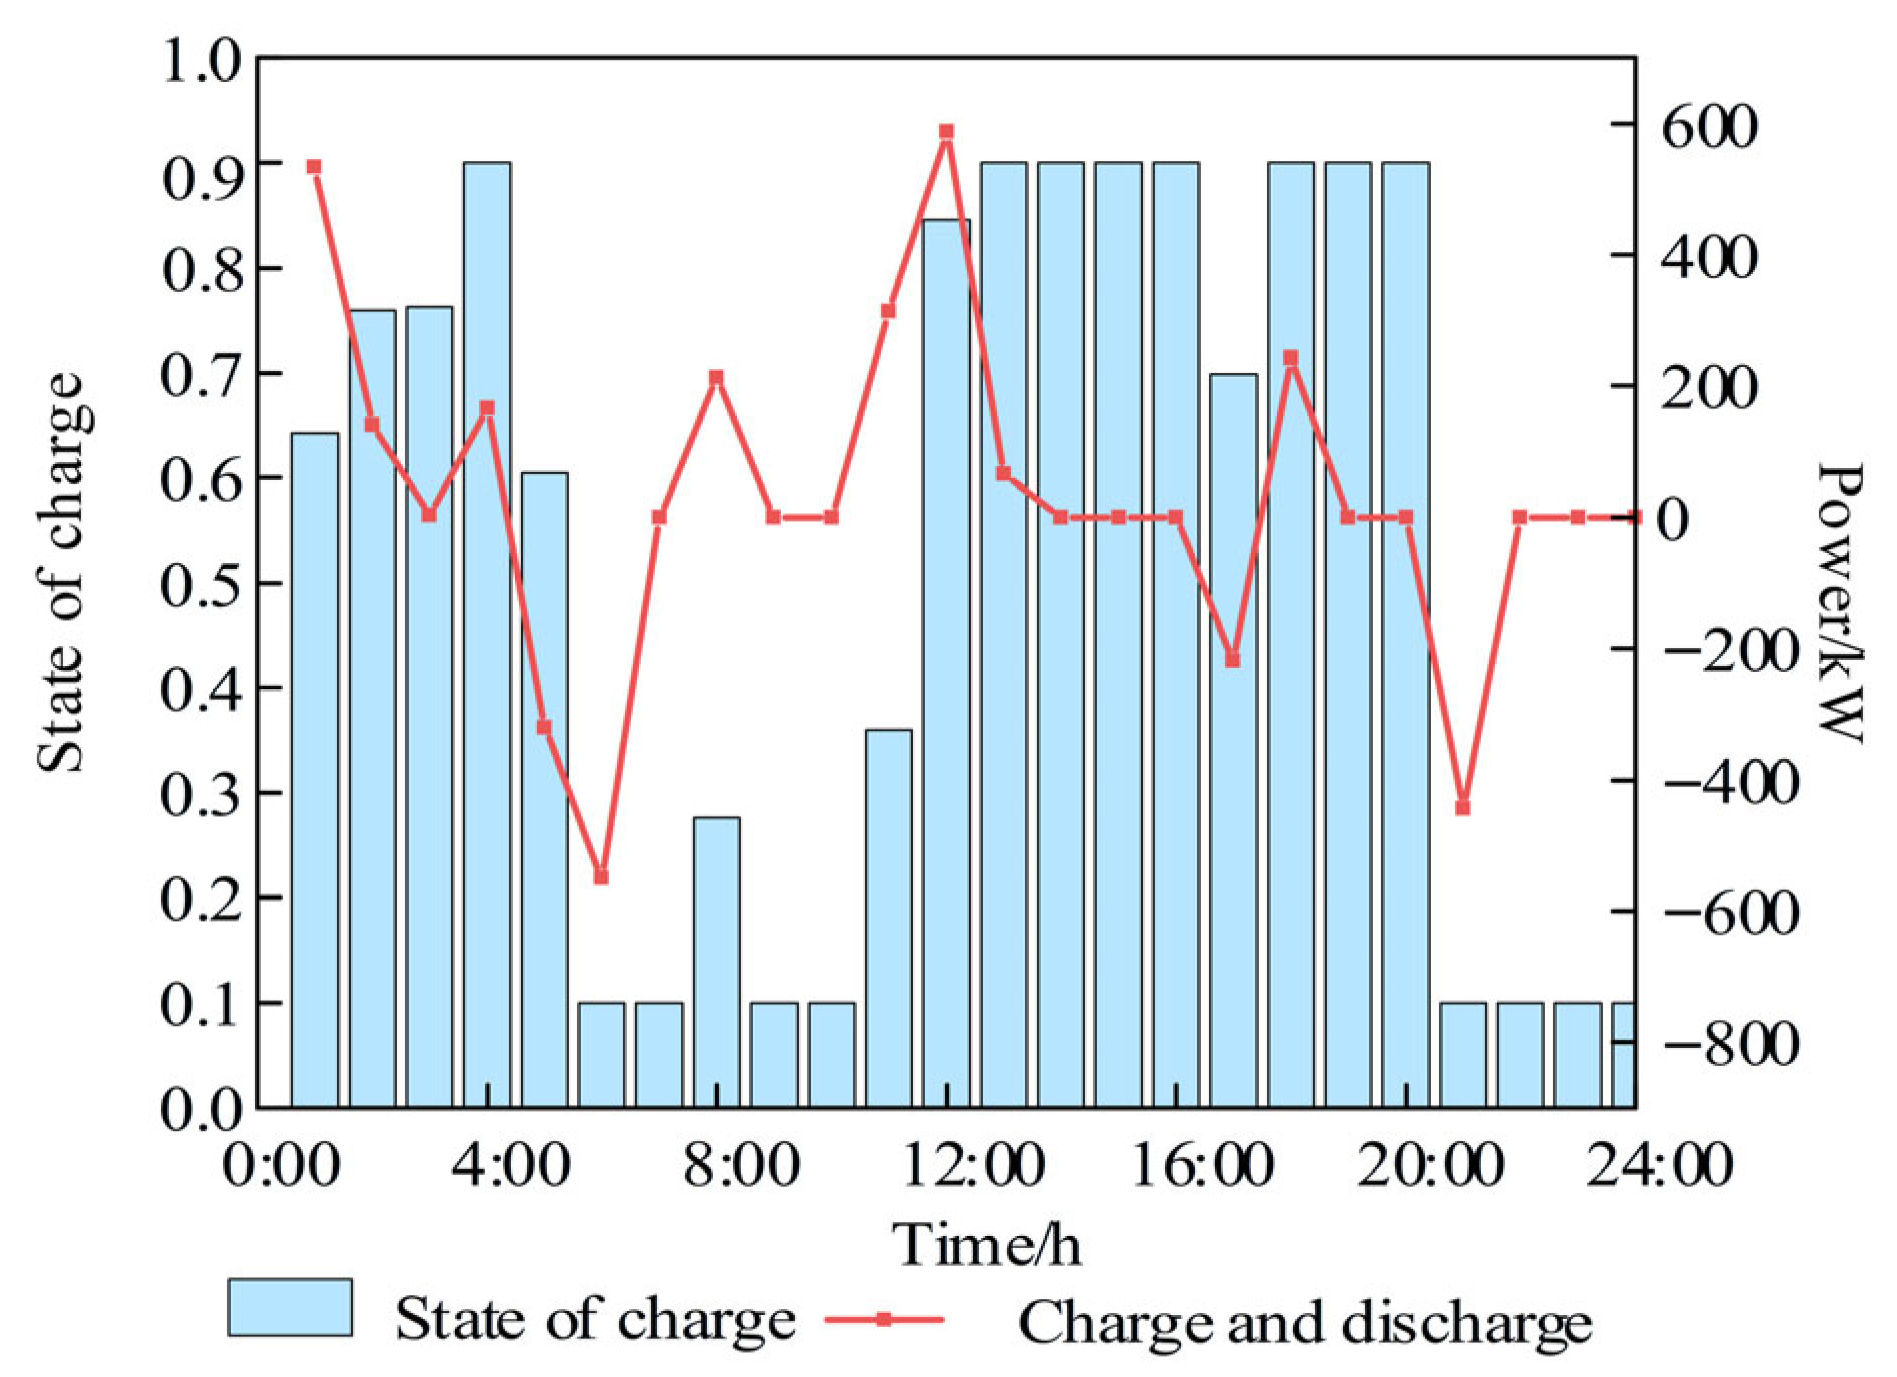
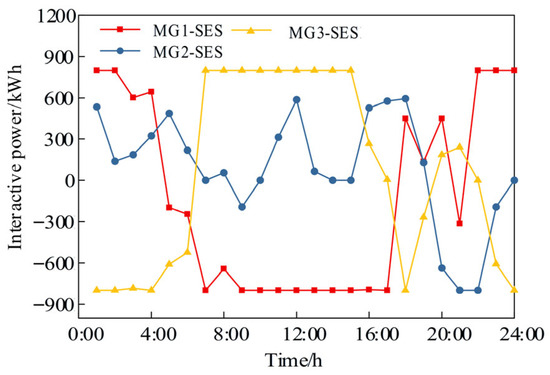
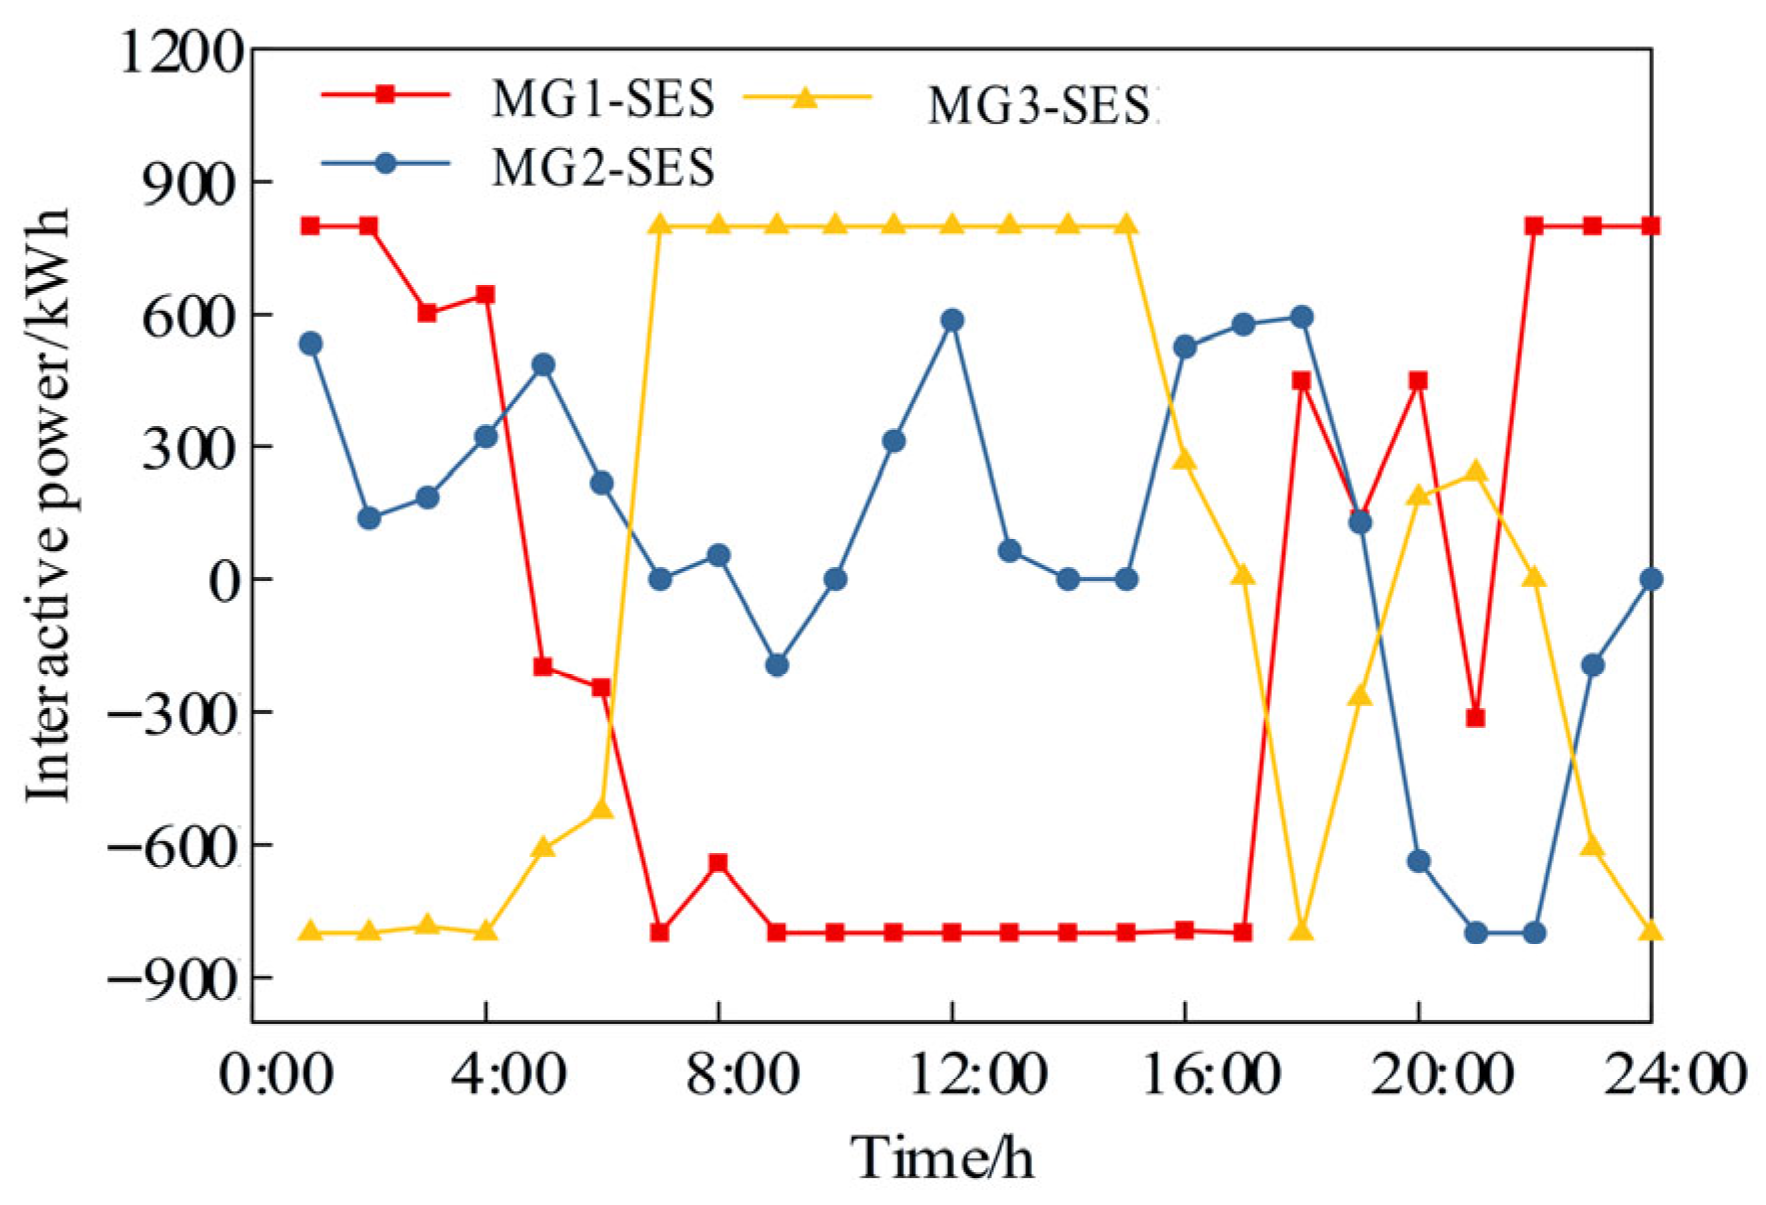
By solving subproblem 1, the SES state of charge curve and net charge–discharge power are shown in Figure 10, where charging power is represented by positive values and discharging corresponds to negative values. The net interaction power between the SES and MG is illustrated in Figure 11, where positive values represent power sold by the MG to the SES and negative values represent power purchased from the SES.
Figure 10.
State of charge curve, net charge, and discharge power.
Figure 11.
Electrical energy interaction between SES and microgrids.
As shown in Figure 11 and Appendix A Figure A1a, MG1 has sufficient wind power generation. During the two time periods 0:00–4:00 and 18:00–23:00, the power load is relatively small, resulting in an excess of electricity supply over demand. At this time, MG1 sells electricity to SES to absorb the excess renewable energy. SES can then provide power support to the power-deficient MG3 during these time periods. During 5:00–17:00, the electrical load power within MG1 increases, and renewable generation falls short of demand. Therefore, to meet its energy needs, MG1 not only boosts CHP generation and imports power from the main grid but also procures electricity from the SES.
Similarly, as shown in Figure 11 and Appendix A Figure A1b, during the 0:00–19:00 time period, MG2’s power consumption remained below 3000 kW, with renewable energy output exceeding its own power consumption needs. MG2 sold excess electricity to SES to absorb the surplus. During the 20:00–23:00 time period, power load demand surges, and internal renewable energy generation cannot meet its needs. The MG addresses its energy requirements by boosting grid purchases while simultaneously buying power from the SES.
As shown in Figure 11 and Appendix A Figure A1c, at 7:00, MG3 has sufficient photovoltaic power generation and a relatively low power load. MG3 consumes excess energy by selling electricity to SES while meeting its own load requirements. During other time periods, MG3 cannot meet its energy demand with its own CHP generation alone. To satisfy its energy needs, MG3 sources electricity from both the external grid and the SES.
In summary, by sharing electricity with SES, MMG can flexibly adjust its power supply, make full use of local renewable energy, avoid energy waste, and promote supply–demand balance across microgrids.
6.3.2. Analysis of Microgrid Energy Optimization Results
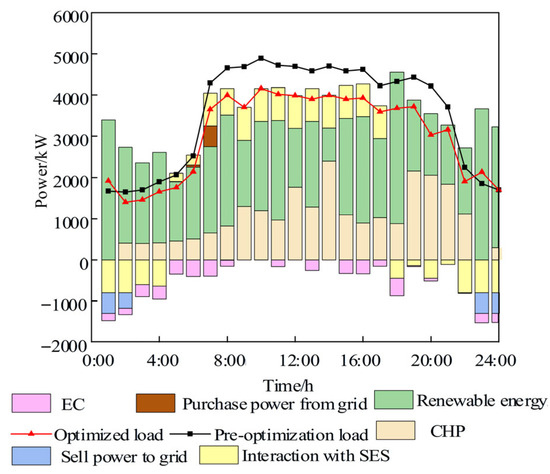
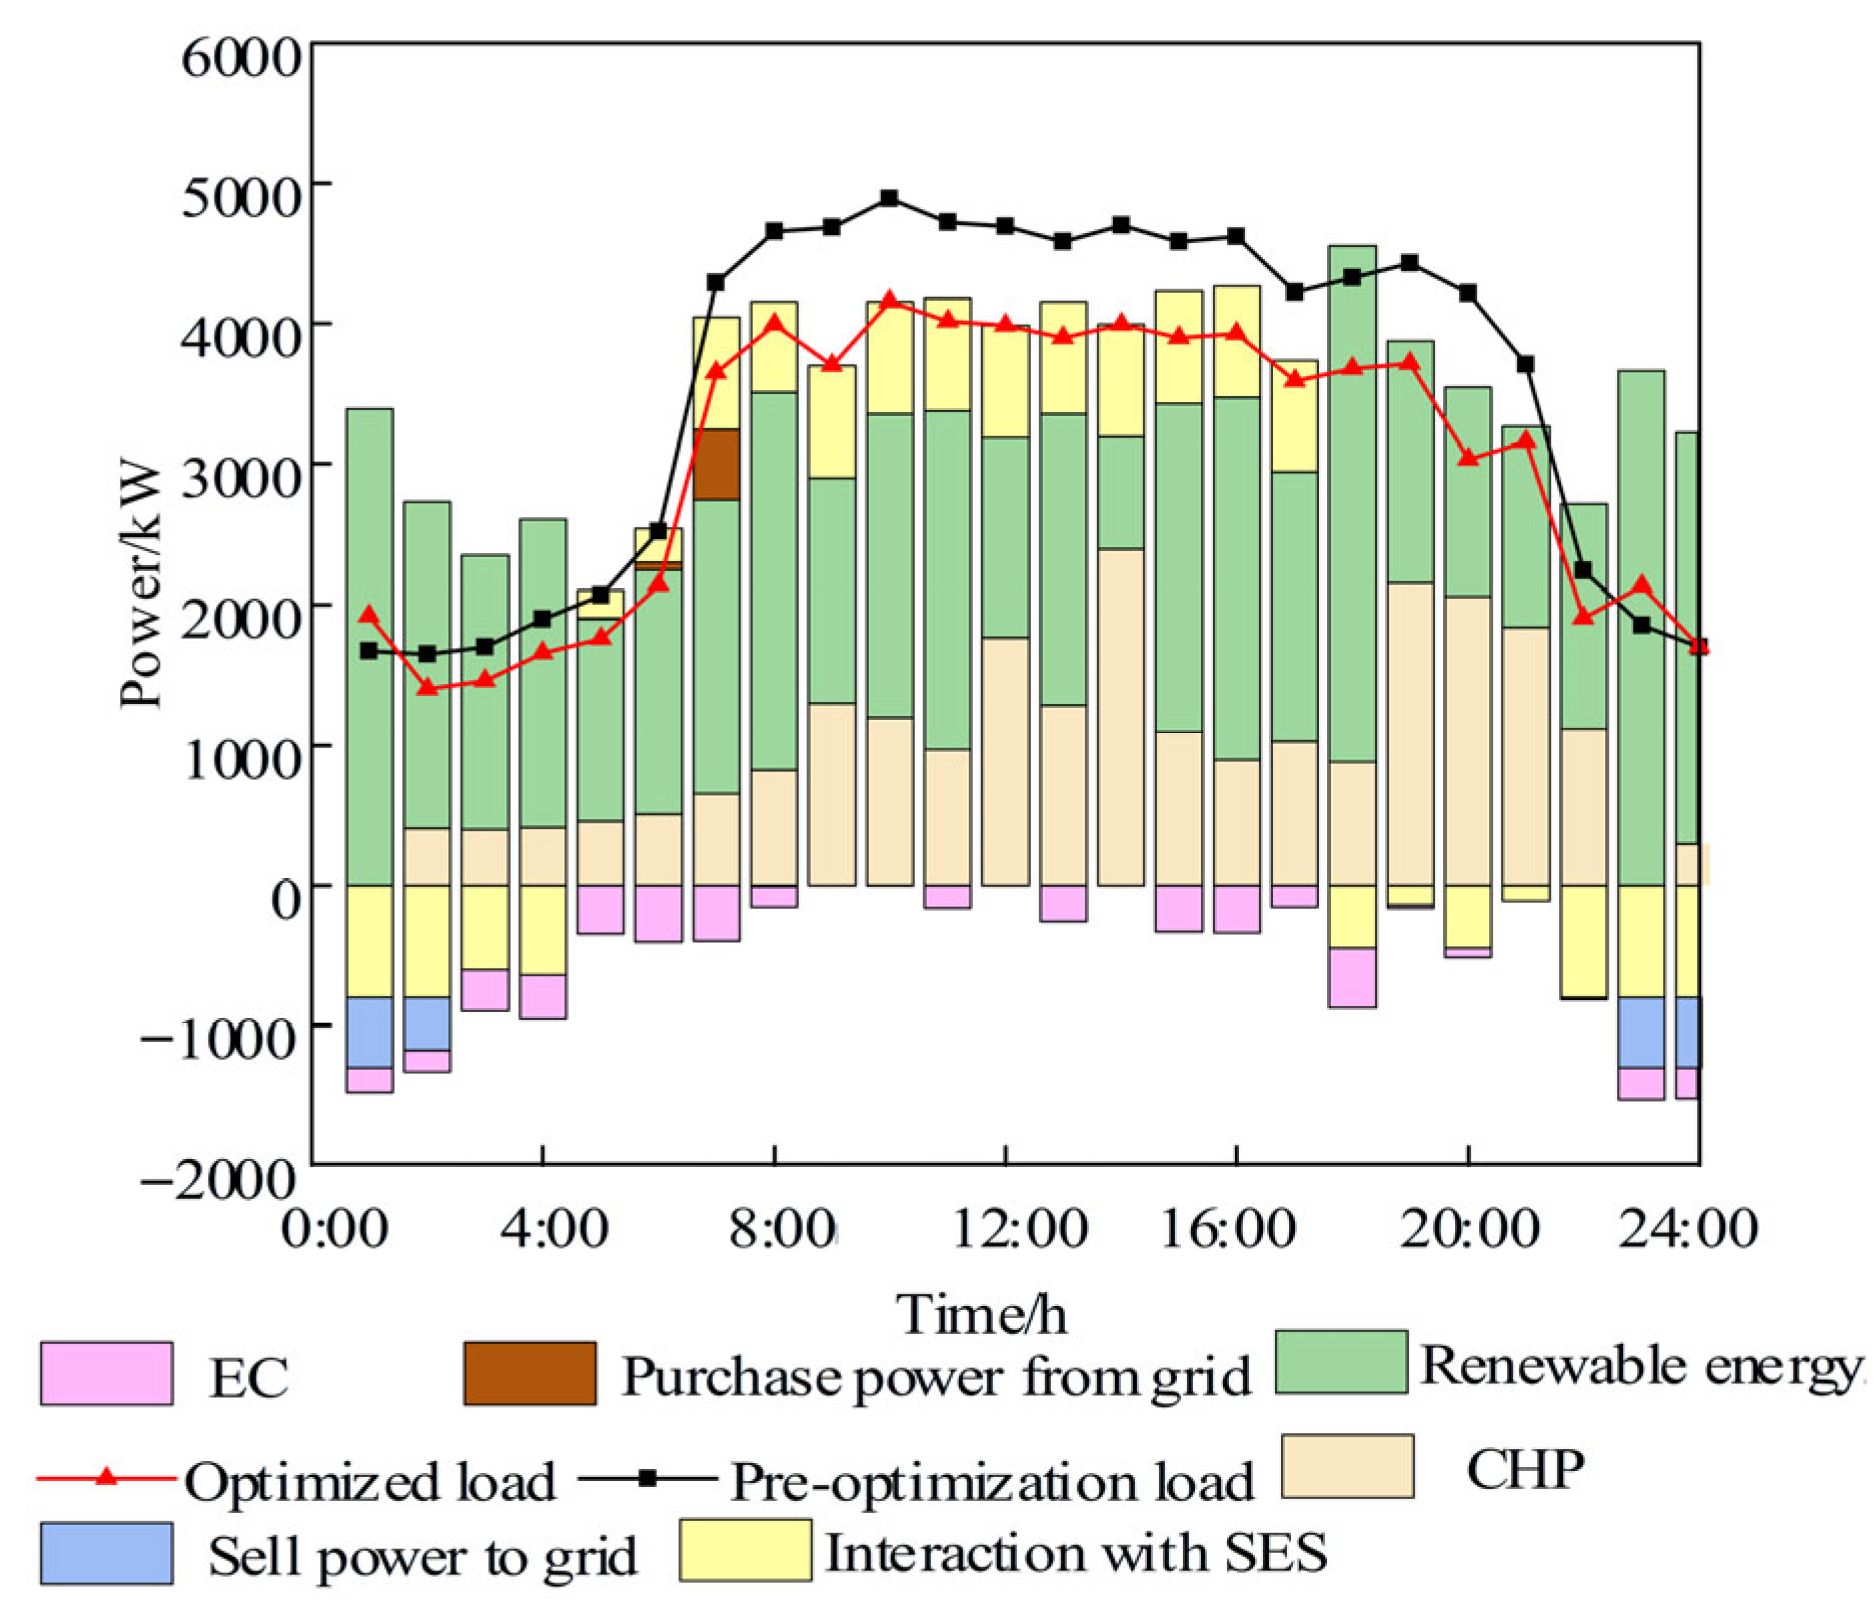
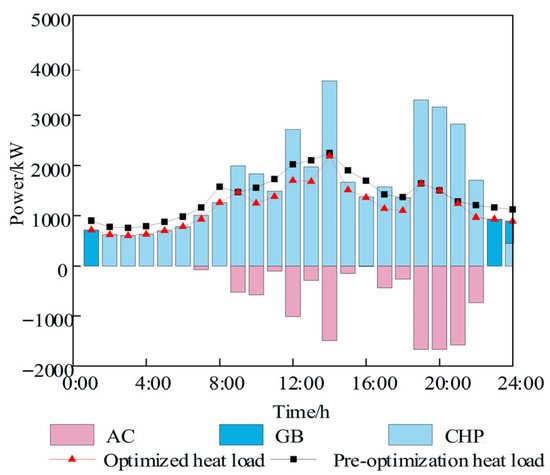
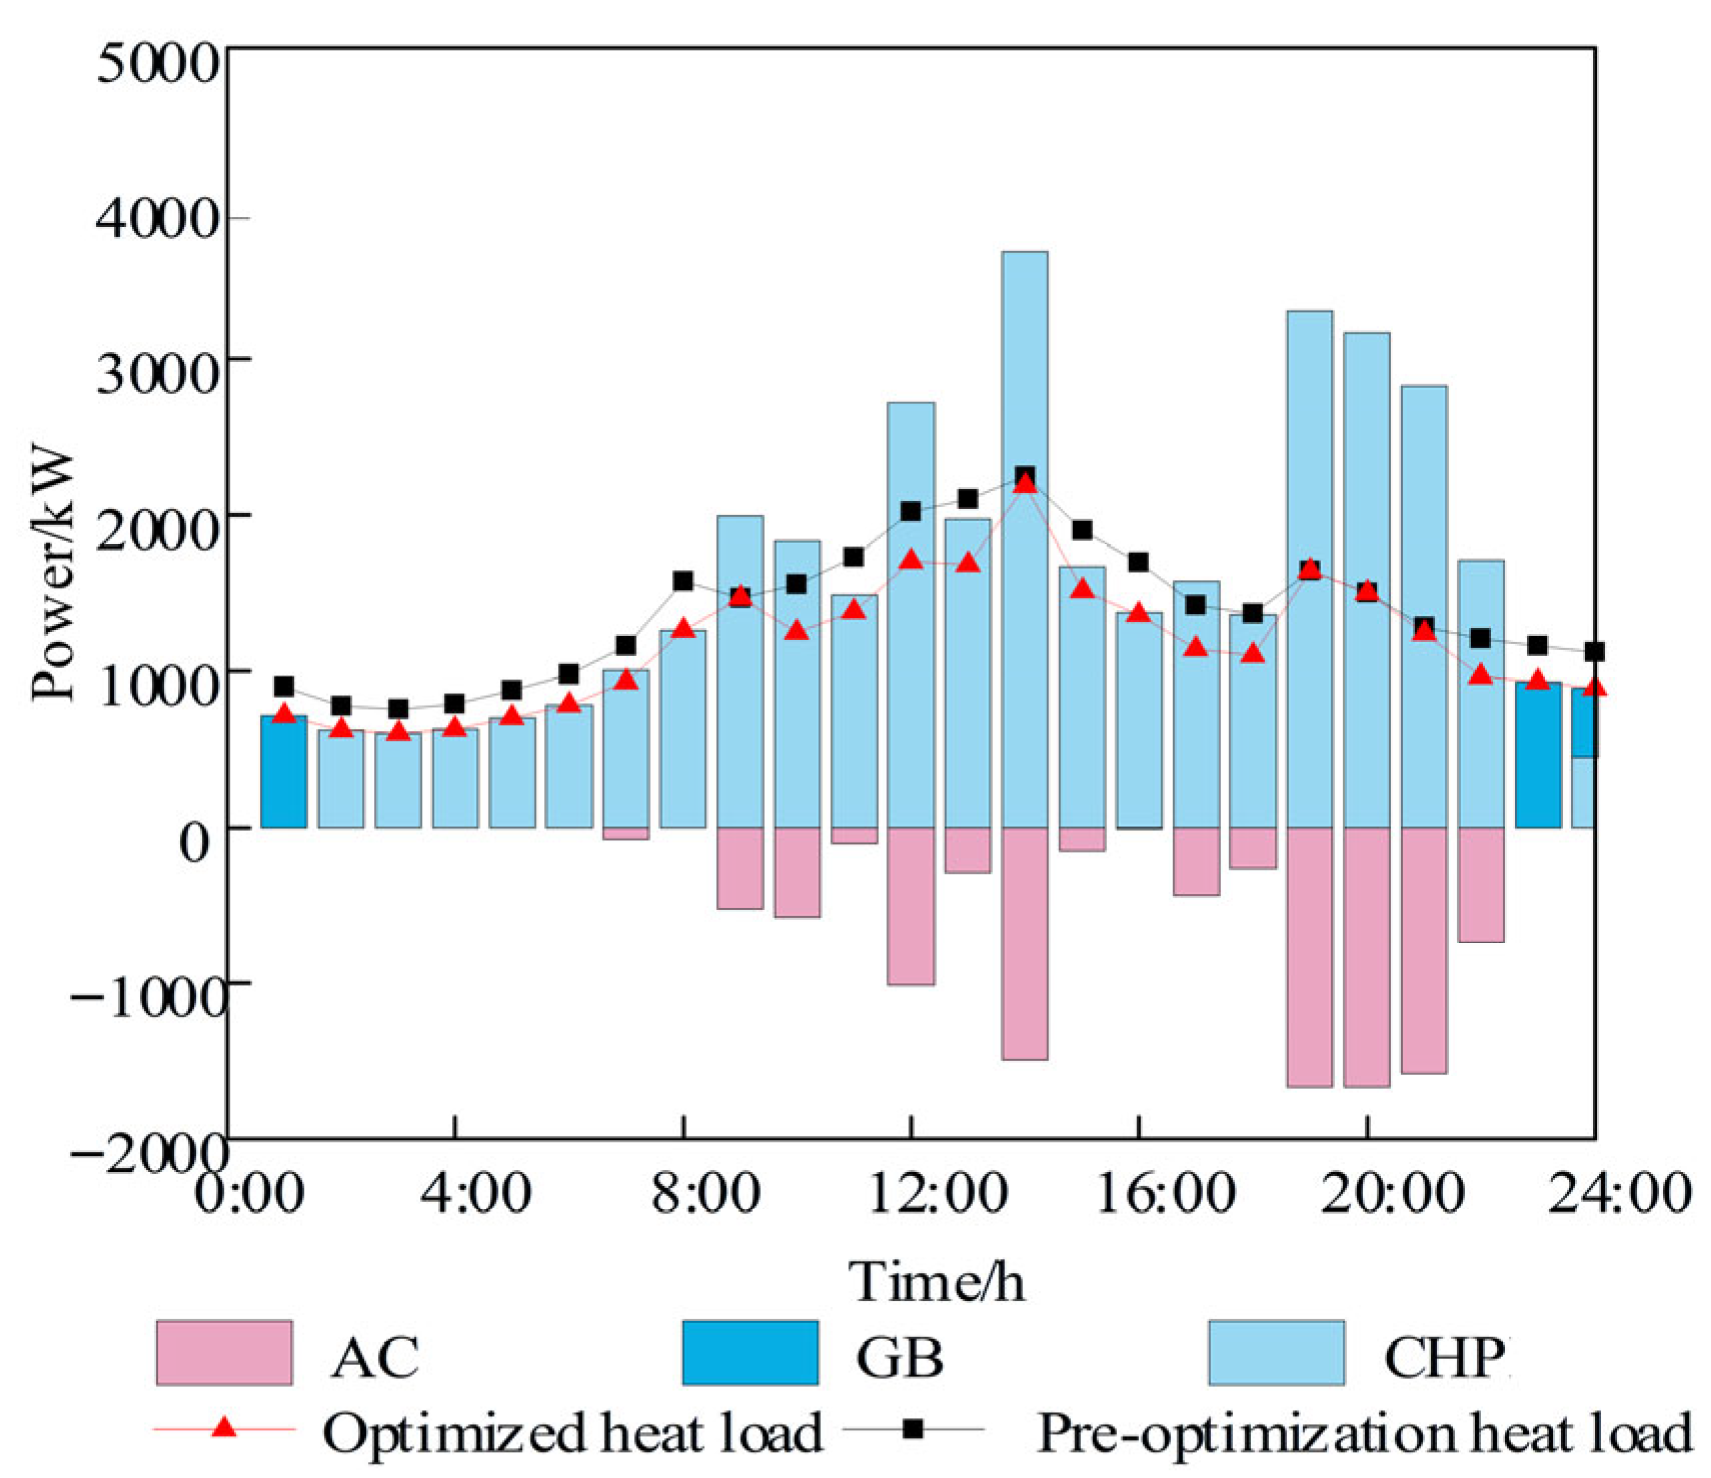
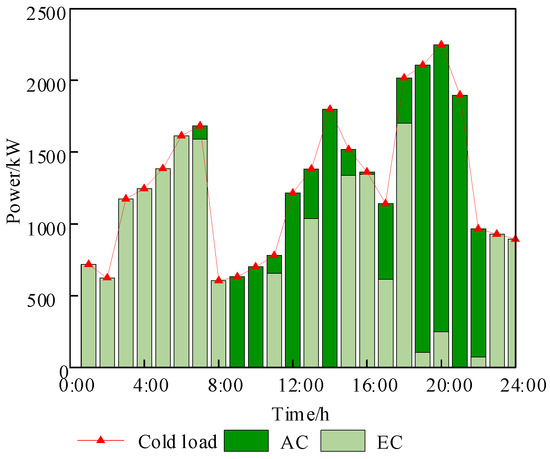
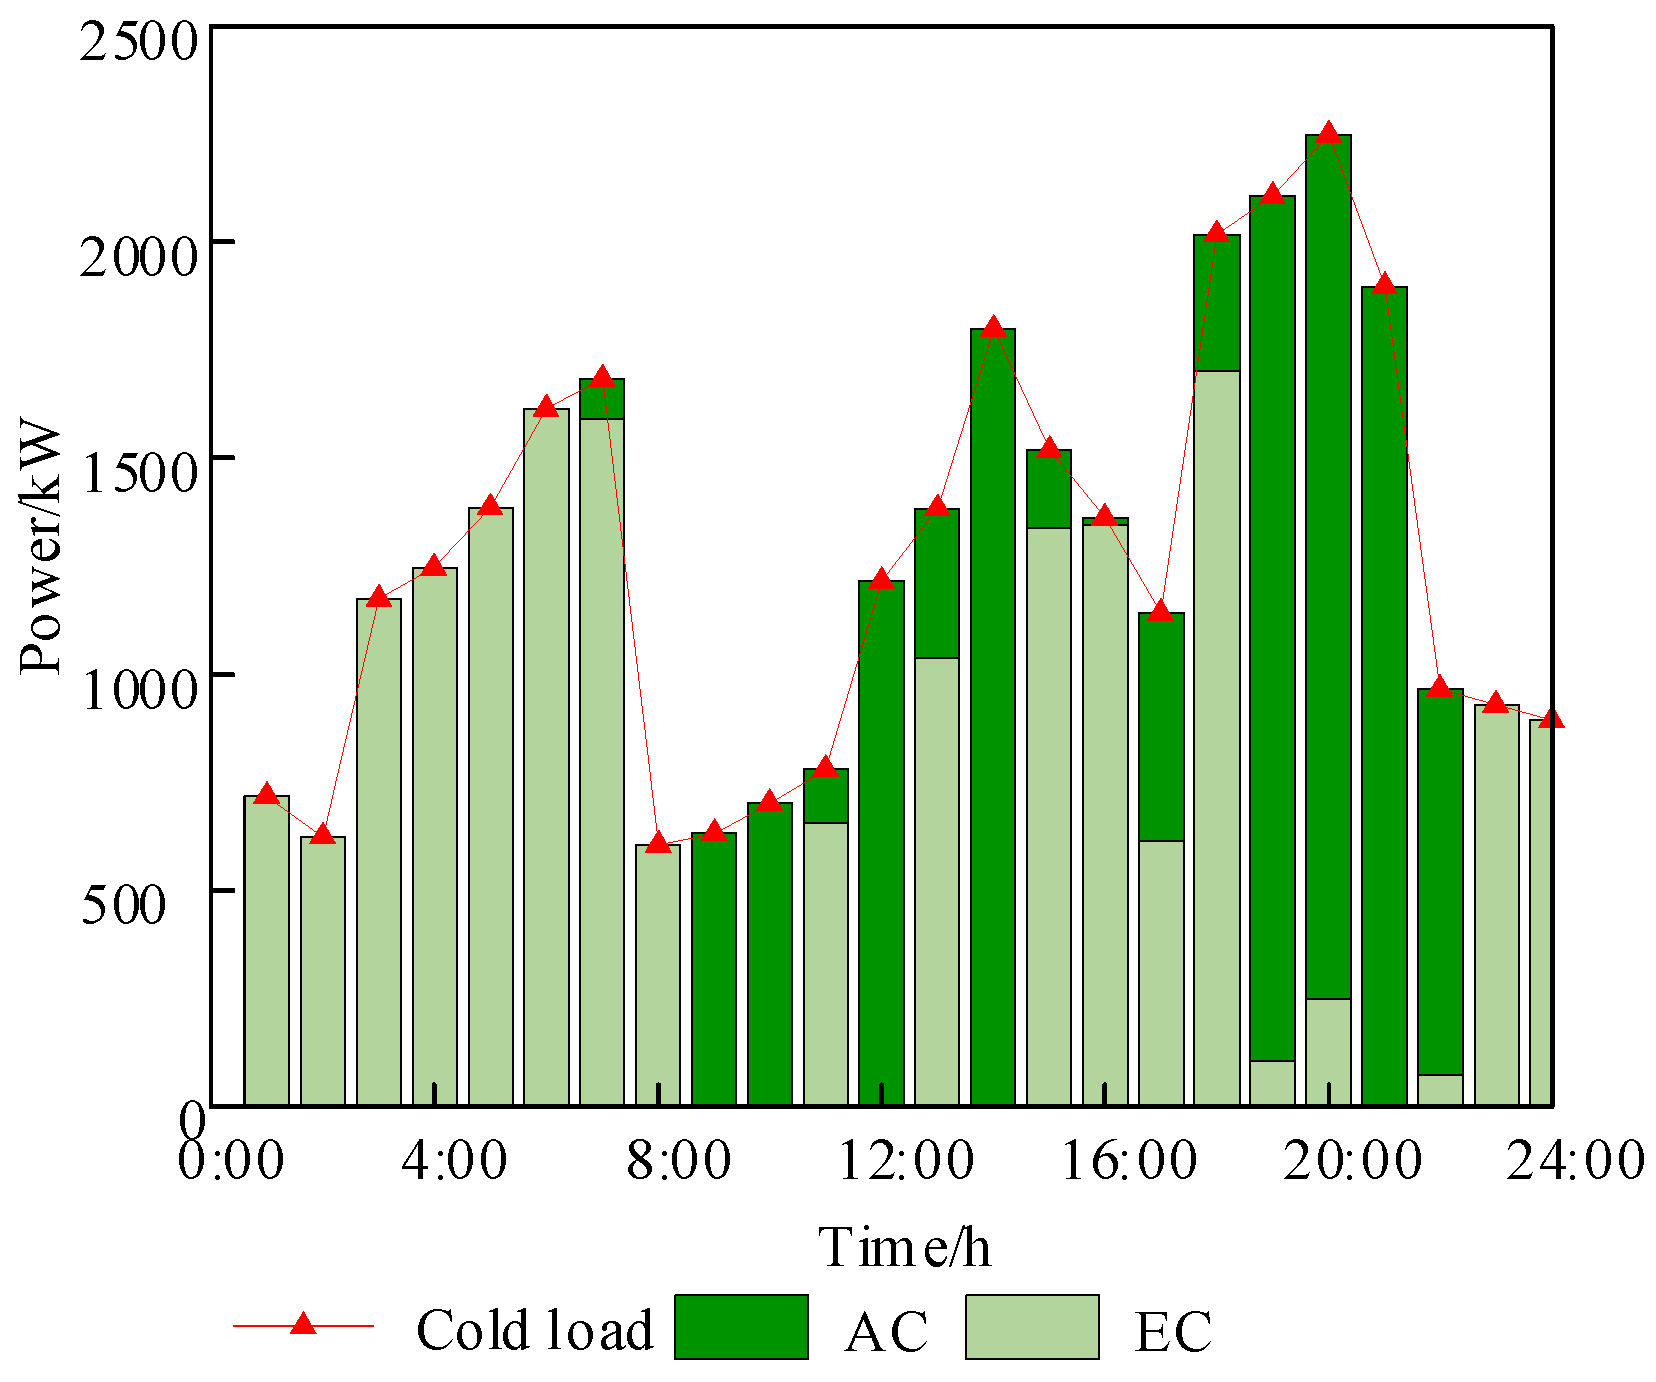
This section selects the optimization results of MG1 for analysis. Figure 12, Figure 13 and Figure 14 show the electrical, heat, and cold power optimization results of MG1.
Figure 12.
MG1 power optimization results.
Figure 13.
MG1 heat energy optimization results.
Figure 14.
MG1 cold energy optimization results.
As shown in Figure 12, MG 1 has abundant wind power generation. During the two periods from 0:00 to 4:00 and 20:00 to 23:00, when local electricity demand is at its lowest, surplus wind generation is exported to both the SES and external grid while being consumed by the EC. During the 5:00–19:00 period, which is a peak electricity demand period, after absorbing all wind power output, measures such as increasing CHP unit output, discharging the SES system, buying electricity from the main grid, and implementing demand response are employed to meet electricity load requirements, thereby reducing the total energy consumption costs of the park.
In terms of heat power optimization, the results are shown in Figure 13. During the two periods of 0:00–8:00 and 22:00–23:00, the heat load is at its lowest, and MG 1 maintains heat balance through CHP output, heat demand response, and other means. During the 9:00–21:00 time slot, heat load demand slightly increased. Due to the CHP’s “electricity-driven heat” characteristic, this results in higher CHP heat output during this period. At this time, excess heat is absorbed by increasing the heat consumption of AC units, while heat load response and other measures are employed to maintain heat balance. The analysis for cold power follows the same principles.
6.3.3. Transaction Prices and Benefit Analysis for Each Entity
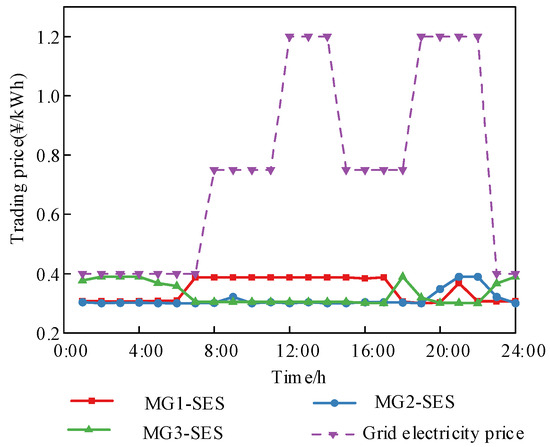
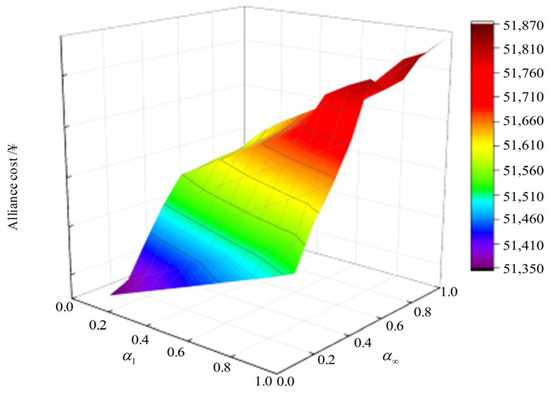
The optimal electricity trading prices between each MG and SES are shown in Figure 15. From the results presented in Figure 15, the optimal trading prices for each MG and SES in each time period are lower than the electricity sales prices of the external grid. Driven by electricity prices, MGs and SES will prioritize electricity interaction, which helps to increase the profits of both parties and reduce their transaction costs.
Figure 15.
Electrical energy trading price between SES and microgrids.
The results of efficiency improvements before and after collaboration among the various entities are presented in Table 4. From the Table’s data, at the point of negotiation breakdown, the operating costs for each microgrid operating independently were 20,427.89 ¥, 15,668.87 ¥, and 18,791.59 ¥, respectively. SES had no costs since it did not engage in power exchange with the microgrids, resulting in a cost of 0 ¥. The total cost for the alliance was 54,888.35 ¥. Since the collaboration cost does not account for the electricity payment costs between the SES and MMG, the alliance’s collaboration cost and final cost are the same, both amounting to 51,780.08 ¥. The final cost is the total cost formed by each entity negotiating and sharing the electricity transaction payment costs based on the cooperation cost. Since the formation of the alliance does not alter the original electricity transaction payment costs between SES and MMG, and although the cooperation cost and final cost of each entity differ, the total cost of the alliance’s overall operation remains unchanged at 51,780.08 ¥.
Table 4.
Each entity’s benefit enhancement considering the contribution factor.
Since MG 1 provides the most electrical energy to other entities during the cooperation process, meaning it has the highest contribution value and bargaining power, it enjoys the lowest average transaction price and is allocated more cooperative benefits. In contrast, due to its smaller share of renewable energy generation and its role primarily as an electricity receiver, MG 2 needs to pay higher interaction costs. The alliance’s benefits increased by 3108.26 ¥, with MG 1, MG 2, MG 3, and SES seeing increases of 947.29 ¥, 797.26 ¥, 772.38 ¥, and 591.34 ¥, respectively. The saving ratios for the three microgrids are 4.6%, 5.0%, and 4.1%. Table 5 illustrates the benefit distribution under Nash bargaining without considering bargaining factors. As shown by the data in Table 5, the final benefit allocation among each entity tends toward equal distribution. This demonstrates that transaction costs calculated based on the improved Nash bargaining model can achieve a reasonable distribution of synergistic benefits according to the differing contribution levels of each entity.
Table 5.
Each entity benefit enhancement without considering the contribution factor.
6.4. Uncertainty Analysis
6.4.1. Analysis at Different Confidence Levels
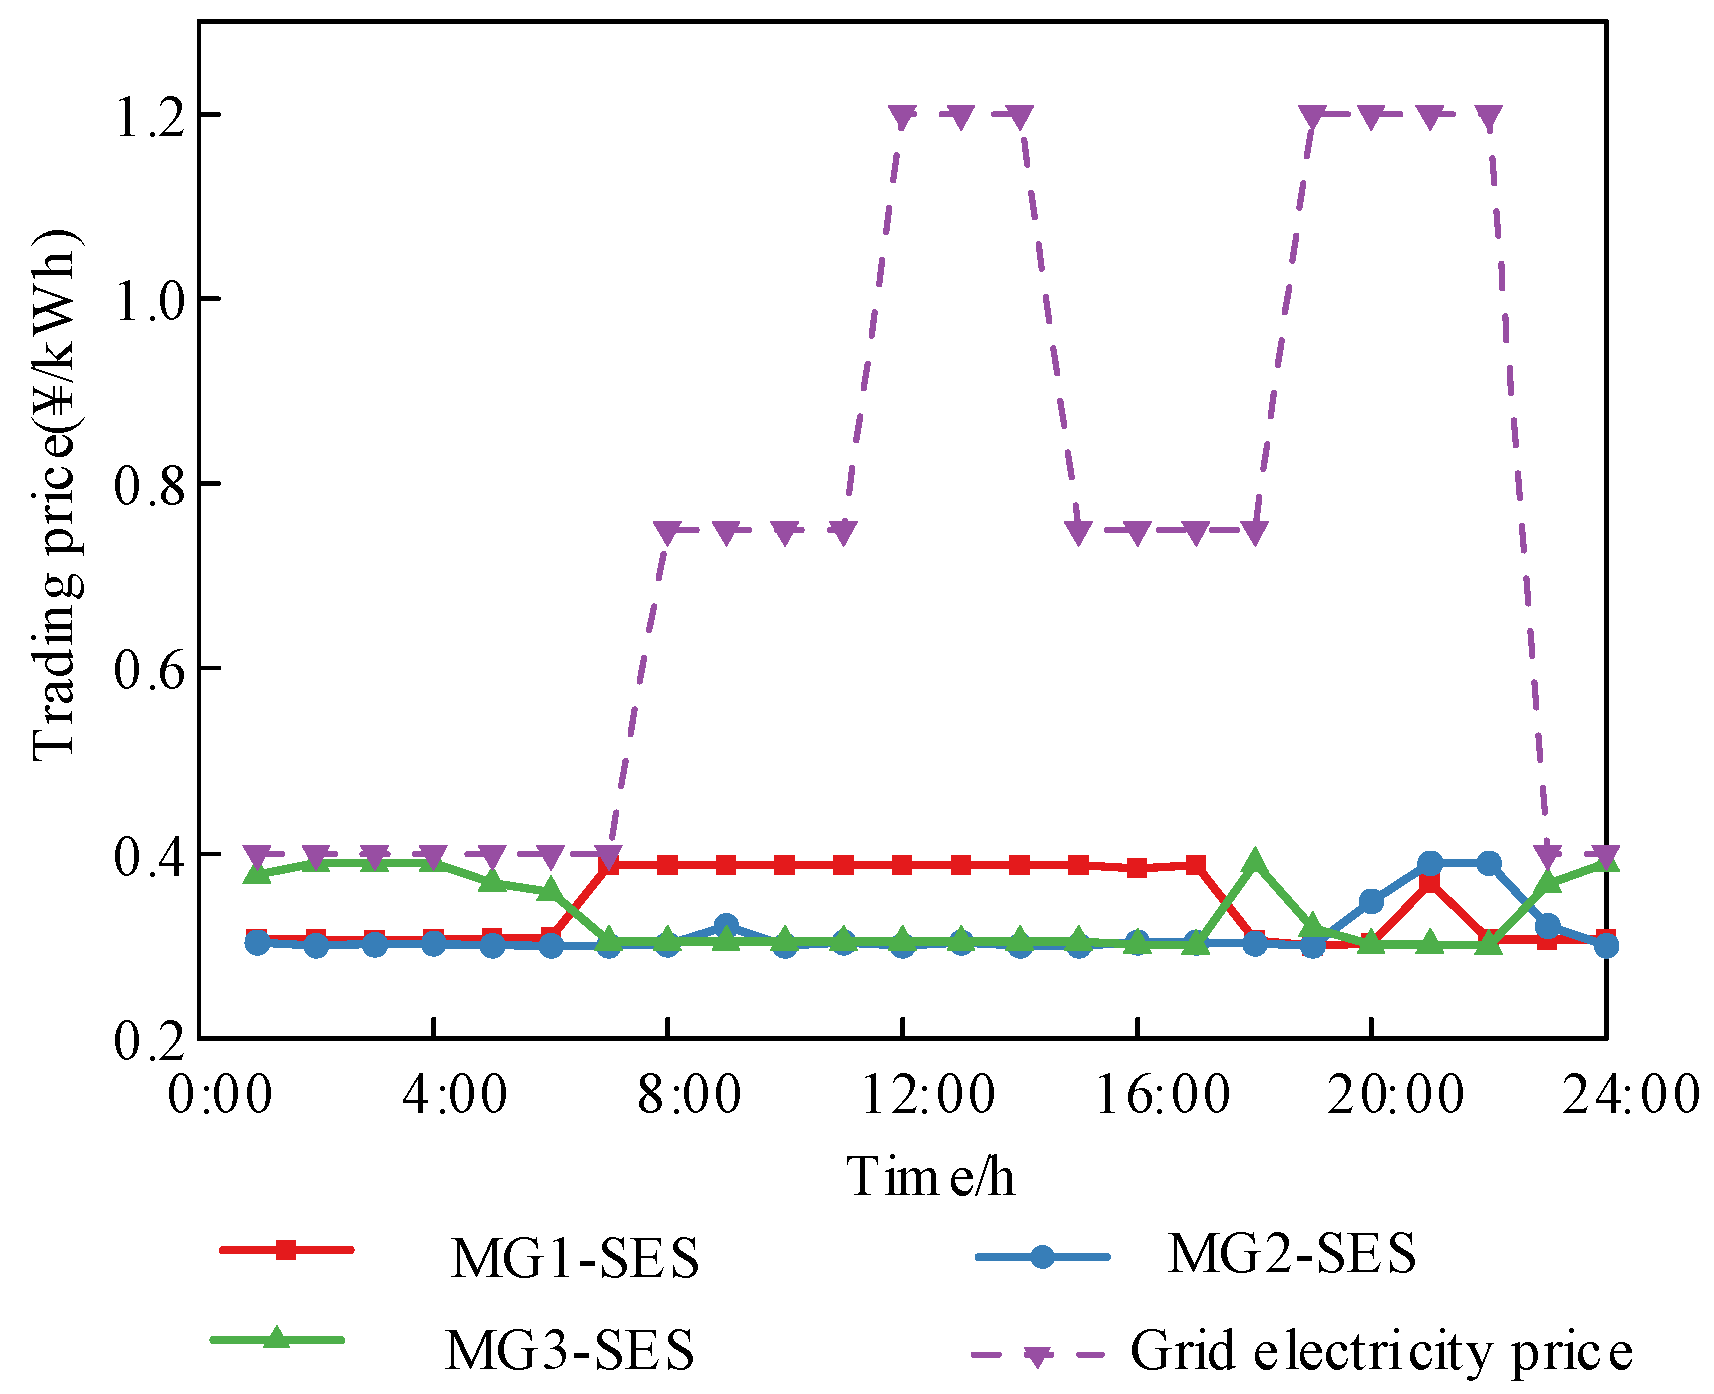
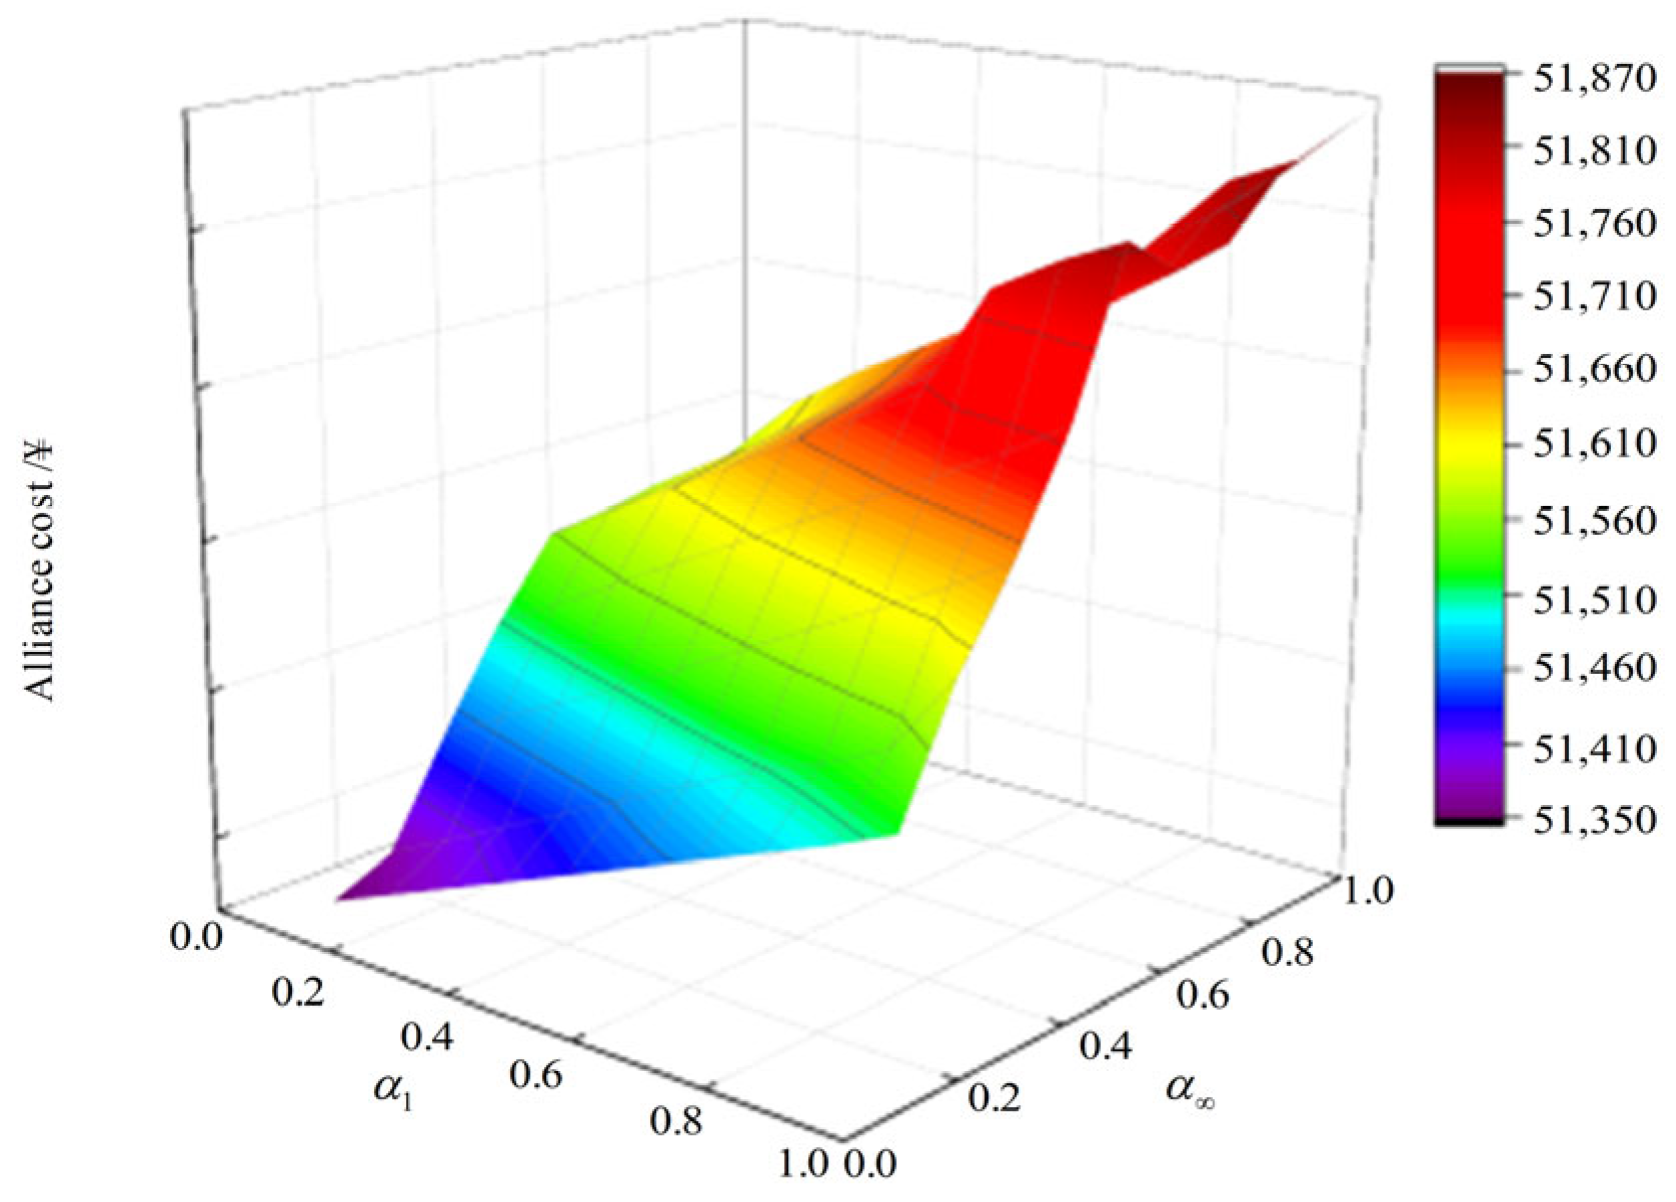
To evaluate the influence of confidence levels on MMG-SES alliance cost, let M = 1000. Figure 16 displays the MMG-SES alliance’s operating cost sensitivity. As confidence levels and increase, the costs of the cooperative alliance also increase. The reason lies in the widening of prediction intervals, which elevates the likelihood of extremely low-generation events in renewable energy systems. Each microgrid must incur control costs due to the variability in renewable power output, thereby increasing the cooperative alliance cost.
Figure 16.
The alliance cost sensitivity of MMG-SES.
6.4.2. Comparison of the Results of the Composite Norm and the Single Norm
To demonstrate the advantages of the composite norm confidence bound, Table 6 presents a competitive assessment between the proposed approach ( = 0.99) and the conventional ∞-norm-constrained method. The results demonstrate that the optimization under the composite norm confidence interval yields more economical outcomes than those under the ∞-norm confidence interval alone for a fixed historical dataset size. This is attributed to the tighter composite norm confidence interval, which more accurately characterizes the uncertainty of wind and photovoltaic power generation, thereby reducing operational costs. Similarly, a performance evaluation contrasting the composite norm ( = 0.66) with the restricted 1-norm formulation is presented in Table 7. The analysis reveals that the composite norm approach yields both reduced coalition costs and lower conservatism relative to the standalone 1-norm formulation.
Table 6.
Comparison of composite norm and ∞-norm costs.
Table 7.
Comparison of composite norm and 1-norm costs.
The data presented in Table 6 and Table 7 demonstrate that, compared to using either the 1-norm or ∞-norm alone, the proposed composite norm method achieves a lower total cost. By mitigating the conservatism inherent in the optimization process, the composite norm approach enhances economic efficiency. Furthermore, when the confidence level of the 1-norm is sufficiently high, the ∞-norm constraint exerts a more significant influence on the total cost.
6.5. Comparison of Different Methods
As supplementary verification for the presented WGAN-GP scene-driven DRO method, in this section, the coalition cost under the proposed method is compared with the LHS-based, MC-based, and GAN-based scene-generated DRO methods, and experimental outcomes are presented in Table 8. Compared to the other three methods, the method mentioned in this article has the lowest alliance operating cost.
Table 8.
Optimization results of different methods.
This is because the DRO model adopted in this study constructs a probability distribution ambiguity set with initial scenario generation as the core. The quality of scenario generation directly determines the accuracy with which the ambiguity set characterizes the uncertainty of renewable energy output. If the generated scenarios fail to accurately reproduce the key statistical characteristics of historical renewable energy output, the ambiguity set will face two types of deviations: one is the underestimation of uncertainty, which refers to the omission of extreme output scenarios that are crucial for system operation, leading to overly optimistic scheduling decisions and additional emergency regulation costs when encountering unforeseen output fluctuations; and the other is the overestimation of uncertainty, which involves including irrelevant scenarios that do not conform to actual operational rules, prompting strategies to tend towards conservatism, and requiring the reservation of redundant backup capacity and interaction resources, thereby pushing up the overall operational cost of the system.
As typical representatives of traditional parametric scenario generation methods, the LHS and MC methods perform independent sampling based on statistical parameters such as mean and variance, without fully considering the spatial–temporal correlation of renewable energy output. They are prone to generating scenario combinations that violate actual operational logic, forcing the DRO model to configure excessive energy storage capacity or grid interaction resources to address such false uncertainties, indirectly increasing unnecessary redundant costs.
As verified in Section 6.2.2, the scenarios generated by WGAN-GP are significantly superior to those generated by the LHS, MC, and GAN methods in four core statistical indicators: kurtosis difference, skewness difference, KS statistic, and Wasserstein distance. This fully confirms that the WGAN-GP method can accurately capture the temporal correlation, distribution asymmetry, and tail characteristics of real renewable energy output. Such high-fidelity scenarios provide reasonable uncertainty boundaries for the DRO model, ensuring that the constructed ambiguity set is neither too narrow to omit key fluctuation information nor excessively broad to introduce invalid redundancy, thus achieving precise delineation of the actual fluctuation range of renewable energy.
6.6. Algorithm Performance Comparison
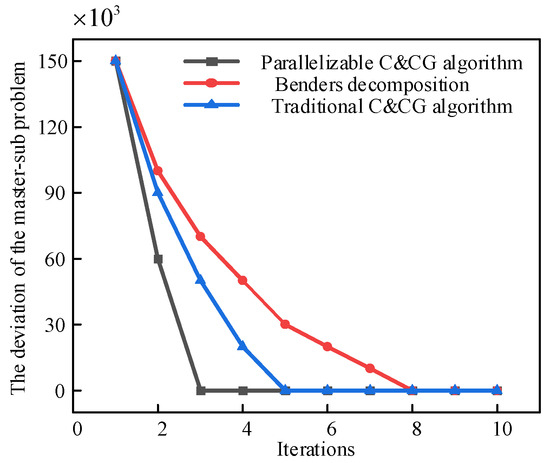
Existing solution approaches for two-stage robust optimization problems primarily include the traditional C&CG method and the Benders decomposition method. This section presents a comparative analysis of computational efficiency among three approaches: traditional C&CG, Benders decomposition, and the parallelizable C&CG algorithm for two-stage robust optimization. Figure 17 illustrates the convergence behavior of the three approaches by tracking the evolution of the master–subproblem objective value disparity during iterative computations.
Figure 17.
The iterative process under different algorithms.
The results demonstrate that three algorithms achieve asymptotic convergence, with the objective value discrepancy progressively diminishing to zero. Notably, the parallelizable C&CG algorithm attains convergence in just three iterations, while Benders decomposition requires eight iterations, and the traditional C&CG algorithm requires five iterations to reach comparable solution accuracy. This comparative analysis reveals that the parallelizable C&CG algorithm possesses superior convergence characteristics and computational efficiency relative to traditional Benders decomposition and the C&CG algorithm.
7. Conclusions
This paper proposes a data-driven MMG-SES system DRO strategy. To better quantify the variability of renewable energy, a WGAN-GP-based scenario generation method is proposed to generate the initial renewable energy scenarios for the two-stage DRO model. A cooperative model integrating DRO for SES and MMG is established. Simulation results validate the following main conclusions:
- The WGAN-GP-based scenario generation method adopted in this study produces scenarios that closely match the temporal statistical characteristics and probability distribution of historical data. Compared to the two-stage distributionally robust models driven by LHS, MC, and GAN scenarios, the proposed model has the lowest alliance operating cost.
- The proposed composite norm method demonstrates superior performance compared to individual applications of either the 1-norm or ∞-norm approaches, yielding significantly lower integrated costs. This methodology effectively mitigates the conservatism inherent in the optimization process, thereby achieving enhanced economic efficiency.
- This proposed cooperative operation framework for SES-MMG by integrating DRO significantly reduces operational costs through optimized pricing mechanisms while effectively mitigating the impacts of source uncertainties. Moreover, the benefit distribution model based on contribution factors ensures a fair benefit allocation scheme. The respective efficiency improvements for each MG and SES are as follows: 947.29 ¥, 797.26 ¥, 772.38 ¥, and 591.34 ¥. This incentivizes microgrid participation in shared energy storage systems and enhances the economic viability of such collaborative energy-sharing paradigms.
- Compared with the traditional Benders decomposition algorithm and the C&CG algorithm, the parallelizable C&CG algorithm proposed in this paper has superior convergence characteristics and computational efficiency in the robust optimization model solving process. The convergence speed is twice as fast as the traditional C&CG algorithm and three times faster than the Benders algorithm.
The core methodological framework proposed in this study integrates three key components: high-fidelity scene generation based on WGAN-GP, DRO with composite norm constraints, and cooperative game theory grounded in contribution factors. Far beyond the specific MMG-SES under investigation, this integrated framework delivers a universal solution for quantifying uncertainties and coordinating interest relationships across diverse cooperative energy systems, thus demonstrating extensive methodological implications.
In terms of uncertainty quantification for renewable energy integration, the WGAN-GP scenario generation method circumvents the need for predefined probability distributions and accurately captures the spatio-temporal correlations and tail characteristics of renewable energy output, with scalability to other renewable energy-integrated systems such as distributed wind-photovoltaic-storage microgrids and regional integrated energy systems with high renewable penetration. For researchers and engineers grappling with challenges in characterizing renewable energy stochasticity—including insufficient historical data and complex output patterns—the method provides a data-driven alternative to traditional parametric sampling techniques and conventional GAN, ensuring more reliable uncertainty modeling.
Regarding the trade-off between economy and robustness in DRO, the composite norm ambiguity set proposed herein addresses the conservatism issue of single-norm-based DRO models, and its design principle can be generalized to a wide array of uncertainty-involved optimization problems, ranging from optimal dispatch of electric vehicles to energy management of off-grid microgrids. By flexibly adjusting the confidence levels of different norms, the framework enables decision-makers to balance operational cost and risk resistance according to specific application scenarios, furnishing a configurable tool for reconciling economy and robustness in complex energy systems.
As for fair benefit allocation in multi-stakeholder cooperation, the cooperative game model built on energy contribution factors effectively resolves interest conflicts among heterogeneous entities, including microgrids with varying renewable energy endowments and shared energy storage operators. This benefit allocation mechanism is adaptable to other multi-stakeholder collaborative scenarios, such as peer-to-peer energy trading among prosumers and cross-region energy sharing in distribution networks; by quantifying each participant’s coalition contributions in dimensions like energy supply, peak shaving, and risk mitigation, it upholds the principle of “fairness based on contribution”, which is critical for incentivizing long-term cooperation and accelerating the popularization of collaborative energy systems.
Despite the effectiveness of the proposed approach, it has three key limitations: First, the WGAN-GP-based scenario generation heavily depends on large-scale, high-quality historical data, and insufficient, noisy, or unrepresentative data may undermine the accuracy of scenarios and subsequent optimization. Second, its scalability to larger-scale systems or complex multi-energy networks remains unproven, as expanding beyond the three interconnected microgrids in this study may significantly increase the computational complexity of the parallelizable C&CG algorithm and ADMM, affecting solution efficiency. Third, the cooperative game’s contribution factor, quantified solely based on energy interaction without integrating multi-dimensional indicators like environmental benefits or grid security, may lead to suboptimal benefit distribution in scenarios emphasizing comprehensive sustainability.
For future research, we will address the identified limitations by: (1) developing a data augmentation technique for WGAN-GP to improve scenario generation performance under data scarcity; (2) optimizing the parallelizable C&CG algorithm and ADMM for large-scale systems to improve scalability; and (3) expanding the contribution factor with multi-dimensional indicators to achieve more comprehensive benefit distribution.
Author Contributions
Conceptualization, J.L. and M.T.; methodology, M.T. and J.L.; software, S.L. and Y.Z.; validation, J.L.; formal analysis, S.L.; investigation, M.T. and J.L.; resources, J.L.; data curation, S.L. and Y.Z.; writing—original draft preparation, S.L. and Y.Z.; writing—review and editing, M.T. and J.L.; visualization, M.T.; supervision, J.L.; project administration, J.L.; funding acquisition, M.T. and J.L. All authors have read and agreed to the published version of the manuscript.
Funding
This work was supported by the National Natural Science Foundation of China (No. 52167013), the Key Program of Natural Science Foundation of Gansu Province (No. 24JRRA225), the Natural Science Foundation of Gansu Province (No. 23JRRA891), and the General Program of Joint Foundation of Gansu Province (No. 25JRRA1167).
Institutional Review Board Statement
Not applicable.
Informed Consent Statement
Not applicable.
Data Availability Statement
The data that support the findings of this study are available from the corresponding author upon reasonable request.
Conflicts of Interest
The authors declare no conflicts of interest.
Abbreviations
The following abbreviations are used in this manuscript:
| SES | Shared energy storage |
| MMG | Multiple microgrids |
| MMG-SES | Microgrids-shared energy storage |
| SP | Stochastic programming |
| RO | Robust optimization |
| DRO | Distributionally robust optimization |
| MC | Monte Carlo |
| LHS | Latin Hypercubic Sampling |
| CFS | Conjugate Function Sampling |
| RBFNN-PSO | Radial basis function neural network–particle swarm optimization |
| GAN | Generative adversarial network |
| WGAN-GP | Wasserstein generative adversarial networks with gradient penalty |
| C&CG | Column and constraint generation |
| ADMM | Alternating direction method of multipliers |
| WT | Wind turbines |
| PV | Photovoltaic |
| CHP | Combined heat and power |
| GB | Gas boilers |
| AC | Absorption chillers |
| EC | Electric coolers |
| JS | Jensen–Shannon |
| RMSE | Root mean square error |
| MAE | Mean absolute error |
| MAPE | Mean absolute percentage error |
Appendix A
Figure A1.
Load and new energy output of each MG.
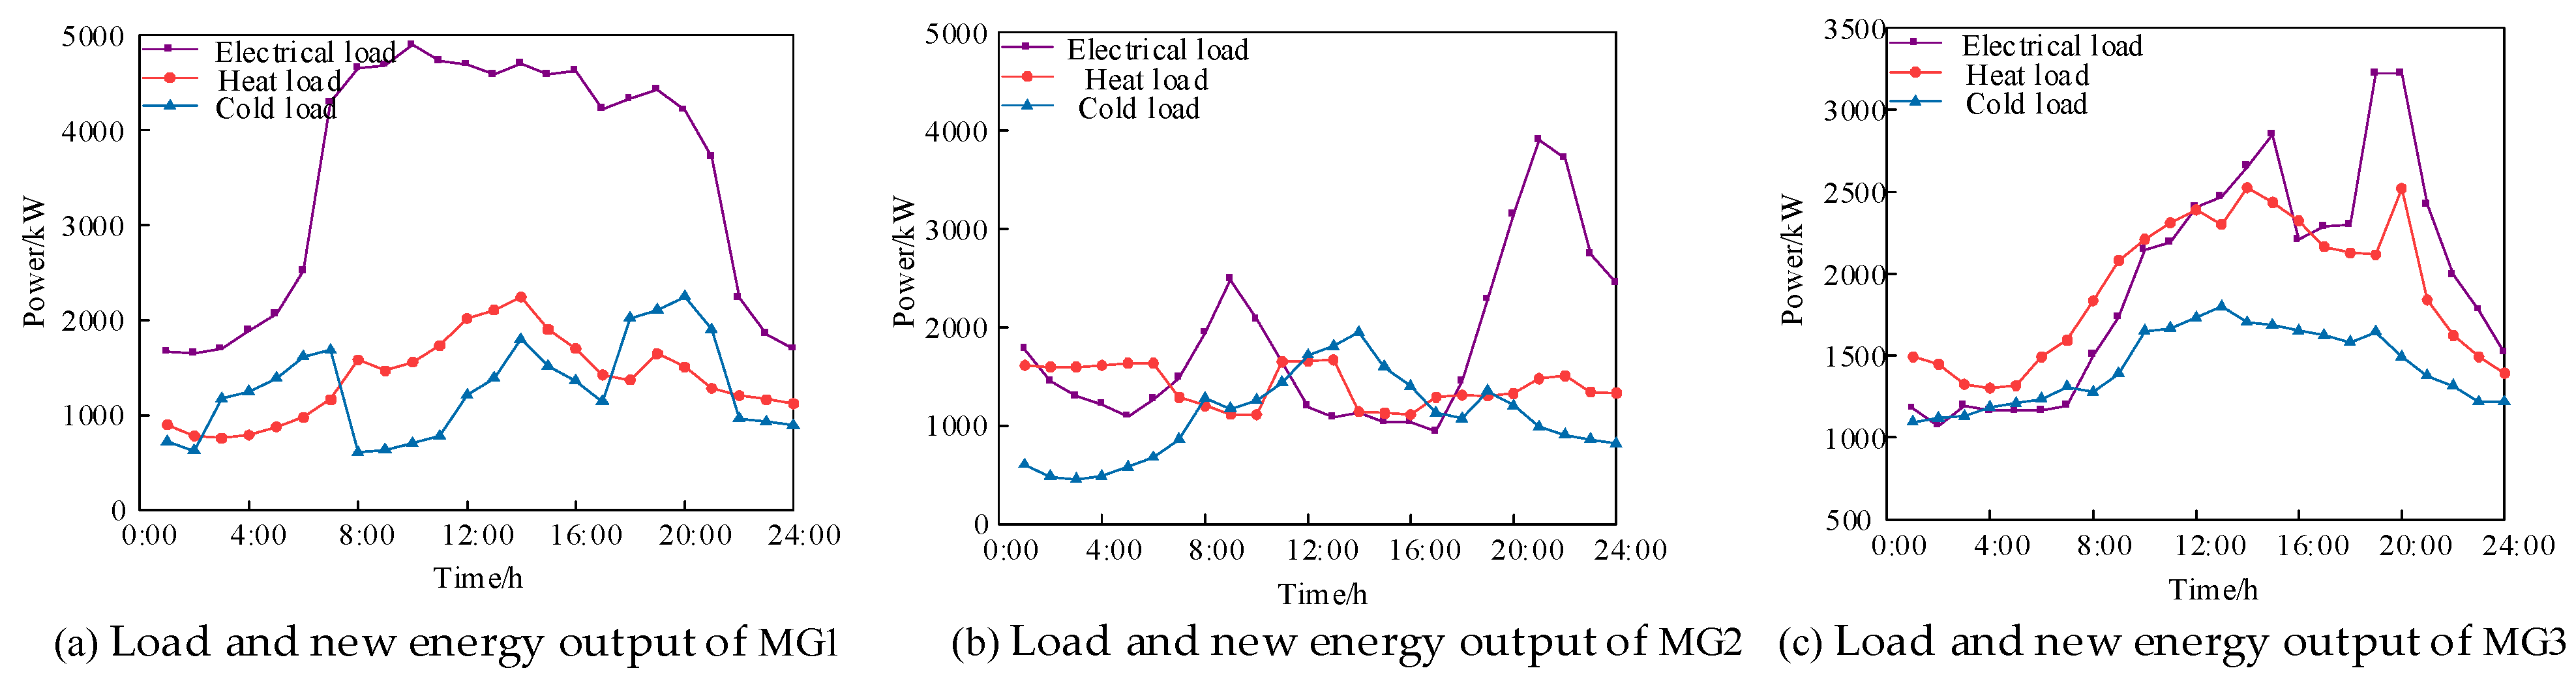
Table A1.
SES equipment parameters.
Table A2.
MG equipment parameters.
References
- Sorknæs, P.; Johannsen, R.M.; Korberg, A.D.; Nielsen, T.B.; Petersen, U.R.; Mathiesen, B.V. Electrification of the industrial sector in 100% renewable energy scenarios. Energy 2022, 254, 124339. [Google Scholar] [CrossRef] [Scilit]
- Xiong, L.; Song, R.; Huang, S.; Ban, C.; Li, P.; Wang, Z.; Khan, M.W.; Niu, T. Markov jump system modeling and control of inverter-fed remote area weak grid via quantized sliding mode. IEEE Trans. Power Syst. 2024, 40, 2091–2105. [Google Scholar] [CrossRef] [Scilit]
- Wang, Q.; Huang, S.; Xiong, L.; Zhou, Y.; Niu, T.; Gao, F.; Khan, M.W.; Wang, Z.; Ban, C.; Song, R. Distributed secondary control based on bi-limit homogeneity for AC microgrids subjected to non-uniform delays and actuator saturations. IEEE Trans. Power Syst. 2024, 40, 820–833. [Google Scholar] [CrossRef] [Scilit]
- Shahbaz, M.; Nwani, C.; Bekun, F.V.; Gyamfi, B.A.; Agozie, D.Q. Discerning the role of renewable energy and energy efficiency in finding the path to cleaner consumption and production patterns: New insights from developing economies. Energy 2022, 260, 124951. [Google Scholar] [CrossRef] [Scilit]
- Tercan, S.M.; Demirci, A.; Gokalp, E.; Cali, U. Maximizing self-consumption rates and power quality towards two-stage evaluation for solar energy and shared energy storage empowered microgrids. J. Energy Storage 2022, 51, 104561. [Google Scholar] [CrossRef] [Scilit]
- Walker, A.; Kwon, S. Design of structured control policy for shared energy storage in residential community: A stochastic optimization approach. Appl. Energy 2021, 298, 117182. [Google Scholar] [CrossRef] [Scilit]
- Wu, C.; Zhou, D.; Lin, X.; Sui, Q.; Wei, F.; Li, Z. A novel energy cooperation framework for multi-island microgrids based on marine mobile energy storage systems. Energy 2022, 252, 124060. [Google Scholar] [CrossRef] [Scilit]
- Siqin, T.; He, S.; Hu, B.; Fan, X. Shared energy storage-multi-microgrid operation strategy based on multi-stage robust optimization. J. Energy Storage 2024, 97, 112785. [Google Scholar] [CrossRef] [Scilit]
- Dai, B.; Wang, H.; Li, B.; Li, C.; Tan, Z. Capacity model and optimal scheduling strategy of multi-microgrid based on shared energy storage. Energy 2024, 306, 132472. [Google Scholar] [CrossRef] [Scilit]
- Lu, J.; Zheng, W.; Yu, Z.; Xu, Z.; Jiang, H.; Zeng, M. Optimizing grid-connected multi-microgrid systems with shared energy storage for enhanced local energy consumption. IEEE Access 2024, 12, 13663–13677. [Google Scholar] [CrossRef] [Scilit]
- Caminiti, C.M.; Spiller, M.; Dimovski, A.; Barbieri, J.; Ragaini, E.; Merlo, M. Integrated adequacy and stability BESS sizing criteria for hybrid diesel–PV microgrids in developing countries. Sustain. Energy Technol. Assess. 2025, 83, 104541. [Google Scholar] [CrossRef] [Scilit]
- Dai, R.; Esmaeilbeigi, R.; Charkhgard, H. The utilization of shared energy storage in energy systems: A comprehensive review. IEEE Trans. Smart Grid 2021, 12, 3163–3174. [Google Scholar] [CrossRef] [Scilit]
- Xiao, J.; Yang, Y.; Cui, S.; Liu, X.K. A new energy storage sharing frame-work with regard to both storage capacity and power capacity. Appl. Energy 2022, 307, 118171. [Google Scholar] [CrossRef] [Scilit]
- Müller, S.C.; Welpe, I.M. Sharing electricity storage at the community level: An empirical analysis of potential business models and barriers. Energy Policy 2018, 118, 492–503. [Google Scholar] [CrossRef] [Scilit]
- Qian, W.; Chen, C.; Gong, L.; Zhang, W. Research on nash game model for user side shared energy storage pricing. Sci. Rep. 2023, 13, 16099. [Google Scholar] [CrossRef] [Scilit]
- Wang, Z.; Chen, L.; Li, X.; Mei, S. A Nash bargaining model for energy sharing between micro-energy grids and energy storage. Energy 2023, 283, 129065. [Google Scholar] [CrossRef] [Scilit]
- Liu, X.; Gao, B.; Zhu, Z.; Tang, Y. Non-cooperative and cooperative optimisation of battery energy storage system for energy management in multi-microgrid. IET Gener. Transm. Distrib. 2018, 12, 2369–2377. [Google Scholar] [CrossRef] [Scilit]
- Wang, Y.; Cui, Y.; Li, Y.; Xu, Y. Collaborative optimization of multi-microgrids system with shared energy storage based on multi-agent stochastic game and reinforcement learning. Energy 2023, 280, 182. [Google Scholar] [CrossRef] [Scilit]
- Liu, L.; Yao, X.; Han, Y.; Qi, X. Research on optimal management strategy of electro-thermal hybrid shared energy storage based on Nash bargaining under source-load uncertainty. J. Energy Storage 2024, 96, 112713. [Google Scholar] [CrossRef] [Scilit]
- Dai, Y.; Liu, Y.; Ma, X. A Transaction Scheme for Shared Energy Storage Service Providers and Multi-microgrid Operators. In Proceedings of the 2025 28th International Conference on Electrical Machines and Systems (ICEMS); IEEE: Piscataway, NJ, USA, 2025; pp. 3427–3432. [Google Scholar] [CrossRef] [Scilit]
- Zhang, B.; Huang, J. Shared energy storage capacity configuration of a distribution network system with multiple microgrids based on a stackelberg game. Energies 2024, 17, 3104. [Google Scholar] [CrossRef] [Scilit]
- Li, B.; Yang, Q.; Kamwa, I. A novel Stackelberg-game-based energy storage sharing scheme under demand charge. IEEE/CAA J. Autom. Sin. 2023, 10, 462–473. [Google Scholar] [CrossRef] [Scilit]
- Chen, C.; Li, Y.; Qiu, W.; Liu, C.; Zhang, Q.; Li, Z.; Lin, Z.; Yang, L. Cooperative-game-based day-ahead scheduling of local integrated energy systems with shared energy storage. IEEE Trans. Sustain. Energy 2022, 13, 1994–2011. [Google Scholar] [CrossRef] [Scilit]
- Duan, P.; Zhao, B.; Zhang, X.; Fen, M. A day-ahead optimal operation strategy for integrated energy systems in multi-public buildings based on cooperative game. Energy 2023, 275, 127395. [Google Scholar] [CrossRef] [Scilit]
- Alilou, M.; Tousi, B.; Shayeghi, H. Home energy management in a residential smart micro grid under stochastic penetration of solar panels and electric vehicles. Sol. Energy 2020, 212, 6–18. [Google Scholar] [CrossRef] [Scilit]
- Zhong, J.; Li, Y.; Cao, Y.; Tan, Y.; Peng, Y.; Zhou, Y.; Nakanishi, Y.; Li, Z. Robust coordinated optimization with adaptive uncertainty set for a multi-energy microgrid. IEEE Trans. Sustain. Energy 2023, 14, 111–124. [Google Scholar] [CrossRef] [Scilit]
- Shen, F.; Zheng, X.; Lyu, M.; Huang, S.; Wu, Q.; Shen, Y.; Wang, P.; Zhou, Y. Transactive energy-based sequential load restoration of distribution systems with networked microgrids under uncertainty. IEEE Trans. Smart Grid 2023, 15, 2601–2613. [Google Scholar] [CrossRef] [Scilit]
- Cao, Y.; Li, D.; Zhang, Y.; Tang, Q.; Khodaei, A.; Zhang, H.; Han, Z. Optimal energy management for multi-microgrid under a transactive energy framework with distributionally Robust optimization. IEEE Trans. Smart Grid 2022, 13, 599–612. [Google Scholar] [CrossRef] [Scilit]
- Tan, B.; Lin, Z.; Zheng, X.; Xiao, F.; Wu, Q.; Yan, J. Distributionally robust energy management for multi-microgrids with grid-interactive EVs considering the multi-period coupling effect of user behaviors. Appl. Energy 2023, 350, 121770. [Google Scholar] [CrossRef] [Scilit]
- Wang, L.; Jiang, C.; Gong, K.; Si, R.; Shao, H.; Liu, W. Data-driven distributionally robust economic dispatch for distribution network with multiple microgrids. IET Gener. Trans. Distrib. 2020, 14, 5712–5719. [Google Scholar] [CrossRef] [Scilit]
- Tavakoli, A.; Karimi, A. Development of Monte-Carlo-based stochastic scenarios to improve uncertainty modelling for optimal energy management of a renewable energy hub. IET Renew. Power Gener. 2023, 17, 1139–1164. [Google Scholar] [CrossRef] [Scilit]
- Han, X.; Lv, F.; Li, J.; Zeng, F. Flexible interactive control method for multi-scenario sharing of hybrid pumped storage-wind-photovoltaic power generation. J. Energy Storage 2024, 100, 113590. [Google Scholar] [CrossRef] [Scilit]
- Becker, R. Generation of time-coupled wind power infeed scenarios using paircopula construction. IEEE Trans. Sustain. Energy 2017, 9, 1298–1306. [Google Scholar] [CrossRef] [Scilit]
- Park, S.W.; Xu, Q.; Hobbs, B.F. Comparing scenario reduction methods for stochastic transmission planning. IET Gener. Transm. Distrib. 2019, 13, 1005–1013. [Google Scholar] [CrossRef]
- Mehrotra, S.; Papp, D. Generating moment matching scenarios using optimization techniques. SIAM J. Optim. 2013, 23, 963–999. [Google Scholar] [CrossRef] [Scilit]
- Li, J.; Zhou, J.; Chen, B. Review of wind power scenario generation methods for optimal operation of renewable energy systems. Appl. Energy 2020, 280, 115992. [Google Scholar] [CrossRef] [Scilit]
- Rahmani, S.; Amjady, N.; Shah, R. Application of Deep Learning Algorithms for Scenario Analysis of Renewable Energy-Integrated Power Systems: A Critical Review. Electronics 2025, 14, 2150. [Google Scholar] [CrossRef] [Scilit]
- Benti, N.E.; Chaka, M.D.; Semie, A.G. Forecasting renewable energy generation with machine learning and deep learning: Current advances and future prospects. Sustainability 2023, 15, 7087. [Google Scholar] [CrossRef] [Scilit]
- Cui, M.; Ke, D.; Sun, Y.; Gan, D.; Zhang, J.; Hodge, B.-M. Wind power ramp event forecasting using a stochastic scenario generation method. IEEE Trans. Sustain. Energy 2015, 6, 422–433. [Google Scholar] [CrossRef] [Scilit]
- Arora, P.; Jalali, S.M.; Ahmadian, S.; Panigrahi, B.K.; Suganthan, P.N.; Khosravi, A. Probabilistic wind power forecasting using optimized deep auto-regressive recurrent neural networks. IEEE Trans. Ind. Inform. 2022, 19, 2814–2825. [Google Scholar] [CrossRef] [Scilit]
- Dong, W.; Chen, X.; Yang, Q. Data-driven scenario generation of renewable energy production based on controllable generative adversarial networks with interpretability. Appl. Energy 2022, 308, 118387. [Google Scholar] [CrossRef] [Scilit]
- Chen, Y.; Li, P.; Zhang, B. Bayesian renewables scenario generation via deep generative networks. In Proceedings of the 2018 52nd Annual Conference on Information Sciences and Systems (CISS); IEEE: Princeton, NJ, USA, 2018; pp. 1–6. [Google Scholar] [CrossRef] [Scilit]
- Xie, J.; Rahman, A.; Sun, W. Bayesian GAN-based false data injection attack detection in active distribution grids with DERs. IEEE Trans. Smart Grid 2023, 15, 3223–3234. [Google Scholar] [CrossRef] [Scilit]
- Jiang, C.; Mao, Y.; Chai, Y.; Yu, M.; Tao, S. Scenario generation for wind power using improved generative adversarial networks. IEEE Access 2018, 6, 62193–62203. [Google Scholar] [CrossRef] [Scilit]
- Aggarwal, A.; Mittal, M.; Battineni, G. Generative adversarial network: An overview of theory and applications. Int. J. Inf. Manag. Data Insights 2021, 1, 100004. [Google Scholar] [CrossRef] [Scilit]
- Jiang, C.; Mao, Y.; Chai, Y.; Yu, M. Day-ahead renewable scenario forecasts based on generative adversarial networks. Int. J. Energy Res. 2020, 45, 7572–7587. [Google Scholar] [CrossRef] [Scilit]
- Gu, L.; Xu, J.; Ke, D.; Deng, Y.; Hua, X.; Yu, Y. Short-term output scenario generation of renewable energy using transformer–wasserstein generative adversarial nets-gradient penalty. Sustainability 2024, 16, 10936. [Google Scholar] [CrossRef] [Scilit]
- Ma, X.; Liu, Y.; Yan, J.; Wang, H. A WGAN-GP-based scenarios generation method for wind and solar power complementary study. Energies 2023, 16, 3114. [Google Scholar] [CrossRef] [Scilit]
- Ikotun, A.M.; Ezugwu, A.E.; Abualigah, L.; Abuhaija, B.; Heming, J. K-means clustering algorithms: A comprehensive review, variants analysis, and advances in the era of big data. Inf. Sci. 2023, 622, 178–210. [Google Scholar] [CrossRef] [Scilit]
- Bai, R.; Shi, Y.; Yue, M.; Du, X. Hybrid model based on K-means++ algorithm, optimal similar day approach, and long short-term memory neural network for short-term photovoltaic power prediction. Glob. Energy Interconnect. 2023, 6, 184–196. [Google Scholar] [CrossRef] [Scilit]
- Chen, Y.; Pei, W.; Ma, T.; Xiao, H. Asymmetric Nash bargaining model for peer-to-peer energy transactions combined with shared energy storage. Energy 2023, 278, 127980. [Google Scholar] [CrossRef] [Scilit]
- Cui, S.; Wang, Y.W.; Liu, X.K.; Wang, Z.; Xiao, J.W. Economic storage sharing framework: Asymmetric bargaining-based energy cooperation. IEEE Trans. Ind. Inform. 2021, 17, 7489–7500. [Google Scholar] [CrossRef] [Scilit]
- Li, H.; Han, Y. Data-driven distributionally robust collaborative optimization operation strategy for a multi-microgrid based on LSTM-CGAN. Power Syst. Prot. Control 2025, 52, 11377. [Google Scholar] [CrossRef]

Disclaimer/Publisher’s Note: The statements, opinions and data contained in all publications are solely those of the individual author(s) and contributor(s) and not of MDPI and/or the editor(s). MDPI and/or the editor(s) disclaim responsibility for any injury to people or property resulting from any ideas, methods, instructions or products referred to in the content. |
© 2026 by the authors. Licensee MDPI, Basel, Switzerland. This article is an open access article distributed under the terms and conditions of the Creative Commons Attribution (CC BY) license.