Article

Decarbonized Electricity Systems: The Critical Impact of LCA Methodology on Climate and Toxicity Impacts


by
Aslhy Torres Ureña
and
Susan E. Powers
*
Institute for a Sustainable Environment, Clarkson University, 8 Clarkson Ave, Potsdam, NY 13699, USA
*
Author to whom correspondence should be addressed.
Sustainability 2026, 18(5), 2263; https://doi.org/10.3390/su18052263
Submission received: 31 October 2025 / Revised: 19 February 2026 / Accepted: 23 February 2026 / Published: 26 February 2026
(This article belongs to the Section Sustainable Engineering and Science)

Abstract

Life cycle assessment (LCA) studies show that electricity supply and consumption are often a dominant contributor to environmental impacts, yet these results are highly sensitive to the choice of inventory database and its embedded assumptions. This study examines how database structure and scenario flexibility shape electricity-related impacts by comparing three approaches for the 2022 Northeast Power Coordinating Council (NPCC) region in the USA: the Ecoinvent “market for electricity” dataset, the modular U.S. electricity model from the Sphera database, and a customized NPCC model built from Ecoinvent unit processes. Impacts were assessed with both ReCiPe 2016 and TRACI 2.1. While climate change and fossil resource depletion results were consistent across databases and impact assessment methods, toxicity-related categories diverged substantially, with substantially higher values from Ecoinvent inventories. These high toxicity values were directly linked to assumptions about the use of copper in grid infrastructure (66%), including incineration at its end of life (18%), a disposal technique that is not relevant to the NPCC area. A case study of residential heating electrification further highlighted that while heat pumps with a decarbonized grid consistently reduced climate impacts, conclusions for other categories varied depending on the database used. These findings underscore the importance of transparent electricity models and cross-database sensitivity analysis in prospective LCAs when evaluating the overall environmental and health benefits of a sustainable energy future (UN SDG 7, 13). Without such practices, non-climate results, particularly toxicity outcomes, risk reflecting database assumptions and artifacts rather than real technological and environmental differences.

1. Introduction

Electricity supply is a critical contributor to the environmental impacts identified in many life cycle assessment (LCA) studies, especially in energy-intensive systems that primarily use fossil fuel resources. Accurate modeling of electricity is essential to capture emissions from upstream fuel supply, generation technologies, infrastructure, and transmission and distribution (T&D) losses. As electrification expands across transportation, heating, and industry sectors, and the electric grid is decarbonized, the ability to model future sustainable electricity scenarios has become increasingly important for prospective LCA applications [1].
Despite this growing need, many widely used LCA databases still rely on static representations of the electricity supply. These datasets often include outdated assumptions, such as fixed generation technology shares, and the use of data and practices for geographical regions that are not relevant to the region of interest, which can significantly influence results [2].
This study aims to evaluate a modeling approach for assessing the environmental impacts of electricity supply under changing grid conditions and to evaluate how life cycle inventory (LCI) database assumptions and impact assessment methods influence these results. Specifically, the study focuses on the Northeast Power Coordinating Council (NPCC) region, which covers New York and New England, U.S.A.

1.1. Motivation and Context

The United States electric grid today consists of regional systems with diverse generation mixes. In 2024, about 60% of U.S. utility-scale electricity generation came from fossil fuels (primarily natural gas and coal), roughly 19% from nuclear, and about 21% from renewable sources [3]. Generation from renewable resources is rapidly growing due to the lower cost of solar and wind energy and governmental policies and subsidies. In 2022, U.S. renewable electricity generation surpassed coal generation for the first time in history [3]. These changes have substantially decreased the carbon intensity of the U.S. electricity sector. According to the U.S. EPA, the national average greenhouse gas emissions rate for electricity generation was approximately 349 kg CO2 per MWh in 2023 [4], which was substantially lower than 530 kg CO2 per MWh a decade earlier [5].
The NPCC region relies primarily on natural gas, nuclear power, and hydropower for electricity generation. In New England, for instance, preliminary 2024 data show about 55% of electricity generation from natural gas and 24% from nuclear, with most of the remainder from renewables and imports (hydropower from Canada), and negligible coal or oil contribution (<1%) [6].
Decarbonization of the electric grid is critically important to meet the international climate goal to limit the global temperature increase to 1.5 °C [7]. Prior to January 2025, the U.S. set an aspirational goal of achieving 100% carbon pollution-free electricity by 2035, recognizing the grid’s pivotal role in broader climate strategy [8]. Independent of federal actions, numerous U.S. states, including some of those in the NPCC, still have similar aspirational goals and have established policies to transition to a more decarbonized grid.

1.2. Research Gap

Recent LCA studies consistently show wide variation in per-kWh greenhouse gas (GHG) intensities. Nuclear and wind are the lowest, followed by hydro, solar, and geothermal, all one to two orders of magnitude below coal or natural gas plants [9]. Integrated scenario work reaches the same conclusion: in a 2050 climate-stabilization pathway, Pehl et al. [10] forecast ~3.5–12 kg CO2e/MWh for wind, solar, or nuclear, versus ~78–110 kg CO2e/MWh for fossil plants with carbon capture, and ~100 kg CO2e/MWh for hydropower, indicating that upfront manufacturing does not erode the climate benefits associated with decarbonizing the power mix. At the same time, decarbonization can entail trade-offs in other impact categories; wind and solar may cause acidification, water use, and toxicity-related burdens due to metals extraction and processing, so consideration of comprehensive indicators beyond climate change remains essential [11,12,13,14,15].
None of these future-grid LCAs systematically evaluated the background databases on which they relied. They typically adopt a single database and vary scenarios or technologies without considering cross-database sensitivity or tracing how database-level assumptions shape the results.
The Ecoinvent, Sphera (formerly GaBi), and U.S. Life Cycle Inventory (USLCI) databases are among the most widely used life cycle inventory (LCI) sources in environmental assessment. Ecoinvent, developed by a Swiss consortium, offers a large and typically transparent collection of unit process datasets covering global energy, materials, agriculture, transport, and other sectors [16]. It is updated regularly and supports multiple system modeling approaches, with regionalized electricity data for many countries and subnational grids [1]. The Sphera database also has broad sectoral coverage and is updated annually [17], but often provides aggregated datasets that are less transparent and less granular than most of Ecoinvent’s unit processes [18]. USLCI, maintained by the U.S. National Renewable Energy Laboratory, focuses on U.S. processes and is openly accessible. It has a limited scope and less frequent updates, with many datasets reflecting older averages [19]. Although valuable for U.S.-centered studies, its technological and regional resolution is generally coarser, and documentation quality varies [20].
A number of recent studies for a variety of systems have examined how LCA results differ across these databases. Kalverkamp et al. [21] compared Ecoinvent and Sphera databases for electric and combustion vehicles, finding broadly similar climate change results but large, inconsistent differences in other categories such as ozone depletion and water use. In some cases, the relative environmental advantage of one vehicle type changed depending on the database used, leading the authors to recommend testing multiple LCI database sources in comparative studies. Emami et al. [18] modelled two Finnish residential buildings with Ecoinvent and Sphera databases and also observed comparable climate change results but dramatic discrepancies, often over 40% higher with Ecoinvent, for eutrophication, acidification, and toxicity indicators. They attributed this to differences in system boundary completeness, with Ecoinvent including more upstream processes. Pauer et al. [2] compared packaging systems in Ecoinvent, Sphera, and the EU Environmental Footprint databases. They also found consistent climate change results but significant divergences in most other categories. They linked these to variations in data content and to differences in how life cycle impact assessment methods were implemented. Kim et al. [19] extended such comparisons to plastic resin production and end-of-life processes across USLCI (U.S. Life Cycle Inventory), Ecoinvent, Sphera database, and GREET (Greenhouse gases, Regulated Emissions, and Energy use in Technologies), finding substantial variation in greenhouse gas emissions, water consumption, and fossil fuel use, especially for incineration and recycling.
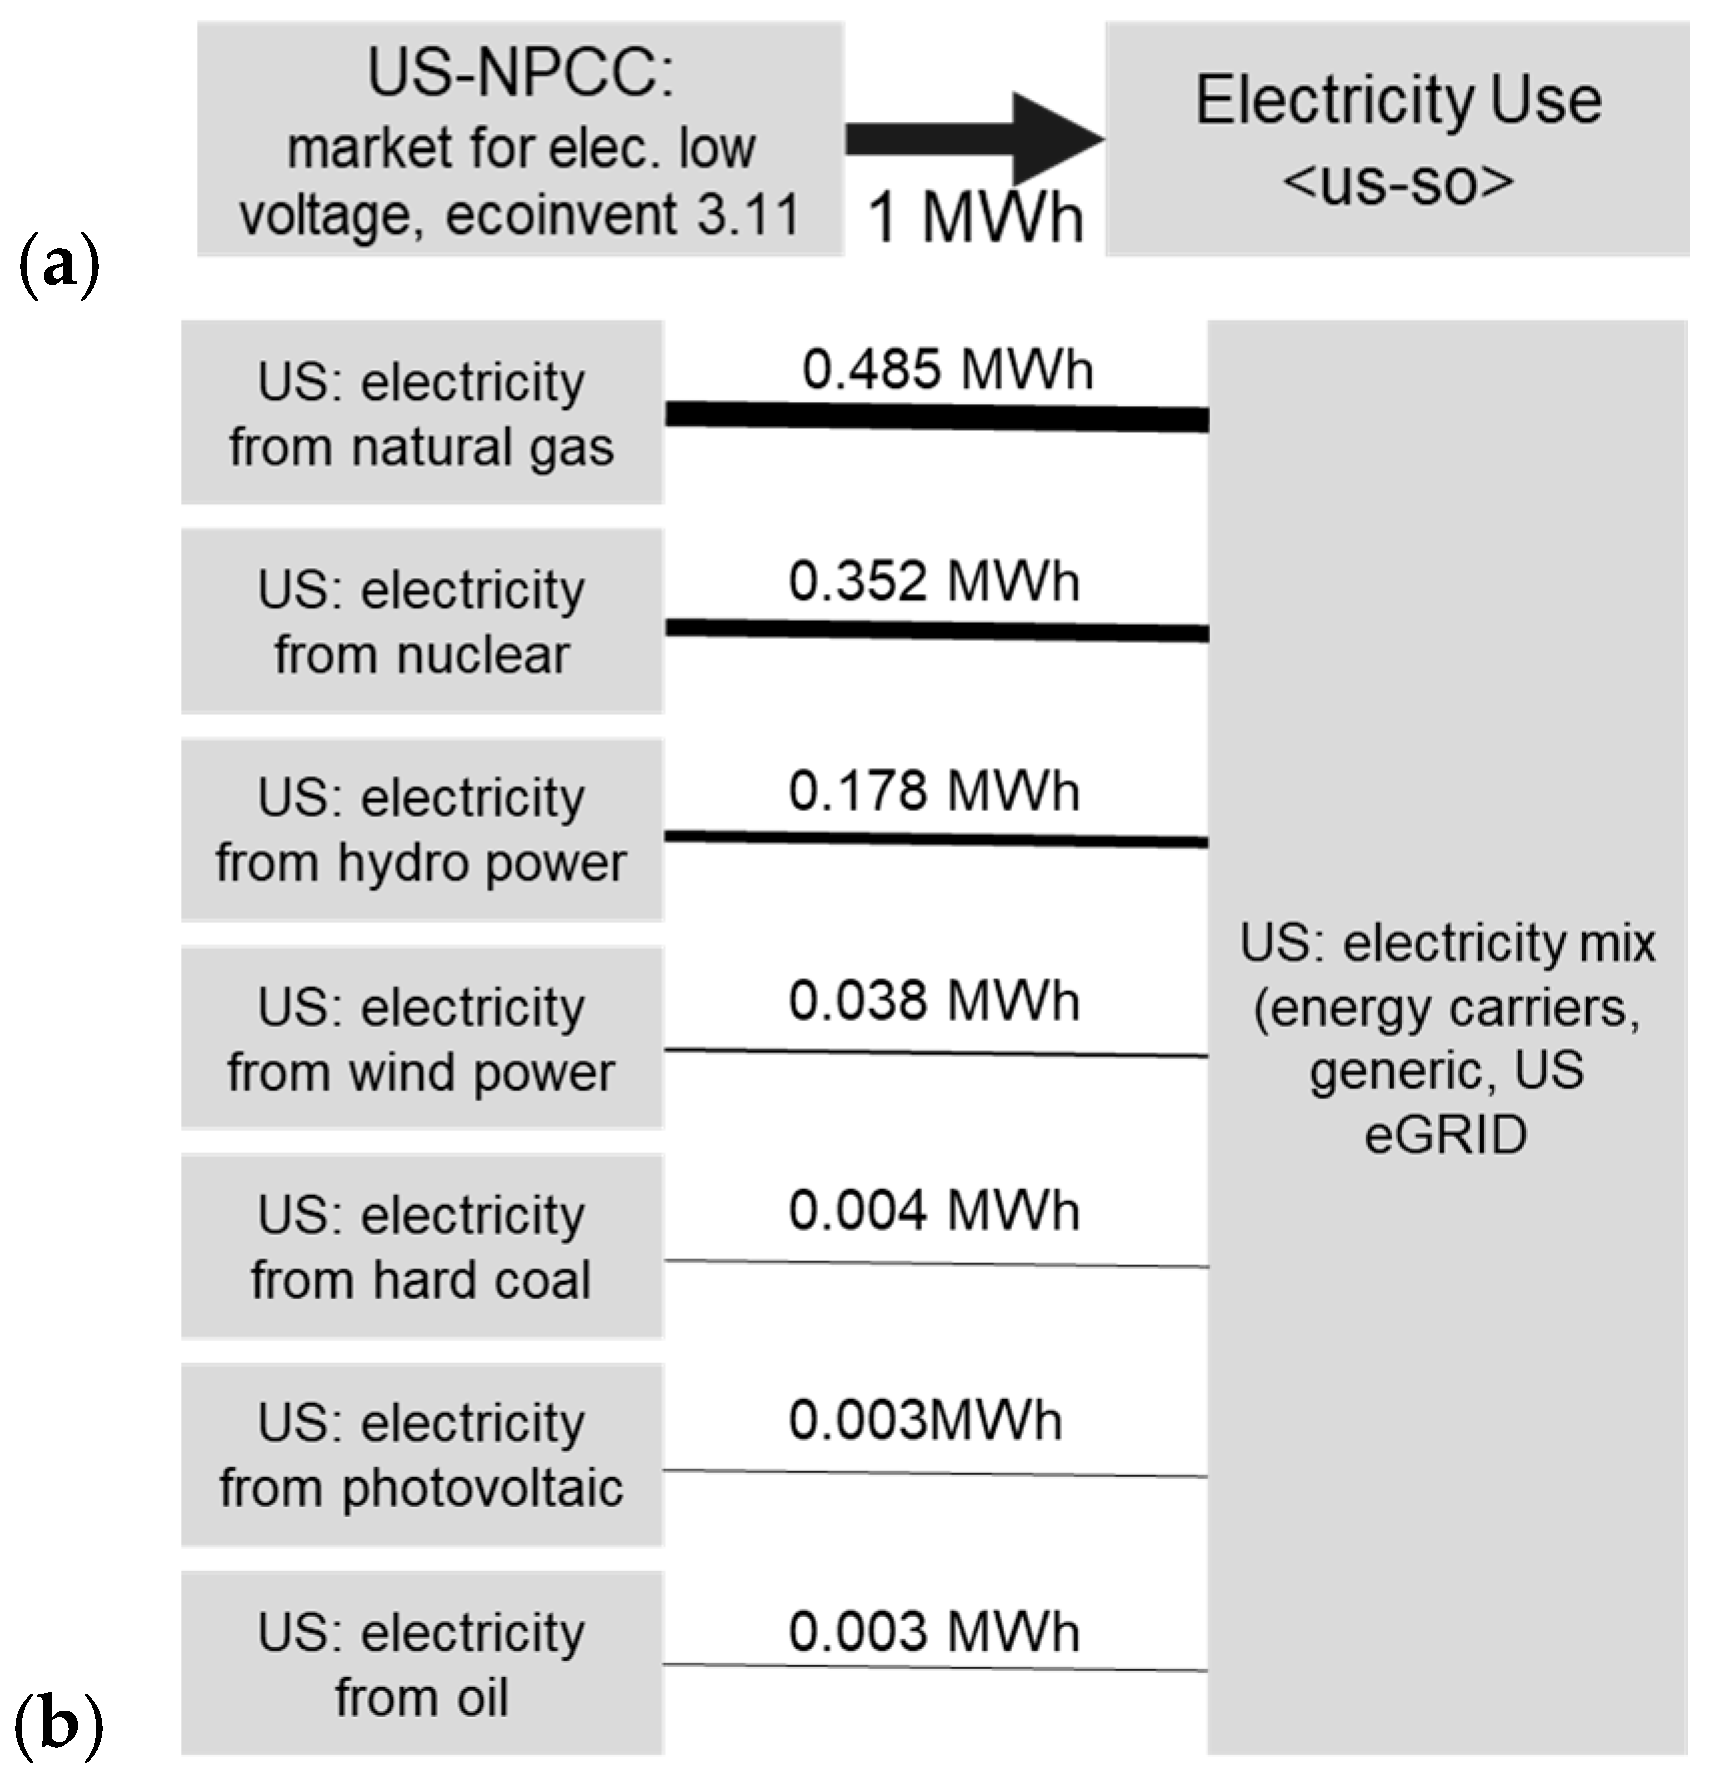
Electricity life cycle datasets differ significantly in structure and transparency. Figure 1 illustrates the relevant Ecoinvent and Sphera database models for the NPCC electricity mix, both of which are commonly used in LCA studies. The Ecoinvent dataset is often referred to as a “black box” because the specific technology shares used to produce electricity are not easily determined. Instead, it aggregates upstream processes and infrastructure burdens into a single market process, limiting the user’s ability to understand, customize, or align the electricity mix with specific scenarios. This lack of flexibility poses challenges for prospective LCA, where forward-looking energy projections are critical.
The Sphera (formerly GaBi) dataset (ver. 2024.2) for the United States uses a modular structure, where each electricity generation technology is represented as a separate input to a central mixing process. Users can adjust the contribution of each technology based on regional data or future scenarios, allowing for more transparent and scenario-adaptable modeling. While the Sphera dataset provides greater flexibility compared to Ecoinvent’s aggregated markets, it still relies on internally developed datasets that are not always fully documented or externally verifiable. Both approaches have strengths and limitations, but the ability to control technology shares is particularly important when electricity is a major driver of life-cycle impacts, as is the case in many prospective and energy-intensive assessments.

1.3. Research Objectives and Scope

To guide the analysis, this study is anchored in the overarching goal of developing an electricity LCA model that is transparent (e.g., system boundaries, capacity to trace specific activities that contribute to the impacts), adaptable to future scenarios, and representative of the NPCC region. This is critical for evaluating the overall impacts of a decarbonized grid that includes climate benefits but also considers other sustainability consequences. Building on this goal, three specific objectives are defined:
  • Compare the results of 2022 electricity supply and distribution LCA models from different inventory databases and lifecycle impact methods to assess the causes and consequences of their structural assumptions.
  • Integrate temporal electricity scenarios for 2022 and 2040 in the NPCC region, highlighting the value of electricity LCA modeling that includes variable technology shares.
  • Explore the practical implications of database selection and scenario modeling on lifecycle environmental impacts through a case study of residential heating electrification.
Together, these research objectives establish a framework for isolating database and impact assessment differences, testing them under decarbonization scenarios, and demonstrating their influence in a decision-relevant context. This work culminates in best-practice guidance and recommendations for electricity modeling in prospective LCA.
The LCA work is presented in two primary sections. The first evaluates the variability in LCA results for the 2022 NPCC electricity mix as a function of LCI database and LCIA method selection. The second drills down on just two of the database options to assess the importance of that selection when a sustainable energy future is expected, including grid decarbonization (2040) and households electrifying their heating systems with heat pump technologies.

2. Methods

2.1. LCI Database and LCIA Method Comparison for the 2022 NPCC Electricity Grid

2.1.1. Scope and System Boundary

The analysis centers on the electricity supply used to deliver 1 MWh of electricity in the Northeast U.S.A. (New England and New York). Upstream generation is therefore greater than 1 MWh to cover T&D and transformer losses. The system boundary is cradle-to-grave, including the fuel production, electricity generation, transmission, and distribution of electricity to any potential user, and the end of life of the electricity infrastructure.
The subregion-level electricity generation mixes were obtained from the U.S. EPA’s eGRID [22] database for New England (NEWE), New York City and Westchester County (NYCW), New York Upstate (NYUP), and New York Long Island (NYLI). These were combined using weighted averages based on net generation (MWh) in each sub-region to produce NPCC-wide mixes that reflect actual historical conditions. Detailed input data and calculation methods are provided in Supplementary Materials (SM), Supplementary S1.
The LCA modeling was performed using the Sphera LCA Software Platform (formerly GaBi) (Ver. 2024-2) (Chicago, IL, USA), coupled with four different LCI databases (Section 2.1.2), and two impact assessment (LCIA) methods—ReCiPe 2016 Midpoint (Hierarchical) and TRACI 2.1. ReCiPe is widely used in scholarly LCA research and provides global methods and considerations for impact categories and models used to estimate characterization and normalization factors. TRACI was developed by the US EPA with a more targeted approach that is relevant for the Northeast USA geography considered in this study. The use of multiple LCI datasets and LCIA methods enabled comparison of results essential for the first research objective.
To facilitate visual comparison across impact categories and databases that have different units and variability in values over orders of magnitude, results were expressed on a relative scale equal to the method’s actual value for an impact category divided by the maximum of the three LCI databases used.

2.1.2. Inventory Dataset Selection and Customized Model Construction

Three database approaches were considered (Ecoinvent (Zurich, Switzerland), Sphera, and a customized Ecoinvent-based model).
  • Ecoinvent 3.11 Default (NPCC electricity datasets) focuses on the Northeast Power Coordinating Council (NPCC) US-only region, defined as the “market for electricity, low voltage 2022” dataset. This dataset aggregates the entire electricity generation system into a single, comprehensive model. It functions as a “black box,” providing a regionalized electricity mix without directly disclosing explicit technology shares (Figure 1a) [23]. This is defined as the Ecoinvent default dataset throughout this paper.
  • Sphera U.S. electricity datasets include a customizable U.S. electricity supply model, allowing for technology shares to be adjusted according to user input based on region and year (Figure 1b). For the baseline analysis, data from eGRID U.S. EPA [22] for the Northeast US region for 2022 were used as input for the technology shares.
  • A customized electricity model (Ecoinvent 3.11-based) was developed for this study to address limitations in both Sphera and Ecoinvent datasets. It was built from Ecoinvent inventories for individual components of the electricity system, which enabled scenario-based analysis by allowing adjustment of technology shares over time and explicitly incorporates infrastructure impacts based on region-specific data (Figure 2). For the customized model, each electricity generation technology (gas, nuclear, hydro, wind, solar, etc.) was modeled as an individual unit process, which feeds into a centralized mixing process where generation shares can be flexibly adjusted via global parameters. Grid infrastructure and losses were also integrated. This architecture enables scenario testing for future years and differentiates between modeling assumptions across datasets.
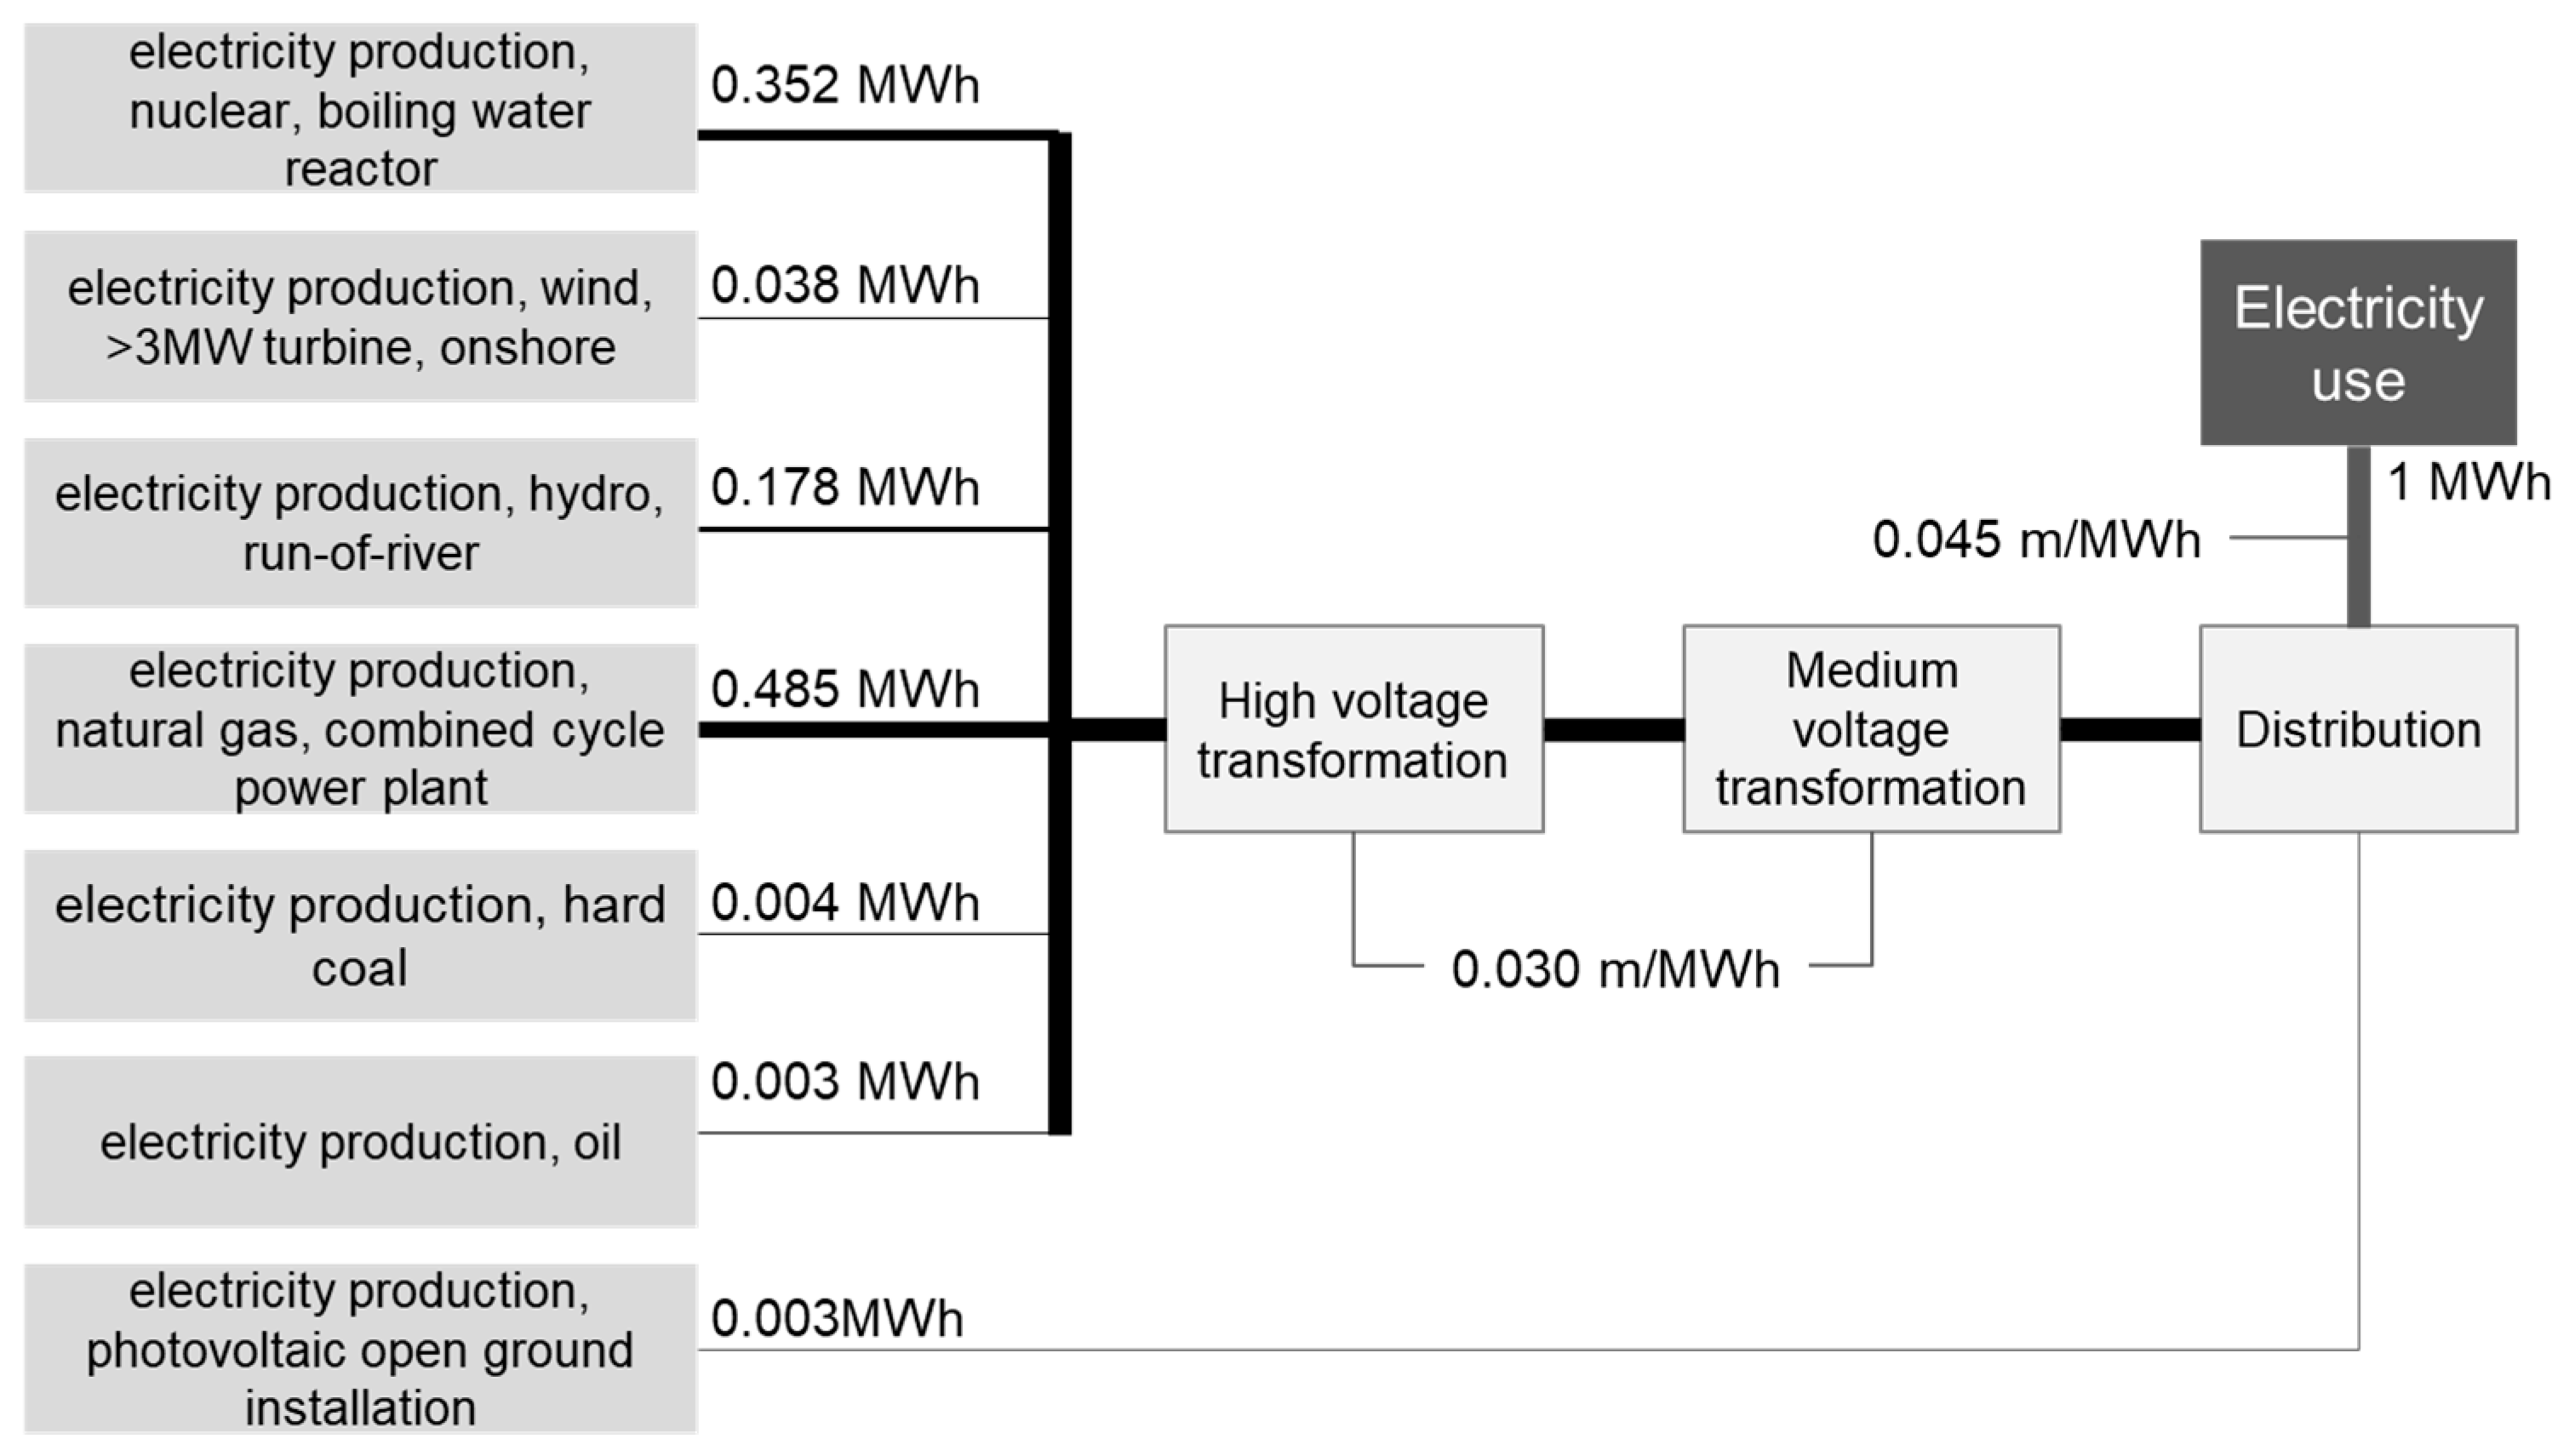
Figure 2. Customized electricity model for the NPCC region (2022) developed in the Sphera LCA platform using Ecoinvent 3.11 unit processes (see also Supplementary Materials, Supplementary S2). Each box represents an individual electricity generation or infrastructure process contributing to the delivery of 1 MWh of electricity at low voltage. Generation technologies are combined in a central mixing process with shares that can be flexibly adjusted. Values shown on the left represent gross electricity generation (MWh) prior to transmission and distribution losses (assumed 6%). Values associated with transmission and distribution represent normalized infrastructure intensities (m/MWh), which are linked to the Ecoinvent processes “electricity transmission network construction, high voltage–US” and “electricity distribution network construction, low voltage–US”.
Sustainability 18 02263 g002
Infrastructure burdens were included by calculating average transmission and distribution grid lengths per unit of delivered electricity (m/MWh) for the NPCC region. These quantities are the LCI input required for Ecoinvent’s electricity transformation and distribution datasets used to create the customized model. Transmission grid length was treated as a single regional average, based on total high-voltage line lengths reported by the Independent System Operator for New England (ISO-NE) and New York Independent System Operator (NYISO), divided by total annual NPCC electricity consumption [6,24,25,26]. We assumed a 40-year lifetime for high-voltage transmission and distribution assets, consistent with typical planning horizons and asset-life estimates reported for North American transmission infrastructure [4]. The distribution grid length was estimated using a weighted average approach that combines state-level electricity consumption data with utility-reported distribution network lengths (details in Supplementary Materials, Supplementary S2).
All results are reported per 1 MWh delivered (low voltage) to a customer. The Ecoinvent default dataset (Figure 1a) already represents delivered electricity with T&D embodied. The Sphera electricity mix dataset was configured so that the mixing node feeds a low-voltage “use” process equal to 1 MWh delivered; upstream generation equals 1.0638 MWh to account for losses through T&D. In the customized model, the technologies (Figure 2) were proportionally rescaled so their gross generation sums to 1.0638 MWh, thereby absorbing both the unaccounted “other” share and the modeled losses. Quantitative results elsewhere in the paper remain expressed per 1 MWh delivered.
The three database options considered were analyzed to identify differences in modeling assumptions, including treatment of upstream processes and downstream activities. Upstream and downstream data for Ecoinvent inventory datasets were obtained through their database repository “ecoQuery” from Ecoinvent Association [23], while Sphera datasets were analyzed using the Sphera Documentation Portal from Sphera Solution [17]. EcoQuery provides detailed documentation for each dataset, including inputs, emissions, upstream supply chains, and modeling assumptions. The Sphera Database Documentation offers metadata and summaries for its datasets used in the Sphera LCA platform. While less granular than ecoQuery, it outlines key assumptions for each process, including technology configurations and regional applicability.

2.2. Case Study: Implications of LCI Database Selection for Electrification and Grid Decarbonization

This case study was designed to demonstrate the practical implications of different electricity modeling approaches and future scenario assumptions in LCA modeling. Heating was selected as an illustrative example because it represents a major end-use sector where electrification—especially via heat pumps—is increasingly promoted as a key decarbonization strategy [7,27,28].
The year 2040 was selected for a prospective decarbonization scenario based on renewable energy goals in the NPCC region. The electricity mix was constructed by combining technology-share projections for New York State [29] and New England [25], weighting shares by projected net generation to produce a single NPCC mix that is consistent with the region’s planned deep decarbonization pathways (~6% natural gas, 15% nuclear, 22% hydro, and 55% solar and wind) (Supplementary Materials, Supplementary S1).
The functional unit is defined as 73,850 MJ of useful thermal energy, representing the average winter heating demand of a typical household in the NPCC region [30,31]. The principal inputs used in the life cycle inventory are described in the Supplementary Materials (Supplementary S3).
LCA models used two inventory databases for comparison: the customized electricity model built with Ecoinvent 3.11 and the Sphera database. Only the ReCiPe LCIA method was used for this analysis to allow for a focus on the decarbonization and electrification implications.
The heat pump model used the datasets “electric heat pump (air-water) 10 kW” for Sphera and “heat pump production, 30 kW–RoW (R134a)” (Rest of World) for Ecoinvent. Dataset availability required different nominal capacities (Sphera dataset: 10 kW; Ecoinvent: 30 kW). To make contributions comparable, capital-goods inventories are scaled by lifetime service (252,000 kWh over 20 years [32]), yielding 0.0812 units per FU (Supplementary Materials, Supplementary S3). This approach standardizes results per unit of useful heat and minimizes capacity effects; it does not eliminate them entirely, because the 10 kW and 30 kW production datasets may differ in materials intensity per kW and other design features.
The heat pump inventory datasets were modeled without the consumer use stage so that we could use the electricity models defined here to model the energy input. The output also included refrigerant leakage during use. Further details on data sources and parameter values are provided in the Supplementary Materials (Supplementary S3).
This case study demonstrates how the selection of LCA databases and electricity mix scenarios influences the environmental assessment of residential heating technologies. The heat pump (HP) technologies are assumed not to change over time; these comparisons look solely at the effects of a decarbonized electricity system.
These results and analyses can be used for four comparative analyses and research questions:
  • How do the projections for the heat pumps change over time?
  • How do these values and changes for the HPs compare between the two inventory databases considered?
  • What stage in the lifecycle contributes most to the impacts?
  • Does the comparison or identification of the least impactful solution depend on the inventory database used?

3. Results and Discussion

3.1. Comparison of the LCI Database and LCIA Methods for 2022

This section presents a comparison of electricity supply modeling for the year 2022, including results from the Sphera electricity inventory dataset, the Ecoinvent default dataset, and the customized NPCC model developed in this study using individual Ecoinvent 3.11 processes.
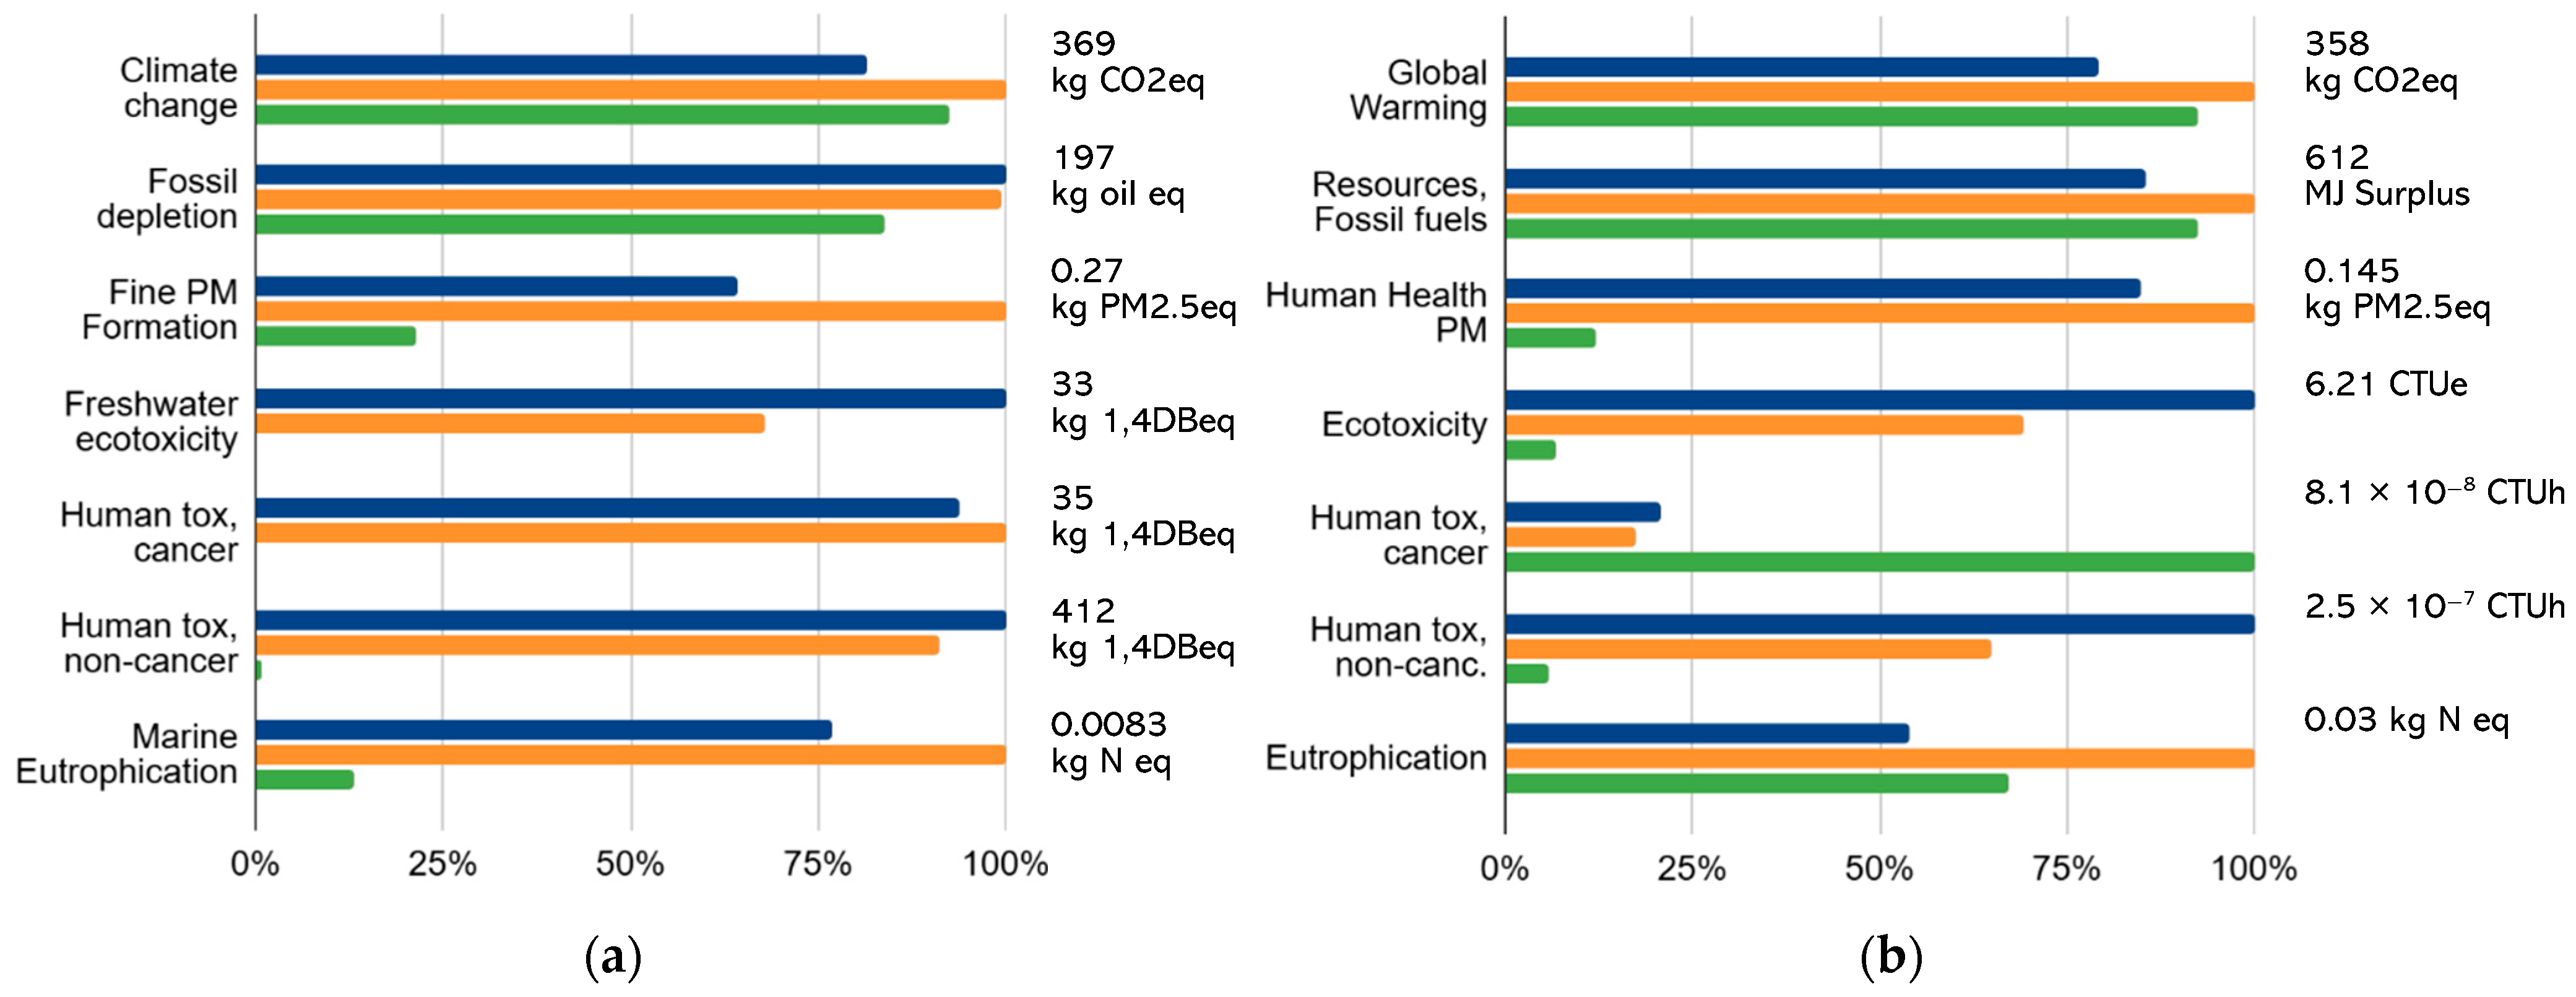
Figure 3 shows the LCIA results using two different impact methodologies, scaled to the highest value of each impact category. The scaled value was calculated separately for the two LCIA methods considered. The comparison focuses on seven impact categories that are comparable between the two LCIA methods. Other impact categories were also assessed, with full results in Supplementary Materials, Supplementary S4.
As has been reported in previous studies (e.g., [1,33]), climate change and energy use results tend to be relatively consistent across all three electricity datasets (within ~20%), whereas larger discrepancies are often observed in toxicity-related categories. As described below, explanations for these differences were explored through literature and documentation of the basic assumptions used to develop the datasets considered in this study.
ReCiPe’s toxicity-related LCIA categories present the greatest divergence between the three datasets. Specifically, the Ecoinvent default dataset shows toxicity impacts that are several orders of magnitude higher than those in the Sphera dataset. For example, freshwater ecotoxicity is approximately 1300 times higher when the Ecoinvent default inventory dataset was used, and human toxicity (cancer) is over 300 times higher.
To verify the robustness of the findings, the same analysis was repeated using the TRACI 2.1 method (Figure 3b), which was developed with a U.S. perspective. Results confirm the same overall conclusions as with ReCiPe 2016 for several categories: climate change and fossil resource depletion impacts remain relatively consistent across databases, with differences typically within 20–30%. As shown with the ReCiPe LCIA, TRACI’s toxicity-related categories exhibit the largest discrepancies, with Ecoinvent-based electricity models yielding values that are approximately 15–20 higher than for the Sphera data set for ecotoxicity and non-cancer human toxicity indicators.
An important exception is human toxicity (cancer), for which the Sphera database produces a five times higher value than the Ecoinvent-based models under TRACI 2.1. This result contrasts with the pattern observed using ReCiPe 2016 and reflects differences in LCIA characterization and database structure rather than inconsistencies in the underlying electricity generation technologies. TRACI places greater weight on specific carcinogenic emissions relevant to U.S.-based fuel production and industrial processes, which appear to be more prominently represented in the Sphera dataset U.S.-focused inventories. In contrast, the extremely high toxicity values in Ecoinvent are driven primarily by metal-related emissions (notably copper, details below) that strongly influence ReCiPe results but have a different relative importance under TRACI. These findings demonstrate that both inventory database structure and LCIA method selection can substantially influence toxicity-related outcomes.
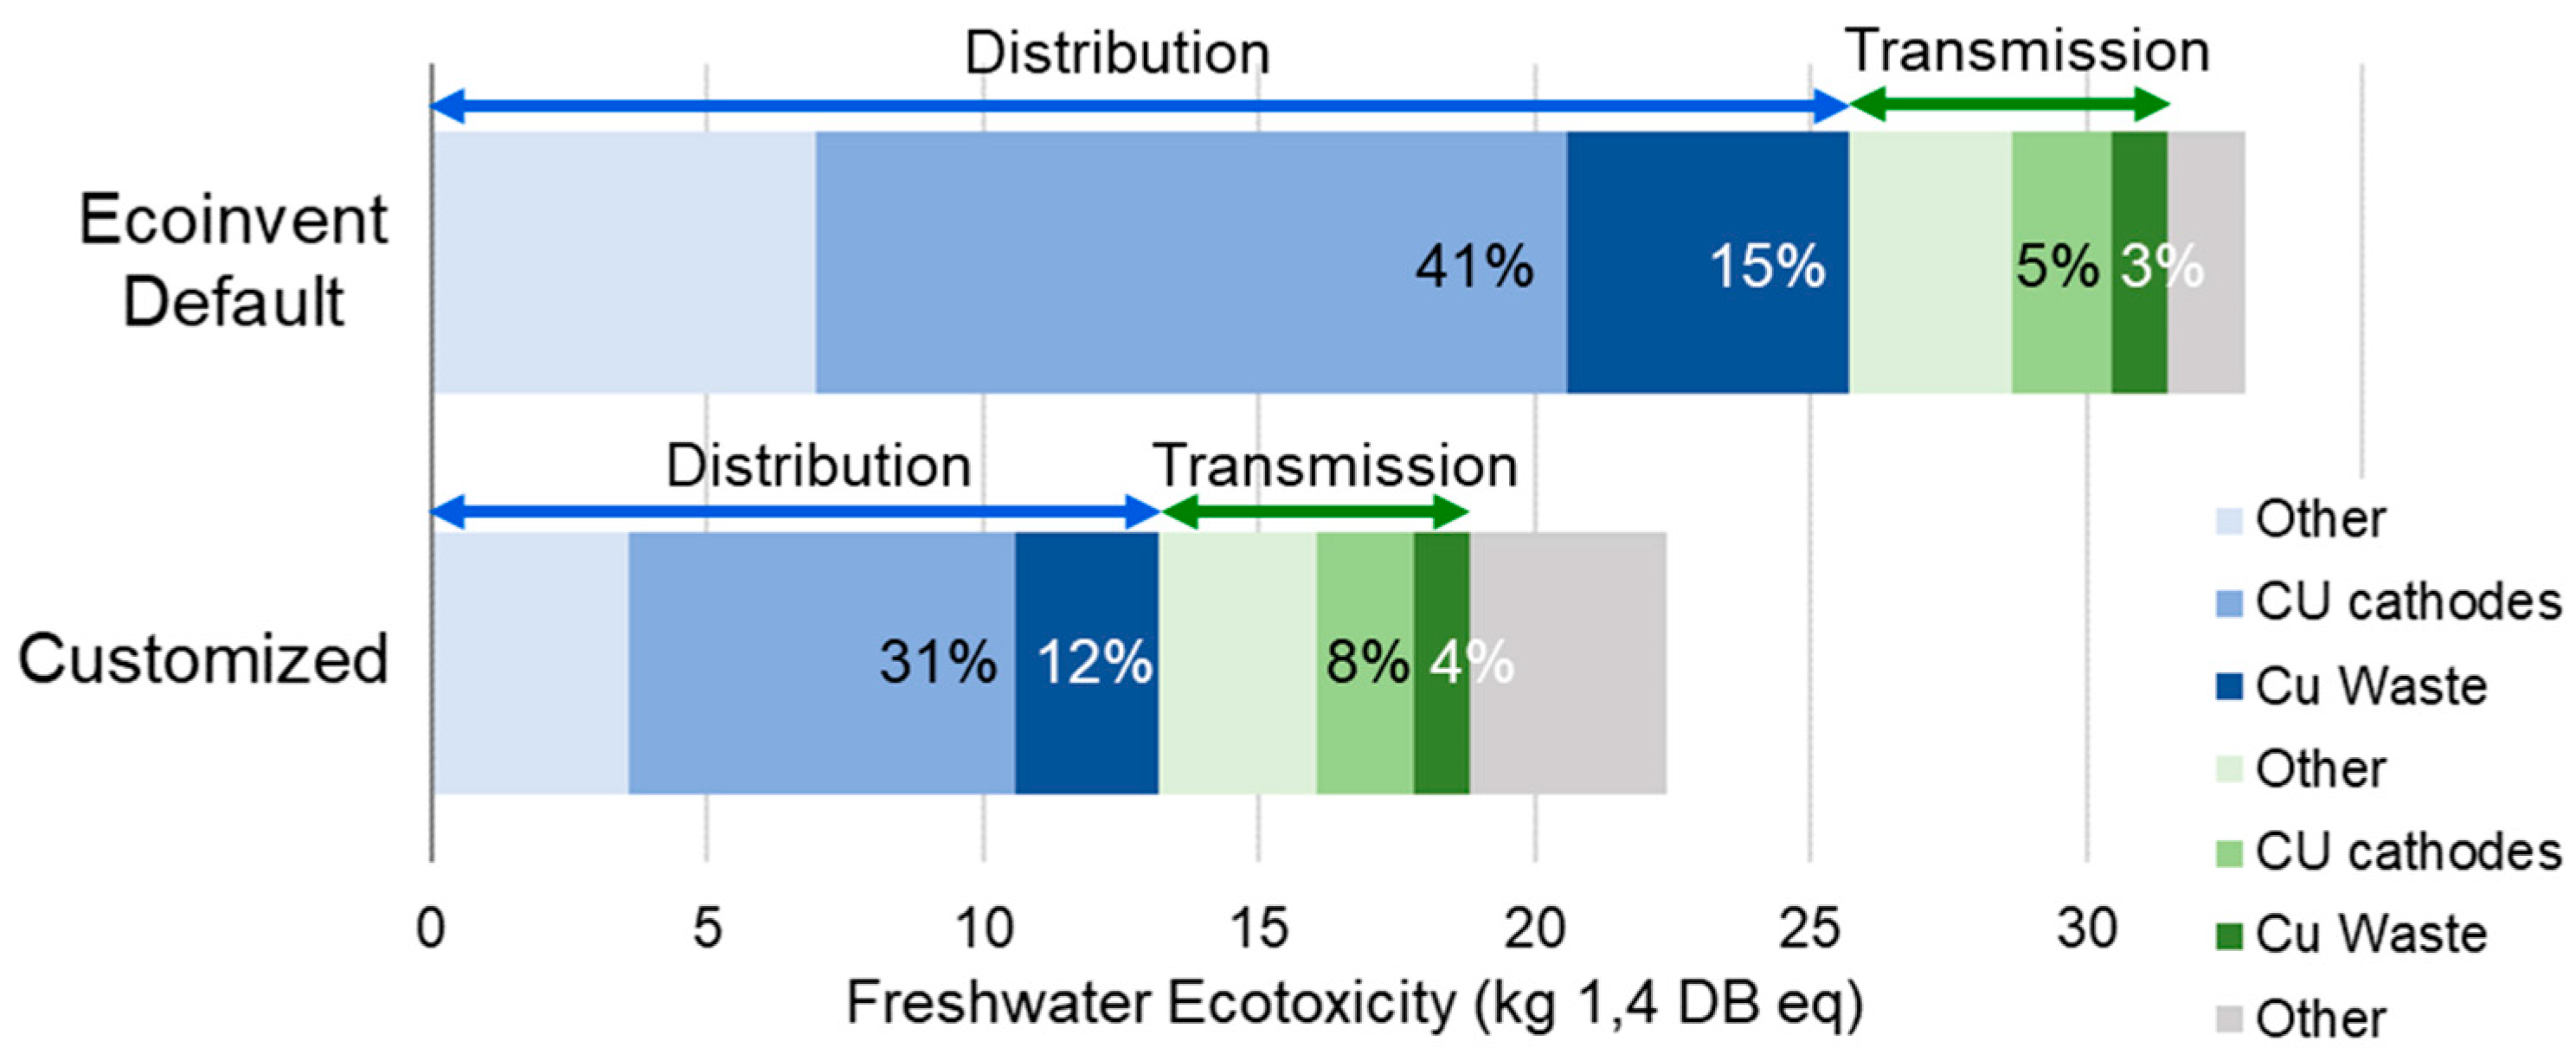
These results suggest the need for a deeper investigation into the processes driving toxicity-related impacts in each dataset. A detailed contribution analysis of the ReCiPe results was conducted using Sphera’s internal documentation [17] and the ecoQuery platform for Ecoinvent datasets [16]. With ecoQuery, it was possible to trace specific upstream emissions contributing to each toxicity impact category (Figure 4).
The analysis revealed that the use of copper in electricity infrastructure dominates the ecotoxicity impacts (64% of the Ecoinvent default and 55% of the customized model). Copper contributions are associated with its use in cathodes and the end-of-life waste management of the copper infrastructure.
In Ecoinvent, the default assumes that copper from both the T&D networks at the end of its life is sent to an average municipal solid waste incinerator in Switzerland (2010 reference year), with only partial recycling [33]. This assumption reflects a European waste management context, where incineration plays a larger role in handling mixed waste streams [16]. However, it is not representative of conditions in the U.S. NPCC region, where copper is consistently recovered and recycled due to its high economic value [34,35]. The primary use of aluminum for transmission wires results in smaller contributions of this component of the electricity infrastructure to the toxicity impact categories compared with the distribution system.
The customized electricity model developed in this study still incorporates background infrastructure processes from Ecoinvent and its assumptions for copper use and incineration. However, as shown in Figure 4, by using NPCC region-specific information for the length of transmission and distribution grid infrastructure (Supplementary Materials Supplementary S2), the waste-copper incineration to freshwater toxicity is reduced, especially for the distribution network. Deleting this contribution was considered, though inventory information for an alternative recycling process was not readily available. Thus, this process within the Ecoinvent T&D inventories was included in our analysis, but clearly labeled as a contribution with significant uncertainty.
A corresponding contribution analysis could not be performed for the Sphera electricity datasets because the Sphera documentation does not provide process-level or material-specific breakdowns for upstream emissions and infrastructure components. While Sphera reports aggregated impacts by electricity generation technology and region, it does not disclose detailed inventories for individual materials (e.g., copper cathodes, copper waste flows) or their end-of-life treatment within the transmission and distribution network. As a result, it is not possible to decompose toxicity-related impacts associated with the Sphera dataset in a manner comparable to the EcoQuery-based analysis conducted for Ecoinvent. This limitation means that the lower toxicity values reported with the use of the Sphera dataset cannot be attributed to specific modeling choices or emission pathways, but instead reflect the higher level of aggregation and reduced transparency of its background datasets.
These general findings are consistent with trends reported in previous comparative LCA studies on electricity supply, though the specific contribution of copper to the toxicity scores has not been previously identified. For example, Mendoza Beltran et al. [1] and Tschümperlin et al. [36] both observed that the choice of database and the treatment of upstream processes can lead to large discrepancies in toxicity-related categories, while climate change and fossil depletion results tend to be more stable across datasets. The lower toxicity values with the Sphera dataset align with the observations by Wernet et al. [33], who found that simplification of upstream inventories, exclusion of certain emissions, and reliance on modern technology averages generally reduce toxicity indicators in Sphera datasets. This convergence with established literature reinforces the robustness of the present results and their added value, which identifies the specific reason for the significant differences in the toxicity impacts and the realization that these high scores might not be relevant for all LCA studies. Thus, this supports the conclusion that database structure and embedded assumptions are key drivers of variability in LCA outcomes for electricity supply.

3.2. Electricity Mix Projections (2022–2040) and Implications for Heating Electrification

This case study demonstrates how the selection of an LCI database and electricity mix influences the interpretation of environmental impacts as the electrification of our heating systems is implemented.
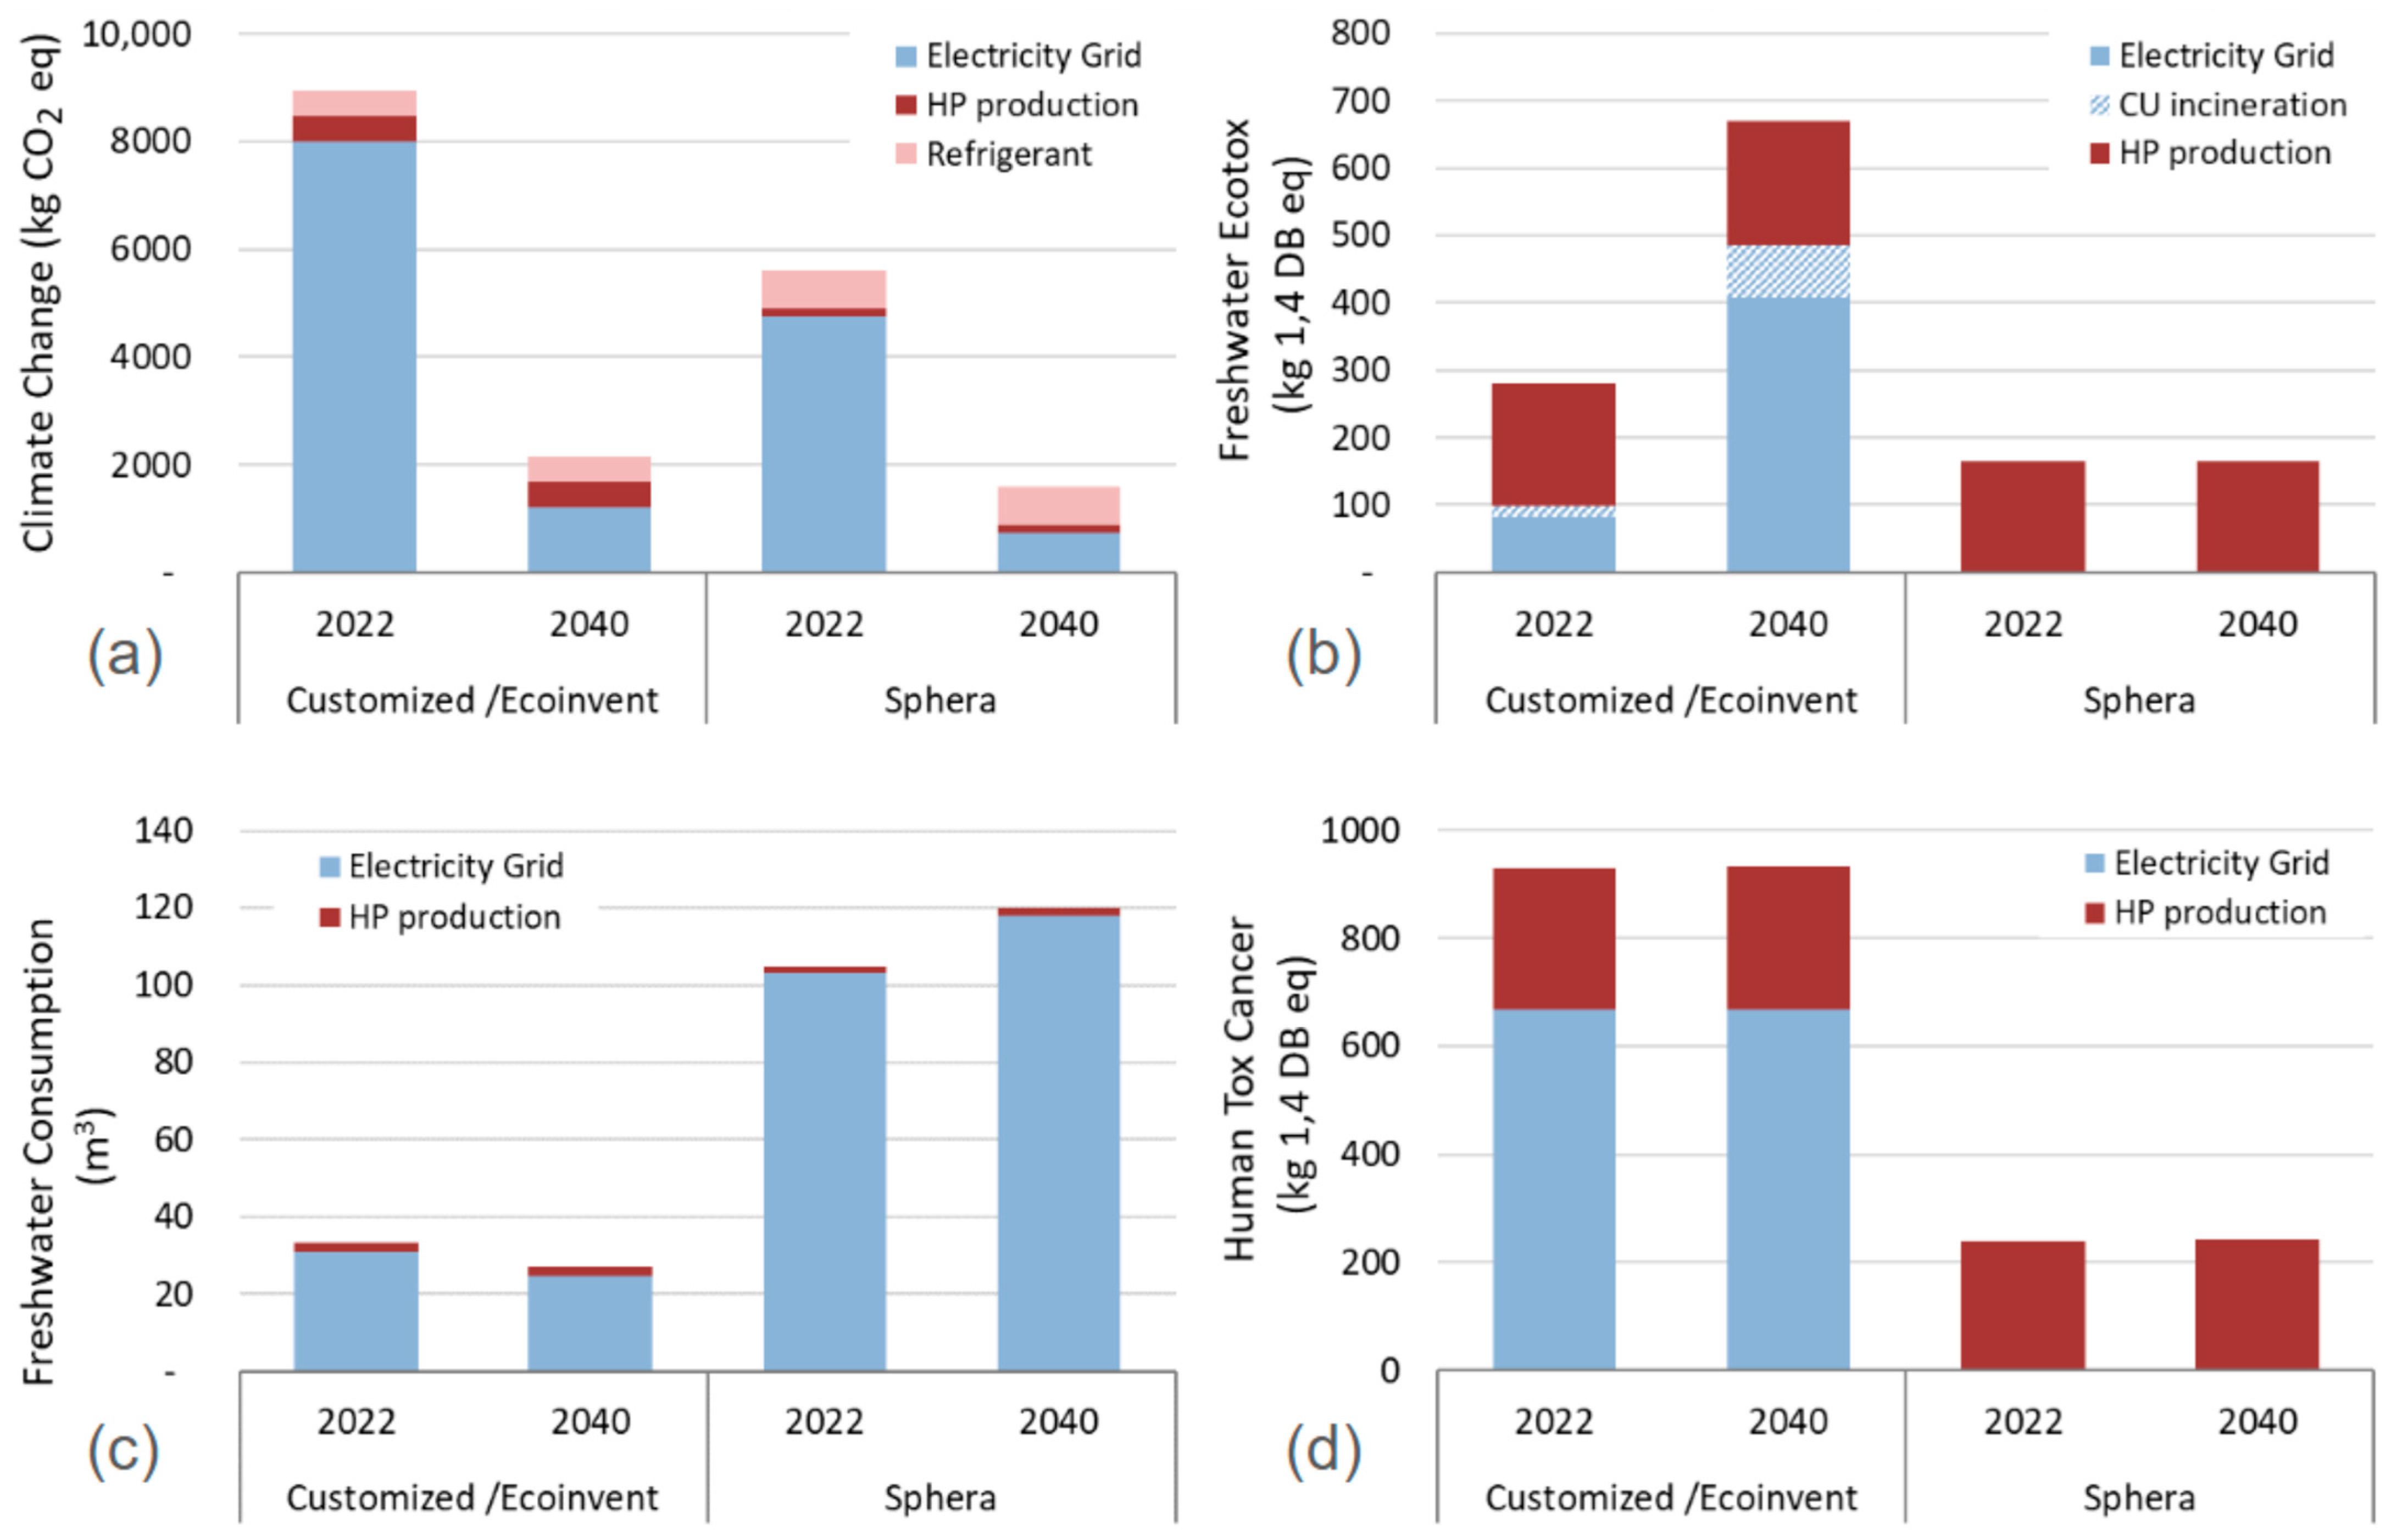
Both inventory databases project that the impacts of the heat pump system on climate change databases decrease markedly (~72–76%) from 2022 to 2040 (Table 1). Sphera estimates are lower (~30–40%) than the customized model for both years. For both datasets, climate impacts are dominated by electricity consumption. Refrigerant leakage, which is assumed to remain constant and is comparable between the years, makes up a relatively small fraction in 2022 (5%), but as CO2 emissions are reduced, the contribution of the refrigerant becomes increasingly important (22%) (Figure 5a). These trends in climate change were expected based on much lower reliance on fossil fuels for electricity (44% in 2022 and 6% in 2040) (Supplementary Materials, Supplementary S1). Similarly, other impact categories that are dominated by fossil fuel combustion are also projected to decrease between 2022 and 2040 (Table 1, e.g., PM10 formation, acidification, O3 formation, and depletion).
Patterns in the relative values for many of the impact categories vary substantially between years, relative contributions of the electric grid versus the heat pump production, and inventory databases (Figure 5). The primary differences are associated with the electric grid (blue bars), not with the modeling of the heat pump production. HP impacts are quite similar regardless of the inventory, with Ecoinvent results consistently 11% higher than the Sphera dataset.
There are pronounced differences in the trade-offs and conclusions drawn regarding increased use of heat pumps under a decarbonized electricity grid, depending on the inventory database used. For climate change, both modeling approaches show large reductions in impacts between 2022 and 2040 (72–77%), reflecting the declining carbon intensity of electricity supply in the NPCC region (Table 1, Figure 5a).
In contrast, freshwater ecotoxicity exhibits diverging trends across databases. Under the customized/Ecoinvent-based model, freshwater ecotoxicity increases between 2022 and 2040 by approximately 130%, primarily due to copper use in the electricity grid infrastructure, even when copper incineration (~5% in 2022, 12% in 2040) is discounted. For 2022, the HP production dominates the overall toxicity score (67%). Over time, with the increased use of copper in the generation of renewables and the associated grid infrastructure, and increased ecotoxicity impacts, the contribution of copper to the overall ecotoxicity score drops to 27%. In the Sphera LCI dataset model, freshwater ecotoxicity associated with electricity is negligible. As discussed above, the system boundaries in the Sphera dataset are interpreted to be less inclusive of upstream components of the electricity system than the Ecoinvent datasets, particularly for the T&D components.
The two databases generate similar results for the HP production (Sphera is 10% lower). A detailed attribution analysis with ecoQuery showed that the Ecoinvent impacts for the HP are dominated by the copper cathode production (94.7%), with a split between electrorefining of the anode and copper production of the cathode, including solvent extraction for the process. The Sphera database documentation and results are not transparent enough to allow a similar breakdown.
The high contribution from the HP production phase with current electricity generation mixes is consistent with previous LCAs of heating systems. Lin et al. [32] found that manufacturing contributed to 50% of human toxicity and 66% of metal depletion impacts, due to the use of copper and electronic components. In their study, copper was modeled explicitly as a material input and linked to Ecoinvent v3 background datasets for copper production. Likewise, in their comprehensive review, Aridi et al. [37] reported that 40–70% of metal-depletion and toxicity burdens across heat-pump LCAs came from upstream metal production, particularly copper and aluminum, but they primarily discussed these metals in the context of resource depletion and land-use impacts.
For freshwater consumption, the customized model predicts a modest decrease (−19%) between 2022 and 2040, while the Sphera model predicts an increase of approximately 14%, with differences driven entirely by the electricity supply rather than heat pump production (Figure 5c). Water use in the electricity production and generation stages of the lifecycle is expected to decrease with increased percentages of solar and wind generation [38], so the results from the Ecoinvent datasets seem to be more consistent with the literature.
Human toxicity (cancer) shows similar contributions from heat pump production across databases but substantially higher contributions from electricity in the customized model compared with the Sphera dataset (~4×). These values exhibit little variation across the decarbonization scenarios, indicating that changes in the electricity generation mix do not strongly influence this category under either modeling approach (Figure 5d).
Collectively, these results indicate that conclusions about the environmental trade-offs of heat pump deployment under grid decarbonization are strongly contingent on how electricity is modeled. While both databases consistently show large climate change benefits from decarbonization, non-climate impact categories respond very differently depending on inventory structure and background assumptions. In the customized/Ecoinvent-based model, electricity infrastructure becomes a dominant contributor to freshwater ecotoxicity and human toxicity, suggesting potential burden shifting toward material- and infrastructure-related impacts as the grid evolves. In contrast, the model built with the Sphera dataset attributes most non-climate impacts to heat pump production, effectively decoupling these categories from changes in the electricity mix.
Some of these differences align with our prior findings (Figure 3) that Ecoinvent often reports higher toxicity-related impacts due to broader inclusion of upstream emissions and waste flows related to the end of life of the electric grid infrastructure, especially the use of copper, while Sphera’s streamlining of background datasets leads to lower toxicity indicators [33]. If TRACI had been used as an LCIA method instead of ReCiPe, then we would expect much higher scores for the electric grid for the human toxicity cancer impact (Figure 3), which could substantially change the conclusions for this category.
Another important contribution of the work presented here lies in the analytical approach used to interpret toxicity results from pre-aggregated datasets. While studies such as Lin et al. [32] could readily attribute toxicity and metal-depletion impacts to copper because this material was explicitly included in their foreground inventory, LCAs that rely on generic database inventories usually do not have that transparency. Here, a detailed contribution analysis was performed using EcoQuery to decompose the background processes and identify the dominant contributors. Such breakdown analyses are rarely reported in the literature but are essential for correctly interpreting toxicity categories and for distinguishing genuine technological effects from database-structural artifacts.

3.3. Overall Discussion and Implications

From a climate perspective, the evidence strongly supports the transition to electric heating. However, when other sustainability impacts are introduced into the evaluation, the conclusions of the relative impacts depend on the specific LCA database and LCIA method employed. These results underscore that neither database provides a definitive account of toxicity outcomes for electrified systems.
Interpretation of toxicity-related impact categories is subject to substantial uncertainty due to both inventory structure and life cycle impact assessment (LCIA) method implementation. In the Ecoinvent-based models, freshwater ecotoxicity and human toxicity impacts are dominated by upstream metal production and end-of-life assumptions for electricity infrastructure, particularly copper. The default assumption that copper from transmission and distribution networks is partially incinerated at the end of life, based on European waste management practices, likely overestimates emissions relative to conditions in the NPCC region, where copper is typically recovered and recycled. These assumptions, therefore, represent a conservative or upper-bound estimate rather than a regionally representative value.
In contrast, the Sphera electricity datasets rely on more aggregated background inventories with limited transparency into material-specific and upstream emission pathways. This aggregation may reduce reported toxicity values when certain emissions or life cycle stages are simplified or excluded. However, under the TRACI 2.1 method, use of the Sphera database generates results that exhibit higher human toxicity (cancer) impacts than the Ecoinvent-based models, an outcome that differs from the pattern observed for ReCiPe 2016. This anomalous result likely reflects differences in pollutant coverage and characterization factors between LCIA methods, as well as database-specific representation of U.S.-relevant emission pathways. Because process-level contribution analysis is not accessible for Sphera datasets, these effects cannot be fully decomposed. Overall, these findings highlight that toxicity indicators for electricity systems are highly sensitive to database structure, documentation depth, and LCIA method choice, and should therefore be interpreted cautiously and in conjunction with cross-database sensitivity analysis.
Even though there is evidence in the literature that increasing shares of renewable energy may shift burdens toward toxicity-related impact categories, these results should be interpreted with caution. The results of this study have noted that toxicity indicators are not always consistently represented across databases and may suffer from methodological limitations or irrelevant underlying assumptions [1,12,36], including the incineration of copper, which was identified here as less relevant in a U.S.A. context. As a result, it remains unclear whether the observed increase in toxicity impacts under scenarios with a high penetration of renewable generation reflects actual technological characteristics or whether it is partly an artifact of inventory database assumptions.
LCA practitioners must make their database choice transparent and analysis thorough, as non-climate conclusions can change direction depending on which inventory database and LCIA method are used. In our results, climate-change impacts track similarly in both databases and decline from 2022 to 2040, but several non-climate outcomes diverge, potentially changing overall LCA conclusions and resulting decisions. Rather than recommending one dataset over the other, the contrast highlights the need for transparency in and thorough understanding of database assumptions and the application of scenario-flexible electricity modeling to ensure prospective LCAs reflect both the system-level decarbonization trends and potential trade-offs among impacts [36,39] that are necessary to avoid unintended consequences.
Where possible, cross-database sensitivity analysis should be part of LCA modeling practice to capture this range. For electricity modeling, the practitioner should exert caution when using aggregated “market” datasets. Thorough use of the EcoQuery tool in Ecoinvent can help to identify the embedded assumptions to identify those that might not be relevant, thereby increasing the uncertainty in the LCA results. Use of more granular, scenario-flexible models that reflect the evolving mix of electricity generation resources and allow testing of technology-specific contributions is more time-consuming, but increases the transparency and confidence that the embedded assumptions are relevant. When reporting, trade-off categories (water use, toxicity), contributor breakdowns, and, ideally, uncertainty ranges should be included with full category results shared.
Future work should prioritize harmonization and transparency in the modeling of electricity-linked flows. While burden-shifting may be a plausible concern under decarbonization pathways, the extent to which these impacts reflect actual technological transitions versus structural database assumptions remains unresolved. Addressing this open question will require coordinated efforts to reconcile upstream emission inventories, improve regionalization of water and metal supply chains, and end-of-life modeling for critical infrastructure materials.
Based on the findings of this research, best practices for modeling electricity use should include:
  • Use of an inventory that is transparent in its inclusion of a relevant and up-to-date mix of electricity-generating technologies.
  • If a prospective LCA is completed, use an inventory for which the energy generation mix can be updated to anticipate the rapid decarbonization of the electricity system.
  • Use tools such as ecoQuery to thoroughly understand the system boundaries and components and explore the reasons for any impact category of substantial interest.
  • Document uncertainties in LCA results. This is often done with sensitivity analysis of inventory data that is central to the LCA work, but should also be considered for uncertainty in the assumptions built into available inventory databases and LCIA methods.

Supplementary Materials

The supporting information defined throughout this paper can be downloaded at: https://www.mdpi.com/article/10.3390/su18052263/s1, Supplementary S1. Estimating NPCC Electricity Mixes; Supplementary S2. Calculation of Grid Length per Unit of Electricity (m/kWh) for NPCC U.S. Region; Supplementary S3. Residential Heating LCA Case Study—Methods. Supplementary S4. LCIA Results: Generation and distribution of 1 MWh electricity, NPCC, 2022; Supplementary S5. LCIA Results—Residential Heating Case Study.

Author Contributions

Conceptualization, A.T.U. and S.E.P.; methodology, A.T.U.; validation, A.T.U. and S.E.P.; formal analysis, A.T.U. and S.E.P.; data curation, A.T.U.; writing—original draft preparation, A.T.U.; writing—review and editing, S.E.P.; visualization, A.T.U. and S.E.P.; supervision, S.E.P.; project administration, S.E.P.; funding acquisition, S.E.P. All authors have read and agreed to the published version of the manuscript.

Funding

This work is supported by the Sustainable Agriculture Systems grant no. 2021-69012-35919 from the U.S. Department of Agriculture (USDA), National Institute of Food and Agriculture.

Institutional Review Board Statement

Not applicable.

Informed Consent Statement

Not applicable.

Data Availability Statement

The electricity generation data used in this study are publicly available from the U.S. Environmental Protection Agency’s eGRID database. Life cycle inventory data were obtained from the Ecoinvent 3.11 database and the Sphera LCA database and are subject to their respective licensing restrictions. All calculated electricity mixes, scenario assumptions, grid-length intensities, and processed results supporting the findings of this study are provided in the Supplementary Materials.

Conflicts of Interest

The authors declare no conflicts of interest. The funders had no role in the design of the study; in the collection, analyses, or interpretation of data; in the writing of the manuscript; or in the decision to publish the results.

Abbreviations

The following abbreviations are used in this manuscript:
eGRIDEmissions and Generation Resource Integrated Database
FUFunctional unit
GREETGreenhouse gases, Regulated Emissions, and Energy use in Technologies
ISO-NEIndependent System Operator-New England
HPHeat pump
IPCCIntergovernmental Panel on Climate Change
LCALife cycle assessment
LCILife cycle inventory
LCIALife cycle impact assessment
NPCCNortheast Power Coordinating Council
NRELNational Renewable Energy Laboratory
NYSERDANew York State Energy Research and Development Authority
NYISONew York Independent System Operator
RoWRest of World
T&DTransmission & distribution
US DOEU.S. Department of Energy
US EIAU.S. Energy Information Administration
US EPAU.S. Environmental Protection Agency
US LCIU.S. Life Cycle Inventory

References

  1. Mendoza Beltran, A.; Cox, B.; Mutel, C.; van Vuuren, D.P.; Font Vivanco, D.; Deetman, S.; Edelenbosch, O.Y.; Guinée, J.; Tukker, A. When the background matters: Using scenarios from integrated assessment models in prospective life cycle assessment. J. Ind. Ecol. 2020, 24, 64–79. [Google Scholar] [CrossRef]
  2. Pauer, E.; Wohner, B.; Tacker, M. The Influence of Database Selection on Environmental Impact Results. Life Cycle Assessment of Packaging Using GaBi, Ecoinvent 3.6, and the Environmental Footprint Database. Sustainability 2020, 12, 9948. [Google Scholar] [CrossRef]
  3. U.S. Energy Information Administration. Electricity in the U.S.: Generation, Capacity, and Sales. 2024. Available online: https://www.eia.gov/energyexplained/electricity/electricity-in-the-us-generation-capacity-and-sales.php (accessed on 14 October 2025).
  4. U.S. Environmental Protection Agency. Power Sector Evolution Data Summary. Available online: https://www.epa.gov/power-sector/power-sector-evolution (accessed on 14 October 2025).
  5. U.S. Energy Information Administration. Emissions by Plant and by Region. 2025. Available online: https://www.eia.gov/electricity/data/emissions/ (accessed on 5 February 2026).
  6. ISO New England. Transmission Planning Process Guide; ISO New England Inc.: Holyoke, MA, USA, 2024; Available online: https://www.iso-ne.com/static-assets/documents/100018/pac_tppg_update_12_12_2024.pdf (accessed on 14 October 2025).
  7. IPCC. Summary for Policymakers. In Global Warming of 1.5 °C; An IPCC Special Report on the Impacts of Global Warming of 1.5 °C Above Pre-Industrial Levels and Related Global Greenhouse Gas Emission Pathways, in the Context of Strengthening the Global Response to the Threat of Climate Change, Sustainable Development, and Efforts to Eradicate Poverty; Masson-Delmotte, V., Zhai, P., Pörtner, H.-O., Roberts, D., Skea, J., Shukla, P.R., Pirani, A., Moufouma-Okia, W., Péan, C., Pidcock, R., et al., Eds.; Cambridge University Press: Cambridge, UK; New York, NY, USA, 2018; pp. 3–24. [Google Scholar] [CrossRef]
  8. Donohoo-Vallett, P.; Ryan, N.; Wiser, R. On the Path to 100% Clean Electricity by 2035; US DOE: Washington, DC, USA, 2023. Available online: https://www.energy.gov/sites/default/files/2023-05/DOE%20-%20100%25%20Clean%20Electricity%20-%20Final.pdf (accessed on 14 October 2025).
  9. Guidi, G.; Violante, A.C.; De Iuliis, S. Environmental Impact of Electricity Generation Technologies: A Comparison between Conventional, Nuclear, and Renewable Technologies. Energies 2023, 16, 7847. [Google Scholar] [CrossRef]
  10. Pehl, M.; Arvesen, A.; Hertwich, E.G.; Luderer, G.; Gibon, T.; Lefèvre, J. Understanding future emissions from low-carbon electricity systems. Nat. Energy 2017, 2, 939–945. [Google Scholar] [CrossRef]
  11. Laurent, A.; Bakas, I.; Clavreul, J.; Bernstad, A.; Niero, M.; Gentil, E.; Hauschild, M.Z. Environmental assessment of electricity supply in Europe: A review and meta-analysis. Renew. Sustain. Energy Rev. 2018, 81, 2011–2032. [Google Scholar] [CrossRef]
  12. Ardente, F.; Mathieux, F.; Recchioni, M. Environmental assessment of the durability of energy-using products: Method and application to a case study. J. Clean. Prod. 2019, 215, 867–879. [Google Scholar] [CrossRef]
  13. Luderer, G.; Pehl, M.; Arvesen, A.; Gibon, T.; Bosetti, V.; Dietrich, J.P.; Popp, A.; Hertwich, E.G. Environmental co-benefits and adverse side-effects of alternative power sector decarbonization strategies. Nat. Commun. 2019, 10, 5229. [Google Scholar] [CrossRef] [PubMed]
  14. Levasseur, A.; Cavalett, O.; Fuglestvedt, J.S.; Cherubini, F. Life cycle assessment of low-carbon electricity futures: Trade-offs and uncertainties. Environ. Sci. Technol. 2021, 55, 5504–5515. [Google Scholar] [CrossRef]
  15. Ghisellini, P.; Sassanelli, C.; Ulgiati, S. Life cycle assessment of European electricity transition scenarios: Challenges and trade-offs. J. Ind. Ecol. 2023, 27, 456–474. [Google Scholar] [CrossRef]
  16. Ecoinvent Association. Ecoinvent Database Version 3.9 Documentation. 2022. Available online: https://ecoinvent.org/the-ecoinvent-database/ (accessed on 27 August 2024).
  17. Sphera Solutions. GaBi Database Documentation. 2023. Available online: https://gabi.sphera.com/databases/gabi-databases/ (accessed on 27 August 2024).
  18. Emami, N.; Heinonen, J.; Marteinsson, B.; Säynäjoki, A.; Junnonen, J.-M.; Laine, J.; Junnila, S. A Life Cycle Assessment of Two Residential Buildings Using Two Different LCA Database-Software Combinations: Recognizing Uniformities and Inconsistencies. Buildings 2019, 9, 20. [Google Scholar] [CrossRef]
  19. Kim, H.C.; Fthenakis, V.M.; Choi, J.K.; Turney, D.E. Life cycle greenhouse gas emissions of thin-film photovoltaic electricity generation: Systematic review and harmonization. J. Ind. Ecol. 2012, 16, S110–S121. [Google Scholar] [CrossRef]
  20. Guo, J.; Li, R.; Zhang, R.; Qi, J.; Li, N.; Xu, C.; Chiu, A.S.; Wang, Y.; Tanikawa, H.; Xu, M. Shedding light on the shadows: Transparency challenge in background life cycle inventory data. J. Ind. Ecol. 2025, 29, 766–767. [Google Scholar] [CrossRef]
  21. Kalverkamp, M.; Günther, E.; Rosiński, A. Database selection and its influence on LCA outcomes: Electric vs. combustion vehicles. Sustainability 2020, 12, 5062. [Google Scholar] [CrossRef]
  22. U.S. Environmental Protection Agency. eGRID2022 Summary Tables. 2023. Available online: https://www.epa.gov/egrid (accessed on 14 June 2025).
  23. Ecoinvent Association. ecoQuery: Market for Electricity, Low Voltage. 2025. Available online: https://ecoquery.ecoinvent.org/ (accessed on 14 October 2025).
  24. New York Independent System Operator (NYISO). 2023 Resource Mix and Transmission Report. 2023. Available online: https://www.nyiso.com/documents/20142/33384099/2023-2032-Comprehensive-Reliability-Plan.pdf (accessed on 14 October 2025).
  25. ISO New England. 2023 Resource Mix. 2024. Available online: https://www.iso-ne.com/about/key-stats/resource-mix (accessed on 1 June 2025).
  26. NYISO. 2024 FERC form 715 Annual Transmission Planning Report; New York Independent System Operator: New York, NY, USA, 2024; Available online: https://www.nyiso.com/documents/20142/1406939/NYISO-2024-Form-715-Report-Final.pdf (accessed on 27 August 2024).
  27. International Energy Agency (IEA). World Energy Outlook 2022; IEA Publications: Paris, France, 2022; Available online: https://www.iea.org/reports/world-energy-outlook-2022 (accessed on 14 October 2025).
  28. Mai, T.; Jadun, P.; Logan, J.; McMillan, C.; Muratori, M.; Steinberg, D.; Vimmerstedt, L.; Haley, B.; Jones, R.; Nelson, B. Electrification Futures Study: Scenarios of Electric Technology Adoption and Electricity Consumption for the United States; National Renewable Energy Laboratory (NREL): Golden, CO, USA, 2018. Available online: https://www.nrel.gov/docs/fy18osti/71500.pdf (accessed on 14 October 2025).
  29. New York State Energy Research and Development Authority (NYSERDA). New York State Zero Emissions Pathways Study: Technical Appendix. 2021. Available online: https://www.nyserda.ny.gov/About/Publications (accessed on 14 October 2025).
  30. Padovani, F.; Sommerfeldt, N.; Longobardi, F.; Pearce, J.M. Decarbonizing rural residential buildings in cold climates: A techno-economic analysis of heating electrification. Energy Build. 2021, 250, 111284. [Google Scholar] [CrossRef]
  31. U.S. Department of Energy. Building Energy Codes Program: Residential Prototypes. Available online: https://www.energycodes.gov/ (accessed on 24 August 2024).
  32. Lin, H.; Clavreul, J.; Jeandaux, C.; Crawley, J.; Butnar, I. Environmental life cycle assessment of heating systems in the UK: Comparative assessment of hybrid heat pumps vs. condensing gas boilers. Energy Build. 2021, 240, 110865. [Google Scholar] [CrossRef]
  33. Wernet, G.; Bauer, C.; Steubing, B.; Reinhard, J.; Moreno-Ruiz, E.; Weidema, B. The ecoinvent database version 3 (part I): Overview and methodology. Int. J. Life Cycle Assess. 2016, 21, 1218–1230. [Google Scholar] [CrossRef]
  34. U.S. Geological Survey. Mineral Commodity Summaries 2023: Copper; U.S. Department of the Interior: Washington, DC, USA, 2023. Available online: https://pubs.usgs.gov/periodicals/mcs2023/mcs2023-copper.pdf (accessed on 14 October 2025).
  35. U.S. Environmental Protection Agency. National Recycling Strategy: Part One—Building a Circular Economy for All; EPA: Washington, DC, USA, 2021. Available online: https://www.epa.gov/system/files/documents/2021-11/final-national-recycling-strategy.pdf (accessed on 14 October 2025).
  36. Tschümperlin, L.; Mutel, C.; Steubing, B. Systematic differences in LCA results across databases: An electricity supply case study. Int. J. Life Cycle Assess. 2021, 26, 812–827. [Google Scholar] [CrossRef]
  37. Aridi, M.; Pannier, M.-L.; Aridi, R.; Lemenand, T. A Comprehensive Review of Life Cycle Assessments for Domestic Heat Pumps: Environmental Footprint and Future Directions. Energy Build. 2025, 336, 115605. [Google Scholar] [CrossRef]
  38. Jin, Y.; Behrens, P.; Tukker, A.; Scherer, L. Water use of electricity technologies: A global meta-analysis. Renew. Sustain. Energy Rev. 2019, 115, 109391. [Google Scholar] [CrossRef]
  39. Sacchi, R.; Terlouw, T.; Siala, K.; Vandepaer, L.; Mutel, C. Prospective EnvironMental Impact asSEment (premise): A streamlined approach to producing databases for prospective life cycle assessment using integrated assessment models. Environ. Sci. Technol. 2022, 56, 2528–2539. [Google Scholar] [CrossRef]
Figure 1. Database options for electricity generation in the U.S. with a functional unit of 1 MWh electricity delivered. LCA inventories from (a) “market for electricity, low voltage 2022, NPCC” from Ecoinvent 3.11; (b) Sphera Database Model for Electricity Mix in the NPCC region for 2022.
Sustainability 18 02263 g001
Figure 3. Relative LCA results for the delivery of 1 MWh of electricity under different modeling approaches using (a) ReCiPe 2016 (H) midpoint, and (b) TRACI 2.1 methods. Maximum values among the three models tested are included to the right of each graph. Each set of bars provides information on the inventory database. From top to bottom: blue—Ecoinvent default; orange—customized model; and green—Sphera database elec. model.
Sustainability 18 02263 g003
Figure 4. Copper contributions of major inventory stages to ReCiPe’s freshwater ecotoxicity impacts.
Sustainability 18 02263 g004
Figure 5. Breakdown of selected impact categories for heat pumps generated with the Ecoinvent inventory (customized electricity and HP production) versus the Sphera dataset (electricity and HP production) databases: (a) Climate Change, (b) Freshwater Ecotoxicity, (c) Freshwater Consumption, and (d) Human Toxicity, Cancer. The functional unit for all of these is the delivery of heat for one typical household over a winter season (results for additional impact categories are presented in Supplementary Materials, Supplementary S5).
Sustainability 18 02263 g005
Table 1. Heat map representation of the LCIA differences in heat pump impacts (blue represents improved performance 2022 → 2040) and between inventory databases (red indicates that the customized model built with Ecoinvent data sets was higher than the model using the Sphera dataset).
LCIA Impact CategoryHeat PumpsDatabase Comparison
Percent Change
(2040 Relative to 2022)
Customized/Sphera
Customized SpheraHP 2022HP 2040
Climate Change, excl Biogenic Carbon−76%−72%1.61.4
Fine Particulate Matter Formation−57%−17%4.32.3
Fossil Depletion−64%−37%1.30.7
Ionizing Radiation−28%11%10.16.5
Freshwater Consumption−19%14%0.30.2
Land Use155%19%4.49.5
Metal Depletion22%7.4%1.71.9
Freshwater Eutrophication−53%0.0%5.32.5
Marine Eutrophication−45%5.5%6.13.2
Terrestrial Acidification−63%−17%4.52.0
Photochem O3 Formation, Human Health−71%−58%3.32.2
Stratospheric Ozone Depletion−61%−15%3.51.6
Freshwater Ecotoxicity138%−0.1%1.74.1
Terrestrial Ecotoxicity41%0.5%2.43.3
Human Toxicity, Cancer0.0%1.0%3.93.9
Human Toxicity, Non-cancer−0.1%0.0%2.42.4
Disclaimer/Publisher’s Note: The statements, opinions and data contained in all publications are solely those of the individual author(s) and contributor(s) and not of MDPI and/or the editor(s). MDPI and/or the editor(s) disclaim responsibility for any injury to people or property resulting from any ideas, methods, instructions or products referred to in the content.