Effect of Spatial Flow and Optimal Combination of New Quality Productivity Forces on High-Quality Economic Development of Coastal Regions: Evidence from China 53 Coastal Cities

Abstract
1. Introduction
2. Literature Review
3. Theoretical Framework and Hypothesis Development
3.1. Conceptual Foundations: Deconstructing New Quality Productive Forces
- (1)
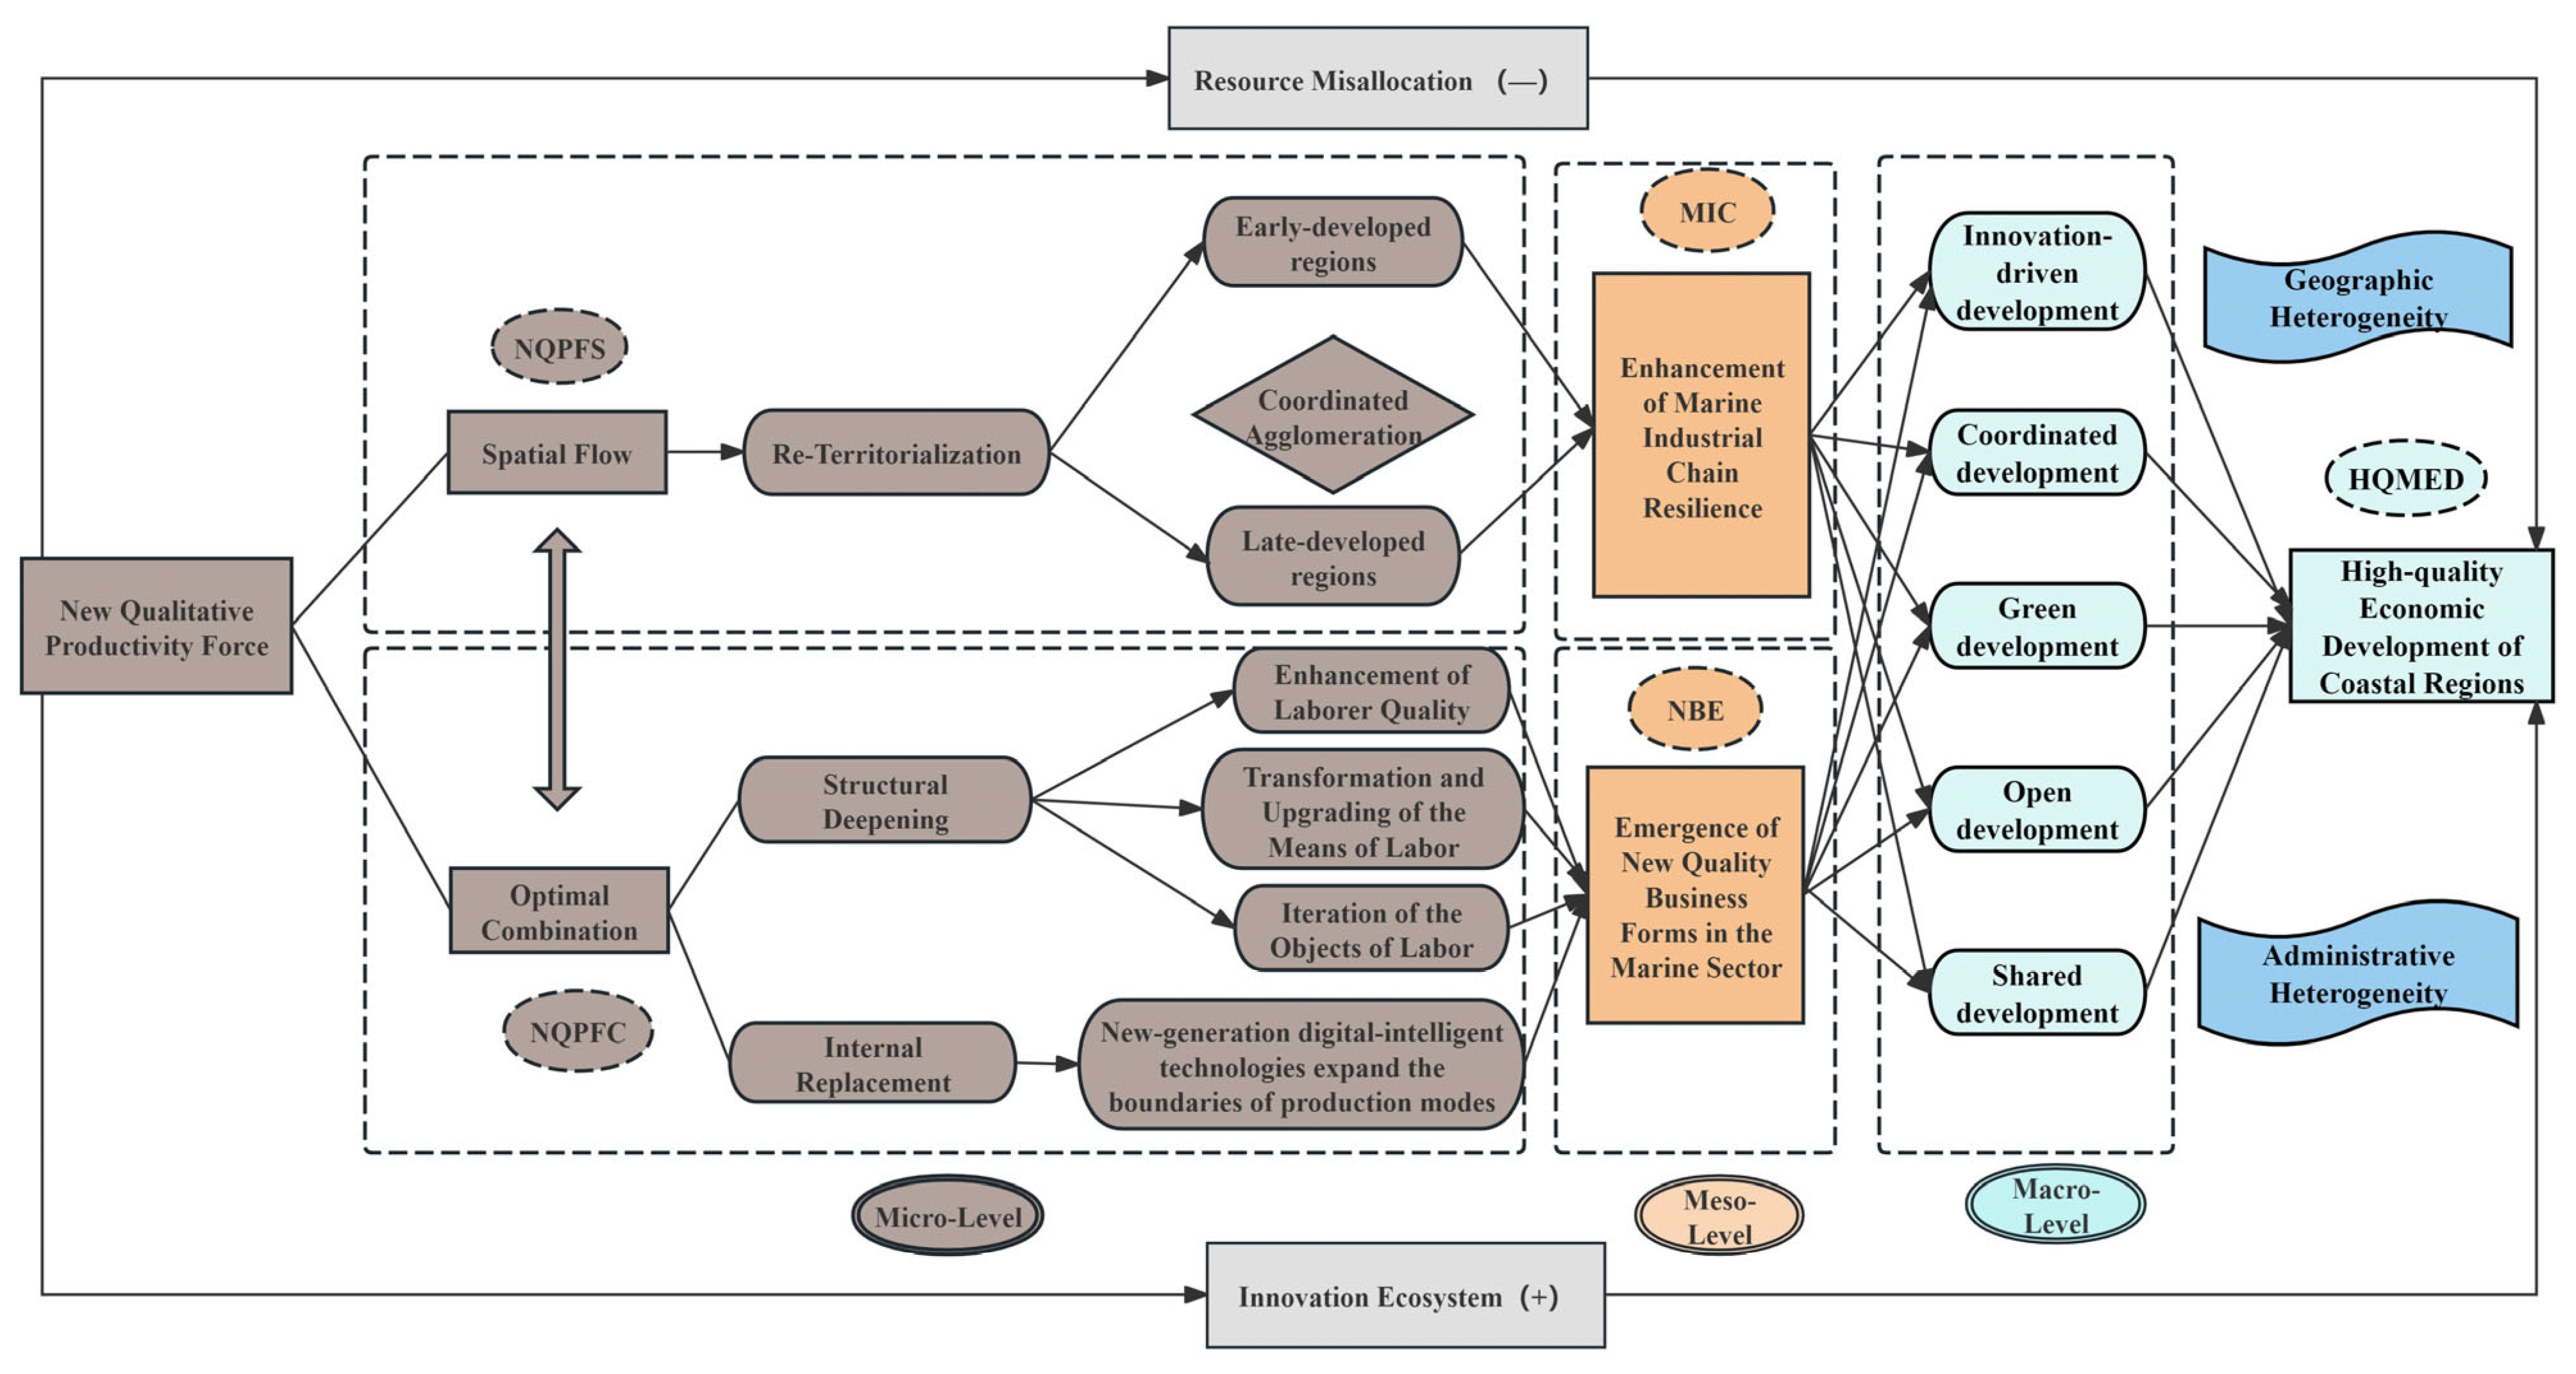
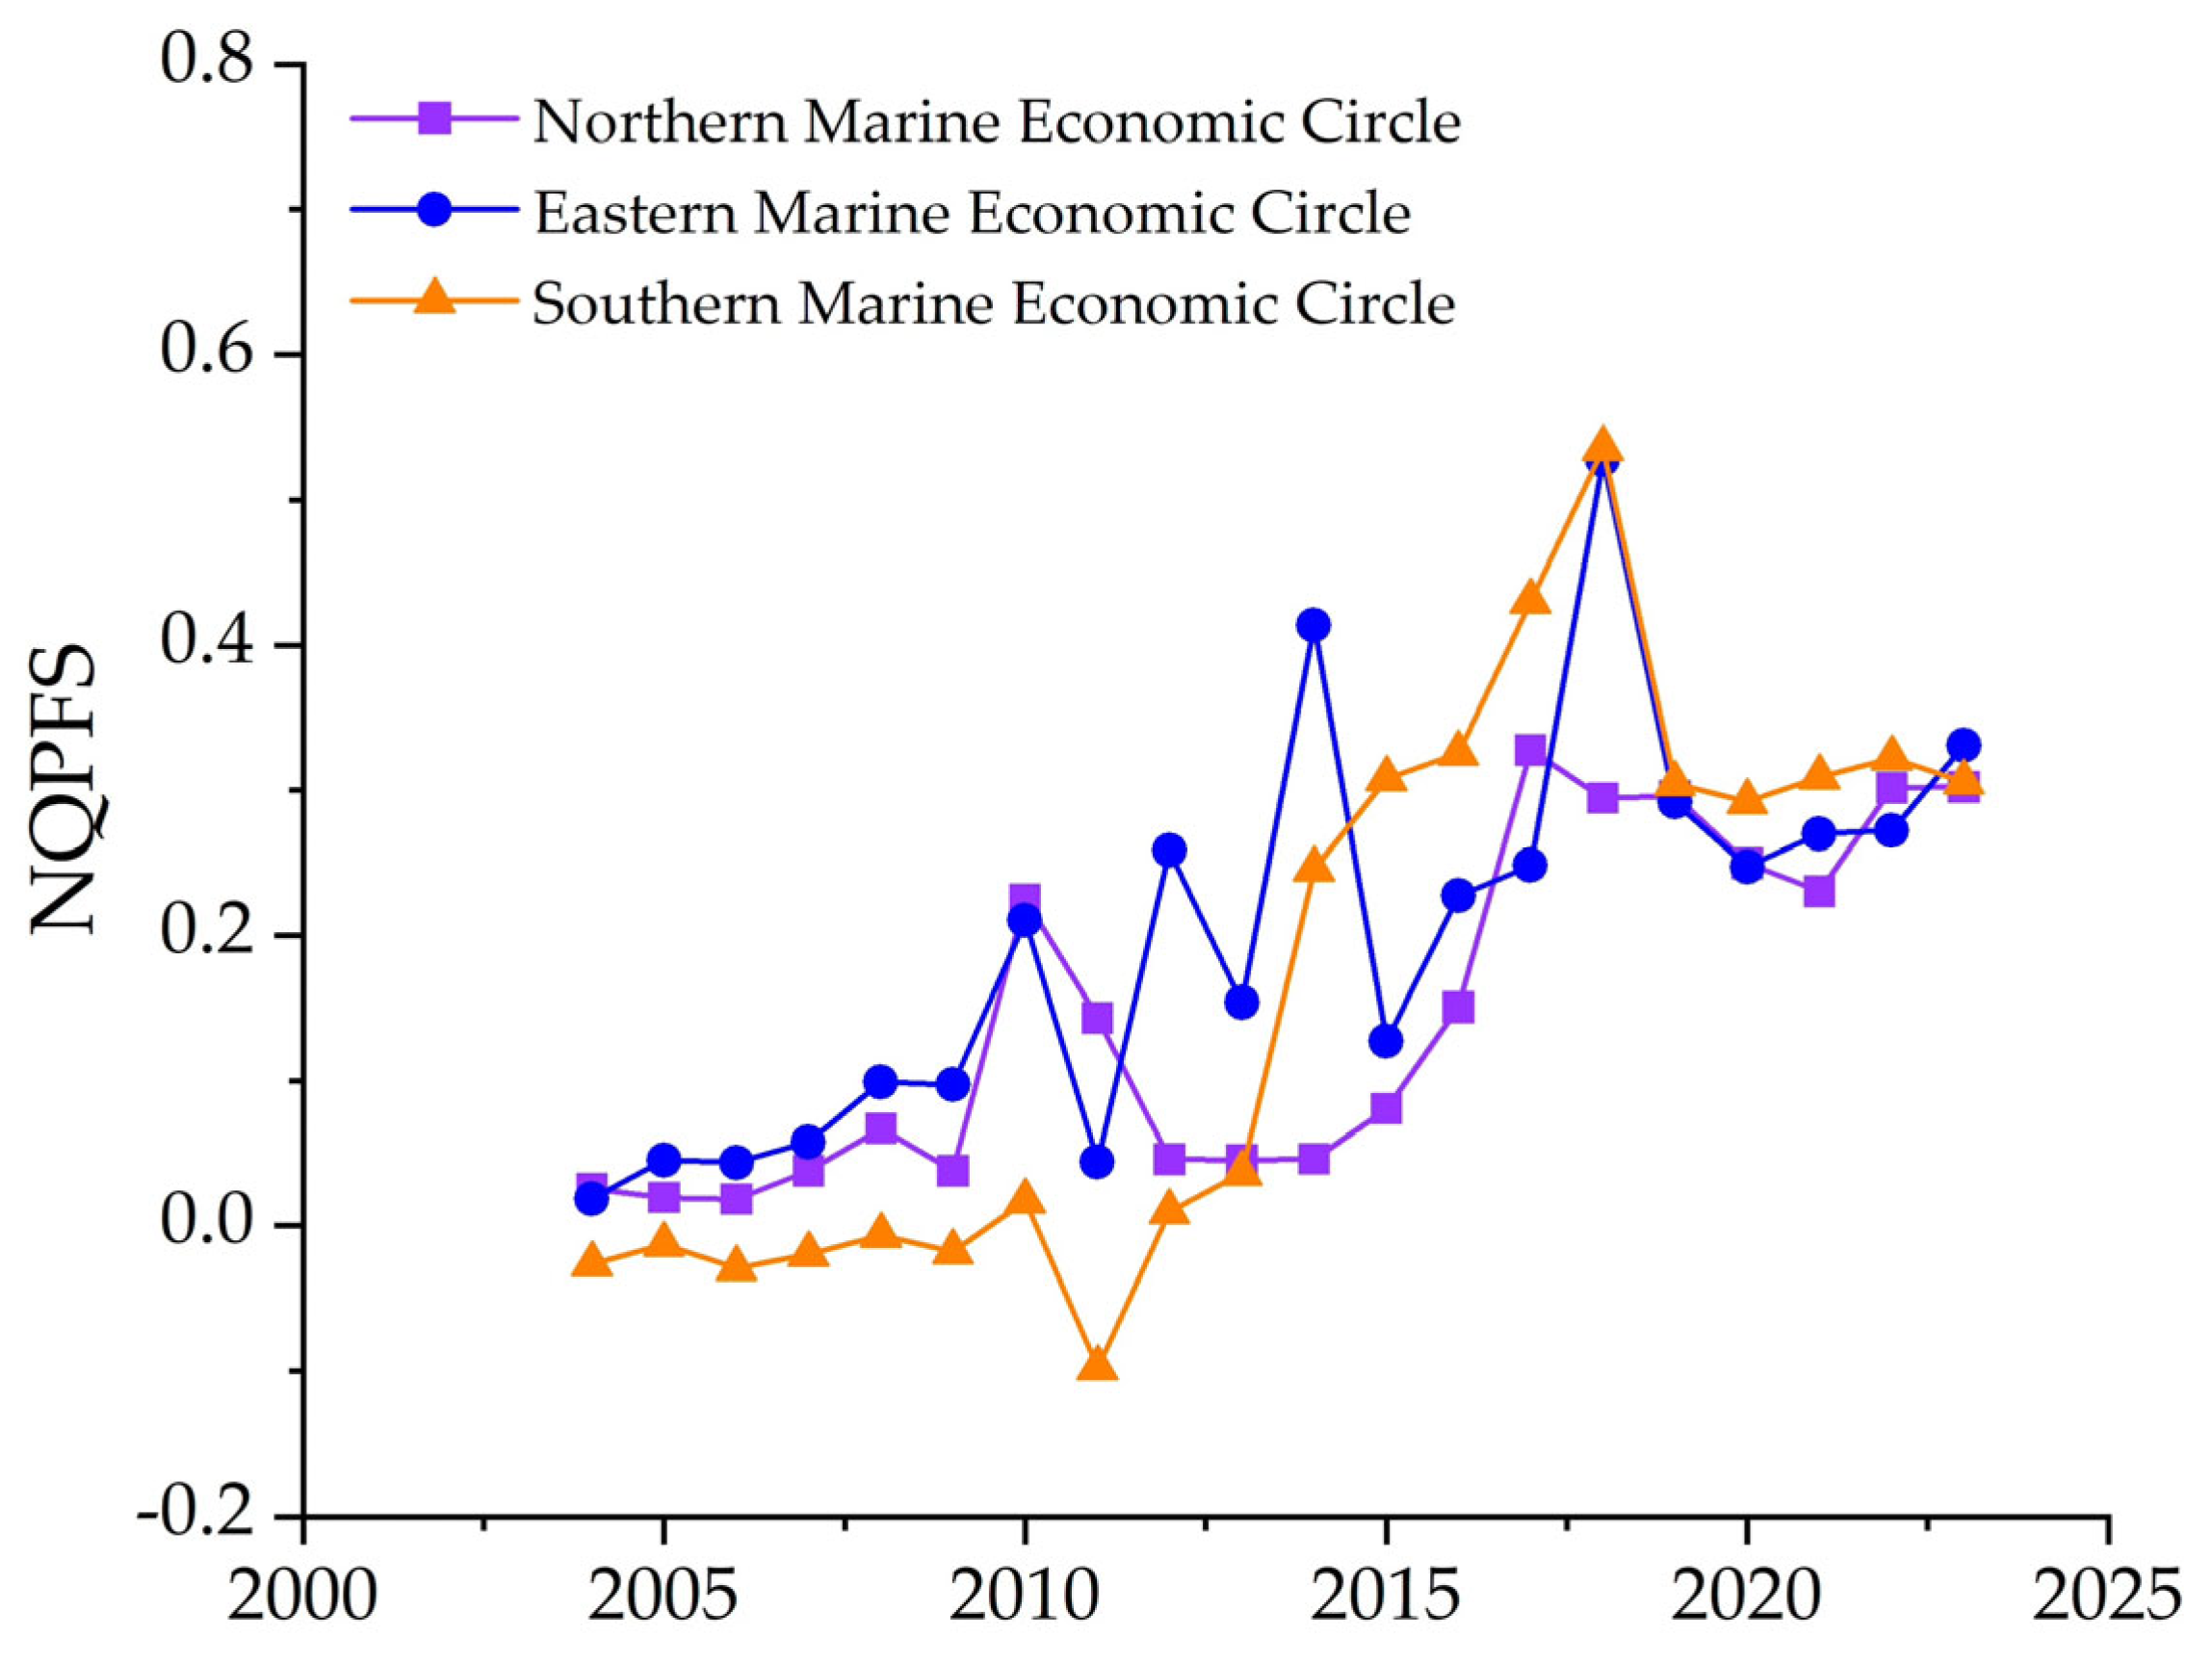
- Spatial flow of New Quality Productive Forces (NQPFS): China’s vast territory and ultra-large market endow it with inherent economies of scale and international competitive advantages. However, market fragmentation and resource misallocation have hindered productivity progress. This paper defines NQPFS as the “re-territorialization” of new quality productive forces, aiming to resolve contradictions in factor combinations through the reallocation of innovative elements. By optimizing the relative proportions and coupling methods of different productive factors, it enhances factor allocation efficiency and generates “Coordinated Agglomeration Effects” for both factor-inflow regions (core pioneering areas) and factor-outflow regions (peripheral late-developing areas).
- (2)
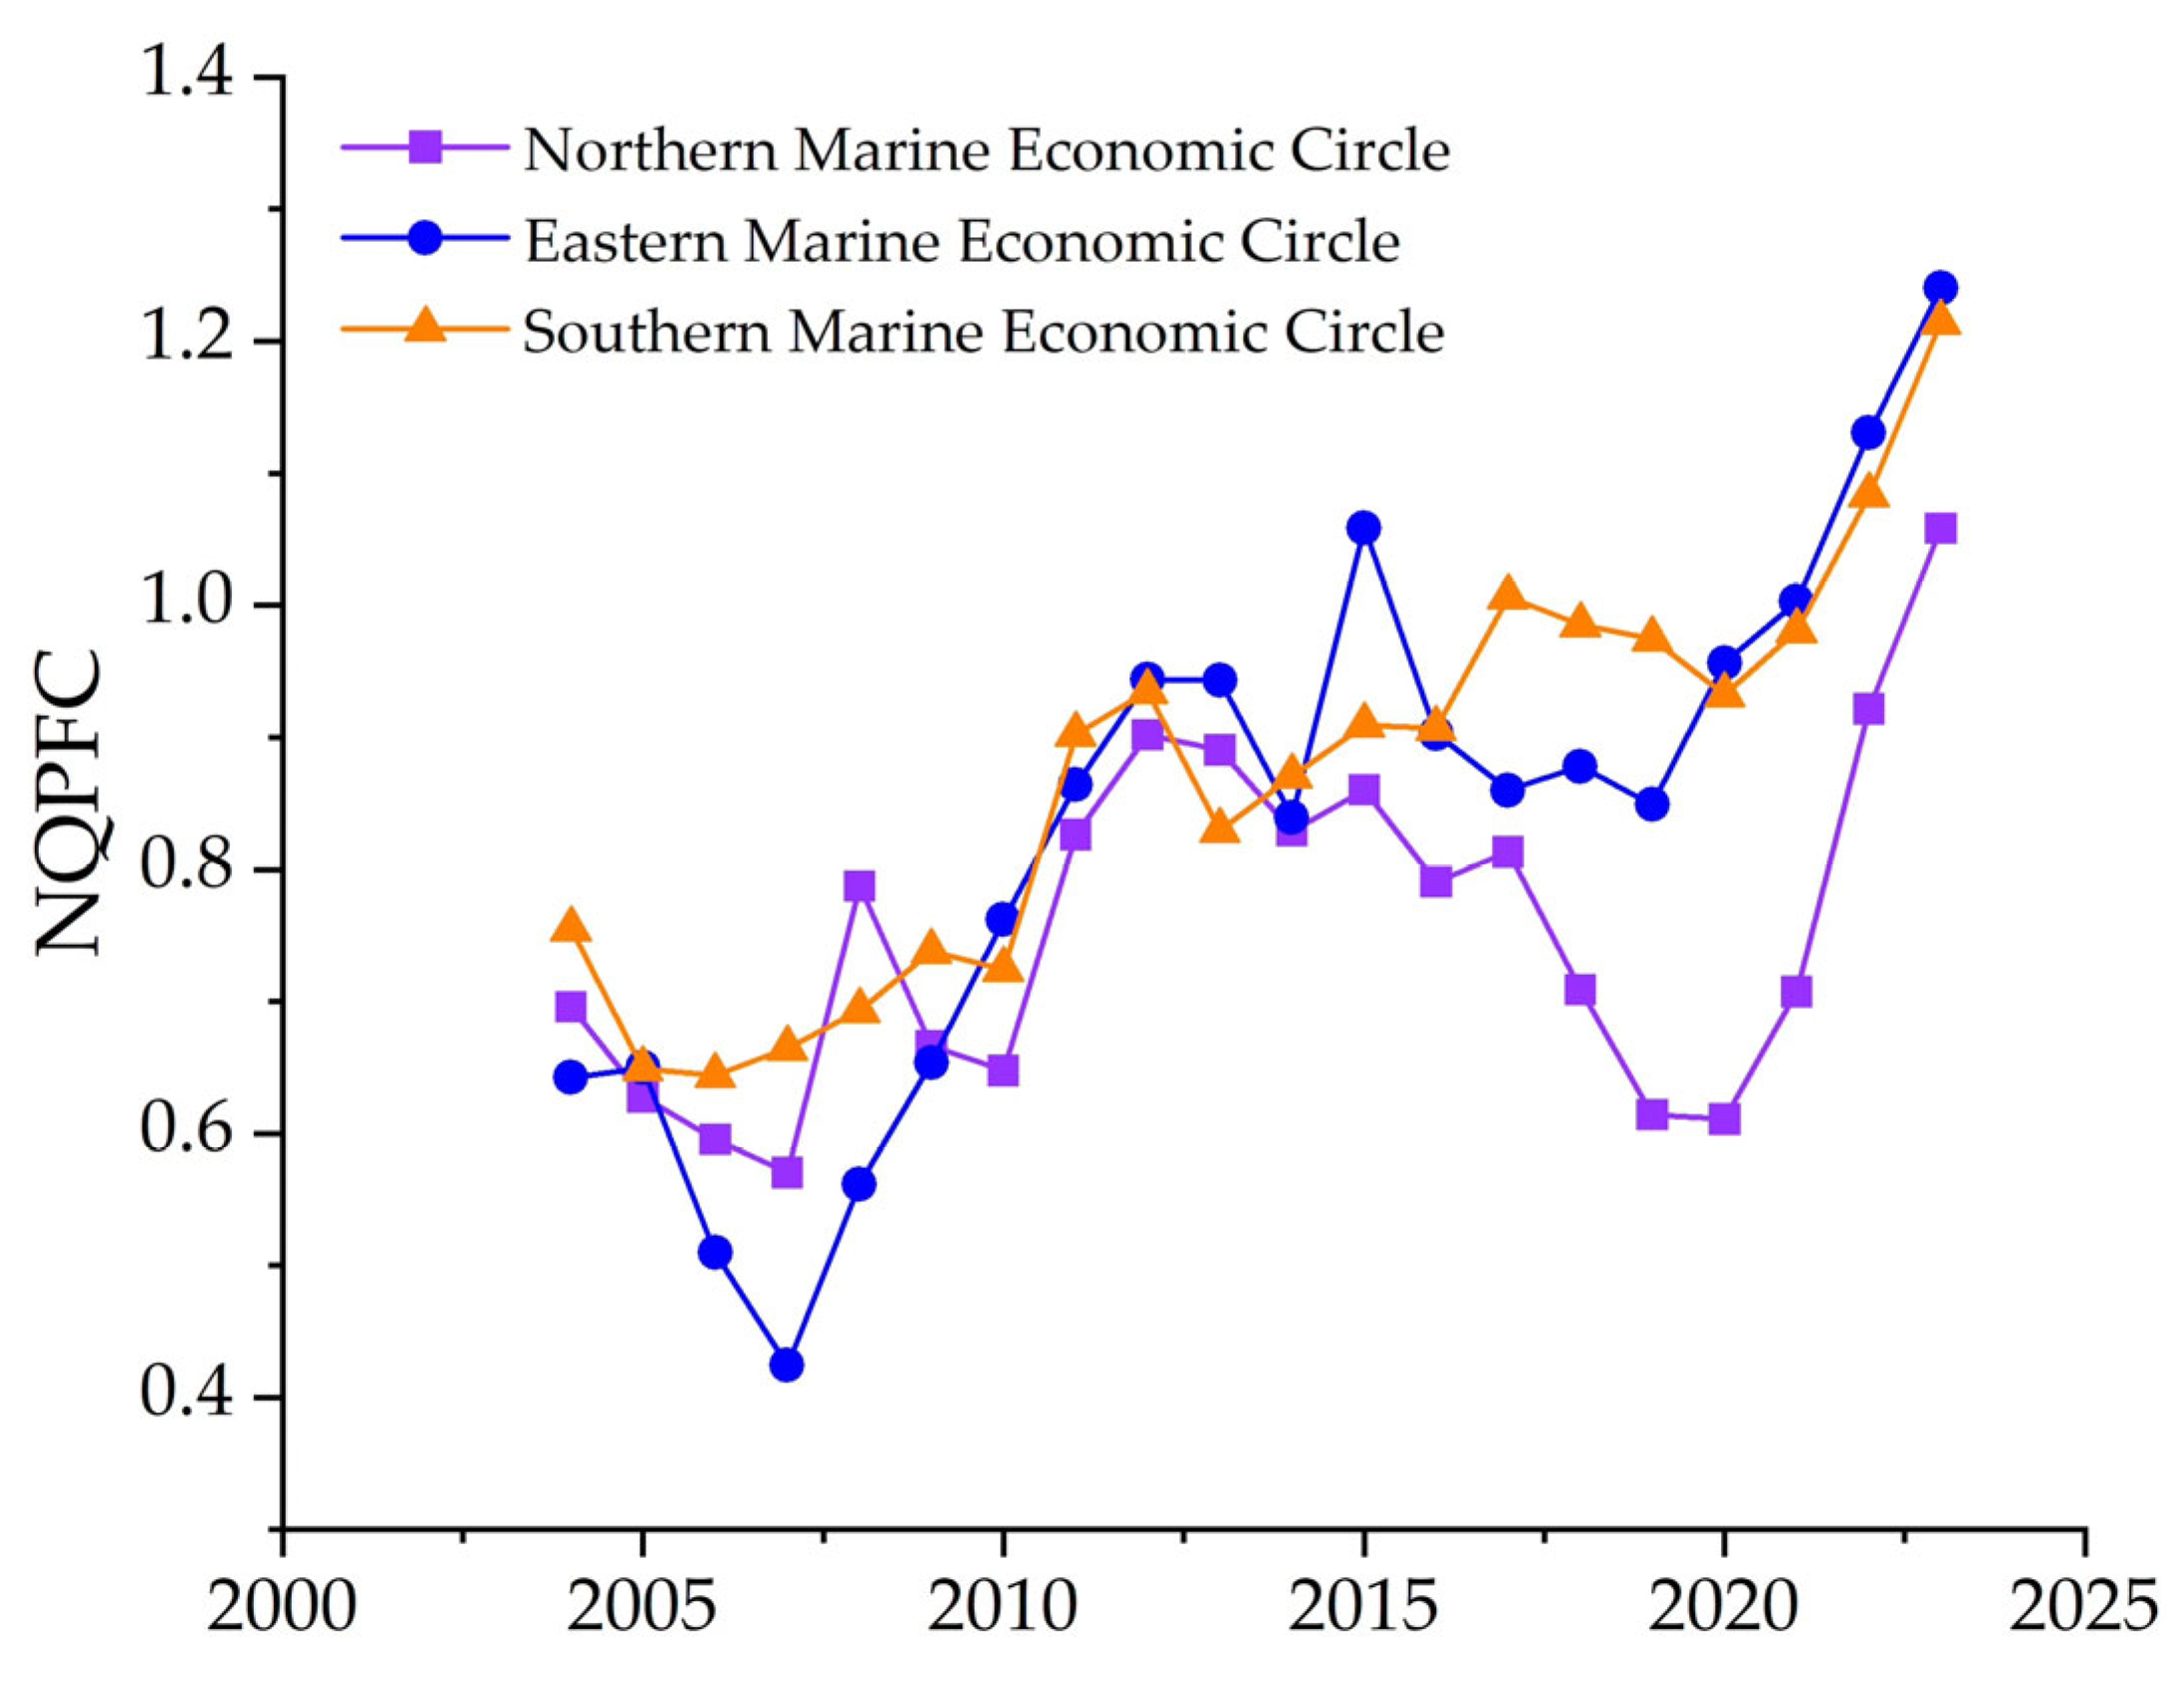
- Optimal combination of New Quality Productive Forces (NQPFC): This paper defines NQPFC as a dual process encompassing the “internal replacement” of old quality productive factors through iterative upgrading, and the “structural deepening” of the productive forces system driven by the emergence of new quality productive factors. From the perspective of “internal replacement”, the development of new quality productive forces requires the optimized substitution of production factors—including laborers, means of labor, and objects of labor: First, laborers transition from low-skilled to high-skilled; Second, means of labor evolve from the legacy of “machine-industry heritage” since the Industrial Revolution to modern high-precision and advanced equipment; Third, objects of labor shift from natural materials such as petroleum and cotton to clean energy and synthetic materials. From the perspective of “structural deepening”, the development of new quality productive forces urgently requires next-generation digital-intelligent technologies, such as AI large models, cloud computing, and blockchain to be embedded throughout the entire material production process, thereby expanding the boundaries of production modes.
3.2. The Direct Impact: Mechanisms Linking New Quality Productive Forces Dynamics to Coastal High-Quality Economic Development
3.3. The Indirect Pathway: Mediation Model
3.4. The Transmission Pathway: A Moderation Model
3.5. The Contingent Effects: Expected Heterogeneities
4. Research Design and Data
4.1. Study Area and Data Sources
4.2. Variable Construction and Measurement
4.3. Econometric Models: Baseline Regression Model
4.4. Econometric Models: Mediation and Moderation Models
5. Spatio-Temporal Evolution: Descriptive Evidence
5.1. Spatial Correlation Analysis of High-Quality Economic Development in China’s Coastal Areas (2004–2023)
5.2. Temporal Analysis of New Quality Productive Forces Spatial Flow (2004–2023)
5.3. Temporal Analysis of Optimal Combination of New Quality Productive Forces (2004–2023)
6. Empirical Results and Analysis
6.1. Baseline Results: Validating the Direct Effects
6.2. Endogeneity and Tests Robustness
6.2.1. Endogeneity with Instrumental Variables (2SLS)
6.2.2. Robustness Test: Replace Dependent Variable and Add Control Variables
6.3. Mediation Mechanism Test
6.4. Moderating Effect Mechanism Test
6.5. Heterogeneity Analysis: Geography and Institutions at Play
6.5.1. Differential Impacts Across the Three Major Marine Economic Circles
6.5.2. Divergent Effects Between Core Cities and General Cities
7. Discussion and Limitations
7.1. Discussion
7.2. Limitations
8. Conclusions
- (1)
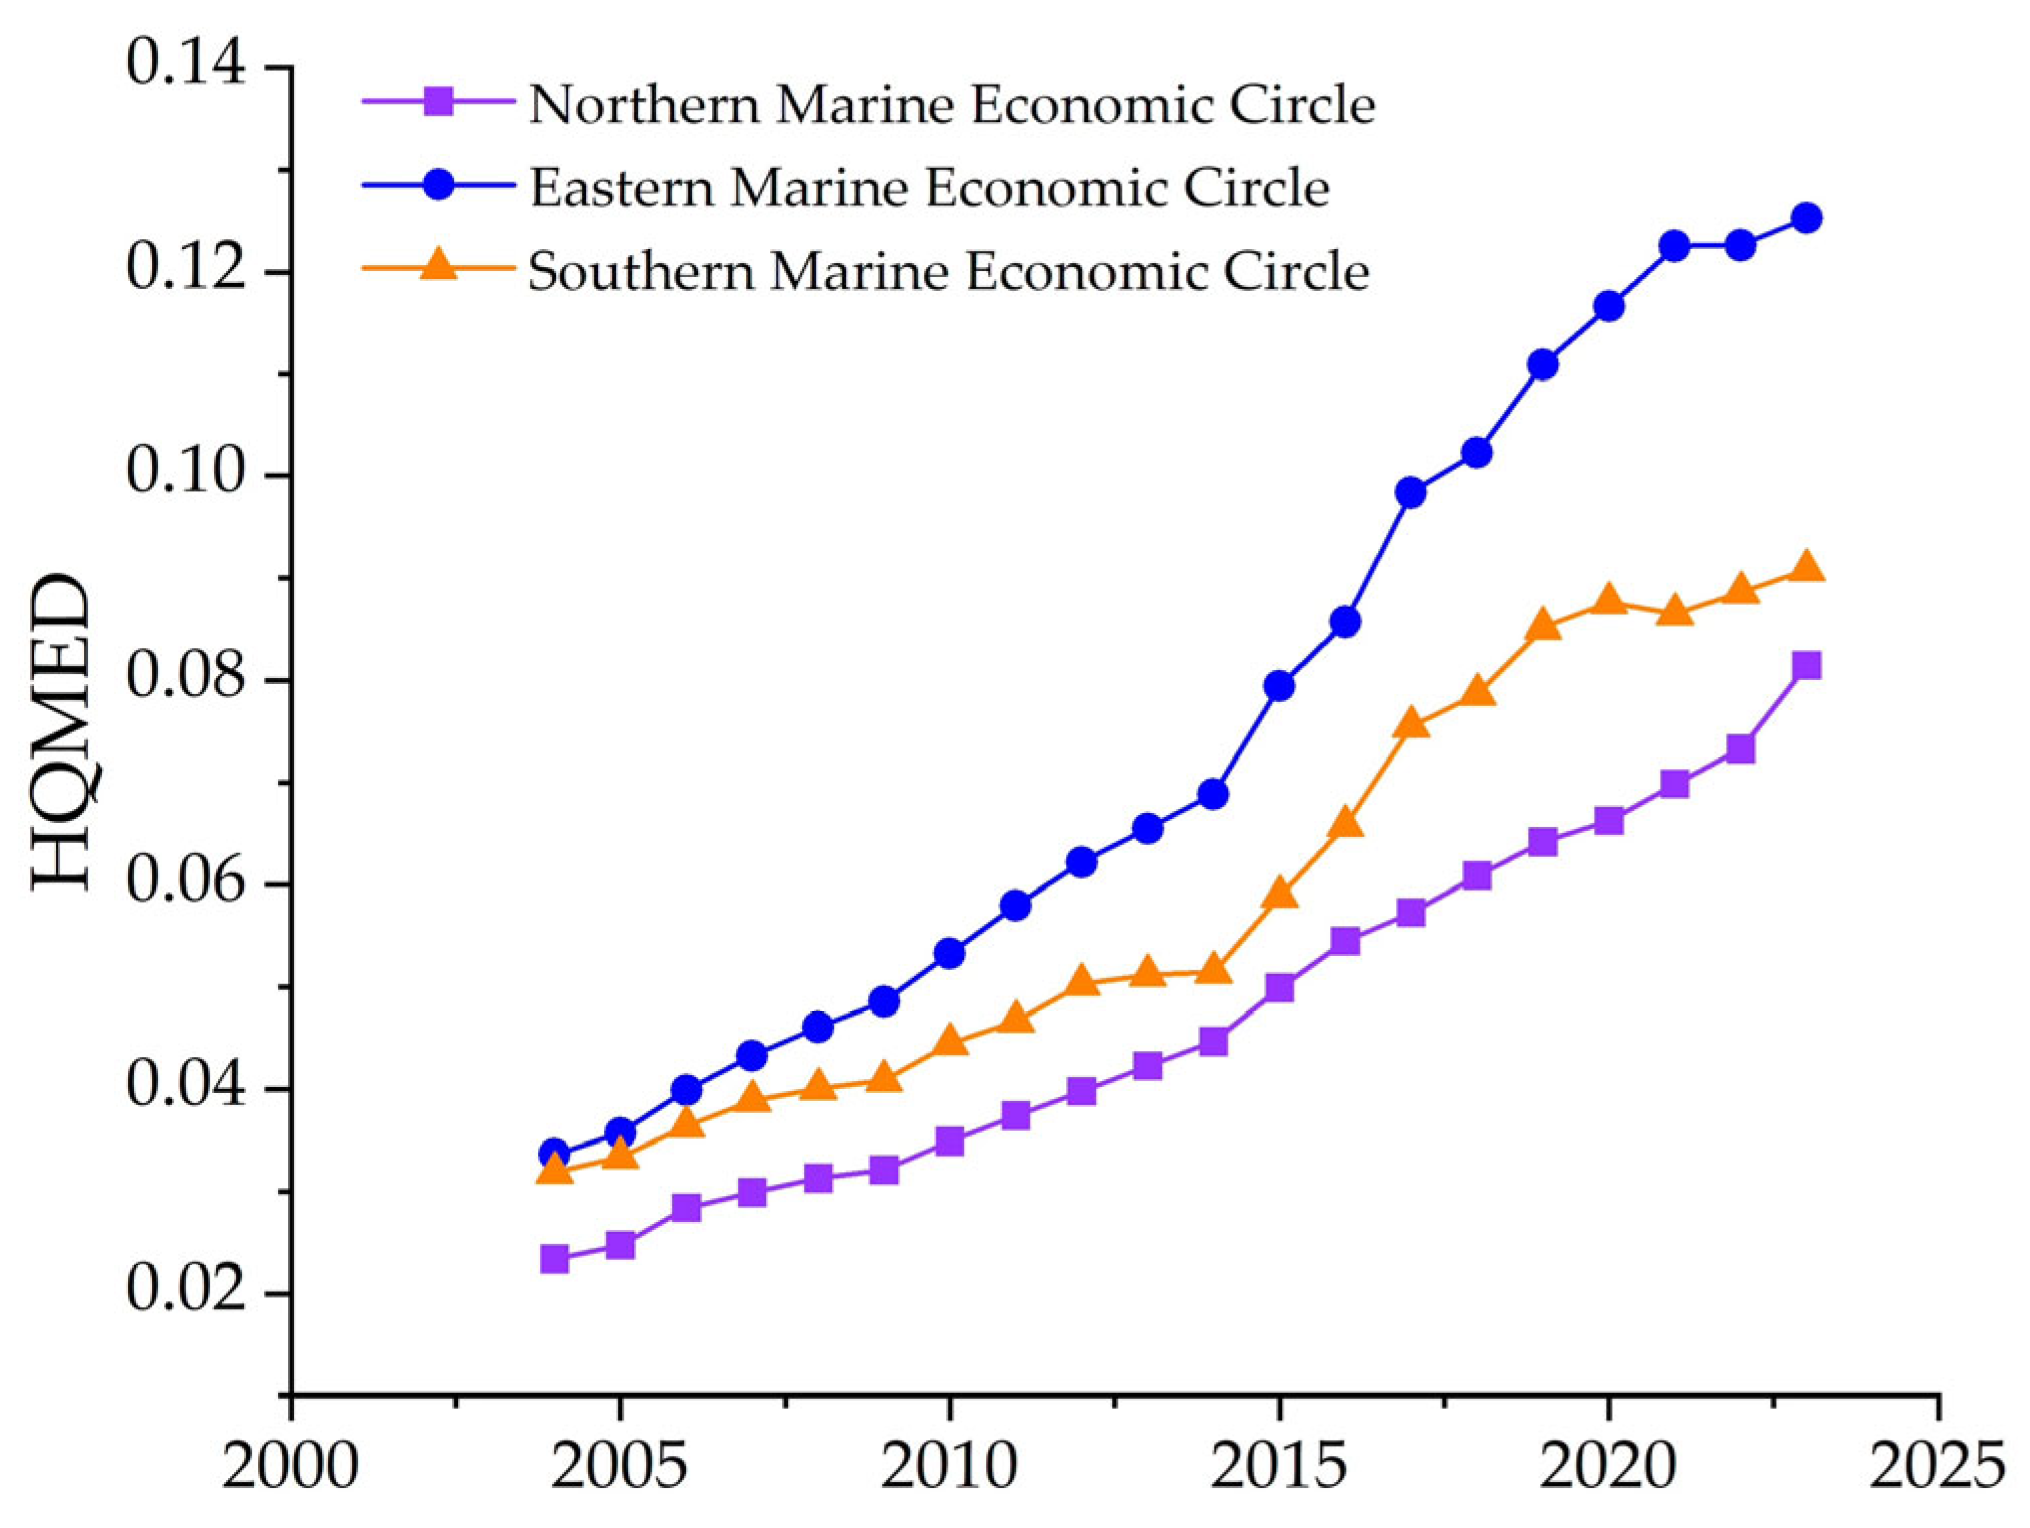
- The high-quality development level of China’s coastal regions shows a continuous upward trend, yet with marked regional disparities, forming a spatial pattern of “one core, two wings” characterized by “Eastern leadership with Northern and Southern regions following.” The development gap between cities has gradually widened, and the overall spatial structure is evolving from a “core-periphery” single-point model toward a clustered stage of “one core, multiple poles, and networked linkage.” new quality productive forces has transitioned from initial single-point agglomeration to multi-polar distribution, eventually forming a networked pattern, reflecting the dynamic deepening of factor mobility and synergy across coastal areas.
- (2)
- The baseline regression results indicate that both the spatial flow and optimal combination of new quality productive forces exert stable positive effects on high-quality economic development in coastal regions. The marginal contribution of factor optimal combination is significantly higher than that of spatial flow, highlighting the critical role of improving factor allocation efficiency at the current stage. The significantly positive coefficients of education investment and R&D expenditure further affirm the fundamental supporting function of human capital and technological innovation in high-quality development. Model diagnostics support the use of a two-way fixed-effects specification, and the gradual increase in adjusted R2 demonstrates the model’s strong explanatory power and reasonable variable selection.
- (3)
- The mechanism tests confirm that new quality productive forces promote high-quality development through two mediation pathways—“enhancing marine industrial chain resilience” and “fostering the emergence of new quality business forms in the marine sector”. Furthermore, resource misallocation exerts a significantly negative moderating effect on the role of factor flow, while the innovation ecology shows a positive moderating effect on the impact of factor configuration. These results highlight the critical boundary conditions imposed by external institutional environments in the high-quality development process.
- (4)
- Heterogeneity analysis reveals that the impact of new quality productive forces on high-quality coastal development exhibits significant regional and institutional differentiation. Spatially, the effects display a distinct geographic pattern: they are strongly positive in the Eastern marine economic circle, significantly negative for spatial flows yet partially positive for factor combination in the Northern circle, and statistically insignificant in the Southern circle. Institutionally, core coastal cities demonstrate pronounced positive effects from both spatial flows and factor optimization, leveraging their administrative advantages for effective factor capture and recombination. In contrast, ordinary cities show negligible or even negative responses, constrained by limited absorptive capacity and the siphon effects from core cities. These findings underscore that both the institutional environment and geographic foundations are key structural factors shaping the effectiveness and boundaries of new, quality productive forces.
Author Contributions
Funding
Institutional Review Board Statement
Informed Consent Statement
Data Availability Statement
Conflicts of Interest
References
- Perez, C. Technological Revolutions and Financial Capital: The Dynamics of Bubbles and Golden Ages; Edward Elgar Press: Cheltenham, UK, 2003. [Google Scholar]
- Baldwin, R.; Evenett, S. COVID-19 and Trade Policy: Why Turning Inward Won’t Work; CEPR Press: Boca Raton, FL, USA, 2023. [Google Scholar]
- Mazzucato, M. Mission Economy: A Moonshot Guide to Changing Capitalism; Harper Business Press: New York, NY, USA, 2021. [Google Scholar]
- World Bank. Available online: https://documents.banquemondiale.org/fr/publication/documents-reports/documentdetail/537371570778931095 (accessed on 1 January 2026).
- Hu, M. Accelerating the Reform of Factor Marketization Allocation. Masses 2025, 8, 14–16. (In Chinese) [Google Scholar]
- Xi, J.P. Developing new-quality productive forces is an essential requirement and a crucial focus for advancing high-quality development. Qiushi 2024, 11, 4–8. (In Chinese) [Google Scholar]
- Guangming Daily. Available online: https://news.gmw.cn/2024-02/22/content_37158384.htm (accessed on 1 January 2026).
- Marshall, A. Principles of Economics, 8th ed.; Macmillan Press: London, UK, 1920. [Google Scholar]
- Schumpeter, J.A. The Theory of Economic Development; Harvard University Press: Cambridge, MA, USA, 1934. [Google Scholar]
- Solow, R.M. Technical change and the aggregate production function. Rev. Econ. Stat. 1957, 39, 312–320. [Google Scholar] [CrossRef]
- Romer, P.M. Endogenous technological change. J. Polit. Econ. 1990, 98, 71–102. [Google Scholar] [CrossRef]
- Krugman, P.R. Increasing returns and economic geography. J. Polit. Econ. 1991, 99, 483–499. [Google Scholar] [CrossRef]
- Mokyr, J. The Gifts of Athena: Historical Origins of the Knowledge Economy; Princeton University Press: Princeton, NJ, USA, 2002. [Google Scholar]
- Nordhaus, W.D. The Climate Casino: Risk, Uncertainty, and Economics for a Warming World; Yale University Press: New Haven, CT, USA, 2013. [Google Scholar]
- Zhang, K.Y. Promote Coordinated Regional Economic Development by Optimizing New-Quality Productive Forces Allocation. New Urban. 2024, 5, 12. (In Chinese) [Google Scholar]
- Zhang, Z.H.; Wang, Y.; Luo, Y. Spatio-temporal gap and endogenous contribution of new quality productive forces in Chinese cities. Acta Geogr. Sin. 2025, 81, 363–386. (In Chinese) [Google Scholar]
- Chen, Y.F.; Yang, S.S.; Hu, S.H. Construction and Measurement of the Evaluation Index System of New Quality Productive Forces: A Study Based on the Perspective of ‘Input-Process-Output’. Sci. Res. Manag. 2025, 46, 1–11. [Google Scholar] [CrossRef]
- Zhang, Y.K.; Wang, Y.S. Measurement Methods and Spatio-Temporal Characteristics of Urban-Rural Factor Flow in China. J. Geogr. Sci. 2023, 78, 1888–1903. [Google Scholar] [CrossRef]
- Wei, J.F.; Yuan, Y.R.; Li, Q.; Xu, H.; Liu, J.R. Spatial Correlation Network and Influencing Factors of New Quality Productive Forces in the Yellow River Basin from the Core-edge Perspective. Econ. Geogr. 2025, 45, 59–69. [Google Scholar] [CrossRef]
- Fernandes, M.; Larruga, F.; Alves, F.L. Spatial characterization of marine socio-ecological systems: A Portuguese case study. J. Clean. Prod. 2022, 363, 132381. [Google Scholar] [CrossRef]
- Zhang, Y.T.; Liu, S.G.; Feng, S.; Zhou, H.W.; Wang, J.L. Impact of Inter-provincial Flow of Marine New Quality Productive Factors on theHigh-quality Development of China’s Marine Economy. Econ. Geogr. 2025, 45, 129–138. (In Chinese) [Google Scholar] [CrossRef]
- Cohen, G.A. Karl Marx’s Theory of History: A Defence (Expanded); Princeton University Press: Princeton, NJ, USA, 2001. [Google Scholar]
- Marx, K.; Engels, F. Karl Marx and Frederick Engels: Selected Works (Vol. I); People’s Publishing House: Beijing, China, 1995. [Google Scholar]
- Arthur, W.B. The Nature of Technology: What It Is and How It Evolves; Free Press: New York, NY, USA, 2009. [Google Scholar]
- Romer, P. Increasing Returns and Long-Run Growth. J. Polit. Econ. 1986, 94, 1002–1037. [Google Scholar] [CrossRef]
- Glaeser, E.L.; Kallal, H.D.; Scheinkman, J.A.; Shleifer, A. Growth in Cities. J. Polit. Econ. 1992, 100, 1126–1152. [Google Scholar] [CrossRef]
- Koenker, R.; Bassett, G. Regression quantiles. Econometrica 1978, 46, 33–50. [Google Scholar] [CrossRef]
- Williamson, O.E. The Economic Institutions of Capitalism: Firms, Markets, Relational Contracting; Free Press: New York, NY, USA, 1985. [Google Scholar]
- Rochet, J.C.; Tirole, J. Platform Competition in Two-Sided Markets. J. Eur. Econ. Assoc. 2003, 1, 990–1029. [Google Scholar] [CrossRef]
- Arrow, K.J. The Economic Implications of Learning by Doing. Rev. Econ. Stud. 1962, 29, 155–173. [Google Scholar] [CrossRef]
- Boschma, R. Proximity and innovation: A critical assessment. Reg. Stud. 2005, 39, 61–74. [Google Scholar] [CrossRef]
- Mattli, W.; Büthe, T. The New Global Rulers: The Privatization of Regulation in the World Economy; Princeton University Press: Princeton, NJ, USA, 2003. [Google Scholar]
- Gereffi, G.; Humphrey, J.; Sturgeon, T. The governance of global value chains. Rev. Int. Polit. Econ. 2005, 12, 78–104. [Google Scholar] [CrossRef]
- Nelson, R.; Winter, G. An Evolutionary Theory of Economic Change; Harvard University Press: Cambridge, MA, USA, 1982. [Google Scholar]
- Zheng, Y.N. How to scientifically understand“new quality productivity”. Bull. Chin. Acad. Sci. 2024, 39, 797–803. (In Chinese) [Google Scholar] [CrossRef]
- Cooke, P. Regional Innovation Systems: Competitive Regulation in New Europe. Geoforum 1992, 23, 365–382. [Google Scholar] [CrossRef]
- Cook, P.; Schienstock, G. Structural Competitiveness and Learning Regions. Enterp. Innov. Manag. Stud. 2000, 1, 265–280. [Google Scholar] [CrossRef]
- Gardner, C.L.; Dwyer, S.J. Numerical Simulation of the XZ Tauri Supersonic Astrophysical Jet. Acta Math. Sci. 2009, 29, 1677–1683. [Google Scholar] [CrossRef]
- Hojnik, J.; Ruzzier, M. The Driving Forces of Process Eco-Innovation and Its Impact on Performance: Insights from Slovenia. J. Clean. Prod. 2016, 133, 812–825. [Google Scholar] [CrossRef]
- Coleman, J.S. Social Capital in the Creation of Human Capital. Am. J. Sociol. 1988, 94, 95–120. [Google Scholar] [CrossRef]
- King, G.; Levine, R. Finance and Growth: Schumpeter Might Be Right. Q. J. Econ. 1993, 108, 717–737. [Google Scholar] [CrossRef]
- Cohen, W.M.; Levinthal, D.A. Absorptive capacity: A new perspective on learning and innovation. Adm. Sci. Q. 1990, 35, 128–152. [Google Scholar] [CrossRef]
- Wang, B.D.; Su, J. Can the Free Flow of Factors Lead to Regional Coordinated Development? A Theoretical Hypothesis and Empirical Test Based on “Coordinated Agglomeration”. Financ. Trade Econ. 2020, 41, 129–143. (In Chinese) [Google Scholar] [CrossRef]
- Zhao, X.L.; Yin, H.T. Industrial relocation and energy consumption: Evidence from China. Energy Policy 2011, 39, 2944–2956. [Google Scholar] [CrossRef]
- Liu, S.G.; Zhang, Y.T.; Wang, J.L. The Impact of the Spatial Mobility of Marine New Qualitative Productivity Force Factors on the Coordinated Development of China’s Marine Economy. Sustainability 2025, 17, 5883. [Google Scholar] [CrossRef]
- Zhao, X.; Ma, X.W.; Shang, Y.P.; Yang, Z.; Shahzad, U. Green economic growth and its inherent driving factors in Chinese cities: Based on the Metafrontier-global-SBM super-efficiency DEA model. Gondwana Res. 2022, 106, 315–328. [Google Scholar] [CrossRef]
- Li, W.J.; Zheng, M.N. Is it Substantive Innovation or Strategic Innovation?—Impact of Macroeconomic Policies on Micro-enterprises’ Innovation. Econ. Res. J. 2016, 51, 60–73. (In Chinese) [Google Scholar]
- Xu, Y.; Wang, Y.Y.; Yu, L.S. Effects of Patent Collateral Loans on Innovation. J. Financ. Res. 2024, 532, 58–75. (In Chinese) [Google Scholar]
- Chen, Y.S.; Sun, Z.F.; Han, Y.; Wang, Y.M.; Zhang, Y. Path and Mechanism of Rural Land System Reform to Promote Urban-Rural Integration Development. Econ. Geogr. 2023, 43, 36–45. (In Chinese) [Google Scholar] [CrossRef]
- Bao, Z.S.; Wang, J.W.; Luo, X.H. Impact and Spatial Effects of the Digital Economy on the High-Quality Development of the Circulation Industry. Econ. Geogr. 2025, 45, 103–112. (In Chinese) [Google Scholar] [CrossRef]
- Tan, J.X.; Wang, K.; Liu, M.L. Spatio-Temporal Adaptation and Interaction Effects Between Territorial Development Intensity and Urban-Rural Integration in the Wuling Mountain Area. Sci. Geogr. Sin. 2024, 44, 2007–2014. (In Chinese) [Google Scholar] [CrossRef]
- Wang, J.Y.; Zhang, J. The Existence of Population Cushion in International Industrial Division and Its Implications for China. Popul. Res. 2025, 49, 32–49. (In Chinese) [Google Scholar]
- Zhan, X.Y.; Liang, L.X. How Does the Chain Leader Policy “Chain” Enterprise Technological Innovation. China Ind. Econ. 2024, 11, 137–155. (In Chinese) [Google Scholar] [CrossRef]
- Wei, Y.Q. Research on the Impact of Digital Finance on the Resilienceof Industrial Chain. China Bus. Mark. 2023, 37, 71–82. (In Chinese) [Google Scholar] [CrossRef]
- Restuccia, D.; Rogerson, R. Policy distortions and aggregate productivity with heterogeneous establishments. Rev. Econ. Dyn. 2008, 11, 707–720. [Google Scholar] [CrossRef]
- Huang, Q.H.; Yu, Y.Z.; Zhang, S.L. Internet Development and Manufacturing Productivity Growth: The Inherent Mechanisms and China’s Experience. China Ind. Econ. 2019, 8, 5–23. (In Chinese) [Google Scholar] [CrossRef]
- Gao, C.L.; Li, S.T. Migration Motivation, Human Capital and big urban scale: Debate over the New Urbanization Model in China. Shanghai J. Econ. 2019, 11, 120–128. (In Chinese) [Google Scholar] [CrossRef]
- Chen, S.Y.; Chen, D.K. Air Pollution, Government Regulations and High-Quality Economic Development. Econ. Res. J. 2018, 53, 20–34. (In Chinese) [Google Scholar]
- Zhu, J.H.; Sun, H.X. Does the Digital Economy Enhance Urban Economic Resilience? Mod. Econ. Res. 2021, 67, 1–13. (In Chinese) [Google Scholar] [CrossRef]
- Jiang, T. Mediating Effects and Moderating Effects in Causal Inference. China Ind. Econ. 2022, 39, 100–120. (In Chinese) [Google Scholar] [CrossRef]
- Guo, J.K.; Tian, D.C. Coupling Coordinated Development of Urban Resilience and Scientific and Technological Innovation in the Grand Canal Area. Areal Res. Dev. 2024, 43, 46–52+60. (In Chinese) [Google Scholar]
- North, D.C. Institutions, Institutional Change and Economic Performance; Cambridge University Press: Cambridge, UK, 1990. [Google Scholar]
- Kildow, J.T.; Colgan, C.S. The California Ocean Economy 1990–2000; Agency for Natural Resources: Sacramento, CA, USA, 2004. [Google Scholar]
- Kildow, J.T.; Colgan, C.S.; Scorse, J. State of the U.S. Ocean and Coastal Economies 2014; National Ocean Economics Program: Monterey, CA, USA, 2014. [Google Scholar]

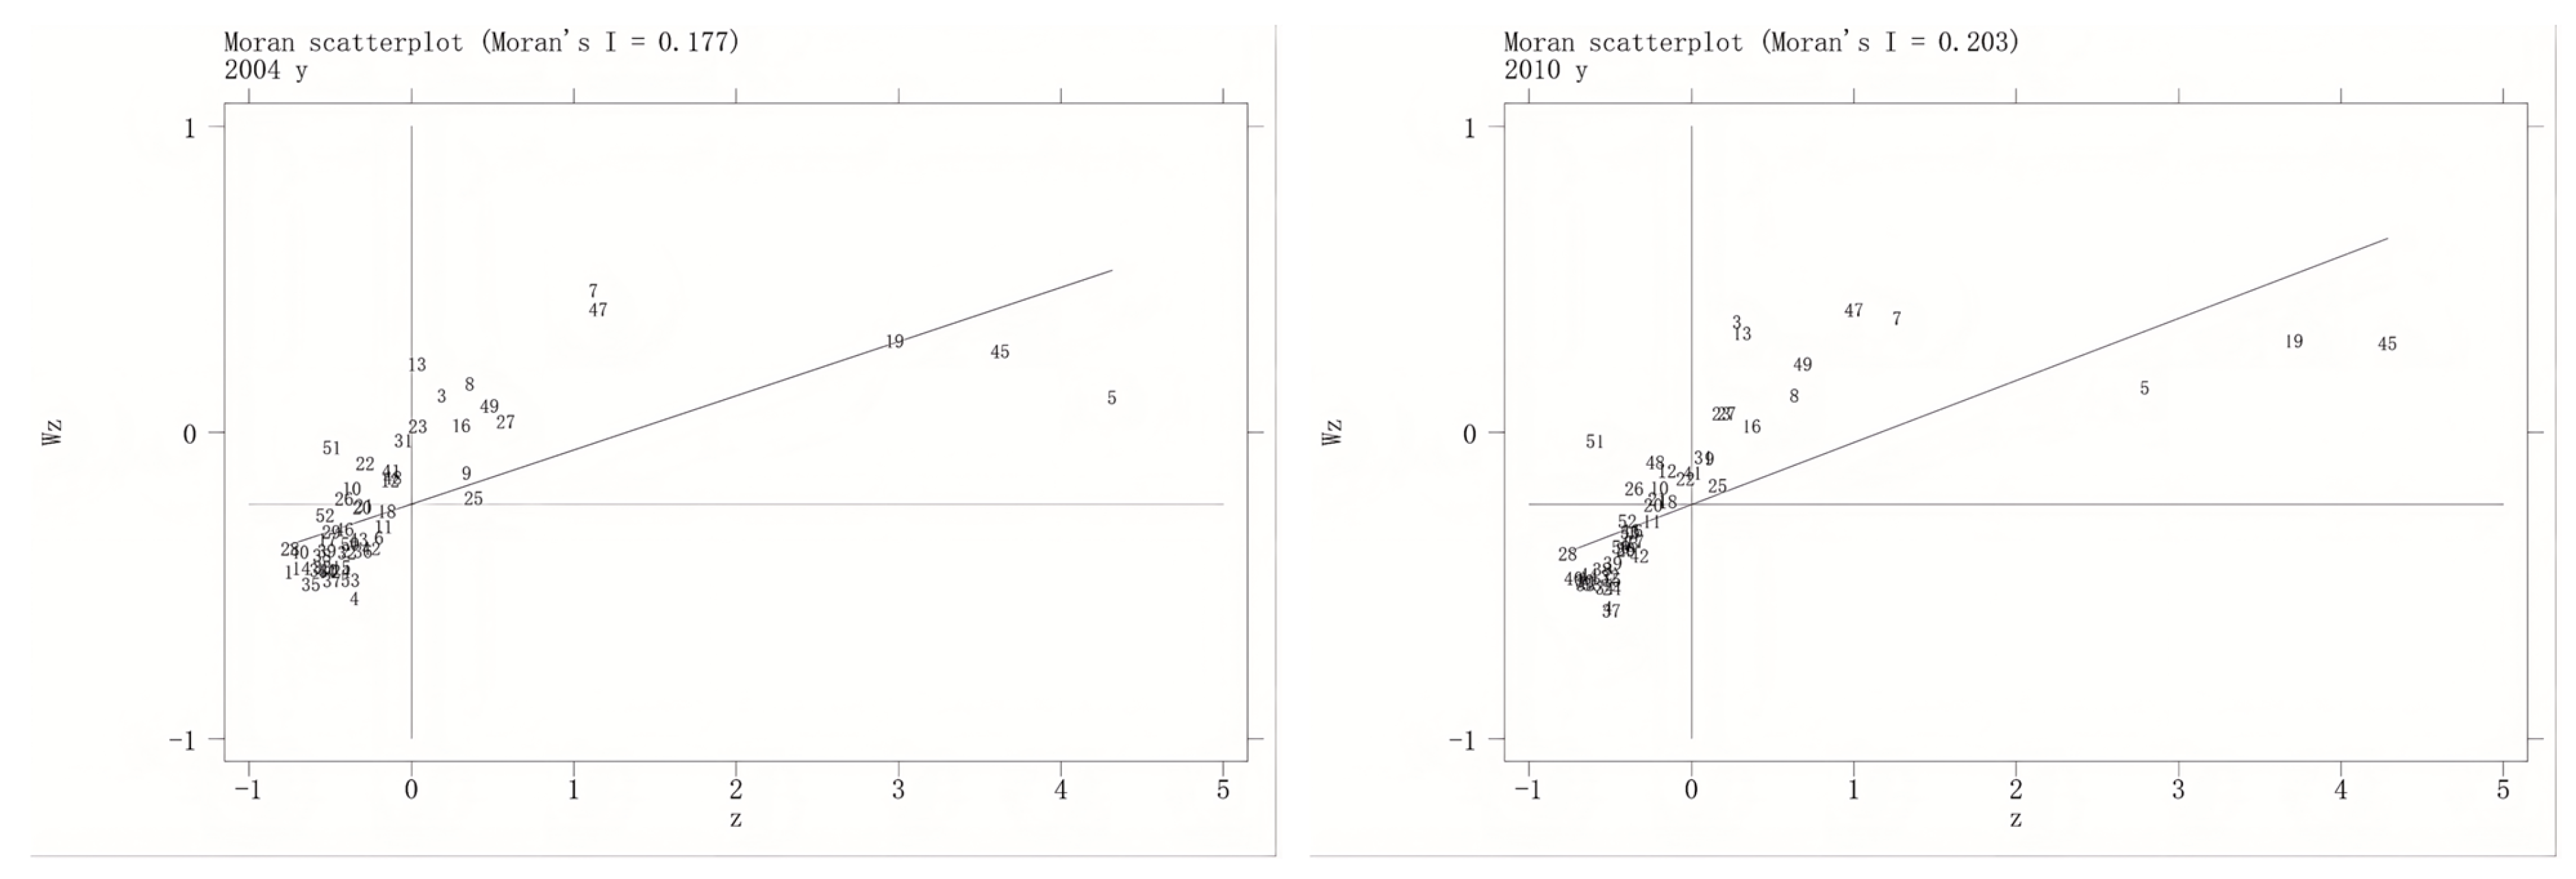
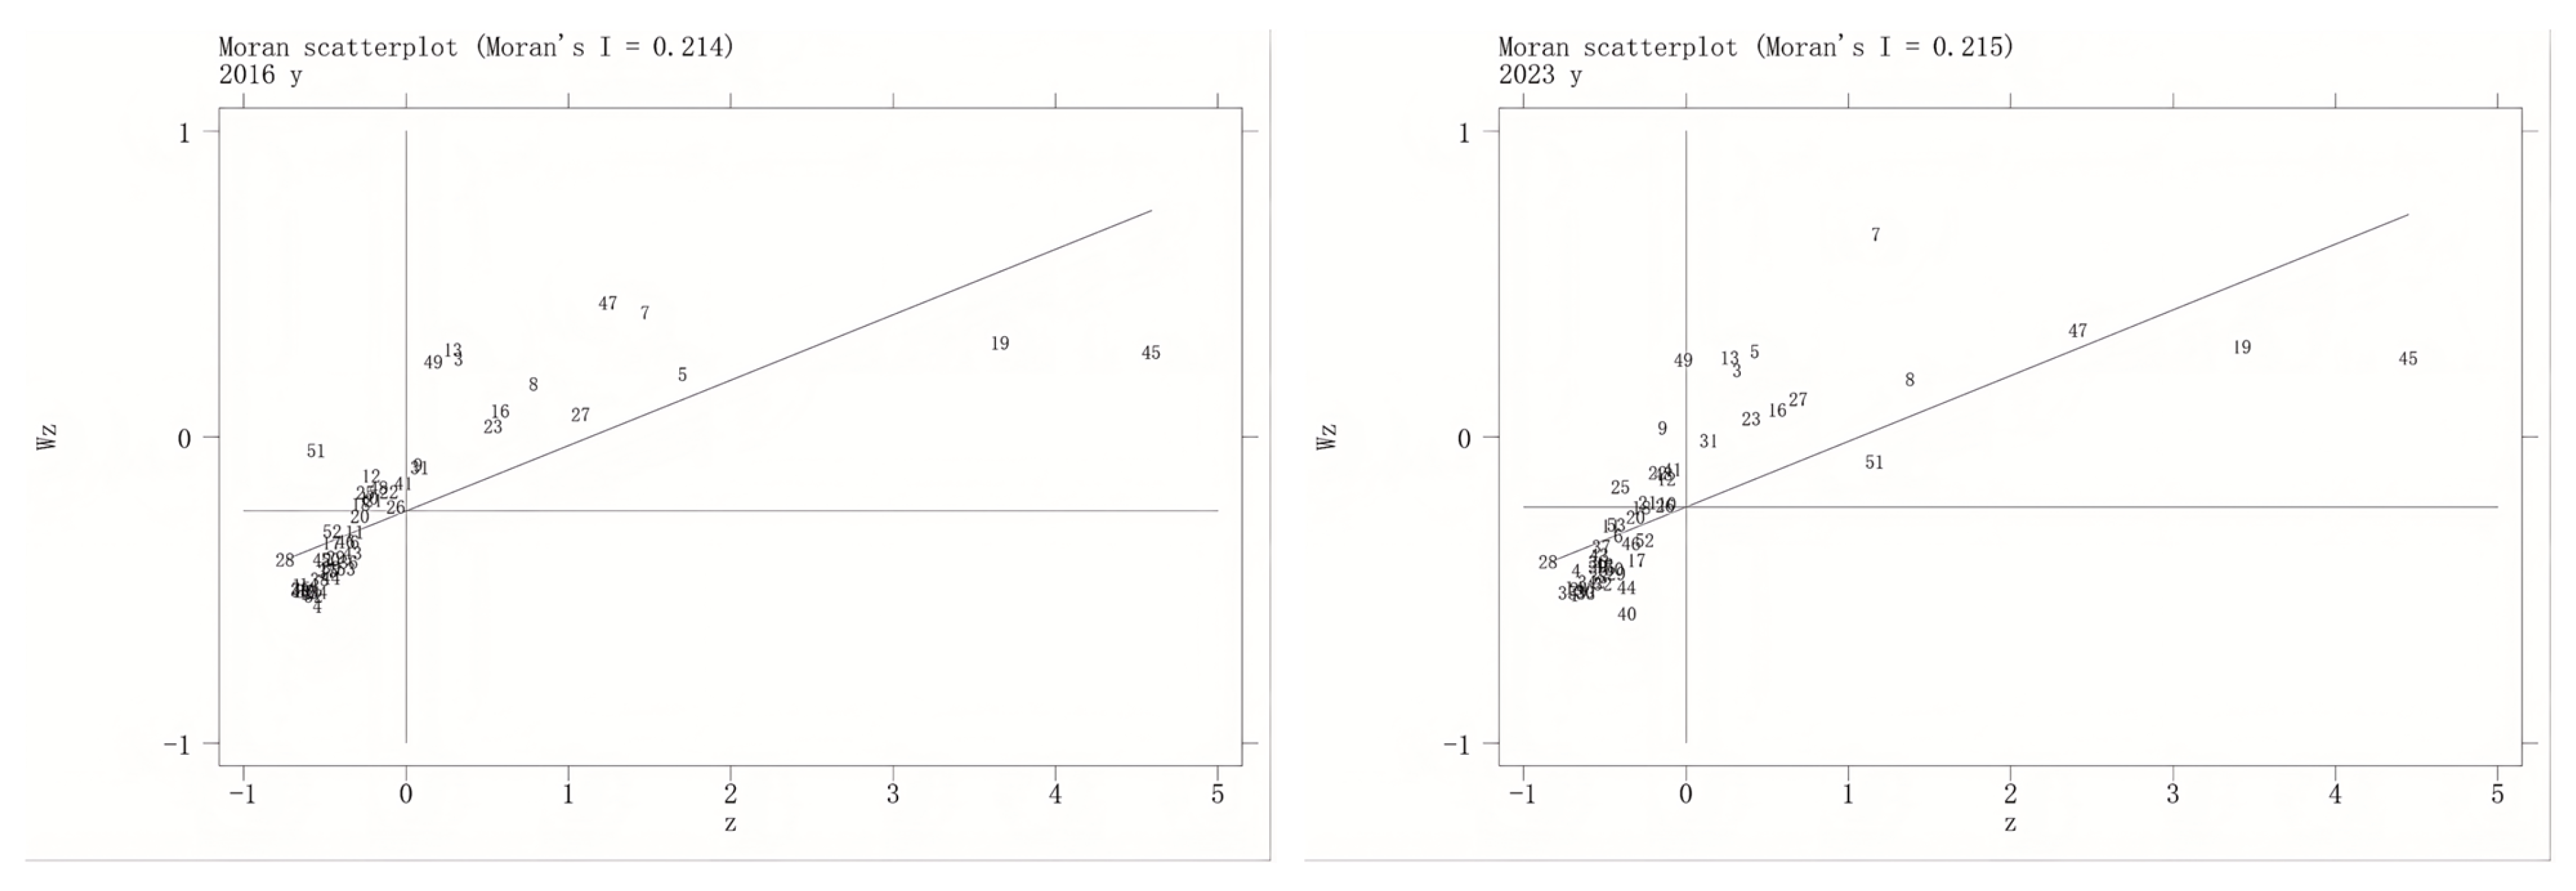



| Primary Indicator | Secondary Indicator | Specific Indicator | EM W. |
|---|---|---|---|
| Innovative City Dimension | Innovation Capability | Number of Marine AI Enterprises (unit) | 0.1197 |
| R&D Expenditure of Marine Research Institutions (10,000 yuan) | 0.0660 | ||
| Innovation Performance | Number of AI Patents Held by Listed Companies (unit) | 0.1299 | |
| Coordinated City Dimension | Regional Coordination | Per Capita Gross Ocean Product (100 million yuan/10,000 people) | 0.0250 |
| Total Retail Sales of Consumer Goods (10,000 yuan) | 0.0428 | ||
| Land–Sea Economic Linkage (%) | 0.0125 | ||
| Industrial Upgrading | Proportion of Marine Tertiary Industry (%) | 0.0013 | |
| Proportion of Marine Secondary Industry (%) | 0.0034 | ||
| Proportion of Marine Primary Industry (%) | 0.0029 | ||
| Green City Dimension | Resource Endowment | Forest Coverage Rate of Coastal Cities (%) | 0.0078 |
| Built-up Area of Coastal Cities (sq. km) | 0.0423 | ||
| Marine Ranch Area (hectares) | 0.1494 | ||
| Environmental Performance | Industrial Particulate Emissions per Unit of Marine-related Output (tons/100 million yuan) | 0.0001 | |
| Sulfur Dioxide Emissions per Unit of Marine-related Output (tons/100 million yuan) | 0.0011 | ||
| Total Industrial Wastewater Discharge per Unit of Marine-related Output (tons/100 million yuan) | 0.0001 | ||
| Open City Dimension | International Trade | Total Imports and Exports (10,000 USD) | 0.0872 |
| Level of Outward Foreign Direct Investment (10,000 USD) | 0.1032 | ||
| International Cooperation | Foreign Trade Dependence of Coastal Cities (%) | 0.0279 | |
| Foreign Exchange Income from International Tourism (10,000 USD) | 0.1145 | ||
| Inclusive City Dimension | Development Inclusiveness | Per Capita Disposable Income (yuan/person) | 0.0147 |
| Level of Coastal Infrastructure (km) | 0.0144 | ||
| Share of Food Expenditure in Total Consumption Expenditure (%) | 0.0018 | ||
| Service Inclusiveness | Per Capita Public Knowledge Dissemination in Cities (volumes/person) | 0.0269 | |
| Per Capita Urban Green Space Area (sq. meters/person) | 0.0049 |
| Primary Indicator | Secondary Indicator | Tertiary Indicator | Specific Indicator | EQ W. |
|---|---|---|---|---|
| Labor | Human Capital Accumulation | Future Labor Force Reserve | Number of Domestic Undergraduate Students (persons) | 0.0526 |
| Number of International Students in China (persons) | 0.0526 | |||
| Full-Time Equivalent of Practitioners | Number of Employees at Period-end (persons) | 0.0526 | ||
| High-end Talent Level | High-quality Labor Force | Marine R&D Personnel (persons) | 0.0526 | |
| Attention to Introduction of Overseas Science and Technology Talent (times) | 0.0526 | |||
| Means of Labor | Tangible Means of Labor | Domestic Capital | Marine Capital Stock (10,000 yuan) | 0.0526 |
| International Capital | Level of Foreign Capital Utilization (10,000 USD) | 0.0526 | ||
| Intangible Means of Labor | Intelligent Technology | Technology Market Transaction Value (100 million yuan) | 0.0526 | |
| Contract Value of Foreign Technology Introduction (10,000 USD) | 0.0526 | |||
| Patent Authorization | Number of Patents Granted (items) | 0.0526 | ||
| Number of Robot Patents Granted to Listed Companies (items) | 0.0526 | |||
| Objects of Labor | Resource and Environment Input | Resource Input | Total Marine Energy Consumption (100 tons of standard coal) | 0.0526 |
| Port International Standard Container Throughput (10,000 TEU) | 0.0526 | |||
| Environmental Input | Number of Green Patents Granted (items) | 0.0526 | ||
| Expenditure on Energy Conservation and Environmental Protection (10,000 yuan) | 0.0526 | |||
| Digital Economy Development | Data Factor Application | Level of Enterprise Data Factor Utilization (times) | 0.0526 | |
| E-commerce Transaction Volume (10,000 yuan) | 0.0526 | |||
| Digital Platform Construction | Number of Internet Broadband Access Subscribers (1000 households) | 0.0526 | ||
| Attention to Cross-border E-commerce (times) | 0.0526 |
| Variable Type | Tier-1 Indicator | Tier-2 Indicator | Tier-3 Indicator |
|---|---|---|---|
| Input Indicators | Labor Input | Workforce Input | Number of Employed Persons (persons) |
| Capital Input | Tangible Capital Input | Capital Stock (10,000 yuan) | |
| Intangible Capital Input | Utilization Frequency of Enterprise Data Elements (times) | ||
| Value of Technology Market Transactions (100 million yuan) | |||
| R&D Input | Human Capital Input | R&D Personnel (persons) | |
| R&D Expenditure Input | Internal Expenditure on R&D (10,000 yuan) | ||
| Resource Input | Water Resource Input | Urban Water Withdrawal (10,000 m3) | |
| Green Space Investment | Urban Park Construction Investment (hectares) | ||
| Energy Input | Total Energy Consumption (million tons of SCE) | ||
| Output Indicators | Desirable Outputs | Innovation Output | Number of Invention Patent Grants (items) |
| Number of Robot Patent Grants (items) | |||
| Economic Output | Gross Regional Product (100 million yuan) | ||
| Social Output | Number of Internet Broadband Subscribers (1000 households) | ||
| Undesirable Outputs | Environmental Output | Greenhouse Gas Emissions (tons) | |
| Low-quality Innovation | Number of Design Patent Applications/Grants (items) |
| Variable | Sample | Mean | Standard Deviation | Minimum | Median | Maximum |
|---|---|---|---|---|---|---|
| HQMED | 1060 | 0.059 | 0.060 | 0.011 | 0.041 | 0.495 |
| NQPFS | 1060 | 0.189 | 0.628 | −0.330 | 0.057 | 9.444 |
| NQPFC | 1060 | 0.826 | 0.323 | 0.079 | 1.001 | 2.027 |
| lnDEV | 1060 | 10.850 | 0.714 | 8.543 | 10.925 | 13.056 |
| URB | 1060 | 0.613 | 0.171 | 0.217 | 0.616 | 1.355 |
| IND | 1060 | 0.504 | 0.168 | 0.084 | 0.507 | 1.157 |
| EDU | 1060 | 0.192 | 0.050 | 0.057 | 0.191 | 0.368 |
| RD | 1060 | 0.022 | 0.020 | 0.000 | 0.016 | 0.130 |
| Year | Moran’s I | Z | Year | Moran’s I | Z |
|---|---|---|---|---|---|
| 2004 | 0.177 | 2.735 | 2014 | 0.200 | 3.161 |
| 2005 | 0.192 | 2.904 | 2015 | 0.210 | 3.264 |
| 2006 | 0.195 | 2.953 | 2016 | 0.214 | 3.280 |
| 2007 | 0.195 | 2.955 | 2017 | 0.205 | 3.171 |
| 2008 | 0.207 | 3.125 | 2018 | 0.203 | 3.174 |
| 2009 | 0.204 | 3.087 | 2019 | 0.199 | 3.147 |
| 2010 | 0.203 | 3.086 | 2020 | 0.192 | 3.049 |
| 2011 | 0.199 | 3.056 | 2021 | 0.190 | 3.045 |
| 2012 | 0.196 | 3.025 | 2022 | 0.203 | 3.136 |
| 2013 | 0.202 | 3.113 | 2023 | 0.215 | 3.238 |
| (1) | (2) | (3) | (4) | (5) | (6) | |
|---|---|---|---|---|---|---|
| HQMED | HQMED | HQMED | HQMED | HQMED | HQMED | |
| NQPFS | 0.006 *** | 0.006 *** | 0.005 *** | 0.005 *** | 0.006 *** | 0.006 *** |
| (4.39) | (4.57) | (4.23) | (4.24) | (4.40) | (5.04) | |
| In DEV | −0.022 *** | −0.021 *** | −0.025 *** | −0.019 *** | −0.015 *** | |
| (−4.88) | (−4.81) | (−4.92) | (−3.74) | (−3.11) | ||
| URB | −0.073 *** | −0.070 *** | −0.070 *** | −0.067 *** | ||
| (−5.97) | (−5.71) | (−5.78) | (−5.76) | |||
| IND | 0.014 | 0.015 * | 0.007 | |||
| (1.50) | (1.69) | (0.81) | ||||
| EDU | 0.188 *** | 0.157 *** | ||||
| (5.34) | (4.60) | |||||
| RD | 0.645 *** | |||||
| (9.06) | ||||||
| cons | 0.058 *** | 0.294 *** | 0.332 *** | 0.365 *** | 0.265 *** | 0.218 *** |
| (72.51) | (6.07) | (6.90) | (6.90) | (4.78) | (4.07) | |
| City Fixed Effects | Yes | Yes | Yes | Yes | Yes | Yes |
| Year Fixed Effects | Yes | Yes | Yes | Yes | Yes | Yes |
| N | 1060 | 1060 | 1060 | 1060 | 1060 | 1060 |
| Adj. R2 | 0.829 | 0.833 | 0.838 | 0.839 | 0.843 | 0.855 |
| (1) | (2) | (3) | (4) | (5) | (6) | |
|---|---|---|---|---|---|---|
| HQMED | HQMED | HQMED | HQMED | HQMED | HQMED | |
| NQPFC | 0.022 *** | 0.024 *** | 0.023 *** | 0.023 *** | 0.023 *** | 0.020 *** |
| (7.25) | (7.86) | (7.83) | (7.69) | (7.86) | (6.78) | |
| In DEV | −0.025 *** | −0.024 *** | −0.025 *** | −0.019 *** | −0.016 *** | |
| (−5.59) | (−5.53) | (−5.00) | (−3.80) | (−3.21) | ||
| URB | −0.074 *** | −0.073 *** | −0.073 *** | −0.071 *** | ||
| (−6.18) | (−6.07) | (−6.15) | (−6.15) | |||
| IND | 0.004 | 0.005 | −0.001 | |||
| (0.39) | (0.56) | (−0.06) | ||||
| EDU | 0.188 *** | 0.160 *** | ||||
| (5.44) | (4.76) | |||||
| RD | 0.550 *** | |||||
| (7.73) | ||||||
| cons | 0.040 *** | 0.306 *** | 0.344 *** | 0.352 *** | 0.252 *** | 0.214 *** |
| (15.33) | (6.44) | (7.31) | (6.80) | (4.65) | (4.04) | |
| City Fixed Effects | Yes | Yes | Yes | Yes | Yes | Yes |
| Year Fixed Effects | Yes | Yes | Yes | Yes | Yes | Yes |
| N | 1060 | 1060 | 1060 | 1060 | 1060 | 1060 |
| Adj. R2 | 0.834 | 0.839 | 0.845 | 0.845 | 0.849 | 0.858 |
| (1) | (2) | (3) | (4) | |
|---|---|---|---|---|
| NQPFS (First Stage) | HQMED (Second Stage) | NQPFC (First Stage) | HQMED (Second Stage) | |
| NQPFS | 0.024 ** | |||
| (2.51) | ||||
| NQPFC | 0.144 *** | |||
| (6.51) | ||||
| In DEV | 0.030 | −0.017 ** | 0.081 | −0.020 * |
| (0.40) | (−2.49) | (1.34) | (−1.76) | |
| URB | −0.718 *** | −0.055 *** | 0.048 | −0.069 *** |
| (−2.86) | (−3.42) | (0.35) | (−3.06) | |
| IND | 0.036 | 0.007 | 0.370 *** | −0.049 *** |
| (0.27) | (0.65) | (4.41) | (−2.58) | |
| EDU | −0.431 | 0.164 *** | −1.084 *** | 0.198 *** |
| (−0.63) | (3.94) | (−2.79) | (3.03) | |
| RD | −3.277 ** | 0.699 *** | 2.212 ** | 0.076 |
| (−2.26) | (6.41) | (2.52) | (0.44) | |
| lniv1 | 0.174 *** | |||
| (4.42) | ||||
| lniv2 | 0.030 *** | |||
| (7.13) | ||||
| City Fixed Effects | Yes | Yes | Yes | Yes |
| Year Fixed Effects | Yes | Yes | Yes | Yes |
| C-D Wald F statistic | 75.943 | 79.217 | ||
| K-P Wald F statistic | 19.505 | 50.895 | ||
| LM statistic | 17.346 p-val = 0.0000 | 41.600 p-val = 0.0000 | ||
| N | 1060 | 1060 | 1060 | 1060 |
| Adj. R2 | 0.006 | −0.085 | 0.056 | −1.489 |
| (1) | (2) | (3) | (4) | |
|---|---|---|---|---|
| MLPR | MLPR | HQMED | HQMED | |
| NQPFS | 0.001 *** | 0.006 *** | ||
| (5.15) | (5.01) | |||
| NQPFC | 0.001 *** | 0.019 *** | ||
| (2.73) | (6.40) | |||
| In DEV | 0.002 *** | 0.002 *** | −0.024 *** | −0.019 *** |
| (3.93) | (3.91) | (−3.89) | (−3.20) | |
| URB | 0.001 | 0.001 | −0.065 *** | −0.070 *** |
| (1.17) | (0.82) | (−5.62) | (−6.07) | |
| IND | 0.000 | −0.000 | −0.003 | −0.005 |
| (0.14) | (−0.20) | (−0.34) | (−0.51) | |
| EDU | −0.011 *** | −0.011 *** | 0.150 *** | 0.157 *** |
| (−3.17) | (−3.13) | (4.41) | (4.65) | |
| RD | −0.001 | −0.006 | 0.572 *** | 0.520 *** |
| (−0.19) | (−0.88) | (7.37) | (6.75) | |
| InECOD | 0.018 ** | 0.008 | ||
| (2.33) | (1.03) | |||
| _cons | −0.015 *** | −0.015 *** | 0.170 *** | 0.192 *** |
| (−2.79) | (−2.79) | (2.96) | (3.38) | |
| City Fixed Effects | Yes | Yes | Yes | Yes |
| Year Fixed Effects | Yes | Yes | Yes | Yes |
| N | 1060 | 1060 | 1060 | 1060 |
| Adj. R2 | 0.541 | 0.532 | 0.856 | 0.858 |
| (1) | (2) | (3) | (4) | |
|---|---|---|---|---|
| MIC | HQMED | LnNBE | HQMED | |
| NQPFS | 0.022 *** | 0.005 *** | ||
| (8.02) | (3.85) | |||
| NQPFC | 0.961 *** | 0.019 *** | ||
| (3.12) | (6.45) | |||
| MIC | 0.061 *** | |||
| (4.35) | ||||
| LnNBE | 0.001 *** | |||
| (3.39) | ||||
| In DEV | −0.053 *** | −0.012 ** | −1.537 *** | −0.014 *** |
| (−4.76) | (−2.45) | (−2.99) | (−2.89) | |
| URB | 0.022 | −0.068 *** | 4.775 *** | −0.076 *** |
| (0.85) | (−5.93) | (3.94) | (−6.56) | |
| IND | 0.094 *** | 0.001 | −1.853 ** | 0.001 |
| (4.77) | (0.15) | (−2.01) | (0.16) | |
| EDU | 0.284 *** | 0.139 *** | 7.587 ** | 0.153 *** |
| (3.70) | (4.10) | (2.14) | (4.54) | |
| RD | 0.957 *** | 0.586 *** | 32.227 *** | 0.517 *** |
| (5.97) | (8.17) | (4.30) | (7.24) | |
| _cons | 0.574 *** | 0.183 *** | 26.090 *** | 0.187 *** |
| (4.76) | (3.41) | (4.69) | (3.52) | |
| City Fixed Effects | Yes | Yes | Yes | Yes |
| Year Fixed Effects | Yes | Yes | Yes | Yes |
| N | 1060 | 1060 | 1060 | 1060 |
| Adj. R2 | 0.879 | 0.858 | 0.812 | 0.859 |
| (1) | (2) | (3) | |
|---|---|---|---|
| HQMED | HQMED | HQMED | |
| NQPFS | 0.005 *** | 0.005 *** | |
| (4.46) | (4.08) | ||
| NQPFS × KM | −0.010 *** | ||
| (−3.73) | |||
| KM | 0.029 *** | ||
| −0.010 *** | |||
| NQPFS × LM | −0.010 *** | ||
| (−5.27) | |||
| LM | 0.014 *** | ||
| (10.98) | |||
| NQPFC | 0.009 *** | ||
| (3.06) | |||
| NQPFC × IE | 0.107 *** | ||
| (10.50) | |||
| IE | 0.062 *** | ||
| (5.11) | |||
| In DEV | −0.005 | −0.025 *** | −0.014 *** |
| (−0.93) | (−5.32) | (−3.02) | |
| URB | −0.064 *** | −0.067 *** | −0.054 *** |
| (−5.70) | (−6.18) | (−5.04) | |
| IND | 0.001 | 0.011 | −0.002 |
| (0.15) | (1.33) | (−0.23) | |
| EDU | 0.079 ** | 0.209 *** | 0.085 *** |
| (2.30) | (6.58) | (2.73) | |
| RD | 0.476 *** | 0.706 *** | 0.387 *** |
| (6.61) | (10.69) | (5.78) | |
| _cons | 0.112 ** | 0.298 *** | 0.187 *** |
| (2.09) | (5.96) | (3.85) | |
| City Fixed Effects | Yes | Yes | Yes |
| Year Fixed Effects | Yes | Yes | Yes |
| N | 1060 | 1060 | 1060 |
| Adj. R2 | 0.865 | 0.876 | 0.881 |
| (1) | (2) | (3) | (4) | (5) | (6) | |
|---|---|---|---|---|---|---|
| Northern | Eastern | Southern | Northern | Eastern | Southern | |
| NQPFS | −0.009 *** | 0.009 *** | −0.001 | |||
| (−2.95) | (4.37) | (−0.50) | ||||
| NQPFC | 0.008 ** | 0.057 *** | 0.003 | |||
| (2.32) | (6.64) | (0.70) | ||||
| In DEV | −0.007 | −0.031 * | −0.006 | −0.009 | −0.021 | −0.006 |
| (−0.82) | (−1.66) | (−1.01) | (−1.04) | (−1.21) | (−1.01) | |
| URB | −0.018 | −0.238 *** | −0.061 *** | −0.016 | −0.203 *** | −0.062 *** |
| (−1.51) | (−5.18) | (−3.37) | (−1.37) | (−4.64) | (−3.40) | |
| IND | 0.044 *** | −0.093 * | −0.013 | 0.044 *** | −0.140 *** | −0.014 |
| (4.60) | (−1.66) | (−1.09) | (4.59) | (−2.63) | (−1.15) | |
| EDU | 0.114 ** | 0.413 *** | 0.170 *** | 0.134 *** | 0.251 ** | 0.173 *** |
| (2.31) | (3.43) | (4.14) | (2.69) | (2.13) | (4.21) | |
| RD | 0.460 *** | 0.210 | 0.683 *** | 0.430 *** | 0.102 | 0.677 *** |
| (3.67) | (0.72) | (7.88) | (3.40) | (0.38) | (7.74) | |
| _cons | 0.086 | 0.528 *** | 0.119 * | 0.097 | 0.414 ** | 0.117* |
| (0.93) | (2.72) | (1.83) | (1.03) | (2.25) | (1.78) | |
| City Fixed Effects | Yes | Yes | Yes | Yes | Yes | Yes |
| Year Fixed Effects | Yes | Yes | Yes | Yes | Yes | Yes |
| N | 340 | 220 | 500 | 340 | 220 | 500 |
| Adj. R2 | 0.834 | 0.896 | 0.866 | 0.834 | 0.896 | 0.866 |
| (1) | (2) | (1) | (2) | |
|---|---|---|---|---|
| Core Cities | General Cities | Core Cities | General Cities | |
| NQPFS | 0.009 *** | −0.002 | ||
| (3.92) | (−1.62) | |||
| NQPFC | 0.029 *** | 0.001 | ||
| (3.12) | (0.15) | |||
| In DEV | −0.058 *** | 0.005 * | −0.064 *** | 0.005 * |
| (−3.14) | (1.77) | (−3.38) | (1.76) | |
| URB | −0.201 *** | −0.020 *** | −0.196 *** | −0.019 ** |
| (−5.46) | (−2.69) | (−5.21) | (−2.55) | |
| IND | 0.022 | −0.008 | 0.010 | −0.009 |
| (0.64) | (−1.55) | (0.28) | (−1.62) | |
| EDU | 0.053 | 0.002 | 0.037 | 0.002 |
| (0.35) | (0.08) | (0.24) | (0.12) | |
| RD | 0.314 | 0.291 *** | 0.170 | 0.293 *** |
| (1.39) | (6.05) | (0.75) | (6.07) | |
| _cons | 0.897 *** | −0.003 | 0.955 *** | −0.004 |
| (4.13) | (−0.11) | (4.31) | (−0.13) | |
| City Fixed Effects | Yes | Yes | Yes | Yes |
| Year Fixed Effects | Yes | Yes | Yes | Yes |
| N | 220 | 840 | 220 | 840 |
| Adj. R2 | 0.878 | 0.828 | 0.878 | 0.828 |
Disclaimer/Publisher’s Note: The statements, opinions and data contained in all publications are solely those of the individual author(s) and contributor(s) and not of MDPI and/or the editor(s). MDPI and/or the editor(s) disclaim responsibility for any injury to people or property resulting from any ideas, methods, instructions or products referred to in the content. |
© 2026 by the authors. Licensee MDPI, Basel, Switzerland. This article is an open access article distributed under the terms and conditions of the Creative Commons Attribution (CC BY) license.
Share and Cite
Zhang, Y.; Liu, S.; Kong, Y.; Ma, A. Effect of Spatial Flow and Optimal Combination of New Quality Productivity Forces on High-Quality Economic Development of Coastal Regions: Evidence from China 53 Coastal Cities. Sustainability 2026, 18, 2262. https://doi.org/10.3390/su18052262
Zhang Y, Liu S, Kong Y, Ma A. Effect of Spatial Flow and Optimal Combination of New Quality Productivity Forces on High-Quality Economic Development of Coastal Regions: Evidence from China 53 Coastal Cities. Sustainability. 2026; 18(5):2262. https://doi.org/10.3390/su18052262
Chicago/Turabian StyleZhang, Yutong, Shuguang Liu, Yawen Kong, and Aile Ma. 2026. "Effect of Spatial Flow and Optimal Combination of New Quality Productivity Forces on High-Quality Economic Development of Coastal Regions: Evidence from China 53 Coastal Cities" Sustainability 18, no. 5: 2262. https://doi.org/10.3390/su18052262
APA StyleZhang, Y., Liu, S., Kong, Y., & Ma, A. (2026). Effect of Spatial Flow and Optimal Combination of New Quality Productivity Forces on High-Quality Economic Development of Coastal Regions: Evidence from China 53 Coastal Cities. Sustainability, 18(5), 2262. https://doi.org/10.3390/su18052262