


Abstract
In light of the low efficiency and unstable power transmission capacity of grid-connected energy storage in photovoltaic (PV) systems, this paper proposes a maximum power point tracking (MPPT) control strategy based on a novel intelligent fusion algorithm. We begin by highlighting that improving the power generation efficiency of PV systems under non-ideal conditions—such as partial shading—is a key challenge for increasing the utilization rate of renewable energy and promoting the sustainability of energy systems. The proposed strategy integrates two complementary search algorithms: the Whale Optimization Algorithm (WOA) for global exploration and the Sparrow Search Algorithm (SSA) for local exploitation. These are combined through a weighted superposition mechanism to enhance the overall search balance. First, a Chaotic Map is used to initialize the populations of both WOA and SSA, while population weights are restructured to improve diversity. Subsequently, a weighted superposition mechanism reorganizes the initialized populations to generate a fused WOSSA population, enabling a global search that produces and evolves a set of optimal solutions across the entire search space, further enhancing search diversity. Then, a local search is applied to selected high-quality individuals to prevent premature convergence and rapidly exploit promising regions. Finally, boundary-handling functions and a power restart mechanism are introduced during the population position update phase to refine position updates in the WOSSA algorithm. This optimizes the iterative process, accelerates convergence, and strengthens the algorithm’s ability to escape local optima. The proposed algorithm is simulated in MATLAB. Simulation results demonstrate that, compared with the SSA algorithm, the convergence speed is improved by approximately 55%, the maximum power tracking performance is enhanced by about 70%, and the voltage of the energy storage unit remains above 380 V. Experimental validation further shows that the PV system achieves an average daily output of 425.5 V and 4.3 A, a grid frequency of 49.9 Hz, a daily energy yield of 0.5 kWh, and a power generation efficiency per unit installation area of 2 kW. The method also exhibits good performance in improving the quality of grid-connected power.
1. Introduction
Improving the power generation efficiency of photovoltaic systems under non-ideal conditions, such as partial shading, is a key challenge in increasing the utilization rate of renewable energy and promoting the sustainable development of energy systems. Grid-connected photovoltaic systems (GIPVS) are widely favored for their excellent power transmission capability. Key technical indicators—including voltage fluctuation and imbalance—must strictly comply with Chinese GB standards. Maximum power point tracking (MPPT) methods based on intelligent optimization algorithms have attracted significant attention due to their strong global search capability. However, the tracking performance of MPPT algorithms is often affected by random fluctuations in irradiance. This issue may lead to additional economic losses, particularly in the event of grid-connected equipment failure.
The photovoltaic grid connection method using a PID controller has been studied extensively. After incorporating the algorithm, it was found that the power quality parameters were improved, and the voltage, current and output power at the MPP point had better performance [1]. Among them, the algorithm has always been the main research object of MPPT, and intelligent algorithms perform better in most fields because they directly calculate the photovoltaic voltage reference based on the photovoltaic power reference and can flexibly adjust the operating point of the photovoltaic array [2,3,4,5,6,7,8,9,10,11,12]. For example, the variable step size P&O strategy of the adaptive single neural control (ASNC) algorithm can effectively improve the MPPT control scheme in terms of power [13]. However, these algorithms are prone to fall into local optima due to their lack of local optimal escape particles. There are also algorithms using the P&O algorithm to eliminate the oscillations of photovoltaic power around the peak point. This algorithm can correctly identify the oscillations and add a boundary condition to prevent it from deviating [14]. Generally, intelligent algorithms have good convergence speed, small steady-state oscillations and accurate tracking [15,16,17,18]. The dual-level three-phase GIPVS works in the DPGM to reduce the additional feed-in power during peak hours. It avoids the drift phenomenon existing in the traditional P&O algorithm. The proposed algorithm in this paper operates in a modified MPPT mode during off-peak hours [19]. The optimal torque (OT) control method can also be applied [20]. The method of pressure delay penetration optimization based on Harris’ eagle optimization can also effectively improve the MPP [21]. When a sudden drop in power causes a secondary frequency drop, the auxiliary frequency control technology can effectively enhance the maximum power point tracking (MPPT) performance [22,23,24]. In recent years, the integration of algorithms has become an important research direction in the MPPT field. Among them, the hybrid algorithm of particle swarm optimization (PSO) and gray wolf optimization (GWO) has stood out, demonstrating significant advantages in improving power convergence speed, tracking accuracy, and reducing the amplitude of power oscillations during the iterative process [25]. In response to the inherent deficiencies of intelligent swarm algorithms, such as the whale optimization algorithm (WOA), which, despite its strong global search capability and excellent performance in mechanical fault signal decomposition [26], has relatively weak local search ability; and the sparrow search algorithm (SSA), which, with its outstanding local search characteristics, plays a key role in short-term photovoltaic power generation prediction [27]. Research shows that combining the advantages of WOA and SSA to construct a hybrid optimization algorithm has led to significant improvements in the evaluation indicators of relevant models for wind power prediction [28]. These research results fully demonstrate the important value and application potential of hybrid algorithms in the MPPT field.
It may also be achieved through the adaptive frequency response control framework for the tailwind influence in the frequency regulation of the power system. This framework combines virtual inertia control and primary frequency control, and responds to low-frequency and over-frequency events with power supply [29]. Additionally, by adding high penetration rate inverter interface to the renewable energy system, there exists an AGC regulation resource for SCED model, which considers the operation of renewable energy under VSR mode to achieve joint scheduling of power generation and reserve [30]. Among them, PRRC, decoupling scheme, by adopting the proposed scheme, can eliminate the negative impact of response characteristics [31,32]. In a single-phase photovoltaic system, this system can be composed of a series of local micro-inverters combined with the photovoltaic system, and is applicable for domestic applications. Due to its AC module structure, when performing MPPT at the module level, it can extract as much solar energy as possible under partial shading conditions [33,34]. When it meets the grid standards, it can be connected to the grid, including coordination control technologies, etc. [35,36]. In the investigation of the grid connection experiment, the relevant results under the influence of grid faults should also be analyzed [37]. To address the core challenges in the field of sustainable energy, the integration of energy storage systems has become a key link in supporting the high proportion of renewable energy access. Whether based on traditional battery energy storage or relying on emerging renewable hydrogen systems, a basic prerequisite for their efficient and stable operation is to ensure the sustainability and self-sufficiency of the energy supply process. Under complex environmental conditions, how to effectively control the cost of power generation and ensure the dispatchable power supply capacity is the core technical proposition for the engineering application of grid-connected energy storage systems [38]. The WOSSA optimization algorithm is designed to fundamentally enhance the accuracy and robustness of MPPT.
In conclusion, extensive research has been conducted in the literature, exploring a wide range of characteristics. The advantages and disadvantages of the MPPT method are summarized in Table 1.
Table 1.
Comparison of MPPT Methods in the References.
Research on maximum power point tracking (MPPT) under partial shading conditions of photovoltaic (PV) arrays has achieved considerable progress, with related features and methods widely discussed in the literature. However, existing studies still exhibit certain limitations: achieving fast and accurate tracking of the global maximum power point (GMPP) under partial shading remains a key technical challenge. Moreover, most existing algorithms still have room for improvement in terms of convergence time and dynamic balance during the tracking process. Additionally, coordinated control of MPPT in complex operating environments such as grid-connected energy storage systems has not been sufficiently investigated and warrants further exploration. To address these gaps, this study proposes an innovative hybrid algorithm named WOSSA, which integrates the Whale Optimization Algorithm (WOA) and the Sparrow Search Algorithm (SSA). The proposed algorithm aims to significantly enhance the MPPT performance and grid-connected operation of PV systems under complex and variable partial shading conditions. In the WOSSA algorithm, a chaotic map is first employed to initialize the population, improving the diversity of the initial solutions. The global search phase then evolves a set of candidate solutions across the entire search space, after which a local search refines promising individuals to avoid premature convergence and to accelerate exploitation of high-quality regions. Finally, mechanisms such as a boundary-handling function are introduced to update the population positions effectively. This thus proves that integrating the two to simultaneously enhance both global exploration and local development capabilities is a direct and necessary approach to addressing the core challenges of photovoltaic MPPT. The remaining parts of this paper are organized as follows. The first section introduces the system framework and the modeling of the grid-connected system’s working strategy. The second section details the basic control strategy of the proposed algorithm. In addition, the third section will present the simulation and experimental results supporting the proposed control strategy. Finally, the fourth section presents the conclusion.
2. Independent Photovoltaic System
2.1. Photovoltaic Array Modeling
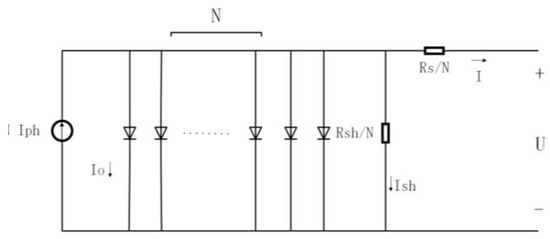
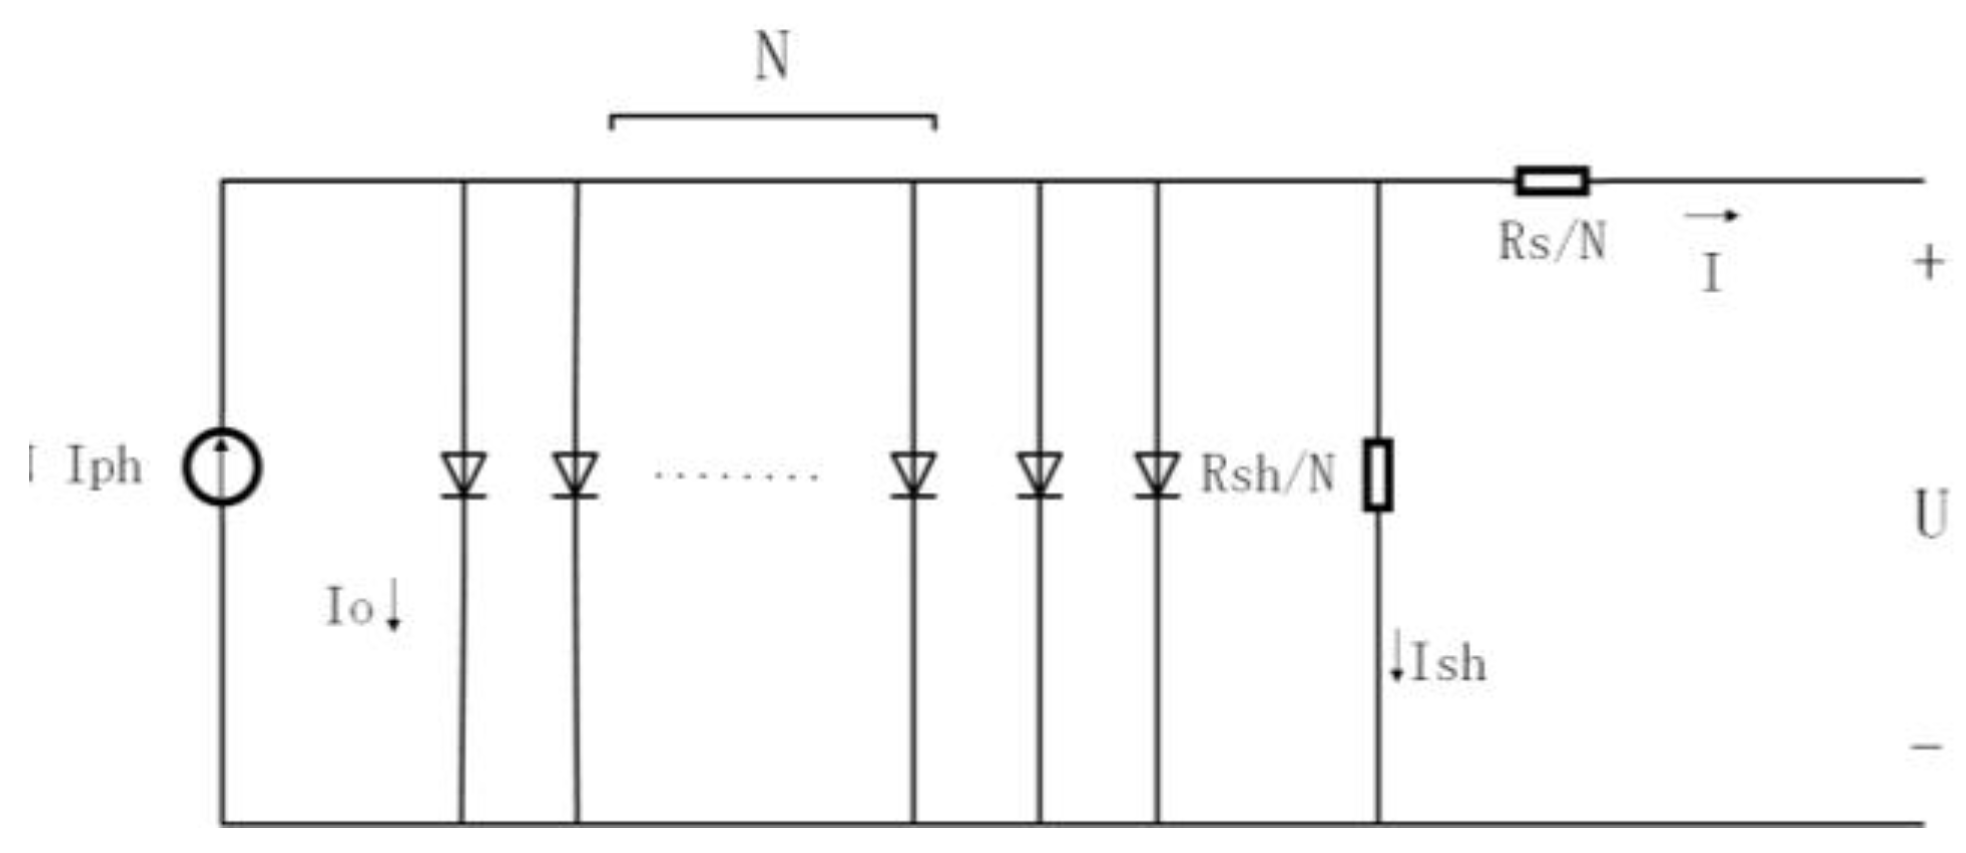
Shadow conditions have a dual impact on photovoltaic systems: they not only significantly reduce the system’s output power but may also trigger the hot spot effect, thereby threatening both operational safety and system service life. Therefore, developing MPPT algorithms capable of effectively coping with shadow conditions is of great theoretical and practical significance for improving the power generation efficiency and operational reliability of photovoltaic systems. Although existing intelligent optimization algorithms have alleviated the problems caused by partial shading to some extent, several technical bottlenecks remain—such as slow convergence speed and a tendency to become trapped in local optima. Addressing these issues is essential for the further optimization and performance enhancement of MPPT algorithms. A simplified model of photovoltaic array cells is illustrated in Figure 1. This model is applicable to photovoltaic systems with N series-connected branches or N parallel-connected branches of photovoltaic modules, which are connected in a series-parallel manner. In Figure 1, The photovoltaic array cells generate photovoltaic current. For the current flowing through the diode; To divert the current of the resistor; I For the output current of the photovoltaic cell; For parallel resistance, For series resistance; U To provide the output voltage of the photovoltaic cell.
Figure 1.
Simple Model of Photovoltaic Array Cells.
As shown in Figure 1, it is a simple model of photovoltaic array cells. Based on the equivalent circuit model of a single diode for photovoltaic cells, according to Kirchhoff’s current law, the current I flowing through the load satisfies [38]:
In the formula, The photovoltaic array cells generate photovoltaic current. For the current flowing through the diode; To divert the current of the resistor; I For the output current of the photovoltaic cell; For parallel resistance, For series resistance; U To provide the output voltage of the photovoltaic cell, n is the ideal coefficient of the diode; k is the Boltzmann constant; T is the absolute temperature; q is the unit charge quantity; N is the number of N parallel photovoltaic modules. Here, let us assume that at that time , = 0 and = ∞. The mathematical formula will be derived as:
Studies have shown that partial shading can cause the shaded solar cell units to operate in a reverse bias state, which leads to a sharp increase in their series resistance and a significant decrease in their parallel resistance. According to the experimental measurement results in reference [37], under shading conditions, the series resistance increases from 1 × 10⁻⁵ ohms to 1 × 10⁻¹ ohms, thereby reducing the maximum power by 63%. Meanwhile, when the parallel resistance increases from 0.1 ohms to 100 ohms, the maximum power doubles. These changes in series and parallel resistance significantly affect the maximum output power of photovoltaic cells, as has been verified in related studies.
To ensure the fairness and validity of the algorithm performance comparison, all comparative experiments in this paper are conducted using the same photovoltaic model. To visually demonstrate the specific impact of resistance parameters on the output characteristics, we present the simulation results of the maximum power point under various series and parallel resistance values in Table 2. This illustrates the extent to which model parameter variations influence the evaluation benchmark and further highlights the rationality of comparing algorithms under unified model conditions.
Table 2.
Test results of the resistance variation in photovoltaic modules under partial shading.
To obtain I more intuitively, the current formula in the photovoltaic array cells can be simplified as:
Considering the components within the photovoltaic module and , The current flowing into the voltage divider resistor in the photovoltaic array cell model is:
Therefore, the voltage in the photovoltaic array cells is:
The parameters in the dual diode model of photovoltaic modules will fluctuate within a certain range due to manufacturing tolerances, aging, environmental factors, etc. In the experiments described below, we will simulate and sample within the reasonable distribution range of these key parameters, run the WOSSA algorithm, and observe the distribution of maximum power point tracking (MPPT) efficiency to quantify the influence range of model parameter uncertainty on the algorithm’s performance conclusion.
2.2. Grid-Connected Photovoltaic Sub-Module DC/AC Inverter
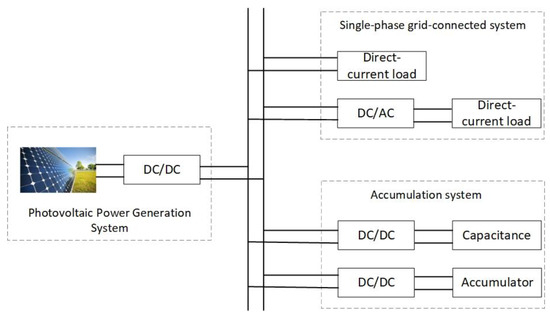
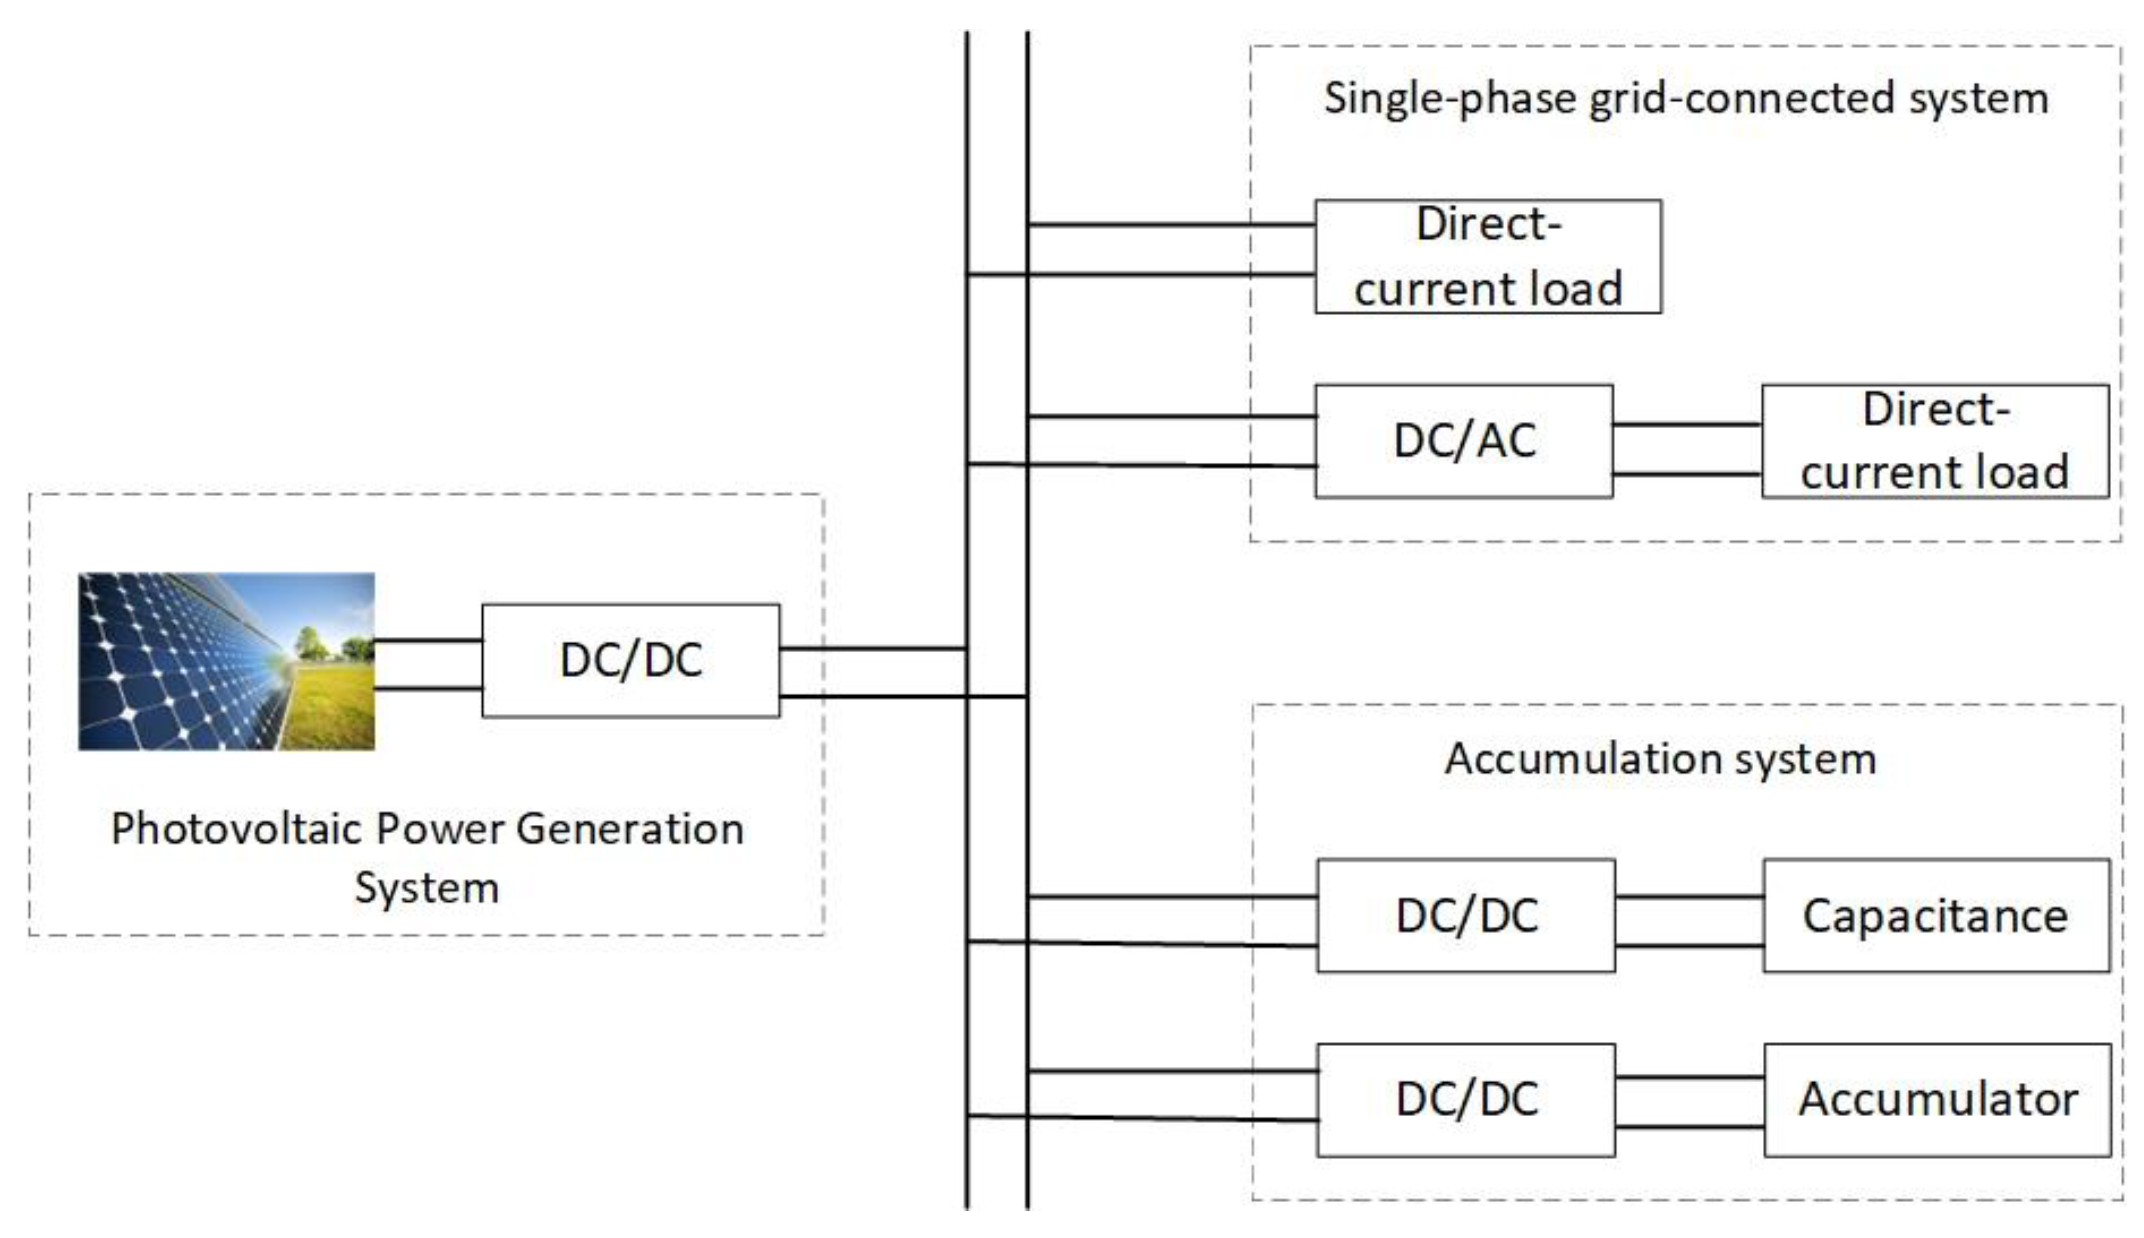
This paper incorporates a DC/AC inverter stage, utilizing a single-phase full-bridge inverter to achieve complete DC-to-AC power conversion and ensure stable grid-connected operation. The primary function of this stage is to convert the DC power from the DC link into standard 220 V/50 Hz sinusoidal AC power, while ensuring reliable power delivery to the grid. Additionally, this stage integrates islanding detection and protection functions to safeguard system operation. The main circuit incorporates a power frequency transformer (TR) to fulfill two key roles: it matches the inverter output voltage to the grid voltage, and it enables coordinated operation between the grid and the power generation system. The configuration of the single-phase photovoltaic grid-connected system is illustrated in Figure 2.
Figure 2.
Basic framework diagram of single-phase power grid with photovoltaic storage system.
The subsequent inverter employs Pulse Width Modulation (PWM) technology to generate switching signals for the inverter bridge. Under ideal operating conditions with no system overshoot, the spectrum of the PWM pulse voltage not only fully retains all information of the modulation wave, but also contains high-frequency harmonic components. These harmonics are primarily located near the switching frequency and its integer multiples. When the modulated wave the frequency is much lower than the carrier frequency. At that time , each switching cycle can be considered as if the modulated wave signal is a constant value, then we obtain:
In the formula, for modulating wave, for high-frequency carrier, to correspond to the turn-on time of the switch, for the carrier period, for carrier peak value.
3. Control Strategy of Intelligent Fusion Algorithm
3.1. Algorithm Principle
This algorithm combines two algorithms with different search strategies: the global search capability of WOA and the local exploitation ability of SSA. Given the potential complementarity between the search behaviors of WOA and SSA, the core contribution of this paper is to propose a hybrid WOSSA algorithm, which aims to improve the solution performance for specific problems by coordinating the global exploration and local exploitation capabilities of the two algorithms.
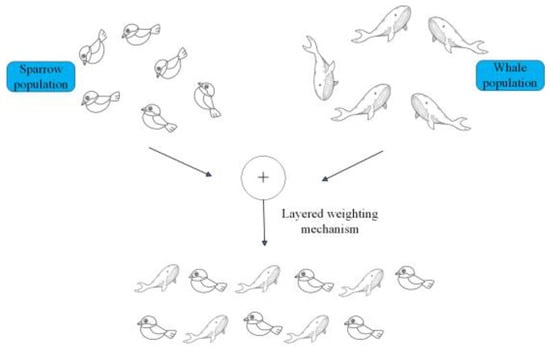
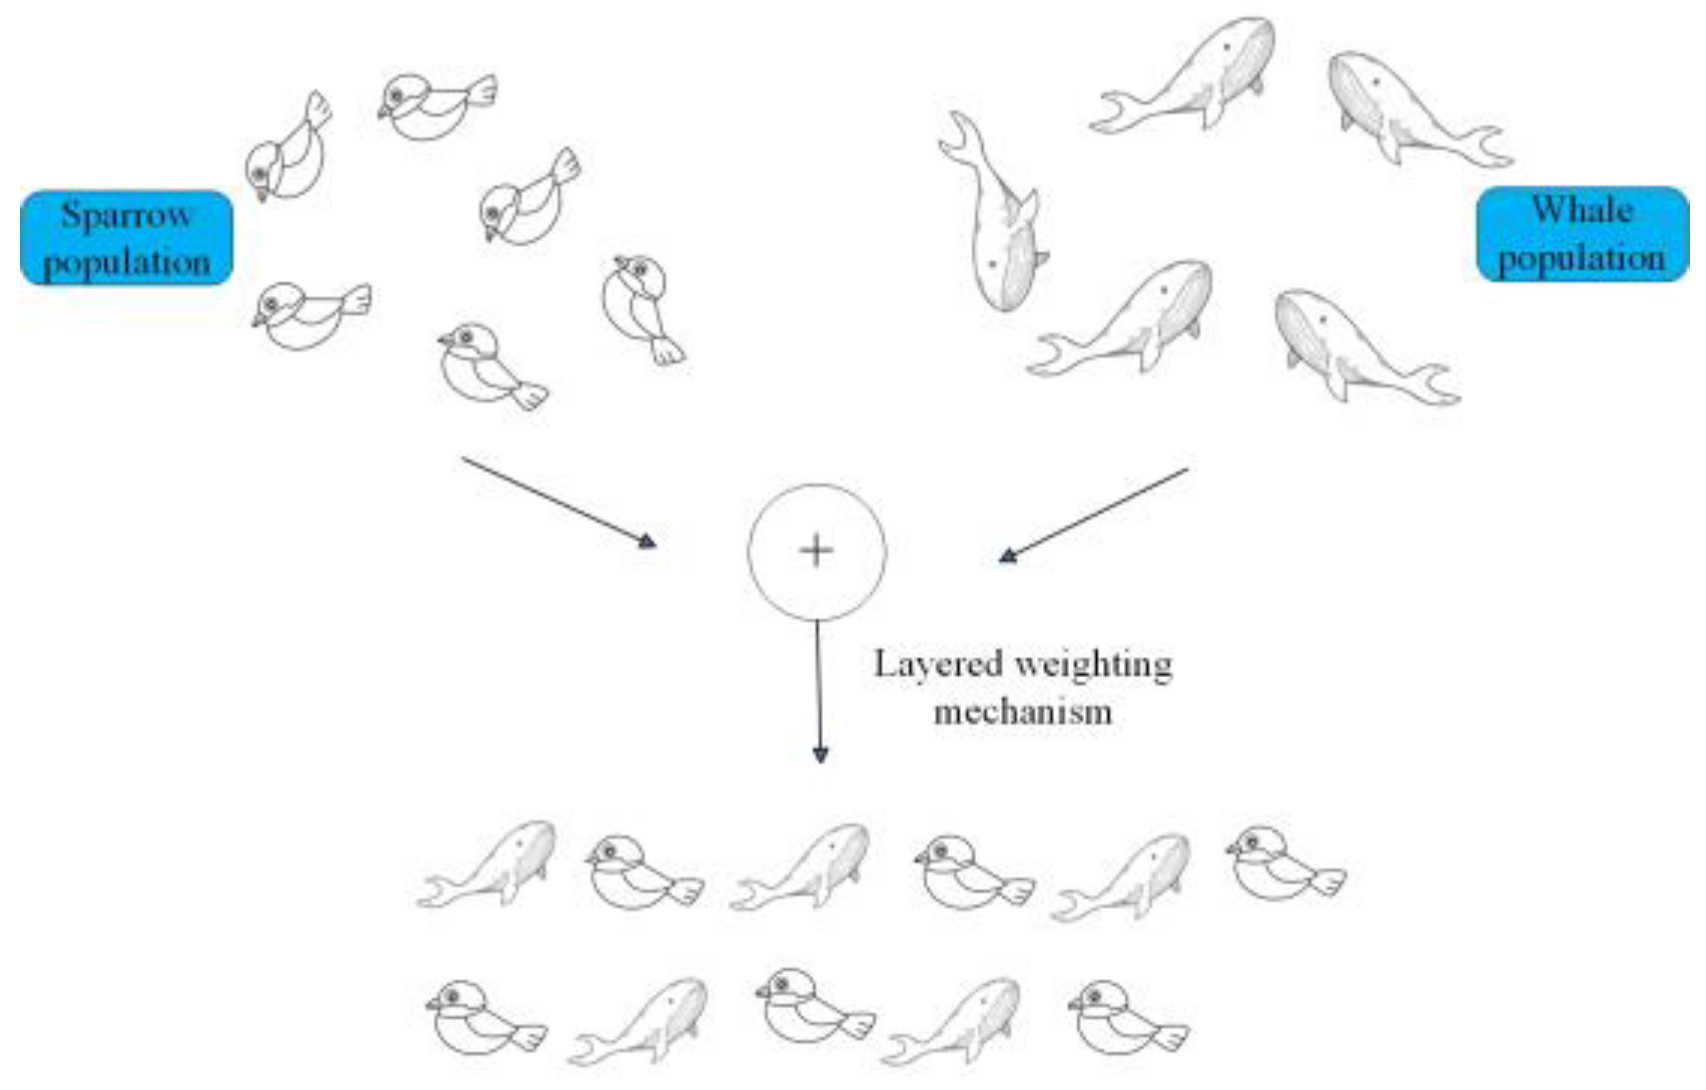
WOSSA is primarily inspired by the distribution patterns of arithmetic operators—division, multiplication, addition, and subtraction—when solving mathematical problems. Its basic workflow is as follows: First, chaotic mapping is used to initialize the populations of both WOA and SSA. These initialized populations are then recombined through a trade-off superposition mechanism to generate the WOSSA population. Next, global and local search strategies are applied to evolve optimal solutions across the population space. During the population position update process, boundary handling functions are introduced to further refine the position updates of this newly proposed intelligent hybrid algorithm. Through iterative updates, the optimal solution is ultimately obtained. A conceptual diagram of the trade-off superposition mechanism is shown in Figure 3, where the left and right sides represent the SSA and WOA populations, respectively, and the bottom illustrates the population size after applying the trade-off superposition mechanism.
Figure 3.
The principal model diagram of the weighted superposition mechanism.
The fundamental concept of the weighted superposition operation is as follows: To enable superposition among individuals, the population is evenly divided into two subpopulations of equal size. The strengths of the Whale Optimization Algorithm (WOA) and the Sparrow Search Algorithm (SSA) are then integrated through a weighted superposition operation to form a new population. This approach aims to leverage the global search capability of WOA and the local search capability of SSA, respectively. Due to its short execution time and straightforward implementation, the superposition operation introduces minimal computational overhead into the algorithm. This strategy primarily employs WOA for global exploration in the early stages to rapidly identify promising optimal regions and approximate the global optimum. In the later stages, the proportion of SSA is gradually increased to enhance local search accuracy. By dynamically adjusting the weights assigned to the two algorithms, an effective balance between global exploration and local exploitation is achieved.
3.2. Algorithm Steps
- 1.
- Initialize the WOA and SSA populations using the Chaotic Map, and restructure the population weights;
The distribution of the initial population exerts a certain influence on both the search accuracy and convergence speed of meta-heuristic algorithms. An uneven initial distribution may lead to suboptimal algorithm performance. To address this, chaotic mapping is introduced for population initialization, which helps generate more uniformly distributed individuals across the search space, regardless of population size, thereby enhancing the overall ergodicity of the population. Among various chaotic maps, the Tent map demonstrates superior ergodicity and convergence rate compared to the Circle, Logistic, and Chebyshev maps. Therefore, this study employs the Tent chaotic mapping to optimize the initialization of the algorithm’s initial population. The formula of the Tent chaotic mapping is as follows:
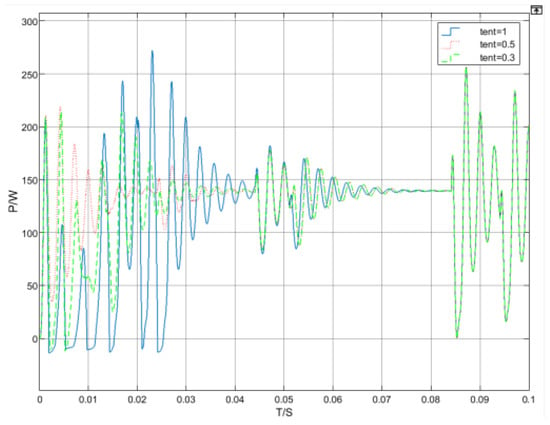
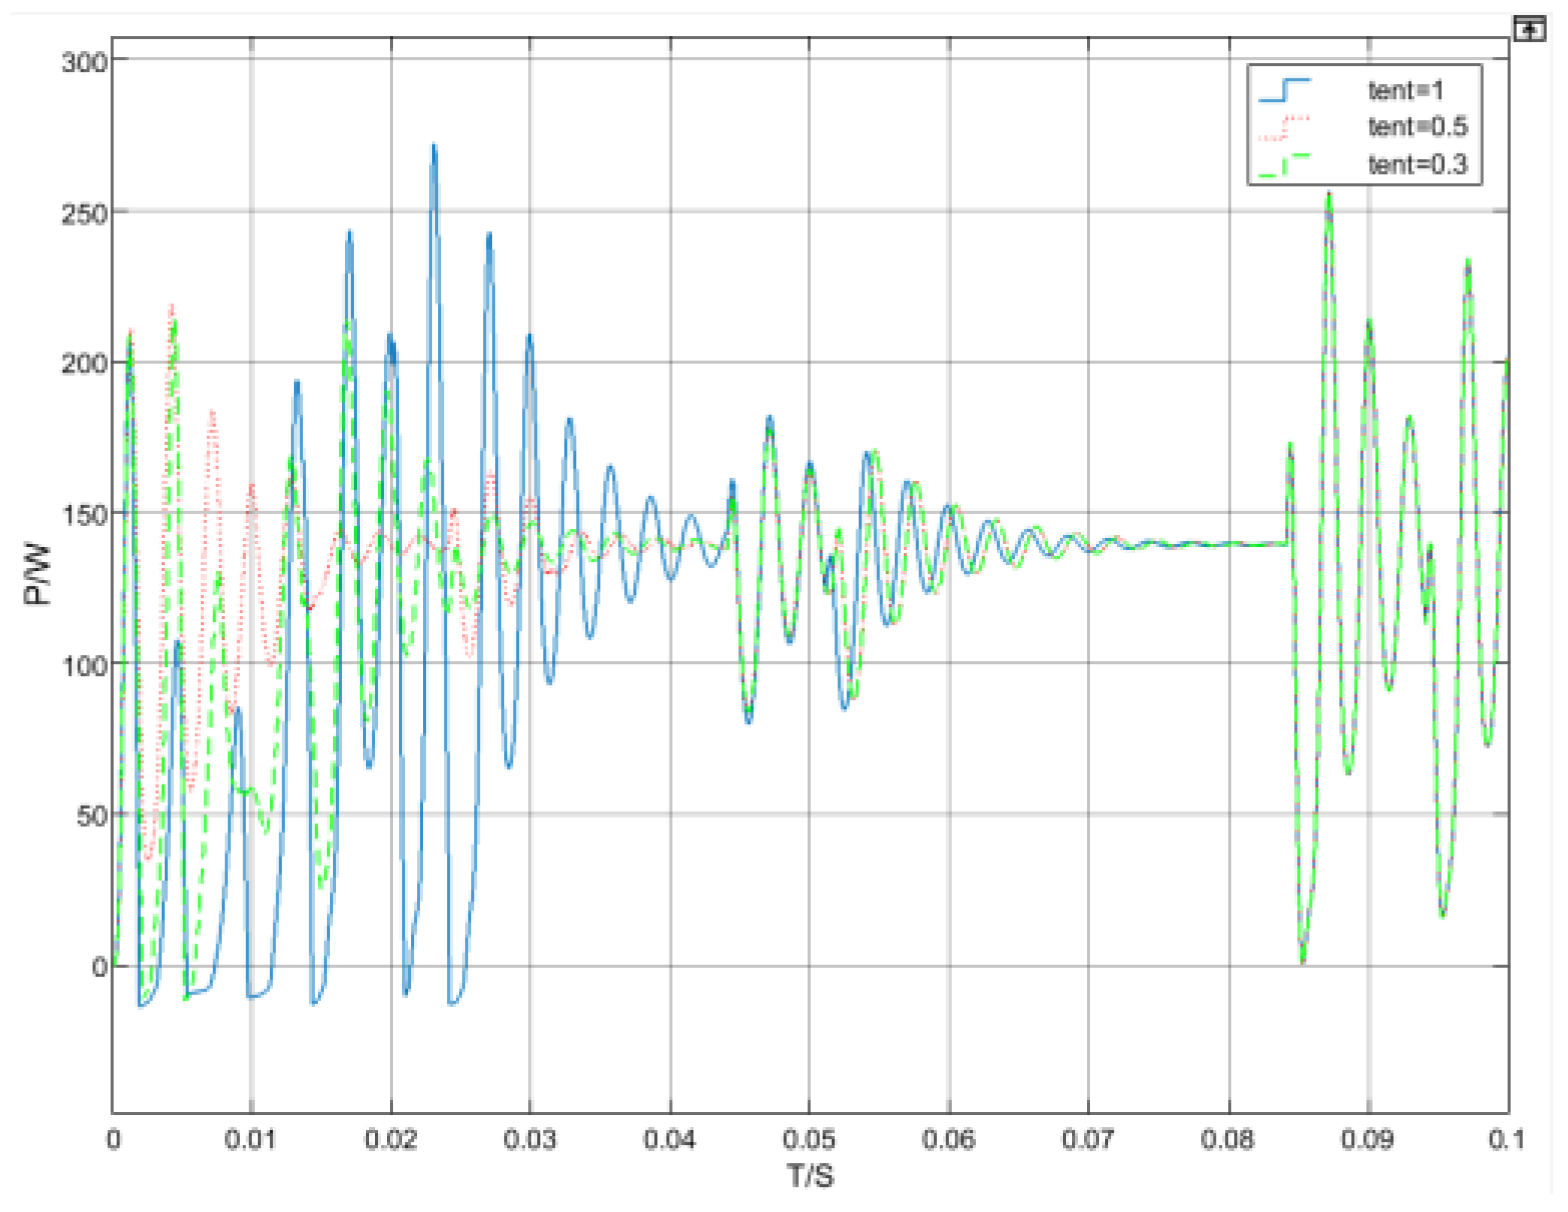
In the formula: is the constant in the chaos coefficient, is the size of the chaos coefficient at time k. The distribution state of the initial population has a significant impact on . The uniformity of its distribution directly determines the algorithm’s exploration capability in the global search space and ultimately influences its search accuracy. To quantify this impact, this paper systematically evaluates the effect of different chaotic coefficients on the power-tracking performance of the WOSSA algorithm. For chaotic mappings, choosing a specific chaotic mapping rather than random initialization is due to its uniformity of traversal and sensitivity to initial values. This helps to enable the population to more widely cover the solution space in the initial stage of the algorithm, thereby directly increasing the probability of covering the global optimal region on the complex multi-peak P-V surface. As shown in Figure 4, as the chaotic coefficient increases, the overall system performance exhibits a trend of positive improvement. Specifically, the best power-tracking performance is observed when the chaotic coefficient lies in the range of approximately 0.8 to 1. At these values, the initial power oscillations are significantly reduced. This improvement is directly attributed to the enhancement of population diversity, which optimizes the algorithm’s search trajectory, resulting in more stable and accurate convergence and thereby minimizing energy losses caused by ineffective oscillations.
Figure 4.
Power graphs under different chaos coefficients.
- 2.
- Divide the population into two subpopulations of equal size according to the principle of random allocation;
- 3.
- Set the number of groups in the whale and sparrow algorithm to a uniform standard;
In order to enhance the search efficiency, the WOSSA population will utilize the positions of its WOA population for random search optimization. The most effective search method is random search, which is referred to as the exploration phase. This mathematical model is [12]:
Among them it is a random search. Which equation to use for updating the position of the whale depends on A; and individually represent the current optimal position and the position of WOA; B indicates the distance between the prey and different WOAs; k it is the number of iterations. When < 1, select the equation below, when ≧ 1, on the selection equation
At the same time, we will introduce the SSA positioning formula. This enables the full demonstration of the advantages of the proposed algorithm:
In the formula: i = 1, 2, …, n, t for the number of iterations, R random numbers that follow a normal distribution, L it is a 1×d matrix, with each element being 1, q(Warning value) ∈ [0, 1], st (security value) ∈ [0.5, 1].
- 4.
- Place the divided individual organisms of the population in the same level and combine them into a WOSSA population;
Initialize both populations to the same level and generate a new population, WOSSA. When the WOSSA population detects danger, the individuals will act collaboratively. The formula for the positions of the collaborating individuals is as follows:
In the formula: represents the worst position of WOSSA, the best position of the collaborating individuals, C is a (1×d) random vector, the element values are defined as 1 or −1, , and n is the population size.
In the WOSSA population activity, certain group members will assume the responsibility of monitoring potential threats in the environment. Their positions are updated according to the following formula:
In the formula, represents the current global optimal position, T is a random number following a normal distribution, is the fitness of the WOSSA algorithm, while is the global best fitness, S is a random number within the range of [−1, 1], is the minimum constant. The WOSSA algorithm fully capitalizes on its advantages, including a minimal number of parameters, ease of implementation, and strong global search capabilities. Additionally, when compared to the WOA and SSA algorithms, WOSSA demonstrates exceptional performance during the search process. It is able to rapidly converge to the vicinity of the optimal solution, giving it significant competitive advantages.
Set the size of the WOSSA population n, the maximum number of iterations T, and the dimension of the search space m. The initial positions of each population are represented as follows:
To establish the WOSSA population, the trade-off superposition mechanism generates a more uniformly distributed sequence of random numbers across the solution space, thereby effectively enhancing population diversity and exploratory capability, while balancing global exploration with local exploitation. This mechanism operates with high efficiency and is straightforward to implement, offering notable advantages in reducing algorithmic error rates. During the initial phase of the algorithm, the global exploration capability of the WOSSA population is primarily leveraged to rapidly identify potential regions containing optimal solutions. As iterations proceed, the local refinement ability of the WOSSA population is progressively strengthened, ensuring higher solution accuracy and stability in the subsequent convergence stage.
- 5.
- In the new population, the fitness of each individual is evaluated, and both the global and local optimal solutions are updated. The process proceeds iteratively, with information exchange among individuals enhancing population diversity throughout.
Among them, and represent the current optimal position and the position of WOSSA, respectively; B represents the distance between the prey and different WOSSA; k is the number of iterations, is the position of the WOSSA user within the system; is the attacker position of the population; is the sentry position of the population, indicating the current position of WOSSA.
Within the equation , there is a variable [2, 0] that can be iterated, while r is a random number within the range [0, 1].
In the WOSSA algorithm, the bubble net attack method and the search for prey are used to represent the exploitation stage and the exploration stage, respectively. We have created a spiral equation between WOSSA and the prey to update their positions:
Here, b is a constant that describes the shape of the vortex, and it is usually set to 1; i is a random number within the range of [−1, 1]; it represents the distance from the first WOSSA to the prey.
The WOSSA’s predation strategy incorporates two distinct mechanisms: contraction encirclement and spiral bubble encirclement. To integrate these mechanisms effectively, the updating and optimization of their positional processes must be balanced between the contraction encirclement mechanism and the spiral model. This optimization process is mathematically formulated as follows:
Here, p is a random number ranging from 0 to 1. The fitness function of the WOSSA algorithm is:
In the formula: F represents the fitness value of the population’s updated position. The fitness value F indicates the quality of the population’s position, and its maximum value corresponds to the optimal position of the population.
- 6.
- Finally, the Padding function and other elements are added. The Padding function has a strong measurement standard for random movements, and at the same time enhances the stability and controllability of the algorithm;
During the iterative search for both global and local optima, region-based loss functions are conventionally employed. In this paper, however, a boundary-based loss function is introduced, which operates on contour space rather than regional areas. Unlike region losses that perform integration over areas, the boundary loss integrates along the interfaces between regions. This approach mitigates issues commonly associated with region-based losses in highly imbalanced segmentation tasks. Changes in the boundary are computed using integral methods, thereby avoiding local differential computations on individual contour points.
It should be noted that both independent variables inherently possess their own ranges of variation. Yet, for the marginal distribution of variable x, the corresponding variable y spans its entire defined domain. To address this, an enhanced boundary processing strategy—termed the Padding function—is proposed in this study. As a specialized boundary handling mechanism, the Padding function differs from conventional methods in both design philosophy and implementation. Within the algorithm workflow, its operational mechanism is fundamentally distinct from that of traditional boundary-processing functions. Together, they constitute a complete and coordinated boundary-processing framework. The formula of the Padding function is:
Here, X and Y represent the horizontal and vertical coordinates of a two-dimensional plane, usually taken as infinity; x and y are the tangent planes of a certain point on the curve that appears in the power tracking process on the two-dimensional plane.
- 7.
- Determine whether the termination condition is met. If it is, terminate the algorithm and output the result; otherwise, proceed to the next iteration.
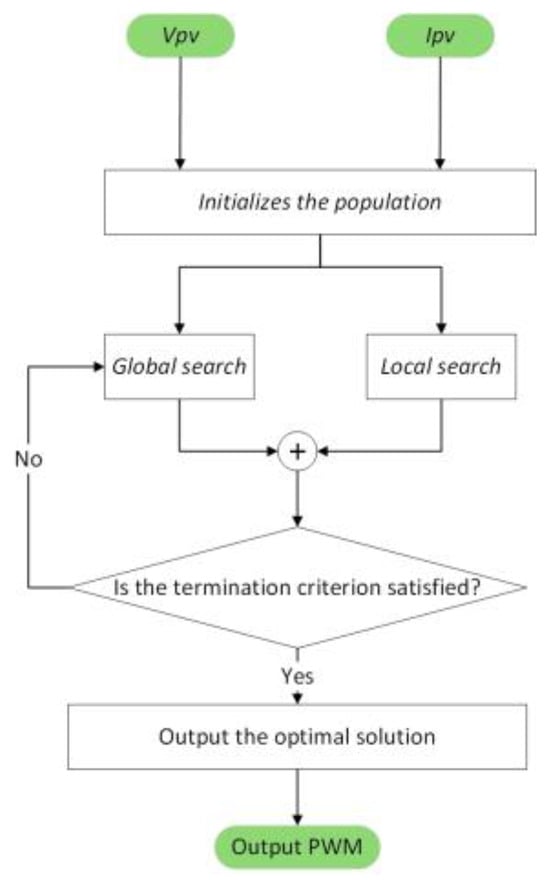
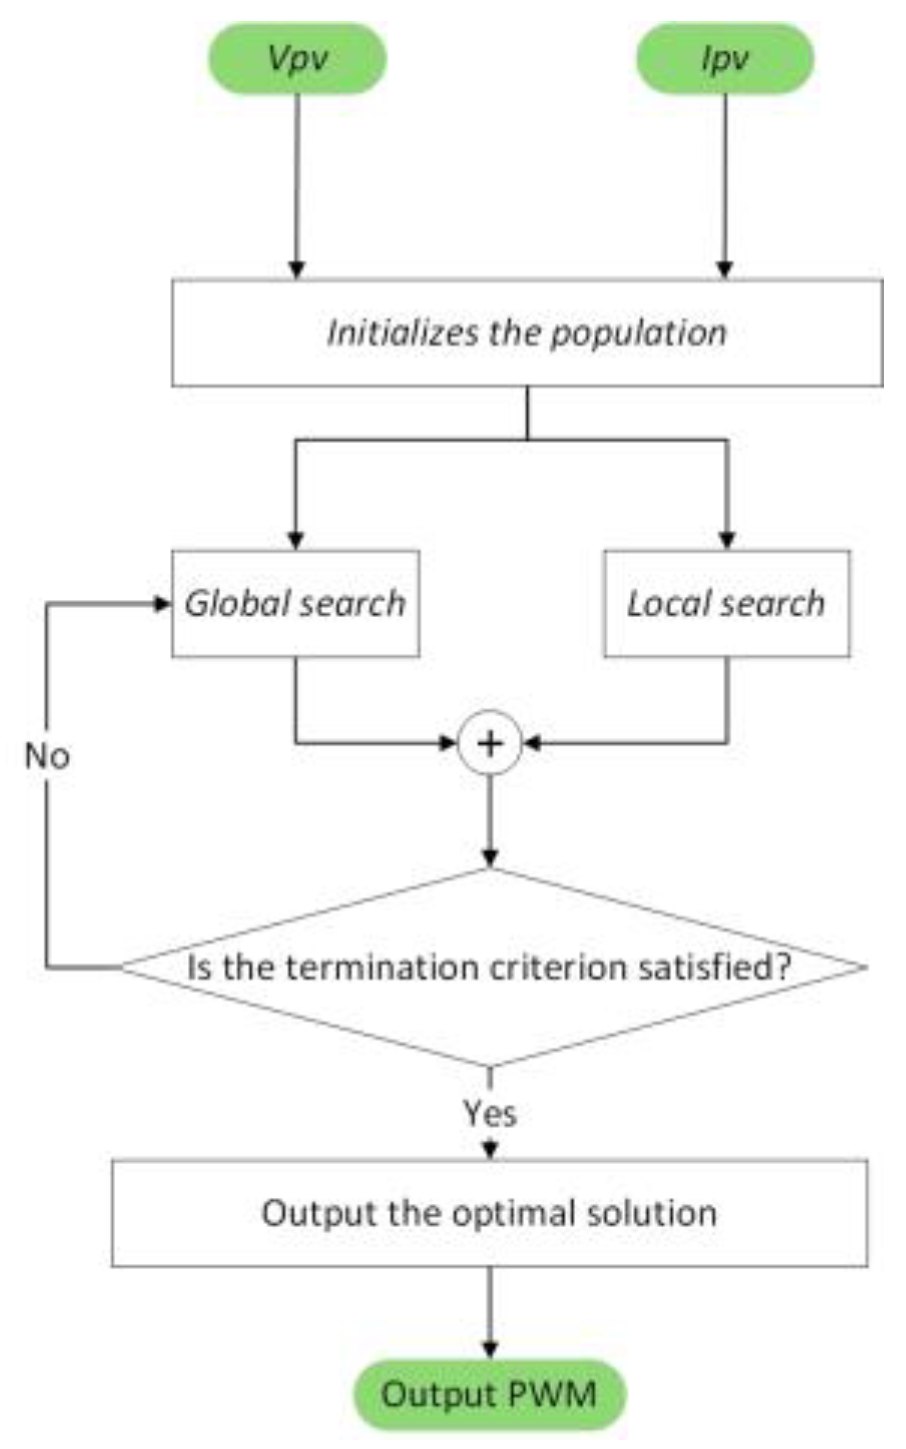
When using the WOSSA algorithm for multi-model experiments, the experimental parameters must be at the same order of magnitude. In this model, both simulation and laboratory analysis were conducted. Good results were achieved in the experiments, and the power curves and parameter values were improved. This indicates that the WOSSA algorithm can effectively handle complex data. Algorithm 1 shows a part of the WOSSA code diagram. In the figure, p: the index of the individual in the current population. Pold: the fitness value of individual p in the previous iteration. u: a random number uniformly distributed in the interval [0, 1]. dbest, dworst: the distance from the current individual to the best and worst individuals in the population, respectively. pcrrut: the preset perturbation probability threshold. Figure 5 shows the step diagram of the WOSSA algorithm.
| Algorithm 1: The WOSSA Operator. |
| Input: Function [duty, ...j,d _d]= WOSSA_MPPT(vpv, ipv, time) |
| persistent p Pold u dbest dworst pbest pworst pcrrut counter iteration |
| 1. if isempty(num) |
| 2. num = 20; |
| 3. num_S = round(num*0.5): |
| 4. num W = num-num_S; |
| 5. a = 2; |
| 6. b = 1: |
| 7. end |
| 8. if isempty(p): |
| 9. p = zeros(1, num); |
| 10. Pold = 1: |
| 11. counter = l: |
| 12. u = 1: |
| 13. iteration = 0; |
| 14. Iter max = 15; |
| end |
Figure 5.
Flowchart of the WOSSA Algorithm.
4. Experiments and Result Analysis
This paper conducts experiments based on a photovoltaic power generation system under partial shading conditions. The experiments are performed on a computing platform equipped with a 13th-generation Intel Core i5-13500H processor with a base clock frequency of 2.6 GHz, 16 MB of L2 cache and 64 MB of L3 cache. The system is equipped with 32 GB (2 × 16 GB) of DDR5 memory running at 5200 MHz. In this hardware environment, MATLAB/Simulink R2019b is used to construct and test a detailed irradiance model that simulates the typical output-power fluctuations of a solar energy system during actual operation. The energy storage system employs a bidirectional DC-DC control structure. By monitoring the bus voltage and comparing it with a target voltage of 380 V, the operating mode of the battery—charging or discharging—is determined. Specifically, a positive current indicates charging, while a negative current indicates discharging. Under each irradiance condition, every experiment is repeated three times independently. Data acquisition and analysis are carried out using custom MATLAB scripts, and the results are presented as the mean ± standard deviation. The specific experimental outcomes are described below. Based on the analysis of solar radiation in the northeastern region and the setup of the laboratory, a circuit model of a voltage booster converter was constructed. This model consists of the following components: a photovoltaic cell model with a maximum power point tracking module; a voltage booster inductor; and a pulse width modulation converter. The parameters of each component are listed in Table 3.
Table 3.
Electrical Data of Selected Solar Panels.
The designed local shading modes are intended to systematically simulate a range of actual fault scenarios, from mild to severe, thereby testing the algorithm’s robustness under conditions varying from simple to extreme, rather than only evaluating its performance under ideal circumstances. For all compared algorithms, we adopted the original parameter values recommended in their respective reference papers, which are widely recognized as standard settings. No algorithm-specific fine-tuning was performed on any test function during the experiments. Similarly, for the proposed WOSSA algorithm, its unique parameters were kept fixed across all test problems to ensure a fair comparison among MPPT algorithms. A summary of the algorithm parameter settings is provided in Table 4.
Table 4.
Comparison Table of Algorithm Parameter Settings.
4.1. Case 1: Irradiation-Induced Mutation Test for MPPT Efficiency
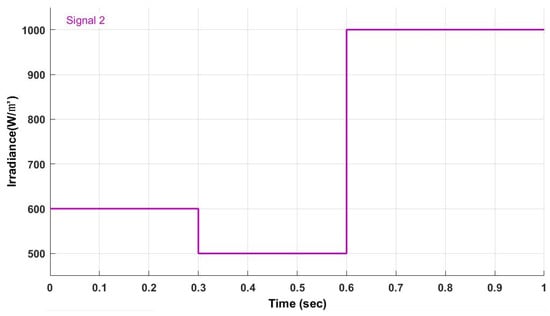
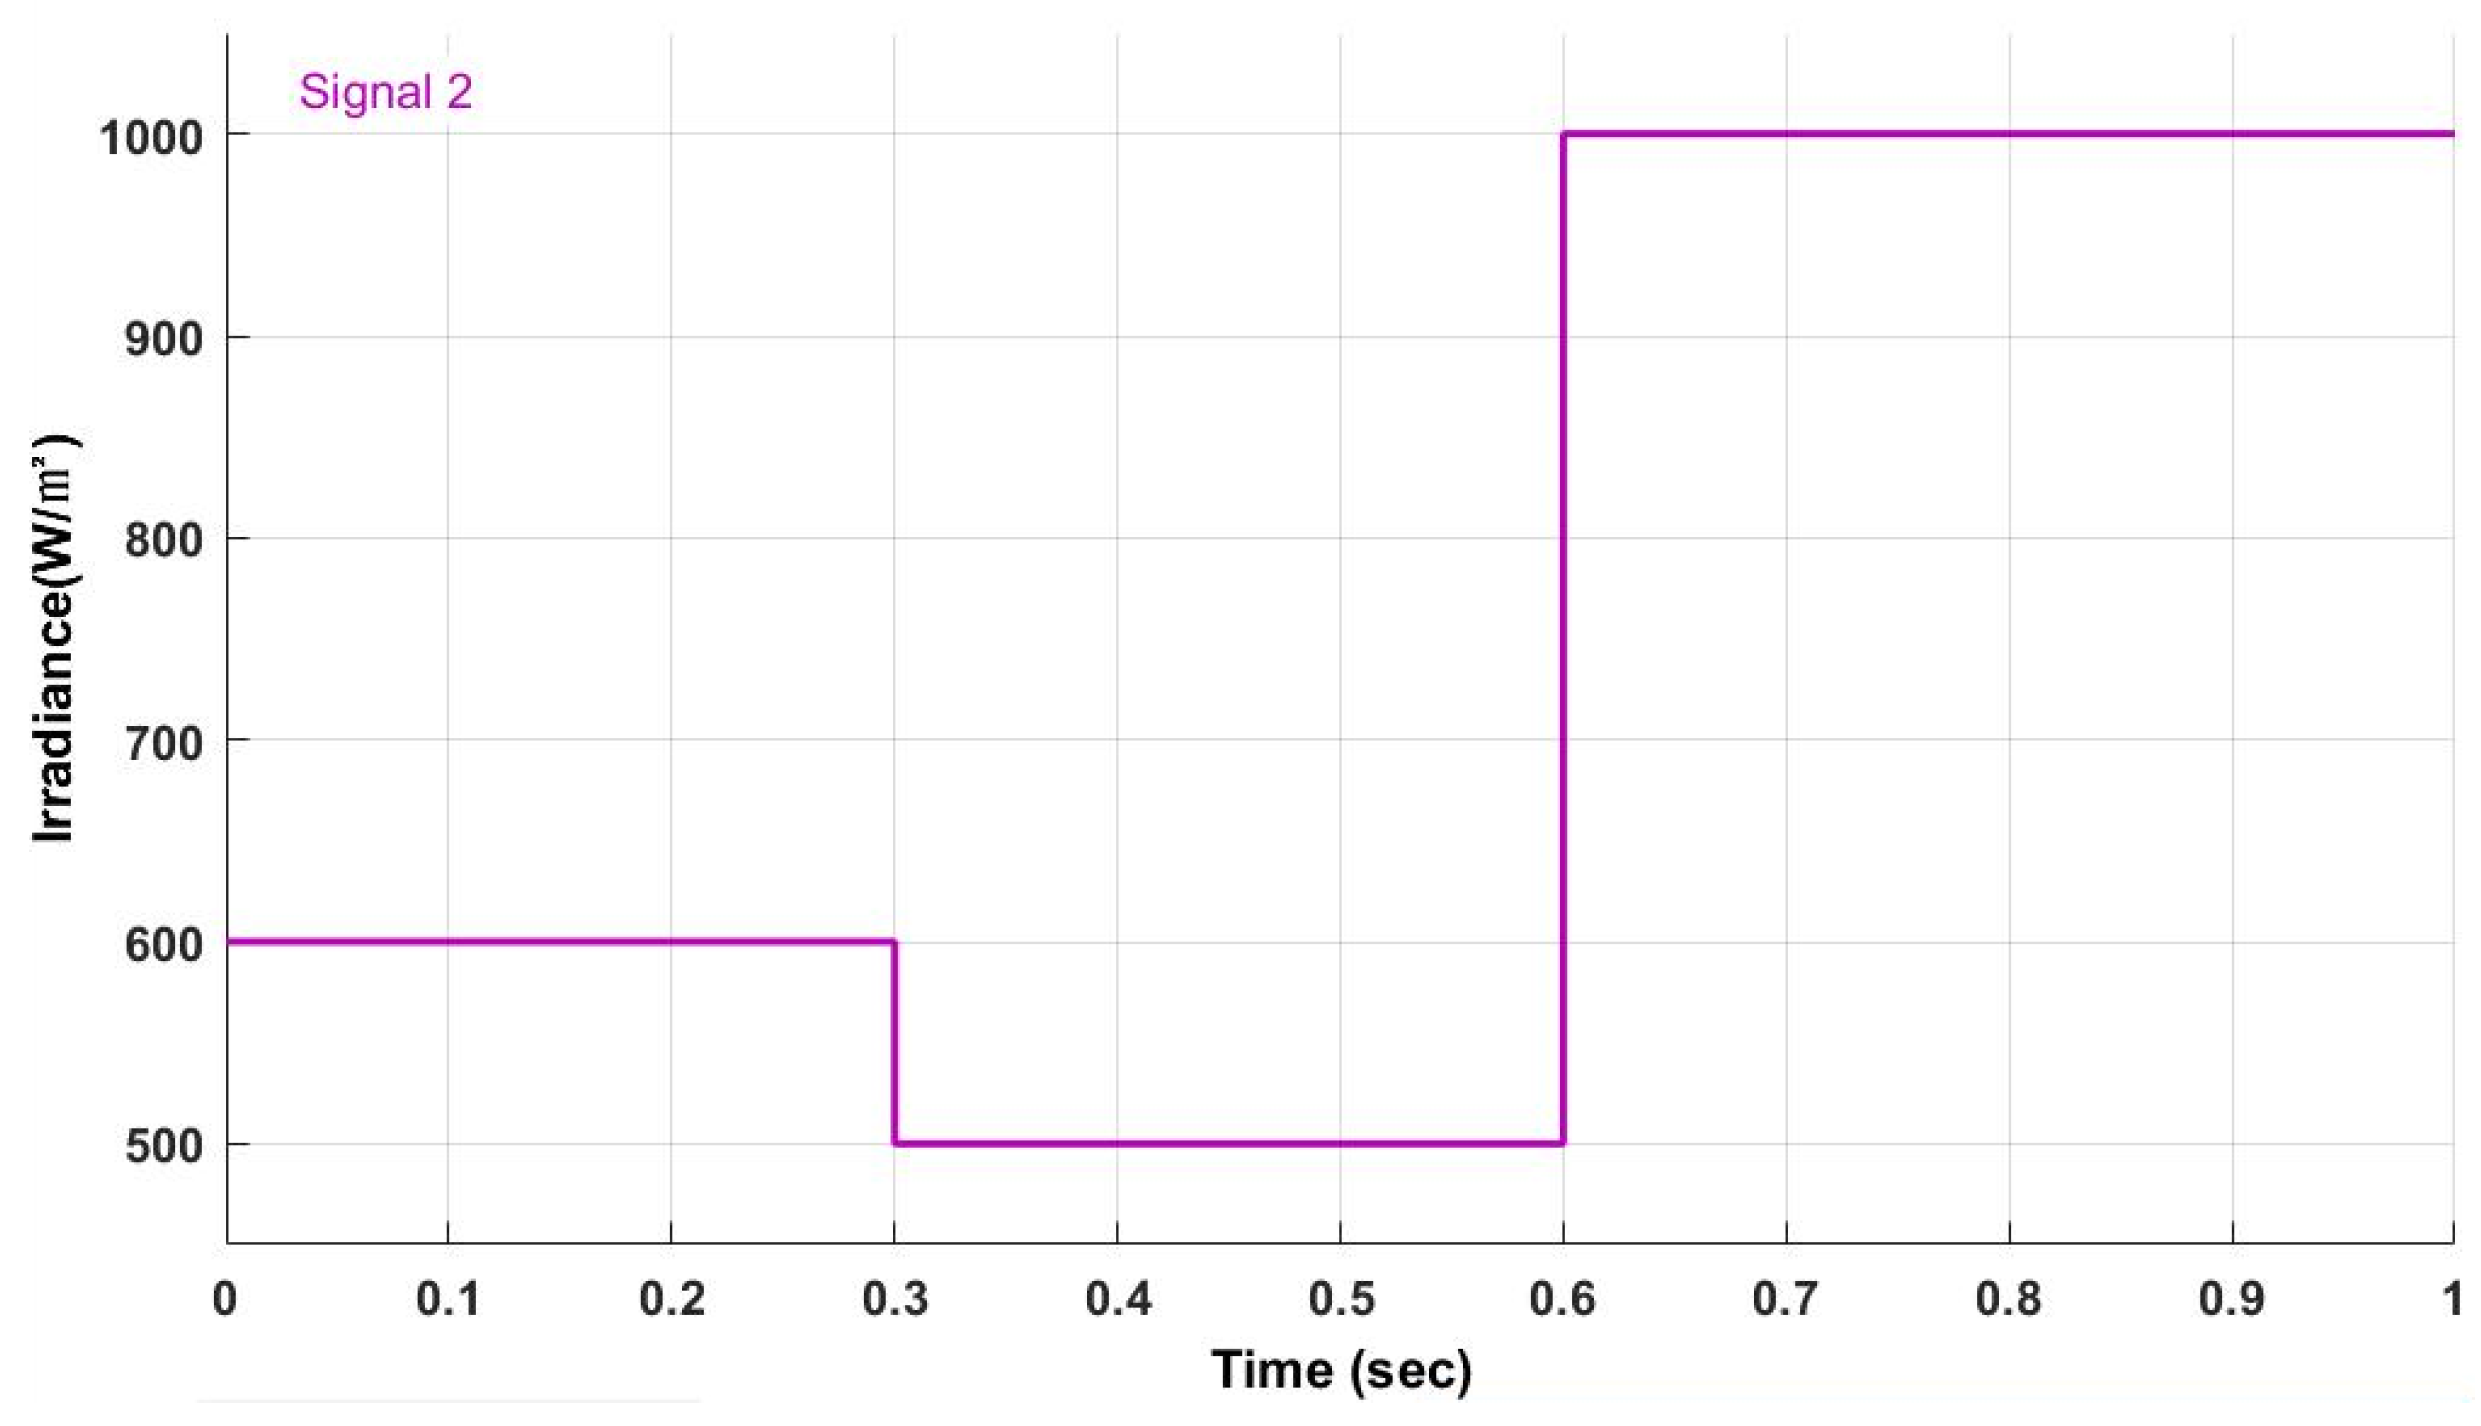
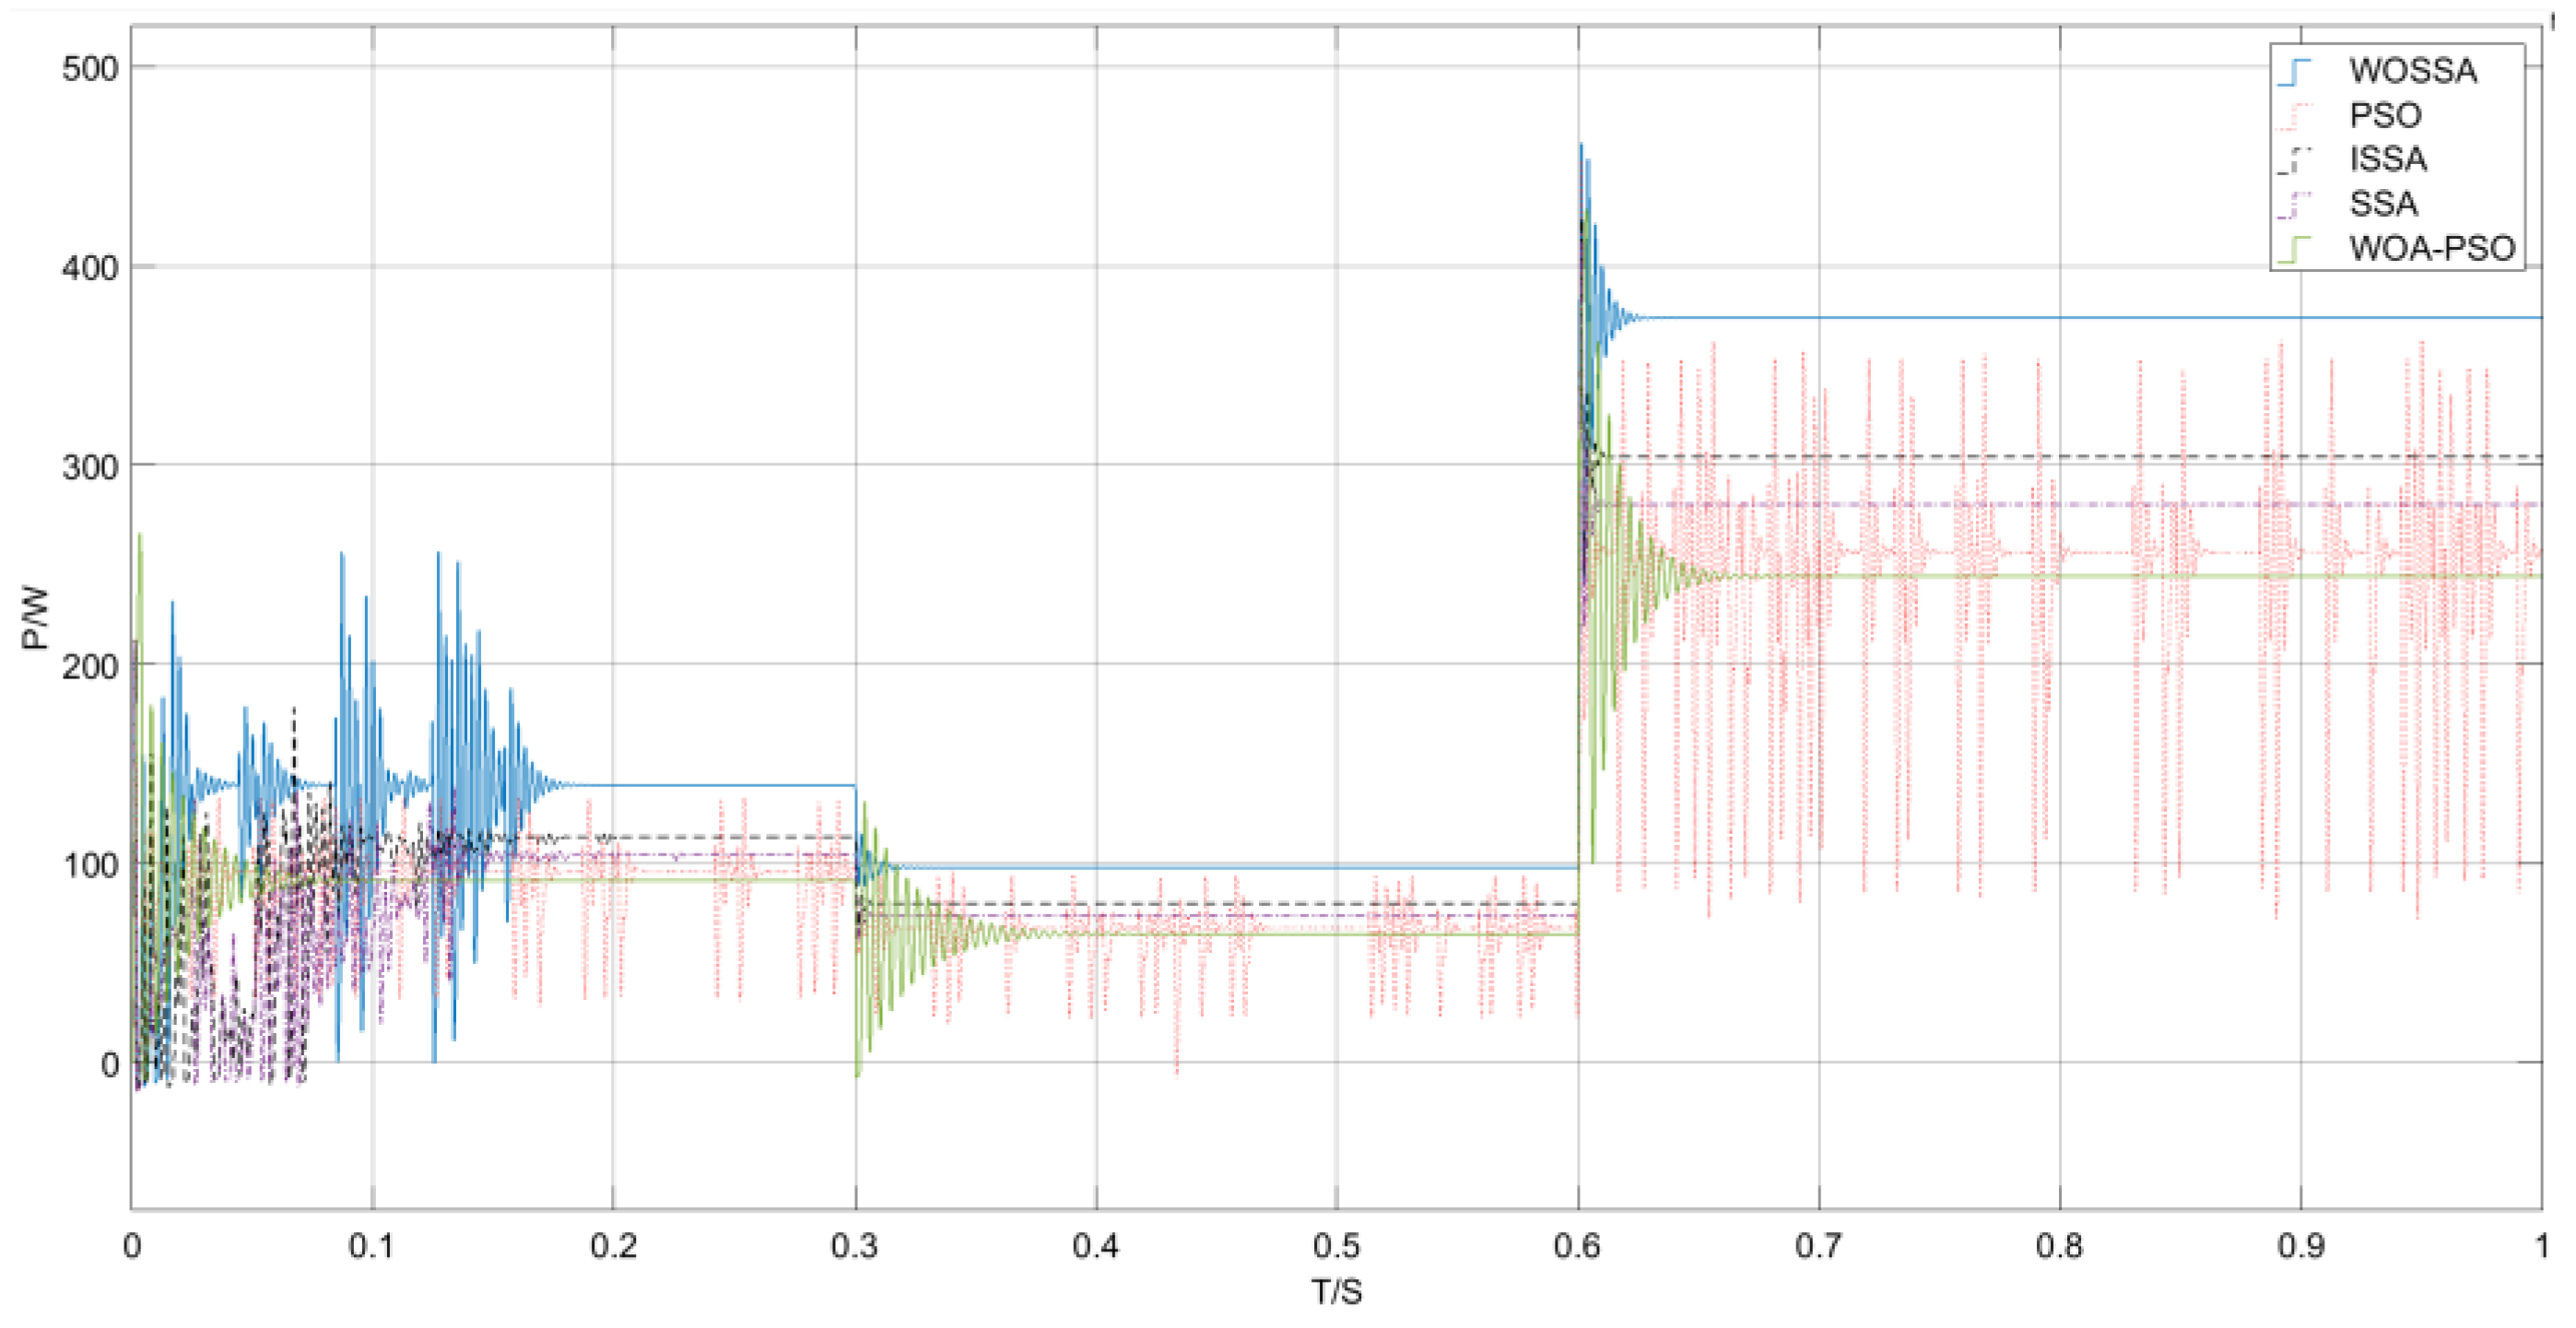
To verify the performance of the proposed WOSSA algorithm, irradiation with ascending and descending shapes was used. The irradiance ranged from 500 W/m2 to 1000 W/m2. The illumination distribution is shown in Figure 6. The irradiance started at 600 W/m2 and remained at this level for 0.3 s; then it dropped to 500 W/m2 and stayed at this level for 0.6 s; subsequently, it rose to 1000 W/m2 and remained flat for 0.4 s. Since our focus is on the steady-state conditions in the algorithm, the ascending or descending processes in the irradiance distribution are not considered. The simulation time was 1 s, and the temperature was fixed at 25 °C.
Figure 6.
Gradual Variation Chart of Solar Irradiance.
This determined the tracking efficiency of each MPPT. After simulation studies, the test results showing the performance under sudden changes in irradiance levels were presented in Table 5.
Table 5.
Test Results of Abrupt Changes in Irradiance Levels.
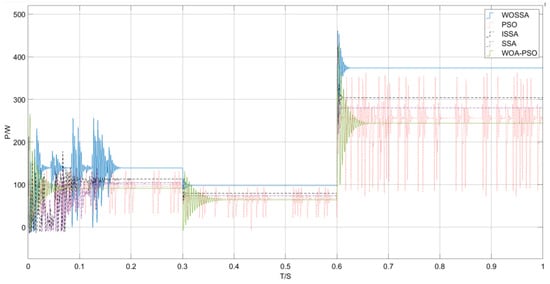
Figure 7 shows the tracking performance comparison of the WOSSA algorithm with various algorithms at different irradiance levels. It can be clearly seen from Figure 8 that the tracking effect of the WOSSA algorithm is better. This is because the power restart mechanism is added, which effectively avoids the high-frequency oscillation problem caused by multiple iterations, reduces system energy loss, and improves search accuracy at the same time.
Figure 7.
Lighting mutation power tracking curve graph.
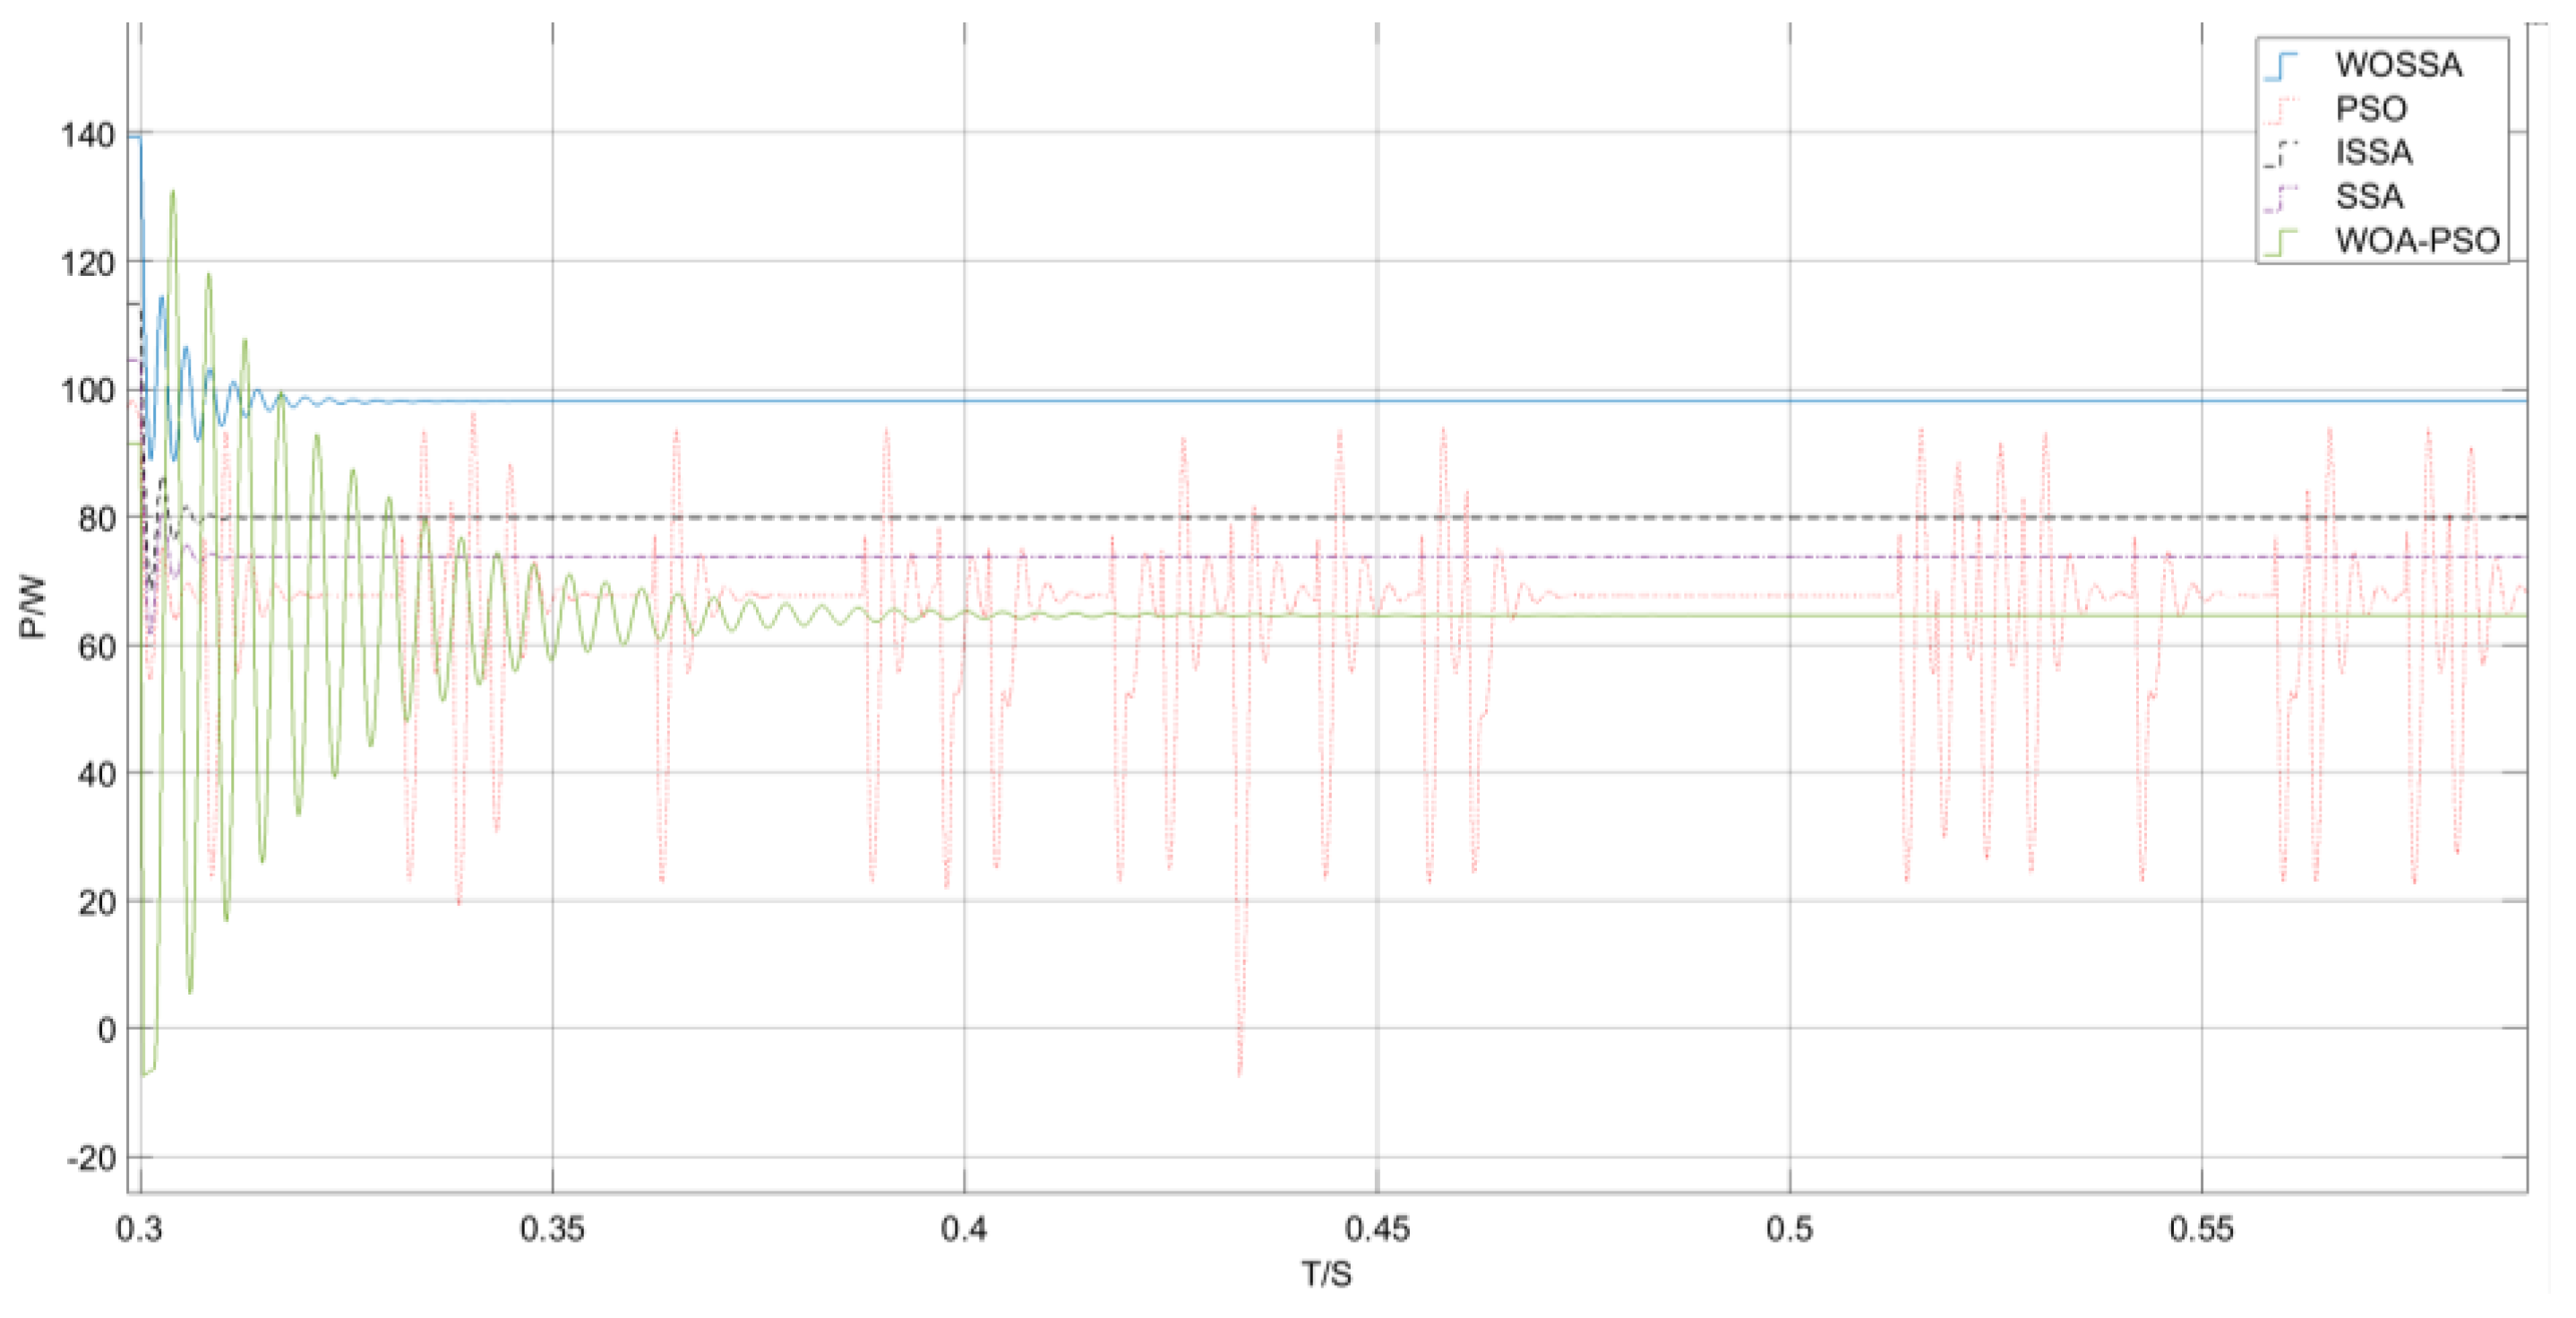
Figure 8.
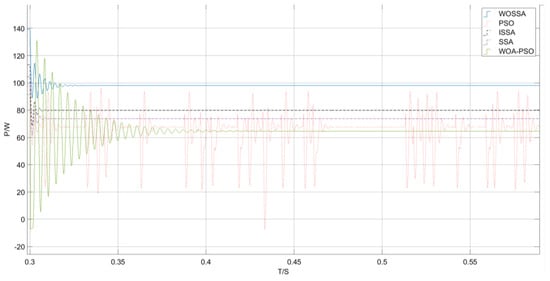
Lighting mutation part enlarged power tracking curve graph.
Another simulation was conducted to emphasize the performance of the MPPT algorithm under different irradiance levels. The results indicated that the proposed algorithm demonstrated superior stability. Figure 8 presents a magnified comparison of the local tracking WOSSA algorithm with other algorithms. The former performed better in reducing oscillations, but in terms of tracking performance, the proposed algorithm showed a more favorable tracking effect. Figure 8 shows a local magnified comparison of the proposed WOSSA algorithm and other algorithms.
4.2. Case 2: Local Shadow MPPT Efficiency Test
In this study, since the light intensity in the actual environment is subject to dynamic changes, a novel WOSSA was proposed to solve the global optimization problem in local shadows. The light intensity in local shadows was set at 500, 600, and 1000 W/m2. In WOSSA, first, the Chaotic Map was used to initialize the WOA and SSA populations, and the population weights were reconstructed to enhance population diversity. Secondly, the weight balancing superposition mechanism was used to recombine the initialized population to generate the WOSSA population; the global search was utilized to generate and evolve a group of optimal solutions throughout the population space, enhancing the diversity of the population search; then, some excellent individuals were processed using local search to avoid premature convergence of the WOSSA population and to quickly explore the potential of high-quality regions. Finally, boundary processing functions and power restart mechanisms were introduced at the population position update point. The experimental results show that WOSSA is a practical and effective method for handling complex engineering optimization problems. The maximum power point tracking (MPPT) performance of the three algorithms was simulated and compared under local shadow conditions. The results are shown in Table 6.
Table 6.
The test results of local shadow irradiance.
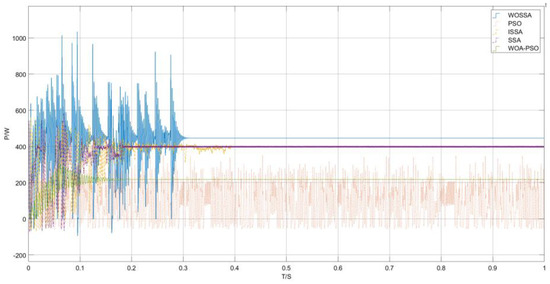
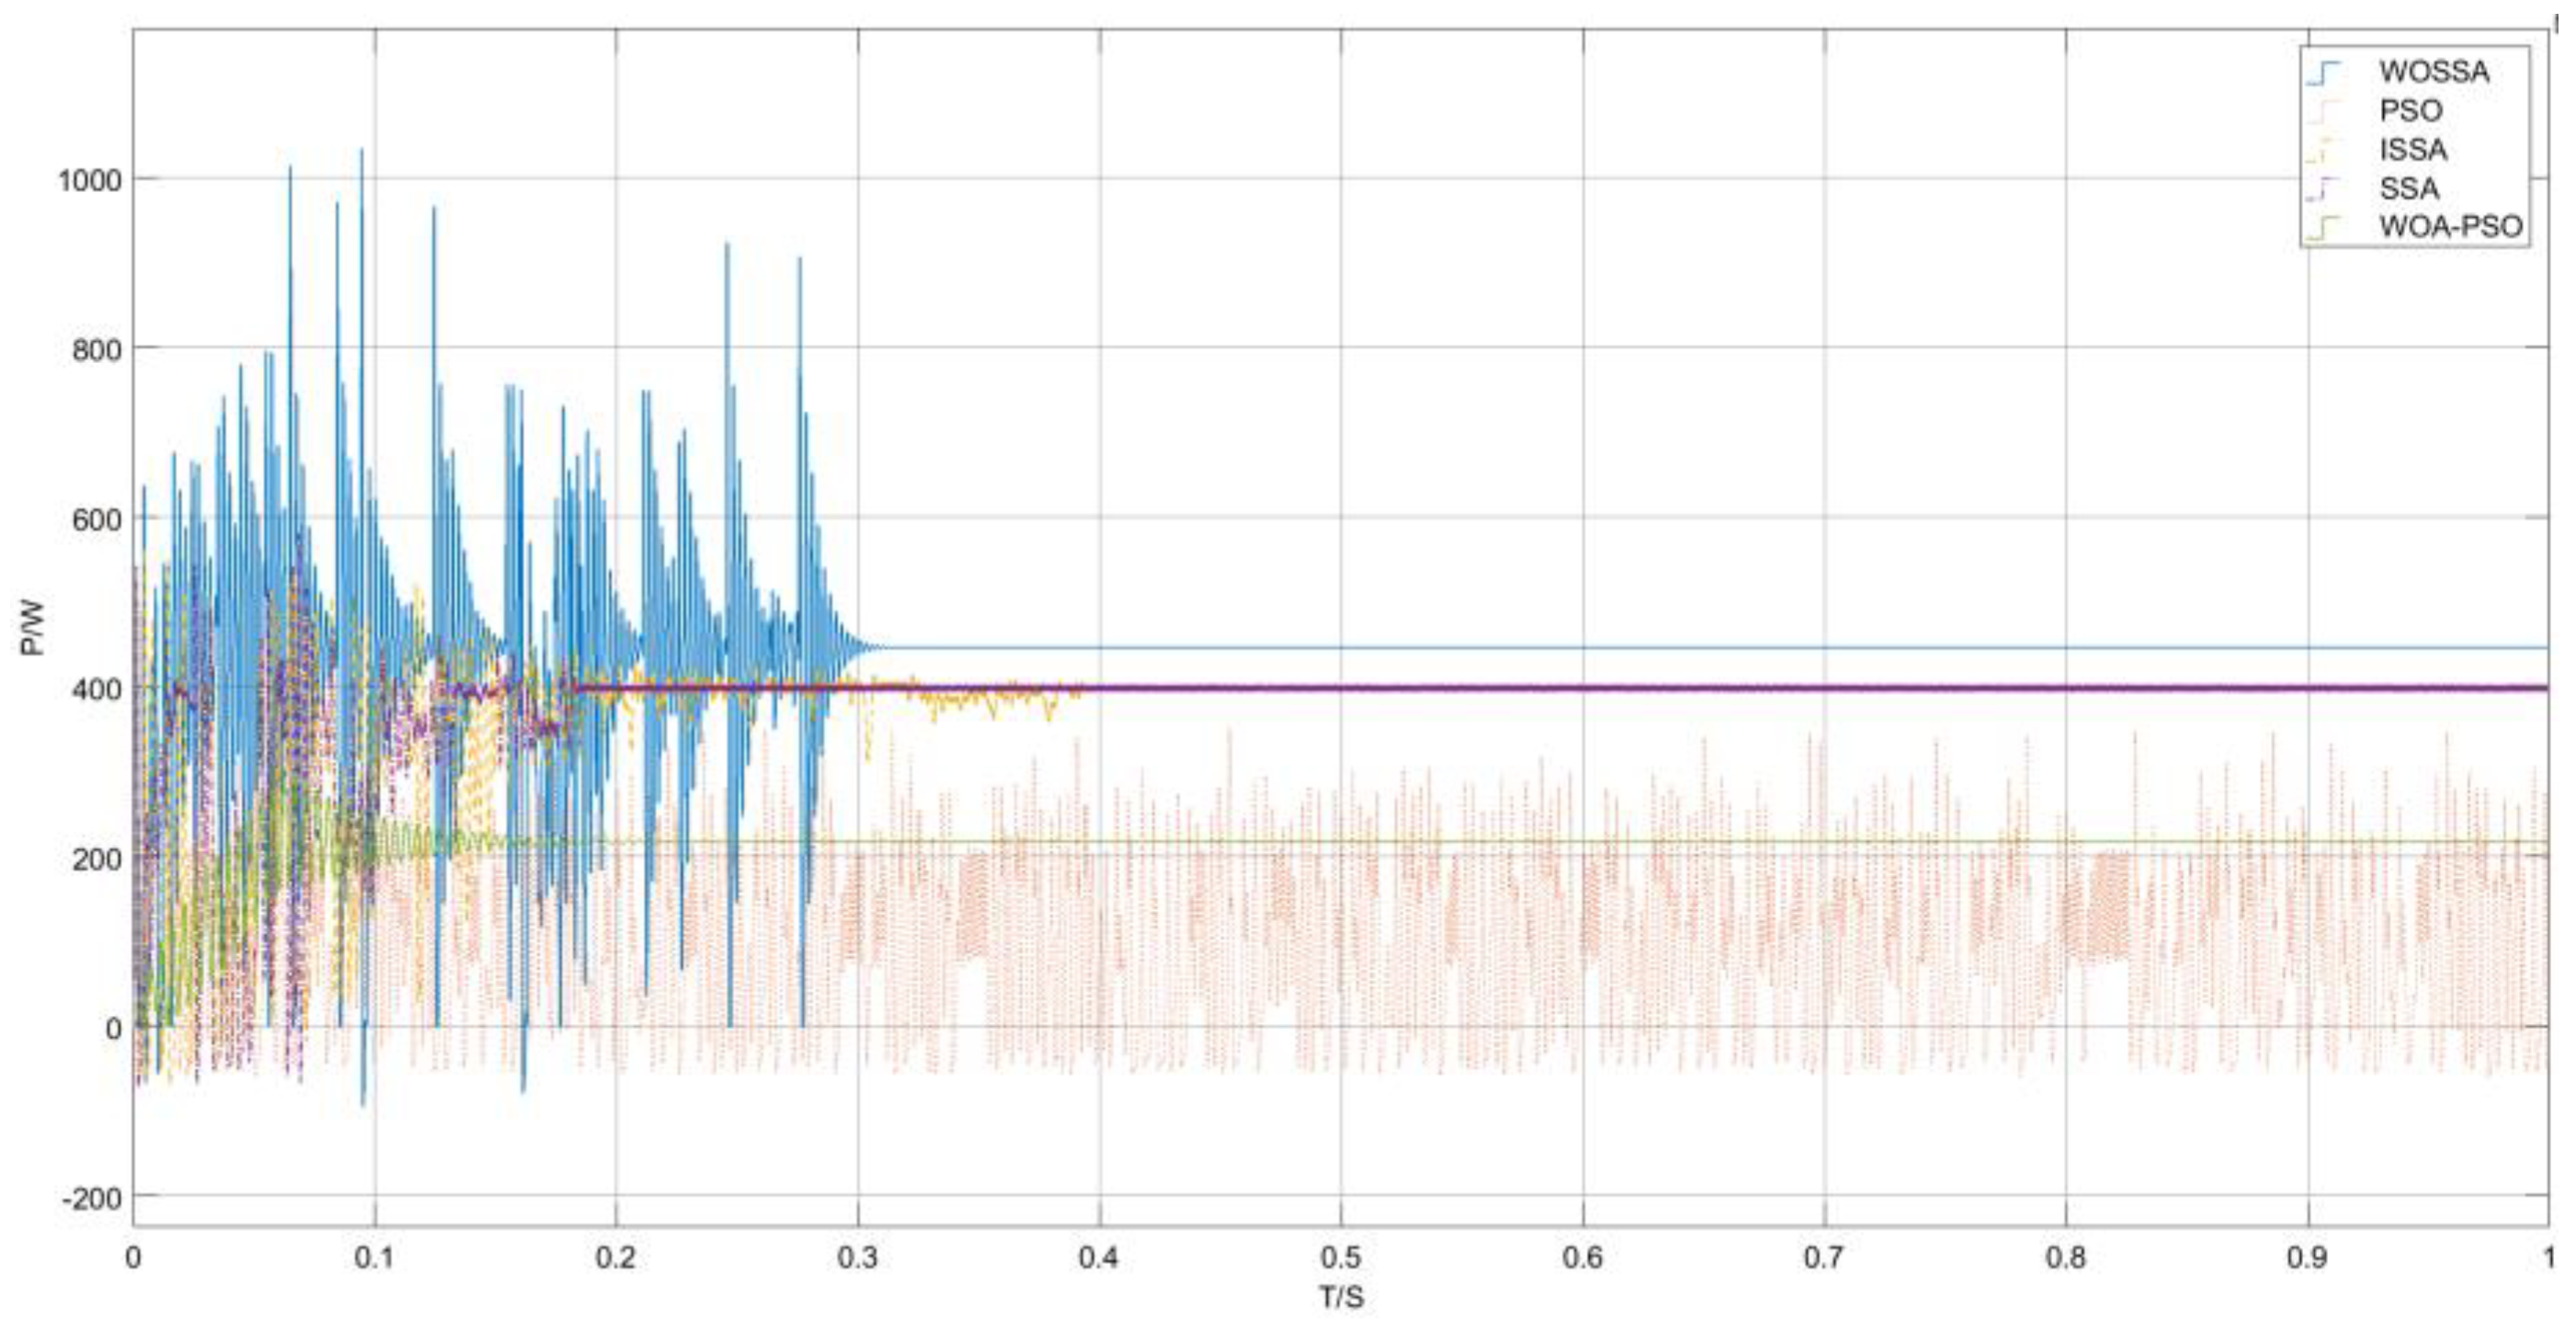
By comparing the maximum power point tracking (MPPT) simulation results of the four algorithms under shadow conditions, Figure 9 shows that in an environment with shadow distribution, the improved WOSSA algorithm outperforms the improved SSA method in terms of both power magnitude and tracking speed. It exhibits a more stable tracking waveform, a lower steady-state oscillation rate, and can complete the tracking in less than 0.3 s, with an output power of approximately 450 W. In contrast, the improved SSA method takes 0.4 s to locate the maximum power point and shows significant power fluctuations near the maximum power point, with an output power of approximately 400 W. The traditional SSA algorithm also reaches the maximum power within 0.4 s, with an output power of approximately 398 W, but the overall oscillation is more obvious. This difference mainly stems from the initially scattered population distribution of the algorithms, which makes it difficult for individuals to quickly respond to environmental changes and adjust the search direction; in the later stage of the search, some sparrows turn to explore other areas, further reducing the overall tracking efficiency. Secondly, the WOA and PSO hybrid algorithm shows a relatively obvious initial oscillation, and the power level does not significantly increase. Compared with the PSO algorithm, its advantage lies in the reduced oscillation during the power tracking process. Thus, the efficiency of the hybrid algorithm can be seen.
Figure 9.
Local shadow power tracking curve graph.
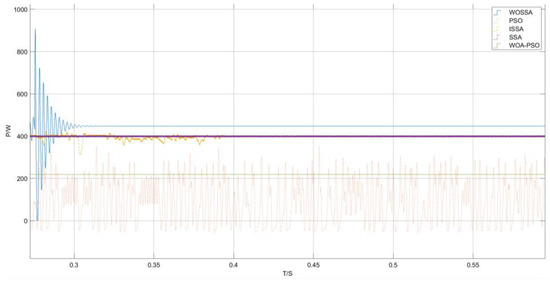
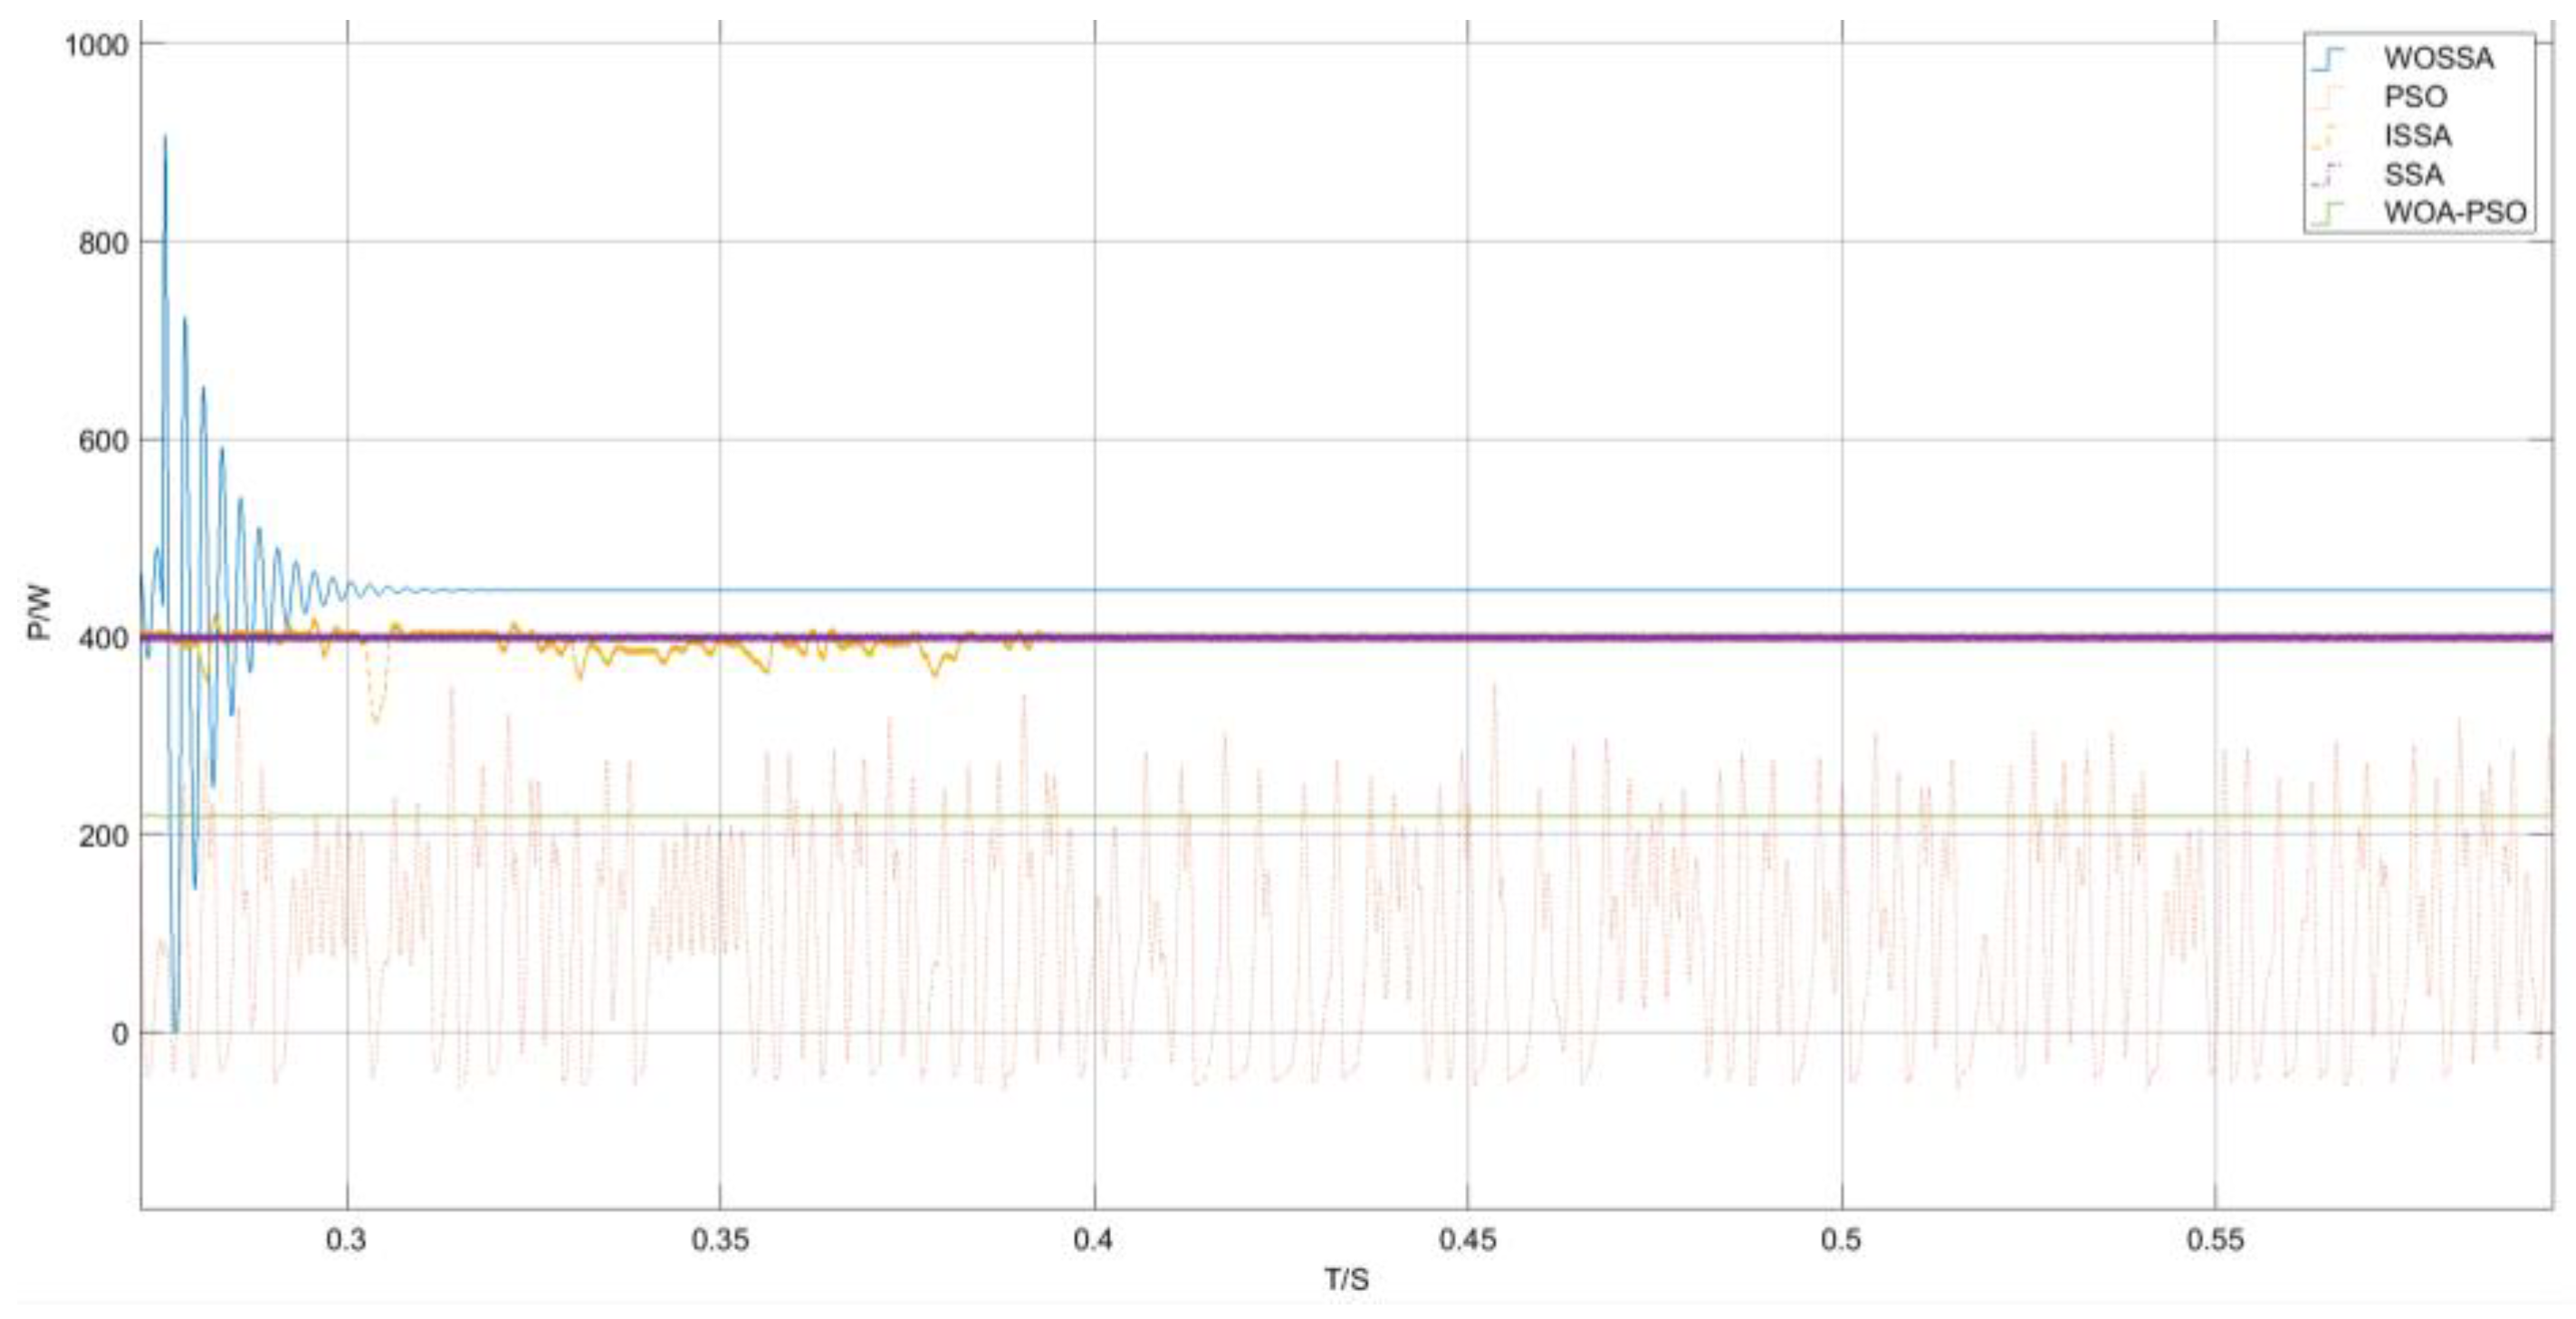
The improved WOSSA algorithm can accurately track the maximum power point in approximately 0.3 s. Its tracking stability is significantly better than the other three comparison algorithms. The optimal output power reaches 450 W, demonstrating the highest tracking accuracy. This performance improvement is mainly attributed to the introduction of the power restart mechanism, the padding function, the symbol matrix and other strategies in the later stage of the algorithm, which effectively avoids the high-frequency oscillation problem caused by multiple iterations, reduces system energy loss, and improves search accuracy. Considering that the light intensity in the actual environment is always in a dynamic state, it is necessary to compare the tracking effect of the MPPT algorithm under dynamic shadow distribution. During the simulation process, the environmental conditions of the photovoltaic array changed from uniform light distribution to shadow distribution. As shown in Figure 10, when the external environment was under shadow distribution, the power of this algorithm showed significant fluctuations in the initial stage. However, compared with the traditional SSA method, the WOSSA method achieved significant improvements in power magnitude and stability. Therefore, in a complex and variable external environment, the population algorithm with the trade-off superposition mechanism demonstrates superior dynamic response capability.
Figure 10.
The enlarged power tracking curve graph of the local shadow area.
4.3. Case 3: Grid-Connected Energy Storage Efficiency Test
4.3.1. Performance Analysis of WOSSA Algorithm
- Irradiation mutation;
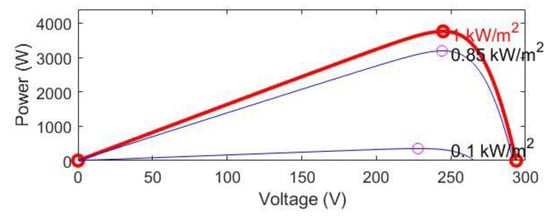
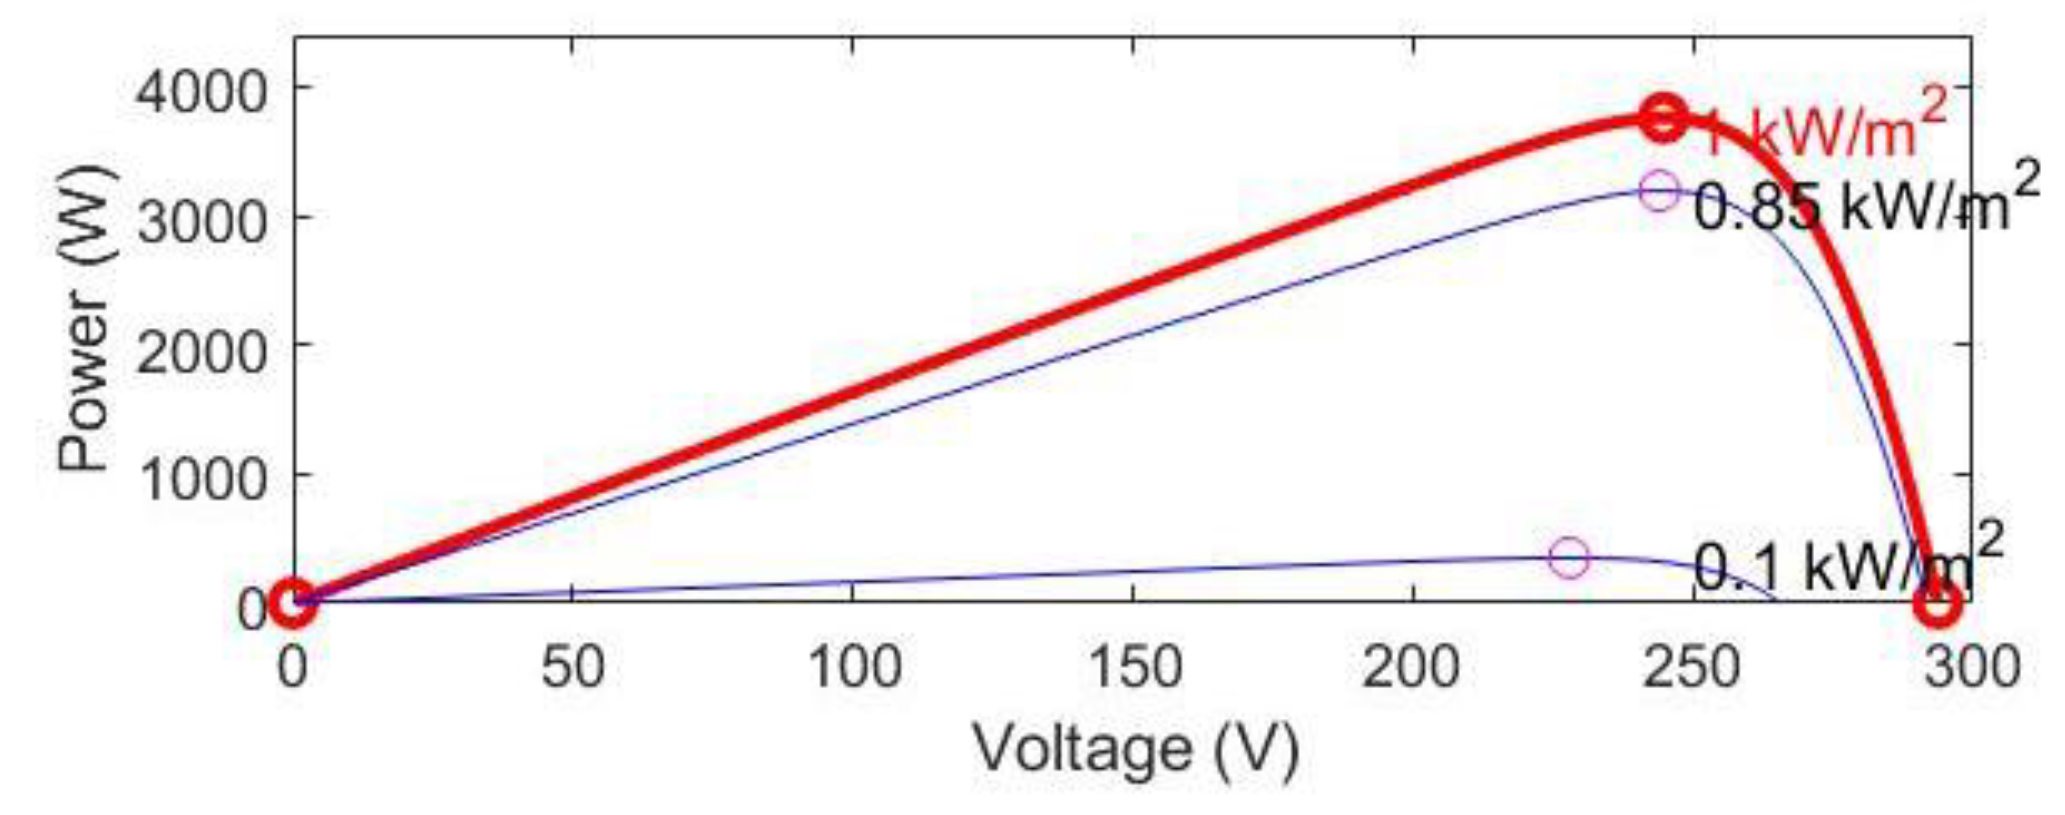
Based on the above experimental environment, a grid-connected energy storage model was added. To simulate the real grid-connected environment, the current was adjusted to allow multiple peaks to appear in the P-V curve. Light intensity is another important external factor affecting the output characteristics of photovoltaic modules. The light intensities are 1000 W/m2, 500 W/m2, and 100 W/m2. The most noticeable change is that for every increase of 500 W/m2 in light intensity, the short-circuit current of the module increases by approximately 7 A and the power increases by about 500 W. Figure 11 shows the detection of the P-U output characteristic curve of the photovoltaic module at a temperature of 25 °C.
Figure 11.
Photovoltaic modules on the P-U curve diagram.
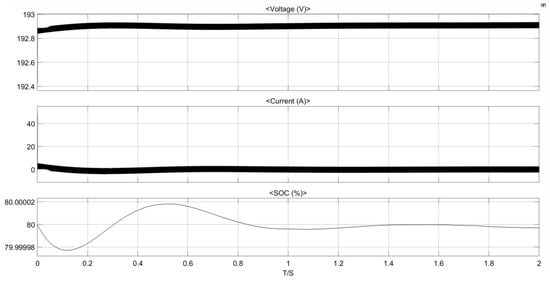
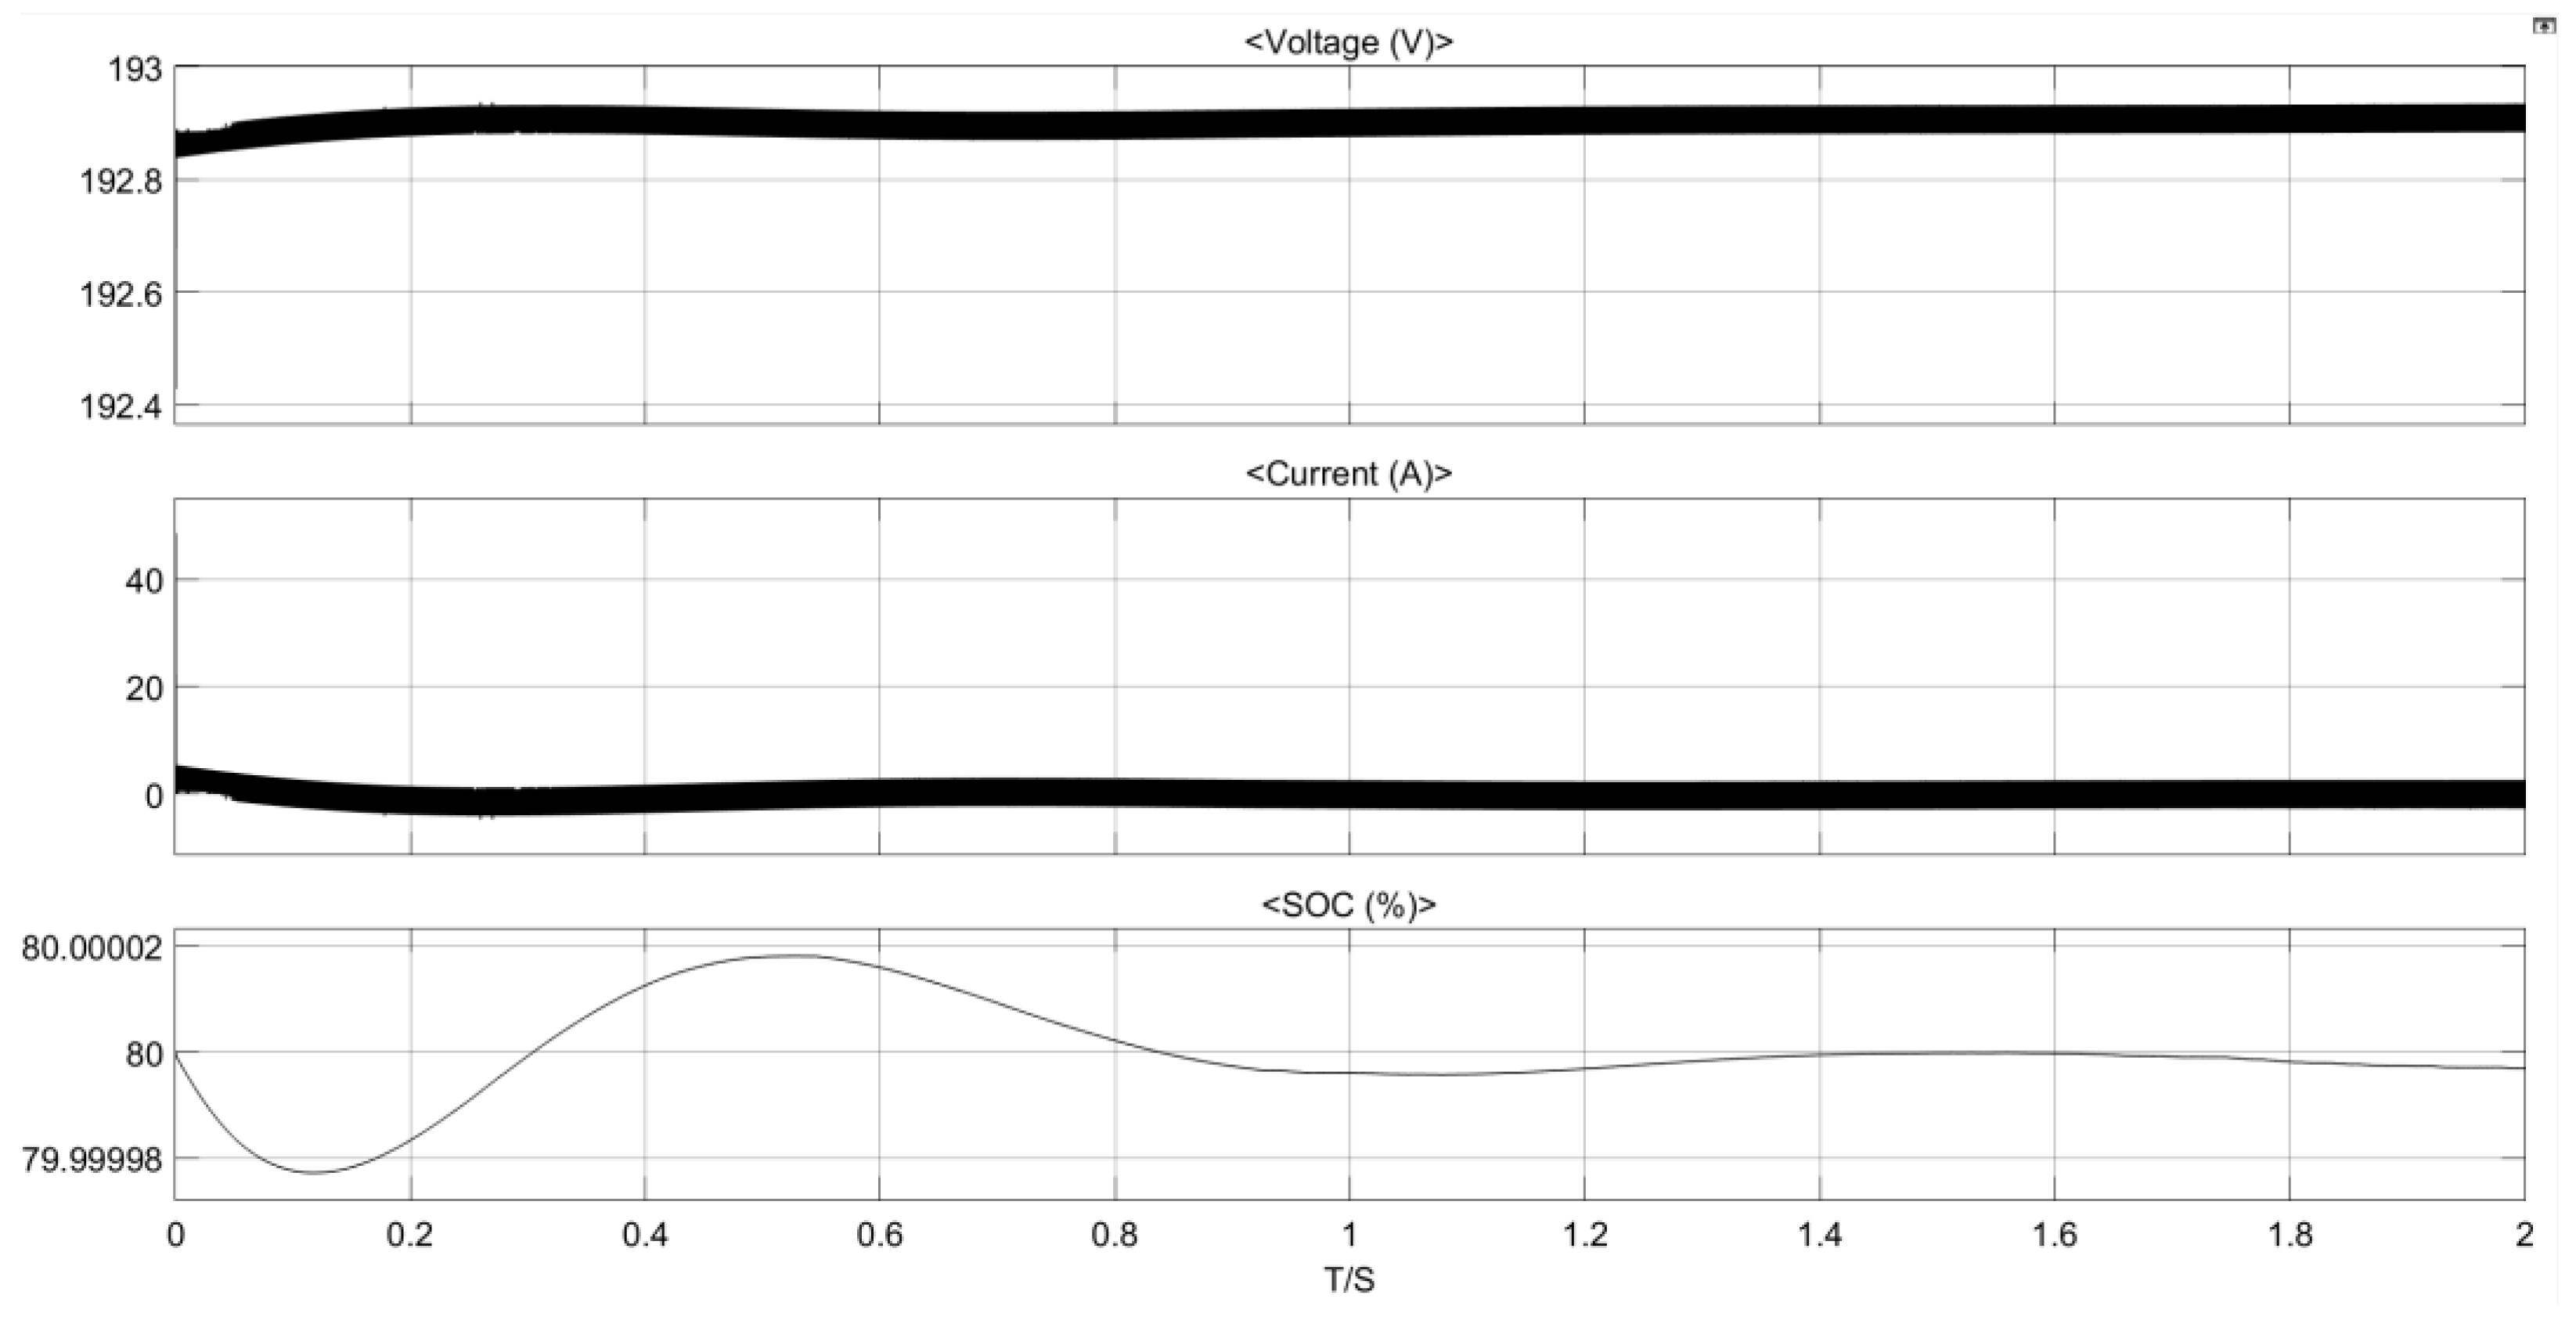
To highlight the performance level, a simulation test of the WOSSA algorithm was conducted. In this case, we observed that the charging state of the battery (SOC curve) shown in Figure 12 rose at a faster rate, which was the same as that of SSA at the beginning: the initial photovoltaic array started to operate, generating insufficient power, and the battery discharged externally. When the SOC curve increased, excess electrical energy was generated. The tracking performance of the change was verified to demonstrate the obvious tracking process of the WOSSA algorithm. During the charging and discharging process of the battery, there were differences in the current direction: the current was negative during charging and positive during discharging. At the same time, its terminal voltage also exhibited fluctuating characteristics as the charging and discharging status changed.
Figure 12.
Battery status diagram during simulation operation.
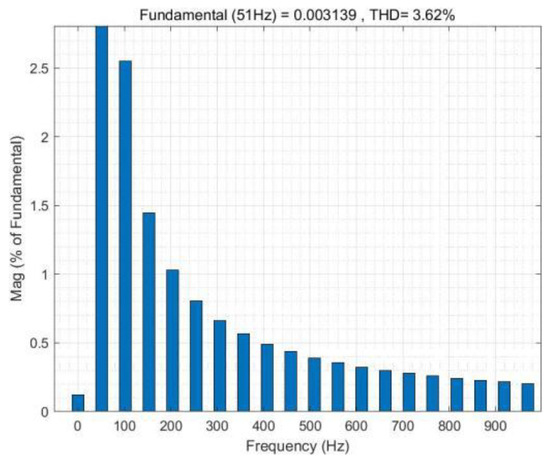
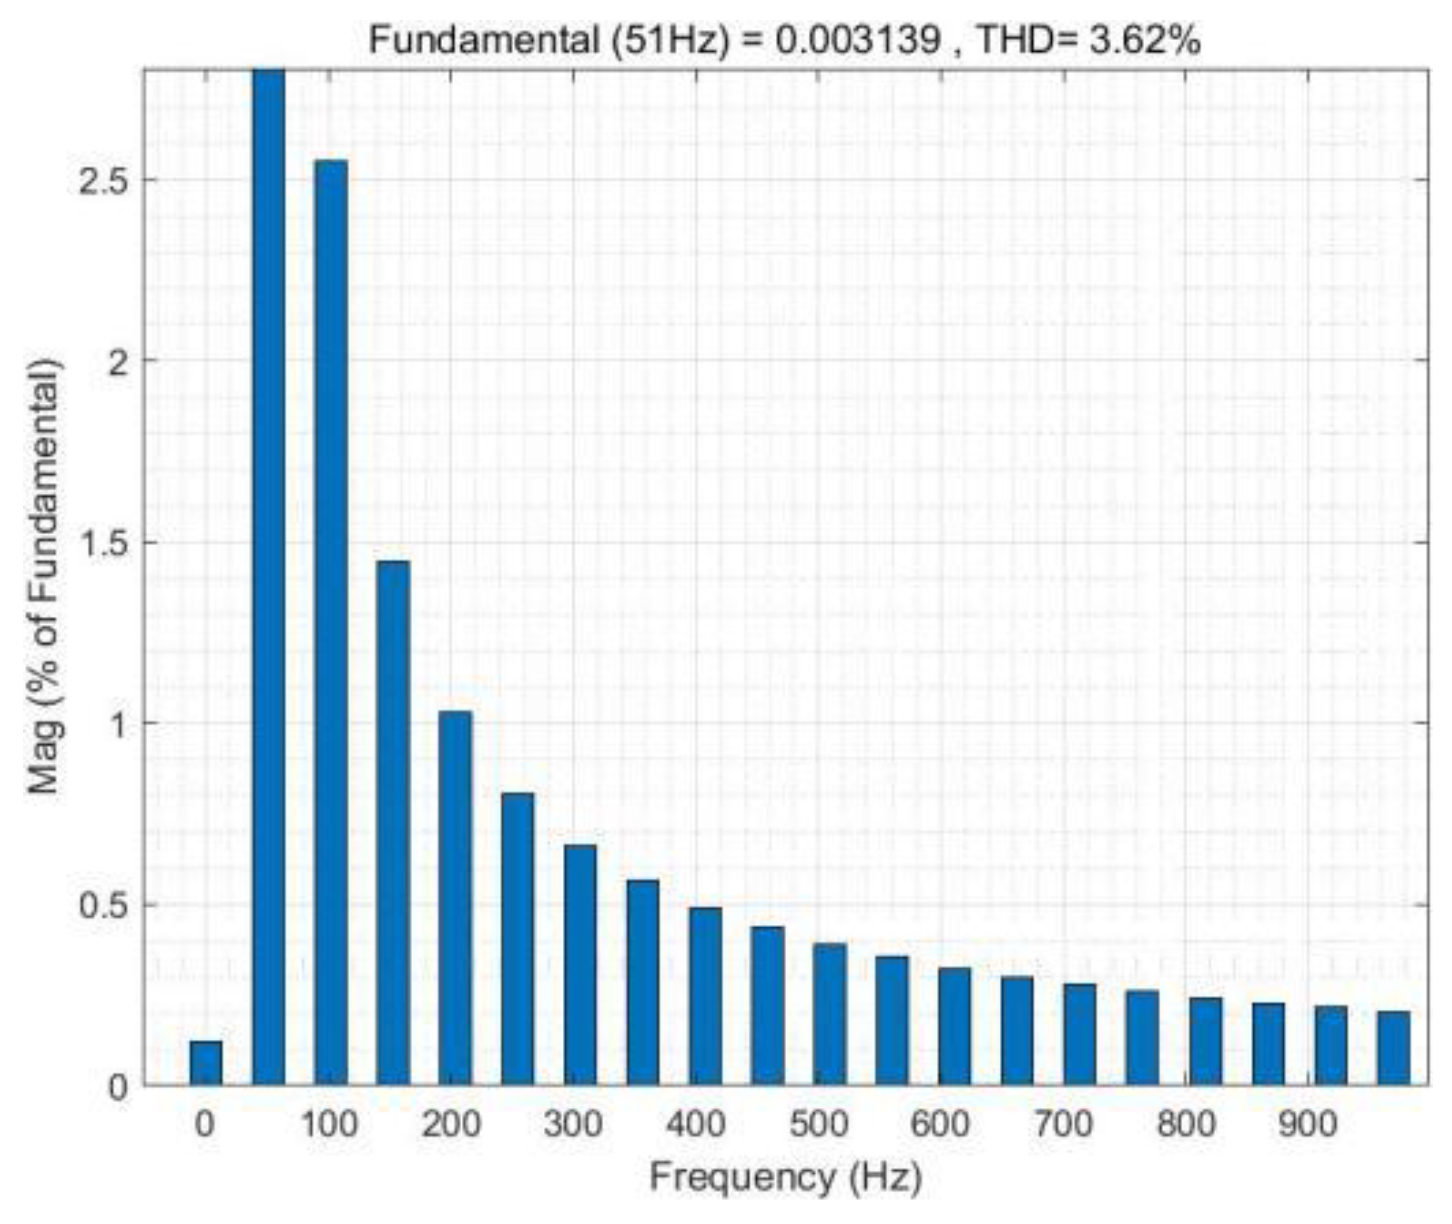
During the simulation process, there was a fluctuation response in the grid current. Through Fourier analysis to analyze the frequency domain characteristics of the current waveform, the result showed that the total harmonic distortion rate was 3.62%, which met the typical grid connection standards. In the spectral characteristic Figure 13, the low-frequency harmonic components were relatively low, indicating that the system still maintained good power quality under sudden irradiation changes. This result was mainly attributed to the dynamic performance of the WOSSA fusion algorithm: when the irradiation changed rapidly, the algorithm, through a multi-strategy collaborative mechanism, could quickly lock the global maximum power point in the solution space, thereby significantly suppressing the current harmonics caused by the frequent jumps of the power point.
Figure 13.
FFT analysis diagram of the power grid.
Compared with a single intelligent algorithm, WOSSA has improved the convergence speed by approximately 55% and the power tracking range by about 70%. This improvement is directly reflected in the current harmonic spectrum distribution. The system led by WOSSA did not show obvious mid-high frequency harmonic clusters during the irradiation step transition, indicating that its MPPT dynamic process is smoother and the overshoot is smaller. Especially in complex working conditions such as local shading, this algorithm effectively avoids the power oscillation caused by traditional algorithms easily falling into local extreme values by adaptively balancing global exploration and local development. Thus, it demonstrates better comprehensive performance in both harmonic performance and tracking efficiency. Comparative experiments further show that, compared with the traditional SSA algorithm, WOSSA has significant advantages in search efficiency and accuracy, reflecting the dual benefits of algorithm improvement in controlling power quality.
- Temperature sudden change;
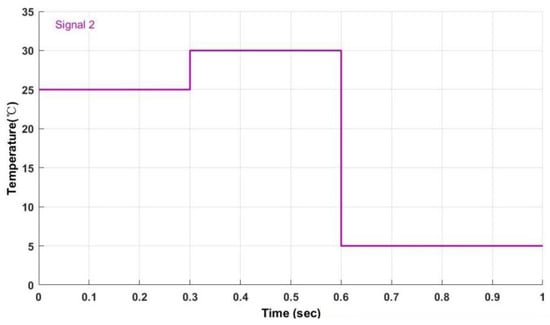
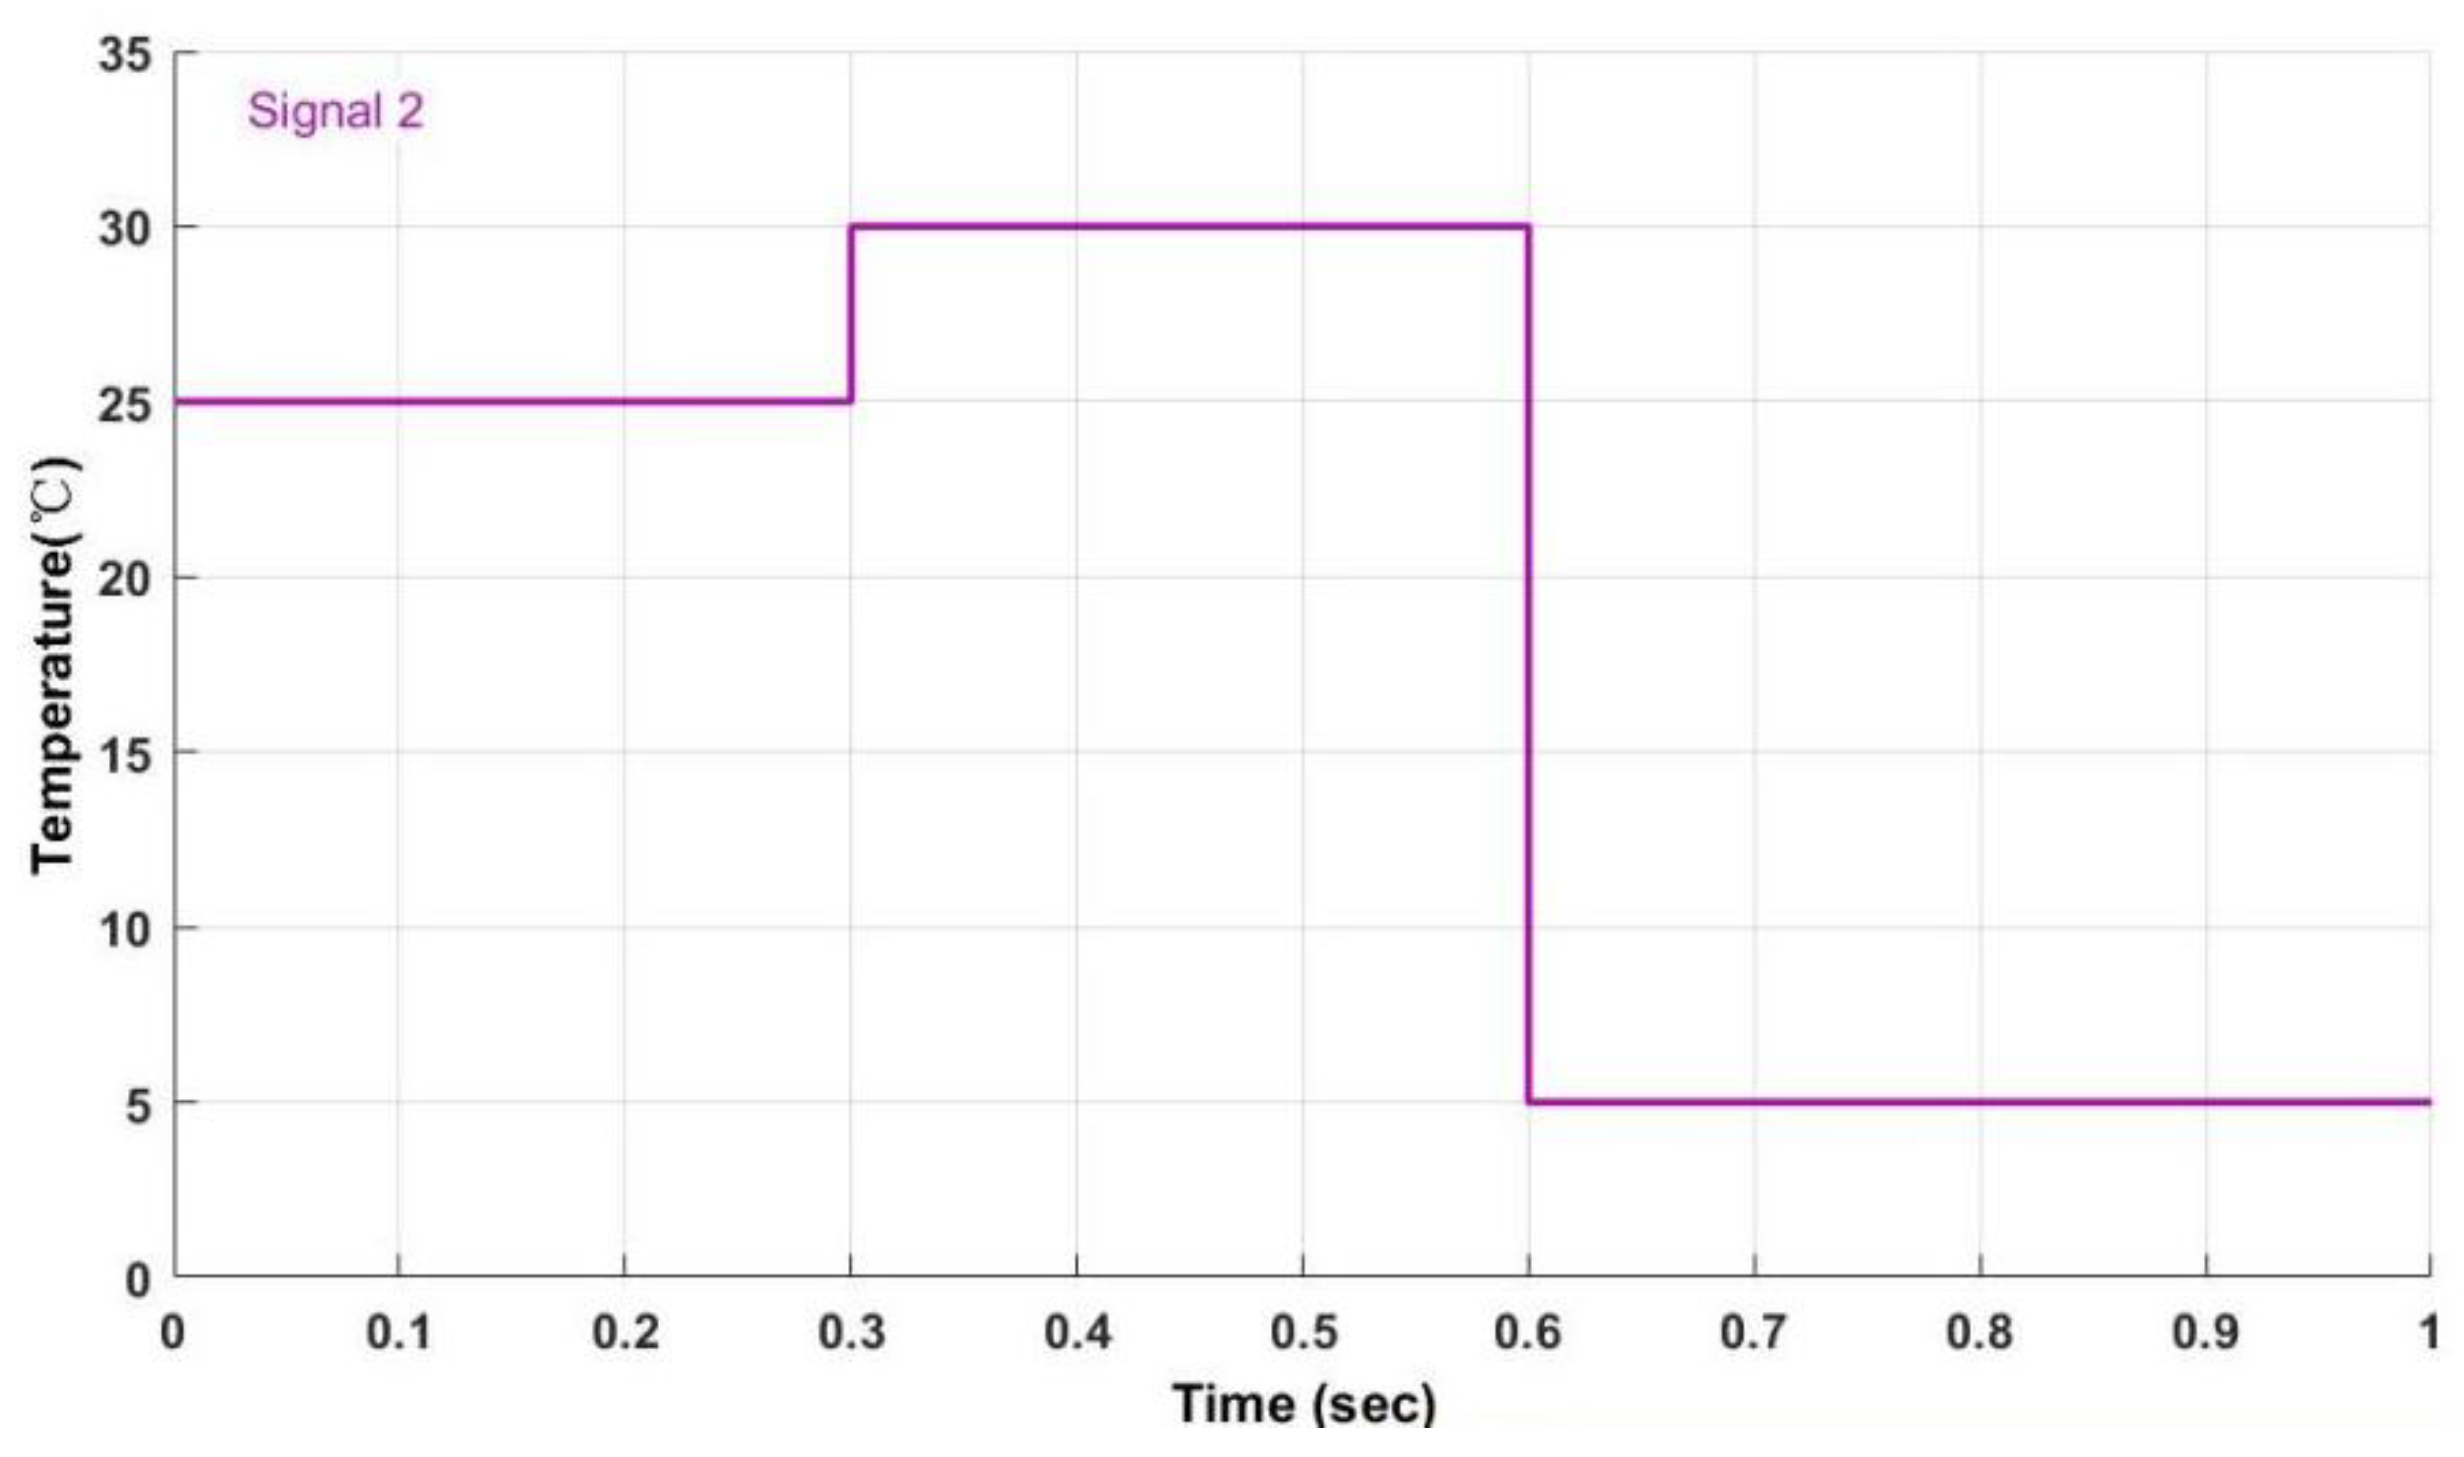
The efficiency test of temperature mutation is used to evaluate the performance of the proposed algorithm under dynamic weather conditions. In the temperature mutation efficiency test, the temperature is provided in a trapezoidal waveform, and the slopes of the waveforms are different. For the test of the proposed algorithm, the temperature level is rapidly increased from 25 degrees to 30 degrees within 0.05 s, as shown in Figure 14.
Figure 14.
Temperature change chart.
The results of the drift test are shown in Table 7.
Table 7.
Results of temperature spike.
This rapid change in temperature can be regarded as a drift problem, which is particularly common in the weather in the north. The proposed algorithm is capable of identifying the causes of the power increase, whether it is due to disturbances or an increase in insulation. The results of the drift test are shown in the table.
4.3.2. Performance Analysis of SSA Algorithm
Under standard conditions, the temperature is maintained at 25 °C and the irradiance is 1000 W/m2. To highlight the performance level, simulations of the SSA algorithm, MPPT grid connection and energy storage tests were conducted. Under these circumstances, the effect of the above algorithm for grid connection and energy storage control is shown in Table 8.
Table 8.
Analysis results of SSA during simulation operation.
The first charged state SOC was observed, and the simulation results were consistent with the proposed WOSSA results during the simulation process. This was because the grid voltage set for the single-phase grid connection in the experiment was the same. The FFT analysis results showed that the harmonic distortion rate was 3.66%, which met the grid connection standards. The SSA algorithms could all quickly and accurately track the global maximum power point. Compared with a single algorithm, the fusion algorithm improved the convergence speed by approximately 55% and the tracking size by approximately 70%. Based on FFT analysis, the fusion algorithm exhibited improved stability and efficiency, better aligning with grid connection standards. Throughout the experiments, all comparison algorithms were tested under complex lighting conditions. The key performance metric was not the instantaneous tracking error or efficiency, but rather the cumulative power generation over the entire simulation period—that is, the total energy actually delivered by the system under each algorithm’s control. This was measured as the percentage of actual cumulative power generation relative to the theoretical maximum possible output. Furthermore, compared to the traditional SSA algorithm, WOSSA demonstrated significant advantages in both search efficiency and accuracy.
5. Experimental Measurement
5.1. Overview of the Experimental Platform
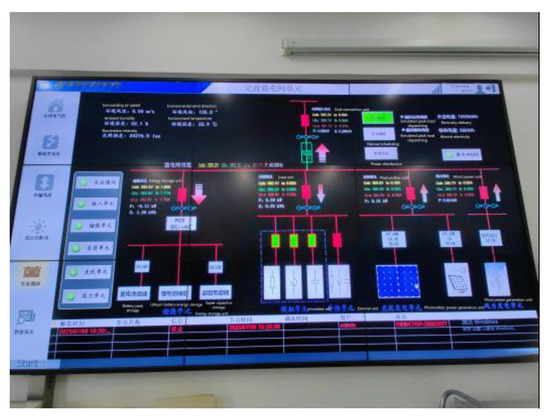
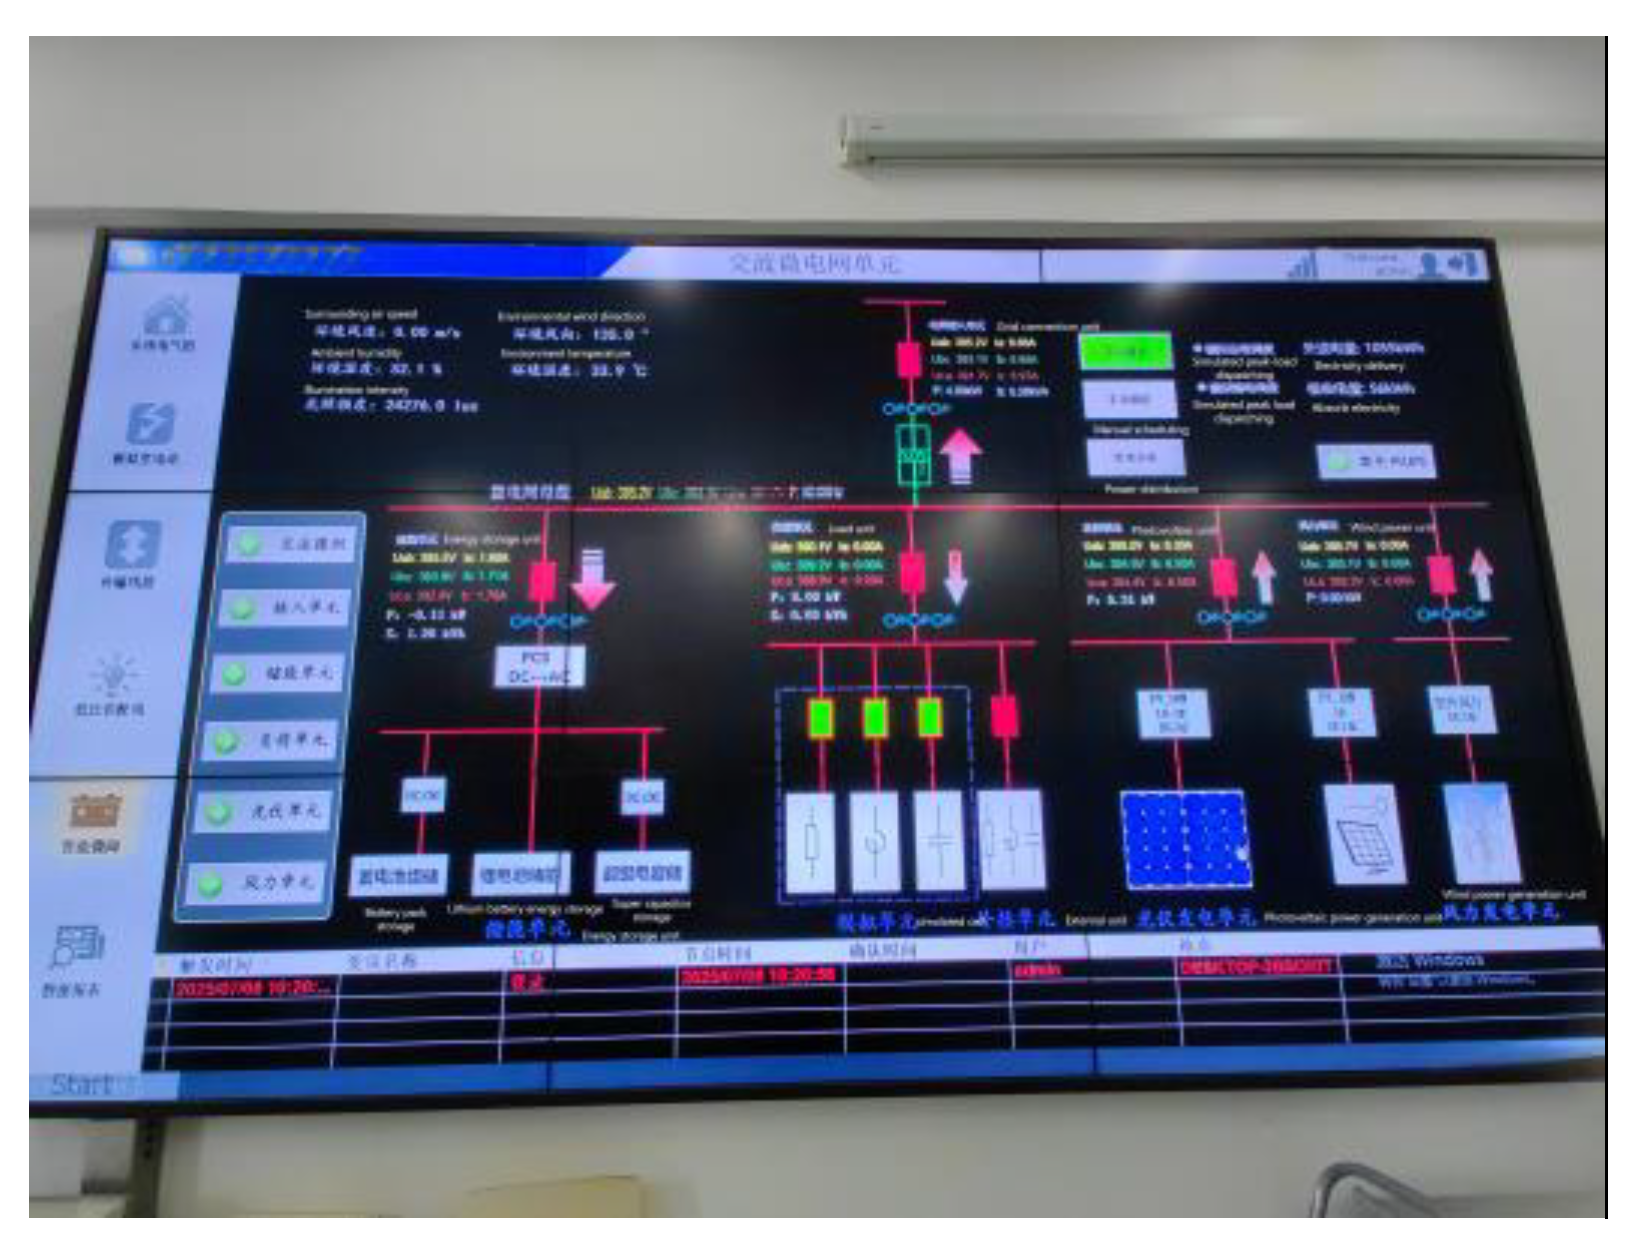
The multi-type landscape and architecture integrated experimental platform is located in a school in the northeastern region. The experimental platform adopts the “wind-solar grid-connected” technology that integrates wind power generation, low-voltage distribution, an intelligent microgrid, and a simulated substation. It is mainly used for testing and application of the wind and solar energy efficiency in the intelligent microgrid system, including three parts: input transformer, power conversion unit, and coupling transformer. The key parameters of the photovoltaic modules used in the experiment are: The open-circuit voltage of the photovoltaic cell model was set at 38.1 V, the short-circuit current at 7.8 A, the peak voltage at 30 V, and the peak current at 7.35 A. Converter topology: The hardware platform adopts the Boost converter topology to achieve the voltage boosting and voltage reducing regulation at the photovoltaic ports, ensuring that it can track the maximum power point under various sunlight conditions. As illustrated in Figure 15 and Figure 16, the power conversion unit comprises an AC/DC rectifier unit and a DC/AC inverter unit. The AC/DC rectifier unit utilizes a two-level converter topology. The wind and solar power generated by the system is first used for self-consumption, with any surplus energy stored in the energy storage system. The converter is then connected to the building’s AC power system. The AC output port of the converter is paralleled with a filter capacitor via a coupling transformer before finally interfacing with the power grid.
Figure 15.
Laboratory equipment.
Figure 16.
System diagram of the communication microgrid unit operating in the laboratory.
When the optimal individual position determined by the WOSSA algorithm is directly mapped to the PWM duty cycle signal of the converter, the fitness value in simulation corresponds to the objective function f(X). In the hardware implementation, calculating the fitness value is equivalent to the real-time measurement of the output power P at the photovoltaic port. The algorithm updates the individual position Y(k) according to the prescribed formula. In hardware, this position update is immediately converted into an update of the PWM register value, thereby altering the duty cycle D for the next control cycle. This enables active disturbance and optimization of the photovoltaic grid-connected operating point.
5.2. Power Generation Performance Analysis
The peak efficiency of photovoltaic cells is influenced by the intensity of light and the installation form. In practical projects, it often fails to reach the theoretical value specified by the product. When calculating the peak efficiency of the photovoltaic system, the formula shown in Equation (27) is adopted.
In the formula: represents the peak efficiency of the photovoltaic module in percentage; represents the peak power of the photovoltaic module in kW; H represents the standard solar irradiance intensity, which is taken as 1000 W/square meter; represents the actual power generation area of the photovoltaic module in square meters. After the laboratory platform is subjected to light and temperature disturbances, the output power can return to a relatively stable range. Thus, a smaller steady-state error range can be achieved, thereby enhancing the system’s resistance to external environmental disturbances and ensuring that the system can more accurately maintain the maximum power output state when facing environmental changes.
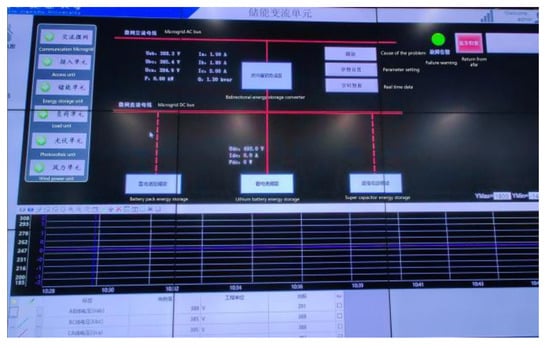
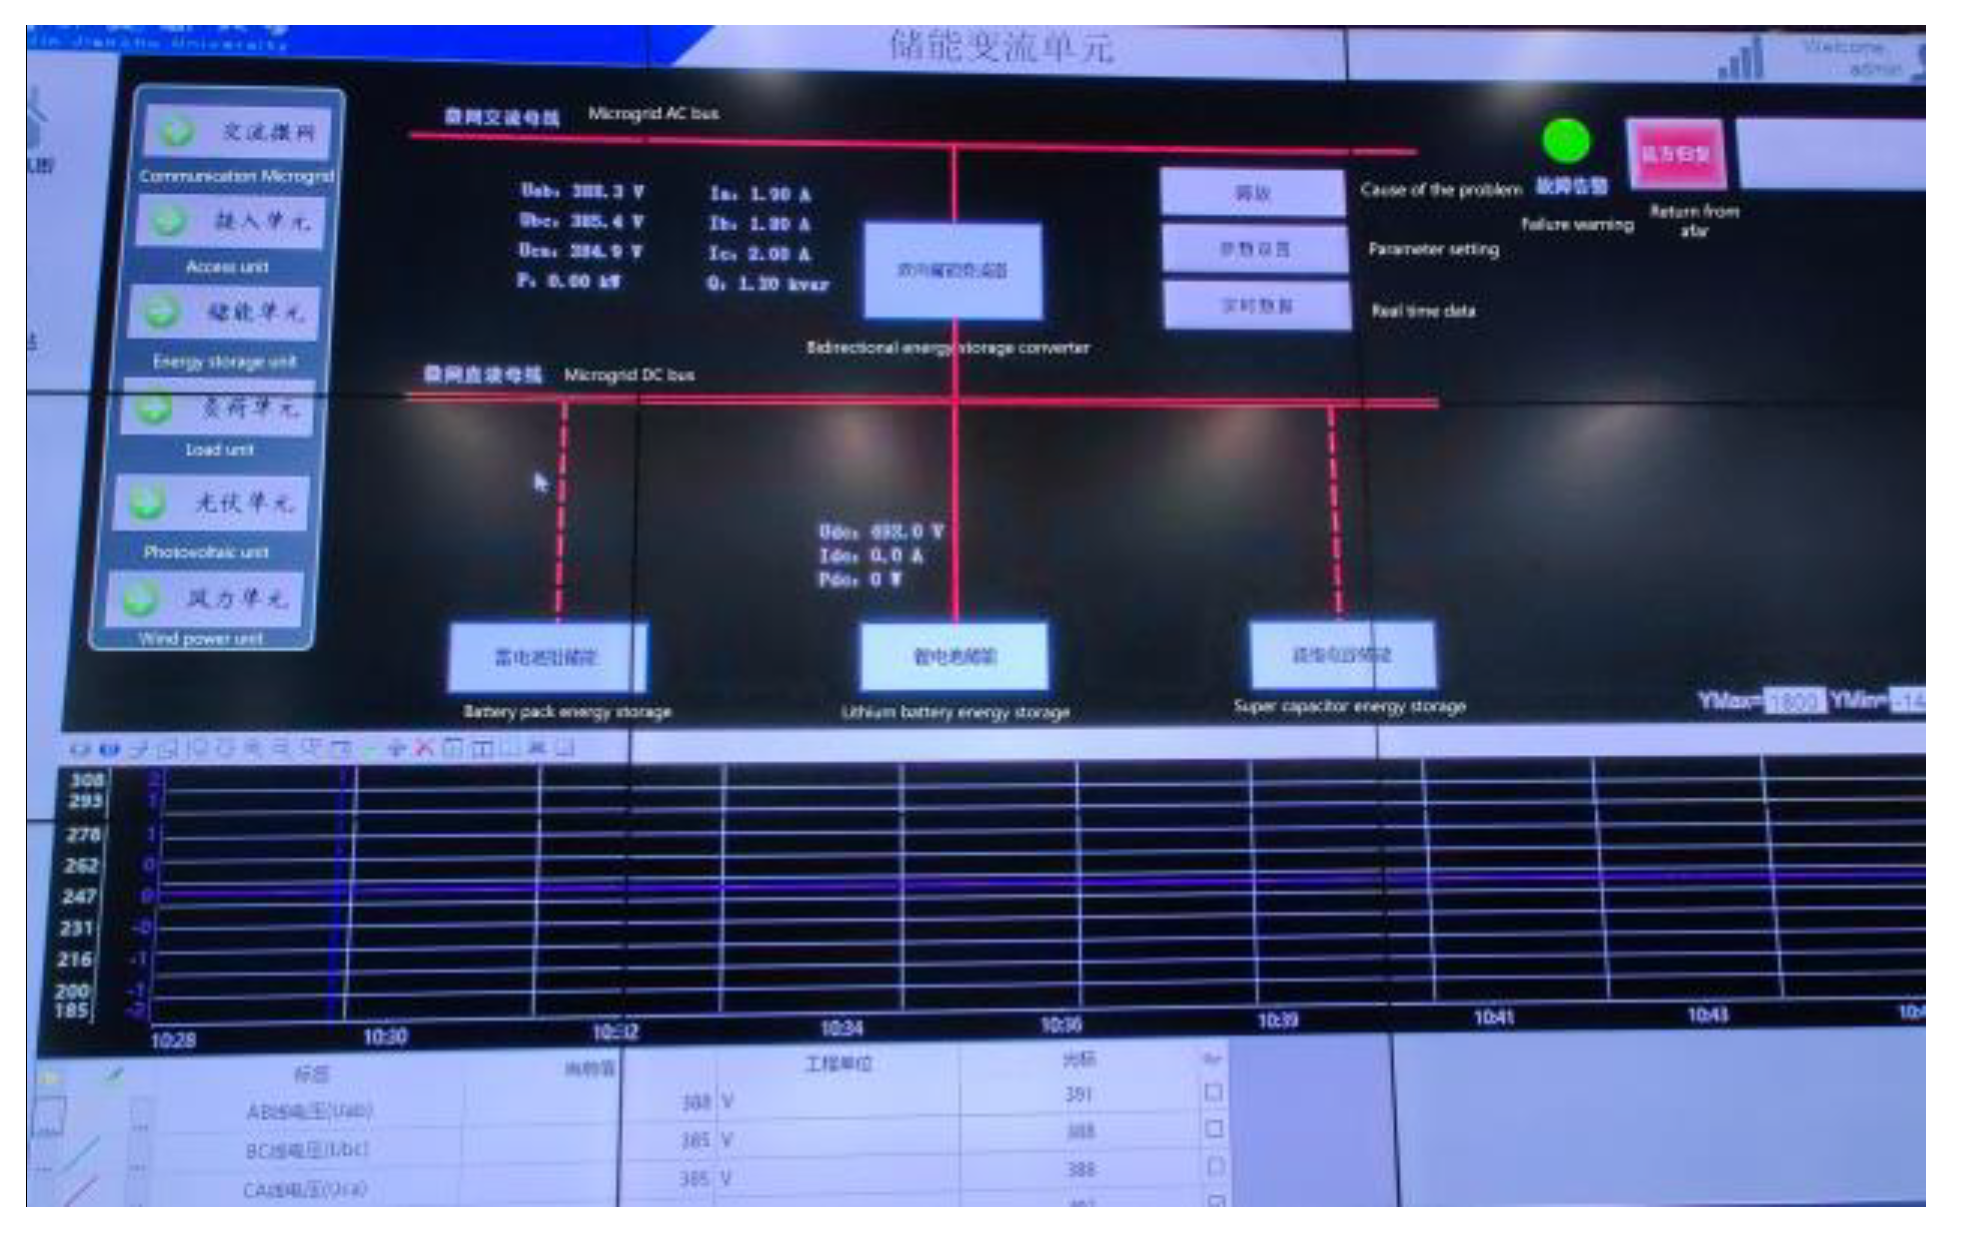
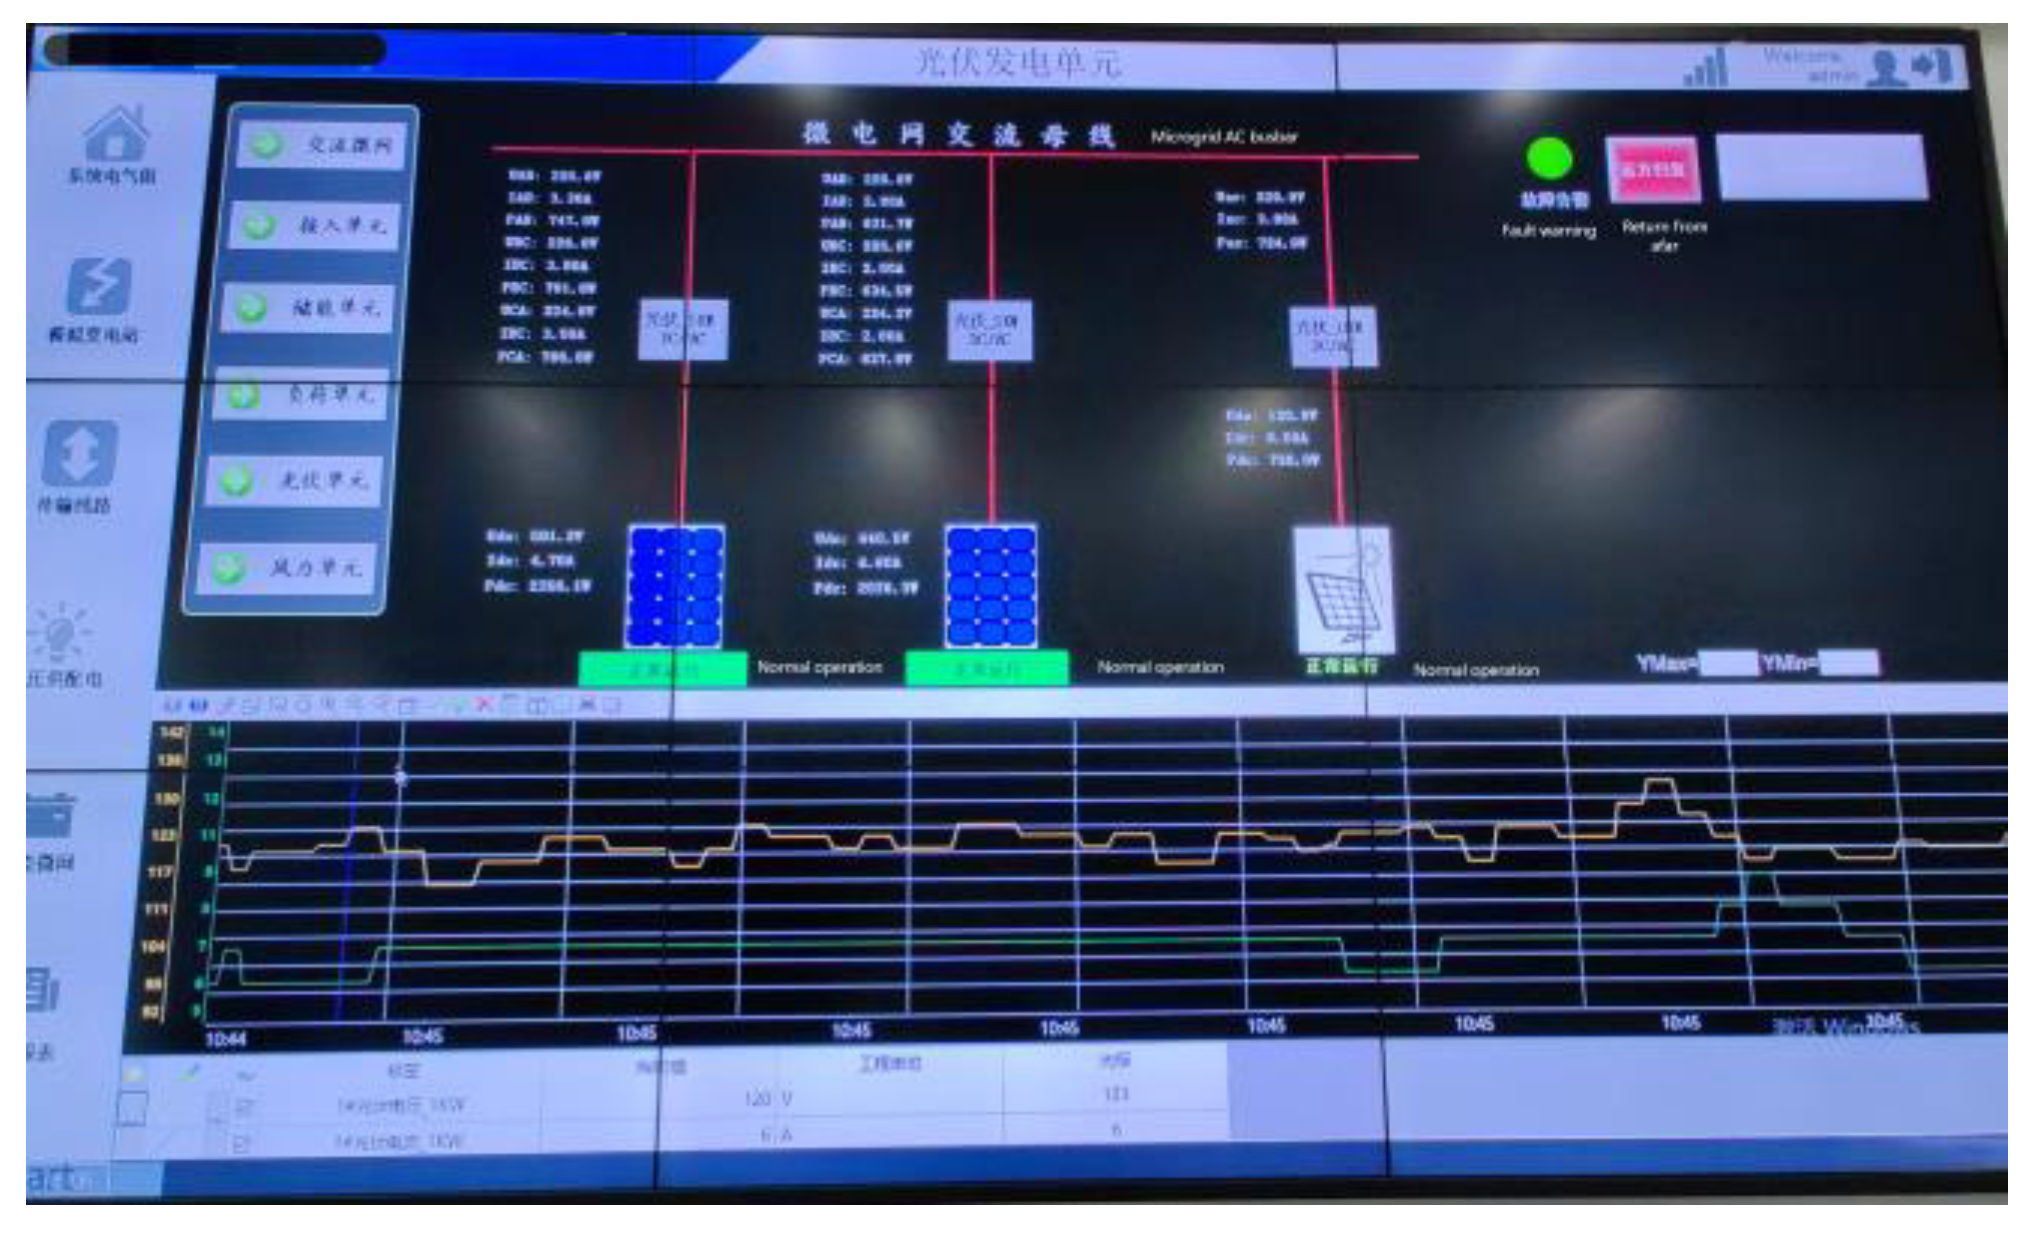
As can be seen from the figure, the power generation effect of the photovoltaic modules is stable. The analysis results of the laboratory platform show that as shown in Figure 17 and Figure 18, the voltage of the energy storage unit is also above 380 V, the power generation efficiency per unit installation area of photovoltaic is 2 kW, and the grid connection and energy storage effect is the best. This is because under irradiation sudden change conditions, the WOSSA fusion algorithm can quickly and accurately track the global maximum power point. Compared with a single algorithm, the fusion algorithm has increased the convergence speed by approximately 55% and the tracking size by approximately 70%. Especially in complex shadow conditions, the fusion algorithm shows better stability and efficiency.
Figure 17.
Operation diagram of the energy storage system in the laboratory.
Figure 18.
Operation diagram of the photovoltaic system in the laboratory during operation.
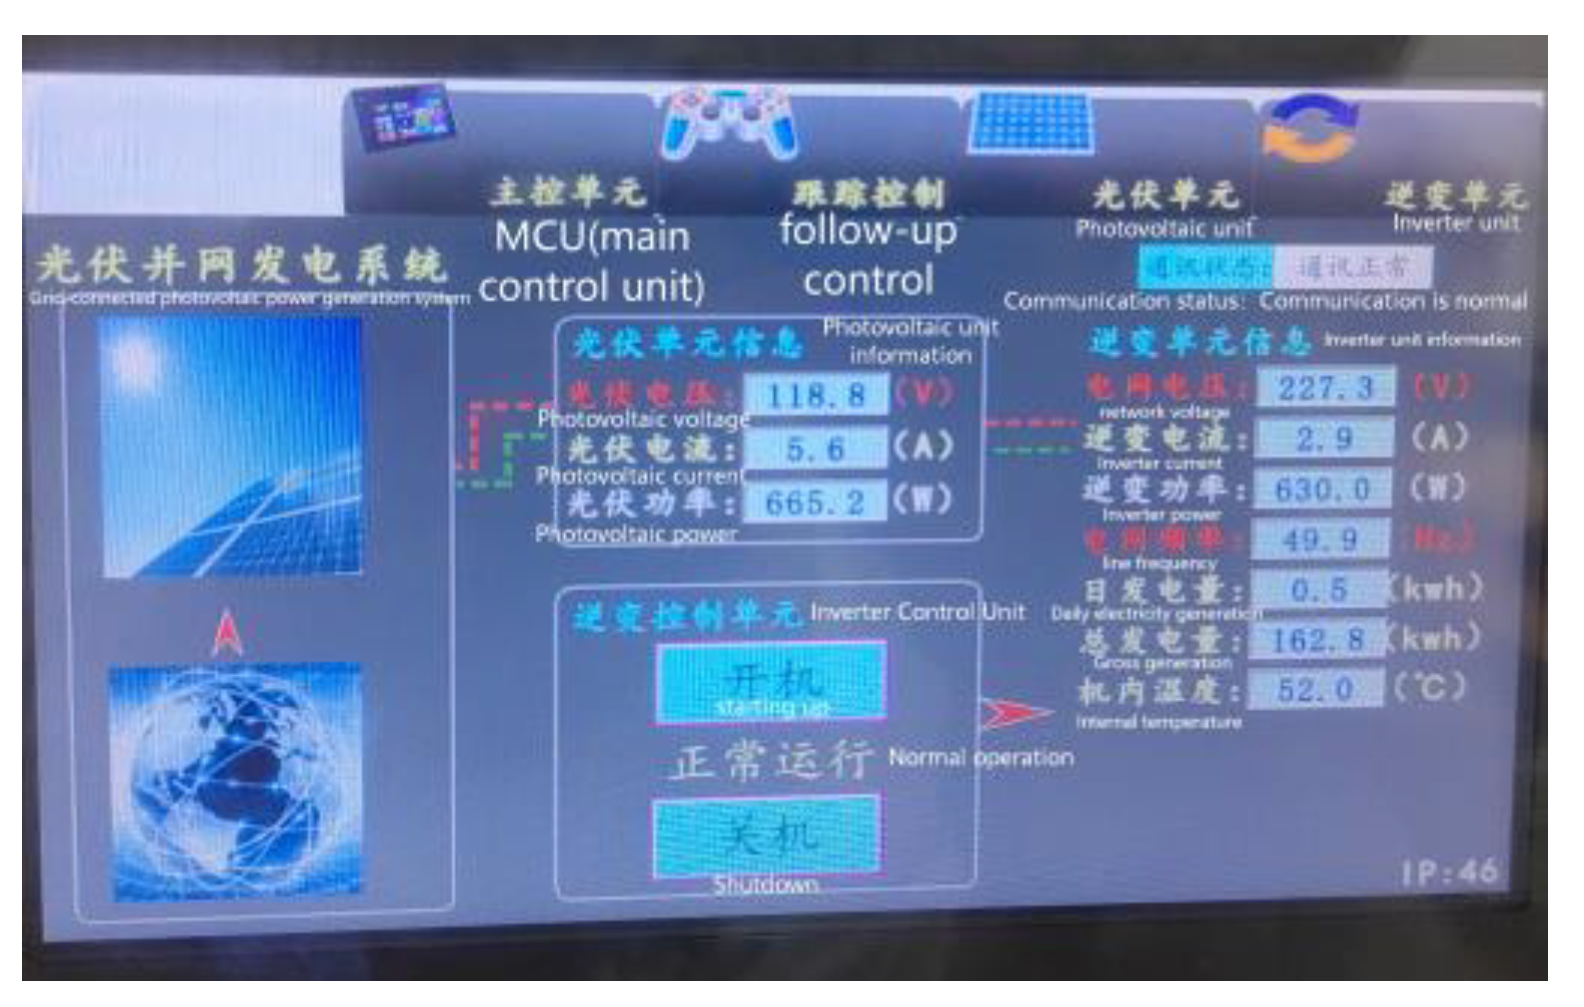
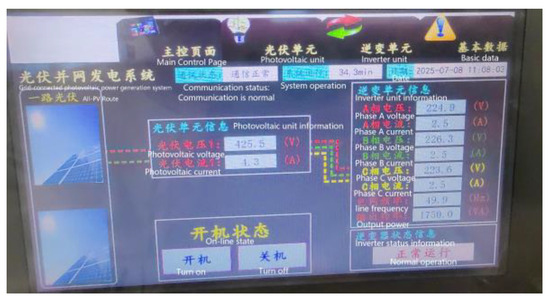
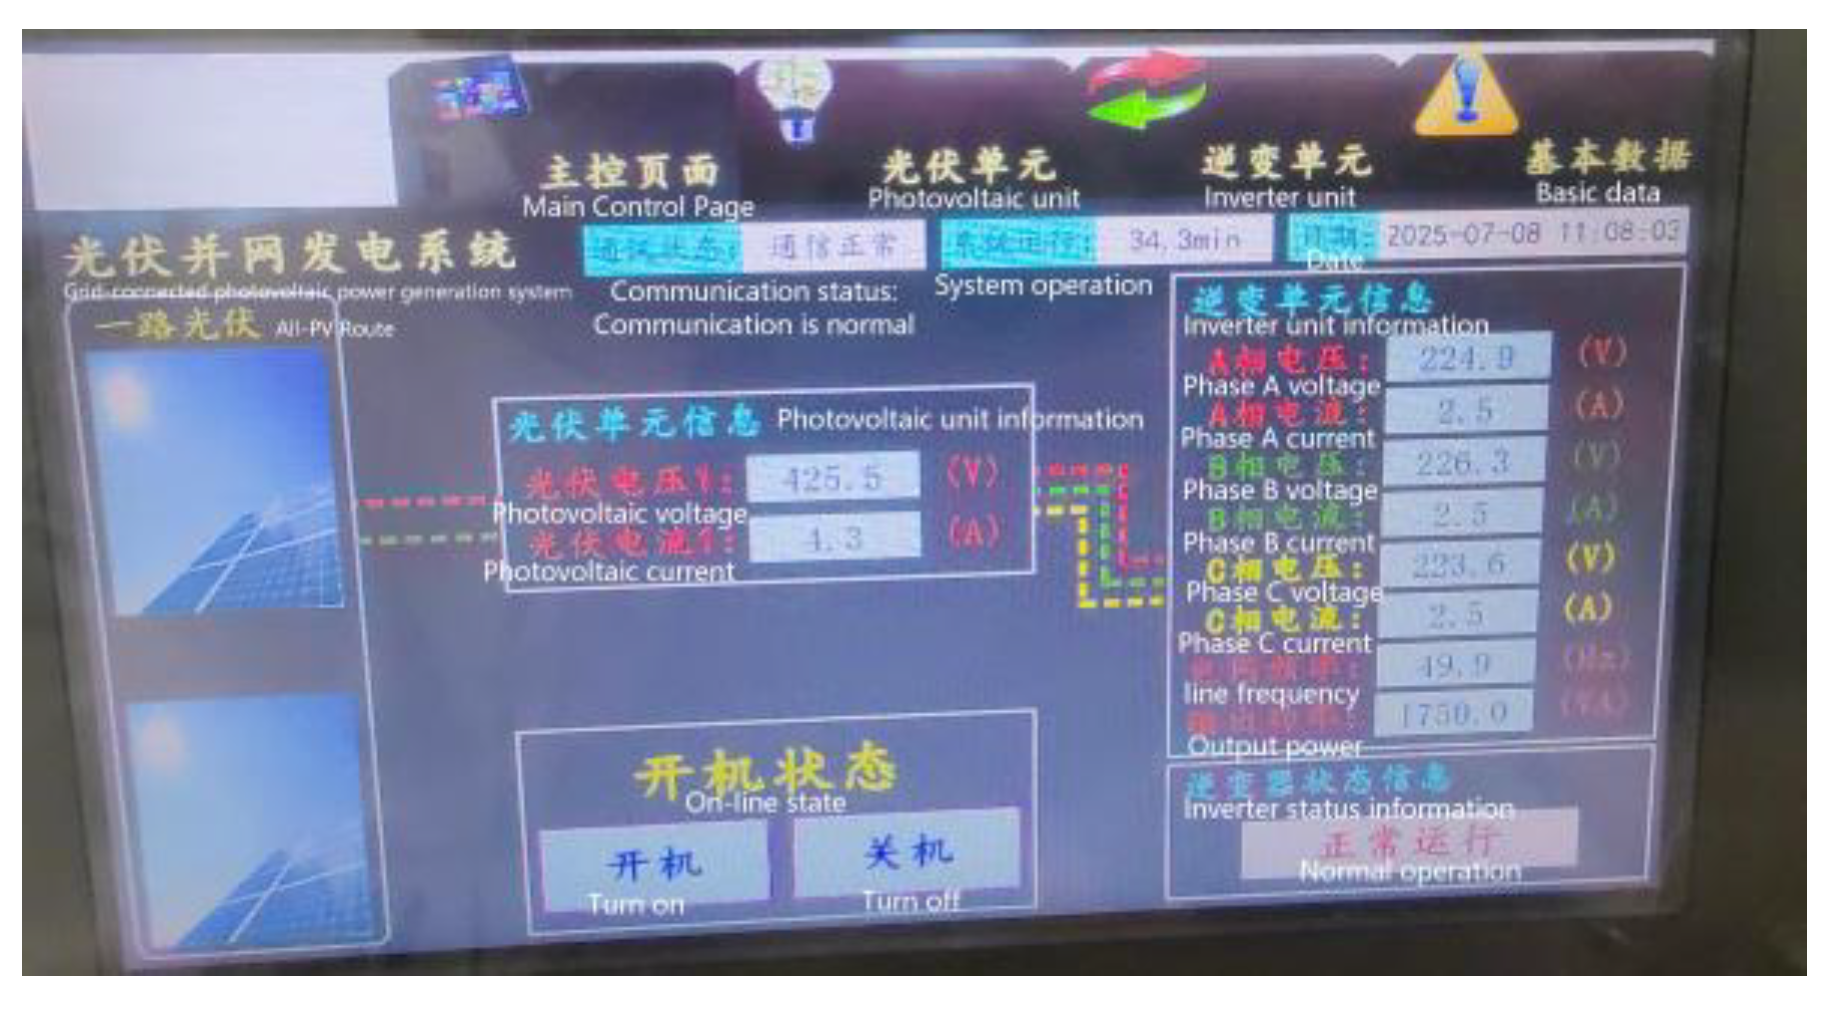
Although the fixed support type photovoltaic system has obvious advantages in terms of power generation compared to grid connection, it also requires power consumption itself. Therefore, the assessment of its power generation efficiency needs to take into account the energy consumption due to transmission and weather conditions. By using an energy consumption monitor to monitor the power generation energy consumption, based on the monitoring data, the average daily power generation efficiency of the photovoltaic system is 425.5 V and 4.3 A. The grid frequency is 49.9 Hz, and the daily power generation is 0.5 kwh. As shown in Figure 19 and Figure 20, this system has a significant improvement in operational efficiency. The control methods proposed in this section have the following characteristics. They have better response speed and steady-state accuracy, and the system can reach the maximum power point within a short period of time. While maintaining a fast response, when the system is in a steady state, it can better eliminate jitter. When the light and temperature are disturbed, the WOSSA algorithm can quickly track to the new maximum power point while ensuring that the output power fluctuation is small.
Figure 19.
The operation chart of photovoltaic grid-connected power generation in the laboratory.
Figure 20.
The power generation curve of the photovoltaic system in the laboratory.
This proves that the WOSSA algorithm not only has excellent instantaneous tracking performance in static or multi-peaked curves, but more importantly, in the long-term operation simulating real dynamic environments, it can translate into significant system-level energy savings. This demonstrates that the WOSSA algorithm has the value and potential for practical engineering applications.
6. Conclusions
Based on the research findings above, a novel method integrating intelligent hybrid algorithms with maximum power point tracking (MPPT) was proposed for grid-connected energy storage photovoltaic systems. Firstly, the MPPT control performance of the WOSSA algorithm under extreme irradiation fluctuations was tested, and transient stress conditions that might occur due to sudden changes in irradiance were simulated. Traditional algorithms such as particle swarm optimization (PSO) and parrotfish Algorithm (SSA) tend to over-rely on the current best individual and often converge prematurely to local optima, which limits global exploration. To address these issues, the proposed WOSSA algorithm incorporates chaotic initialization, a weighted update mechanism, a filling function, and dynamic restart measures. Among these improvements, the filling function and adaptive weighting contribute most significantly to convergence accuracy by directly optimizing the core position-update process. The filling function balances exploration and exploitation to accelerate convergence and reduce oscillations; adaptive weighting helps maintain population diversity and prevents premature stagnation; and dynamic restart assists in escaping local optima. Simulation experiments in Section 4 indicate that variations in solar irradiance are the primary disturbance source for the system. A sudden drop in irradiance considerably reduces the output current of the photovoltaic panels, while the voltage at the energy storage battery terminals fluctuates within a narrow range—a typical characteristic of system operation near the maximum power point. The voltage stability under maximum power conditions verifies the adaptability of the WOSSA algorithm to irradiation changes. Moreover, the consistency between simulation and experimental data demonstrates that despite significant fluctuations in irradiance and temperature, the system can maintain stable maximum power output and, through its grid-connected architecture with energy storage, compensate for instantaneous power imbalances in real time. Building on these results, conclusions regarding system stability, energy performance, and self-consumption level are directly supported by experimental and simulation data. Both simulation studies and laboratory-platform analyses confirm that the proposed method effectively enhances system performance under various operating conditions, leading to the following main conclusions:
- The MPPT convergence speed has been improved by approximately 55%, and the tracking range has been increased by approximately 70%;
- The voltage of the energy storage unit is also above 380 V, and the power generation efficiency per unit of photovoltaic installation area is 2 kW;
- Especially in grid connection and battery energy storage tests, FFT analysis was applied. The voltage and current generated by the WOSSA algorithm have stable outputs. The grid connection voltage and current, after FFT analysis, can all reach below 5% of the standard.
Author Contributions
Conceptualization, L.W. and Q.K.; methodology, L.W. and Q.K.; formal analysis, L.W. and Q.K.; writing—original draft preparation, L.W. and Q.K.; writing—review and editing, L.W. and Q.K.; visualization, Q.K.; supervision, L.W.; project administration, L.W.; funding acquisition, L.W. All authors have read and agreed to the published version of the manuscript.
Funding
Jilin Provincial Development and Reform Commission Infrastructure Construction Fund Innovation Capacity Project (Project Number: 2022C045-3); Key R&D Project of Jilin Provincial Department of Science and Technology (Project Number: 20230203129SF).
Institutional Review Board Statement
Not applicable.
Informed Consent Statement
Not applicable.
Data Availability Statement
The data presented in this study are available on request from the corresponding author.
Conflicts of Interest
The authors declare no conflicts of interest. The funders had no role in the design of the study; in the collection, analyses, or interpretation of data; in the writing of the manuscript; or in the decision to publish the results.
Abbreviations
The following symbols are used in this manuscript:
| Title | Implication |
| k | Boltzmann constant |
| T | absolute temperature |
| q | unit charge quantity |
| high-frequency carrier | |
| modulating wave | |
| carrier period | |
| carrier peak value | |
| constant in the chaos coefficient | |
| size of the chaos coefficient at time | |
| random search | |
| L | 1×d matrix |
| worst position | |
| current position | |
| distance from the first WOSSA to the prey | |
| H | standard solar irradiance intensity |
References
- Bairami, S.; Salimi, M.; Mirabbasi, D. A Novel Method for Maximum Power Point Tracking of the Grid-Connected Three-Phase Solar Systems Based on the PV Current Prediction. Chin. J. Electron. 2023, 32, 353–364. [Google Scholar] [CrossRef] [Scilit]
- Haghighat, M.; Niroomand, M.; Tafti, H.D.; Townsend, C.D.; Fernando, T. A Review of State-of-the-art Flexible Power Point Tracking Algorithms in Photovoltaic Systems for Grid Support: Classification and Application. J. Mod. Power Syst. Clean Energy 2024, 12, 1–21. [Google Scholar]
- Li, S.; Zhang, B.; Xu, T.; Yang, J. An artificial fish swarm control strategy for MPPT in single-stage photovoltaic grid-connected systems. Power Electron. Technol. 2014, 48, 4–6. [Google Scholar]
- Chen, J.; Zhang, W.; Li, X. Photovoltaic MPPT Control Based on Improved Conductance Increment Method. Smart Power 2021, 49, 47–55. [Google Scholar]
- Luo, H.; Wang, L.; Liu, T.; Tan, Q. Research on MPPT Control Based on Improved Harris Eagle and Conductance Increment Method. J. Power Supply 2026, 1–12. [Google Scholar]
- Wang, Y.; Ma, R.; Tang, S. Multi-objective Optimization Scheduling of AGV Flexible Job Shop Based on Improved Whale Optimization Algorithm. Mod. Manuf. Eng. 2024, 7, 17–25. [Google Scholar] [CrossRef]
- Li, K.; Jiang, X. Research on MPPT Control Based on Improved Particle Swarm Interval Type-2 Fuzzy Neural Network. Sol. Energy 2024, 45, 556–564. [Google Scholar]
- Li, Z.; Zhang, Y.; Wang, L.; Jia, X.; Zhang, Y. Research on Photovoltaic Multi-peak MPPT Based on Improved Quantum Particle Swarm Algorithm. Sol. Energy 2021, 42, 221–229. [Google Scholar] [CrossRef]
- Guo, K.; Yan, D.; Fu, J. Research on MPPT of Photovoltaic System Based on Improved Disturbance Observer Method. Power Technol. 2021, 45, 56–59. [Google Scholar]
- Pang, K.; Liu, W. Research on MPPT of Photovoltaic System Based on Improved Artificial Fish Swarm Algorithm. Sol. Energy 2014, 35, 2009–2014. [Google Scholar]
- Sun, S.; Li, C.; Li, Z.; Qi, X. Research on Photovoltaic MPPT Control Strategy Based on Swordfish Swarm Optimization Algorithm. Power Technol. 2023, 47, 1202–1206. [Google Scholar]
- Wu, C.Y. Research on MPPT Based on Whale Particle Swarm Fusion Algorithm. Power Technol. 2023, 47, 1351–1354. [Google Scholar]
- Li, M.; Wang, T.; Zhou, F.; Shi, M. An Adaptive Single Neural Control for Variable Step-Size P&O MPPT of Marine Current Turbine System. China Ocean Eng. 2021, 35, 750–758. [Google Scholar]
- Kahani, R.; Jamil, M.; Iqbal, M. An Improved Perturb and Observe Maximum Power Point Tracking Algorithm for Photovoltaic Power Systems. J. Mod. Power Syst. Clean Energy 2023, 11, 1165–1175. [Google Scholar] [CrossRef] [Scilit]
- Yap, Y.K.; Sarimuthu, C.R.; Lim, M.J. Artificial Intelligence Based MPPT Techniques for Solar Power System: A review. J. Mod. Power Syst. Clean Energy 2020, 8, 1043–1059. [Google Scholar] [CrossRef] [Scilit]
- Xu, P.; Liu, F.; Liu, B.; Duan, S. Analysis and Comparison of Several MPPT Methods for Photovoltaic Systems and Their Improvements. Power Electron. Technol. 2007, 41, 3–5. [Google Scholar]
- Xie, B.; Li, P.; Su, Y.; Su, J.; Liu, T. Research on Maximum Power Point Tracking Algorithm for Photovoltaic Arrays under Local Shadow. Acta Solaris Sin. 2023, 44, 47–52. [Google Scholar] [CrossRef]
- Liu, J.; Cui, Y.; Xie, J.; Zhang, P.; Liu, J. Natural Potential Inversion of Regular Geometric Objects Using Whale Optimization Algorithm. J. Cent. South Univ. 2023, 30, 3069–3082. (In English) [Google Scholar] [CrossRef] [Scilit]
- Kumar, V.; Singh, M. Derated Mode of Power Generation in PV System Using Modified Perturb and Observe MPPT Algorithm. J. Mod. Power Syst. Clean Energy 2021, 9, 1183–1192. [Google Scholar] [CrossRef] [Scilit]
- Guo, L.; Yin, M.; Cai, C.; Xie, Y.; Zou, Y. Optimal Decreased Torque Gain Control for Maximizing Wind Energy Extraction Under Varying Wind Speed. J. Mod. Power Syst. Clean Energy 2023, 11, 853–862. [Google Scholar] [CrossRef] [Scilit]
- Chen, Y.; Shi, Z.; Xu, B.; Shaheed, M.H. Optimal design of a scaled-up PRO system using swarm intelligence approach. Sci. China (Inf. Sci.) 2021, 64, 175–188. [Google Scholar]
- Sun, M.; Min, Y.; Xiong, X.; Chen, L.; Zhao, L.; Feng, Y.; Wang, B. Practical Realization of Optimal Auxiliary Frequency Control Strategy of Wind Turbine Generator. J. Mod. Power Syst. Clean Energy 2022, 10, 617–626. [Google Scholar] [CrossRef] [Scilit]
- Singh, K.A.; Chaudhary, A.; Chaudhary, K. Three-phase AC-DC Converter for Direct-drive PMSG-based Wind Energy Conversion System. J. Mod. Power Syst. Clean Energy 2023, 11, 589–598. [Google Scholar]
- Gu, W.; Chen, Z.; Li, Q.; Zou, Y. Torque Limit-based Inertial Control Method Based on Delayed Support for Primary Frequency Control of Wind Turbines. J. Mod. Power Syst. Clean Energy 2024, 12, 561–570. [Google Scholar] [CrossRef] [Scilit]
- Huang, B.; Song, K.; Jiang, S.; Zhao, Z.; Zhang, Z.; Li, C.; Sun, J. A Robust Salp Swarm Algorithm for Photovoltaic Maximum Power Point Tracking Under Partial Shading Conditions. Mathematics 2024, 12, 3971. [Google Scholar] [CrossRef] [Scilit]
- Wang, Y.; Chen, Z.; Wang, Y. A Fault Feature Extraction Method for Bearing Outer Rings Based on the Combined Application of WOA-VMD and MOMEDA. Mech. Electr. Eng. 2023, 40, 1655–1663. [Google Scholar]
- Wang, L.; Li, C.; Liu, J.; Li, C. Short-term Photovoltaic Power Prediction Based on GRO-SSA-LSTM. Sol. Energy J. 2025, 46, 401–409. [Google Scholar]
- Hu, R.; Qiao, J.; Li, Y.; Sun, Y.; Wang, B. Long-Term Wind Power Prediction Based on WOA-VMD-SSA-LSTM. Sol. Energy J. 2024, 45, 549–556. [Google Scholar]
- Lyu, X.; Jia, Y.; Dong, Z. Adaptive Frequency Responsive Control for Wind Farm Considering Wake Interaction. J. Mod. Power Syst. Clean Energy 2021, 9, 1066–1075. [Google Scholar] [CrossRef] [Scilit]
- Zhang, W.; Sheng, W.; Duan, Q.; Huang, H.; Yan, X. Automatic Generation Control with Virtual Synchronous Renewables. J. Mod. Power Syst. Clean Energy 2023, 11, 267–279. [Google Scholar] [CrossRef] [Scilit]
- Riquelme-Dominguez, J.M.; Gonzalez-Longatt, F.M.; Martinez, S. Decoupled Photovoltaic Power Ramp-rate Calculation Method for Perturb and Observe Algorithms. J. Mod. Power Syst. Clean Energy 2022, 10, 932–940. [Google Scholar] [CrossRef] [Scilit]
- Xi, J.; Geng, H.; Zou, X. Decoupling Scheme for Virtual Synchronous Generator Controlled Wind Farms Participating in Inertial Response. J. Mod. Power Syst. Clean Energy 2021, 9, 347–355. [Google Scholar] [CrossRef] [Scilit]
- Toodeji, H.; Aghaei, S. Domestic PV System with Feedback Linearization-based Control Strategy for Module-level MPPT under Partial Shading Condition. J. Mod. Power Syst. Clean Energy 2021, 9, 1530–1539. [Google Scholar] [CrossRef] [Scilit]
- Wei, Z.; Yu, S.; Sun, G.; Sun, Y.; Yuan, Y.; Wang, D. The Concept and Development of Virtual Power Plant. Autom. Electr. Power Syst. 2013, 37, 1–9. [Google Scholar]
- Kumar, A.; Kumar, P. Power Quality Improvement for Grid-connected PV System Based on Distribution Static Compensator with Fuzzy Logic Controller and UVT/ADALINE-based Least Mean Square Controller. J. Mod. Power Syst. Clean Energy 2021, 9, 1289–1299. [Google Scholar] [CrossRef] [Scilit]
- Bakhtiari, F.; Nazarzadeh, J. Optimal Estimation and Tracking Control for Variable-speed Wind Turbine with PMSG. J. Mod. Power Syst. Clean Energy 2020, 8, 159–167. [Google Scholar] [CrossRef] [Scilit]
- Liu, S. Research on the Mismatch Phenomenon of Photovoltaic Arrays. Master’s Thesis, Shantou University, Shantou, China, 2008. [Google Scholar]
- Kumar, P.; Date, A.; Shabani, B. Towards self-water-sufficient renewable hydrogen power supply systems by utilizing electrolyser and fuel cell waste heat. Int. J. Hydrogen Energy 2025, 137, 380–396. [Google Scholar] [CrossRef] [Scilit]



Disclaimer/Publisher’s Note: The statements, opinions and data contained in all publications are solely those of the individual author(s) and contributor(s) and not of MDPI and/or the editor(s). MDPI and/or the editor(s) disclaim responsibility for any injury to people or property resulting from any ideas, methods, instructions or products referred to in the content. |
© 2026 by the authors. Licensee MDPI, Basel, Switzerland. This article is an open access article distributed under the terms and conditions of the Creative Commons Attribution (CC BY) license.