


Abstract
The study proposes a methodological integration of machine vision and image processing based on color-based object detection. The primary goal of the study is to use the color vision method to simplify the process of transforming real objects into 3D digital twins for application in Sustainable Agriculture 4.0. The experiment solves several related problems: (1) Color analysis and methodology for quantifying the color representation of a 3D model. Representation quality was determined using colorimetric methods with sRGB and L*a*b* models in relation to the D65 standard. Colors with accurate color values on the object surface and in the 3D model were identified. (2) The process of capturing and creating digital twins using the SfM method is time-consuming and requires manual work. The study solves this problem by partially automating the entire process. The proposed DSLR system with an automated method for capturing, storing, and sorting data significantly accelerates the entire process. (3) To create a digital color scale, it is necessary to define the color values of 3D digital twins. A color segmentation procedure based on points on the surface of a 3D model is proposed. These color values form a basic color form corresponding to the color value changes in the coloring process of a real object. The proposed procedure uniquely integrates methodologies and has potential for use in Sustainable Agriculture 4.0. The proposed colorimetric method quantifies representation quality and could be deployed in other 3D model digitization and automation processes, especially in image processing and computer vision.
1. Introduction
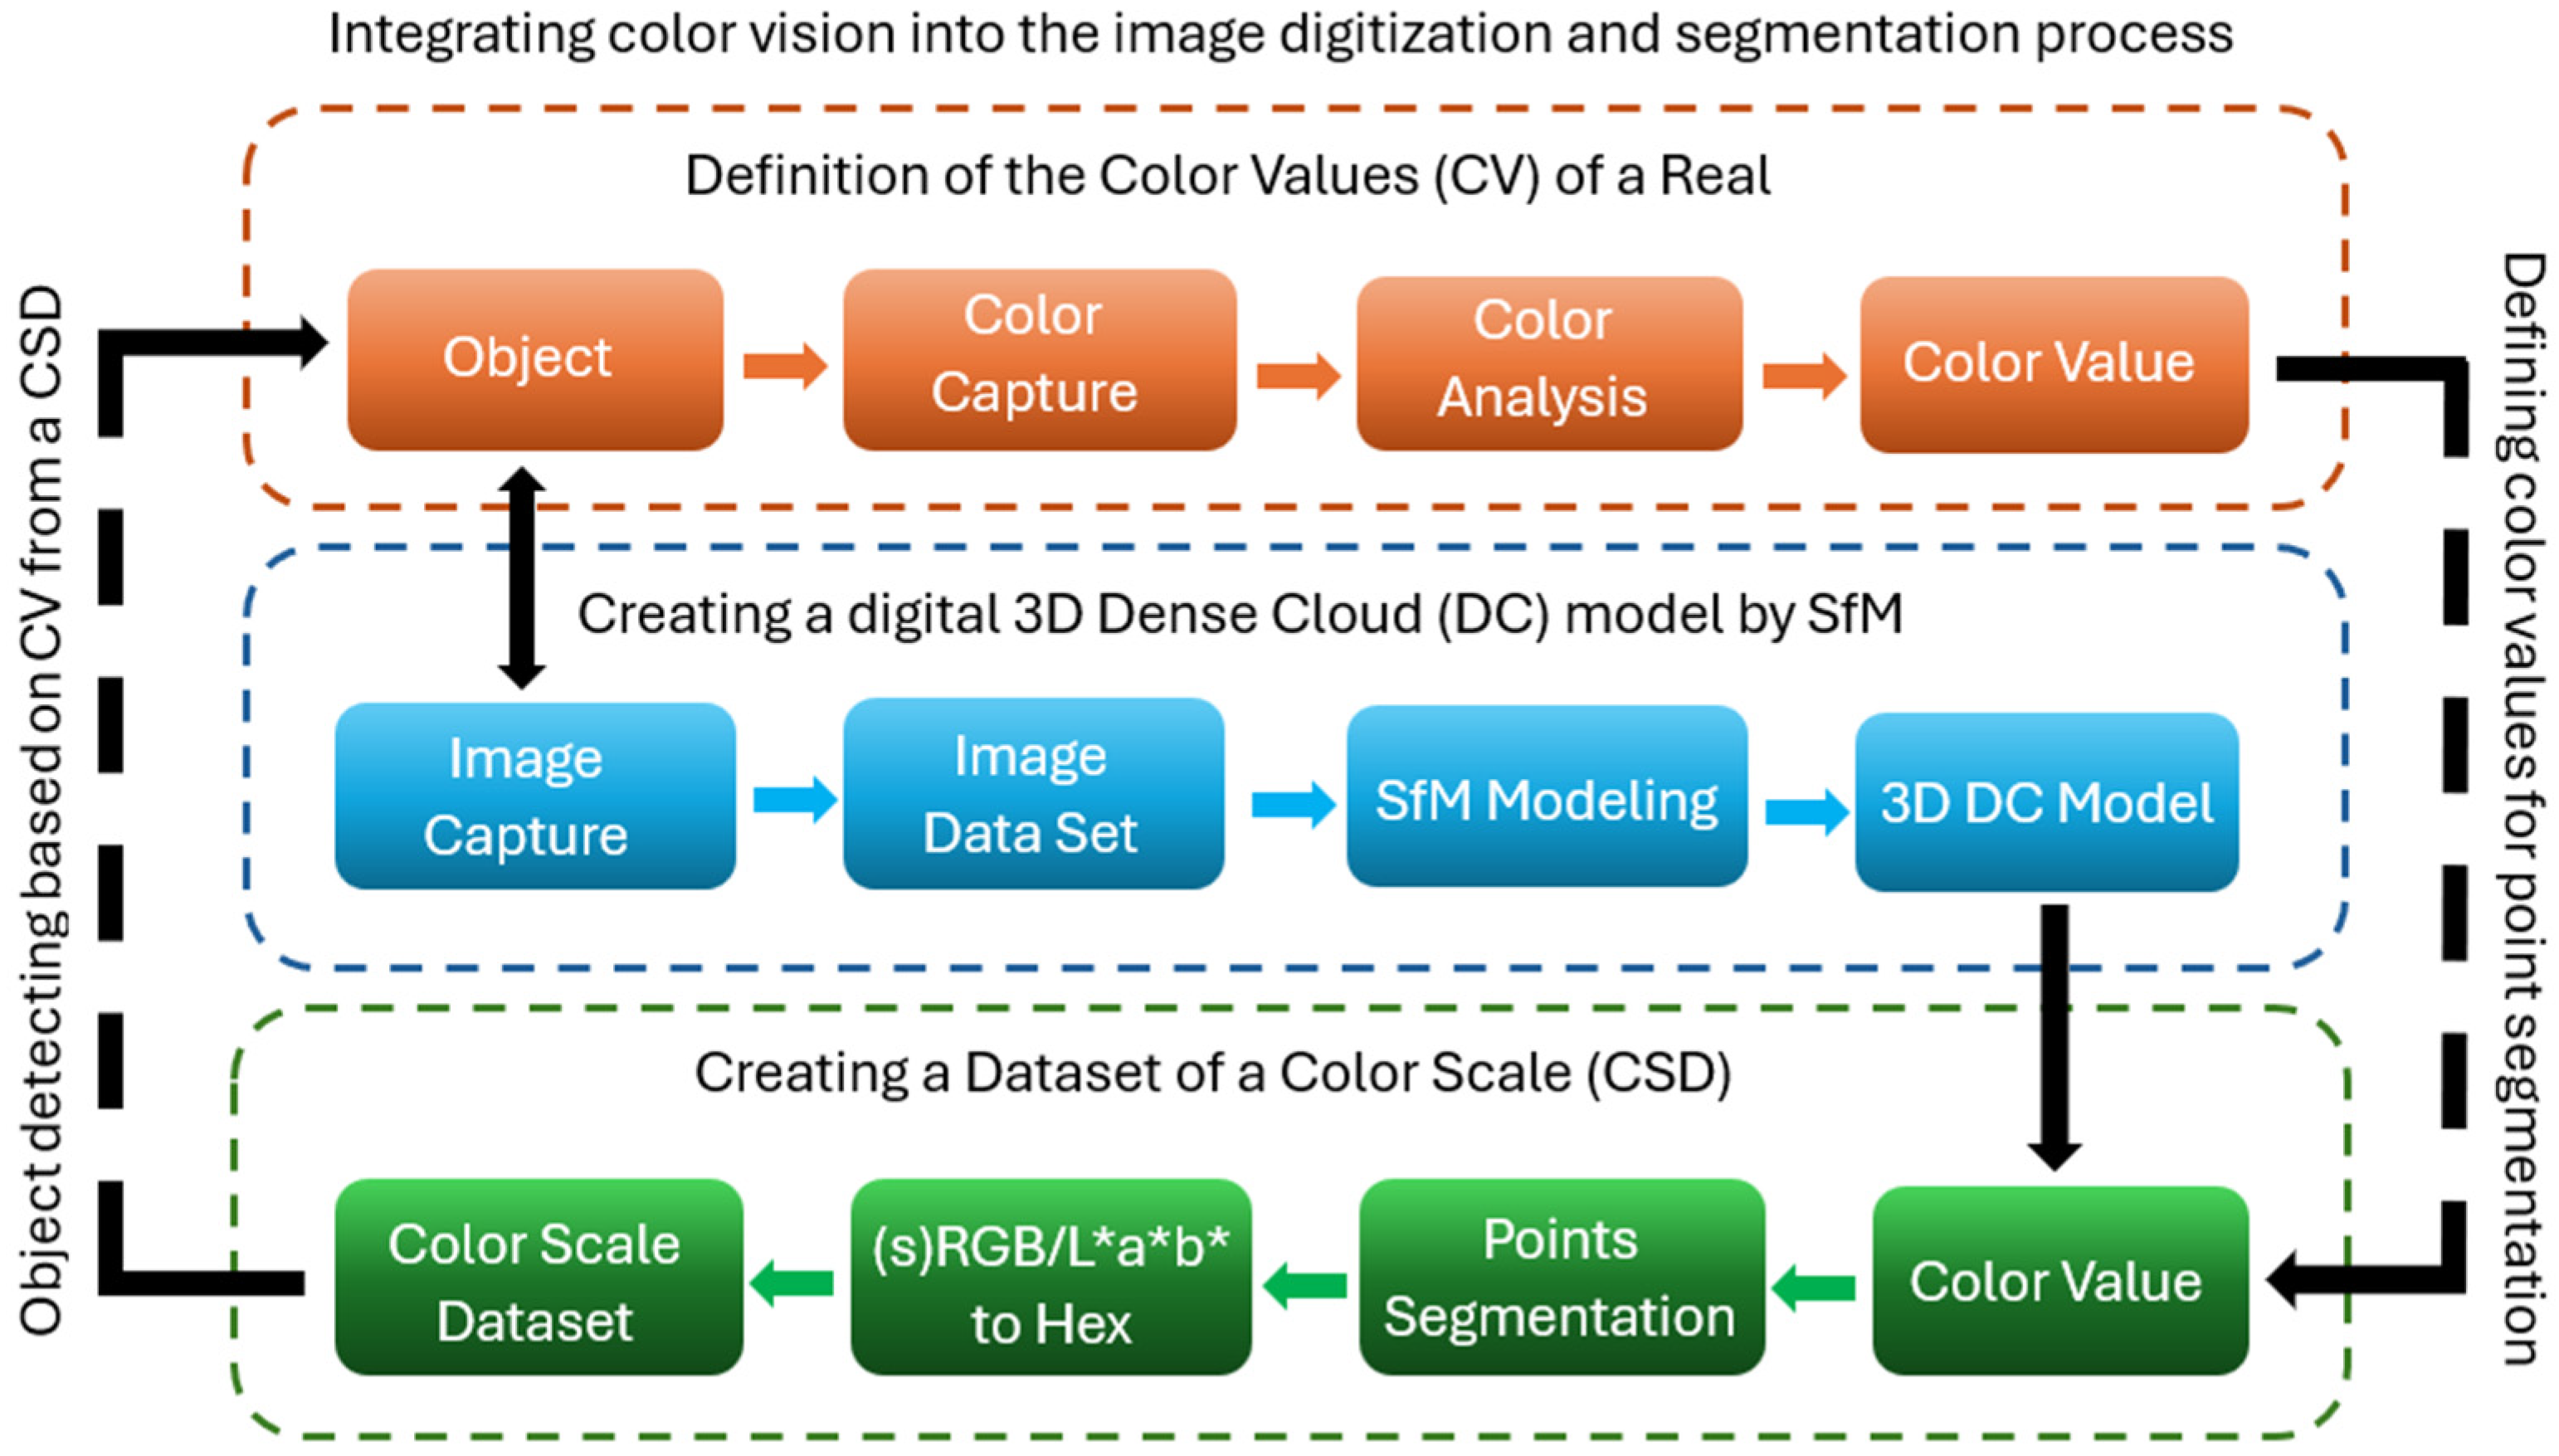
The study addresses a gap in color quality representation when applying color vision in optimization, automation, and digitalization processes in modern Agriculture 4.0. In line with the global nature of industrial processing, global climate change, nature conservation, and international food trade, this issue is addressed both at the global and regional levels [1,2]. In agriculture, great emphasis is placed on the method of cultivation, harvesting, yield, and processing of crops [3]. An important factor in this is the accurate and precise color representation of leaves and fruits for health and development monitoring. At this stage, it is necessary to detect pests or cultivation errors early that can damage and reduce crop yields [4]. Accurate color representation is also necessary during harvest when separating ripe, healthy crops, which are often required for further processing or sale [5,6,7]. Sustainable Agriculture 4.0 can do all this today with a greater or lesser degree of automation and robotization [3,8]. Agricultural fields and greenhouses are routinely monitored by drones; greenhouse environmental control and crop growth are remotely managed, and harvesting and post-processing processes are partially or fully automated. The creation of digital twins to visualize or simulate processes is also an integral part of modern agriculture [3,9]. New machine learning and deep learning methods are constantly being developed for image analysis and segmentation. Convolutional neural networks (CNN) and R-CNN with masking are used for fruit detection [10,11,12]. The YOLO (You Only Look Once) method, based on deep learning, detects fruits in real time [13,14,15]. Object detection methods are combined with other methods and are constantly being developed to improve automation processes in modern agriculture [16,17,18]. However, the field of color vision (CV) and tools to validate the quality of color representation are slightly underdeveloped areas of research; some studies consider the application of color models in research and the potential of color vision to improve image segmentation results [19,20,21,22,23,24]. Other experiments consider only a complex model or calibration of the color imaging device and post-production image processing [19,25,26,27]. Nevertheless, the practical use of machine learning methods is increasingly being used in color vision methods and research applications [28,29,30]. This study focuses on the comparative analysis of the color values of real objects and their digital reproductions in the form of 3D digital twins generated using photogrammetry. It proposes improvements to segmentation methods that could help monitor maturation or detect plant health. To improve the effectiveness of segmentation methods, we propose using color models and precisely defining color values within the defined color scale range. Based on the information about the points forming the 3D Dense Cloud (DC) model, we propose a unique methodological integration of colorimetry methods. The proposed methodologies and procedures offer the potential to generate machine learning datasets based on color values and the desired color scale range. By integrating these procedures, plant or crop detection will be more accurate. Image processing based on color values and the creation of 3D models using the photogrammetric method SfM (Structure from Motion) are described in Figure 1. Creating a basic color scale dataset (CSD) required the following steps:
- Color analysis and determination of color values of objects.
- Image capture and processing into a 3D Dense Cloud model.
- Segmentation of points by color values and creation of a basic color dataset.
Figure 1.
The process of integrating color vision and color models into the creation of 3D digital twins using image segmentation methods based on color values.
2. Materials and Methods
This study focuses on color analysis and color vision issues as an integral part of computer vision and accurate color representation in 3D models. The creation and use of digital twins is increasing in many fields of Industry 4.0. In this experiment, the multi-frame terrestrial photogrammetry method SfM was applied [31,32,33,34]. Color analysis was performed in several image processing steps while creating digital twins of chili pepper fruits. The individual devices, materials, and methods of the procedures are described in the following sections.
2.1. Objects for Creating 3D Digital Twins
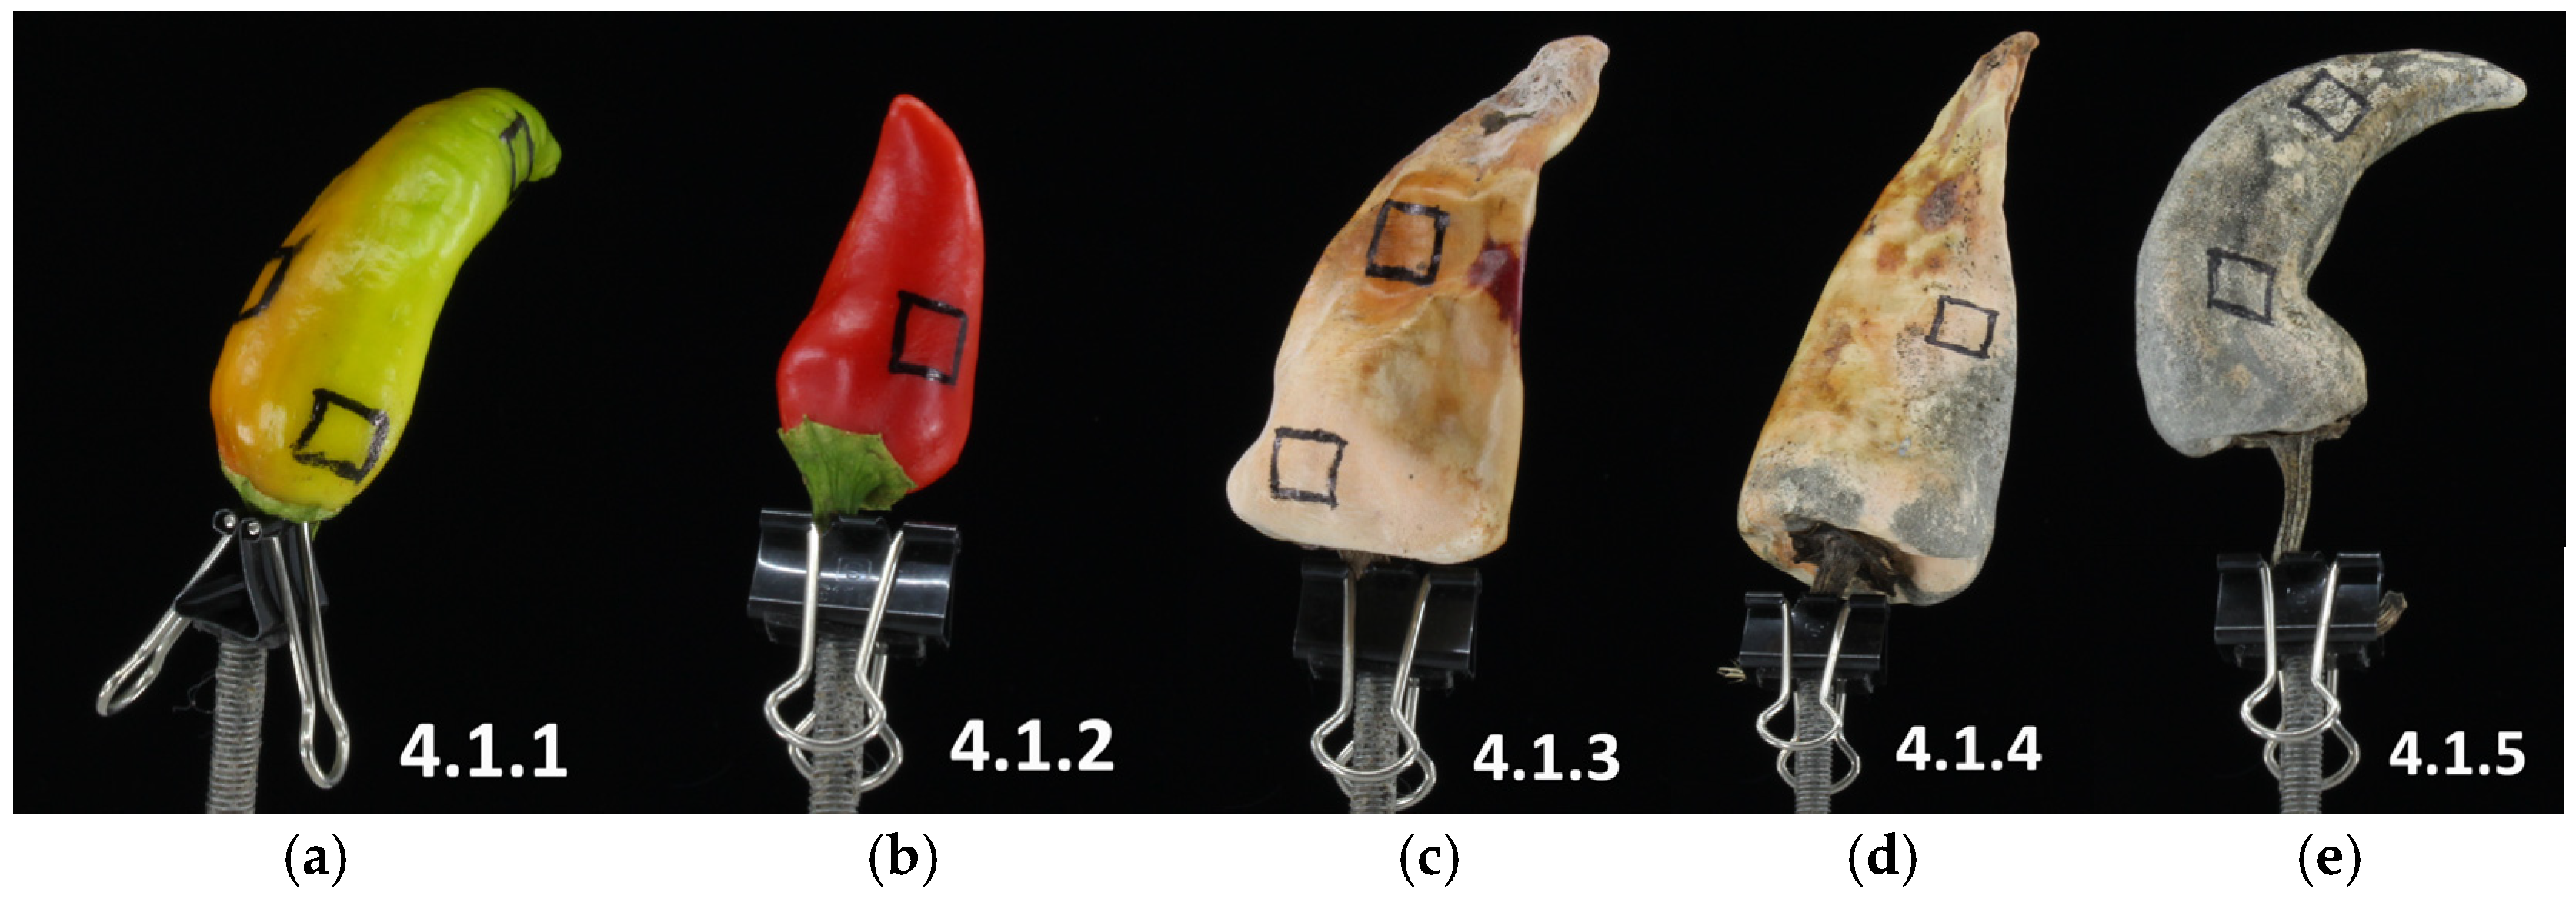
For this experiment, chili plants (Capsicum annuum vr. Bulgarsky Perets) were grown in pots at the Institute for Sustainable Agro-ecosystem Services, University of Tokyo, Japan. Chili fruits of different shapes and colors were grown and selected just before and after physiological maturity, in other words, at different stages of fruit ripening. Their color was measured and defined using the ColorCatch Nano Colorimeter [34]. The selected objects for creating 3D digital twins are shown in Figure 2.
Figure 2.
Objects intended for creating 3D digital twins: (a) chili 4.1.1; (b) chili 4.1.2; (c) chili 4.1.3; (d) chili 4.1.4; (e) chili 4.1.5.
As shown in Figure 2, the objects selected for digitization have different properties. These differences can be observed in the objects’ color, size, and structure. Object 4.1.1: Figure 2a shows an unripe fruit, the color of which can be described as green. Object 4.1.2: Figure 2b shows a ripe chili pepper fruit. Figure 2c–e shows chili pepper fruits with shrunken structure, discoloration and multiple diseases, characteristic of over-ripe fruits.
At the same time, black frames measuring 5 × 5 mm are marked on the chili pepper fruits with the numbers 4.1.1, 4.1.2, 4.1.3, 4.1.4, and 4.1.5. On each reference fruit, multiple areas are marked where a color shade change was visually visible. These marked areas are used for metric color value measurement by the ColorCatch Nano from Gamin, s.r.o., Czech Republic color sensor. The measured color values are subsequently used for scaling and identifying the color values of 3D digital object models.
2.2. Analysis and Definition of Object Colors
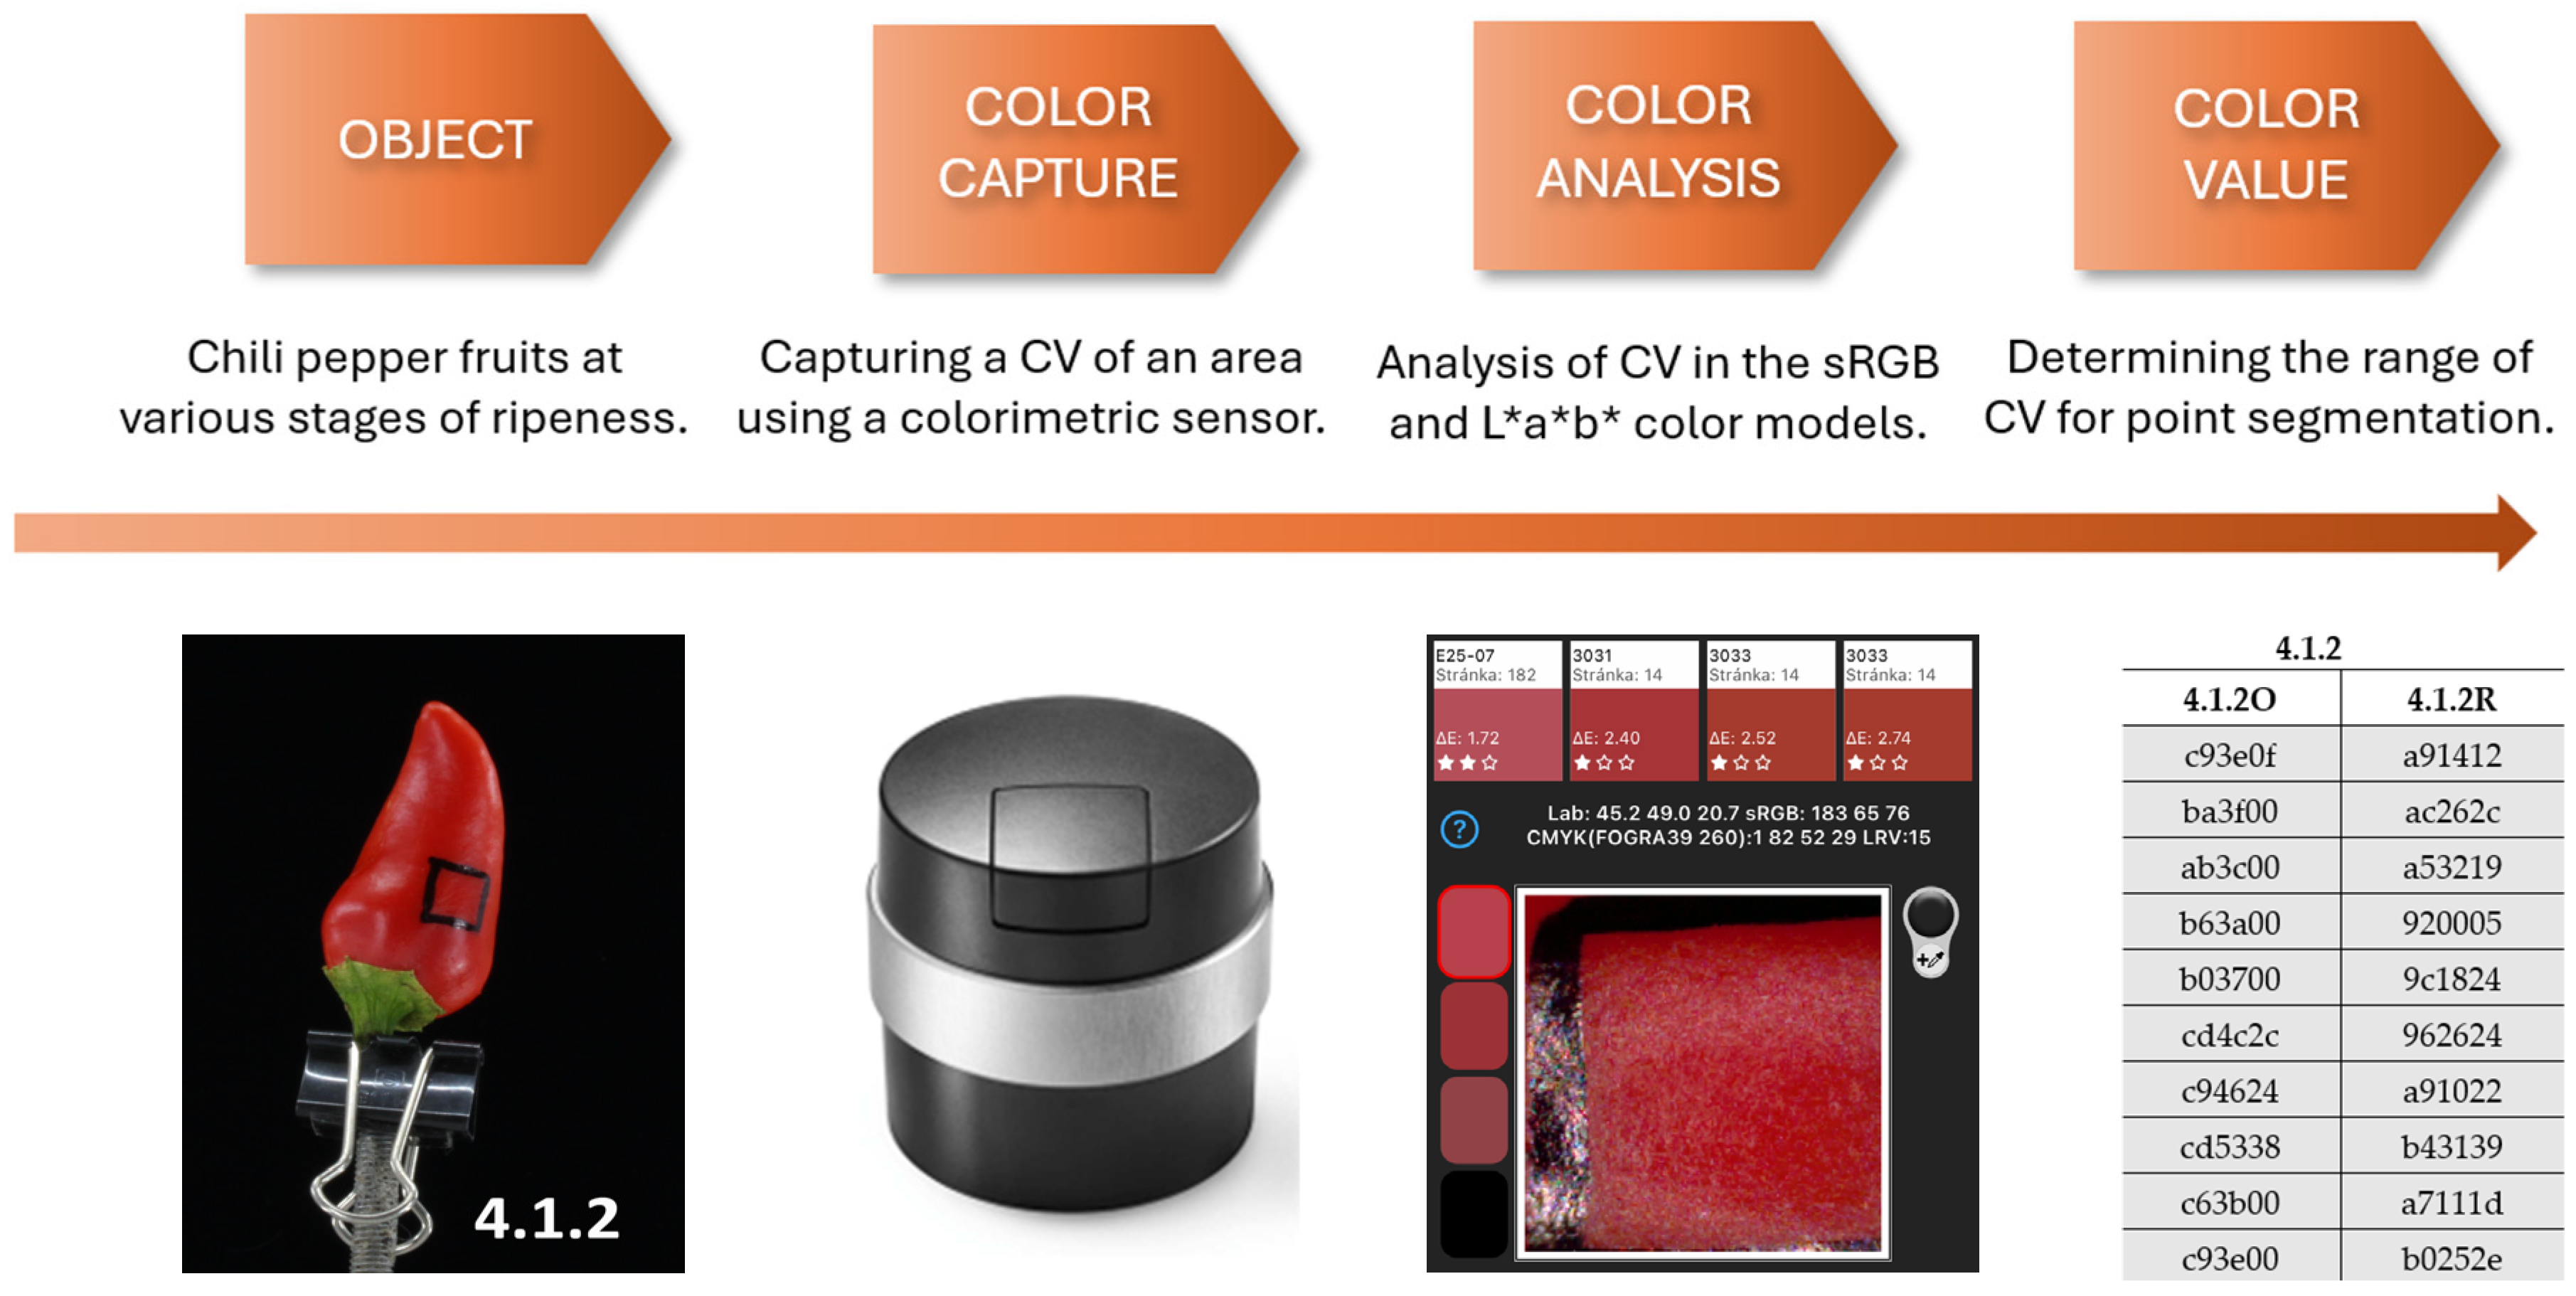
Reference values of color tones were recorded at the marked locations on objects 4.1.1, 4.1.2, 4.1.3, 4.1.4, and 4.1.5. These values were recorded with the ColorCatch Nano colorimeter to compare color values in the created 3D models of objects [34]. The values were measured in the L*a*b*, sRGB, and CMYK color models in the FOGRA color chart included with the colorimeter. For this experiment, only the sRGB model, or RGB, which is based on the color spectrum of the light spectrum, was used. The basic colors of the RGB model are the red (R), green (G), and blue (B) components of the light spectrum. Figure 3 shows object number 4.1.2, the process of capturing color values in the marked detailed area of the object, and the reference color values recorded by the ColorCatch Nano colorimeter in the marked areas of the object.
Figure 3.
The process of sensing, analyzing, and determining the color values of ripe chili pepper fruits using a colorimetric sensor.
Figure 3 illustrates how the reference color values for the segmented area of object 4.1.2 were determined. Figure 3 also depicts the sensing device, which features a sensor with a light source calibrated to standardized white light (W) before each measurement. The process of sensing the color values was identical for the other chili pepper fruit areas.
An extensive set of color values was created based on the measured color values. The selected reference values were transformed from the RGB color model to Hex values. The hexadecimal color format is given as a six-digit number. This hexadecimal number contains the digits 0 to 9. The lowest number, #000000, corresponds to black. The highest value, #FFFFFF, corresponds to pure white. The hexadecimal color values created reference color scales for individual objects.
The following section describes the transformation of color values in relation to the color gamut and standardized white light values corresponding to the daylight standard. In this type of ambient lighting, the color values on the object surface were captured based on the calibration of the measuring device’s sensor.
2.3. Color Models in the Image Digitization Process
A colorimeter was used to measure the colors of chili peppers accurately. The color measurements were performed in the RGB color model or the sRGB and L*a*b* gamuts. Figure 3 shows the individual color models. It is important to mention that the L*a*b* color model works in the entire color spectrum of the CIE 1978 trichromatic diagram, which is derived from the CIE XYZ (CIE 1931) color model. At the same time, the Color Checker Classic color scale from X-Rite s.r.o. Vyškov, Czech Republic was used for color standardization.
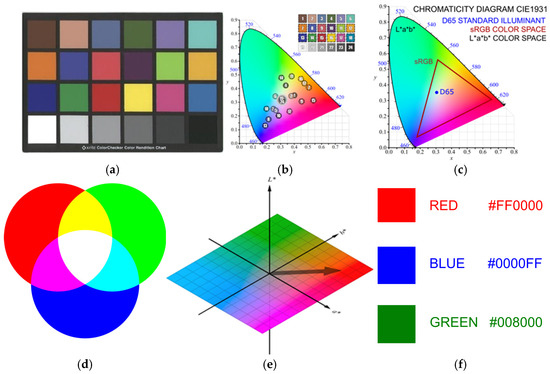
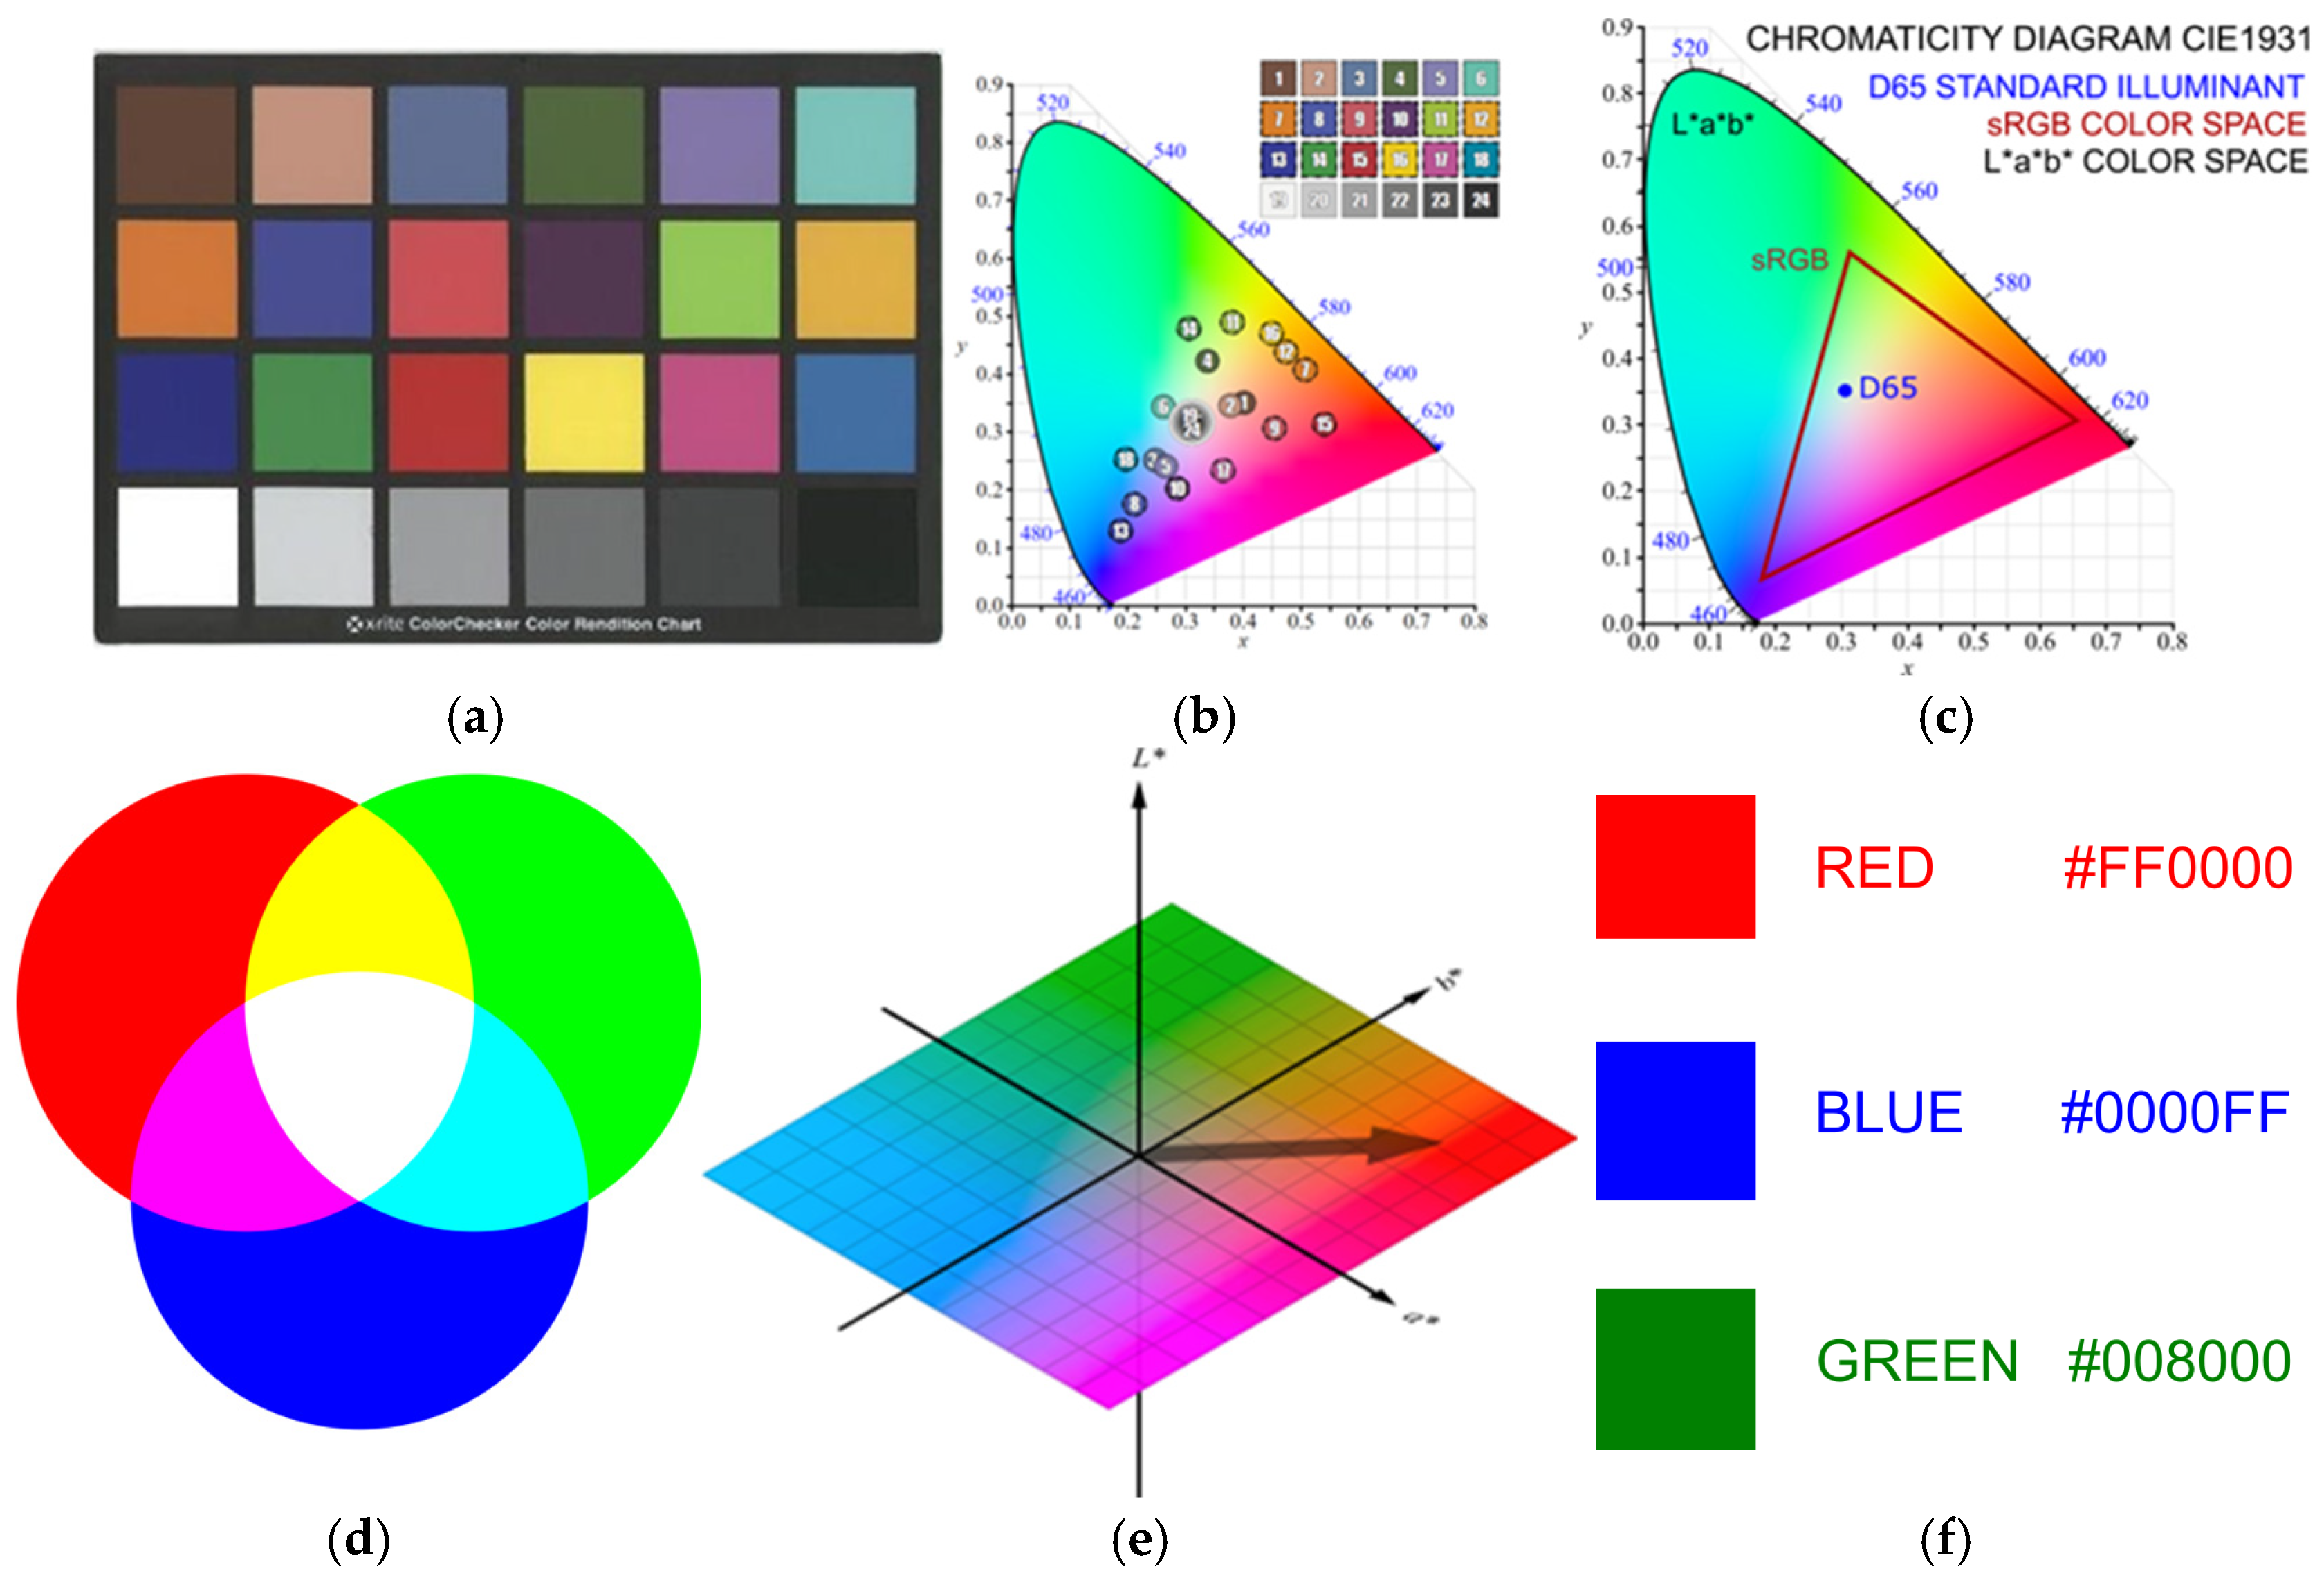
Figure 4 also shows the notation of the primary colors of the RGB model (red, green, blue) in hexadecimal format. Figure 4a shows the standardized range of primary colors, including white (W). Figure 4b shows the individual positions of the standardized colors in the CIE Chromaticity Diagram (1931), on which the CIE XYZ/CIE LAB (1978) for many Color Management Systems (CMS) is based [34,35].
Figure 4.
Color models and spaces: (a) Standardized color scale Color Checker Classic; (b) Position of standardized colors in the CIE 1931 trichromatic diagram; (c) CIE 1931 trichromatic diagram with the sRGB and L*a*b* gamuts and standardized light D65 marked; (d) RGB color model; (e) L*a*b* color model; (f) Transcription of primary colors of the RGB color model into hexadecimal numerical values.
As mentioned, a colorimetric device for measuring the color of a physical object works with the sRGB and L*a*b* gamuts. The sRGB color space is applied to most standard digital imaging and imaging devices. The range of this gamut in the trichrome diagram area is shown in Figure 4c. It is clear from the figure that the L*a*b* gamut represents the full range of the chromaticity diagram. The range of the L*a*b* gamut does not consider the type of digital device or its color range. This flexible use and application are important in the overall digitization process, especially when interpreting digital output in an augmented and digital reality (AR/VR) environment. The chromaticity diagram lists the standardized daylight D65 (the illuminant white point for the sRGB gamut). By converting the daylight standard (W) to the D50 standard, we obtain the expression of the white point in the CIE XYZ gamut [35,36].
Figure 4d,f visualizes the RGB and L*a*b* color models. Figure 4f shows the transformation of the RGB model into the hexadecimal system, which is particularly suitable for entering color values for image processing across graphics software (SW) [37]. Hexadecimal color representation was also used in this study to create color scales. The statements are considered for the components of the L*a*b* color model, where and are the white (W) tristimulus values of a perfectly reflecting diffuser under CIE D65 illumination, defined by x = 0.3127 and y = 0.3290 in the CIE chromaticity diagram [38]. Conversion between XYZ color coordinates with respect to different white (W) points is performed. The ICC specification recommends a linear chromatic adaptation based on the Bradford model to convert between D65 XYZ coordinates and D50-related values. This was implemented in the Java API. Complete mapping between gamut colors, sRGB, and D50 coordinates was achieved by performing a linear transformation using a matrix. The matrix defines the chromatic adaptation transformation. When applying and implementing the transformation using the to CIEXYZ() and from CIEXYZ() methods (Java’s default sRGB Color Space class), a gamma correction was required between the linear RGB components and the actual nonlinear sRGB values (R’, G’, B’) [37].
The Color Catch Nano device has a measuring range of 0.36–8 mm, automatic detection of 5 dominant colors, and a 45°/0° measurement geometry [33]. The CCD camera sensors have a resolution of 224 × 224 (px). The scanning device has an integrated calibration system and works with a standardized daylight source of 9 × D65 LEDs. This device reliably measures color values at 50.0000 (px) on smooth, porous, and structured surfaces. During scanning, all minor colors caused by surface contamination or shadows are automatically removed, and the system automatically detects 5 dominant colors with a color difference ∆E = 0.3. The CIE XYZ gamut is used to calculate the ∆E parameter, and this parameter can be measured by colorimetry. This value represents the difference in color perception. For professional graphic design work, an ∆E value ≤ 2 is sufficient. The parameter ∆E ≤ 1 is no longer observable by human vision.
The sensor properties of the device and the calibration according to the D65 standard proved to be sufficient for this study. In marked areas of 5 × 5 mm on the chili fruit, 10 color values were measured, which defined the basic color range for creating a color scale. The defined color values were then segmented in the marked area according to the color values in a realistic color 3D Dense Cloud model. The procedure and methodology for creating the 3D models are described in the following sections.
2.4. 3D Reconstruction of an Object by the SfM Photogrammetry Method
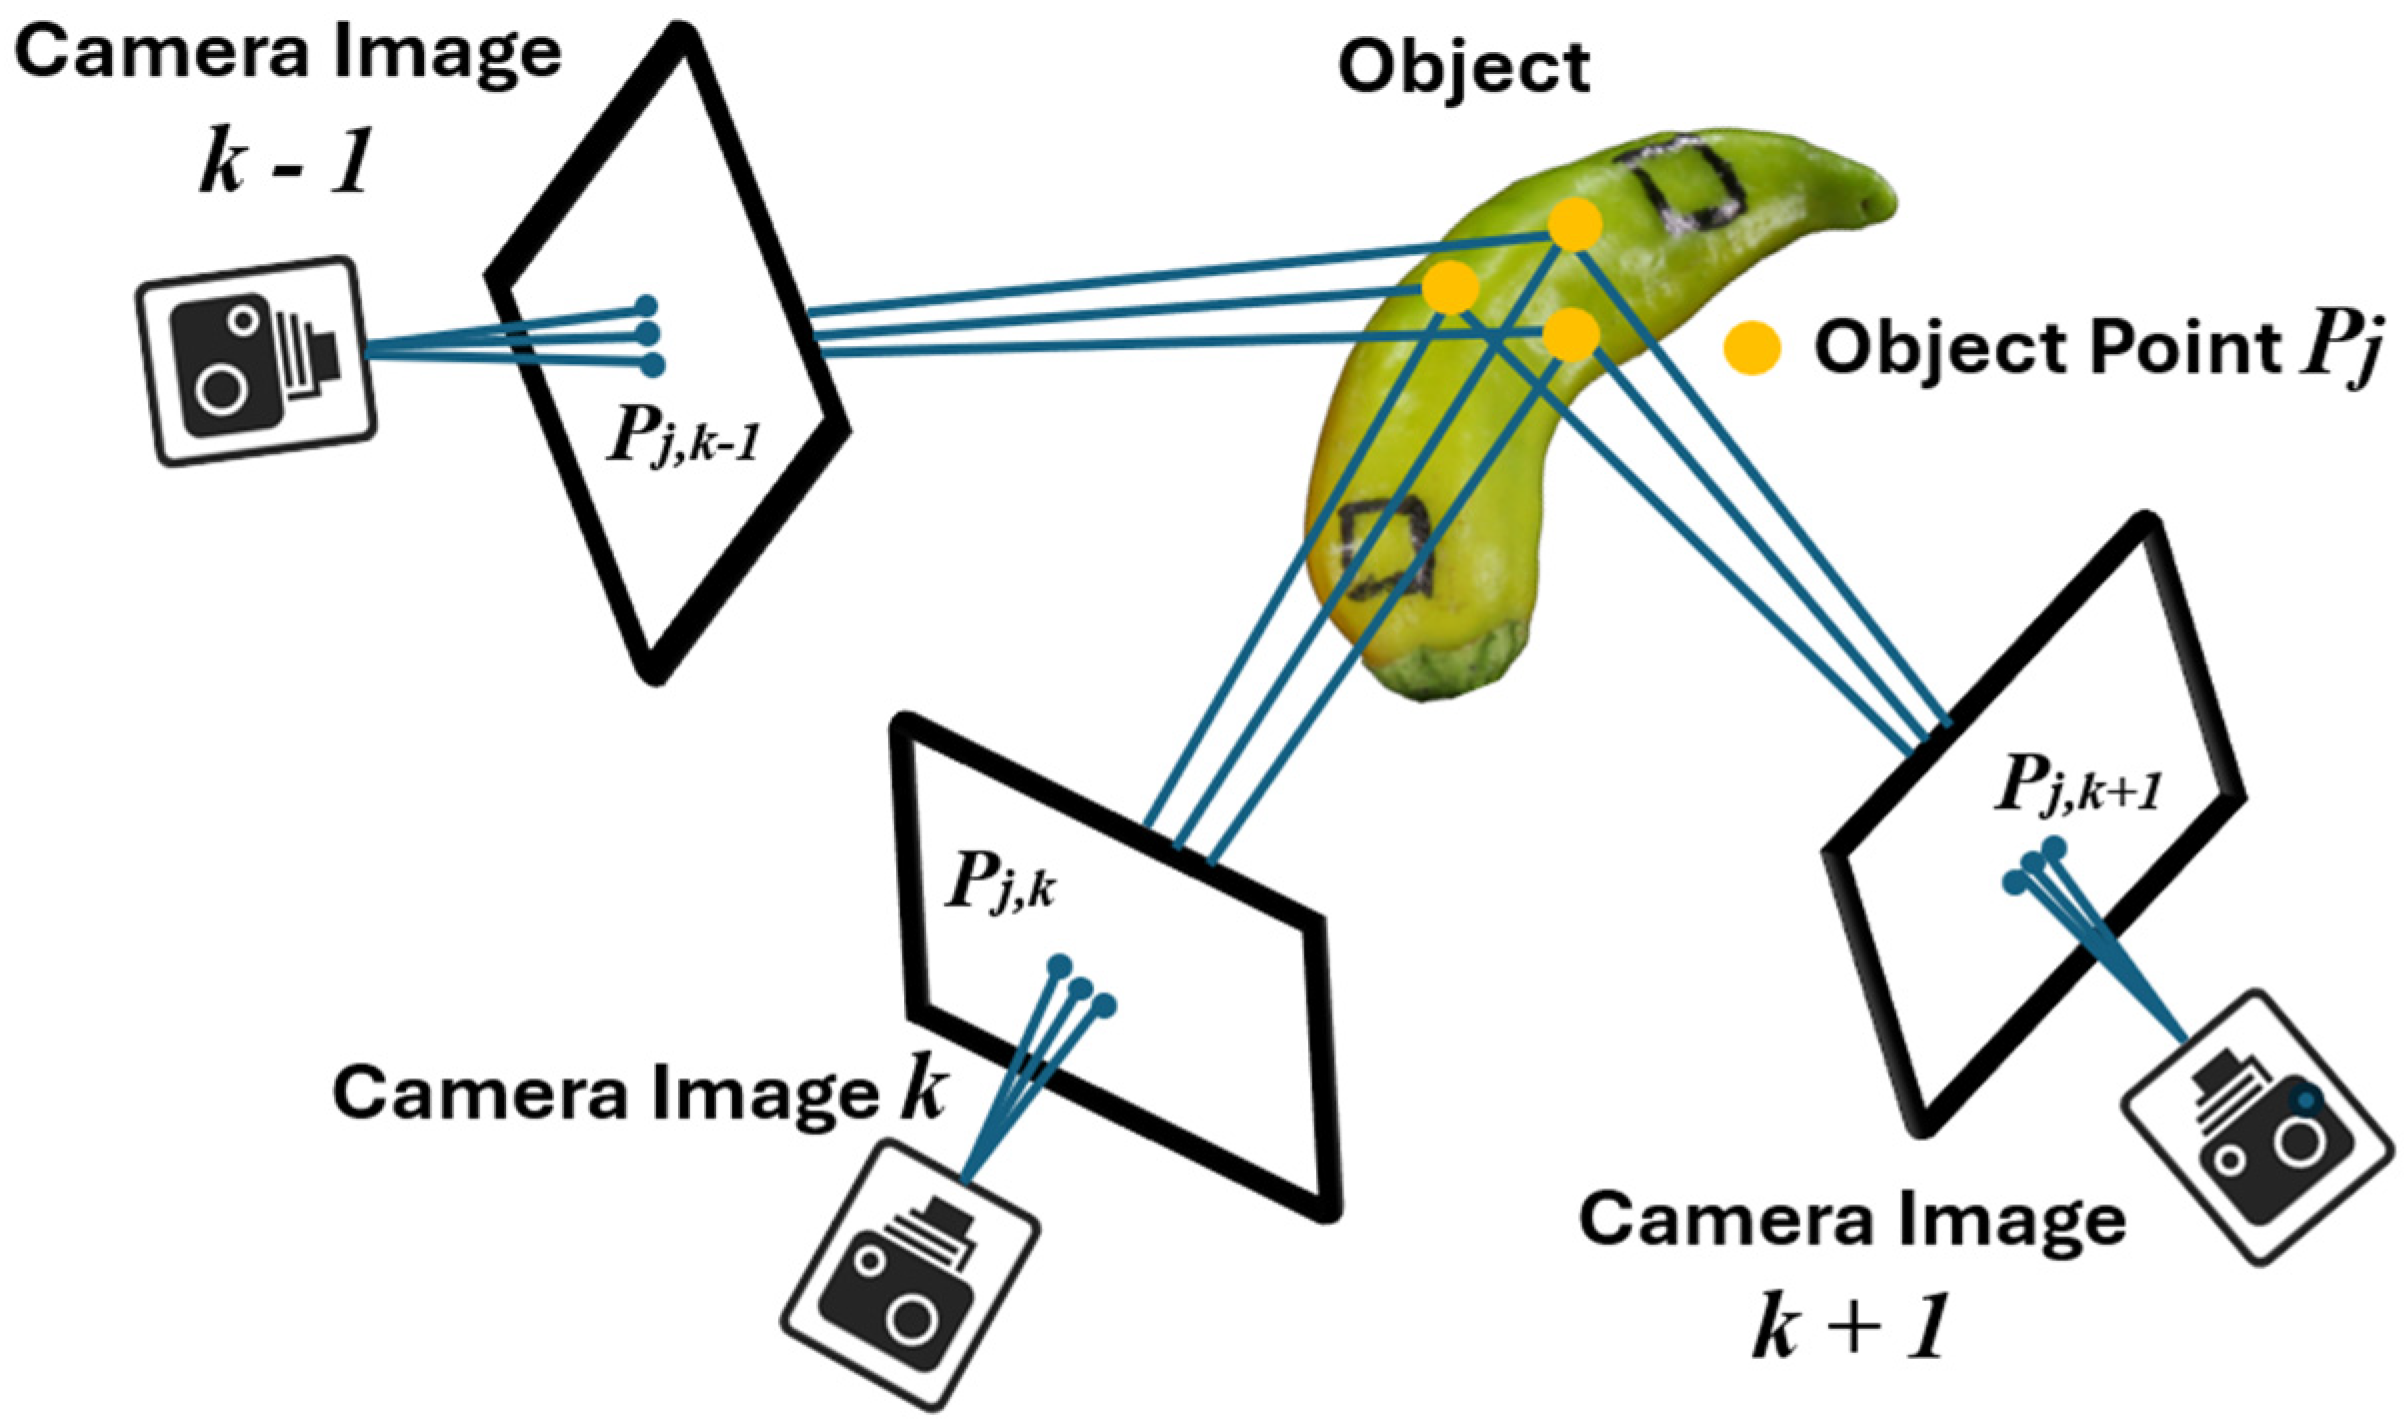
The SfM (Structure from Motion) photogrammetry method was used to create realistic 3D digital twins of objects. This method is widely used for the creation of realistic objects and scenes. In modern Agriculture 4.0, it is significantly applied within the UAV (Unmanned Aerial Vehicle) scanning framework [39,40,41]. In the case of terrestrial scanning, it also has its place as a terrestrial multi-image method [42,43,44]. The principle of the SfM photogrammetric method is generally defined as:
where is Direct Linear Transformation Parameters (DLTP). Coefficients to are functions of exterior landmarks and interior landmarks. The initial values of the external and internal orientation elements are unnecessary for the calculation. The DLT equation can be used for the photogrammetry of consumer-class digital cameras [45].
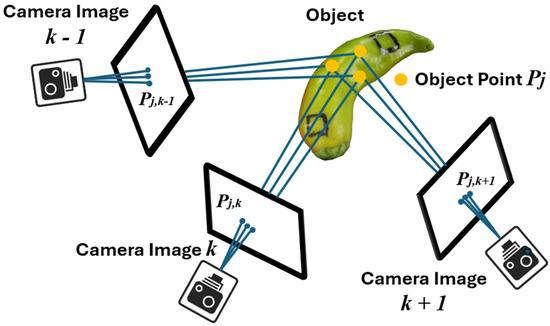
This study used studio equipment and a DSLR camera setup to capture the object. 3Dobject models were created using the professional graphics software (SW) Agisoft Metashape from G4D, s.r.o., Czech Republic [46]. Figure 5 shows the creation of a 3D model using the SfM method.
Figure 5.
The basic visualizations of the Structure from Motion (SfM) method.
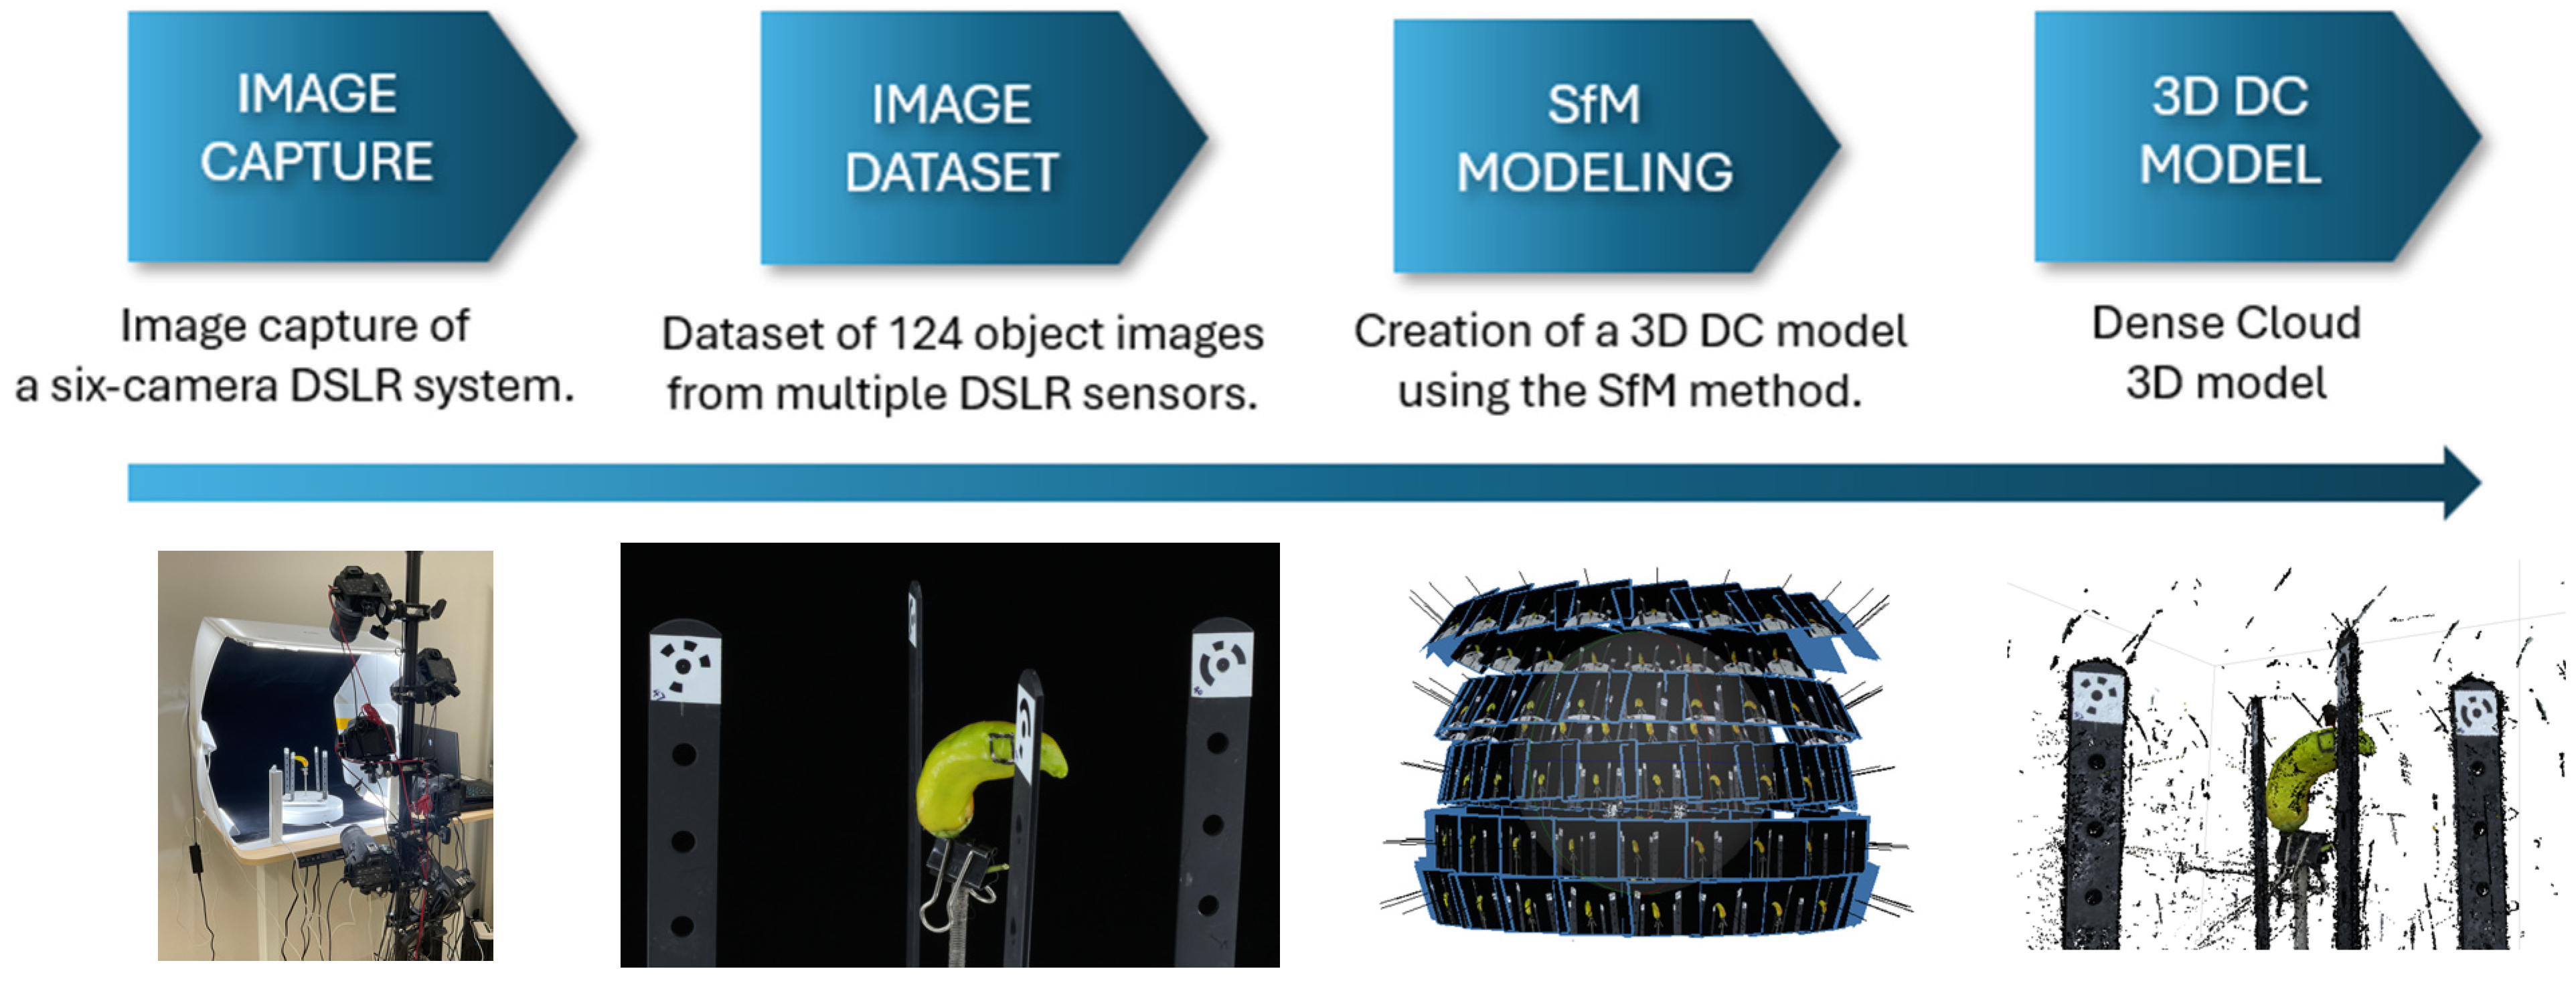
Figure 6 visualizes the process of creating realistic 3D digital twins of object 4.1.1, unripe chili pepper fruits. Realistic 3D digital reconstructions of objects were performed using a partially automated SfM photogrammetric method. Objects were captured by a system of 6 Canon EOS 100D Kiss X7 DSLR cameras with a resolution of 5184 × 3456 pixels and lens-type EF-S 18–55 mm from Canon, Japan. On a 360° rotating base, the DSLR camera system captured 124 images. The last image capture was performed just before the 360° rotation was completed. The vertical spacing between the DSLR cameras was set to approximately 25 cm. The percentage of image overlap was not measured because it had a minor influence on the 3D modeling process. The camera system was 0.5 m from the object, with a focal length of 45 mm and an exposure time of 1/15 s. White balance (W) was manually set. This setting applies to all series of scanned objects. For the digital 3D reconstruction of a single object, 124 images from 6 series were captured with a DSLR camera system. All images were captured in JPEG format with 24-bit depth and sRGB color space. The photo studio with a black background for digitizing the object was supplemented with 4 LED D65 lamps. This setup simulated the initial conditions for measuring the object’s color values with a colorimeter.
Figure 6.
The process of capturing an object and creating a 3D model using the SfM photogrammetric method.
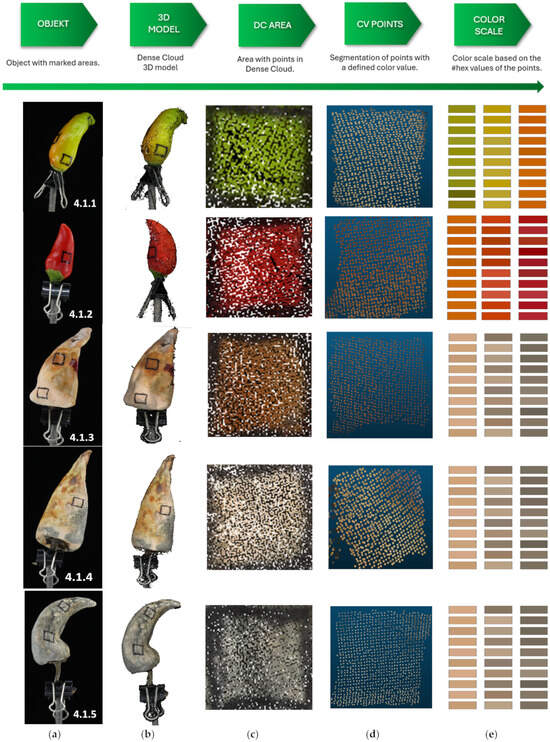
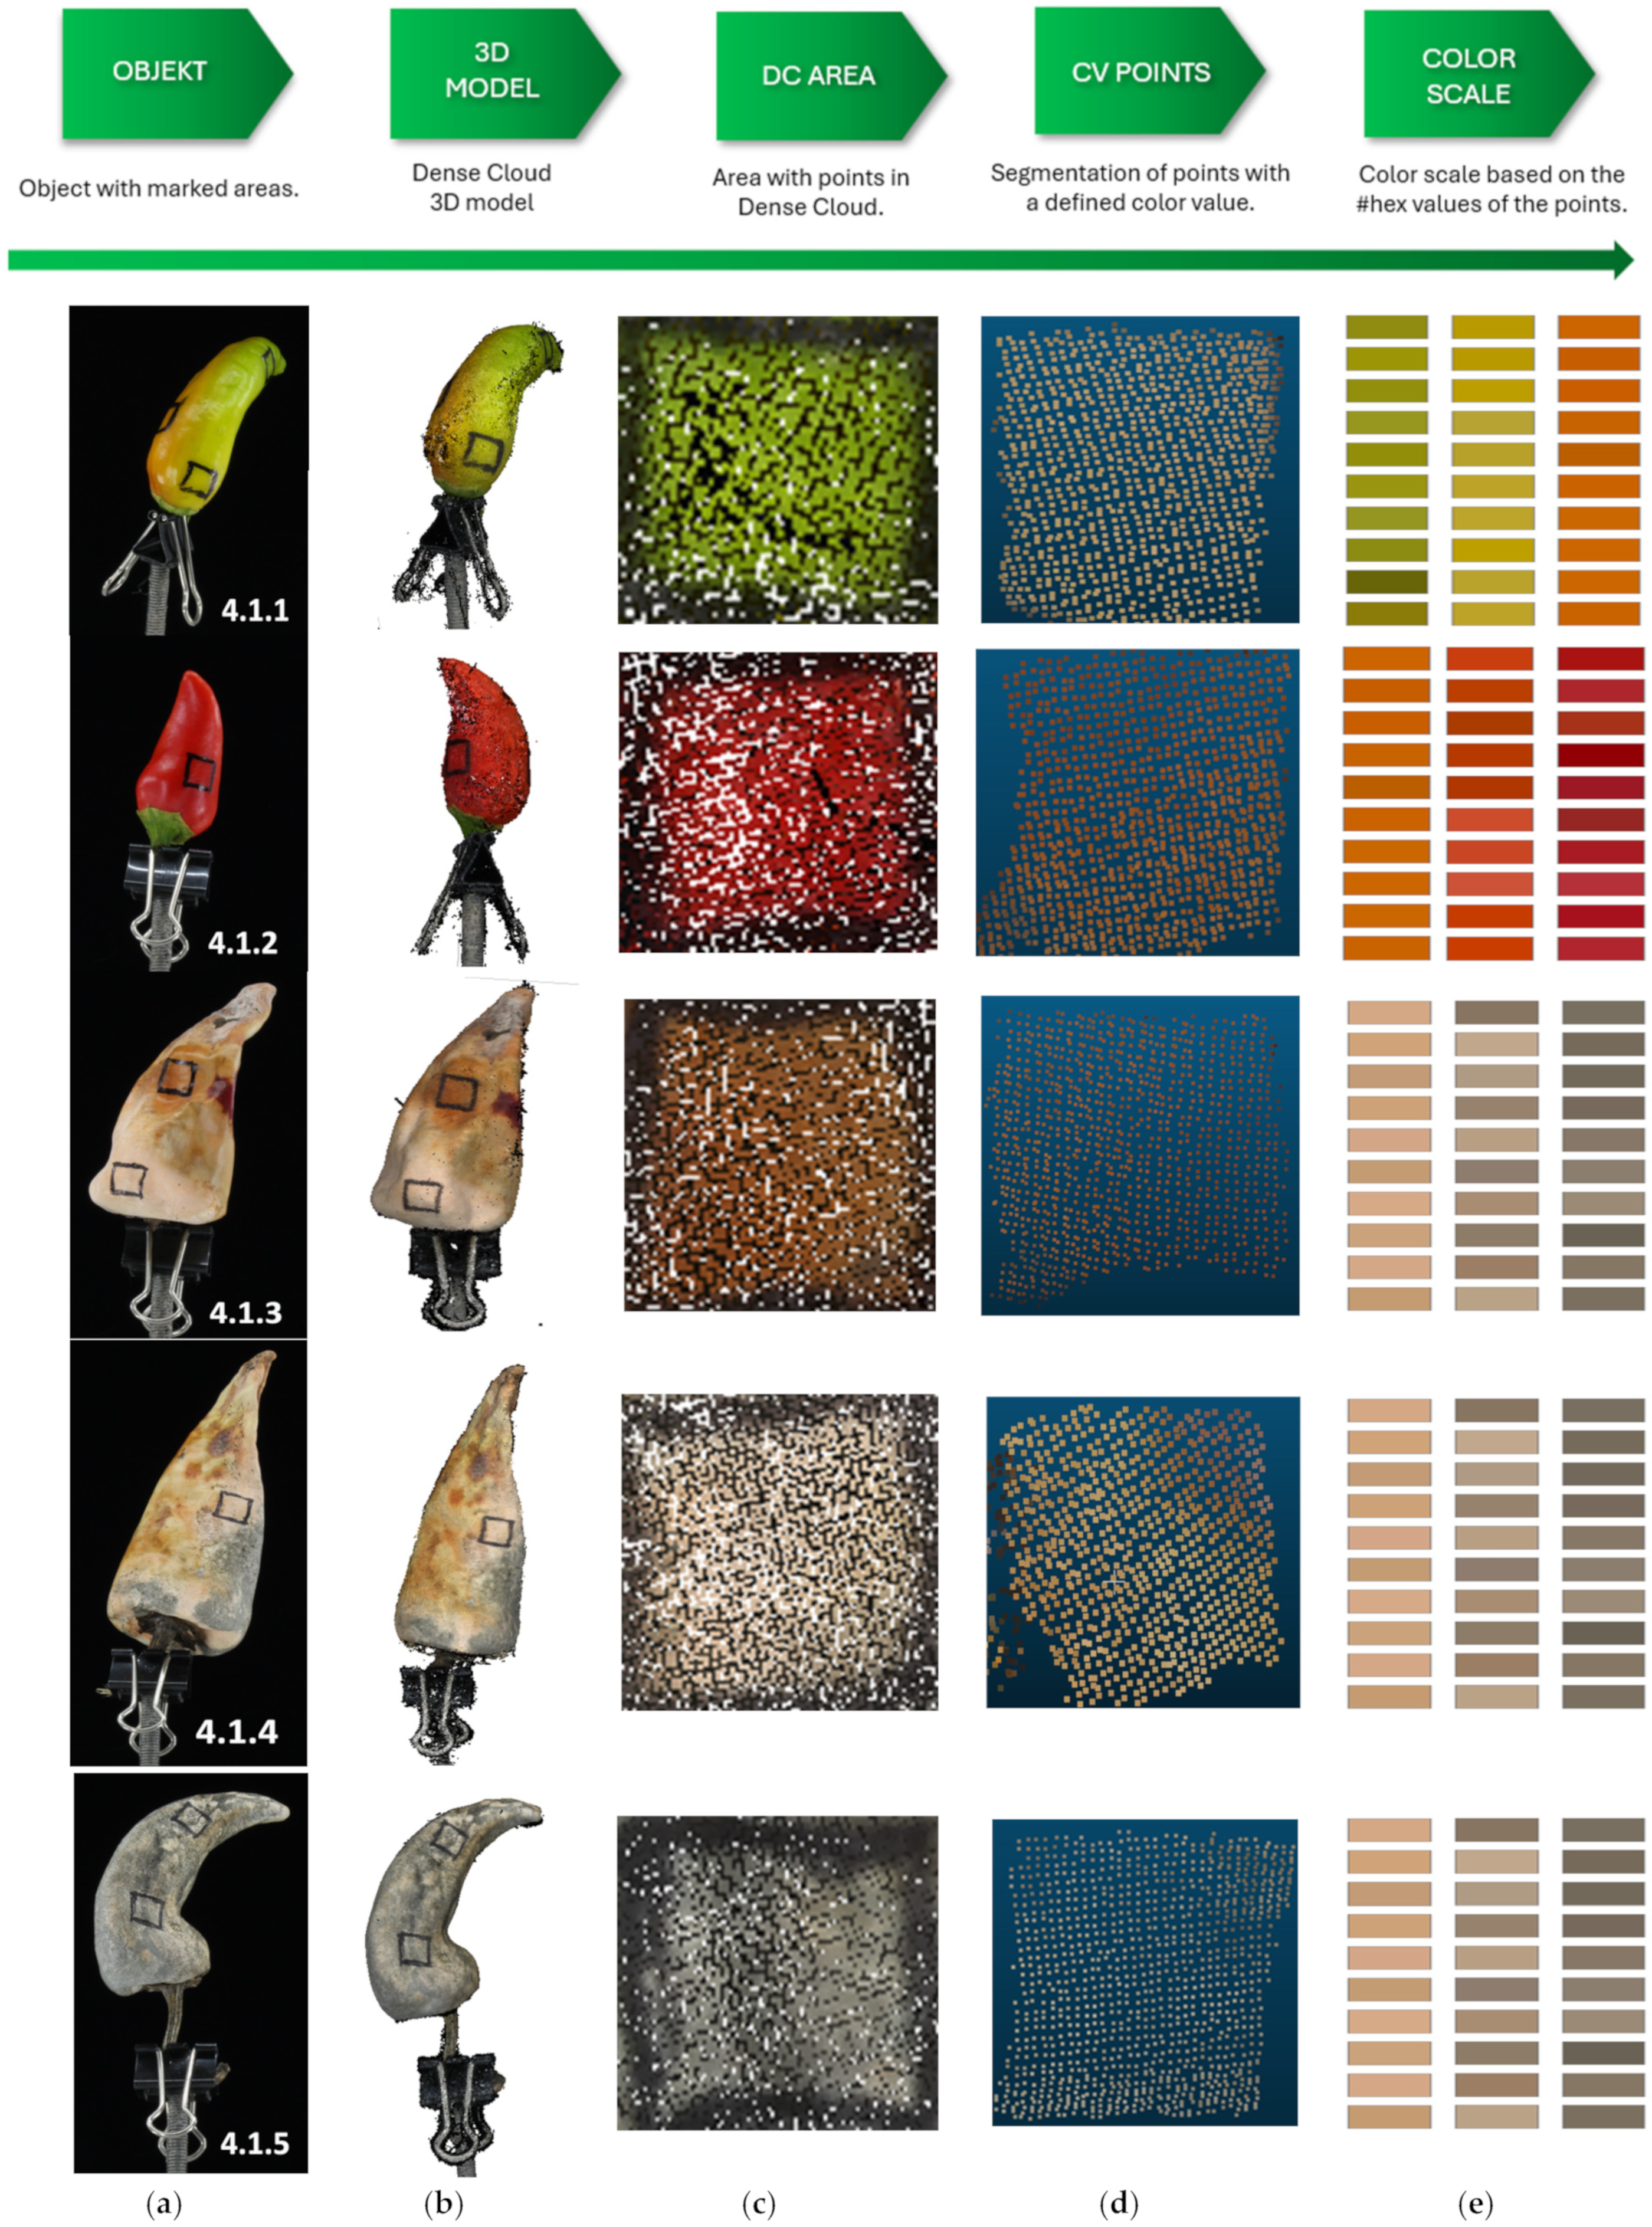
The captured images were automatically stored in folders created in the library on the computing unit. Next, 3D models from the captured images were created using Agisoft Metashape professional graphics software. The resulting 3D models were composed of individual points from the Dense Cloud model. The 3D digital twins are shown in Figure 7 in the next section. That section also presents the point segmentation and the resulting color scale.
Figure 7.
Reference visualization of objects 4.1.1, 4.1.2, 4.1.3, 4.1.4, and 4.1.5 in the process of creating a 3D model and color scale. (a) Objects intended for realistic 3D reconstruction. (b) 3D digital twin of the object as a Dense Cloud. (c) Marked area in the digital model for color analysis and segmentation of points based on their color value. (d) Segmentation of points with a defined color value in the marked area. (e) The resulting color scale corresponds to the color values of the segmented points from the 3D digital twin.
3. Results
This section describes how to create a 3D model and a point cloud and how to visualize them. This section also includes information on defining colors and creating a color reference scale based on the measured values.
3.1. 3D Models of Dense Cloud Objects
The result of the 3D reconstruction of the chili pepper objects is a 3D digital twin in a Dense Cloud (DC). This form of 3D model is composed of individual points with their own color information. The number of points in the 3D model for each object is listed in Table 1. Qualitative attributes of the images are also displayed, including the number of images used for 3D reconstruction via the SfM method, image resolution, bit depth, and color contrast. The color resolution value represents the sRGB color gamut.
Table 1.
Basic image attributes for transformation into 3D models.
In the professional Agisoft Metashape software for 3D reconstruction, the Reprojection Error (RE) is calculated using the equation:
where is the actual position of the point in the image, and is the position recorded from the camera + model. RE shows by how many pixels the position of a point in the image differs from the position to which the derived model projects it. In SfM, RE < 0.3 (px) is excellent, RE ≤ 0.5 (px) is very good, RE ≥ 1.0 (px) is acceptable, and RE > 1.0 (px) represents a significant difference. The 3D model 4.1.4 has RE = 36.205 (px). This is significantly above the limit. The result indicates that there was a non-standard error in the image processing. The study focuses on fetal maturity. This error can be tolerated.
3.2. Color Values and Color Scales
Digital twins of chili pepper objects created by the SfM photogrammetric method are depicted in Figure 7b. Based on visual comparison of the 3D digital reproduction with the photographs of the objects, the resulting 3D models appear very successful. The color analysis markers in the 3D models were visibly reproduced. The figure further visualizes the process of point segmentation and the creation of the color scale.
Figure 7 visualizes 3D digital twins created from real objects. That figure also visualizes segmented partial areas of objects for the subsequent process of segmenting individual points based on a precisely defined attribute. This attribute is a precisely defined color in the selected RGB gamut, corresponding to the measured values from real objects. For segmenting individual points on the surface, Agisoft Metashape and SW Cloud Compare 2.1.3 Beta Open Source were used. Figure 7 also shows the color scales created for individual objects. Table 2 shows the color scale values expressed in hexadecimal after conversion and the average color value.
Table 2.
Hex and Ø Hex CV from measured real colors of chili pepper fruit objects.
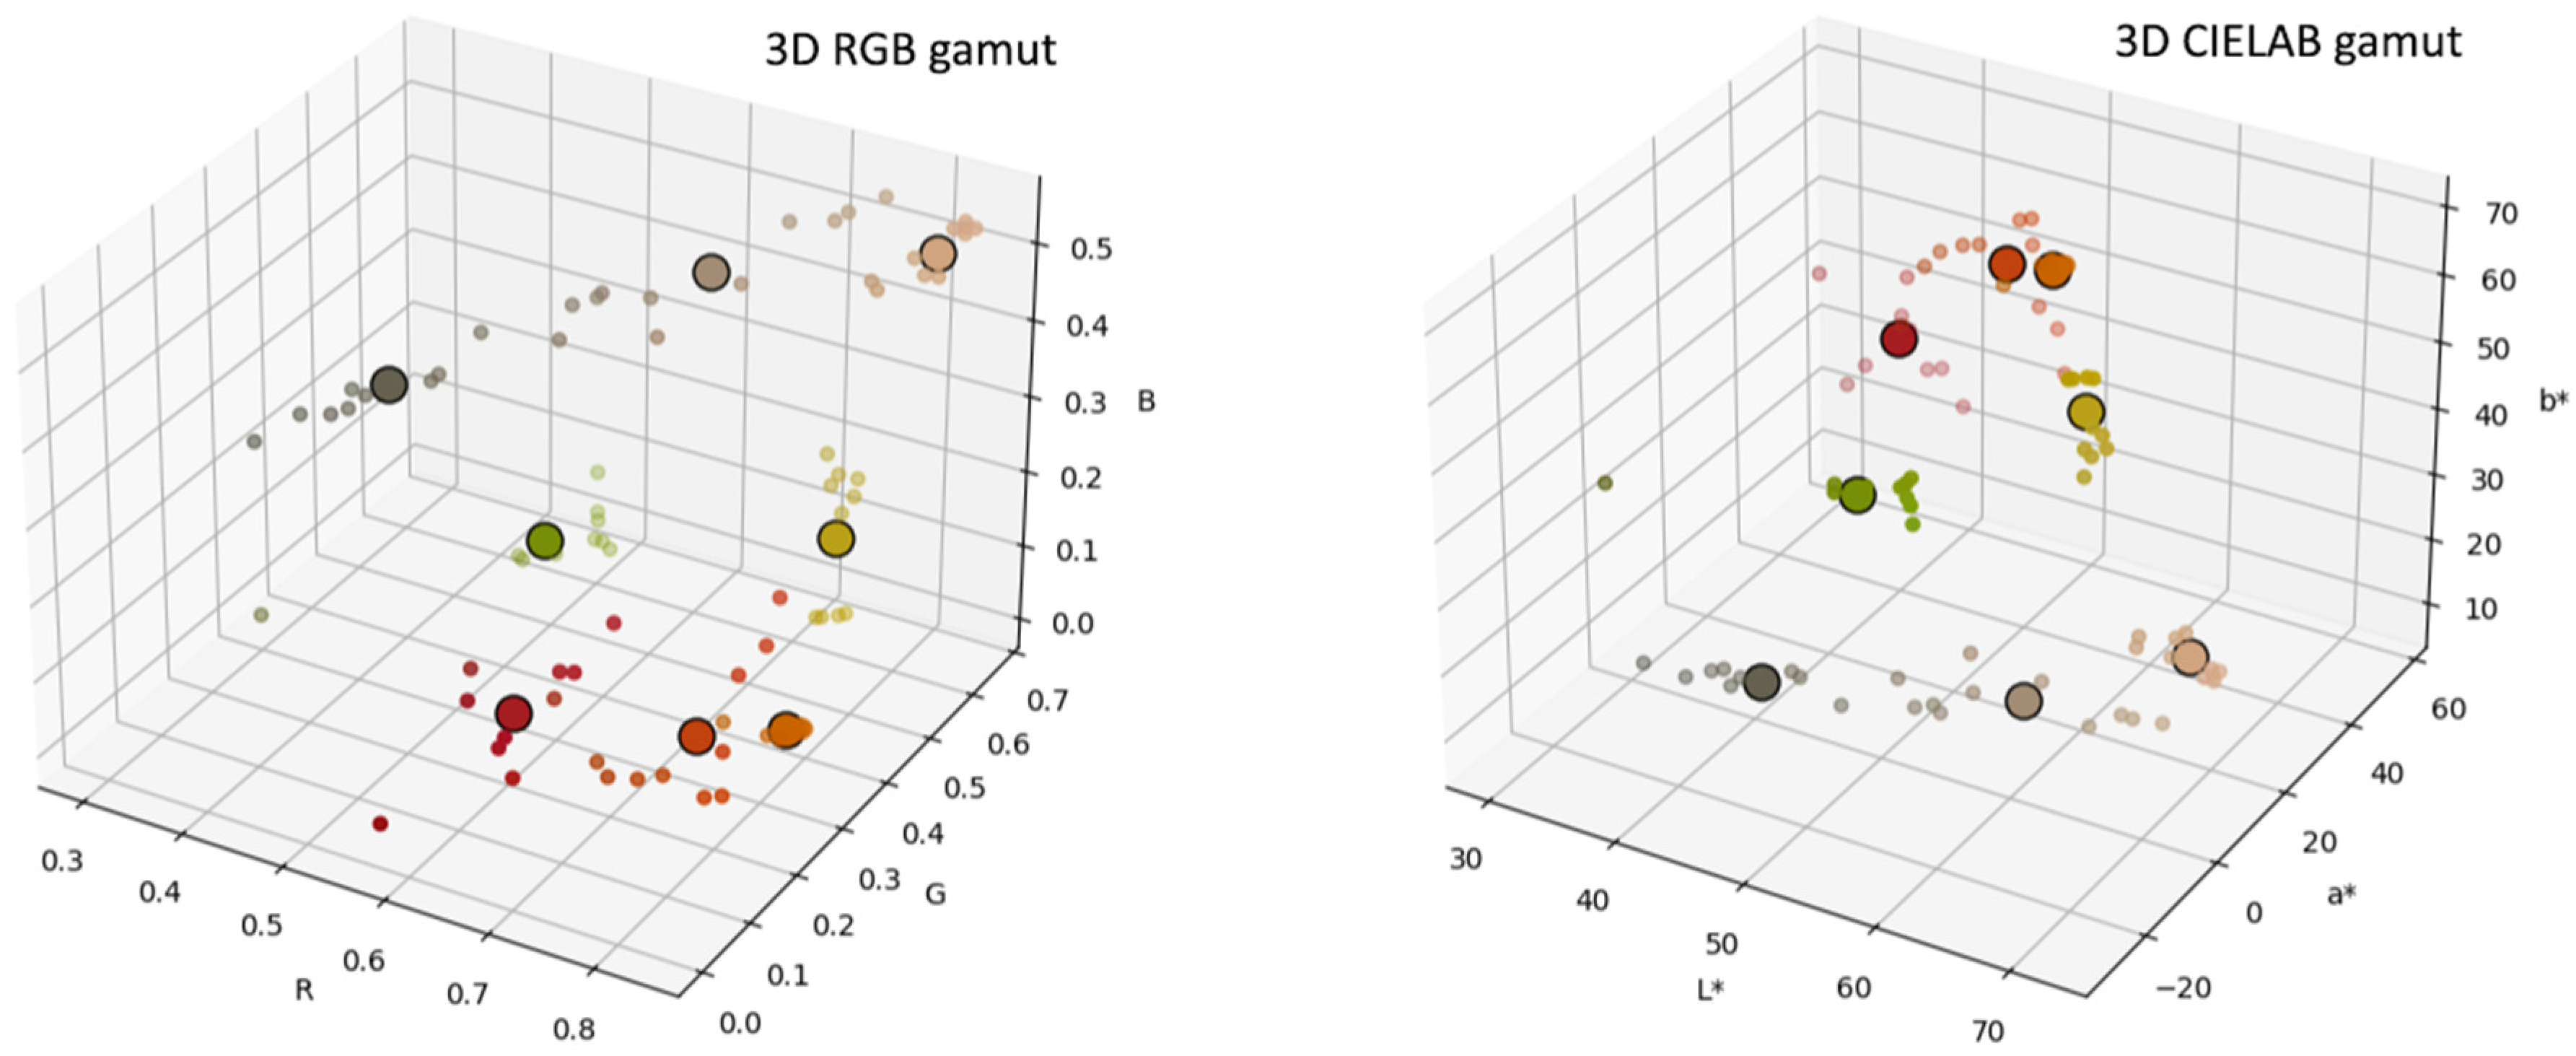
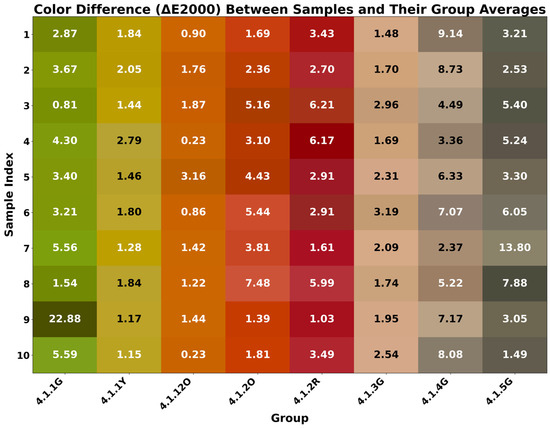
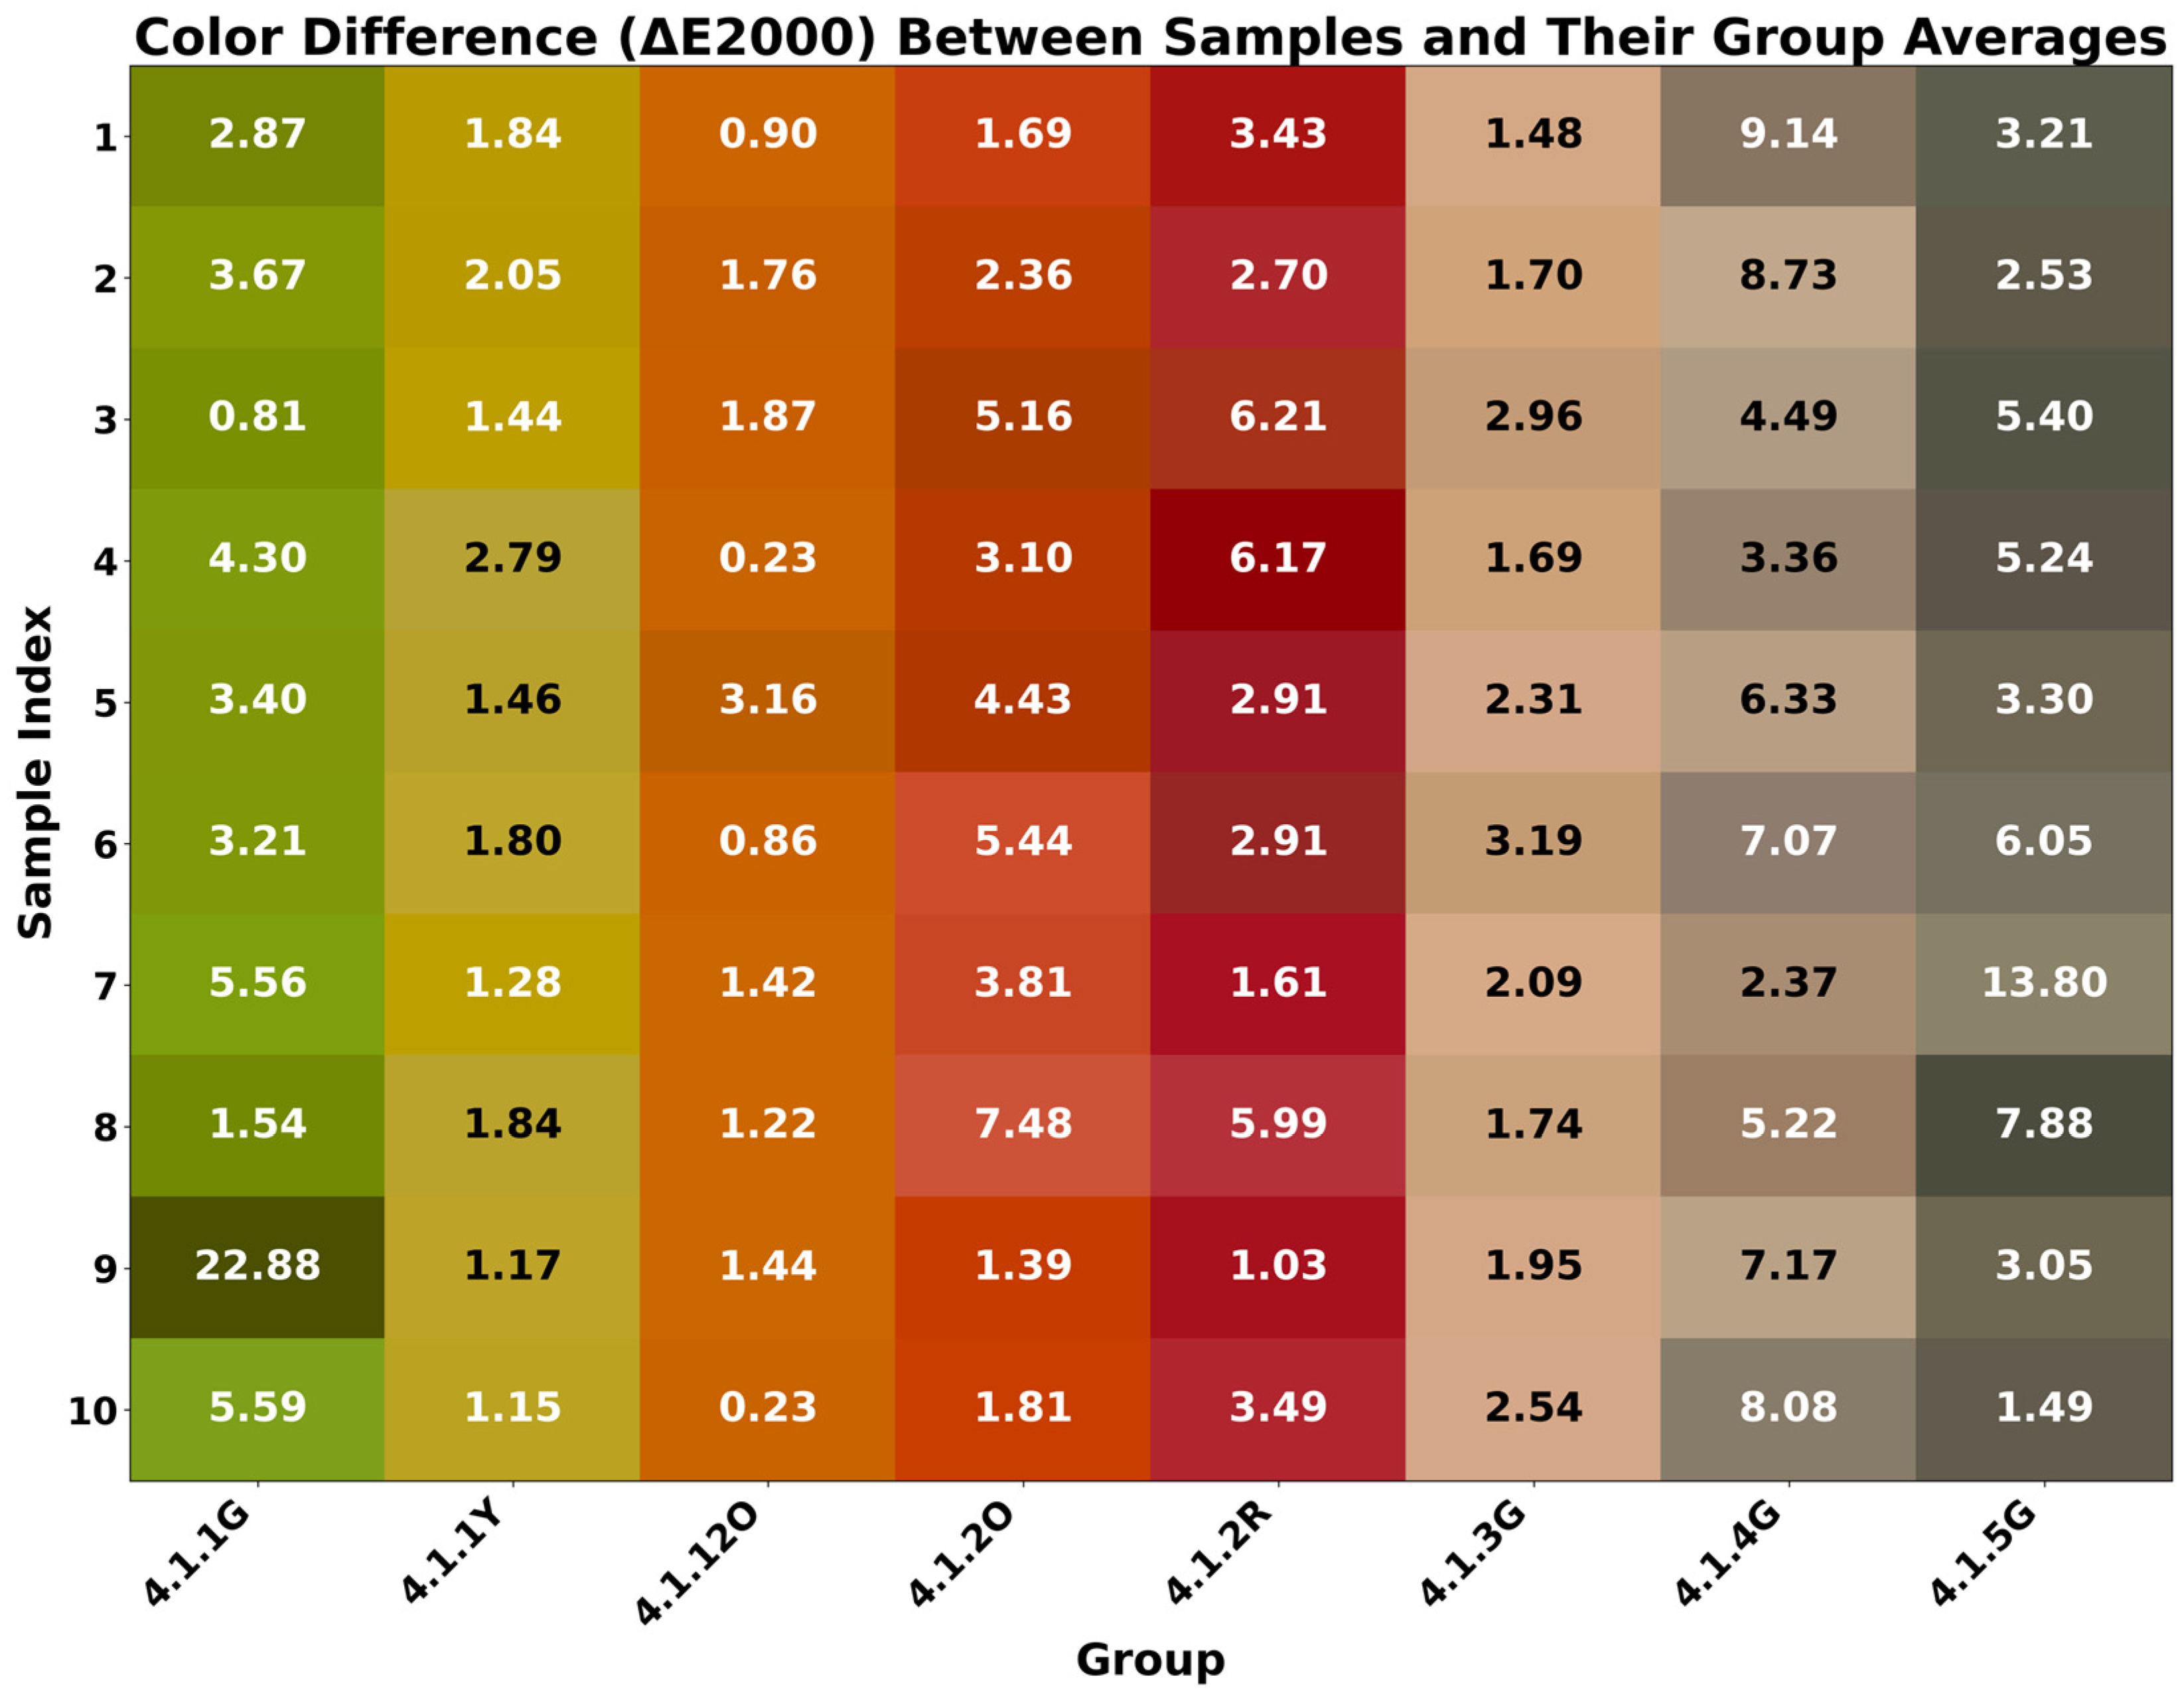
Figure 8 shows the 3D RGB and CIELAB gamuts, depicting the dispersion of color values relative to the group’s average color. The ΔE parameter was determined for all colors using the ΔE2000 standard in the L*a*b* color space. This space does not account for the gamut of the sensing and display devices. Figure 9 shows the ΔE values of all colors in relation to the average color value of the group. Table 3 shows the average values of the ΔE parameter.
Figure 8.
The Ø color value and the dispersion of color value groups in the 3D RGB gamut and 3D CIELAB gamut.
Figure 9.
Color difference ΔE2000 of all color values and the Ø color of the groups.
Table 3.
Ø ΔE2000 for each group and the color average.
Table 3 shows the average ΔE2000 values for each group. Table 2 shows the differences in color between the group column and its averages.
Table 3 shows the most stable groups 4.1.12O, 4.1.1Y, and 4.1.3G with very consistent color shades. These groups are very close to their color average. On the contrary, the most significant color variance, ΔE ≈ 6.20, is expected for group 4.1.4G. Group 4.1.1G has a color difference of ΔE ≈ 5.19. This group represents the chili pepper fruit in the immature stage. At this stage, there is an intense change in color tone.
Table 2 shows the hexadecimal numerical values converted from the sRGB color space values. These numerical color values subsequently defined the individual colors for the reference color scale model. The emphasis is mainly on ripening and ripe chili pepper fruits. These are 3D object models 4.1.1 and 4.1.2. These color values are essential for the color changes in the fruit during ripening. The color values listed in Table 2—4.1.1G; 4.1.1 Y; 4.1.12O 4.1.12O; 4.1.2O and 4.1.2R—represent the color values during ripening from the green color of the unripe chili pepper fruit to the red color of the ripe chili pepper fruit. The color variation during fruit ripening is captured from green tones (4.1.1G) through yellow and orange tones (4.1.1Y; 4.1.12O 4.1.2O) to red tones (4.1.2R) of ripe fruit. The values marked 4.1.12O define the boundary values between unripe and ripening chili pepper fruit. Green (4.1.1G) and red tones (4.1.2R) represent the minimum and maximum values defining the beginning and end of the fruit ripening phase. The following color values for the scales 4.1.3G, 4.1.4G and 4.1.5G and their visualizations represent the color of the fruit after the ripening phase. These phases are associated with the beginning of fruit rot and drying. In a specific modification, a similar process of color tone adjustment can be applied to the principle presented in the study on color modification in the virtual environment [47].
These color values can therefore be understood as the basis for the determined limit value in the variability of fruit ripening. In this study, a colorimeter with a color-difference parameter ∆E = 0.3 was used, and points with the corresponding color values were segmented from the 3D models. It can be assumed that the parameter ∆E remains constant. The parameter’s value is below the limit of human vision, ∆E ≤ 1. The color scale shows visually distinct color tones that are derived from the direct color value. The dispersion of individual color groups around their average color value and the average color differences ΔE across the entire color scale, as shown in Figure 8 and Table 3, can be considered additional attributes for determining the range of measured values when identifying the stage of fruit maturity.
4. Discussion
This study demonstrates the potential of color vision in the field of digital objects and the creation of digital twins. In the agricultural industry, one can imagine broad applications of color vision and colorimetry methods. Some current scientific studies present different approaches to solving this problem [48,49,50]. A combination of methods and procedures from computer vision, color vision, image capture sciences, and image processing is a prerequisite for successful results. In practical use, it is also necessary to consider the sensing device’s capabilities, sensor types, signal transmission, software and applications, and the type of final output required, including display devices. In this regard, simple solutions, methodologies, and procedures are preferred [51,52].
The color scale defined by the actual color values measured by the colorimetric sensor in individual parts of the fruit and segmented points carrying the same color information can be considered a basic representation quality indicator. The color scale values represent the range of colors during the ripening of chili pepper fruits. The continuous process of fruit ripening includes all colors and their variability in real time until the final stage of ripeness. In this research, the color change is proposed in individual tones. In this way, the basic color scale of the fruit ripening process can be appropriately expanded to include additional color values.
The limitations of this study include the smaller sample of objects for 3D reconstruction and the limited areas analyzed. Repetitive values were observed in some of the areas marked for color analysis. For this reason, 10 color values were determined in each part of the color scale with the assumption of the possibility of expanding the scale with other tones falling within the desired color spectrum. These tones can be derived and supplemented with an appropriate algorithm. This solution will be the subject of future research in the field of Sustainable Agriculture 4.0.
In the issue of color vision, it is also necessary to consider human vision. It is well known that the perception of colors by the human eye varies from person to person. In the study, point segmentation was performed in the cloud of a 3D model based on the physical surface values measured on the object. The colorimeter measured the values on the marked area of the object. In this experiment, a colorimeter with a color-difference parameter ∆E = 0.3 was used, and points with corresponding color values were segmented from 3D models. The ∆E parameter shows extreme accuracy. It can be assumed that the ∆E parameter remains at the value 0.03. The value of the parameter ∆E < 1 is below the limit of human vision. This parameter can be the focus of future research in connection with machine vision and the definition of different levels of accuracy based on the nature of sensing and imaging devices.
This research also focused on the color model and gamut (sRGB/L*a*b*/CIE XYZ) and color value transformation. The experiment applies the D65 daylight standard. The sensors of the scanning device used to measure color values work on this standardized principle. At the same time, these conditions were simulated during object scanning to create 3D digital twins. The objects were scanned on a black background in a photo studio supplemented with standardized LED lighting. The prerequisites for this solution are natural and artificial lighting conditions in the external environment and in the greenhouse. The color scale defines the basic color framework for application in these conditions. Attributes associated with the issue of light are not considered in this research. However, these attributes significantly expand the scope of the research issue and the possibilities for future research, not only in the field of Sustainable Agriculture 4.0.
5. Conclusions
This study proposes a unique methodological integration with the potential to generate color datasets for machine learning. The design of a color scale for detecting the ripening stage of the chili fruit and pest infestation expands the possibilities in the field of Sustainable Agriculture 4.0. To achieve the goal, the following conditions had to be met:
- Analyze the colors of the object and establish a methodology for applying color values in a digital environment. The exact definition of color values on the marked surfaces of chili fruits at different stages of ripening was determined by precise measurement using the sensory colorimeter in the D65 light standard with the parameter ∆E = 0.3. These color values were then applied to the point segmentation process for the created 3D digital twins.
- Define the process of capturing and processing images into a 3D Dense Cloud model. A photogrammetric method was applied to create realistic 3D chili pepper models. The process was streamlined by creating a semi-automatic system to capture and store images. A set of six DSLR cameras and a rotating plate significantly shortened the time required to photograph chili peppers. The objects were photographed in a photo studio environment with a black background supplemented with standardized D65 LED lighting. This procedure simulated the conditions in which the color values were acquired on the fruit surface. Transferring the image data and storing it in the created library made the sorting and storing of the acquired image dataset more efficient. Three-dimensional models were subsequently generated as a Dense Cloud. Individual points in this model have the color information in the marked area for color analysis.
- The last phase was the segmentation of points according to color value and the creation of a color scale. The measured color values and the segmented points’ color information served as the basis for creating the scale. Three-dimensional digital twins provided sufficient points at the marked area with the same color value as on the surface of the real object. On this basis, a primary color scale corresponding to color values at different stages of ripening was designed.
Defining colors based on accurate color values is crucial for expanding the color dataset and training machine learning models. The proposed procedures for creating color scales serve as a basis for future automated agriculture applications to quantify fruit maturity and detect disease. Non-contact identification of fruit ripening stage, disease or pest infestation using a color scale simplifies monitoring crop growth and ripening. Combined with future use of IoT (Internet of Things) and the development of autonomous greenhouses, the entire crop identification process is not only simplified but also supports a responsible, sustainable approach to agriculture.
Author Contributions
Conceptualization, I.D., H.W. and W.G.; methodology, I.D., H.W., W.G., J.B. and P.M.B.; software, I.D., H.W. and W.G.; validation, P.M.B. and J.B.; formal analysis, I.D. and H.W.; investigation, I.D. and H.W.; resources, I.D. and N.K.; data curation, I.D. and H.W.; writing—original draft preparation, I.D.; writing—review and editing, I.D., H.W., W.G., J.B., P.M.B., N.K. and M.A.; visualization, I.D. and H.W.; supervision, W.G.; project administration, I.D. and W.G. All authors have read and agreed to the published version of the manuscript.
Funding
This research received no external funding.
Institutional Review Board Statement
Not applicable.
Informed Consent Statement
Not applicable.
Data Availability Statement
The data presented in this study are available on request from the author (I.D.).
Acknowledgments
The chili pepper seeds were provided by the Genebank Project, National Agriculture and Food Research Organization, Japan. The authors thank Naomi Morinaga and Kozue Wada at ISAS Laboratory, the University of Tokyo, Japan, for their support.
Conflicts of Interest
The authors declare no conflicts of interest. The funders had no role in the design of the study; in the collection, analyses, or interpretation of data; in the writing of the manuscript; or in the decision to publish the results. The authors partially used Copilot M365 for graph creation.
References
- Niewiadomska, A. Agriculture 4.0—An opportunity or threat to Polish agriculture. Przegląd Prawa Rolnego 2024, 2, 163–174. [Google Scholar] [CrossRef] [Scilit]
- Gupta, K.P.; Singh, S.; Gautam, S.K. Bibliometric Study of Global Research Trends on Agriculture 4.0: Publication Pattern, and Thematic Analysis. J. Agric. Inform. 2024, 15, 25–41. [Google Scholar] [CrossRef] [Scilit]
- Mane, S.; Narawade, V.; Ranshur, N. Revolutionizing Agriculture Soil Testing with Agriculture 4.0 and IoT Integration. Curr. Agric. Res. J. 2025, 12, 1333–1344. [Google Scholar] [CrossRef] [Scilit]
- Anjum, R.; Khan, M.; Olawale, K.; Baber, R. Field Evaluation and Enzyme-Linked Immunosorbent Assay Detection of Potato Leaf Roll Virus, Potato Virus X and Potato Virus Y in Potato Germplasm. J. Agric. Sci. 2024, 9, 229. [Google Scholar] [CrossRef] [Scilit]
- Chen, G.; Hou, Y.; Cui, T.; Li, H.; Shangguan, F.; Cao, L. YOLOv8-CML: A lightweight target detection method for color-changing melon ripening in intelligent agriculture. Sci. Rep. 2024, 14, 14400. [Google Scholar] [CrossRef] [Scilit]
- Yang, Z.; Li, Y.; Han, Q.; Wang, H.; Li, C.; Wu, Z. A Method for Tomato Ripeness Recognition and Detection Based on an Improved YOLOv8 Model. Horticulturae 2025, 11, 15. [Google Scholar] [CrossRef] [Scilit]
- Wei, X.; Xie, F.; Wang, K.; Song, J.; Bai, Y. A study on Shine-Muscat grape detection at maturity based on deep learning. Sci. Rep. 2023, 13, 4587. [Google Scholar] [CrossRef] [Scilit]
- Korlepara, N.S.D.P.; Raju, V.S.N.N.; Satyanarayana, P.; Kumar, V.S.; Priya, Y.J.; Vardan, D.H. Real-Time Precision Irrigation System for Optimal Crop Yield and Water Conservation. IOP Conf. Ser. Earth Environ. Sci. 2024, 1375, 012019. [Google Scholar] [CrossRef] [Scilit]
- James, J.A.; Manching, H.K.; Mattia, M.R.; Bowman, K.D.; Hulse-Kemp, A.M.; Beksi, W.J. CitDet: Benchmark Dataset for Citrus Fruit Detection. IEEE Robot. Autom. Lett. 2024, 9, 10788–10795. [Google Scholar] [CrossRef] [Scilit]
- Raza, S.M.; Raza, A.; Babeker, M.I.A.; Haq, Z.U.; Islam, M.A.; Li, S. Efficient citrus fruit image classification via a hybrid hierarchical CNN and transfer learning framework. Food Meas. 2025, 19, 356–377. [Google Scholar] [CrossRef] [Scilit]
- Purnama, N. Comparison of CNN Transfer Learning in Detecting Superior Local Fruit Types in Bali. J. Intell. Syst. Comput. 2024, 6, 39–45. [Google Scholar] [CrossRef] [Scilit]
- Giménez-Gallego, J.; Martinez-del-Rincon, J.; González-Teruel, J.D.; Navarro-Hellín, H.; Navarro, P.J.; Torres-Sánchez, R. On-tree fruit image segmentation comparing Mask R-CNN and Vision Transformer models. Application in a novel algorithm for pixel-based fruit size estimation. Comput. Electron. Agric. 2024, 222, 109077. [Google Scholar] [CrossRef] [Scilit]
- Natij, Y.; El Karch, H.; Maafiri, A.; Mezouari, A. Evaluating the Performance of YOLO Object Detectors for Plant Disease Detection. In Proceedings of the 11th International Conference on Wireless Networks and Mobile Communications (WINCOM), Leeds, UK, 23–25 July 2024; pp. 1–6. [Google Scholar] [CrossRef] [Scilit]
- Madhu, S.; Ravisankar, V. Comprehensive Analysis of a YOLO-based Deep Learning Model for Cotton Plant Leaf Disease Detection. Eng. Technol. Appl. Sci. Res. 2025, 15, 19947–19952. [Google Scholar] [CrossRef] [Scilit]
- Ali, U.; Ismail, M.A.; Habeeb, R.A.A.; Shah, S.R.A. Performance Evaluation of YOLO Models in Plant Disease Detection. J. Inform. Web Eng. 2024, 3, 199–211. [Google Scholar] [CrossRef] [Scilit]
- Mahto, S.K.; Kumar, Y.; Singh, M.; Kumari, R.; Ray, K.K. Automation in Agriculture Using Deep Machine Learning: A Survey. In Communications in Computer and Information Science; Springer: Cham, Switzerland, 2023; Volume 1822. [Google Scholar] [CrossRef] [Scilit]
- Kahya, E.; Ozduven, F.F.; Aslan, Y. YOLOv5 Model Application in Real-Time Robotic Eggplant Harvesting. J. Agric. Sci. 2024, 16, 9. [Google Scholar] [CrossRef] [Scilit]
- Palleja, T.; Tresanchez, M.; Llorens, J.; Saiz-Vela, A. Design and characterization of a real-time capacitive system to estimate pesticides spray deposition and drift. Comput. Electron. Agric. 2023, 207, 107720. [Google Scholar] [CrossRef] [Scilit]
- Bodor-Pesti, P.; Nguyen, L.L.P.; Nguyen, T.B.; Dam, M.S.; Taranyi, D.; Baranyai, L. LeafLaminaMap: Exploring Leaf Color Patterns Using RGB Color Indices. AgriEngineering 2025, 7, 39. [Google Scholar] [CrossRef] [Scilit]
- Baranyai, L.; Lien, N.; Mai, D.; Zsom, T.; Hitka, G. Evaluation of precooling temperature and 1-MCP treatment on quality of ‘Golden Delicious’ apple. J. Appl. Bot. Food Qual. 2020, 93, 130–135. [Google Scholar] [CrossRef]
- Gupta, S.; Singh, D. Color Features Based Model for Land Cover Identification and Agriculture Monitoring with Satellite Images. In Remote Sensing of Agriculture and Land Cover/Land Use Changes in South and Southeast Asian Countries; Springer: Cham, Switzerland, 2022. [Google Scholar] [CrossRef] [Scilit]
- Lhermitte, E.; Hilal, M.; Furlong, R.; O’Brien, V.; Humeau-Heurtier, A. Deep Learning and Entropy-Based Texture Features for Color Image Classification. Entropy 2022, 24, 1577. [Google Scholar] [CrossRef] [Scilit]
- Chen, G.; Hou, Y.; Chen, H.; Cao, L.; Yuan, J. A lightweight Color-changing melon ripeness detection algorithm based on model pruning and knowledge distillation: Leveraging dilated residual and multi-screening path aggregation. Front. Plant Sci. 2024, 15, 1406593. [Google Scholar] [CrossRef] [Scilit]
- Pane, M.A.S.; Saleh, K.; Satia Simbolon, H.F.; Wilhelm Weber, G.; Ehkan, P.; Warip, M.N. Assessing Palm Plant Health through Color Analysis of Leaves Using MATLAB-Based Digital Image Processing. J. Inf. Syst. Technol. Res. 2025, 4, 63–70. [Google Scholar] [CrossRef] [Scilit]
- Huang, H.; Tang, Y.; Tan, Z.; Zhuang, J.; Hou, C.; Chen, W.; Ren, J. Object-Based Attention Mechanism for Color Calibration of UAV Remote Sensing Images in Precision Agriculture. IEEE Trans. Geosci. Remote Sens. 2022, 60, 4416013. [Google Scholar] [CrossRef] [Scilit]
- Han, Z.; Li, L.; Jin, W.; Wang, X.; Jiao, G.; Wang, H. Convolutional Neural Network Training for RGBN Camera Color Restoration Using Generated Image Pairs. IEEE Photonics J. 2020, 12, 6802815. [Google Scholar] [CrossRef] [Scilit]
- Adedeji, O.; Abdalla, A.; Ghimire, B.; Ritchie, G.; Guo, W. Flight Altitude and Sensor Angle Affect Unmanned Aerial System Cotton Plant Height Assessments. Drones 2024, 8, 746. [Google Scholar] [CrossRef] [Scilit]
- Lepej, P.; Taranyi, D.; Rakun, J.; Nagy, B.; Steckl, S.; Lukácsy, G.; Mikóczy, N.; Nyitrainé Sárdy, D.Á.; Bodor-Pesti, P. The Effect of Irrigation on the Vineyard Canopy and Individual Leaf Morphology Evaluated with Proximal Sensing, Colorimetry, and Traditional Morphometry. Horticulturae 2024, 10, 716. [Google Scholar] [CrossRef] [Scilit]
- Bodor-Pesti, P.; Taranyi, D.; Nyitrainé Sárdy, D.Á.; Le Phuong Nguyen, L.; Baranyai, L. Correlation of the Grapevine (Vitis vinifera L.) Leaf Chlorophyll Concentration with RGB Color Indices. Horticulturae 2023, 9, 899. [Google Scholar] [CrossRef] [Scilit]
- Ambrus, B.; Teschner, G.; Kovács, A.; Neményi, M.; Helyes, L.; Pék, Z.; Takács, S.; Alahmad, T.; Nyéki, A. Field-grown tomato yield estimation using point cloud segmentation with 3D shaping and RGB pictures from a field robot and digital single lens reflex cameras. Heliyon 2024, 10, e37997. [Google Scholar] [CrossRef] [Scilit]
- Roza De Moraes, F.; Da Silva, I. Optimizing Submillimeter 3D Modeling with Auxiliary Lighting and Artificial Textures: An SfM-Based Approach. F1000Research 2024, 13, 1479. [Google Scholar] [CrossRef] [Scilit]
- Arief, M.A.A.; Nugroho, A.P.; Putro, A.W.; Sutiarso, L.; Cho, B.-K.; Okayasu, T. Development and Application of a Low-Cost 3-Dimensional (3D) Reconstruction System Based on the Structure from Motion (SfM) Approach for Plant Phenotyping. J. Biosyst. Eng. 2024, 49, 326–336. [Google Scholar] [CrossRef] [Scilit]
- Liu, L.; Wang, C.; Feng, C.; Gong, W.; Zhang, L.; Liao, L.; Feng, C. Incremental SFM 3D Reconstruction Based on Deep Learning. Electronics 2024, 13, 2850. [Google Scholar] [CrossRef] [Scilit]
- Gamin, s.r.o. Czech Republic. 2023. Available online: https://www.gamin.cz/kolorimetr-colorix-colorcatch-nano/ (accessed on 1 December 2025).
- Robertson, A.E. The CIE 1976 Color-Different Formulae. Color Res. Appl. 1977, 2, 7–11. [Google Scholar] [CrossRef] [Scilit]
- Burger, W.; Burge, M.J. Digital Image Processing: An Algorithmic Introduction Using Java; Springer: London, UK, 2010; ISBN 978-1-84628-379-6. [Google Scholar]
- Aspose Pty Ltd. Australia. 2025. Available online: https://products.aspose.app/svg/cs/color-converter/rgb-to-hex (accessed on 1 June 2025).
- Gonzalez, R.C.; Woods, R.E. Digital Image Processing, 4th ed.; Pearson: London, UK, 2018; ISBN 978-1-292-22304-9. [Google Scholar]
- Straffelini, E.; Cucchiaro, S.; Tarolli, P. Mapping potential surface ponding in agriculture using UAV-SfM. Earth Surf. Process. Landf. 2021, 46, 1926–1940. [Google Scholar] [CrossRef] [Scilit]
- Dai, W.; Qiu, R.; Wang, B.; Lu, W.; Zheng, G.; Amankwah, S.O.Y.; Wang, G. Enhancing UAV-SfM Photogrammetry for Terrain Modeling from the Perspective of Spatial Structure of Errors. Remote Sens. 2023, 15, 4305. [Google Scholar] [CrossRef] [Scilit]
- Bello, R.-W.; Owolawi, P.A.; Wyk, E.A.V.; Tu, C. Estimation of tree height using UAV photogrammetric data. Edelweiss Appl. Sci. Technol. 2024, 8, 507–579. [Google Scholar] [CrossRef] [Scilit]
- Agarwal, D.; Soni, N.; Namboodiri, A.M. Salient object detection in SfM point cloud. In Proceedings of the 2013 Fourth National Conference on Computer Vision, Pattern Recognition, Image Processing and Graphics (NCVPRIPG), Jodhpur, India, 18–21 December 2013; pp. 1–4. [Google Scholar] [CrossRef] [Scilit]
- Heng Siong, E.H.; Ariff, M.F.M.; Razali, A.F. The Application of Smartphone Based Structure from Motion (SfM) Photogrammetry in Ground Volume Measurement. Int. Arch. Photogramm. Remote Sens. Spat. Inf. Sci. 2023, 48, 145–152. [Google Scholar] [CrossRef] [Scilit]
- Al-Tameemi, R.; Hamandi, S.; Al-Mahdi, A. Creating a Digital 3D Model of the Dental Cast Using Structure-from-Motion Photogrammetry Technique. Int. J. Online Biomed. Eng. (iJOE) 2023, 19, 4–17. [Google Scholar] [CrossRef] [Scilit]
- Moulon, P.; Monasse, P.; Marlet, R. Adaptive Structure from Motion with Model Estimation. In Computer Vision—ACCV 2012, Proceedings of the 11th Asian Conference on Computer Vision 2012, Daejeon, Republic of Korea, 5–9 November 2012; Lecture Notes in Computer Science; Lee, K.M., Matsushita, Y., Rehg, J.M., Hu, Z., Eds.; Springer: Berlin/Heidelberg, Germany, 2013; Volume 7727. [Google Scholar] [CrossRef] [Scilit]
- G4D s.r.o. Metashape, Prague, Czech Republic. 2024. Available online: https://www.agisoft.cz/ (accessed on 1 December 2025).
- Drofova, I.; Richard, P.; Fajkus, M.; Valasek, P.; Sehnalek, S.; Adamek, M. RGB Color Model: Effect of Color Change on a User in a VR Art Gallery Using Polygraph. Sensors 2024, 24, 4926. [Google Scholar] [CrossRef] [Scilit]
- Syafutra, H.; Anam, M.K.; Ahmad, F.; Nadalia, D.; Heryanto, R.; Antarnusa, G.; Umam, R.; Takahashi, H. Development of portable color detector: Its application for determination of Munsell Soil Color. SAINS TANAH—J. Soil Sci. Agroclimatol. 2025, 22, 1–11. [Google Scholar] [CrossRef] [Scilit]
- Tamilarasi, T.; Muthulakshmi, P.; Ashtiani, S.-H.M. Smart Edge Computing Framework for Real-Time Brinjal Harvest Decision Optimization. AgriEngineering 2025, 7, 196. [Google Scholar] [CrossRef] [Scilit]
- Unigarro, C.; Hernandez, J.; Florez, H. Artificial Neural Networks for Image Processing in Precision Agriculture: A Systematic Literature Review on Mango, Apple, Lemon, and Coffee Crops. Informatics 2025, 12, 46. [Google Scholar] [CrossRef] [Scilit]
- Lestari, R.W.; Kusumiyati, K.; Mubarok, S. Comparative Analysisiof Color, Texture, and Water Content in Three Shallot Cultivars at Different Harvest Ages. Kultivasi 2025, 24, 288–297. [Google Scholar] [CrossRef] [Scilit]
- Chaisiriprasert, P.; Chuiad, K. LCAT: A Lightweight Color-Aware Transformer with Hierarchical Attention for Leaf Disease Classification in Precision Agriculture. IEEE Access 2025, 13, 128202–128215. [Google Scholar] [CrossRef] [Scilit]

Disclaimer/Publisher’s Note: The statements, opinions and data contained in all publications are solely those of the individual author(s) and contributor(s) and not of MDPI and/or the editor(s). MDPI and/or the editor(s) disclaim responsibility for any injury to people or property resulting from any ideas, methods, instructions or products referred to in the content. |
© 2026 by the authors. Licensee MDPI, Basel, Switzerland. This article is an open access article distributed under the terms and conditions of the Creative Commons Attribution (CC BY) license.