


Abstract
The Yellow River Basin is a vital agricultural and ecological region in China. In recent years, intensified livestock farming has substantially increased chemical oxygen demand (COD) as well as nitrogen and phosphorus emissions, forming a cross-media pollution chain that threatens soil, water, and air. To support sustainable development and agricultural waste utilization, this study constructs a spatiotemporal nested resource estimation model using multi-source data from 1995 to 2022. We then examine the temporal evolution and spatial clustering of livestock waste and develop a multidimensional analytical framework that integrates environmental carrying capacity, socioeconomic factors, and regional heterogeneity. Based on these data-driven assessments, we propose a three-pronged governance system—regional control, technology matching, and institutional innovation—to enable spatially adaptive and actionable solutions for basin-scale pollution mitigation, thereby supporting coordinated ecological and economic development in the Yellow River Basin.
1. Introduction
As a critical ecological security barrier and economic core area in China, the Yellow River Basin bears the dual strategic mission of ensuring national food security and maintaining ecosystem services. However, long-term high-intensity resource exploitation has severely depleted the basin’s ecological baseline, leading to severe soil erosion and widespread deep soil desiccation within the region, where soil moisture content frequently falls below 10.78% [1]. With the recent upgrading of residents’ dietary structures and the accelerated transition of animal husbandry toward intensification, livestock and poultry breeding has gradually evolved into the primary source of regional agricultural non-point source pollution. The resulting emissions of Chemical Oxygen Demand (COD) and nitrogen/phosphorus pollutants have formed a cross-media composite pollution chain threatening water, soil, and atmospheric environments [2]. Although multiple action plans have been successively introduced at the national level to promote the resource utilization of waste, existing governance frameworks face a severe “spatial mismatch” dilemma in implementation due to the neglect of significant spatial heterogeneity within the basin. Specifically, ecologically fragile areas in the upstream face environmental overloading due to grazing activities superimposed on a high-vulnerability baseline, while industrial clusters in the mid- and downstream lack energy conversion mechanisms synergistic with industrial solid waste treatment. As emphasized by Pinto et al., governance structures play a key role in performance assessment, and single technical indicators are often insufficient to address complex regulatory realities [3]. Therefore, the governance of livestock waste must balance public good attributes with system complexity, promoting a shift in governance modes from single technological breakthroughs to complex system optimization [4].
In response to this challenge, the Chinese government has successively issued the Action Plan for the Resource Utilization of Livestock and Poultry Manure and the Action Plan for the Yellow River Ecological Protection and Governance Breakthrough, establishing a target of a comprehensive utilization rate for livestock manure exceeding 80% by 2025. Nevertheless, at the level of policy implementation, existing governance frameworks face a severe “Spatial Mismatch” dilemma due to the neglect of significant spatial heterogeneity within the basin. The ecologically fragile areas in the upstream face risks of environmental overloading due to the interplay of grazing activities and high baseline vulnerability, necessitating migration mechanisms to alleviate ecological pressure; conversely, the industrial clusters in the midstream and downstream are better suited for developing industrial solid waste-to-energy conversion technologies. Regrettably, current governance modes often adopt “one-size-fits-all” homogenized measures, leading to resource misallocation and technical incompatibility, while a lack of cross-regional collaborative mechanisms makes it difficult to effectively curb the transboundary transfer of pollutants.
While existing academic research has established a solid foundation based on the “Source-Sink” theory of landscape ecology and the Social-Ecological System (SES) framework, significant limitations remain. First, regarding scale, existing studies mostly focus on macro-level total estimations or time-series forecasting of single pollution indicators, lacking micro-level precise quantification for specific geographical units, which fails to support refined governance at the basin scale. Second, in terms of methodology, although machine learning (such as Random Forest) has demonstrated advantages in processing high-dimensional nonlinear data, few studies have directly applied it to the “automatic optimization” and “pathway matching” of governance strategies. Existing decision-support tools remain largely at the stage of Descriptive Analytics, lacking a systematic framework to leap from “prediction” to Prescriptive Analytics.
To address the aforementioned “Spatial Mismatch” dilemma and the scarcity of decision tools, this study aims to construct an integrated decision-support framework that incorporates “precise resource quantification, spatiotemporal characteristic analysis, and data-driven matching of governance pathways.” Utilizing multi-source heterogeneous data from 1995 to 2022, this study systematically quantifies the evolutionary trajectory and spatial agglomeration characteristics of livestock waste. Moving beyond a singular environmental perspective, it establishes a multi-dimensional analytical system that integrates environmental carrying capacity, socio-economic levels, and regional heterogeneity. On this basis, the Random Forest algorithm is applied to precisely match differentiated governance strategies—including livestock migration, feed optimization, fertilizer utilization, and energy conversion—for 115 prefecture-level cities within the basin. This research intends to resolve the homogenization challenges in basin governance by constructing a ternary governance system that combines zonal control, technical adaptation, and institutional innovation.
This study makes four main contributions. (1) A long-term, basin-scale waste resource estimation model. We develop a spatiotemporal nested resource estimation model that integrates multi-source datasets to quantify livestock waste generation and pollutant loads in the Yellow River Basin over 1995–2022, providing a consistent basis for tracking long-run dynamics and spatial disparities. (2) An integrated diagnostic framework linking “waste supply–environmental capacity–development constraints.” We construct a multidimensional analytical framework that jointly considers environmental carrying capacity, socioeconomic conditions, and regional heterogeneity, enabling a structured diagnosis of where and why cross-media pollution risks intensify across sub-regions of the basin. (3) A data-driven prescriptive analytics pipeline for technology and governance matching. Moving beyond descriptive mapping, we translate diagnostic results into actionable recommendations by matching region-specific pollution control and waste utilization pathways under a three-pronged governance system (regional control, technology matching, and institutional innovation), thereby operationalizing spatially adaptive basin-scale management. (4) Robustness and boundary sensitivity for policy relevance. We further test the stability of key findings under alternative spatial boundary definitions (e.g., administrative versus hydrological boundaries), enhancing the credibility and transferability of the proposed policy framework. The overall research framework of this study is illustrated in Figure 1.
Figure 1.
Research Framework.
2. Literature Review
Current research on agricultural non-point source pollution and watershed governance is increasingly characterized by a multidisciplinary synthesis. This review integrates three critical dimensions of the field: the physical mechanisms of pollution migration, the institutional frameworks for governance, and the methodological advancements in decision-making. While landscape ecology “Source-Sink” dynamics provides the theoretical basis for understanding pollutant movement, the management of these processes requires robust social-ecological frameworks and economic mechanisms such as Horizontal Ecological Compensation. Furthermore, the rapid evolution of artificial intelligence offers new paradigms for moving from descriptive analysis to prescriptive optimization. This section reviews these theoretical and methodological foundations while identifying key gaps in cross-scale quantification, institutional design, and the application of machine learning for strategic path matching.
2.1. Landscape Ecological Foundations and Pollution Quantification Challenges
The formation and migration of agricultural non-point source pollution are driven by complex landscape ecological processes. The core mechanisms of these processes can be effectively elucidated using the classic “source-sink” landscape theory. Based on the principles of material migration, landscape units are categorized into two distinct types: “sources,” which encompass land-use types that facilitate the generation and export of pollutants, and “sinks,” which refer to areas capable of intercepting, transforming, or retaining pollutants [5]. Applying this theory to map pollution migration pathways establishes a critical foundation for watershed governance; specifically, the precise quantification of key pollution sources—most notably livestock and poultry waste—is a prerequisite for effective intervention.
However, a critical limitation in current research is the “scale mismatch.” Existing studies have predominantly focused on total volume estimation at the macro scale or concentration prediction in the temporal dimension. For instance, Wang et al. relied primarily on macro-statistical data to explore the impact of livestock manure on soil acidification and N2O emissions [6], while Bekrik et al. and Zhang et al. employed similar datasets to estimate livestock manure biomass in Kenya and China, respectively [7,8]. These macro-level approaches often fail to align with specific geographic units, lacking the spatial resolution necessary for precision governance at the watershed level.
2.2. Theoretical Frameworks for Governance and Institutional Mechanisms
Watershed governance is fundamentally the management of human-land relationships. Ostrom’s Social-Ecological Systems framework provides the meta-theoretical support for understanding this complexity. This framework posits that governance performance is determined by the dynamic matching and interaction between Resource Systems, Governance Systems, and Actors [9]. Within this context, recent scholarship has increasingly integrated Circular Bioeconomy theory, arguing that waste governance must transcend simple “end-of-pipe” reduction. Instead, it should shift towards value creation based on “Cascading Use,” conceptualizing livestock manure not as waste, but as a critical feedstock for bio-fertilizer and bio-energy production [10,11,12].
At the institutional level, Horizontal Ecological Compensation has emerged as a core policy instrument in China to address externalities between upstream and downstream areas. Empirical studies evaluating Horizontal Ecological Compensation practices in the Yellow River and Yangtze River basins have confirmed their efficacy in fostering transboundary cooperation [13,14,15]. Despite these successes, the literature identifies risks of “institutional failure” in current mechanisms. First, compensation standards remain singular and overly simplistic, relying mostly on water quality cross-section assessments while neglecting a comprehensive quantification of Ecosystem Service Value and the development opportunity costs borne by upstream regions [16]. Second, compensation modes are predominantly characterized by “blood transfusion”, lacking distinct market-based “hematopoietic” mechanisms—such as carbon trading or pollution rights trading—that could sustain long-term ecological value realization [17].
2.3. Methodological Paradigm Shift: From Predictive Analytics to Decision Support
As environmental management enters the era of “Big Data + Artificial Intelligence,” decision-making methodologies are undergoing a profound transformation. Theoretically, this represents a paradigm shift from “Descriptive Analytics” to “Prescriptive Analytics” [11]. Among various algorithms, Random Forest (RF) has gained widespread adoption in the environmental domain due to its efficacy in handling high-dimensional, nonlinear, and multi-source heterogeneous data. Recent literature indicates that RF exhibits superior generalization capabilities and robustness with small-sample data compared to traditional regression models and even certain deep learning architectures, such as Artificial Neural Networks [15]. This superiority has been demonstrated in applications ranging from predicting municipal solid waste generation [12], assessing water quality indices [13], and simulating the environmental effects of livestock and poultry farming [14].
Crucially, in contrast to the “black box” nature of deep learning, RF offers enhanced interpretability through Feature Importance evaluation. This attribute is vital for environmental policy-making, as decision-makers require an understanding of the underlying rationale—the “why”—behind specific recommendations [18]. However, existing studies remain largely confined to utilizing Machine Learning (ML) for the “prediction” of environmental indicators. There is a paucity of research that directly employs ML algorithms for the “automatic optimization” and “path matching” of governance strategies [19].
In summary, while the “source-sink” theory provides a physical basis for understanding pollution migration, and the SES framework offers a theoretical guide for institutional design, there remains a disconnect between spatial diagnostics and policy implementation. Current research effectively estimates pollution at macro scales and evaluates existing compensation mechanisms, but it struggles to downscale these insights to specific geographic units or optimize governance paths dynamically. Furthermore, although Machine Learning has proven powerful for environmental prediction, its potential for “Prescriptive Analytics”—specifically in matching governance strategies to local ecological conditions—remains largely untapped. Therefore, an integrated approach that combines micro-scale spatial analysis, market-based institutional innovation, and interpretable AI optimization is urgently needed to achieve precision watershed governance.
3. Materials and Methods
This section of the paper focuses on the spatiotemporal characterization of resource-oriented governance for livestock and poultry breeding waste in the Yellow River Basin. The goal is to establish a data foundation for pollution control decision-making through systematic quantification. The spatial units include 115 prefecture-level cities across nine provinces within the basin, integrating multi-cavalcade data for 1995–2022. Multi-source heterogeneous data fusion technology was applied to construct a basin-wide database. Methodologically, a regionally calibrated theoretical biomass resource quantification model was developed for livestock waste. Refined pollution source accounting was achieved by differentially calibrating key parameters, including regional-specific excretion coefficients, breeding cycle abjurations, and dry matter content. This framework was further augmented by a land carrying capacity assessment model coupling soil nutrient demands, manure assimilation potential, and environmental capacity thresholds. This uncovered spatial imbalances in crop-livestock system material cycling. Concurrently, the study systematically evaluated cross-media migration pathways of heavy metals, antibiotics, and pathogens from livestock waste, assessing their compound stress effects on soil, aquatic, and atmospheric systems. These analyses provide scientifically robust and operationally actionable baseline data to optimize data-driven governance pathways. This effectively bridges pollution characterization and decision-making frameworks.
3.1. Research Objects
The Yellow River Basin (95°53′45″ E–119°12′48″ E, 32°09′33″ N–41°50′20″ N) spans approximately 1900 km east–west and 1100 km north–south, with a mainstream length of 5464 km and a drainage area of 752,400 km2. The basin originates from the Yoguzonglie Basin on the northern slope of the Bayan Har Mountains and flows into the Bohai Sea at Kenli County, Shandong Province. The nine regions include Qinghai, Sichuan, Gansu, Ningxia, Inner Mongolia, Shaanxi, Shanxi, Henan, and Shandong. Figure 2 shows the areas through which the river flows.
Figure 2.
Geographic Scope of Study.
The geographical pattern of the basin has a pronounced three-stage geomorphological gradient. First, the upper reaches are dominated by pastoral regions on the Qinghai–Tibet Plateau, with an elevation exceeding 3000 m. The region has frigid climatic conditions and abundant lakes and marshes, and the river systems are predominantly recharged by glacial meltwater. The area has exceptional water conservation functionality, but its ecosystem remains critically fragile. Second, the middle reaches transition through the Loess Plateau as an agro-pastoral transition zone; the area features crisscrossing gullies, severe soil erosion, and concentrated high-intensity rainfall. This increases the river’s sediment levels, making it the main source of the Yellow River’s silt. Third, the lower reaches are an intensive farming zone with low-lying terrain and broad river channels. These rivers have sluggish flow velocities, resulting in heavy sedimentation and forming a suspended river. There is a high degree of agricultural development, mainly focusing on crop farming with well-developed irrigation agriculture.
It should be noted that although the natural hydrological boundaries of the Yellow River Basin do not perfectly overlap with the administrative boundaries of the nine provinces, this study adopts the administrative scope of these nine provinces and their 115 prefecture-level cities as the research unit. This selection is necessitated by two critical factors: first, the consistency of long-term socioeconomic statistical data (1995–2022), which is strictly recorded and released by administrative units; and second, the operational reality that pollution governance policies and fiscal transfers are implemented by local administrative governments. Thus, aligning the research scope with administrative boundaries ensures both the reliability of temporal data and the practical applicability of policy recommendations.
3.2. Data Sources
The municipal-level data used in this study include livestock and poultry inventories, year-end resident population, gross output value of the primary industry, gross regional product, total sown area of crops, and nature reserve area. These data are from official documents from national and provincial departments from 2013 to 2022, including the Henan Statistical Yearbook, Shandong Statistical Yearbook, Shanxi Statistical Yearbook, Shaanxi Statistical Yearbook, Inner Mongolia Statistical Yearbook, Ningxia Statistical Yearbook, Sichuan Statistical Yearbook, Gansu Statistical Yearbook, and Qinghai Statistical Yearbook. Provincial-level livestock and poultry data are from statistical records published by the National Data Bureau website from 1995 to 2022. The studied categories of livestock and poultry include pigs, cattle, horses, donkeys, mules, sheep, poultry, and rabbits. To address the missing data regarding livestock and poultry waste biomass in Hulunbuir City, Hinggan League, and Wuhai City of the Inner Mongolia Autonomous Region for the year 2017, this study performed imputation using linear interpolation based on the arithmetic mean of the data from 2016 and 2018.
3.3. Estimation Methods
3.3.1. Theoretical Biomass Resource Quantity
The theoretical levels of livestock and poultry waste biomass production were calculated using the method specified in the Technical Code for Investigation and Evaluation of Biomass Energy Resources [20]. This estimation was based on the quantities of different types of livestock and poultry, breeding cycles, excretion coefficients, and dry matter content.
In Equation (1), the theoretical amount of livestock and poultry farming waste biomass in the region is represented by ; represents the type of livestock and poultry breeding species, ; represents the breeding quantity of the species (measured in head or number), where annual stock data is used for species with breeding cycles exceeding 365 days, and slaughter volume is used for species with cycles shorter than 365 days; represents the breeding cycle of the type of livestock and poultry; represents the manure excretion coefficient of the type of livestock and poultry; and represents the dry matter content of the type of livestock and poultry breeding waste.
The excretion coefficients for different livestock types were derived from the Manual of Emission and Discharge Coefficients for Livestock and Poultry Breeding in the First National Pollution Source Census [21] and regionally modified values established in other studies [22,23,24]. The breeding cycle refers to research by Bao et al. [25], and the dry matter content values of livestock and poultry breeding waste were obtained from Zhang et al. [26] and Chen et al. [22]. The energy potential of livestock and poultry waste was estimated based on the theoretical production of manure, the collection coefficient, and the standard coal coefficient.
The energy reserve potential of livestock and poultry waste was estimated based on the theoretical production quantity of animal manure, collection coefficient, and coal equivalent conversion coefficient.
In Equation (2), represents the theoretical biomass resources of livestock and poultry waste in the study area ; represents the collection coefficient of the type of livestock and poultry breeding waste; and represents the coal equivalent conversion coefficient of the type of such waste.
Table 1 lists the key parameters involved in calculating the theoretical biomass resources in the study area, such as the type of livestock and poultry, the breeding cycle, and the excretion proportion coefficient. The collection coefficients for livestock and poultry breeding waste were derived from previous studies [22,27], and the coal equivalent conversion coefficients referenced the China Energy Statistical Yearbook 2022 [28] and other research [29].
Table 1.
Key parameters in calculating theoretical biomass resources.
3.3.2. Estimation of Land Carrying Capacity
The regional land carrying capacity for livestock and poultry breeding waste was calculated using the Technical Guide for Calculating Land Carrying Capacity [30]. This refers to the maximum number of allowable livestock inventory (expressed in swine equivalents) sustainably supported by the cultivated land, forestland, and grassland in a given region for a sustainable land ecosystem to function.
The land carrying capacity for livestock and poultry manure in a region was identified as being equal to the nutrient demand of regional plants for manure fertilizer, divided by the nutrient supply of manure fertilizer per unit of pig equivalents (calculated in pig equivalents). The nutrient demand of manure fertilizer for regional plants was determined based on soil fertility, crop types, yields, and the proportion of manure fertilizer application. The nutrient supply of manure fertilizer was determined based on the amount of livestock breeding, the amount of generated manure nutrients, and manure collection and treatment methods.
The regional plant nutrient demand was calculated based on the N and P requirements of all vegetation categories within the study area, including crops, constructed forage, and forest land. The calculation methodology is expressed as follows:
In Equation (3), represents the plant nutrient demand within the study area; represents the total plant nutrient demand within the study area; refers to the specific crop category; represents the total yield of the type of plant category (in 10,000 tons); represents the nutrient requirement per unit yield of the plant type. The appropriate N and P requirements per unit yield for different plant categories were obtained using soil nutrient analysis and field trials in the target region. This study adopted the methodology proposed by Liu [31].
The regional plant manure nutrient demand was calculated based on the proportion of TN and TP requirements requiring manure fertilizer under varying soil fertility conditions, the manure contribution ratio to total fertilization inputs, and the manure utilization efficiency in a specific season. The Equation is as follows:
In Equation (4), represents the regional plant manure nutrient demand; represents the proportion of fertilizer-supplied nutrients; and represents the region-specific utilization efficiency of manure fertilizer.
Table 2 shows the recommended nutrient levels for different crops. The proportion of fertilization-supplied N/P was determined based on soil N/P fertility. In this study, the fertilization proportion was set at 45%. The recommended range for the nitrogen utilization efficiency in manure fertilizer is 25–30%; this study adopted the midpoint value of 27.5%. Similarly, the recommended range for phosphorus utilization is 30–35%; the study adopted the midpoint value of 32.5%.
Table 2.
Recommended Nutrient Application Rates for Different Crops.
The nutrient supply from livestock and poultry breeding waste, and COD, TN, and TP production is calculated as follows:
In Equation (5), represents the TN/TP production (10,000 tons); and represents the pollution production and discharge coefficient for the type of livestock and poultry . Table 3 shows the pollution coefficient values for different livestock and poultry animals. The pollutant production and discharge coefficients for different livestock categories are from China’s Manual of Emission and Discharge Coefficients for Livestock and Poultry Breeding in the First National Pollution Source Census [21] and regional correction values established in other studies [22,23,24].
Table 3.
Pollution Coefficients for Livestock and Poultry.
Although this study has conducted regionalized calibration on excretion coefficients and pollutant generation coefficients (COD, TN, TP) based on the characteristics of different geographical zones to approximate actual levels as closely as possible, these parameters may still exhibit certain variability in practical application. This is due to constraints regarding the completeness of data in existing literature, as well as the micro-level heterogeneity of breeding management modes and the impact of climate fluctuations. While this may exert a certain influence on the estimation accuracy of pollution loads in localized micro-areas, it does not alter the overall spatial differentiation patterns at the macro-watershed scale.
4. Results
This section investigates the resource characteristics and environmental implications of livestock and poultry waste in the Yellow River Basin (YRB) to systematically elucidate spatiotemporal differentiation patterns and the mechanisms underlying pollution risks. Based on multi-source heterogeneous data covering 115 prefecture-level cities across nine provinces in the YRB from 1995 to 2022, the temporal evolution of the theoretical biomass resource potential and its driving factors was quantitatively evaluated. These evolutionary trends reflect the dynamic coupling effects of regional economic development, policy regulation, and technological upgrading on resource fluctuations.
Furthermore, through provincial clustering analysis and the deconstruction of compositional characteristics, the spatial correspondence between dominant waste categories and industrial structures across different geographical gradients is examined. The analysis characterizes the resource distribution heterogeneity and the underlying eco-economic drivers in regions dominated by herbivorous livestock, mixed farming systems, and specific compositional profiles. By identifying zones of pollution overload and ecological sensitivity, this study provides critical scientific evidence and data support for the differentiated design of governance pathways and data-driven decision-making.
4.1. Overall Characteristics of Biomass Resources
Based on statistical data from 1995 to 2020, this study systematically quantifies the theoretical potential and analyzes the spatiotemporal evolution of livestock and poultry waste biomass resources in the Yellow River Basin (YRB). The results demonstrate that over the 26-year study period, the total resource volume exhibited significant phased fluctuations rather than a monotonic linear trend of growth or decline. The overall evolutionary trajectory followed a complex pattern characterized by “sharp contraction–rapid escalation–oscillatory adjustment–steady decline–restorative growth,” corresponding to the dynamic long-term adjustments in the production scale and structure of regional animal husbandry. Throughout this period, the theoretical resource volume in the basin ranged from a minimum of approximately 161 million tons in 1996 to a peak of approximately 231 million tons in 2005. The observed range of 70 million tons suggests substantial elasticity in the potential resource supply. Figure 3 illustrates the average distribution of the theoretical biomass quantity and energy potential of livestock and poultry waste.
Figure 3.
(a) Theoretical Biomass Resources from Livestock and Poultry Waste; (b) Energy Reserves from Livestock and Poultry Wastes.
Specifically, the first stage (1995–1996) was defined by a sharp contraction in resource volume. In 1995, the total volume stood at a high level of 211 million tons but dropped to 161 million tons in 1996, a year-on-year decrease of 23.86%. This precipitous decline interrupted the prior steady state, coinciding with a significant clearance of livestock production capacity. Subsequently, the second stage (1997–2005) witnessed a robust nine-year growth phase. Biomass resources rose continuously from 178 million tons, maintaining a high average annual growth rate, to reach a historical peak of 231 million tons in 2005. A distinct feature of this stage was the rapid volume accumulation, consistent with an unprecedented expansion in the scale of livestock farming within the YRB during this period.
The year 2006 marked the onset of the third stage, involving a structural correction where resource volume decreased by 19.36% year-on-year to 187 million tons. From then until 2016, the resource volume in the YRB entered a decade-long relative plateau. During this interval, annual generation fluctuated within a narrow band (185–194 million tons), remaining below the 2005 peak. These trends signify that regional livestock development has entered a “new normal” of inventory adjustment and capacity stabilization. The fifth stage (2017–2019), subject to multiple external perturbations, exhibited a renewed downward trend, declining from 175 million tons in 2017 to a trough of 171 million tons in 2019. In the final year of the study period (2020), data exhibited signs of a rebound, with the theoretical resource volume rising to 182 million tons—a 6.21% increase over 2019—potentially marking the onset of a capacity recovery cycle. Overall, the evolution of livestock and poultry waste biomass resources in the YRB is characterized by distinct periodicity and volatility. These macro-quantitative features establish the baseline variations in agricultural non-point source pollution control pressure across different periods.
4.2. Provincial Characteristics of Theoretical Biomass Resources
Based on panel data from 1995 to 2020, the theoretical potential of livestock and poultry waste biomass resources across the nine provinces of the Yellow River Basin (YRB) exhibited significant spatial disequilibrium and asynchronous evolutionary trajectories. In terms of spatial distribution, resource endowments presented highly concentrated “oligarchic” characteristics. Using data from 2020 as a reference, Shandong Province, Inner Mongolia Autonomous Region, and Sichuan Province ranked as the top three, with theoretical resource volumes of 43.3065 million tons, 35.4447 million tons, and 33.0379 million tons, respectively. Collectively, they accounted for 61.48% of the basin’s total, constituting the “core growth pole” of livestock biomass resources. In contrast, the resource volumes in Ningxia Hui Autonomous Region, Shaanxi Province, and Shanxi Province remained relatively low, all falling below the 8 million-ton level. Notably, Ningxia recorded only 4.8258 million tons, indicating a substantial disparity in the resource carrying baseline within the basin. Figure 4 illustrates these trends in biomass energy from livestock and poultry waste.
Figure 4.
Trends in Biomass Energy from 1995 to 2022. (HA: Henan Province; NM: Inner Mongolia Autonomous Region; SD: Shandong Province; SX: Shanxi Province; SN: Shaanxi Province; GS: Gansu Province; QH: Qinghai Province; NX: Ningxia Hui Autonomous Region; SC: Sichuan Province.).
Regarding long-term temporal evolution, the provinces did not exhibit homogeneous growth or decline but instead diverged into two distinct evolutionary patterns. The first pattern, characterized by an “inverted U-shape” or fluctuating decline, was primarily observed in traditional agricultural regions such as Henan, Shandong, Sichuan, Shanxi, and Shaanxi. Most of these provinces reached their historical resource peaks in 2005, subsequently entering a phase of long-term inventory adjustment or decline. Henan Province exemplified the most typical recession trajectory; its resource volume climbed from 41.8255 million tons in 1995 to a peak of 53.0240 million tons in 2005 before initiating a continuous downward cycle to 20.3014 million tons by 2020—a decline of 61.71%. Consequently, its resource ranking within the basin dropped from second to fourth. Although Shandong Province consistently maintained the leading position in total resources, its 2020 figure contracted by 26.84% compared to the 1995 high of 59.1936 million tons, corresponding to a structural reduction in livestock production capacity in these regions.
The second pattern is characterized by continuous growth or a steady rise, mainly distributed in northwestern regions, including Inner Mongolia, Gansu, Qinghai, and Ningxia. Unlike the inventory contraction in the mid- and downstream provinces, these regions demonstrated strong potential for resource accumulation. The growth momentum in the Inner Mongolia Autonomous Region was notably significant; its theoretical resource volume steadily climbed from 23.1384 million tons in 1995 to 35.4447 million tons in 2020, maintaining a positive average annual growth rate and surpassing Sichuan and Henan provinces to become the second-largest resource province in the basin. Although Ningxia Hui Autonomous Region had the smallest volume, it exhibited the highest relative growth rate, increasing from 2.3352 million tons in 1995 to 4.8258 million tons in 2020, effectively doubling its resource volume. This spatial reconfiguration, characterized by an “increase in the Northwest and decrease in the Southeast,” suggests that the center of gravity of livestock waste resources in the YRB is gradually shifting from the traditional farming areas in the lower reaches to the grassland pastoral areas and the farming-pastoral ecotones in the upper reaches.
4.3. Composition Characteristics of Livestock and Poultry Waste
Based on 2020 statistical data regarding livestock and poultry waste biomass source structures in the Yellow River Basin (YRB), the provinces demonstrated significant spatial heterogeneity and diverse resource compositions. According to the contribution rates of dominant livestock species and the similarity of biomass composition, the nine provinces in the basin can be categorized into three typical resource distribution patterns: the Herbivore-Dominated Pattern, the Intensive Single-Species Dominated Pattern, and the Multi-Source Mixed Pattern. This structural differentiation corresponds to variations in natural resource endowments across different geographical units and characterizes the specialized division of labor in the regional agricultural industrial layout. Figure 5 illustrates the composition of livestock and poultry waste in each province.
Figure 5.
Composition of Livestock and Poultry Waste. Note: YRV: Yellow River Basin Total.
The Herbivore-Dominated Pattern is primarily distributed in the upper reaches of the Yellow River and the inland northwest regions, covering Qinghai Province, Ningxia Hui Autonomous Region, Gansu Province, and Inner Mongolia Autonomous Region. Biomass resources in these areas rely heavily on herbivorous livestock such as cattle and sheep, with their combined contribution rate generally exceeding 90%, aligning with the characteristics of the “Grain-to-Fodder” policy or pure pastoral zones. Specifically, Qinghai Province exhibits alpine pastoral features; its cattle manure resources account for 69.74%—the highest in the basin—superimposed with 28.16% from sheep manure, constructing a near-singular herbivore waste source system. Ningxia and Gansu display similar dual-dominant structures; Ningxia is dominated by cattle (61.39%), while Gansu presents a balanced distribution between cattle (48.09%) and sheep (45.23%). As a traditional animal husbandry base, Inner Mongolia’s sheep manure contribution reached 47.10%, which, together with cattle manure (43.43%), constitutes the cornerstone of the region’s biomass resources, whereas the proportion of waste from grain-consuming livestock (e.g., pigs and poultry) is negligible.
The Intensive Single-Species Dominated Pattern and the specialized diversified pattern are observed mainly in the downstream and southwest regions, typically represented by Shandong Province and Sichuan Province. Shandong’s biomass resource structure exhibits a high degree of “de-herbivorization” and a unipolar agglomeration of poultry. The proportion of poultry waste reaches 66.99%, far exceeding other provinces in the basin, while the shares of pigs, cattle, and sheep are limited to approximately 10% or lower. This distribution is consistent with the province’s industrial agglomeration effect as a national base for poultry breeding and processing. In contrast, Sichuan Province’s resource composition highlights unique regional characteristics. Although cattle (45.41%) and pigs (22.12%) still occupy important positions, the proportion of rabbit manure reaches 6.82%, significantly higher than in other provinces (mostly below 1% or negligible). This forms a distinct “Cattle-Pig-Rabbit” tripartite resource spectrum, associated with the province’s developed rabbit meat consumption market and breeding tradition.
The Multi-Source Mixed Pattern is concentrated in the farming-pastoral ecotones and traditional agricultural areas of the middle reaches of the Yellow River, including Henan, Shaanxi, and Shanxi provinces. The resource composition in this region is relatively balanced, lacking a single dominant livestock species, which typifies the complex agricultural feature of coexisting crop farming and diverse animal husbandry. As a major agricultural province, Henan displays the most dispersed resource distribution; the gradient of waste proportions among cattle (36.36%), sheep (24.01%), pigs (22.95%), and poultry (16.05%) is small, suggesting comprehensive livestock development. Shaanxi and Shanxi show transitional characteristics leaning towards herbivorous livestock; the combined proportion of cattle and sheep waste in both provinces is around 70%, yet they retain a share of approximately 10% to 17% for pigs and poultry. This mixed resource structure indicates that selecting waste governance pathways in this region requires simultaneous consideration of the physicochemical properties of different manure types and the adoption of more comprehensive technical routes.
4.4. Main Pollution Characteristics of Livestock and Poultry Waste
During livestock and poultry feeding, heavy metal elements (e.g., copper, zinc, and arsenic) added to feedstocks cannot be fully absorbed and used by livestock and poultry. Applying untreated manure fertilizers therefore releases toxic substances into soil environments, including heavy metals, antibiotics, and pathogenic microorganisms. Studies have found significantly increased heavy metal levels in soils amended with livestock and poultry manure; for example, 69% of Cu and 51% of Zn, respectively, measured in China’s agricultural soils originate from the direct land application of untreated livestock and poultry waste [34]. Further, livestock and poultry manure are rich in ARGs (Antibiotic Resistance Genes) and ARB (Antibiotic-Resistant Bacteria), which help spread antimicrobial resistance. Sulfonamides, tetracyclines, quinolones, macrolides, and other antibiotics have been detected in manure-amended soils across China [35]. Long-term accumulation of hazardous substances induces soil contamination and elevates disease risks for crops and livestock, potentially threatening human health through food chain transmission.
The Yellow River Basin has pronounced spatial heterogeneity in soil contamination, with an overall severe pollution status. Figure 6 shows the average values of the N and P pollution coefficients of livestock and poultry waste from 2018 to 2022. The analysis of pollution coefficients indicates that multiple provinces within the basin experience different degrees of soil pollution. Particularly high pollution levels are seen in specific areas in Qinghai Province, Sichuan Province, and the Inner Mongolia Autonomous Region. In the Golok Tibetan Autonomous Prefecture of Qinghai Province, the N coefficient value reaches 22,417.53, and the P coefficient value reaches 4220.56. In Sichuan Province, the Aba Tibetan and Qiang Autonomous Prefecture has a N coefficient value of 127.70 and a P coefficient value of 40.57. The Garzê Tibetan Autonomous Prefecture has an N coefficient value of 231.21 and a P coefficient value of 75.03.
Figure 6.
(a) Average N Pollution Coefficient; (b) Average P Pollution Coefficient.
The soil contamination problems in this region are primarily due to the vulnerability of plateau ecosystems, compounded by anthropogenic factors such as overgrazing and ineffective agricultural practices. These activities elevate soil exposure risks, increasing land degradation and soil contamination levels. The Inner Mongolia Autonomous Region also shows high pollution coefficients, with the Xilingol League having a N coefficient value of 45.73 and a P coefficient value of 9.48, and Wuhai City with a N coefficient value of 7.60 and a P coefficient value of 1.98. The high pollution coefficients in the Xilingol League are due to long-term overgrazing, irrational reclamation, and indiscriminate mining activities; these have substantially reduced vegetation coverage, compromised soil structural integrity, and facilitated pollutant infiltration. Wuhai City is an energy and heavy chemical industrial base; it has experienced severe soil erosion and diminished nitrogen-phosphorus retention capacity through prolonged large-scale coal mining, washing, and chemical production.
From a geographic distribution perspective, high-value pollution zones are mainly in the ecologically sensitive regions and resource-based cities in the upper reaches of the Yellow River Basin. For instance, in plateau areas such as the Haibei Tibetan Autonomous Prefecture in Qinghai Province, the N coefficient value is 97.77; in the Huangnan Tibetan Autonomous Prefecture, the N coefficient value is 293.42; and in the Gannan Tibetan Autonomous Prefecture in Gansu Province, the N coefficient value is 101.07. These high pollution indices are related to the release of heavy metals through natural weathering and the intensification of soil erosion due to grazing activities.
The industrial-intensive areas in the middle and lower reaches of the basin also show significant pollution. For example, in Shandong Province, Dongying City has a N coefficient value of 6.79 and a P coefficient value of 4.30; Weifang City has an N coefficient value of 6.38 and a P coefficient value of 5.19; and Rizhao City has an N coefficient value of 6.82 and a P coefficient value of 5.27. These pollution levels highlight the impact of industrialization and urbanization on the soil environment. Moreover, in Shanxi Province, Taiyuan City has an N coefficient value of 23.88 and a P coefficient value of 8.14; and Lvliang City has an N coefficient value of 8.16 and a P coefficient value of 2.13. Some agriculture-dominated regions have lower pollution levels. For example, Xinyang City in Henan Province has an N coefficient value of 1.52 and a P coefficient value of 0.44; and Xianyang City in Shaanxi Province has an N coefficient value of 1.72 and a P coefficient value of 0.43. These N coefficients are slightly above the threshold, but their P coefficients do not exceed the standard. This reflects the potential risk of agricultural non-point source pollution.
Soil contamination governance in the Yellow River Basin needs to be closely integrated with regional pollution characteristics and ecological-economic structures. To respond to the high pollution distributions in the upstream ecologically fragile areas and resource-intensive cities, this study proposes a systematic remediation framework with four strategies: livestock migration, feed formulation optimization, fertilizer-oriented utilization, and energy-oriented waste valorization.
In ecologically fragile plateau zones, such as Golog and Huangnan in Qinghai Province, the high pollution coefficients are closely related to soil erosion and heavy metal accumulation caused by grazing activities. Scientifically planning livestock migration routes may alleviate pasture overloading pressures while reducing surface disturbance and pollutant dispersion risks. Concurrent feed structure optimization lowers nitrogen-phosphorus loads in animal excreta, enabling non-point pollution source control.
For industrial clusters in the mid-lower reaches of the basin, promoting energy-oriented agricultural waste utilization technologies has dual benefits: mitigating secondary soil contamination from organic pollutant stockpiling and substituting fossil fuels to reduce carbon footprint pressure on soils. In agricultural-dominant areas, advancing fertilizer-oriented organic waste recycling increases soil organic matter content to improve pollutant adsorption and immobilization capacity. This also reduces chemical fertilizer usage to block nitrogen-phosphorus leaching pathways. This study’s framework uses spatially differentiated regulation and industrial metabolism optimization to systematically couple ecological conservation with resource circularity. This provides multi-scale solutions to prevent and control soil pollution across the Yellow River Basin.
5. Discussion
This section of the paper focuses on constructing and validating a multi-path data-driven decision-making system for resource-oriented livestock and poultry waste management in the Yellow River Basin. This breaks through the traditional single environmental governance paradigm and explores differentiated management solutions that optimize the synergies possible from considering economic, environmental, and societal multi-dimensional objectives. Based on the preceding analyses of pollution source characteristics, spatiotemporal differentiation patterns, and environmental effects, this section integrates environmental carrying capacity, socioeconomic conditions, and regional heterogeneity indicators to construct a data-driven adaptation framework. The framework includes four management paths: livestock relocation, feed optimization, fertilization, and energy utilization.
The study applies a random forest classification algorithm, using 115 prefecture-level cities in the Yellow River Basin to establish a management strategy classification model based on multi-dimensional spatial attribute variables. The study uses feature importance analysis and model generalization capability validation to reveal the decision-making mechanisms of key driving factors and their interactive effects on management path selection. The research further quantifies the synergistic contributions of different management paths to N and P pollution reduction, resource recycling efficiency, and economic benefits through nested spatiotemporal pollution load simulation and reduction efficiency assessment. The approach verifies the spatial adaptability and policy operability of the model using a confusion matrix and classification accuracy indicator system.
5.1. Resource-Based Governance Pathways
5.1.1. Livestock Migration
To strategically optimize livestock and poultry breeding layouts, livestock relocation is a key measure to effectively alleviate the environmental carrying capacity in the original breeding areas by transferring the breeding communities to areas with strong environmental carrying capacity. For ecologically fragile zones and high-pollution load regions, systematically reconfiguring breeding spatial layouts can achieve sustainable development through crop-livestock integration and establishing agro-pastoral circular systems. Bai et al. [36] showed that optimizing livestock geographic distribution significantly reduces ammonia emission exposure risks. County-level simulations across 2300 administrative units found that relocating 10 billion heads of livestock and poultry from eastern and southern China to northeastern and northwestern regions, based on crop-livestock spatial synergy theory, could reduce the population exposed to ammonia nitrogen emissions by 90% and reduce nitrogen emissions by two-thirds.
5.1.2. Feed Structure Optimization
Optimizing feed formulations involves scientifically proportioning feed components to reduce nitrogen, phosphorus, and other nutrient emissions in livestock and poultry waste. Rationally adjusting the ratios of protein, amino acids, and mineral elements in feed can significantly lower N and P levels in breeding waste, alleviating soil and water body pollution. Tsujikawa et al. [37] found that optimizing feed structures reduces N and P emission intensities from livestock waste. Their study showed that supplementing swine feed with 15% kelp stems increased lactic acid bacteria abundance in the porcine gut by 37% and increased short-chain fatty acid production by 28%. Malimi et al. [38] also found that nutritional regulation technologies decreased N excretion by 30%. The resourceful utilization of food processing by-products can achieve a positive nutrient cycle supporting both livestock farming and crop cultivation.
5.1.3. Fertilization Utilization of Breeding Waste
Converting livestock and poultry waste into fertilizer involves transforming manure into organic fertilizers for agricultural applications through composting and fermentation technologies. Common fertilization processes include windrow composting, in-vessel composting, and reactor-based fermentation. Khder et al. [39] found that synergistically applying chicken manure compost and plant growth-promoting rhizobacteria (PGPR) can increase the fruit soluble solid content to 18.7. Wang et al. [40] found that adding a mixture of zeolite, wood vinegar, and biochar during swine manure composting significantly reduced ammonia volatilization, greenhouse gas emissions, and nitrogen losses. Awasthi et al. [41] suppressed gaseous emissions and increased carbon-nitrogen sequestration during composting by incorporating biochar and microbial inoculation. This mitigated carbon and nitrogen losses.
5.1.4. Energy Utilization of Breeding Waste
Energy utilization technologies for livestock and poultry waste include multidimensional thermochemistry and biological conversion pathways. Anaerobic digestion technology can convert livestock and poultry manure into biogas to generate power or to be purified into bio-natural gas. The resulting biogas residue and slurry can be further processed into organic fertilizers. Hydrothermal carbonization technology can transform organic waste into dense, high-energy, and stable biochar. Gasification combustion technology can convert solid waste into syngas, which can be used to generate power or supply heat.
Biodiesel production technology uses catalytic conversion to transform fatty acids and oils into better combustion performance and environmentally friendly biodiesel through catalyst conversion. Li et al. [42] found that high-temperature pretreatment increases the COD solubility of pig manure by 24.57% and increases methane yield by 28.76%, providing technical support for large-scale applications. Qamar et al. [43] discovered that under optimal oxygen conditions, biochar conversion efficiencies of cattle manure and poultry litter reached as high as 58% and 57%, respectively. Yields decreased as pyrolysis temperature increased. This technology enables large-scale animal manure reduction and leverages biochar’s application potential in ecological environments. Anukam et al. [44] proposed a gasification combustion technology that initiates partial oxidation and molecular dissociation at high temperatures (800–1000 °C), converting energy stored in biomass into clean syngas. Kim et al. [45] introduced a thermochemical non-catalytic transesterification reaction, where lipid extracts rapidly react with methanol and porous silica material at elevated temperatures (200–400 °C) to produce biodiesel. The transesterification of pig manure lipids achieved biodiesel yields exceeding 90% under conditions of 360 °C or higher. The substitution of fossil fuels with biomass can significantly reduce the carbon dioxide emission intensity. While facilitating the regional transition to low-carbon energy, it can also effectively enhance the autonomy and sustainability of the regional energy supply system [46]. Figure 7 shows the technology roadmap associated with the four management methods.
Figure 7.
Technology Roadmap.
5.2. Selection of Research Methods and Result Validation
5.2.1. Research Method Selection
Random Forest is an ensemble learning method that increases model accuracy and stability by constructing multiple decision trees and aggregating their predictions. Proposed by Leo Breiman [47], this method applies the bootstrap aggregating (bagging) technique to draw multiple samples from the dataset. To address the classification task of governance paths in the Yellow River Basin—a typical problem involving a complex Social-Ecological System—this study selects the Random Forest (RF) model, primarily due to its nonlinear mapping capabilities and interpretability advantages when processing multi-source heterogeneous data. In terms of model advantages, RF effectively mitigates the risk of overfitting through ensemble learning strategies and captures complex nonlinear interactions among multidimensional economic-environmental factors; its built-in feature importance evaluation mechanism reveals the driving weights behind decisions, providing critical causal transparency for policy formulation. Regarding the correction of algorithmic limitations and remaining challenges, given the original RF algorithm’s sensitivity to extreme skewness in feature distributions, this study introduced the Box–Cox generalized power transformation to conduct targeted preprocessing on variables with significant long-tail characteristics, such as GDP and R&D investment. This structural correction effectively compensated for the model’s deficiencies in handling highly skewed data. Nevertheless, this study acknowledges that the discretization of continuous variables by RF results in a certain sensitivity at critical feature thresholds. This explains the classification instability observed in certain samples located within climate transition zones, as well as the model’s limited capability to extrapolate to extreme scenarios outside the range of the training data. On balance, the RF model, following adaptive data corrections, remains the optimal choice for balancing prediction accuracy with logical interpretability in the current context.
5.2.2. Indicator Parameter Selection
This study’s selected indicator system addresses core challenges in livestock and poultry manure pollution governance across three dimensions: environmental carrying capacity, socioeconomic conditions, and regional heterogeneity; the specific indicators are shown in Table 4. Data selection is driven by the principles of scientific rigor and operational feasibility.
Table 4.
Random Forest Indicators.
The selection of indicators is theoretically grounded in the integration of ‘Source-Sink’ landscape theory and the Social-Ecological Systems framework. Specifically, guided by ‘Source-Sink’ dynamics, environmental indicators are structured to characterize the metabolic process of pollutants: livestock biomass and density represent the intensity of ‘Pollution Sources,’ while soil nutrient levels and nature reserves define the capacity and thresholds of ‘Ecological Sinks.’ Complementarily, the SES framework directs the selection of socioeconomic indicators to capture the system’s resilience and regulatory potential. Economic metrics quantify the governance capacity (financial and technical capital), while social metrics reflect the adaptability of actors. This theoretical coupling ensures that the feature matrix comprehensively covers the physical migration of pollutants and the social response mechanisms.
For the environmental indicators, soil N and P pollution levels quantify cumulative pollutant effects and are primary drivers for selecting mitigation measures. The biomass of livestock and poultry farming waste and unit-area density are calculated as five-year moving averages to mitigate data noise from breeding cycles while revealing spatial pollution distribution characteristics of pollution sources. The proportion of natural protected areas, serving as an ecological constraint, identifies restrictive governance requirements in sensitive zones. Climate indicators use time-segmented averages to account for climatic lag effects while minimizing the impact of inter-annual meteorological volatility on model stability.
Among the social indicators, the degree of population density and the popularization rate of high school education and above form a dual human capital indicator. Population density reflects the urgency of environmental governance, and the educational level reflects the social foundation for technology promotion. Locational coding for the upper, middle, and lower river reaches of the Yellow River integrates basin-scale gradient characteristics: high ecological fragility upstream, intensified human-land conflicts in midstream agro-pastoral zones, and economic agglomeration downstream. This internalizes spatial heterogeneity into the model’s structural parameters through locational attributes.
Among the economic indicators, gross regional product (GRP) and Research and Experimental Development (R&D) spending determine the feasibility of capital- and technology-intensive measures, such as energy utilization, in two capacity-focused areas: economic support and technological innovation. The simultaneous use of crop-sown area ratio and primary industry proportion synergistically constrains fertilizer utilization suitability through agricultural intensity and economic structure. Critically, the indicator system uses temporal differentiation to simultaneously capture environmental cumulative effects and socioeconomic real-time conditions. This spatiotemporally nested structure increases the Random Forest model’s capacity to decipher nonlinear relationships in complex systems, providing a robust analytical framework for adaptive governance.
Under the integrated economy, environment, and society analysis framework, the research samples show pronounced spatial heterogeneity. Regional central cities such as Zhengzhou, Chengdu, Xi’an, and Jinan have significant advantages with respect to multi-dimensional indicators. This imbalanced spatial pattern induces extreme right-skewed distributions of core variables. GRP, R&D spending, population density, biomass of livestock and poultry breeding waste, and unit-area livestock waste biomass have skewness coefficients of 3.350, 4.196, 1.314, 1.676, and 1.577, respectively. These results show the polarization effects of production factor agglomeration during regional development. In the model, high skewness values distort parameter estimation systems in machine learning through leverage effects. Information gain calculations interfere with the objective evaluation of feature importance. In response to data characteristics, the study first applies a logarithmic function for a preliminary correction. This leverages a nonlinear compression mechanism to mitigate leverage effects in high-dimensional spaces. After the transformation, the skewness indices of GDP, R&D expenditure, and population density improve but remain at suboptimal levels of 1.130, −1.467, and −1.020, respectively. This means they do not fully meet robust modeling requirements.
In Equation (6), the Box–Cox generalized power transformation system is further introduced to solve this problem. This system achieves structural adaptation of the data generation process by dynamically adjusting the parameters . This approach significantly reduces skewness indices to reasonable ranges, and the distribution shape tends towards symmetry.
Following the distribution correction based on the Box–Cox transformation, to further eliminate significant dimensional discrepancies among indicators of varying dimensions, this study employed the Z-score standardization method to standardize all continuous features input into the Random Forest model. This approach effectively mitigated the potential interference of numerical magnitude differences on the convergence speed of model training and feature importance evaluation, thereby ensuring the comparability and statistical robustness of multidimensional indicators on a unified scale.
5.2.3. Definition of Governance Strategy Labels and Decision Logic
To ensure that the training data for the Random Forest model possesses dual rationality in environmental science and regional economics, this study constructed a “rule-driven expert decision system” to pre-label the training samples. The determination of governance pathways follows a hierarchical decision logic of “Ecological Redline Priority, Resource Endowment Matching, and Bottom-line Guarantee,” which involves setting a strict exclusive priority order to sequentially determine the governance category of the samples. Specifically, based on the quantile distribution characteristics of various indicators in the Yellow River Basin and absolute physical thresholds, this decision system classifies governance strategies into four tiers: Livestock Migration, Energy Utilization, Fertilizer Utilization, and Feed Structure Optimization. Once a condition at a higher tier is triggered, the subsequent judgment process is terminated.
The highest priority is assigned to the “Livestock Migration” strategy, which is established as an “ecological circuit breaker mechanism” for the regional environmental carrying capacity, aiming to identify and control areas of extreme overload or ecological sensitivity. The determination of this category requires satisfying any one of the following five sets of threshold conditions: First, constraints regarding ecological redline zones, specifically targeting areas located in the upper or middle reaches of the Yellow River (graded as 1 or 2) where both the proportion of nature reserve area and the livestock waste biomass per unit area exceed the top 20% of the basin (i.e., greater than the 80th percentile). Second, human-land conflict constraints in densely populated areas require population density to be in the top 20%, while total waste volume and soil nitrogen or phosphorus pollution levels are in the top 30%. Third, constraints on absolute high-load areas, referring to extreme high-value zones where either the waste biomass per unit area or the total waste volume exceeds the top 10% of the basin. Finally, constraints on severely polluted areas, namely regions where soil nitrogen and phosphorus pollution levels simultaneously exceed the 90th percentile. Meeting any of the above scenarios indicates that the region has severely breached its ecological environmental capacity or poses a serious threat to human settlements, necessitating migration measures to reduce pollution at the source.
Under the premise that the migration mechanism is not triggered, the second-priority strategy is “Energy Utilization.” This pathway is primarily matched with regions possessing high biomass potential, suitable climatic conditions, or strong techno-economic support. Its determination logic includes three sets of conditions: The first focuses on climate and resource suitability, requiring total waste volume to exceed the 60th percentile, with an average temperature (2018–2022) above 15 °C and average precipitation (2016–2020) greater than 800 mm, to meet the objective requirements of temperature and humidity for biological treatment technologies such as anaerobic fermentation. The second focuses on socio-economic support capacity, applicable to areas where waste volume per unit area exceeds the 60th percentile, regional GDP is above the mean, the rate of high school education or above per 100,000 people exceeds the 75th percentile, and population density exceeds the 70th percentile, thereby ensuring the financial and talent foundation for constructing and operating large-scale energy facilities. The third focuses on R&D-driven development, targeting areas where R&D investment intensity ranks in the top 25% of the basin, based on a waste volume per unit area exceeding the 25th percentile, reflecting the driving role of technological innovation in the energy transition.
The third priority is the “Fertilizer Utilization” strategy, which aims to promote the integration of crop planting and livestock breeding as well as nutrient cycling. It is mainly applicable to areas where environmental risks are controllable and agricultural absorption capacity is available. The determination conditions are divided into two groups: First, the environmentally safe type, where soil nitrogen and phosphorus pollution levels are both below the 40th percentile and the share of the primary industry exceeds 6%, indicating that there is still surplus space for soil nutrients and a solid agricultural foundation. Second, the agronomic demand type requires the proportion of total sown area of crops to exceed 4% and moderate climatic conditions (average temperature 5–15 °C, precipitation greater than 500 mm), which are suitable for organic fertilizer field application. Finally, for the remaining areas where none of the conditions for migration, energy utilization, or fertilizer utilization are triggered, the system uniformly classifies them into the “Feed Structure Optimization” category. As a universal source reduction measure, this strategy constitutes the final “bottom-line guarantee” of the basin governance system, applicable to transitional areas with moderate environmental pressure and non-significant resource characteristics. Through the definition of these hierarchical rules, this study achieves the transformation of complex multi-dimensional features of environment, economy, and society into structured labels identifiable by machine learning algorithms.
5.2.4. Model Construction
The Random Forest model in this study addresses the quadruple classification problem of livestock and poultry waste management strategies in basin cities. The architectural design integrates the heterogeneity of watershed governance scenarios with the robustness of machine learning models. Prefecture-level administrative units serve as sample entities. The model’s input feature matrix incorporates 13-dimensional spatial attribute variables encompassing resource constraints, environmental pressure, economic conditions, and climate adaptability. The output layer maps to a discrete classification space of four governance strategies.
During the data preprocessing phase, a geospatial stratified sampling strategy is implemented by partitioning samples into nine spatial blocks, based on watershed geographical differentiation characteristics. Using Monte Carlo random permutation, samples are independently divided into two, with 80% being the training set and 20% being the testing set within each block. This effectively preserves the distributional consistency of regional features between the training and testing sets. The normalization method is concurrently applied to eliminate dimensional discrepancies among features.
The model’s core parameters are systematically optimized using out-of-bag (OOB) error convergence analysis. A total of 1000 decision trees are used to build the ensemble learner, which ensures model generalization capability while mitigating overfitting risks. The minimum leaf node sample size is set to 4 to capture fine-grained classification boundaries, with node splitting governed by the Gini impurity criterion. During model training, a feature importance evaluation mechanism is activated, applying OOB permutation-based feature perturbation to quantify the contribution of environmental-economic factors to classification decisions.
In the performance validation phase, a dual-index system with the confusion matrix analysis and classification accuracy is combined with comparative assessments of training and test set predictions to describe the model’s transfer learning capabilities with respect to spatially heterogeneous data. This architecture achieves nonlinear mapping of multidimensional features through the ensemble learning mechanism, providing reliable algorithmic support for data-driven identification of differentiated governance strategies in the Yellow River Basin. The management methods selected based on city indicators are shown in Figure 8.
Figure 8.
Governance Pathways. The numerical coefficients represent: (1) Livestock relocation; (2) Energy-oriented utilization of farming waste; (3) Fertilizer-oriented utilization of farming waste; (4) Optimization of feed formulation in livestock farming.
5.3. Analysis of Research Results
To conduct a comprehensive and rigorous assessment of the Random Forest model’s predictive performance and generalization capability in the classification task of governance paths for the Yellow River Basin, this study constructed a confusion matrix based on test set data, as shown in Figure 9. Furthermore, a multidimensional evaluation framework was established, incorporating Precision, Recall, F1-Score, and Cohen’s Kappa coefficient. Quantitative analysis results indicate that the model achieved complete fitting on the training set, attaining a 100% prediction accuracy across 88 training samples. This demonstrates that the predicted values were entirely consistent with the actual values across all intervals. The precise diagonal elements within the confusion matrix illustrate the model’s impeccable performance in learning high-order features from the training data. Collectively, the performance evaluation of the Random Forest model signifies that the algorithm exhibits high predictive efficiency and stability in classifying livestock and poultry waste management paths within the Yellow River Basin.
Figure 9.
Confusion Matrix.
Regarding the test set, error curve analysis reveals that upon increasing the number of decision trees to 300, the model’s error rate declined significantly from an initial 0.65 to 0.15. The curve demonstrated a tendency toward convergence, indicating that the model achieved sufficient feature learning while effectively controlling for overfitting. The model’s overall prediction accuracy on the test set reached 92.59%, with a Cohen’s Kappa coefficient of 0.890, denoting “almost perfect” agreement between the predicted results and actual labels. This critical metric compels valid evidence that the model maintains extremely high classification robustness even after eliminating the interference of stochastic factors, avoiding the severe overfitting phenomena common in machine learning.
In terms of identification efficacy for specific governance paths, the model exhibited superior resolution capabilities regarding the characteristics of different strategies. The data shows that the “Energy Utilization” path achieved 100.0% Precision and 91.7% Recall. This implies that the model can identify regions suitable for high-capital and technology-intensive governance with a high degree of confidence, providing a reliable decision-making basis to avoid uninformed investment. Meanwhile, the Recall rates for the “Fertilizer Utilization” and “Feed Structure Optimization” paths both reached 100.0%, indicating that the model achieved comprehensive coverage of these suitable areas without omission, thereby ensuring the broad promotion of foundational governance technologies. Although the F1-Score for the “Livestock Relocation” path was marginally lower (0.875), in-depth analysis reveals that misclassifications were primarily limited to isolated samples situated near critical thresholds of precipitation gradients and soil carrying capacity. Considering the complexity of the macro-watershed ecosystem and the ambiguity of transitional zone characteristics, this margin of error is statistically acceptable. In summary, the multidimensional validation metrics fully corroborate that the Random Forest model constructed in this study possesses excellent robustness when processing high-dimensional nonlinear spatial data. It is capable of accurately extracting key features from the complex “Economic-Environmental-Social” coupled system, providing scientific and objective empirical support for the formulation of differentiated governance strategies.
Based on the Gini impurity reduction criterion within the Random Forest algorithm, this study identified the critical driving factors influencing the selection of governance pathways, with the hierarchy of feature importance presented in Figure 10. The analysis reveals that internal expenditure on Research and Experimental Development (R&D) ranks as the paramount determinant, a finding that effectively corroborates Ecological Modernization Theory. This prominence indicates that regional technological innovation capability and capital accumulation serve as the critical thresholds for transforming agricultural waste from a “pollution load” into an “energy asset,” thereby directly dictating the feasibility of high-tech pathways such as energy utilization. Concurrently, environmental carrying capacity constraints manifest as strong, rigid driving forces. Specifically, the degree of soil phosphorus pollution, livestock and poultry waste biomass per unit area, and the proportion of nature reserve area rank second through fourth, respectively. This hierarchy suggests that when pollutant emission intensity overlaps with cumulative soil pollution or encroaches upon ecological red lines, the model activates a “circuit breaker mechanism” based on environmental thresholds, preferentially identifying livestock relocation as the requisite strategy. Furthermore, the high importance of soil nitrogen pollution and total livestock waste biomass reinforces the decisive role of source pollution pressure in strategic decision-making. Notably, specific environmental pressure indicators and technical input metrics (R&D) contribute significantly more to the model than aggregate economic output or general education levels. This demonstrates that livestock governance in the Yellow River Basin has transcended simple economic determinism, shifting toward a composite decision-making paradigm centered on ecological carrying capacity and precise technological adaptation.
Figure 10.
Importance Ranking of Influencing Factors. 1: population density (people/km2), 2: popularization rate of high school and above education (%), 3: urban location distribution, 4: degree of soil nitrogen pollution, 5: degree of soil phosphorus pollution, 6: biomass of livestock and poultry waste (tons), 7: biomass of livestock and poultry waste per unit area, 8: proportion of nature reserve area (%), 9: average temperature from 2018 to 2022 (°C), 10: average precipitation from 2016 to 2020 (mm), 11: regional gross domestic product (GDP) (billion yuan), 12: internal expenditure on research and development (R&D) (ten thousand yuan), 13: the proportion of total sown area of crops (%), and 14: the proportion of the primary industry (%).
Following the simulation of comprehensive management strategies for livestock and poultry waste within the basin, the pollution loads of nitrogen (N) and phosphorus (P) exhibited a significant downward trend, as illustrated by the post-management pollution coefficients in Figure 11. The livestock relocation strategy, implemented in environmentally overloaded zones, achieved a reduction in waste load per unit area of over 90%, precipitating a decline in soil N and P pollution levels from 22,417.5 and 4220.6, respectively, to within controllable ranges. This mitigation is primarily attributed to the rigorous regulation of livestock density and the direct severance of nutrient input sources through land fallowing. In parallel, the optimization of feed structure—characterized by reducing crude protein content from 16.5% to 13% and supplementing with phytase—demonstrates that a 1 percentage point decrease in dietary protein yields an 8% reduction in N and P emissions, accompanied by a concurrent attenuation of ammonia volatilization intensity. Regarding resource recovery, the fertilizer-oriented utilization of waste via high-temperature composting enhances organic matter mineralization rates to 80%; specifically, N is immobilized in humus as ammonium, while P is transformed into stable aluminum-bound (Al-P) and iron-bound (Fe-P) fractions via complexation. This process generates the triple benefits of emission reduction, carbon sequestration, and soil fertility enhancement. Additionally, the energy utilization pathway reduces Total Nitrogen (TN) and Total Phosphorus (TP) by 11–25% and 8–57%, respectively, through anaerobic digestion, extending the nutrient release cycle of the digestate to 120 days when used as slow-release fertilizer. Multi-source data fusion analysis confirms that the integrated application of these four governance pathways reduces the overall N and P fluxes into the Yellow River by 77.08% and 69.97%, respectively, substantiating the scientific validity and practical efficacy of this differentiated governance framework in mitigating watershed-scale pollution.
Figure 11.
(a) Prediction of Nitrogen Coefficient after Treatment; (b) Prediction of Phosphorus Coefficient after Treatment.
5.4. Robustness Check and Boundary Sensitivity Analysis
Although this study adopts the administrative boundaries of 115 prefecture-level cities to ensure data consistency and policy relevance, we acknowledge the inherent spatial discrepancy between administrative jurisdictions and natural hydrological boundaries in certain peripheral regions. To ascertain whether the inclusion of these non-hydrological areas introduces statistical bias or distorts the core conclusions, we conducted a rigorous sensitivity analysis using a counterfactual “Control Set” approach (detailed experimental design and results are provided in Appendix A).
We re-executed the Random Forest model by excluding peripheral counties that do not hydrologically drain into the Yellow River Basin. The comparative results demonstrate substantial model robustness: the prediction accuracy of the Control Set (93.33%) remained highly consistent with that of the Original Set (92.59%), exhibiting a marginal improvement rather than a structural deviation. Furthermore, the hierarchy of key driving factors remained stable, with “Internal Expenditure on R&D” and “Degree of Soil Phosphorus Pollution” consistently identified as the primary determinants of governance pathways. These empirical findings confirm that the spatial mismatch of administrative boundaries does not compromise the study’s identification of “Economic-Environmental” coupling mechanisms or the classification of governance strategies. Consequently, the results derived from the administrative-based framework are scientifically robust and provide a reliable basis for policy formulation.
6. Conclusions
6.1. Summary of Research Findings
This study systematically describes the spatiotemporal evolution patterns, environmental effects, and multidimensional mechanisms driving livestock and poultry breeding waste resource utilization in the Yellow River Basin. The result is a differentiated governance framework using a synergistic economy, environment, and society perspective. The findings show that from 1995 to 2022, the total amount of livestock and poultry waste in the Yellow River Basin experienced phases of scale expansion, management fluctuation, and sustained optimization. There were coupled relationships between policy intervention intensity, technological upgrade pathways, and regional economic restructuring. During peak periods, pollutant emission hotspots were concentrated in an intensive breeding belt in the mid-to-lower reach of the basin, forming cross-media composite pollution networks.
Using dynamic metabolic models and land carrying capacity assessments, the research quantitatively analyzed the spatial imbalance mechanisms in crop-livestock system material cycles. This included identifying the different constraints involved in grassland-livestock conflicts in ecologically fragile upstream areas and resource misallocations in industrially dense downstream zones. Data-driven decision modeling with random forest algorithm validation demonstrated that R&D investment intensity, climate adaptability, and soil pollution levels are core drivers in selecting governance pathways. Synergistically applying four governance strategies could reduce riverine N and P fluxes by 77.08% and 69.97%, respectively. This demonstrates the multidimensional governance system’s efficacy in reducing pollution loads and increasing resource circularity.
6.2. Policy Recommendations
Based on the key driving factors and feature importance ranking revealed by the Random Forest model, this study proposes that livestock pollution governance in the Yellow River Basin must adhere to a differentiated response order of “Ecological Baseline Priority, Technical Capacity Synergistic Drive”. To ensure the precise implementation of the governance system, we propose a three-tiered governance framework that deeply integrates macro-strategic priorities with micro-level dynamic regulation and market mechanisms.
Defending the Ecological Red Line via Dynamic Spatial Control and Precise Compensation. Given the high importance of soil phosphorus pollution and natural reserve proportion in model decision-making, the primary task is the rigid control of ecologically fragile upstream areas, centered on “Livestock Relocation”. To overcome the hysteresis of traditional static zoning, a “Multi-source Remote Sensing and Ground Verification” dynamic monitoring mechanism must be established. This system generates township-level “Environmental Capacity Heatmaps” to automatically identify red prohibited zones and trigger elastic warnings for regions approaching capacity limits. To address livelihood concerns resulting from relocation, a dual-layer compensation accounting mechanism must be established based on “Opportunity Cost + Ecosystem Service Value Added”. This mechanism involves implementing a cross-regional horizontal compensation fund, delivering a combined compensation package of “direct funding + green skills training,” and introducing a “Protection Outcome Linkage” mechanism to ensure ecological investment correlates dynamically with water quality improvement.
Driving Energy Utilization via Market-Based PPP Models and Diversified Revenue. In the mid-to-lower reach regions, where R&D resources are abundant and ecological red lines are not immediately breached, the focus must shift to “Economic and Technical Synergistic Drive.” The leading importance of internal R&D expenditure validates the decisive role of technological capital in solving existing pollution. Addressing investment and operation challenges, we recommend promoting the Renovate-Operate-Transfer PPP model characterized by shared risk and revenue. Operationally, the government must guarantee the construction of standardized collection systems to eliminate the “raw material risk,” while the enterprise assumes responsibility for technical operation and compliance risk. Crucially, a multi-revenue closed loop of “Energy + Carbon Sink + Product” must be constructed: in addition to standard electricity sales, Certified Emission Reductions generated from methane reduction should be integrated into the carbon market, forming a composite model of “Government Guarantee + Green Energy Sales + Carbon Value Realization” to attract long-term private capital.
Universal Systemic Efficiency and Baseline Management. For broad agriculturally dominant areas, “Fertilization Utilization” and “Feed Structure Optimization” serve as the universal strategies for systemic efficiency. Leveraging the resource endowments of crop-sown area and total livestock biomass, and under the critical premise of safe soil carrying capacity, low-cost integrated farming technologies should be promoted to achieve broader ecological self-purification and system circulation.
Methodological Replicability: This study’s methodological paradigm—integrating “Multi-source Data Fusion, Multidimensional Evaluation, and Random Forest data-driven Matching”—provides a replicable scientific reference for other watersheds facing similar “agriculture-ecology” compound conflicts globally.
6.3. Future Research Outlook
This study systematically establishes a theoretical framework and practical pathways for livestock and poultry waste governance in the Yellow River Basin. However, several scientific questions and technological bottlenecks deserve further exploration. Future research could focus on the following areas. While this study successfully constructed a data-driven framework for governance path identification using the Random Forest algorithm and validated its effectiveness on a macro scale, a scrutiny from the deeper perspectives of systems science and methodology reveals several core limitations that urgently need to be addressed in future research.
First, regarding the depth of mechanistic elucidation, the machine learning model employed inherently relies on statistical correlation mining and the nonlinear mapping of multi-dimensional data, objectively possessing certain “black box” attributes. Although the model effectively identified the driving weights of macro-indicators—such as R&D investment and soil pollution levels—on governance paths, it has not yet deeply deconstructed the internal causal feedback mechanisms of the complex coupled system of “economic development-environmental pressure-technology selection.” Furthermore, the study lacks an analysis of the behavioral games played by micro-level stakeholders during the technology adoption process, which, to a certain extent, limits the explanatory power and prescriptive guidance of the governance strategies at the implementation level.
Second, concerning model parameter settings, critical parameters such as livestock excretion coefficients and land carrying capacity thresholds were largely based on regional historical averages or static standards. Consequently, the model failed to adequately capture the dynamic marginal impacts induced by extreme climate events or the application of disruptive green technologies. This indicates that there remains room for improvement in simulation accuracy when addressing future scenarios characterized by uncertainty. It is particularly important to note that the current study offers limited discussion on the uncertainties associated with key parameters like excretion coefficients and manure collection rates. These parameters often exhibit significant spatiotemporal heterogeneity due to factors such as breed, growth stage, and management practices. Future research should more systematically quantify the impact of parameter uncertainty on model outputs and decision robustness through methods like probability distribution setting and global sensitivity analysis.
Third, in terms of algorithmic robustness, although the model achieved high overall classification accuracy, the results indicated a certain sensitivity when processing critical thresholds of continuous variables. The calibration of decision boundaries for samples with extreme pollution levels requires further optimization to mitigate the risk of misclassification in complex geographical transition zones. Moreover, the current practice of simply encoding the “future urban location distribution” fails to reflect the ecological heterogeneity within the same river basin segment. Future studies should consider introducing quantitative methods, such as an ecological vulnerability index or landscape pattern indices, to more precisely characterize the intrinsic ecological differences within regions, thereby enhancing the accuracy of spatial identification.
Fourth, regarding the spatial delineation of the study object, the current use of prefecture-level cities within the nine provincial administrative regions traversed by the Yellow River, while convenient for data acquisition, may not fully align with the natural geographical boundaries of the river basin. This could introduce biases into the analysis. Future research should strive to define the study area based on the more precise natural boundaries of the Yellow River Basin, ensuring spatial consistency among ecological processes, pollutant transport, and governance strategies, thereby enhancing the scientific rigor and relevance of the research.
In light of these limitations, future research should focus on the following areas.
First, regional suitability assessments for technological pathways mainly rely on static parameters and do not address the dynamic demands of climate change and industrial transformation. Future research is needed to establish a closed-loop system encompassing technology R&D, pilot deployment, and standard iteration; life cycle assessment and material flow analysis could be applied to quantify the eco-economic efficiency of technologies across their full value chains. A key priority should be overcoming technological bottlenecks in synergistically mitigating soil, water, and atmospheric pollution. Concurrently, a regional technology adaptation database should be established, integrating dynamic parameters such as climatic characteristics, resource endowments, and industrial infrastructure. This could be used to construct a dynamic technology applicability scoring model. These frameworks could deliver differentiated technology packages tailored to distinct ecological gradient zones, including alpine meadow zones, loess gully regions, and intensive plain areas.
Second, validate the selection of governance strategies for expanding to ecologically fragile areas across the country. The governance strategies of the Yellow River Basin provide valuable references; however, other areas have more complex constraints. Examples of fragile ecosystems across China include the permafrost-thaw zones of the Qinghai–Tibet Plateau and karst terrains in Southwest China. Future research could construct a national-scale zoning, classification, and tiering governance framework, delineating differentiated management units based on three-dimensional indicators: ecological sensitivity, pollution load, and economic development levels. Concurrently, the National Ecological Network Platform could be used to identify and implement cross-regional technology transfer pilots and to design adaptive adjustment mechanisms that integrate technology, policy, and market dynamics. Multi-regional comparative studies could help distill universal governance principles and region-specific correction coefficients. This would ultimately establish a nationally coordinated technical standards repository and policy toolkit for preventing and controlling agricultural non-point source pollution.
Author Contributions
Conceptualization, X.R. (Xiaoling Ren); methodology, J.J.; software, J.J.; validation, J.J., X.R. (Xinyue Ren) and X.R. (Xiaoling Ren); formal analysis, J.J.; investigation, J.J. and X.R. (Xinyue Ren); resources, X.R. (Xiaoling Ren); data curation, J.J.; writing—original draft preparation, J.J.; writing—review and editing, J.J. and X.R. (Xinyue Ren); visualization, J.J.; supervision, X.R. (Xiaoling Ren); project administration, X.R. (Xiaoling Ren); funding acquisition, X.R. (Xiaoling Ren). All authors have read and agreed to the published version of the manuscript.
Funding
This research was funded by the Ministry of Education of the People’s Republic of China, grant number 21YJCZH055; the Basic Research Program of Shanxi Province, grant number 202303021222010; the Fund for Overseas Returnees of Shanxi Province, grant number 2022-084; the Special Project on Science and Technology Strategy Research in Shanxi Province, grant number 202404030401086; the Major Policy Decision-Making Consultation Project of Shanxi Provincial People’s Government, grant number ZB1103.
Institutional Review Board Statement
Not applicable.
Informed Consent Statement
Not applicable.
Data Availability Statement
The data presented in this study are available on request from the corresponding author.
Acknowledgments
The authors wish to express their gratitude to Xiaoling Ren for their assistance with technical support, data analysis, or manuscript proofreading. We would also like to thank the anonymous reviewers and the editor for their constructive comments and valuable suggestions, which have significantly improved the quality of this manuscript.
Conflicts of Interest
The authors declare that they have no known competing financial interests or personal relationships that could have appeared to influence the work reported in this paper.
Abbreviations
The following abbreviations are used in this manuscript:
| ARB | Antibiotic-Resistant Bacteria |
| ARGs | Antibiotic Resistance Genes |
| COD | Chemical Oxygen Demand |
| GDP | Gross Domestic Product |
| GRP | Gross Regional Product |
| GS | Gansu Province |
| HA | Henan Province |
| SC | Sichuan Province |
| SD | Shandong Province |
| SN | Shaanxi Province |
| SX | Shanxi Province |
| QH | Qinghai Province |
| NM | Inner Mongolia Autonomous Region |
| NX | Ningxia Hui Autonomous Region |
| YRV | Yellow River Basin |
| LCA | Life Cycle Assessment |
| MFA | Material Flow Analysis |
| N | Nitrogen |
| P | Phosphorus |
| PGPR | Plant Growth-Promoting Rhizobacteria |
| PPP | Public–Private-Partnership |
| PRRS | Porcine Reproductive and Respiratory Syndrome |
| R&D | Research and Experimental Development |
| SARS | Severe Acute Respiratory Syndrome Coronavirus |
| TN | Total Nitrogen |
| TP | Total Phosphorus |
| WTO | World Trade Organization |
Appendix A
Appendix A.1. Experimental Design and Sample Grouping
To rigorously assess the robustness of model results regarding the spatial discrepancy between administrative units and natural hydrological boundaries, this study employed a systematic sensitivity analysis based on the Random Forest algorithm. Two distinct spatial datasets—designated as the “Original Group” and the “Control Group”—were constructed for comparative analysis. The Original Group maintains the research scope defined in the main text, covering 115 prefecture-level cities across the nine provinces along the Yellow River to preserve the integrity of administrative policy units. In contrast, the Control Group strictly adheres to hydro-geographical principles by excluding peripheral counties that, despite their administrative affiliation with riparian provinces, do not hydrologically drain into the Yellow River, thereby retaining only samples strictly within the natural watershed. The specific geographical scope and natural hydrological boundaries of this refined research area are clearly delineated in Figure A1.
Figure A1.
Research Area.
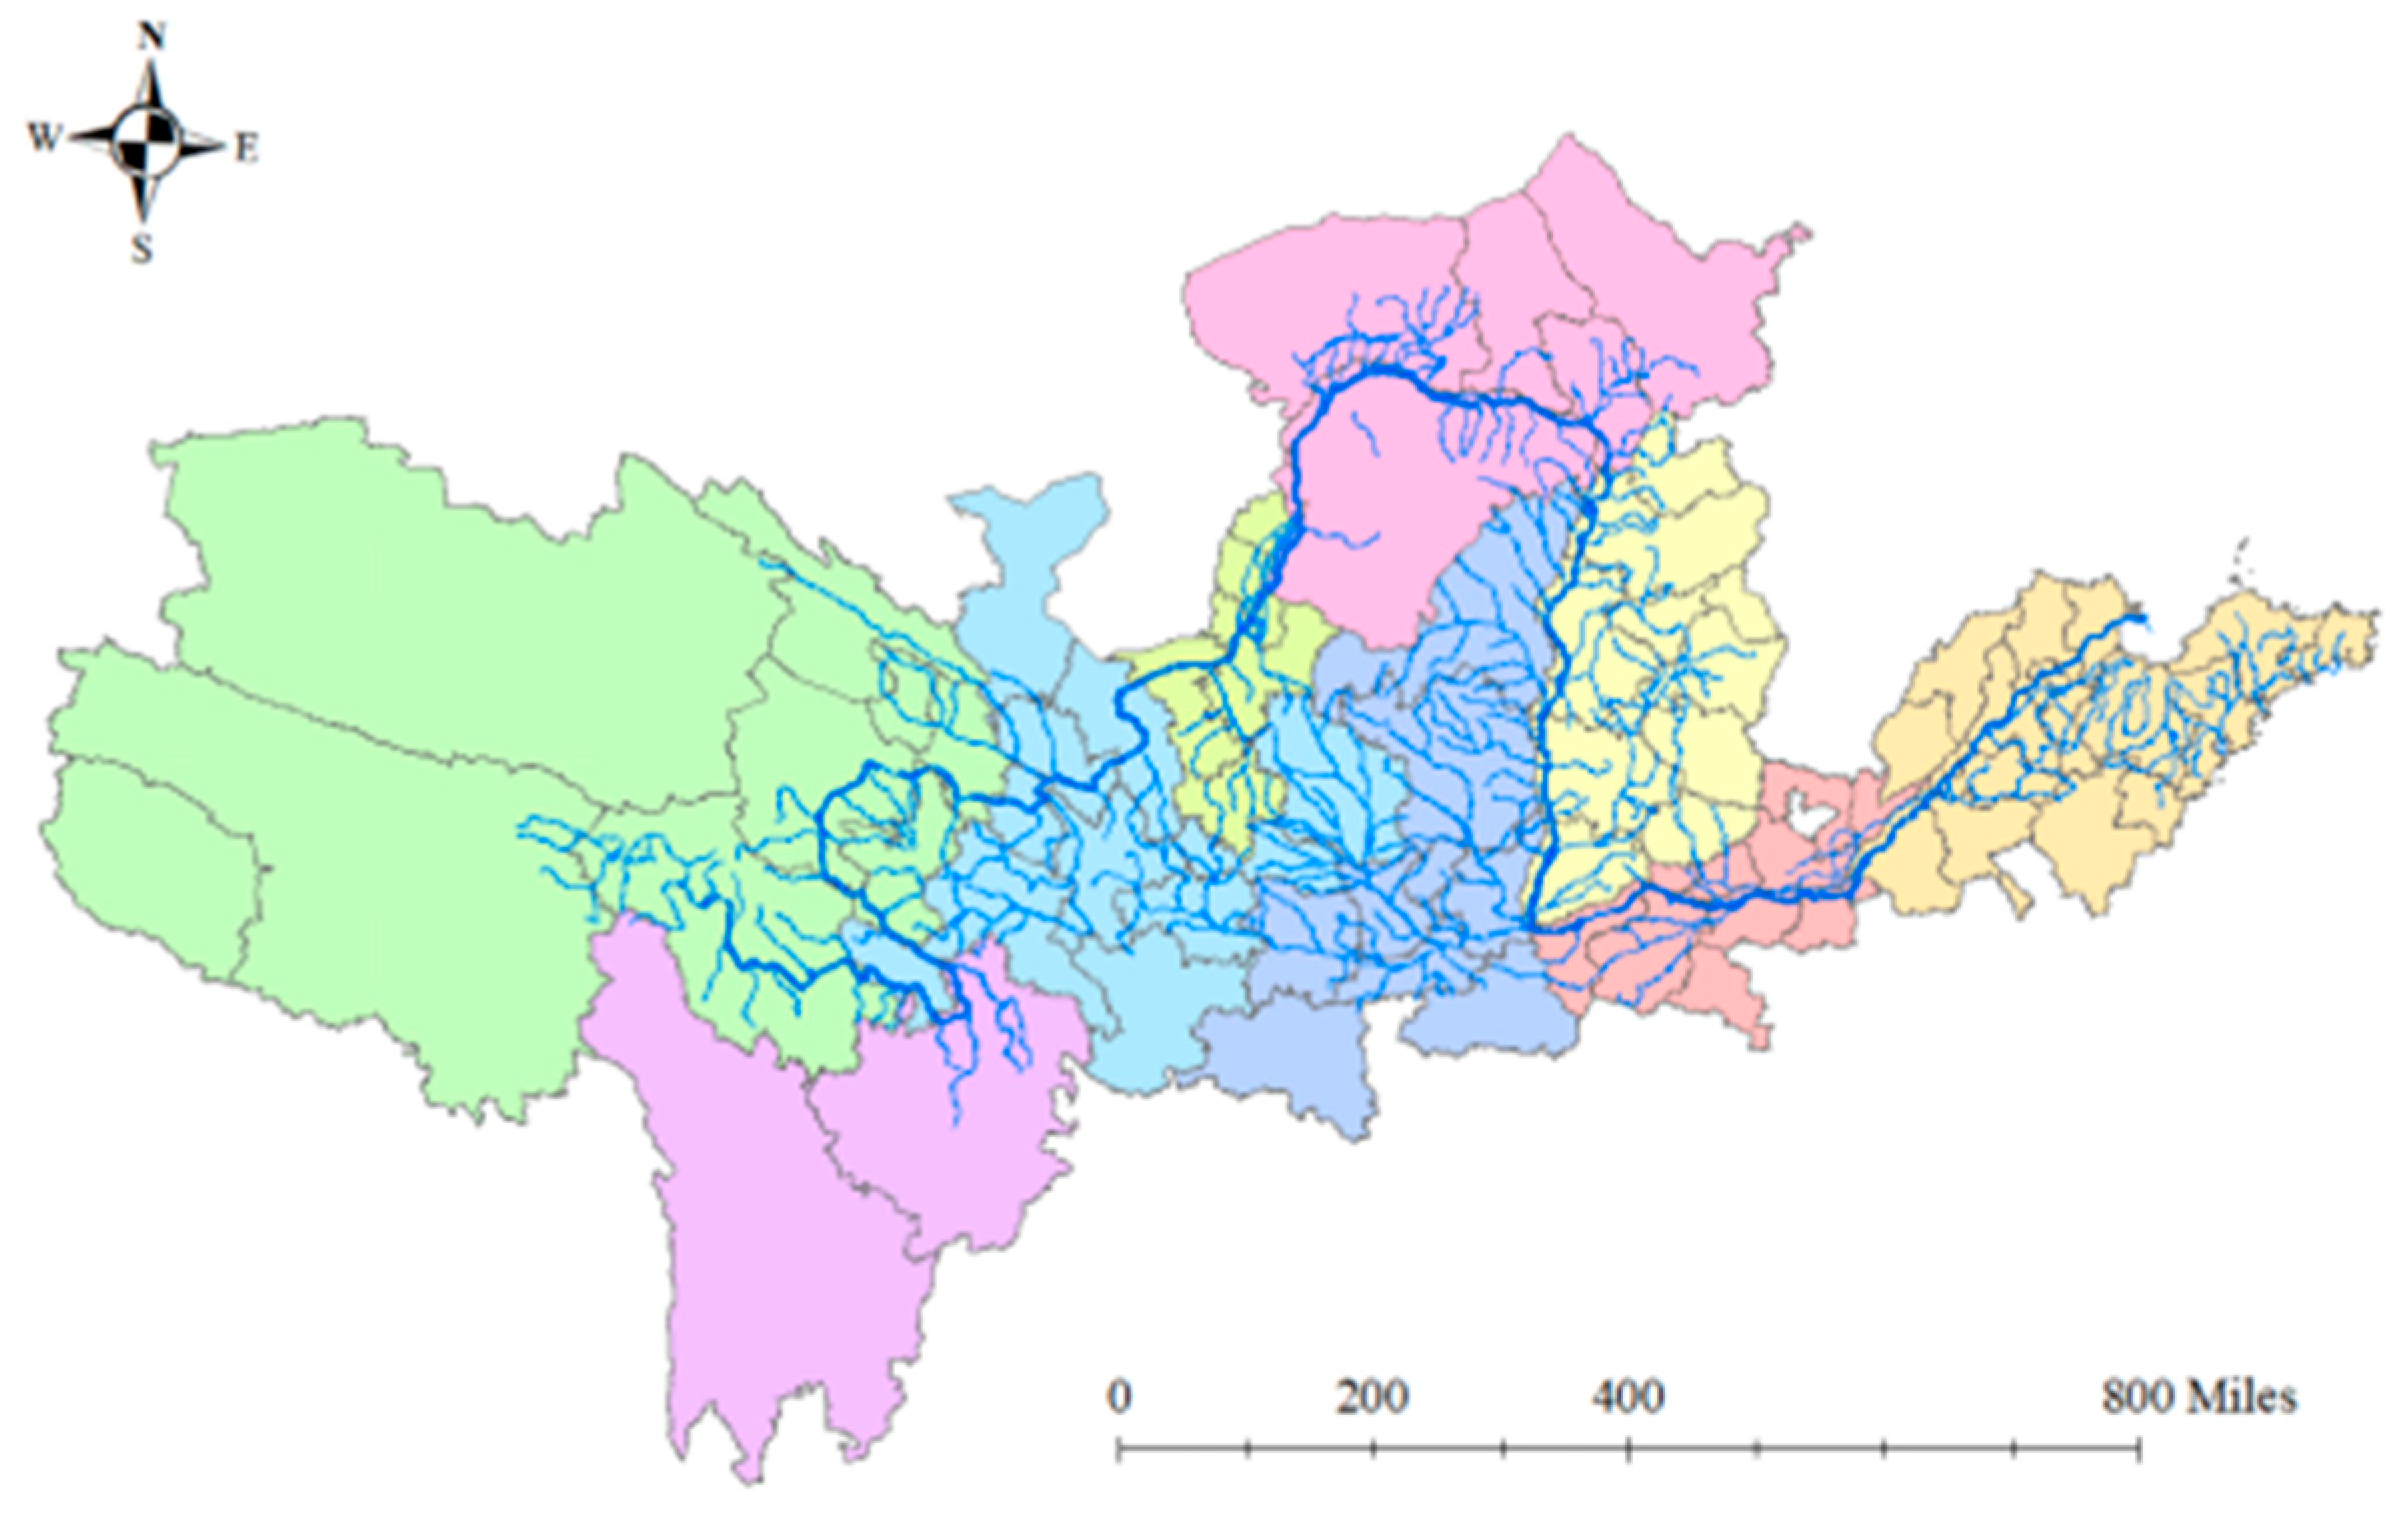
To control for confounding variables and ensure that variations in model output stem solely from the selection of spatial boundaries, identical algorithmic parameter configurations were applied to both experimental groups. Specifically, the analysis utilized an ensemble learner comprising 1000 decision trees, employing Gini impurity as the node-splitting criterion. Furthermore, data preprocessing uniformly applied a Box–Cox generalized power transformation combined with Z-score normalization. This experimental design establishes a rigorous counterfactual framework, providing an objective empirical basis for quantitatively assessing the impact of spatial heterogeneity on the identification of governance pathways. Based on this rigorous design, the resulting spatial distribution of the four governance pathways for the control group is mapped in Figure A2.
Figure A2.
Governance Pathways (The numerical coefficients represent: (1) Livestock relocation; (2) Energy-oriented utilization of farming waste; (3) Fertilizer-oriented utilization of farming waste; (4) Optimization of feed formulation in livestock farming.).
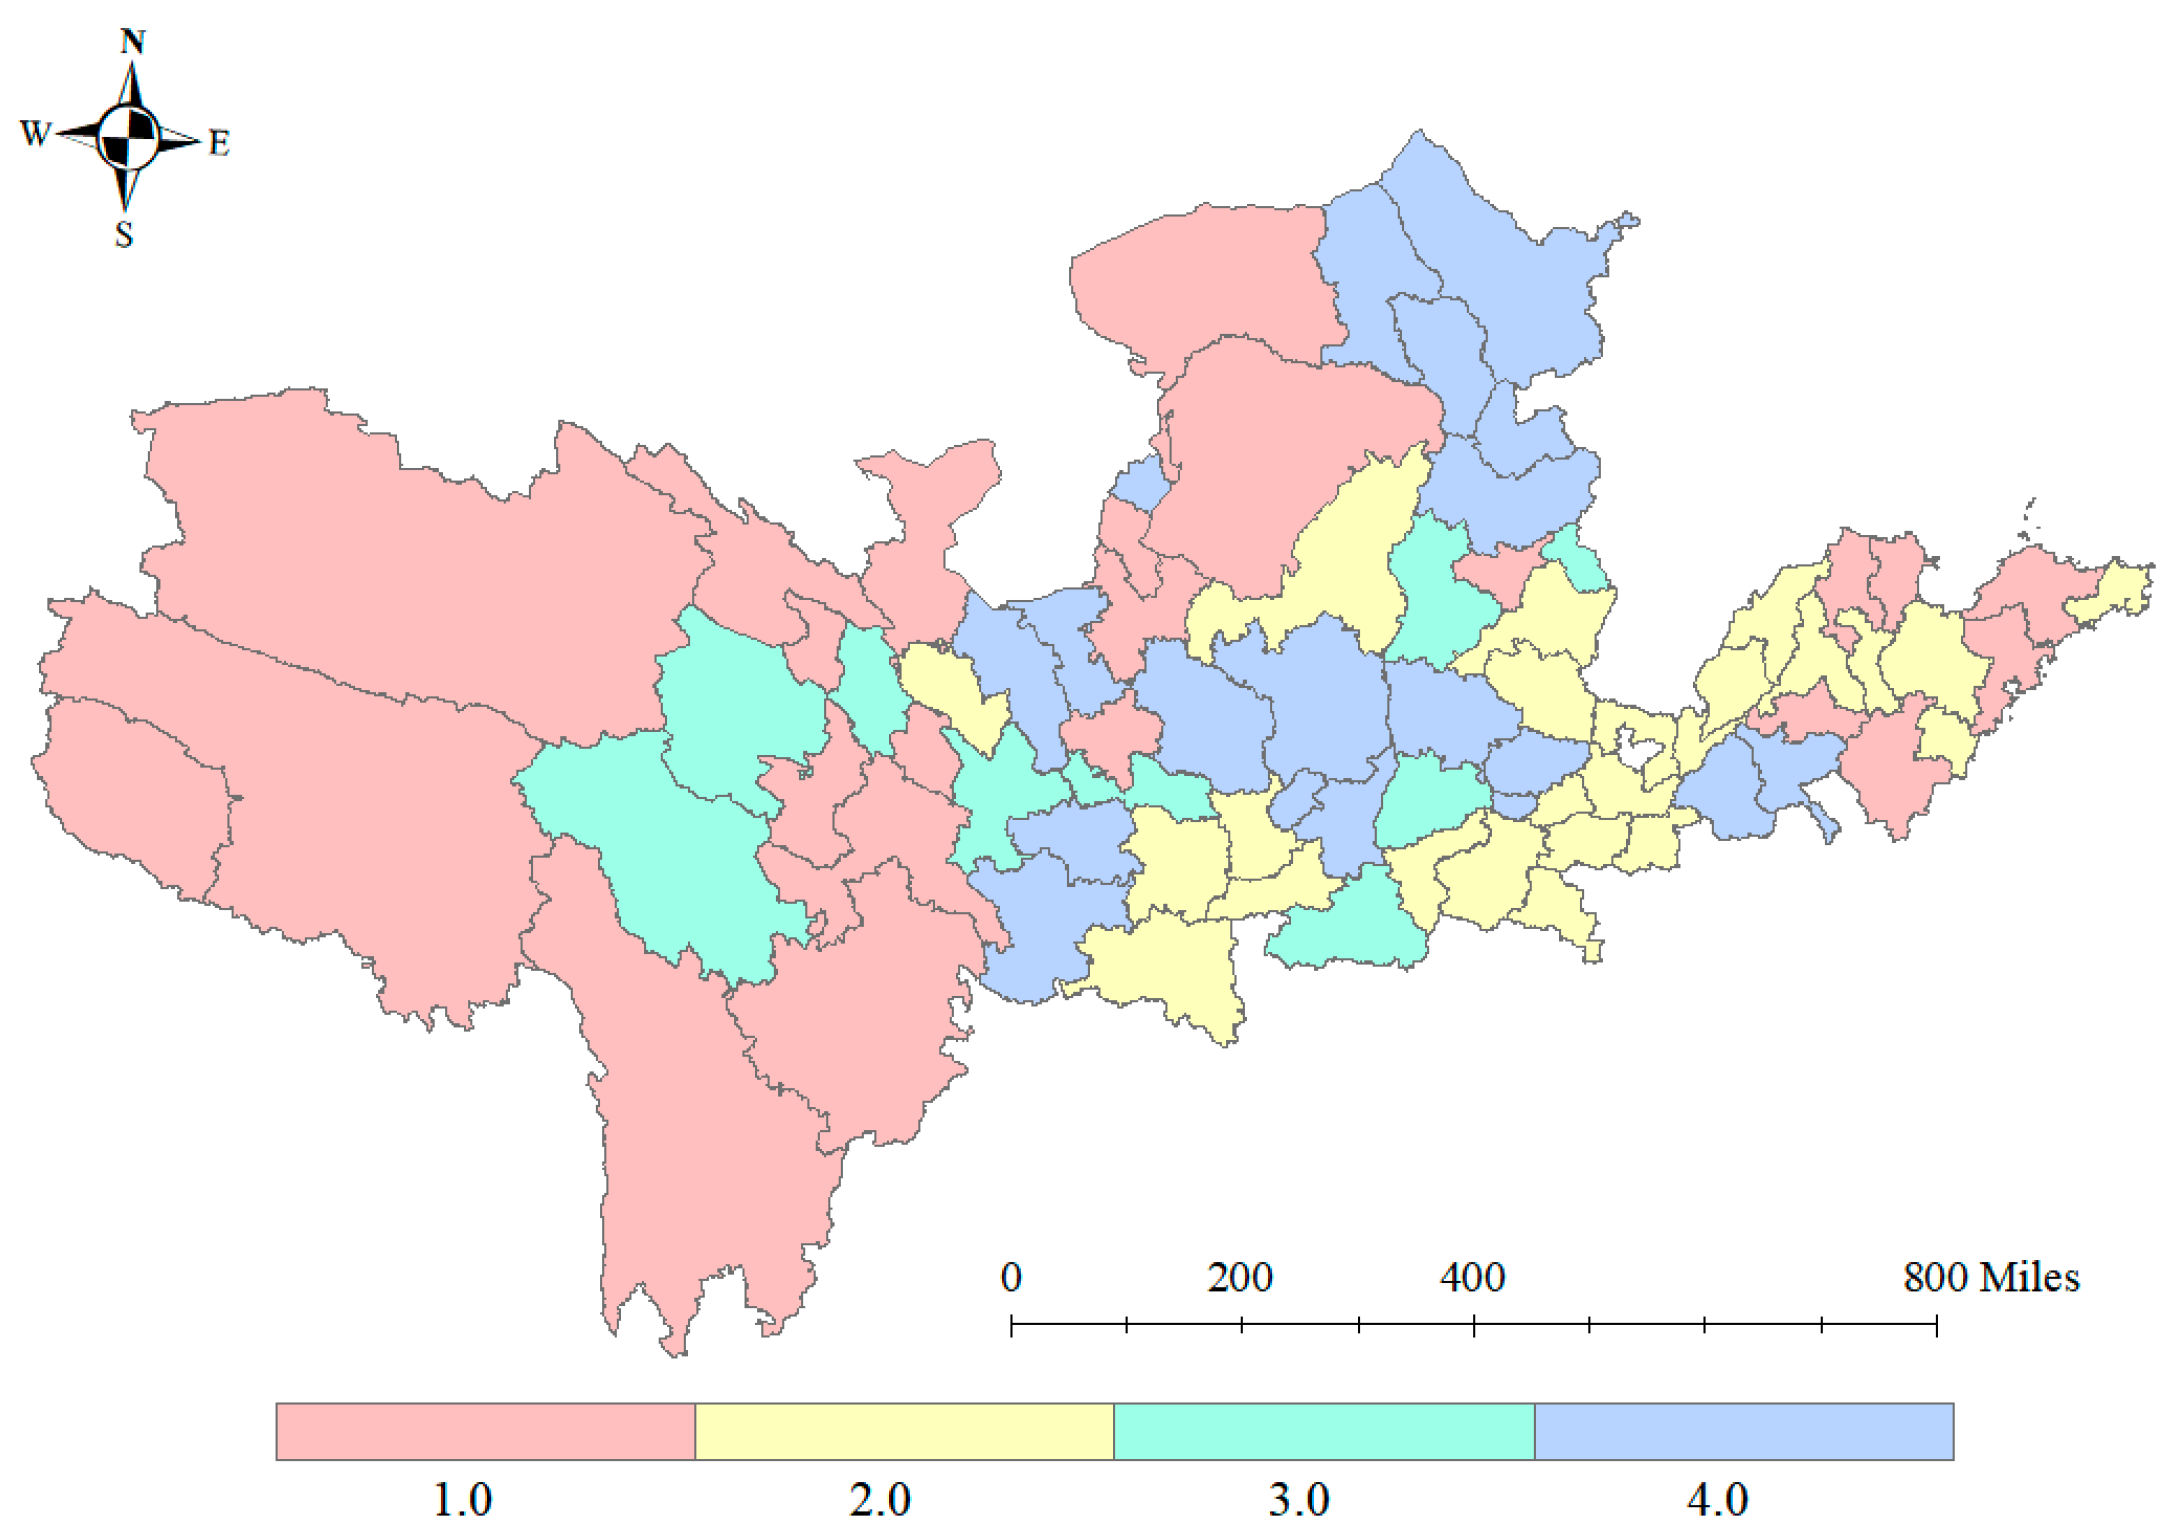
Appendix A.2. Comparative Verification of Classification Accuracy for Governance Pathways
Based on the empirical results of the sensitivity analysis, we conducted a multi-dimensional quantitative evaluation of model classification performance for both the “Original Group” and the “Control Group.” The findings confirm that the model, utilizing the original administrative boundary demarcations, demonstrates substantial robustness and predictive reliability.
A quantitative comparison of core performance metrics on the test sets reveals that the Control Group maintained high stability following the exclusion of non-hydrological areas. Specifically, the Original Group, which encompasses complete administrative units, achieved a predictive accuracy of 92.59% on the test set, with a Cohen’s Kappa coefficient of 0.890. In the Control Group, where hydrological boundaries were strictly defined, predictive accuracy increased marginally to 93.33%, and the Kappa coefficient rose to 0.911. The detailed classification performance and precise error distribution for this control group are comprehensively presented as a confusion matrix in Figure A3. This negligible statistical variance provides strong evidence that the original administrative boundary demarcation did not introduce significant noise or distort the decision logic of the Random Forest algorithm. Conversely, the high degree of consistency between the two datasets confirms the model’s superior generalization capability across differing spatial constraints.
Figure A3.
Confusion Matrix.
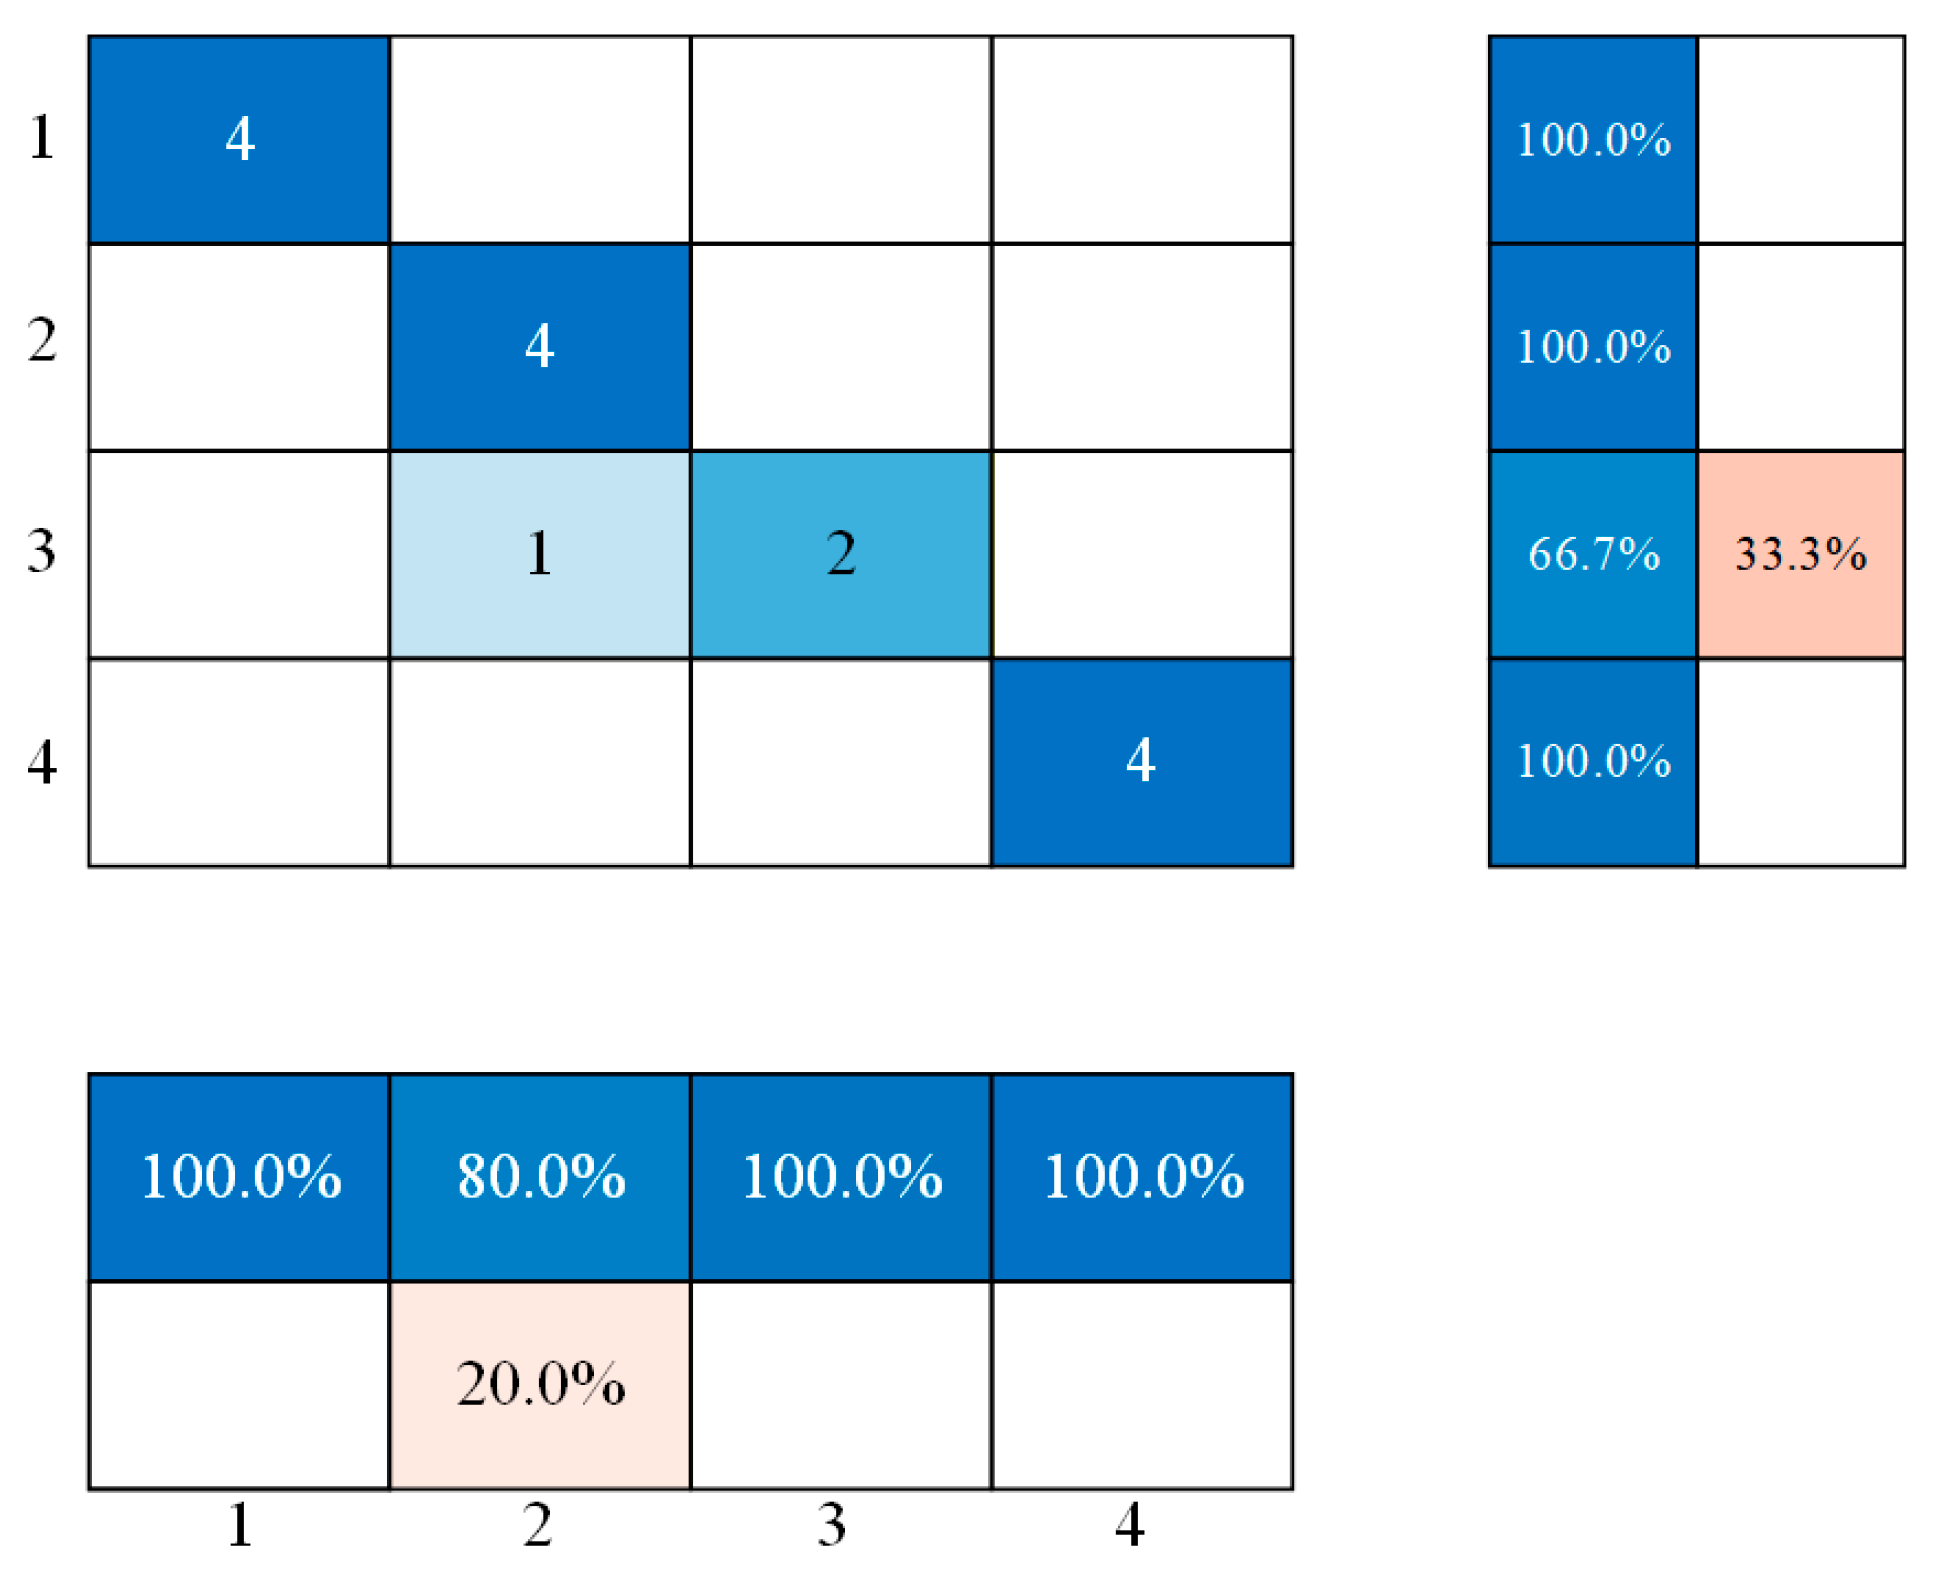
The precision in identifying key governance pathways remained elevated even after excluding peripheral regions. Specifically, for the distinct governance strategies of “Livestock and Poultry Migration” and “Feed Structure Optimization,” the identification accuracy of the Control Group remained consistently at 100%. Only minimal classification fluctuations were observed in a minority of samples located in ecological transition zones. These results indicate that the exclusion of peripheral administrative areas did not compromise the model’s capacity to capture core governance features. The model accurately distinguishes between high-environmental-pressure zones and high-technical-adaptation zones, avoiding structural misjudgments resulting from minor adjustments in the sample space.
The aforementioned verification results reveal that the multi-dimensional “Economic-Environmental-Social” driving mechanism constructed in this study possesses a universality that extends beyond micro-geographical boundaries. Comparative validation demonstrates that the selection of governance strategies inherently depends on regional resource endowments and environmental carrying capacity thresholds, rather than being solely constrained by the geometric overlap between administrative divisions and natural watershed boundaries. Even in peripheral administrative districts involving non-hydrological runoff, provided that their socio-ecological attributes are isomorphic with watershed characteristics, the model can recommend the correct governance pathway through nonlinear mapping. Therefore, the research conclusions derived from existing administrative units are scientifically robust and have not been adversely affected by boundary effects.
Appendix A.3. Stability Analysis of Driving Factor Importance Ranking
Sensitivity analysis of feature importance based on the Random Forest algorithm demonstrates that the exclusion of peripheral samples from non-hydrological basins did not alter the hierarchical structure of core driving factors. The decision-making mechanism regarding governance pathways revealed by the model exhibits exceptional robustness. A comparative analysis of the recalculation results between the original dataset and the control group indicates that the ranking logic of driving factors maintains the following highly consistent characteristics. The specific recalculated feature importance scores and their corresponding hierarchical rankings for the control group are graphically displayed in Figure A4.
Figure A4.
Importance Ranking of Influencing Factors (1: population density (people/km2), 2: popularization rate of high school and above education (%), 3: urban location distribution, 4: degree of soil nitrogen pollution, 5: degree of soil phosphorus pollution, 6: biomass of livestock and poultry waste (tons), 7: biomass of livestock and poultry waste per unit area, 8: proportion of nature reserve area (%), 9: average temperature from 2018 to 2022 (°C), 10: average precipitation from 2016 to 2020 (mm), 11: regional gross domestic product (GDP) (billion yuan), 12: internal expenditure on research and development (R&D) (ten thousand yuan), 13: the proportion of total sown area of crops (%), and 14: the proportion of the primary industry (%).).
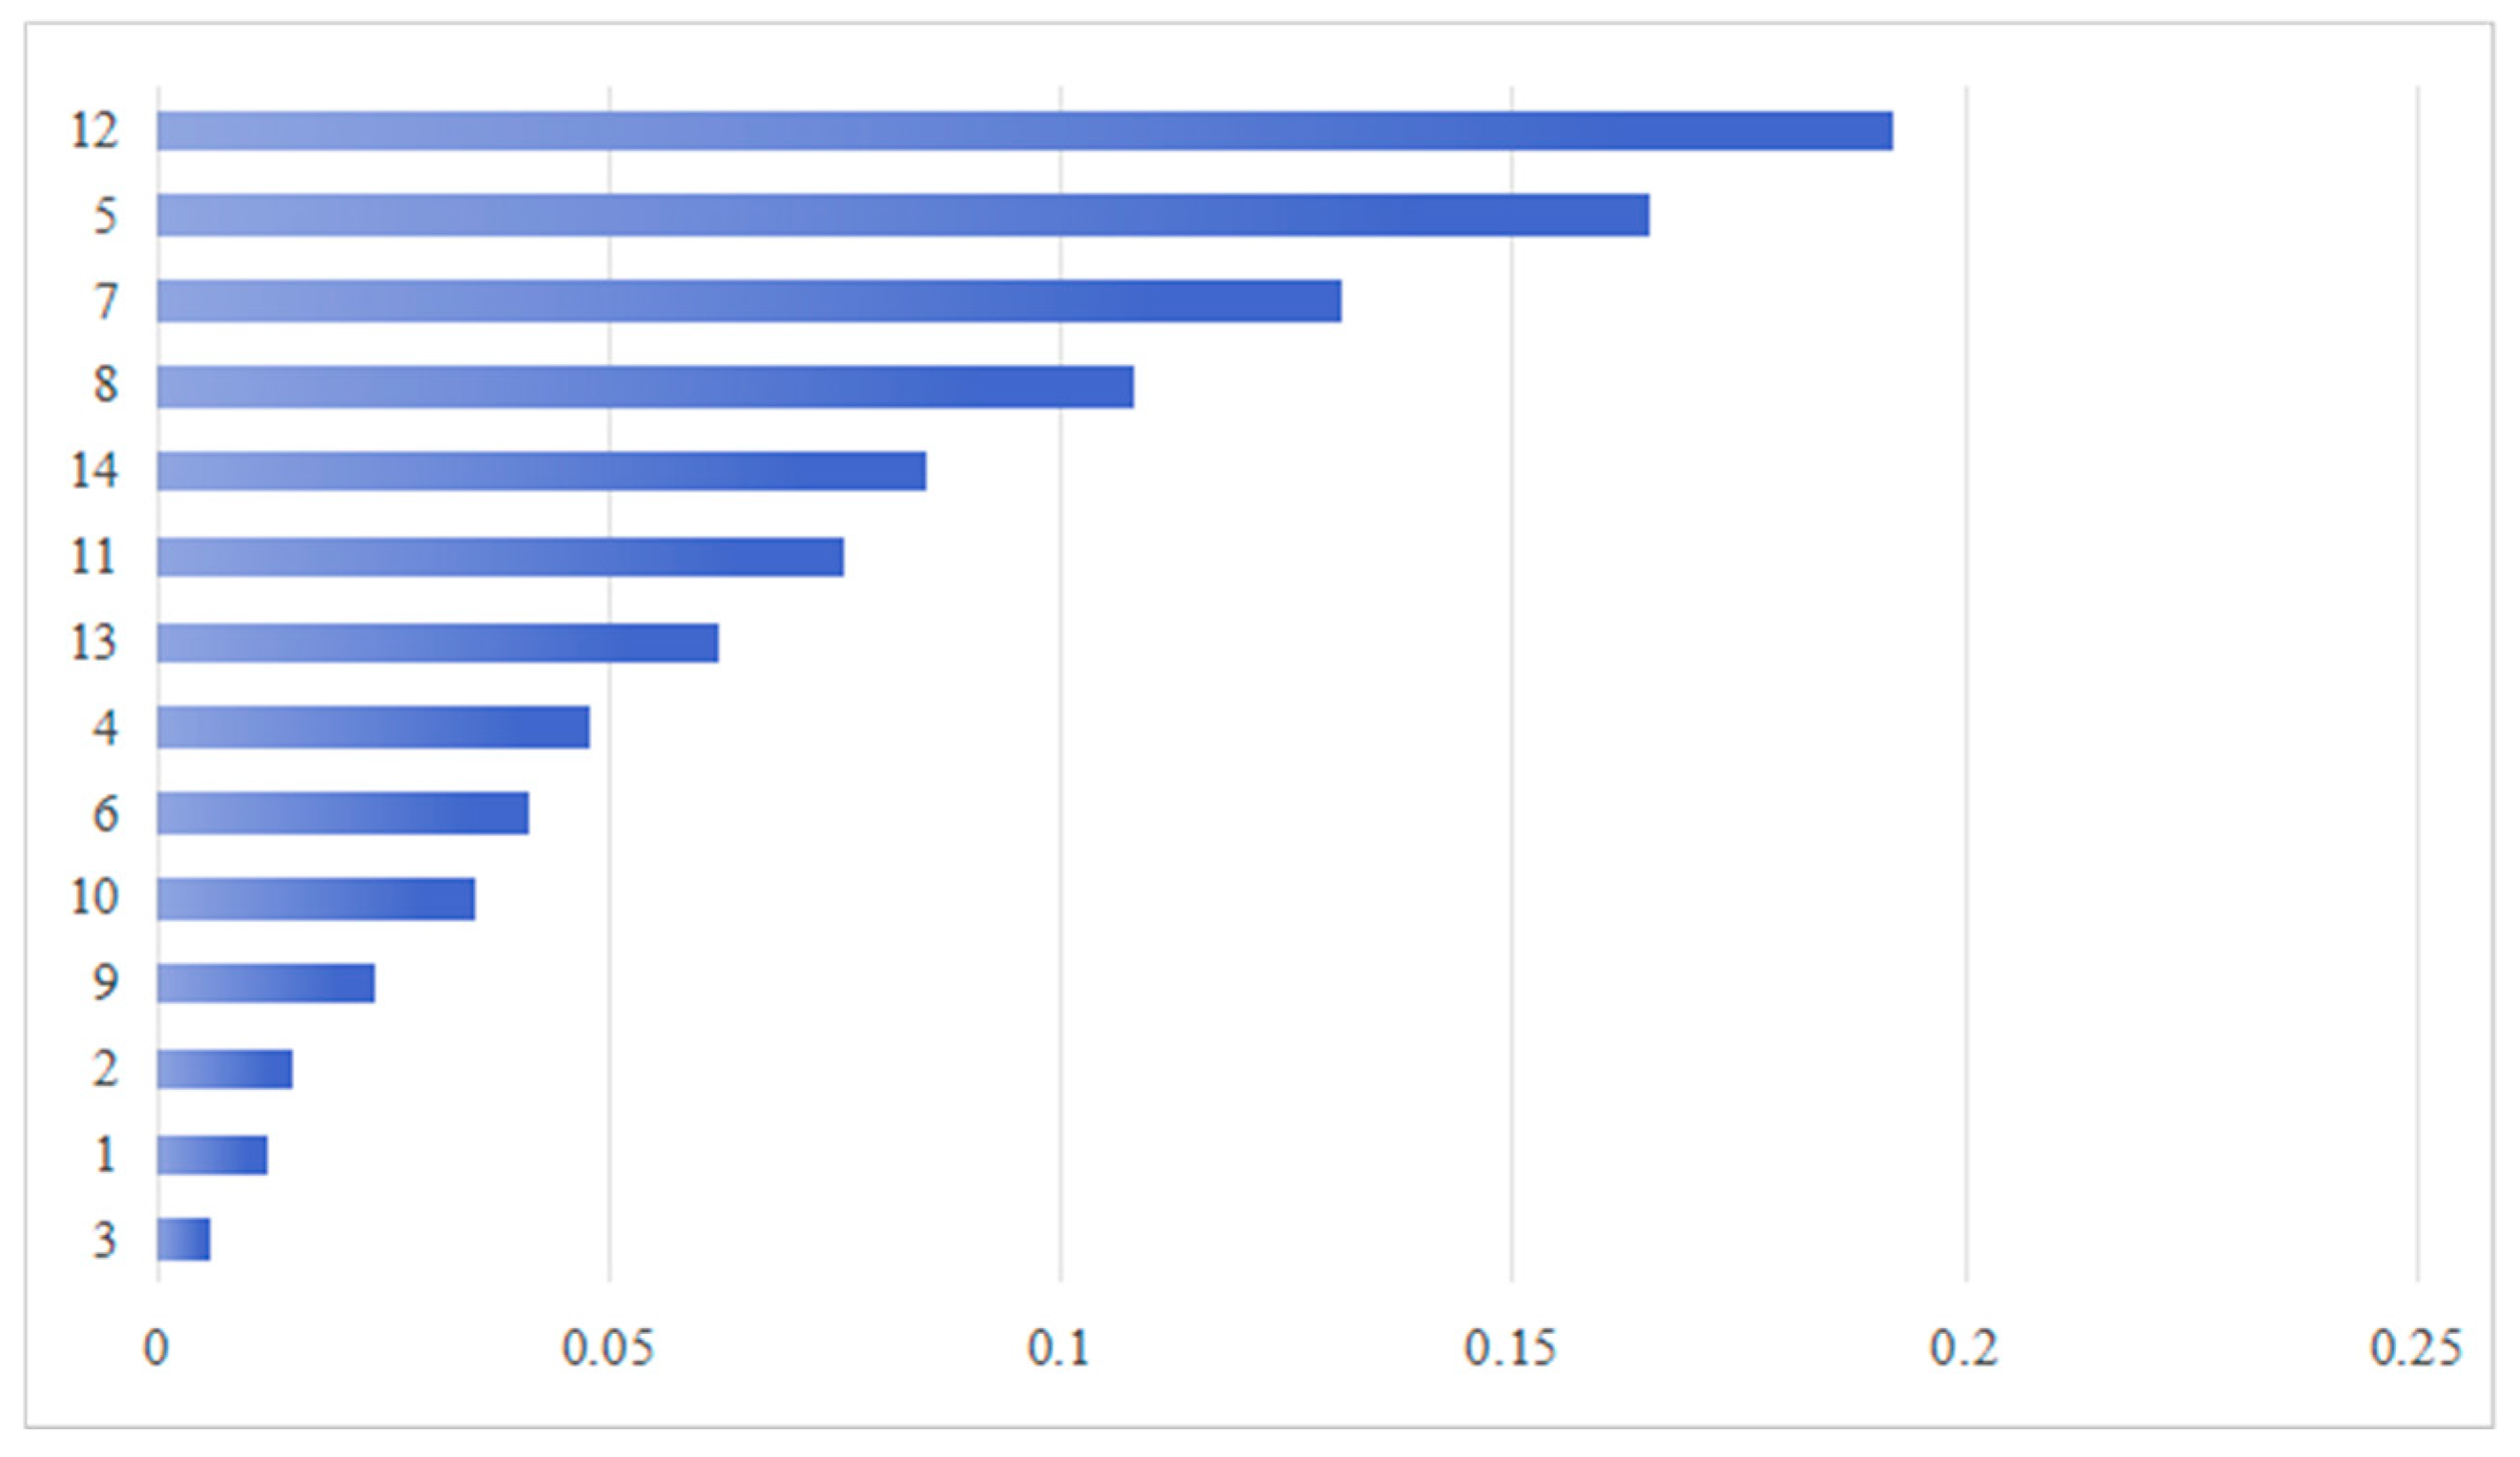
Comparative analysis reveals that “Internal Expenditure on R&D” consistently ranked first in feature importance within the control group experiment. This result provides compelling statistical evidence reconfirming that regional technological innovation capital serves as the decisive threshold supporting high-tech, capital-intensive governance pathways, such as the energy-oriented utilization of livestock and poultry waste. The primacy of this factor remained stable despite the reduction in the marginal sample space, aligning fully with the expectations of Ecological Modernization Theory regarding technological progress as a driver of environmental governance transitions. This confirms that the “techno-economic” logic maintains equal validity across both core and peripheral areas of the basin.
In the dimension of environmental pressure, “Soil Phosphorus Pollution Level” and “Livestock and Poultry Waste Biomass per Unit Area” followed closely, maintaining their top positions in the importance rankings across both experimental groups. The stability of this ranking indicates that the rigid constraints of environmental carrying capacity—acting as a “circuit breaker mechanism” within the decision model—retain significant and stable explanatory power across different spatial scales. Irrespective of minor adjustments to sample boundaries, when regional pollutant loads approach or exceed ecological thresholds, the model identifies them as critical signals triggering “ecological red line” responses; this causal logic was not compromised by sample exclusion.
The high consistency of core driving factor rankings across both groups strongly demonstrates that the “Economic Incentive-Environmental Pressure” dual-driving logic identified in this study originates from the endogenous coupling between the livestock industry and the regional eco-economic system in the Yellow River Basin, rather than being limited by geographic noise from peripheral administrative divisions. The model successfully mitigated interference from spatial heterogeneity to accurately capture the underlying mechanisms determining governance pathway selection. Therefore, the conclusions regarding driving mechanisms derived from existing administrative boundary samples are scientifically credible and robust, reflecting patterns of systemic significance that transcend strict geographical boundaries.
Appendix A.4. Mechanistic Interpretation of Result Consistency
The “convergence” phenomenon observed in this sensitivity analysis—where model outputs remain highly consistent despite the imperfect overlap between administrative and natural hydrological boundaries—is not a statistical coincidence. Rather, it is determined by the homogeneity of the “Socio-Ecological System (SES)” of the regions under study and the inherent decision logic of the Random Forest algorithm. The specific mechanistic interpretations are as follows:
Based on Source-Sink Landscape Theory and the Socio-Ecological System framework, the core mechanism determining livestock waste governance pathways relies on the coupling between regional resource endowments and environmental carrying capacity, rather than being constrained by the geometric delineation of geo-hydrological boundaries. Although the excluded peripheral administrative areas may not directly contribute runoff to the main stream of the Yellow River in terms of physical hydrology, their livestock production modes and ecological vulnerability characteristics exhibit high “isomorphism” with core basin samples regarding “economic-environmental” attributes. This implies that data points from these peripheral areas are not heterogeneous outliers in the multidimensional feature space, but rather adhere to the same eco-economic laws as the core basin. Consequently, the exclusion of these samples did not alter the intrinsic distribution structure of the feature matrix; the model continues to address governance challenges of the same fundamental nature.
From a methodological perspective, the decision rules learned by the Random Forest model within the multidimensional feature space essentially reflect universally applicable causal laws rather than local features of specific geographic coordinates. The nonlinear threshold rules identified by the model—such as “high technical capital investment driving energy-utilization pathways” or “soil phosphorus overload triggering livestock migration mechanisms”—represent robust logic derived from extensive sample training. The inclusion or exclusion of peripheral samples did not significantly alter the data support required to define these critical decision boundaries. In other words, provided that the nonlinear response relationship between “input-output-environment” remains constant, the ensemble of decision trees constructed by the algorithm will output consistent classification results. This explains, from an algorithmic mechanism standpoint, why minor adjustments to administrative boundaries do not cause structural shifts in the identification of macro-governance patterns, thereby confirming the scientific rationality of conducting research based on complete administrative units.
References
- Li, P.; Chen, J.; Zhao, G.; Holden, J.; Liu, B.; Chan, F.; Ka, S.; Hu, J.; Wu, P.; Mu, X. Determining the drivers and rates of soil erosion on the Loess Plateau since 1901. Sci. Total Environ. 2022, 823, 153674. [Google Scholar] [CrossRef] [Scilit]
- Tao, Y.; Xu, J.; Ren, H.; Guan, X.; You, L.; Wang, S. Spatiotemporal evolution of agricultural non-point source pollution and its influencing factors in the Yellow River Basin. Trans. Chin. Soc. Agric. Eng. 2021, 37, 257–264. [Google Scholar]
- Pinto, F.S.; Sirnoes, P.; Marques, R.C. Raising the bar: The role of governance in performance assessments. Util. Policy 2017, 49, 38–47. [Google Scholar] [CrossRef] [Scilit]
- Xuan, M.; Xu, Z.; Wu, G.; Ou, W.; Li, J.; He, W. Analysis of Utilization of Fecal Resources in Large-scale Livestock and Poultry Breeding in China. J. Agric. Resour. Environ. 2018, 35, 126–132. [Google Scholar]
- Cross-Strait Ecological Terms Working Committee. Cross-Strait Ecological Terms; Science Press: Beijing, China, 2013. [Google Scholar]
- Wang, J.; Yu, D.; Huang, Q.; Lu, L.; Jing, H.; Qian, Y.; Ni, K.; Cheng, Y. Alleviation of soil acidification using livestock manure increases nitrogen supply while stimulating N2O emission in a tea plantation. Arch. Agron. Soil Sci. 2025, 71, 1–13. [Google Scholar] [CrossRef] [Scilit]
- Zhang, J.; Wei, J.; Guo, C.; Tang, Q.; Guo, H. The spatial distribution characteristics of the biomass residual potential in China. J. Environ. Manag. 2023, 338, 117777. [Google Scholar] [CrossRef] [Scilit] [PubMed]
- Bekrik, L.; Musa, A.A.; Ogwu, F.A. Green hydrogen production from biomass in Kenya: Geospatial feedstock assessment and decentralized energy system integration. Energy Sustain. Dev. 2025, 89, 101842. [Google Scholar] [CrossRef] [Scilit]
- Ostrom, E. A General Framework for Analyzing Sustainability of Social-Ecological Systems. Science 2009, 325, 419–422. [Google Scholar] [CrossRef] [Scilit]
- Schlager, E.C.; Olivier, T.; Cox, T.E.; Hanlon, J.W. Polycentricity and state reinforced self-governance: The case of the New York City watersheds governing arrangement. Ecol. Soc. 2025, 30, 18. [Google Scholar] [CrossRef] [Scilit]
- Long, H.; Liu, J.; Tu, C.; Fu, Y. From State-controlled to Polycentric Governance in Forest Landscape Restoration: The Case of the Ecological Forest Purchase Program in Yong’an Municipality of China. Environ. Manag. 2018, 62, 58–69. [Google Scholar] [CrossRef] [Scilit]
- Tang, J.; Li, S. Research on multiple co-governance of agricultural non-point source pollution in China on the perspective of ENGOs and public participation. PLoS ONE 2023, 18, e0280360. [Google Scholar] [CrossRef] [Scilit]
- Sonia, R.C.; Katherine, L.; Tracey, D.; Austin, H.; Suchandra, B.; Hirotsugu, U.; Emi, U. Coastal and Marine Socio-Ecological Systems: A Systematic Review of the Literature. Front. Mar. Sci. 2021, 8, 648006. [Google Scholar] [CrossRef] [Scilit]
- Gain, A.K.; Hossain, S.; Benson, D.; Di Baldassarre, G.; Giupponi, C.; Huq, N. Social-ecological system approaches for water resources management. Int. J. Sustain. Dev. World Ecol. 2021, 28, 109–124. [Google Scholar] [CrossRef] [Scilit]
- McAllister, T.A.; Becquet, P.; Amon, B.; LEAP Technical Advisory Group; Lee, M.R. Livestock-an essential component of a circular bioeconomy. Anim. Front. 2025, 15, 3–6. [Google Scholar] [CrossRef] [Scilit]
- Liu, F.; Dai, E.; Yin, J. A Review of Social–Ecological System Research and Geographical Applications. Sustainability 2023, 15, 6930. [Google Scholar] [CrossRef] [Scilit]
- Hussain, F.; Ahmed, S.; Naqvi, S.M.Z.A.; Awais, M.; Zhang, Y.; Zhang, H.; Raghavan, V.; Zang, Y.; Zhao, G.; Hu, J. Agricultural Non-Point Source Pollution: Comprehensive Analysis of Sources and Assessment Methods. Agriculture 2025, 15, 531. [Google Scholar] [CrossRef] [Scilit]
- Shah, M.; Wever, M.; Espig, M. A Framework for Assessing the Potential of Artificial Intelligence in the Circular Bioeconomy. Sustainability 2025, 17, 3535. [Google Scholar] [CrossRef] [Scilit]
- Chen, L.; Fu, B.; Zhao, W. Source-sink landscape theory and its ecological significance. Front. Biol. China 2008, 3, 131–136. [Google Scholar] [CrossRef] [Scilit]
- China National Energy Administration. Technical Code for Investigation and Evaluation of Biomass Energy Resources; China National Energy Administration: Beijing, China, 2021; Volume NB/T 10493-2021, p. 49.
- Institute of Agricultural Environment and Sustainable Development, Chinese Academy of Agricultural Sciences; Nanjing Institute of Environmental Sciences, Ministry of Environmental Protection. Manual of Emission and Discharge Coefficients for Livestock and Poultry Breeding in the First National Pollution Source Census; Ministry of Environmental Protection of the People’s Republic of China: Beijing, China, 2009.
- Chen, L.; Shu, B.; Li, X. Evaluation of Biogas Potential of China’s Livestock and Poultry Manure and Its Influencing Factors Based on Regional Differences in Excretion Coefficient. China Biogas 2019, 37, 7–11. [Google Scholar]
- Zhu, J.; Zhang, Z.; Fan, Z.; Li, R. Biogas Potential, Cropland Load and Total Amount Control of Animal Manure in China. J. Agro-Environ. Sci. 2014, 33, 435–445. [Google Scholar]
- Zhou, T.; Zhu, Y.; Fu, Q.; Hu, Z.; Yang, F. Pollutant coefficients data of livestock industry at provincial level in China. Acta Geogr. Sin. 2014, 69, 153–158. [Google Scholar]
- Bao, W.; Liu, J.; An, J.; Xie, G. Discussion on value-taking of relative parameters for assessment of livestock and poultry excrement resource in China. Trans. Chin. Soc. Agric. Eng. 2018, 34, 314–322. [Google Scholar]
- Zhang, T.; Bu, M.; Geng, W. Pollution status and biogas-producing potential of livestock and poultry excrements in China. Chin. J. Ecol. 2012, 31, 1241–1249. [Google Scholar]
- Wang, W.; Chen, X.; Zhu, S.; Zhang, Y.; Wang, Q.; Liang, C.; Qi, W. Potential estimation and distribution of biomass energy resources in Guangdong Province. Renew. Energy Resour. 2023, 41, 152–159. [Google Scholar]
- Department of Energy Statistics, National Bureau of Statistics of China. China Energy Statistical Yearbook 2022; China Statistics Press: Beijing, China, 2023. [Google Scholar]
- Du, H.; Liu, X.; Wang, T. Impact of agricultural waste energy utilization on rural energy sustainability in the Yellow River basin:based on data analysis of 60 prefecture-level administrative regions in nine provinces. J. Agric. Resour. Environ. 2023, 40, 1443–1451. [Google Scholar]
- National Animal Husbandry Service; China Feed Industry Association; National Science and Technology Innovation Alliance for Resource Utilization of Livestock and Poultry Waste. Technical Guidelines for Calculating the Carrying Capacity of Livestock and Poultry Manure; China Agriculture Press: Beijing, China, 2017. [Google Scholar]
- Liu, X. Study on Nutrients Balance and Requirement in Agricultural Production in China. Ph.D. Thesis, Chinese Academy of Agricultural Sciences, Beijing, China, 2018. [Google Scholar]
- Xue, Y. Intensive Livestock Breeding Waste Pollution and Its Application Value in Ecological Environment and Pollution Control Process. Front. Soc. Sci. Technol. 2019, 1, 188–195. [Google Scholar]
- Zhang, M.; Jing, G.; Li, P.; Han, J.; Wang, X.; Zhang, X.; Sun, B.; Chen, Z.; Zhang, Y. The Volume of Livestock and Poultry Production and Fecal Load on Cropland in Northeastern China: A Case Study of Fuxin County, Liaoning Province. Pol. J. Environ. Stud. 2025. [Google Scholar] [CrossRef] [Scilit] [PubMed]
- Luo, L.; Ma, Y.; Zhang, S.; Wei, D.; Zhu, Y. An inventory of trace element inputs to agricultural soils in China. J. Environ. Manag. 2009, 90, 2524–2530. [Google Scholar] [CrossRef] [Scilit]
- Yin, C.; Luo, Y.; Teng, Y.; Zhang, H.; Chen, Y.; Zhao, Y. Pollution Characteristics and Accumulation of Antibiotics in Typical ProtectedVegetable Soils. Environ. Sci. 2012, 33, 2810–2816. [Google Scholar]
- Bai, Z.; Fan, X.; Jin, X.; Zhao, Z.; Wu, Y.; Oene, O.; Gerard, V.; Hu, C.; Ma, L. Relocate 10 billion livestock to reduce harmful nitrogen pollution exposure for 90% of China’s population. Nat. Food 2022, 3, 152–160. [Google Scholar] [CrossRef] [Scilit]
- Tsujikawa, Y.; Nishiyama, K.; Namai, F.; Imamura, Y.; Sakuma, T.; Saha, S.; Suzuki, M.; Sakurai, M.; Iwata, R.; Matsuo, K.; et al. Establishment of porcine fecal-derived ex vivo microbial communities to evaluate the impact of livestock feed on gut microbiome. Biosci. Microbiota Food Health 2024, 43, 100–109. [Google Scholar] [CrossRef] [Scilit]
- Kilucha, M.; Cheng, S.; Minza, S.; Nasiruddin, S.M.; Velempini, K.; Li, X.; Wang, X.; Mokeira Doroth, K.; Li, Z. Insights into the anaerobic digestion of fecal sludge and food waste in Tanzania. Front. Environ. Sci. 2022, 10, 911348. [Google Scholar] [CrossRef] [Scilit]
- Khder, O.M.M.; Ashry, R.M.E.; Deeb, A.M.A.E.; Bouqellah, N.A.; Ashkan, M.F.; Dablool, A.S.; Thagfan, F.A.; Algopishi, U.B.; Alshammari, N.M.; Al-Gheffari, H.K.; et al. The combination of composted animal manure and plant growth-promoting rhizobacteria is a sustainable biofertilizer and bionematicide for grapevine (Vitis vinifera L.) cultivars. Eur. J. Plant Pathol. 2025, 172, 219–239. [Google Scholar] [CrossRef] [Scilit]
- Wang, Q.; Awasthi, M.K.; Ren, X.; Zhao, J.; Li, R.; Wang, Z.; Wang, M.; Chen, H.; Zhang, Z. Combining biochar, zeolite and wood vinegar for composting of pig manure: The effect on greenhouse gas emission and nitrogen conservation. Waste Manag. 2018, 74, 221–230. [Google Scholar] [CrossRef] [Scilit]
- Awasthi, M.K.; Duan, Y.; Awasthi, S.K.; Liu, T.; Zhang, Z. Effect of biochar and bacterial inoculum additions on cow dung composting. Bioresour. Technol. 2020, 297, 122407. [Google Scholar] [CrossRef] [Scilit]
- Li, P.; Wang, J.; Peng, H.; Li, Q.; Wang, M.; Yan, W.; Benz, B.S.Y.; Li, W.; Sun, Y.; Zheng, G.; et al. The effect of heat pre-treatment on the anaerobic digestion of high-solid pig manure under high organic loading level. Front. Bioeng. Biotechnol. 2022, 10, 972361. [Google Scholar] [CrossRef] [Scilit]
- Sarfaraz, Q.; Silva, L.S.D.; Drescher, G.L.; Zafar, M.; Severo, F.F.; Kokkonen, A.; Molin, G.D.; Shafi, M.I.; Shafique, Q.; Solaiman, Z.M. Publisher Correction: Characterization and carbon mineralization of biochars produced from different animal manures and plant residues. Sci. Rep. 2021, 11, 8463. [Google Scholar] [CrossRef] [Scilit] [PubMed]
- Anukam, A.; Mamphweli, S.; Reddy, P.; Meyer, E.; Okoh, O. Pre-processing of sugarcane bagasse for gasification in a downdraft biomass gasifier system: A comprehensive review. Renew. Sustain. Energy Rev. 2016, 66, 775–801. [Google Scholar] [CrossRef] [Scilit]
- Kim, M.; Jung, S.; Lee, D.J.; Lin, K.Y.A.; Jeon, Y.J.; Rinklebe, J.; Klinghoffer, N.B.; Kwon, E.E. Biodiesel synthesis from swine manure. Bioresour. Technol. 2020, 317, 1078. [Google Scholar] [CrossRef] [Scilit] [PubMed]
- Zapata, O. Renewable energy and well-being in remote Indigenous communities of Canada: A panel analysis. Ecol. Econ. 2024, 222, 108219. [Google Scholar] [CrossRef] [Scilit]
- Breiman, L. Random Forests. Mach. Learn. 2001, 45, 5–32. [Google Scholar] [CrossRef] [Scilit]
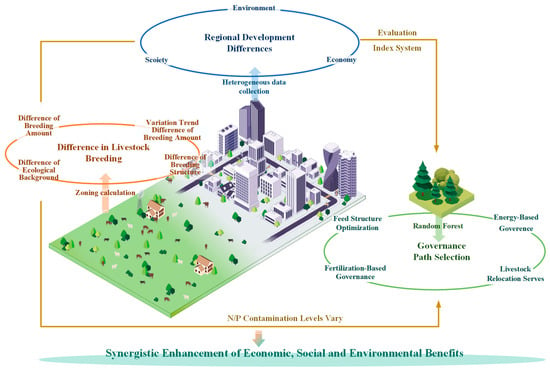
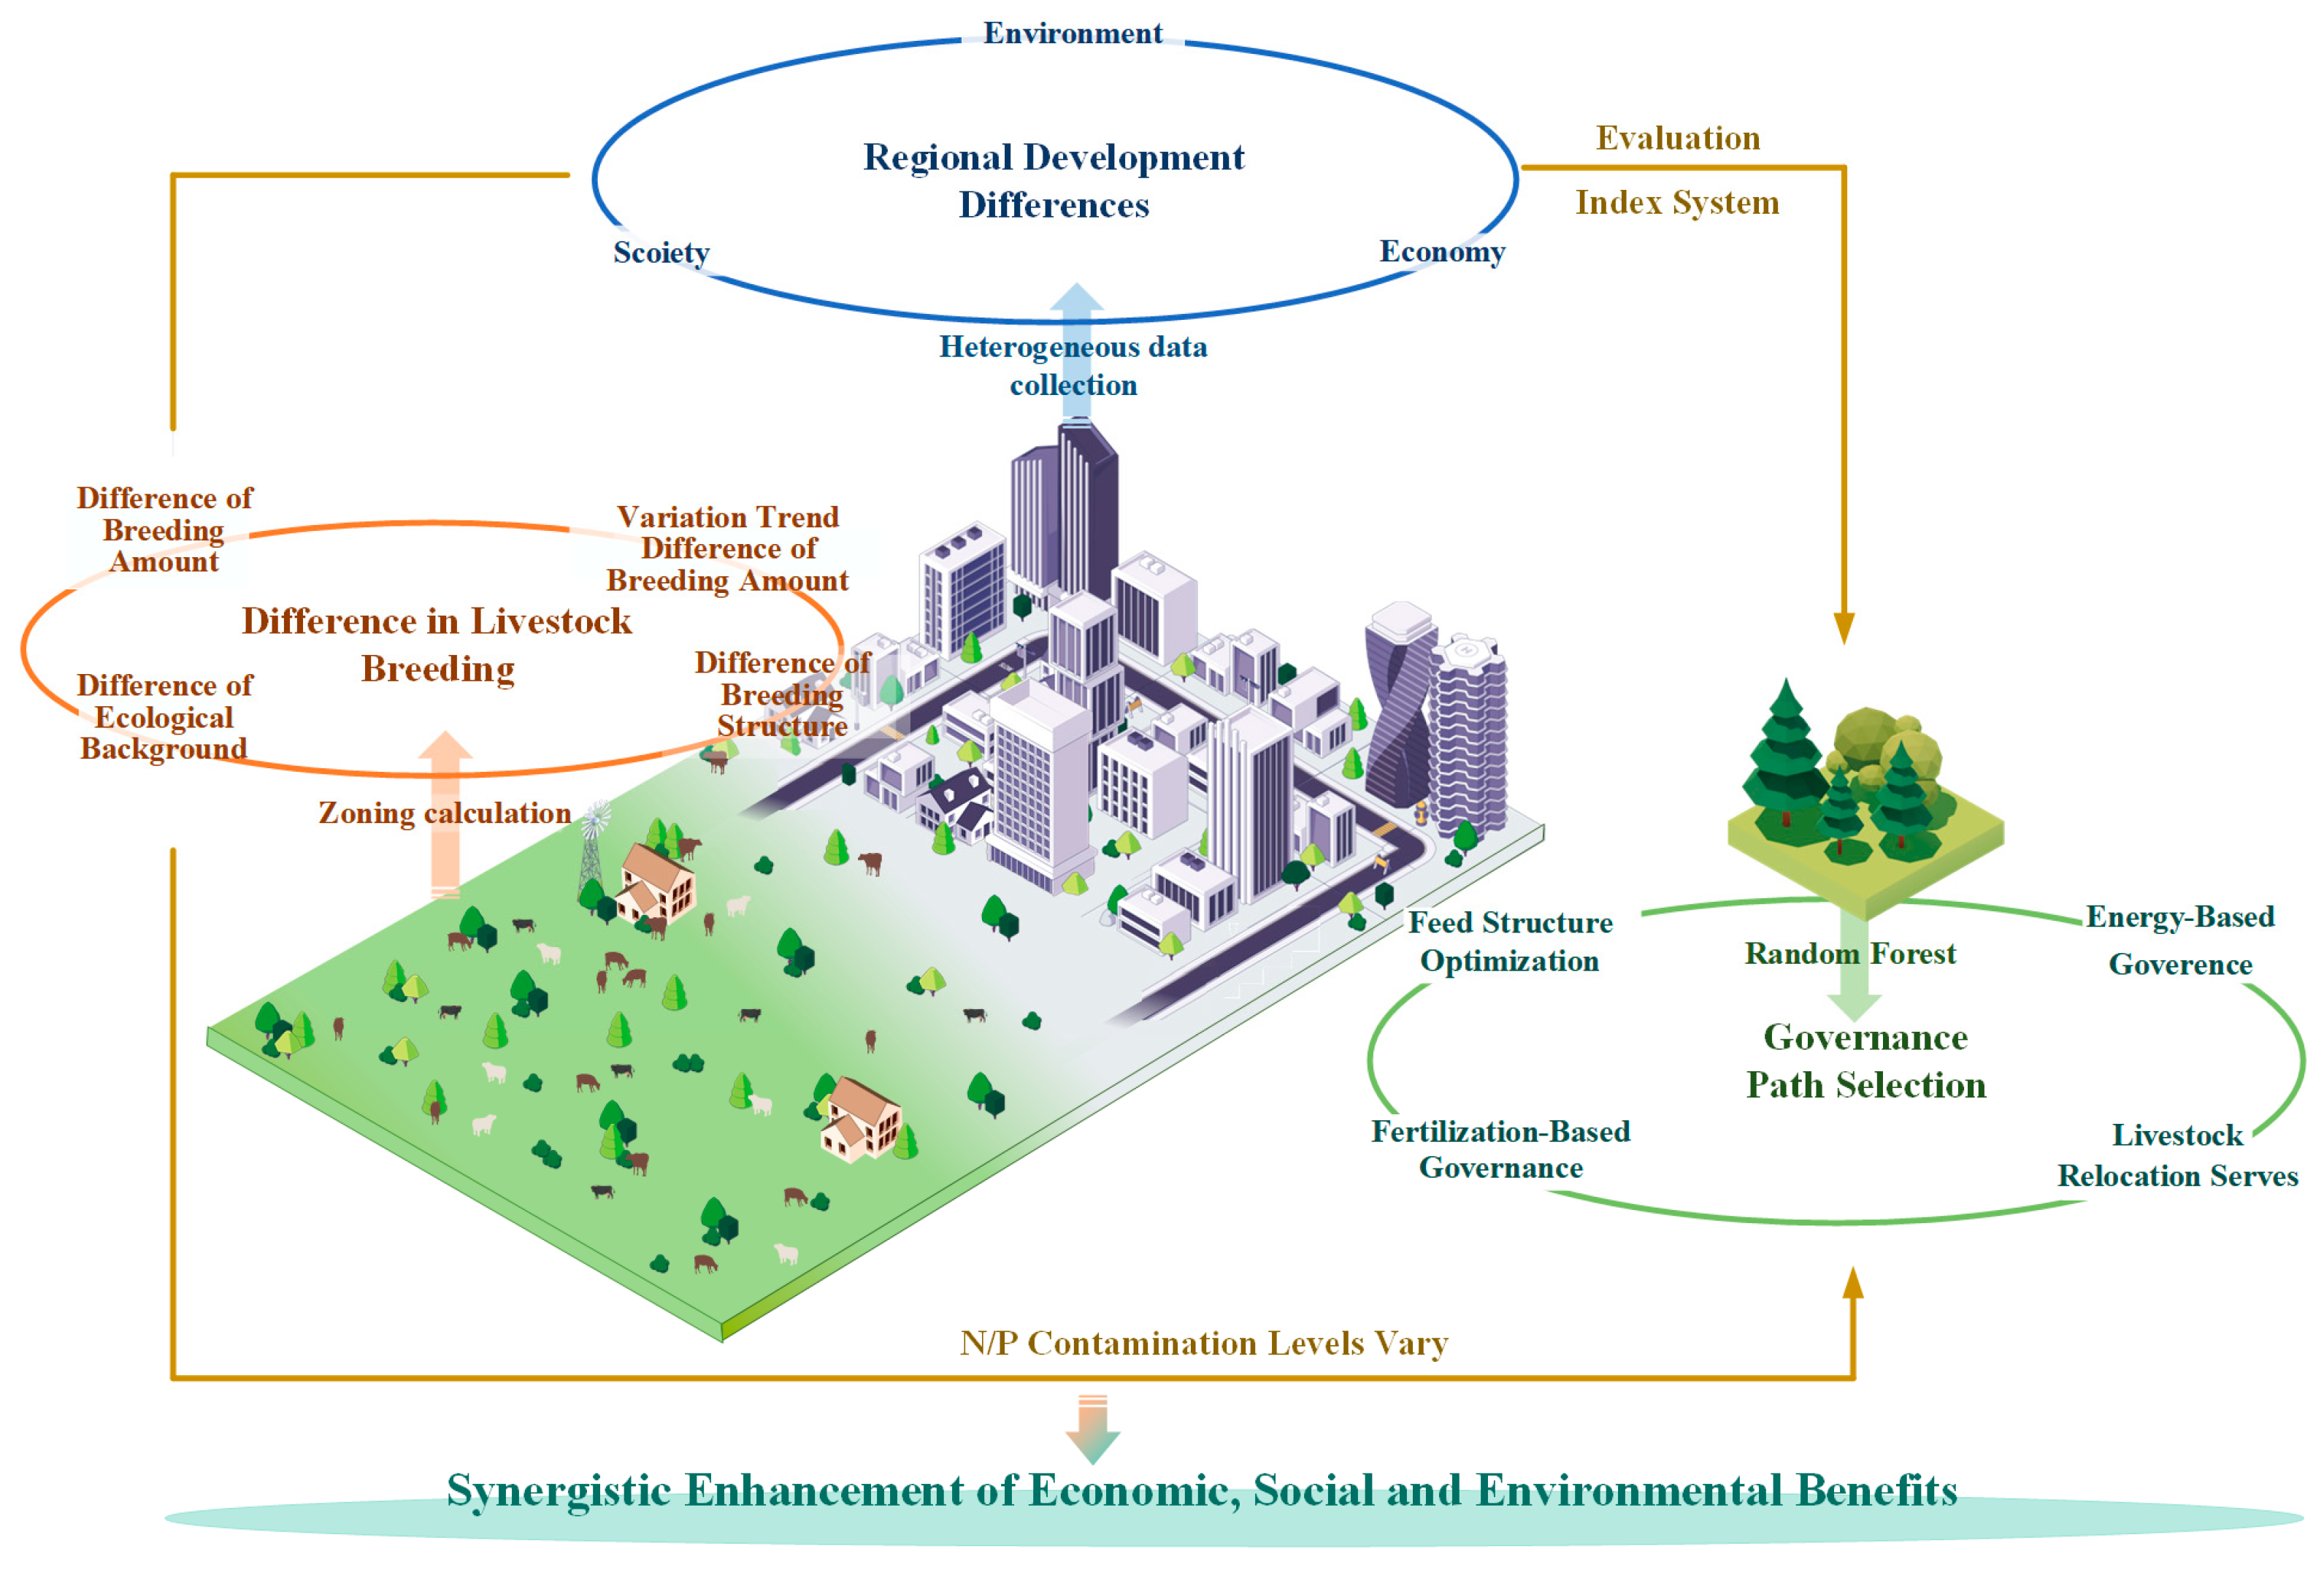
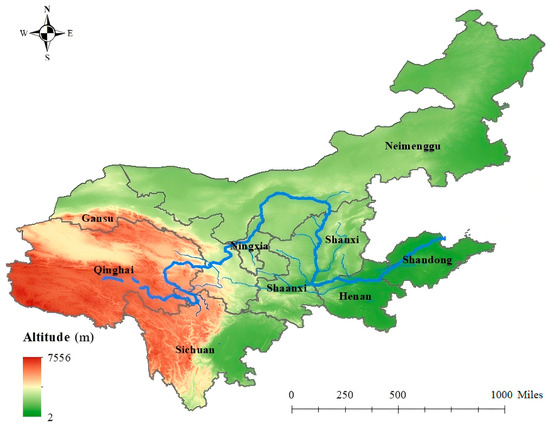
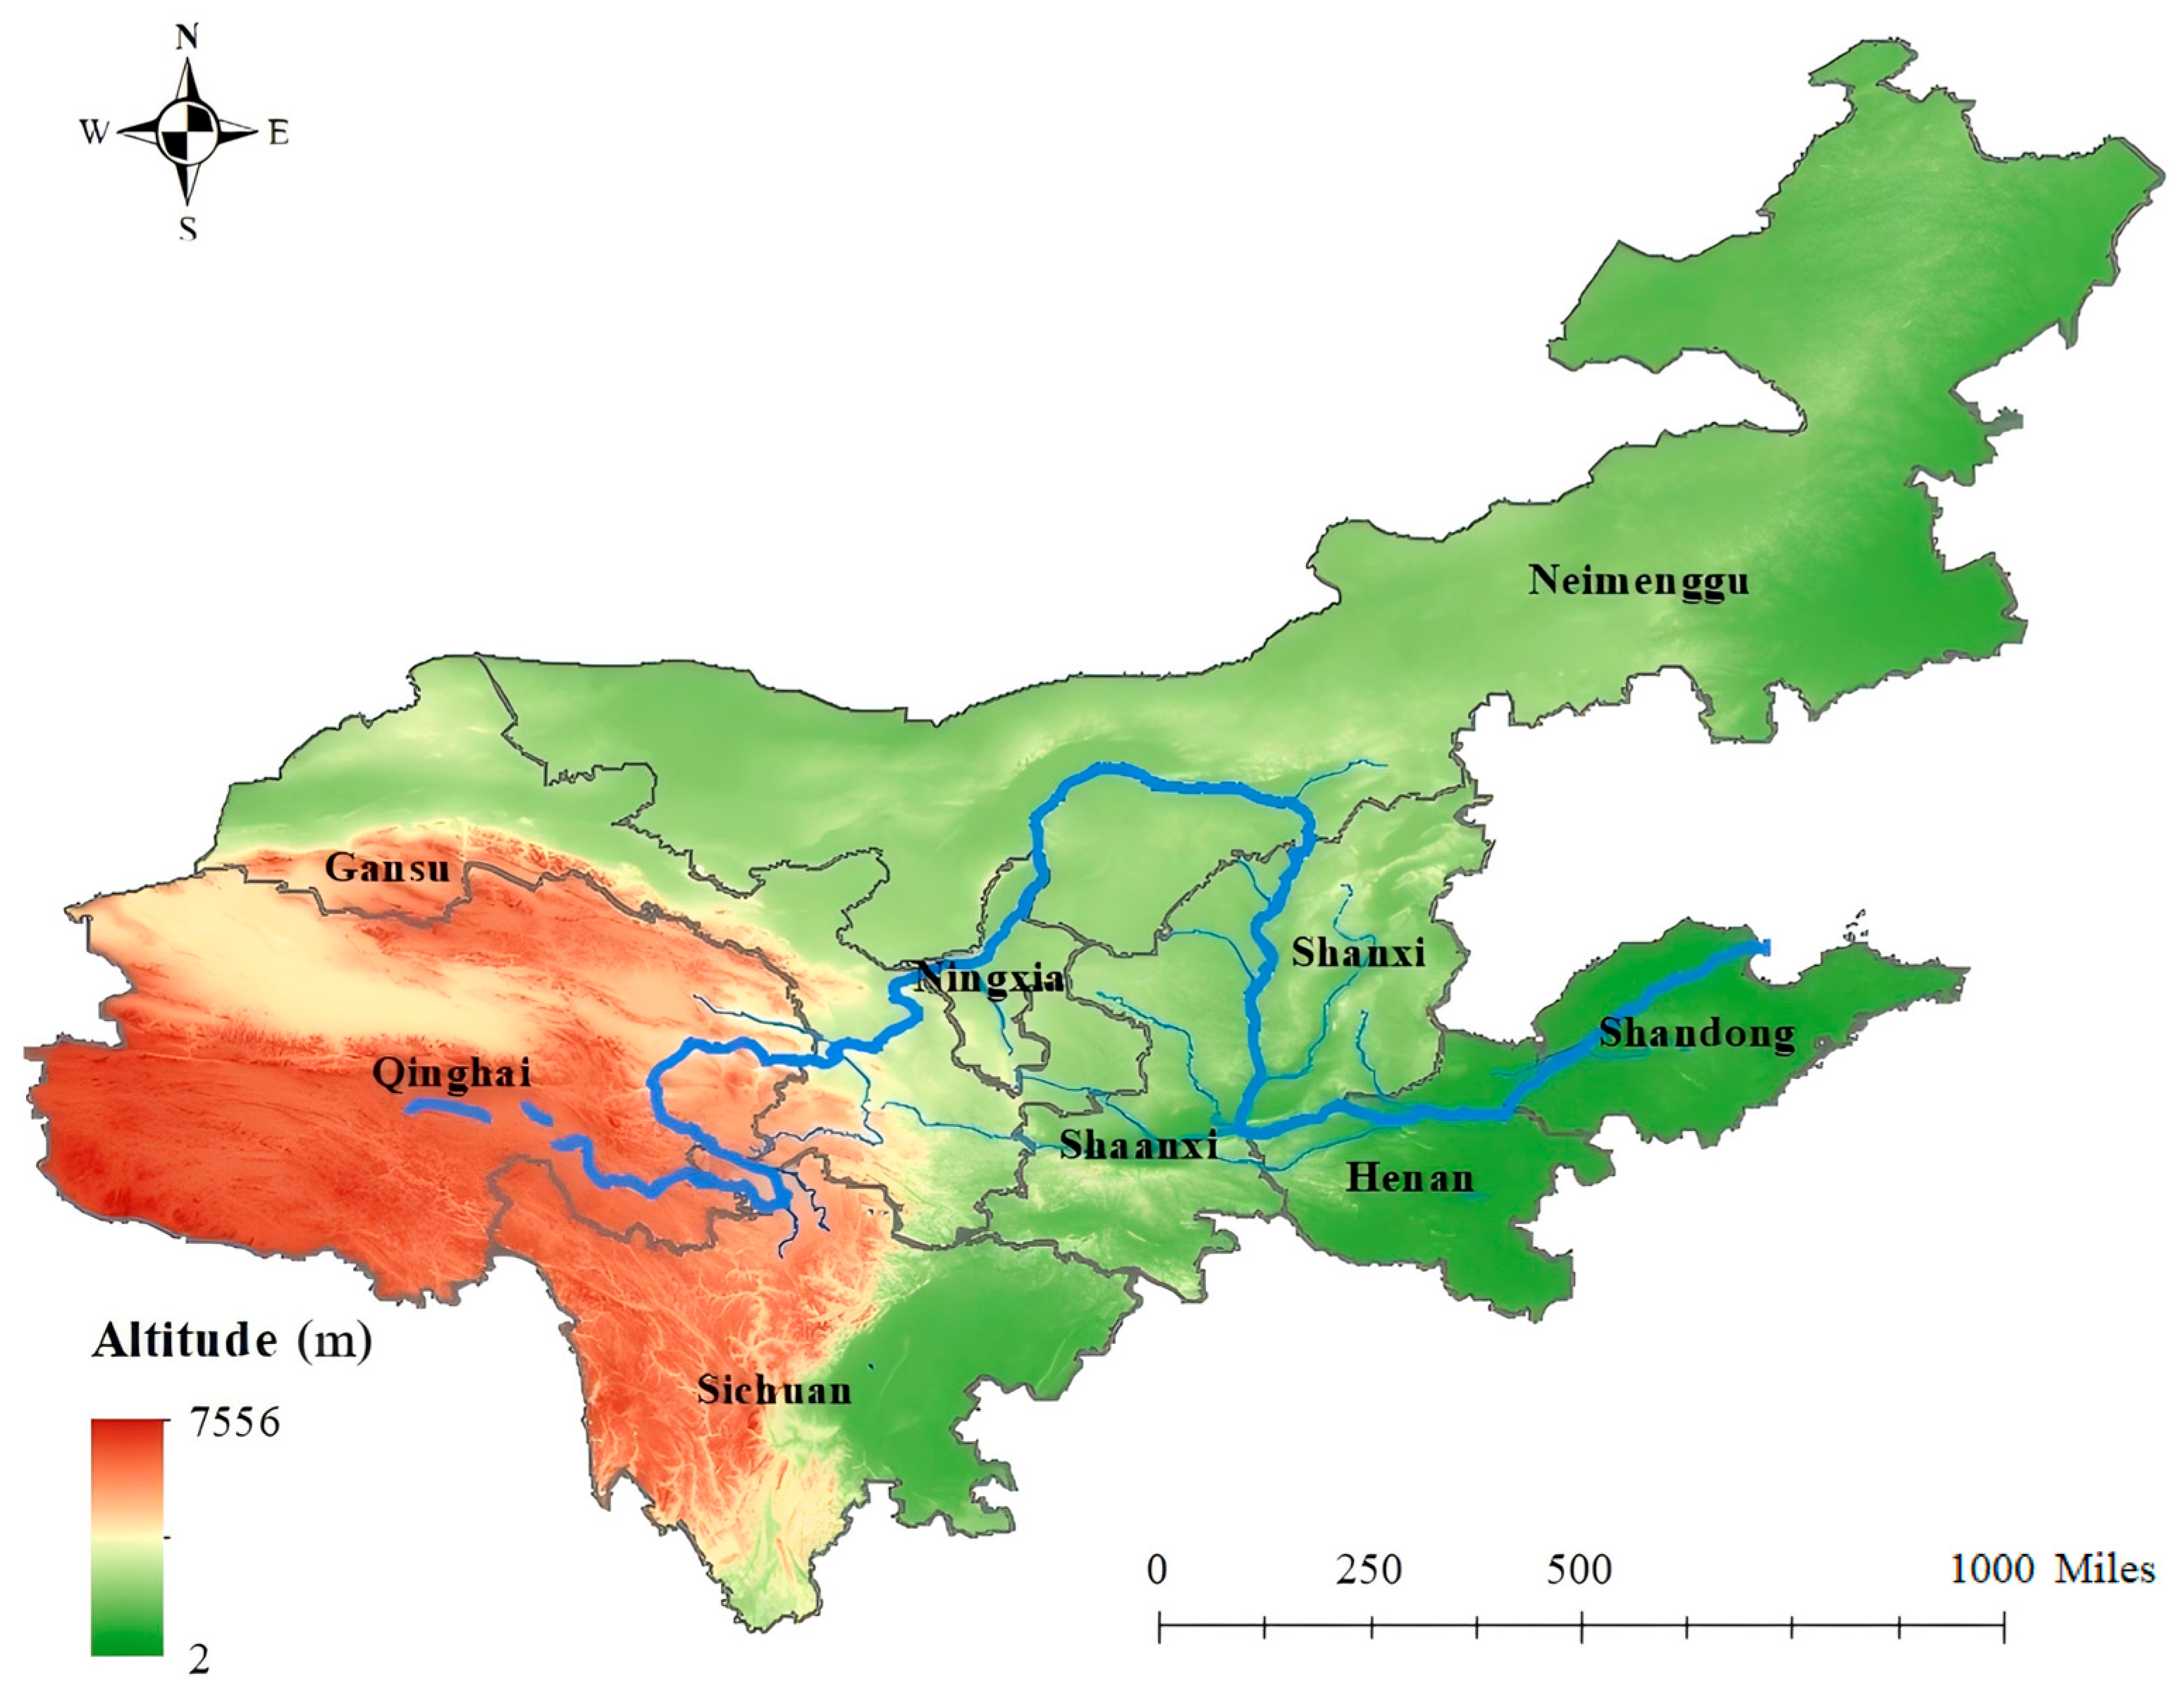
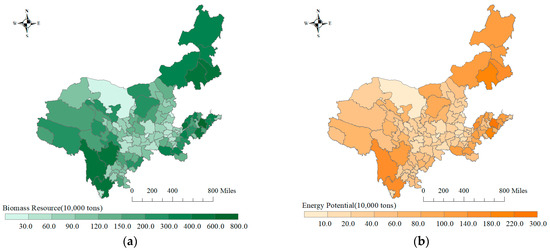
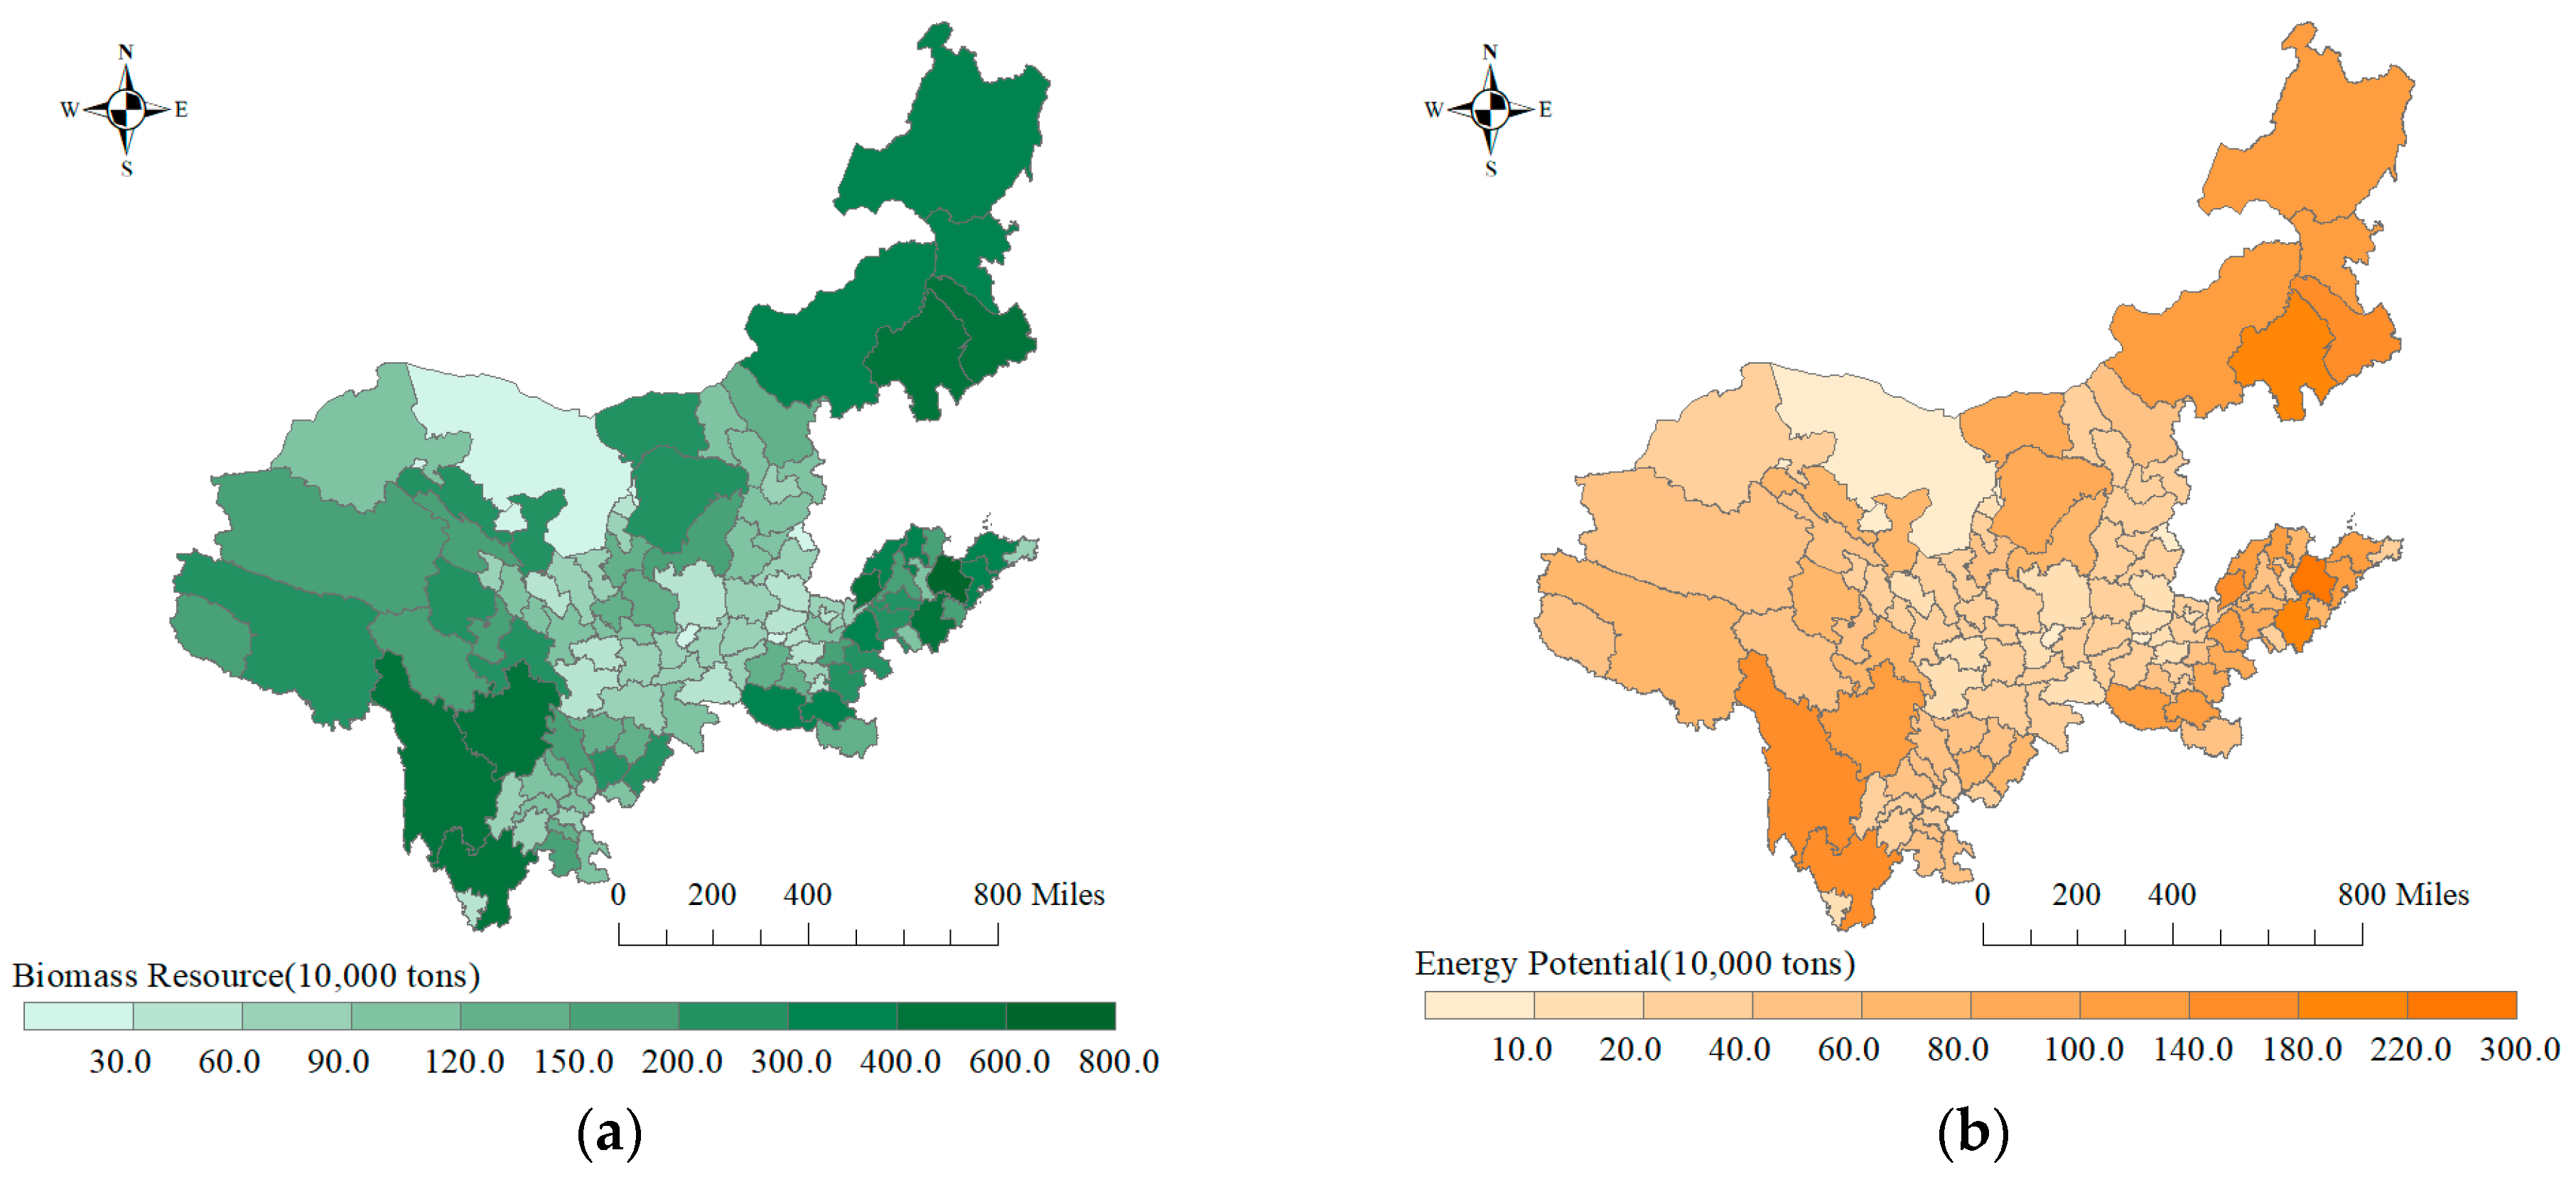
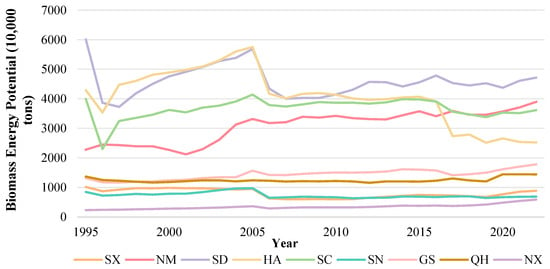
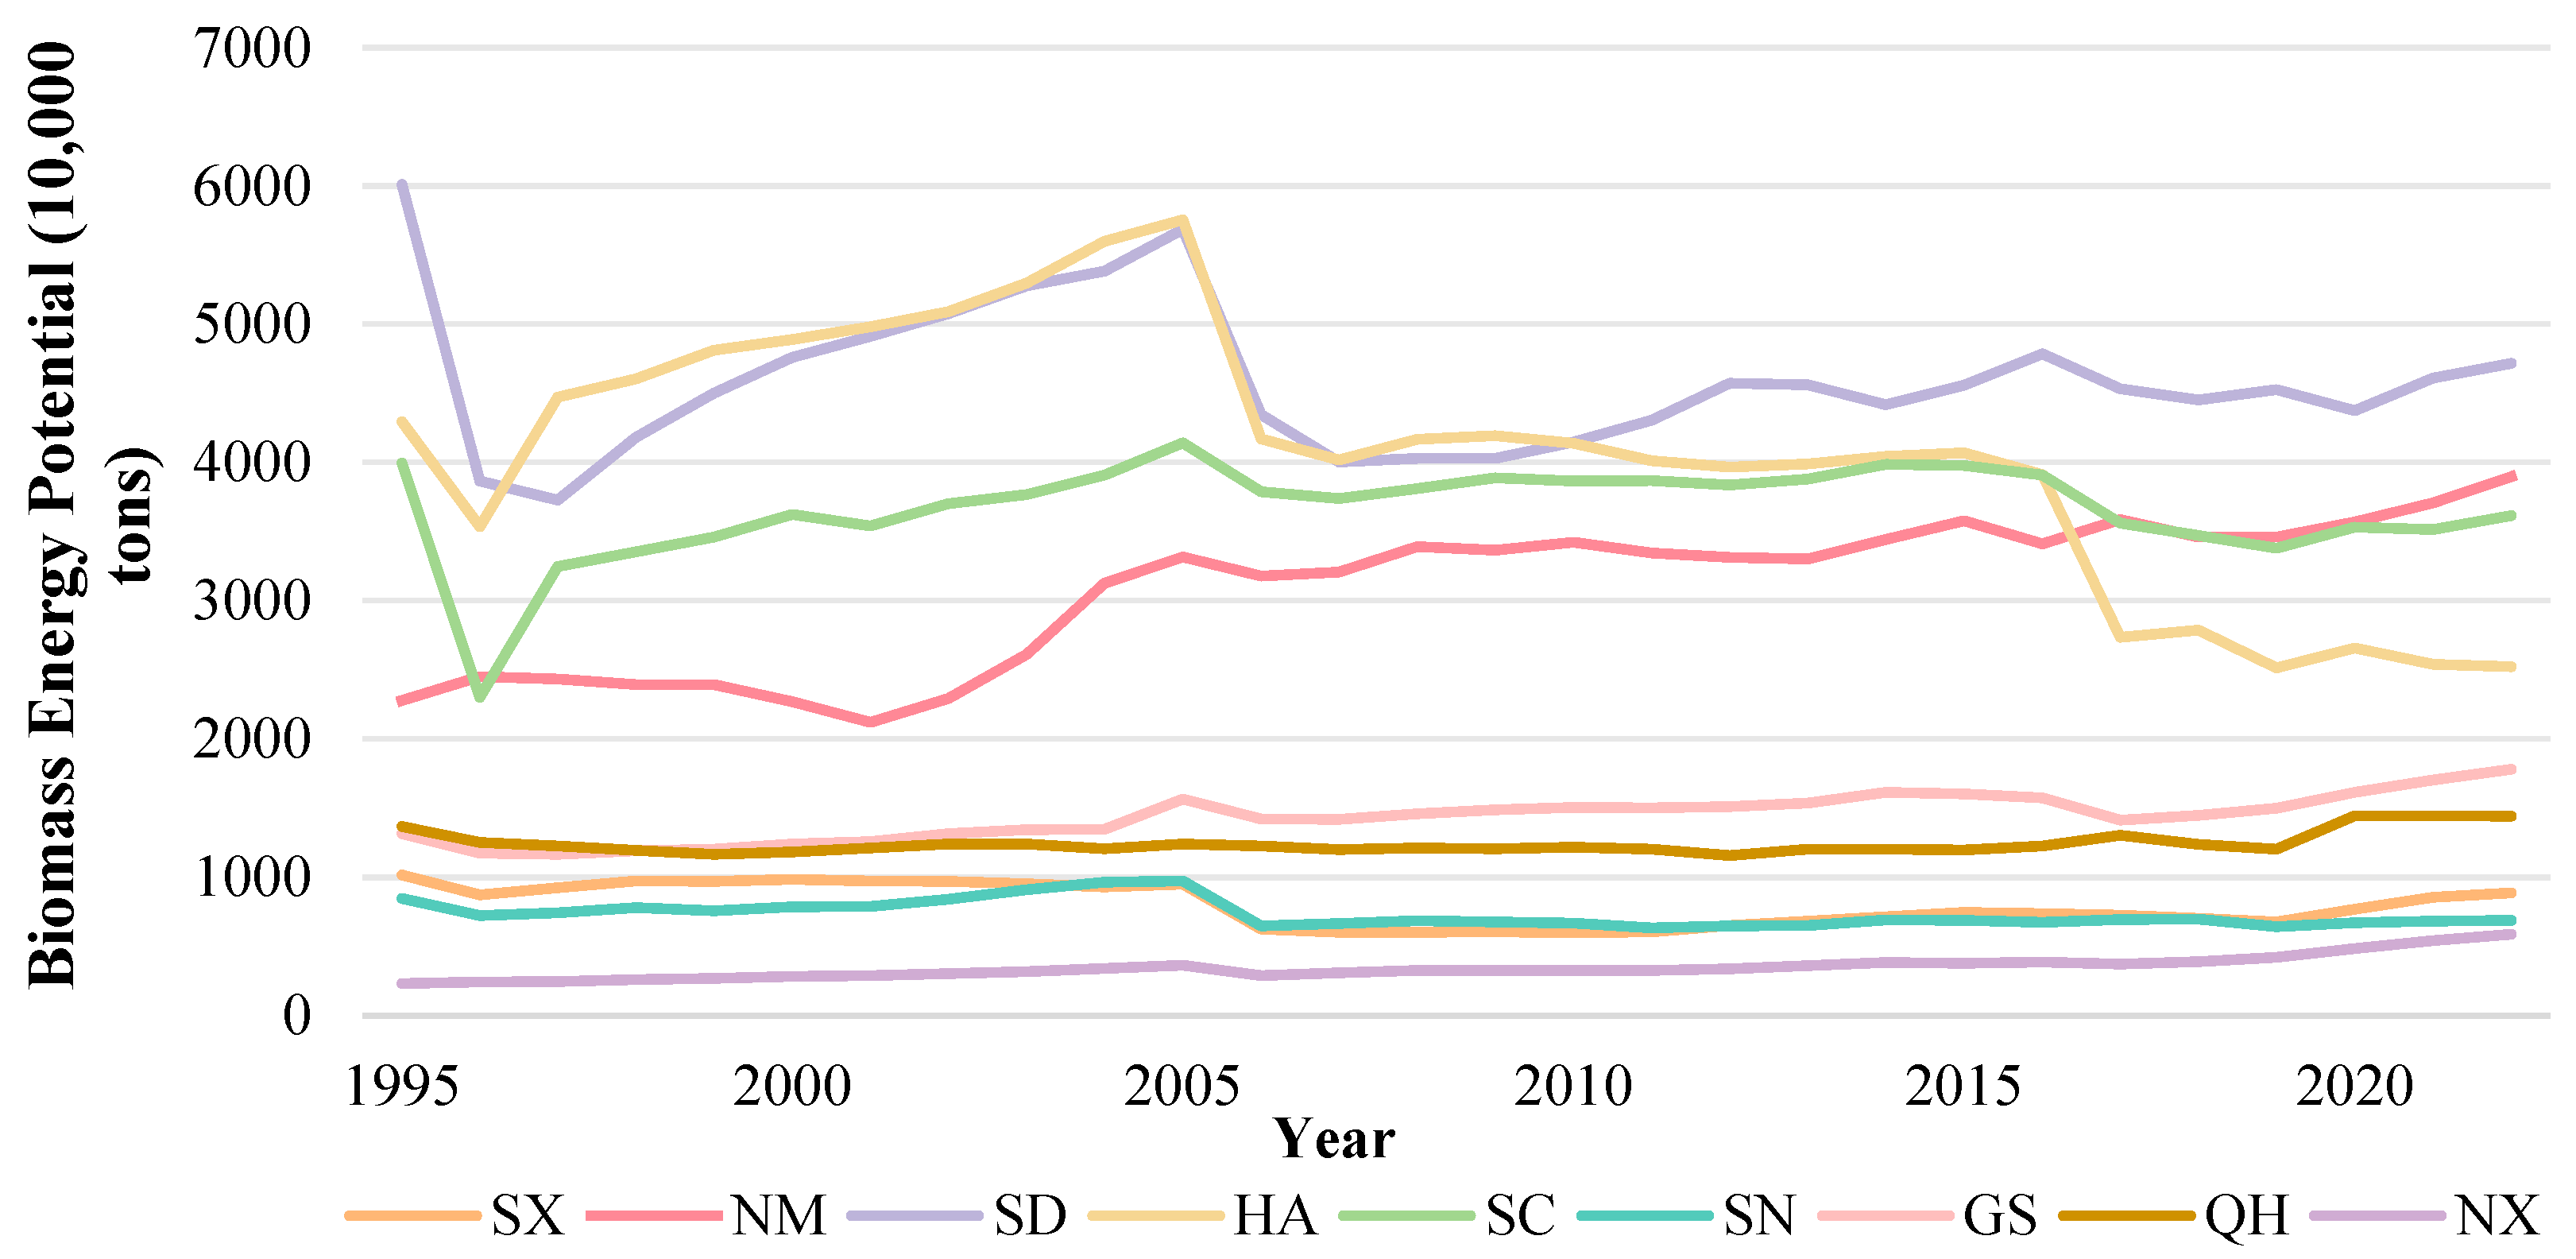
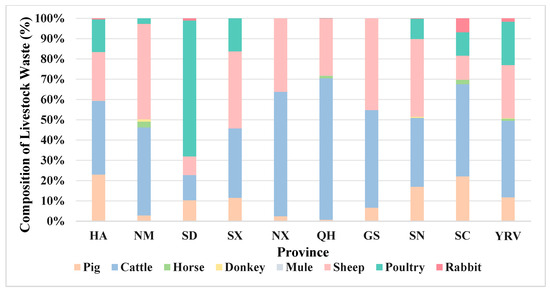
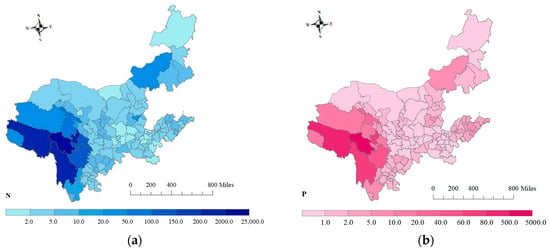
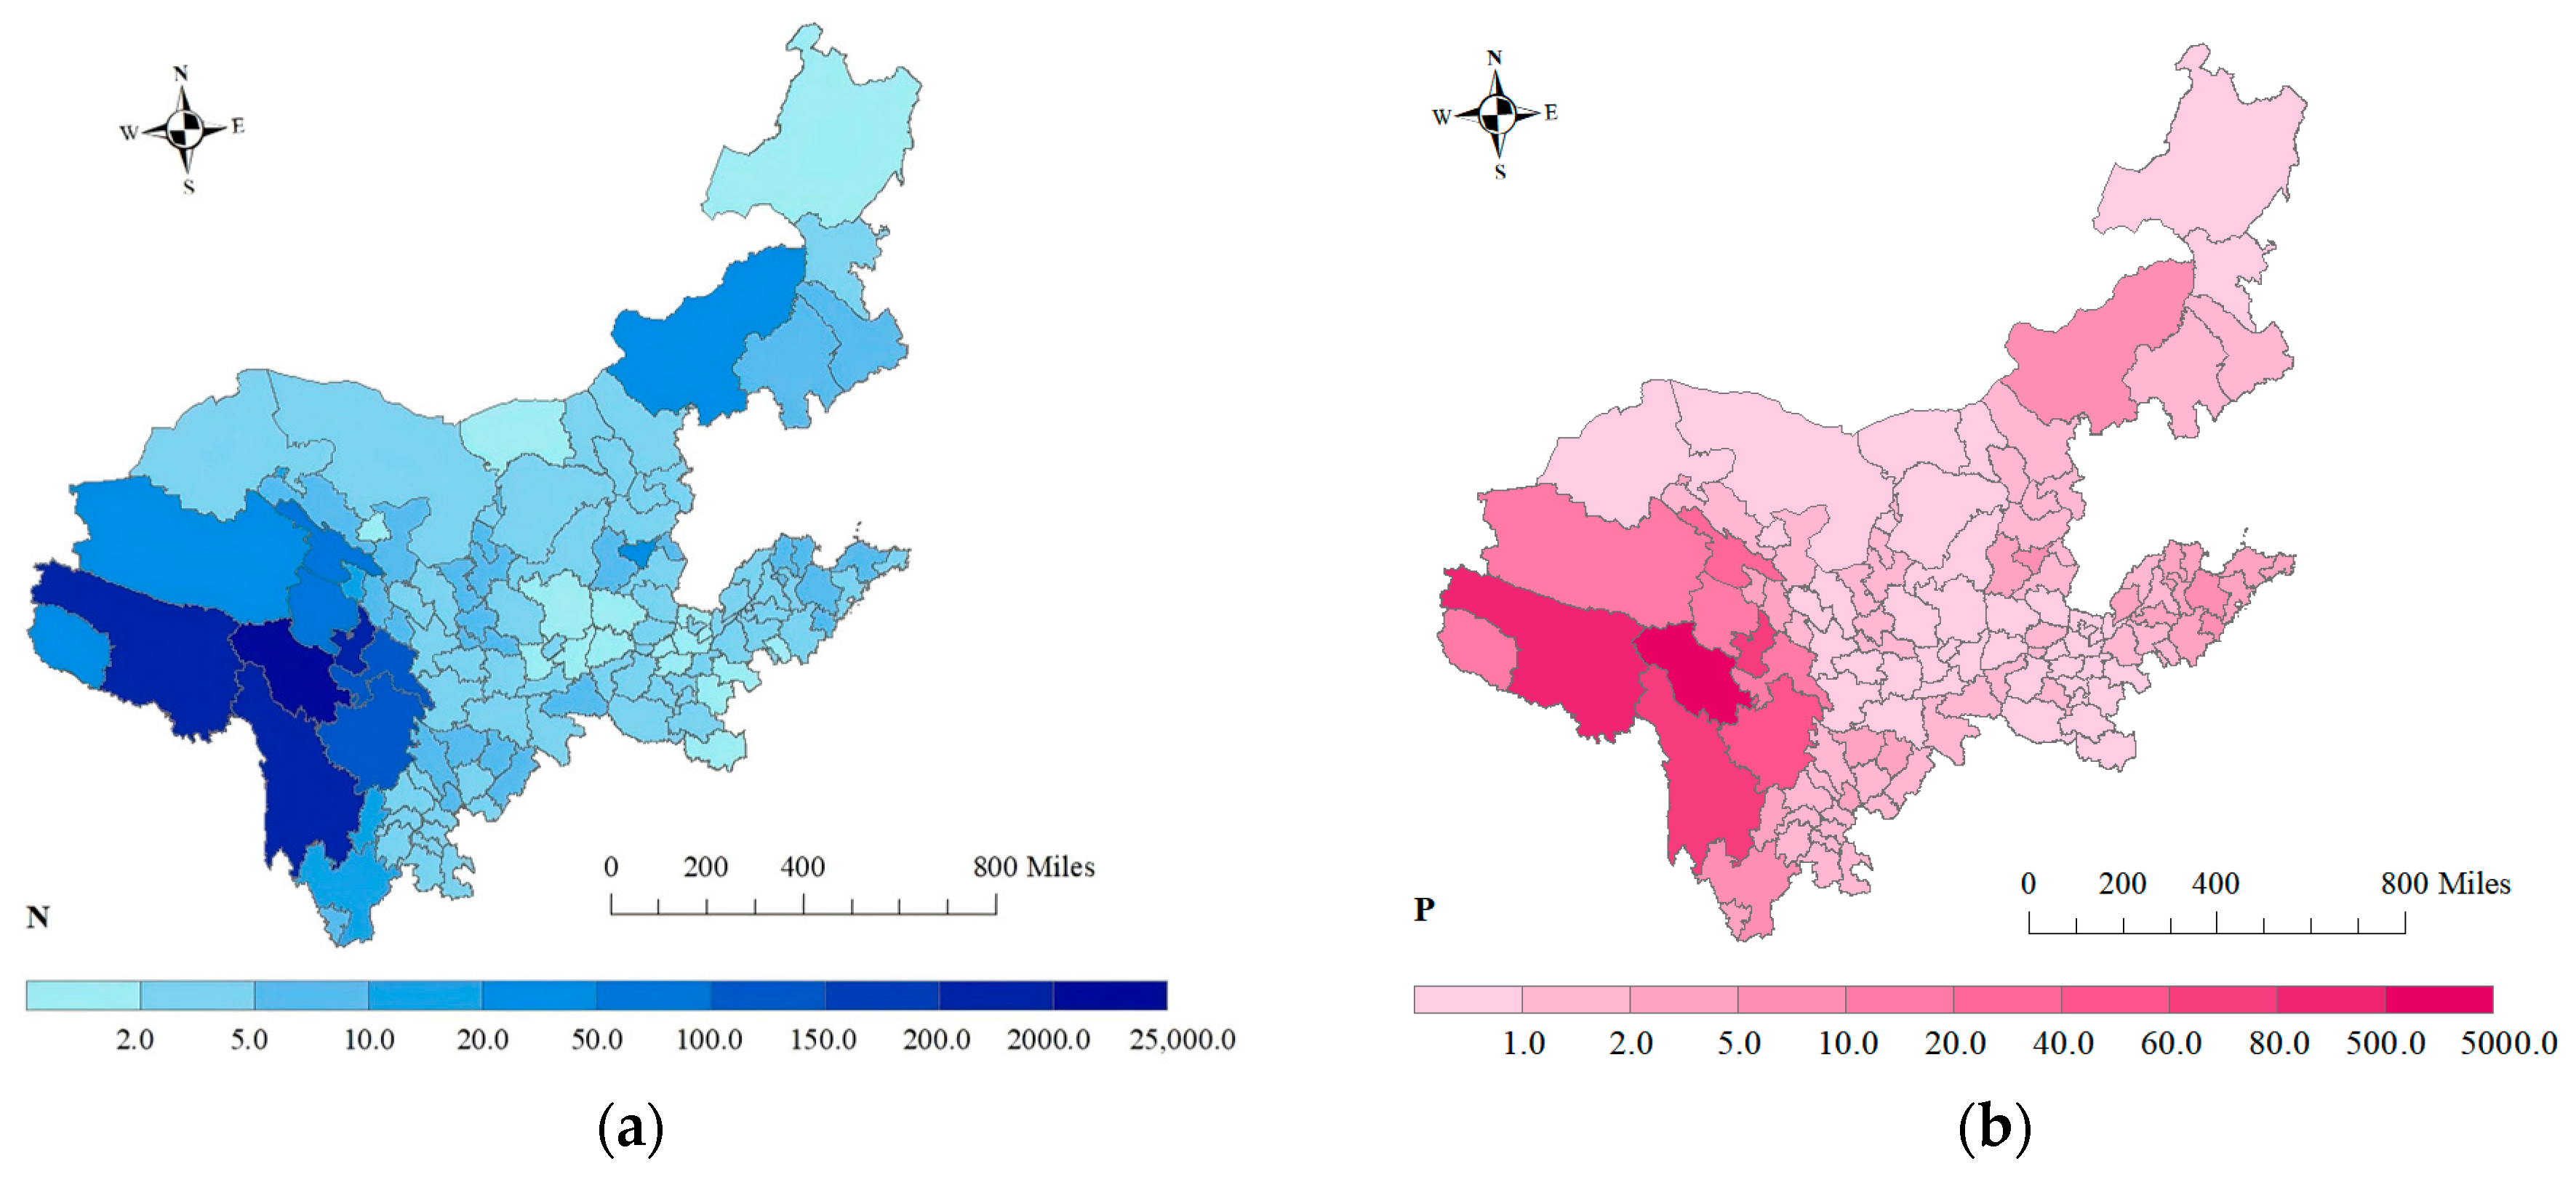
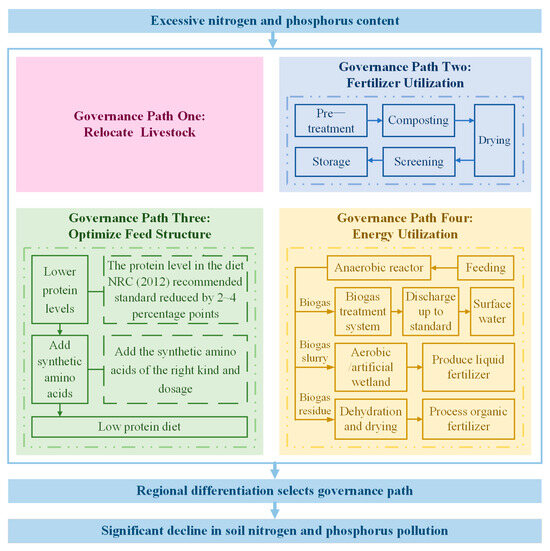
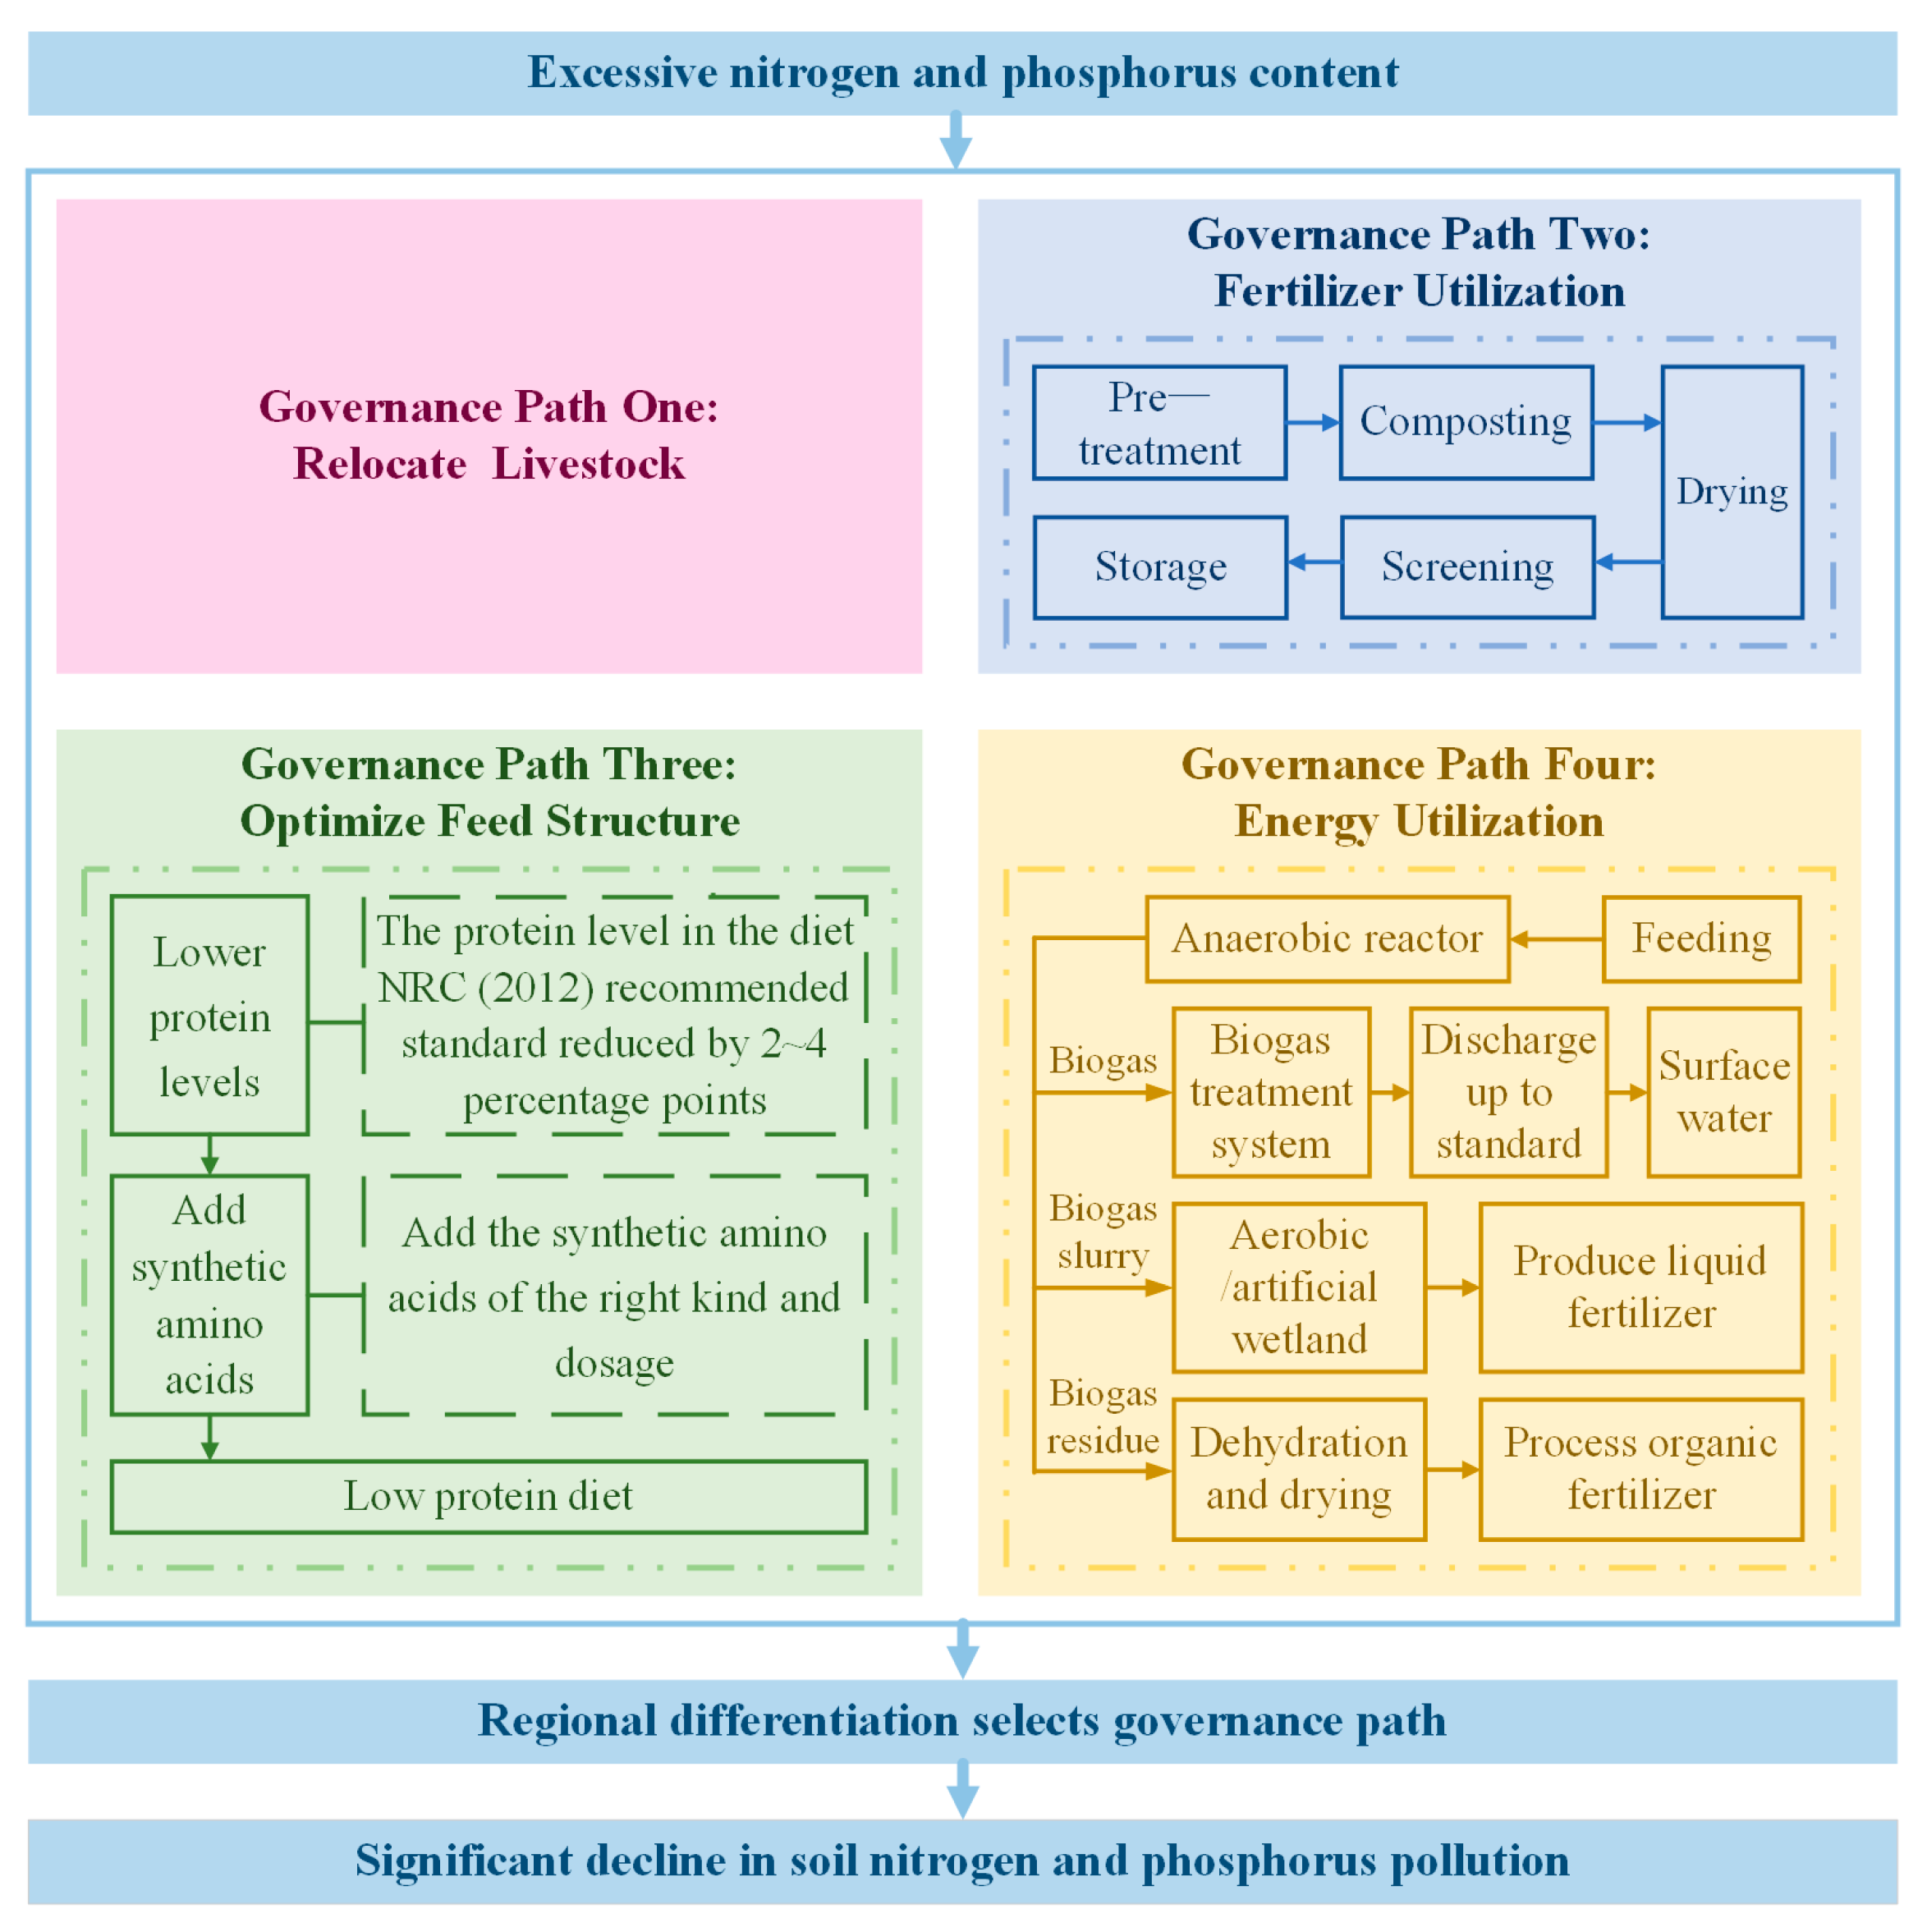
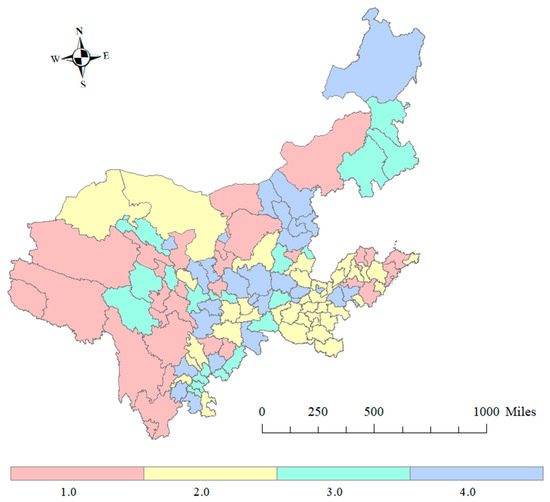
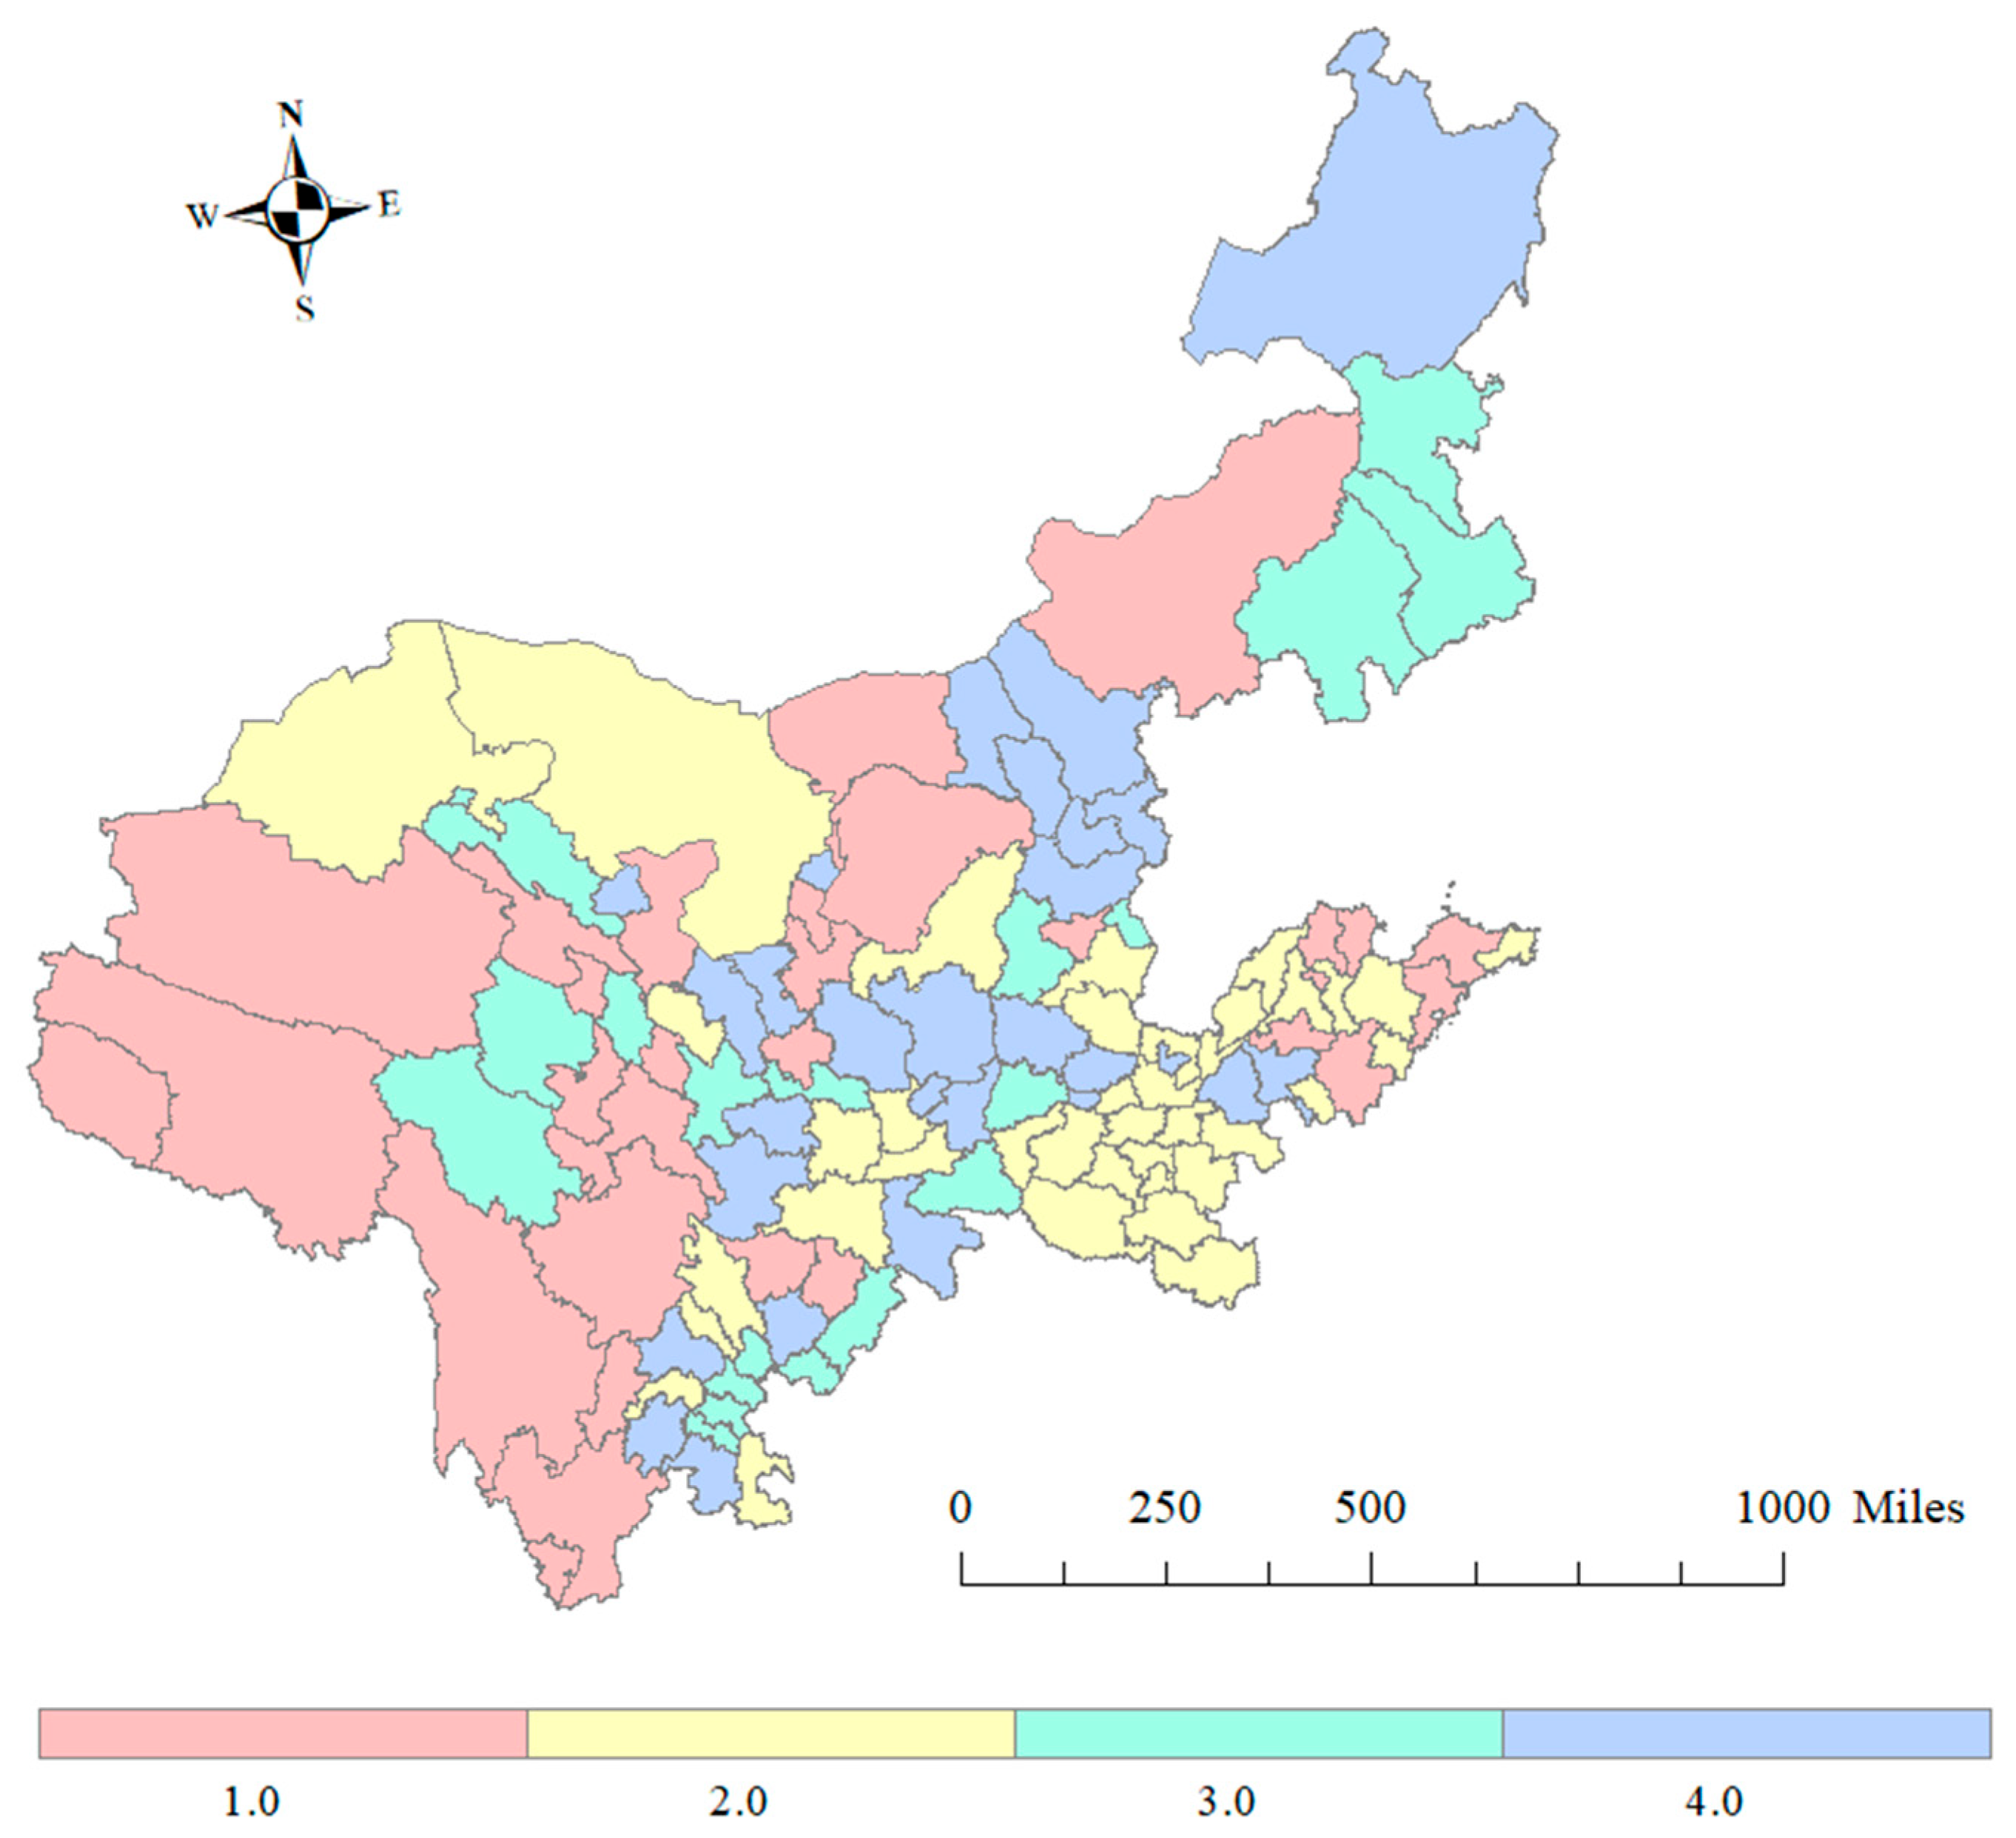
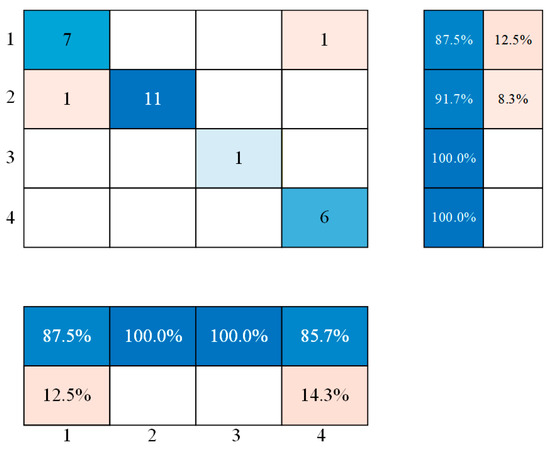
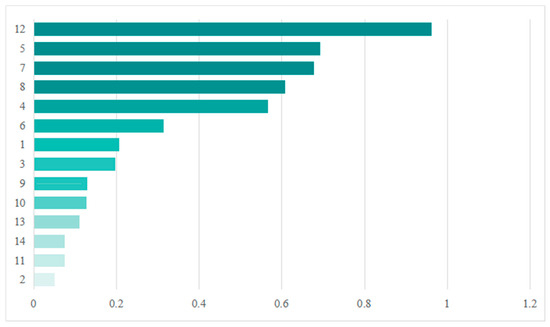
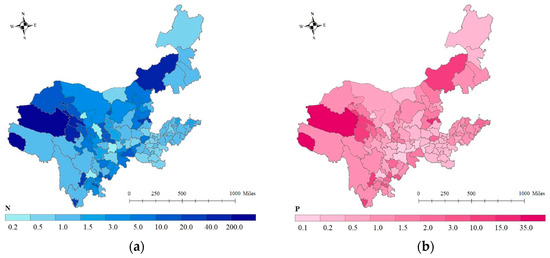

Disclaimer/Publisher’s Note: The statements, opinions and data contained in all publications are solely those of the individual author(s) and contributor(s) and not of MDPI and/or the editor(s). MDPI and/or the editor(s) disclaim responsibility for any injury to people or property resulting from any ideas, methods, instructions or products referred to in the content. |
© 2026 by the authors. Licensee MDPI, Basel, Switzerland. This article is an open access article distributed under the terms and conditions of the Creative Commons Attribution (CC BY) license.