


Abstract
In recent years, cycling mobility in urban environments across Spain has grown significantly, driven by sustainability policies and behavioral shifts following the COVID-19 pandemic. However, this growth has been accompanied by an increase in accidents in urban areas, where more than 72.6% of cyclist accidents are concentrated, with large cities being the most affected. This study aims to explore and analyze the factors influencing cycling accidents in Spanish municipalities with populations exceeding 50,000, during the period of 2020–2023. A total of 24 variables were analyzed, encompassing not only innovative cyclist infrastructure network features (line connectivity), but also urban morphology and street infrastructure, weather conditions and mobility (all transportation modes). The methodological approach combines Principal Component Analysis (PCA) with two negative binomial regression models: one addressing all cycling accidents, and another focusing specifically on collisions between cyclists and motor vehicles. PCA shows the complex relations between urban features when comparing cyclist accidents among cities. The main results from the Negative Binomial analysis show that increased bicycle lane length significantly reduces cycling accident risk, while higher intersections with traffic signal density are associated with a greater likelihood of car–bicycle crashes. These findings emphasize the importance of cycling infrastructure provision and intersection design and regulation as key policy levers for improving urban cyclist safety. Future research should seek to corroborate these results through micro-spatial analyses and accident geolocation, assessing their severity and accounting for more detailed data on cycling infrastructure. Finally, the results’ discussion underscores the importance of implementing holistic urban mobility strategies that prioritize cyclist safety.
1. Introduction
The use of bicycles as a transport mode in urban environments has experienced a notable increase in Europe [1] and, specifically, in recent years in Spain [2], which represents a crucial element in the advancement of more sustainable active urban mobility and in the promotion of a healthier lifestyle.
Traveling by bicycle helps to reduce energy consumption and emissions of harmful gases, promotes physical activity and improves overall health [3]. In order to promote bicycle mobility in cities, public administrations are implementing a series of strategic measures. Actions on urban roads include the adaptation of infrastructures and specific roads for cycling, such as segregated bicycle paths [4], the incorporation of shared public bicycle systems, and incentives for the purchase of bicycles, as well as awareness-raising and road education measures [5]. These measures not only facilitate the use of bicycles but also promote a cultural transformation towards more sustainable and environmentally friendly modes of transport. Owing to the initiatives aimed at promoting sustainable mobility that have been implemented in recent years, there has been a notable increase in the use of bicycles as a conventional means of transport but has also led to a growing trend in bicycle traffic accidents. In Spain, there are some indicators that would convey the urgency to study this phenomenon: in the interval from 2020 to 2023, cycling accidents in urban environments represented 71.6% of the total accident rate of this group in Spain. In addition, the seriousness of these accidents has shown an upward trend: the number of seriously injured cyclists increased by 21.3% (2023) compared to the figures for 2020. Some studies in other countries have started to evidence this fact; for example, in some cities in European countries, like Zurich, from 2013 to 2017, bicycle traffic increased by 35%, while bicycle accidents rose by 60% [6]. Between 1993 and 2020, Spain also experienced a significant increase in the use of bicycles, which resulted in a three-fold increase in the incidence of urban cycling accidents [2]. In turn, in recent years, some authors [7] have also found a correlation between the quality of cycling infrastructure and the frequency of accidents in the Netherlands. The study of accidents in four cities in the Netherlands (Amsterdam, Rotterdam, The Hague and Utrecht) indicates that adequate infrastructure can mitigate the increase in accidents as bicycle mobility increases, thus improving the safety of cyclists. However, this profile of studies (linking road safety with cyclist infrastructure features) is still very scarce and, with the aim to achieve a more sustainable and at the same time a safe mobility, it would be essential to carry out a holistic examination of the factors that influence, at the municipal level, the safety of cyclists taking into account the features of the cycling and street infrastructure, high traffic and speed of motorized vehicles, as well as environmental or socioeconomic factors specific to each city.
From the scientific point of view, in recent years, there has also been a notable increase in academic interest and in the production of research papers aimed at determining the most critical factors that contribute to the increase in bicycle accidents in general terms. According to Scarano et al. [8], only in 2012, a total of 48 publications on cyclist road safety were registered, which increased to 169 in 2021, indicating an average annual growth rate of 15.1%. Although, according to these figures, there has been a growing academic interest in studies of road safety for cyclists in urban areas, the scientific literature still presents few studies that analyze, at the macro level, which urban conditions favor greater cycling accidents. When comparing road accident data between cities, absolute values, such as the number of deaths, serious or minor injuries, or relative indicators, such as the number of accidents per inhabitant, are usually not sufficient to carry out a complete analysis that considers the particularities of the urban environment. In the case of Spain, there are macro-scale studies on urban accidents in general [9,10,11], and even on pedestrians in particular (Gálvez et al. [12,13]); however, this approach has not yet been applied specifically to the cycling community, limiting the ability to design evidence-based urban strategies to reduce the risks associated with the use of bicycles. Apart from the evolution of scientific research on cyclist road safety, after the end of the mobility restrictions imposed by the COVID-19 pandemic and starting in 2020, many urban areas were affected by changes in mobility patterns because of the need to maintain social distancing measures aimed at mitigating transmission. Research carried out in Europe [14,15] reveals that the COVID-19 pandemic promoted the use of bicycles and micromobility as resilient alternatives to public transport, reconfiguring urban road safety. With regard to cycling accidents, research highlights that, although lower vehicle traffic reduced the total number of collisions, the severity of accidents increased due to higher traffic speeds. In the context of Spain, there is evidence that bicycle sales experienced a notable increase of 24% in 2020, compared to the previous year, 2019 [2]; the rapid growth of bicycle use in Spanish cities has not been matched by corresponding improvements in infrastructure and regulation, resulting in increased cyclist accident risk during the early stages of cycling promotion [16].
This increase in bicycle mobility in the years after COVID-19 is significantly influenced by government policies, such as the strategy used by the Government of Spain to allocate European funds aimed at mitigating the repercussions of the COVID-19 crisis through the Recovery, Transformation and Resilience Plan [17], which involves significant investments in sustainable mobility initiatives.
These initiatives are mainly aimed at reducing dependence on fossil fuels and greenhouse gas emissions while reinforcing projects that advocate active modes of transport, such as walking and cycling, facilitated by direct investments through the Recovery and Resilience Mechanism (MRR). On the other hand, in Europe, Directive 2008/50/EC [18] establishes air quality objectives and concentration limits for the main air pollutants. This directive is the basis for the creation of low emission zones (ZBE) in member countries of the European Union. In Spain, an obligation has been established for the coming years to create low-emission zones in all municipalities with more than 50,000 inhabitants. Low-emission zones are not only based on traffic restrictions for the most polluting vehicles, but they also promote active mobility measures, such as cycling; for this reason, some cities are improving and expanding their cycling infrastructure, in addition to implementing public bicycle rental systems.
These investments after the COVID-19 pandemic in cycling infrastructure mean a paradigm shift towards more sustainable modes of transport, which translates into an increase in cycling activity and an increase in accidents: 5624 cyclist accidents were registered in 2019 (pre-pandemic year), compared to 5825 in 2021 (post-pandemic year), indicating a growth of 3.4% [19]. The main objective of this research is to analyze the factors influencing the occurrence of urban cyclist accidents following the COVID-19 pandemic in Spain, for the period of 2020–2023, using a holistic approach in order to make it possible in the future the formulation of safer and more effective urban mobility policies. This research has focused on the analysis of a cycling accident database in 152 municipalities of Spain with more than 50,000 inhabitants during the period of 2020–2023. To this end, data has been collected for twenty-four significant urban variables from various sources; and different themes: Sociodemographic, which includes data such as population, density, per capita income and motorization rate; Urban Morphology, with variables on urban surface, shape of the city and relief; Climatic Conditions, which includes the percentage of days with extreme temperatures and rain; Urban Mobility, which analyzes the use of bicycles, cars, motorcycles and the existence of public bicycle systems; Urban Infrastructure, which measures the network road, proportion of urban roads, roundabouts, traffic lights and pedestrian crossings; and Cycling Infrastructure, which evaluates not only the length of bicycle paths but also innovative variables less used in research studies until now such as the proportion, accessibility and connectivity of the cyclist network, as well as the availability level of bicycle parking.
Based on the data corresponding to the urban variables of each city, a detailed statistical analysis has been carried out using the Principal Component Analysis (ACP) technique. The objective of this analysis is to analyze and identify underlying patterns, excluding accident variables at this stage. This approach allows us to explore clusters of variables with similar behaviors, which constitute a cluster of variables that facilitate the structural interpretation of the analyzed urban system. Through this grouping, we seek to better understand the interrelationships between variables and evaluate the internal coherence of the data set.
Subsequently, several negative binomial regression models have been applied to study the factors that influence the safety of cyclists, considering variables such as cycling infrastructure, urban mobility and sociodemographic characteristics. The models have allowed us to explore different aspects of cycling accidents and to compare the significance of independent variables in different scenarios. Negative binomial regression, widely used in the modeling of accident frequencies, is especially suitable for this type of analysis, since it allows us to identify the factors with the greatest influence on the frequency of accidents, which constitutes the main objective of this study. This comprehensive methodology provides a deep understanding of the factors that condition cyclists’ road safety and offers a solid basis for the formulation of more effective public policies adapted to the specific characteristics of each municipality, as a result of the changes in mobility patterns that have occurred after the pandemic and the new policies to promote cycling while contributing to the understanding of how cycling transport should be promoted without compromising safety.
This paper is structured as follows: Section 1 contains the introduction and Section 2 a revision of the state of the art. Section 3 describes the data and methods used, including, a detailed description of the database (Spanish municipalities over 50.000 inhabitants), an exploratory analysis of cyclist accidents, and the models used in each phase of the methodology. Finally, Section 4 presents the results of the modeling, while Section 4 shows the conclusions of this paper and future research lines drawn from this research.
2. Urban Cyclist Road Safety: An Overview
Accidents related to urban cycling represent a major concern in many cities around the world and this scenario has prompted academic research in this area, which has led to some investigations aimed at identifying and analyzing the variables that influence urban cycling accidents, but very few of them at macro-level spatial units. The safety of cyclists on urban roads is influenced by factors of cycling infrastructure and its design, as well as urban planning factors, weather factors and individual and behavioral factors. The state of the art has been structured according to the most cited macro-spatial factors in the literature affecting road safety at the urban level:
- Cycling Infrastructure features
There is a great variety of cycling infrastructure and a diverse group of terms to design cycling infrastructure. According to the National Association of City Transportation Officials (NACTO), a bike lane constitutes a portion of the roadway designated by striping, signage, and pavement markings for the preferential or exclusive use of bicyclists. Depending on their level of protection from motorized traffic, their layout and their use (pedestrians can use bike lanes in some scenarios), the general term “bike lane” can be changed for bike path, side path, cycle path, bike track, and protected bike, among others. In exceptional cases and cities, common street lanes (shared with cars), called sharrows in the US, are identified as cyclist infrastructure although these do not fulfil the minimum features that a “bike lane” demands. In any case, well-designed unique bike lanes reduce the risk of accidents and provide safer spaces [3,4,20] and reduce the risk of injury [21]. Modifying shared traffic roads to dedicated bike lanes could prevent a significant number of crashes per year [22]. However, the expansion of cycling networks may initially cause an increase in the number of accidents, which could be attributed to the increase in bicycle mobility [23]. With respect to the geometry of cycling routes, high slopes can lead to higher speeds in descending sections, increasing the risk of accidents [24]; on the contrary, ascending sections are associated with a lower risk of serious accidents, possibly due to circulation reduced speed [25].
The existence of a cycling infrastructure alone is not enough to reduce cyclist crash occurrence; its design must consider the behavior of all road users to mitigate accidents [26]. Poor road maintenance and inadequate signage of cycling routes increase the risk of cycling accidents [20], while adequate public lighting improves visibility and reduces the likelihood of accidents [3].
Additional variables that may influence the safe and efficient use of bicycles in urban environments are scarcely addressed in the academic literature and present methodological challenges in terms of measurement and characterization. Notable among these are the connectivity and spatial coverage of cycling infrastructure networks, together with the provision of bicycle parking facilities [20]. Consequently, these dimensions are explicitly incorporated into the analytical framework of this study, thereby constituting a scientific contribution to the state of the art.
- Street road infrastructure
In the context of examining urban infrastructure variables that correlate with cyclist safety, numerous studies have incorporated the examination of intersections. The configuration of intersections is of paramount importance to ensure the safety of cyclists at urban level. On cycling routes, intersections represent places of greater risk, since a significant proportion of accidents occur in these places [20,27]. Inadequately designed intersections with complex routes can cause an increase in accidents due to the lack of clarity of traffic signs and the interference of different modes of transport [23,28]. At intersections, research indicates that physically segregating cyclists from motor vehicles, such as dedicated bike lanes, can improve the safety of cyclists with motor vehicles. Although roundabouts often reduce vehicle collisions, they can pose a risk to cyclists, unless they are designed with dedicated bike paths [3]. Moreover, multi-lane roundabouts without specific roads for cyclists can significantly increase risk [20]. Even in the case of separation between cyclists and motorized vehicles, this separation can also lead to risky behavior, such as skipping red lights, especially at intersections with little motor vehicle traffic [29]. In addition, proximity to public transport stops, such as bus and tram lines, can considerably affect both the incidence and severity of bike accidents [20], due to a higher interaction between pedestrians, cyclists and motorized vehicles.
This paper has integrated additional variables relevant to urban infrastructure, poorly analyzed in previous literature at the macro level (such as the number of urban roads, roundabouts, intersections equipped with traffic signs and pedestrian crossings), in order to compare several different urban environments though the sample of cities.
- Road traffic
High flows of motorized traffic and high medium speed of these flows are associated with a greater likelihood of accidents, especially in urban environments [20]. Consequently, the application of measures such as traffic calming actions and the reduction in speed limits can improve the safety of cyclists [20], and roads with low-speed limits (30 km/h) show less exposure to the adverse effects of motor vehicles [30]. The literature has also shown that the strategic installation of speed cameras can also mitigate cyclists’ injuries [31].
In recent years, in Spain, numerous cities have adopted public bicycle rental systems, including an increasing proportion of pedal-assisted bicycles. Although these systems seek to promote sustainable mobility and reduce urban congestion, the impact they have on road accidents is an aspect that has not yet been conclusively evaluated, suggesting the need to incorporate these variables into this study to analyze the implications of these systems for the safety of cyclists and their relationship with traffic accidents in urban environments.
- Socioeconomics and Urban planning features (Urban shape)
In terms of urban fabric features, previous research [20] has underlined that urban areas with a high population density tend to have a higher incidence of bicycle accidents [20]. The urban configuration of cities is intrinsically linked to the orographic characteristics of the terrain. Cities with rugged topography, characterized by significant unevenness, tend to have roads with steep slopes. This peculiarity, in the context of cycling mobility, can significantly increase the risk of accidents. In addition, the geographical location of a city, either due to its proximity to the coast or its alignment along valleys between mountains, directly influences its urban morphology and the design of its road layout. There is little academic research that addresses these issues and their relationship with cycling accidents; for this reason, the following variables have been identified and analyzed in the present study: the relief, associated with the existing slope, and the shape, which describes the relationship between the width and the length of the city area. Urban configurations in the form of networks or grids usually facilitate the dispersion of vehicle traffic on numerous roads, reducing speed and allowing for the existence of alternative roads and uninterrupted cycling networks. On the contrary, linear urban models tend to concentrate traffic flows and conflicts on a limited number of axes, increasing the potential for interactions between vehicles.
- Bike user profile and behavior
The physical characteristics of cyclists also condition accidents’ occurrence, and several studies indicate that older people are at greater risk of accidents because their reaction times are slower and their greater vulnerability to serious injuries [20,32]. However, the impact of age-related factors may vary in different countries and contexts; in Brazil, for example, most victims of bicycle accidents are men between the ages of 11 and 20 [33]. Studies in Nagoya (Japan) found that children are more likely to have accidents in residential areas, while young and adult cyclists are more at risk in commercial areas [34]. In addition, male cyclists are more likely to suffer injuries and collisions compared to female cyclists; men have a risk of accidents 1.43 times greater than women, which can be attributed to differences in cycling behavior and in risk-taking tendencies [32]. The experience of cyclists also influences crash occurrence, since less experienced cyclists are more likely to suffer accidents [20]. The above-mentioned investigations determine that understanding behavioral patterns in urban environments is crucial for the examination of cycling-related accidents; however, with respect to the scope of current research, this particular variable has not been taken into account for the evaluation of macro-level accidents in urban areas due to the absence of a uniform data repository (such as the cyclist experience) that allows for the correlation of all the cities examined. Moreover, this research is more focused on the urban features conditioning cyclist road safety using open access urban databases, nor dependent on cyclist surveys.
- Weather conditions
Weather has a significant effect on cyclists’ mobility and safety in cities. Warm days generally encourage cycling, while extreme cold or heat can deter it [35,36]. On the other hand, rainfall has a negative impact on cycling rates; heavy rain creates slippery surfaces and reduces visibility, increasing the risk of accidents [36]. Strong winds increase discomfort and physical effort for cyclists; however, the impact on mobility and accidents is less pronounced compared to temperature and rainfall [35,37]. In addition, it is necessary to take into account the time of day when the trip takes place; accidents are more frequent at noon and at 8:00 p.m., with peaks on Fridays and Saturdays [33]. As demonstrated by the results of previous academic research, the different meteorological conditions that exist in different urban environments can significantly affect the frequency of cycling-related incidents; therefore, it has been considered essential to incorporate variables related to temperature and precipitation as factors to be examined in the scope of this study.
- Methods and models for cyclist road safety analysis
Over the past decade, academic research on the safety of cyclists in urban environments has been addressed using several research methodologies. Among them, quantitative studies stand out, which use statistical analysis and regression models, such as negative binomial regression, in order to identify factors associated with the occurrence of accidents and estimate risks based on different variables, such as sociodemographic, infrastructure and environmental variables. In addition, machine learning techniques are increasingly important in the field of cyclist safety research because of their ability to analyze complex data sets and discover patterns that traditional methods may overlook [8]. Over the past five years, the integration of Explainable Artificial Intelligence (XAI) and Large Language Models (LLMs) has transformed predictive capacity in cycling safety research. For example, recent studies using XAI have been fundamental to understanding gender gaps in bike-sharing services [38], while LLM-based studies are currently being used to analyze the severity of electric bike accidents [39]. However, negative binomial regression remains a robust tool for macro-level analysis.
Quantitative studies on traffic accidents are quite dependent on the spatial unit of analysis. The spatial distribution of cycling accidents in urban environments, together with the various factors associated with the built environment, can be examined in multiple territorial dimensions at the macroscale (such as the country, region, city or urban district) or at the microscale level (including analogous segments or intersections of road infrastructure). This paper will focus on a macroscale analysis, specifically at the city level. There is extensive research on macro-scale road safety studies [40], but few of these studies are devoted to cyclist accidents in urban environments.
Specifically in Spain, the only study on cyclist road safety, by Gomes-Bastos et al. [2], which highlights the growing trend of bicycle accidents in urban areas of Spain between 2000 and 2020, only develops a comparative analysis of four Spanish cities (Barcelona, Madrid, Seville and Valencia). The results revealed significant differences in cyclist accident rates and infrastructure quality among cities. One of the main drawbacks of this study is that a limited mathematical analysis was carried out, focusing on standardized indicators, without estimating any accidents the mortality rate adjusted to the population and the comparison of year-to-year trends. A more robust analysis was developed in Britain a year before by Daraei et al. [41], who also compared and analyzed data from bicycle accidents in the cities of London, Boston and Pittsburgh to build a model that quantifies cycling safety as the relative probability of a serious bicycle accident occurring in a given location. Apart from these two studies, no further evidence has been identified in the literature on an in-depth comparative analysis of urban characteristics and their impact on the safety of cyclists in a large number of cities in the same country. This gap in the literature suggests the need to carry out studies within the research framework proposed in this paper.
The analysis of recent studies in the academic world reveals a connection between the increase in cycling traffic and the corresponding increase in accidents, highlighting that adequate cycling infrastructure can alleviate this problem. However, research on factors affecting the safety of cyclists on a large scale, especially at the urban level, remains limited. In this framework, the present research explores a topic that has been little discussed in the existing literature by carrying out an exhaustive and macro-spatial examination of the elements that influence bicycle accidents in urban areas of Spain. Its main contribution is found in the extensive and exhaustive nature of the methodology used. Unlike previous studies, which were limited to a limited number of cities and used limited mathematical models, this research carries out a comparative evaluation in 152 Spanish municipalities with populations exceeding 50,000 residents. This broad scope facilitates a more detailed analysis of urban and mobility factors at the municipal level. In addition, this research stands out for integrating a wide range of twenty-four variables, including several innovative ones that have rarely been investigated in previous large-scale research, such as the proportion, accessibility and connectivity of cycling infrastructure, in addition to a particularly significant and distinctive aspect of this study, which is the examination of the effects of public bike-sharing systems. Despite being defended as sustainable mobility instruments, the correlation between these systems and cycling accidents has not been specifically evaluated at the macro level in the literature.
The combined application of Principal Component Analysis (PCA) with two negative binomial regression statistical models offers greater analytical depth than traditional approaches based solely on descriptive indicators. This approach allows for a more specific understanding of the risk factors affecting cycling accidents. Overall, this study seeks to identify the urban, infrastructure and mobility factors that condition cycling safety in Spain during the period of 2020—2023, helping to generate solid empirical evidence for the design of public strategies aimed at safer and more sustainable mobility.
3. Data and Methods
The methodology for the analysis and treatment of the study data is structured in four sections: First, the case study is presented, and the general characteristics of cycling accidents are described; then, the selected cities are analyzed according to their population size and urban variables that condition road safety are identified. Next, a statistical methodology based on Principal Component Analysis (PCA) is developed to explore relationships between urban variables, and negative binomial regression models are applied to determine the factors that affect the frequency of accidents.
3.1. Case Study
The official traffic accident database (provided by the DGT) will be used to analyze cycling accidents in Spain. The Spanish traffic accident database represents a relational database that covers information on accidents, drivers, pedestrians, occupants and vehicles. On urban roads, the municipality where each accident was reported and the location are recorded as the postal address closest to the place where it occurred. Consequently, an analysis of the frequency of traffic accidents can be developed, without the georeferencing process, using the municipality as a spatial unit of study. The Spanish accident database has had different formats and configurations for storing data over the years. The operating application that has been used since 2016 is called ARENA2. To avoid data homogenization processes, only data provided with that data structure has been used in this study. Consequently, in this section, the period of 2016–2023 will be analyzed (being 2023 the last year available) in order to explore the impact of COVID-19 on cyclist crash evolution. Obviously, the year 2020 is an atypical mobility period, and 2021 was still affected by social distancing and vaccination processes, while 2022 and 2023 can be considered recovery periods.
In Spain, between 2016 and 2023, a total of 62,777 cyclist accidents (any road accident with a cyclist involved) were recorded, resulting in 588 deaths, 5578 serious injuries and 54,593 minor injuries. Focusing on urban roads, 44,974 cyclist accidents (representing 71.6%) were registered, causing 195 deaths (equivalent to 33.2%), 2952 serious injuries (constituting 52.9%) and 38,455 minor injuries (representing 70.4%) during the same period. Table 1 shows the accident data for the study period. A comparative analysis of accidents on urban and non-urban roads reveals that urban areas register a greater number of accidents and minor injuries; however, the fatality rate (0.43 in urban roads vs. 2.20 in interurban roads) and the severity of injuries (severity index 6.5 vs. 14.7) are lower in urban environments than in interurban environments. These data highlight the need for differentiated approaches to analysis to improve road safety on both types of roads, adapting measures to the specific characteristics and risks of each environment.
Table 1.
Cyclist accident frequency and severity in Spain between 2016 and 2023.
During the years before the pandemic, 2016 to 2019, the trend of accidents and minor injuries remained stable, with 5649 accidents in 2016 and 5624 in 2019, while the number of serious accidents showed a downward trend (−15.3%). Taking as a reference the year before the pandemic (2019), and compared to 2023, the number of accidents has decreased by 141 (−2.5%), a percentage very similar to that of minor injuries, which also reflects a decrease of −2.46%. The number of deaths has also fallen by 3 (−10.3%), but the most notable fact is the increase in the number of seriously injured, which has increased in 87 cases (+21.3%). In the first year after the pandemic, between 2020 and 2021, there was an increase in accidents of 562 (10.7%), while between 2021 and 2023, there was a decrease in the number of accidents of 344 (−5.8%) and in the number of minor injuries, 346 (−6.9%). On the contrary, there was a significant increase in deaths, from 21 to 29 (38.1%) and serious injuries (4.1%). After an increase in accidents between 2020 and 2021, there has been a decrease in the number of accidents and an increase in severity. This trend must be confirmed with data from the coming years, as it can be attributed to changes in mobility patterns and bicycle use, which have not yet stabilized after the loss of the pandemic. It is also possible that cyclists have become more vulnerable on urban roads, which can be attributed to an increase in mobility associated with car traffic during the post-COVID-19 phase, which required maintaining physical distance between people to mitigate the spread of the infection. In addition, the establishment of new cycling infrastructures, because of the introduction of new low-emission zones, can contribute to increasing the distance traveled by bicycle, thus raising the level of exposure to potential risks.
Table 2 illustrates the collision matrix of urban cyclist accidents in Spain during 2023. Among the 5076 accidents involving cyclists, 26.7% of them did not involve the intervention of any other vehicle. Passenger cars were the most frequently involved vehicles, representing 47.9% accidents, followed by vans (4.8%), bicycles (4.5%) and motorcycles (3.3%). Accidents between bicycles and pedestrians represented 3.0% of the accidents. Traffic collisions involving cyclists in urban areas show a significant trend toward interaction with motor vehicles (63%), as well as a high percentage (26%) of accidents attributable solely to cyclist falls or collisions with objects. In addition, the likelihood of cyclists suffering a fatal or serious accident increases significantly with the participation of larger and heavier vehicles, such as trucks or buses. Because crashes involving bicycles and cars constitute the most significant proportion, this category will serve as a reference point in the analysis of the accident data model related to this investigation.
Table 2.
Type of bicycle crashes. Matrix of bicycle collision matrix on Spanish urban roads (2023).
Data on the evolution of cyclist accidents in urban environments after the COVID-19 pandemic shows an increase in the number of serious injuries in 2023 (compared to 2020, 2021 and 2022). In addition, cyclist accidents involving cars represent the most significant proportion of the total. This situation could be related to changes in mobility patterns, the increase in the use of bicycles and the expansion of cycling infrastructures. This context constitutes a key starting point for the analysis of the accident data model, since it highlights the need for a specific evaluation of risk factors in the urban environment, in order to design road safety policies adapted to these new mobility realities.
3.2. Cities Selected
In 2023, there were 8132 municipalities in Spain, of which 152 were cities with more than 50,000 inhabitants, Figure 1, with a total population of 25,525,486 inhabitants, representing 53.08% of the total population of the country. During the period between 2020 and 2023, a total of 17,605 cycling accidents occurred in these 152 cities, 78.46% of all cycling accidents that occurred on urban roads. The average fatality–severity cycling rate (i.e., fatalities plus seriously injured accident victims divided by the number of total cycling accidents) in municipalities with more than 50,000 inhabitants was 6.29, compared to 11.53 in municipalities with less than 50,000 inhabitants. This data indicates that in cities with more than 50,000 inhabitants, there is a greater chance of suffering a bicycle accident, but the fatality and severity of the accident are lower, which could be attributed to greater bicycle mobility and a greater number of dedicated infrastructures for cyclists.
Figure 1.
Cities with a population greater than 50,000 inhabitants.
To corroborate the above-mentioned inferences, an exhaustive statistical examination has been carried out of 152 urban areas with a population greater than 50,000 inhabitants. These urban areas were classified into three demographic segments in order to group cities according to socioeconomic and urban variables related to population size and the need to mitigate scale-related biases in comparative analysis, as follows: municipalities with populations greater than 250,000 inhabitants (big-sized cities, 17 cities), those ranging from 250,000 to 100,001 inhabitants (medium-sized cities, 48 cities) and those with between 100,000 and 50,000 inhabitants (small-sized cities, 87 cities), as indicated in Table 3.
Table 3.
Cyclist traffic accident rates and severity in cities with more than 50,000 inhabitants according to groups of population size.
Firstly, big-sized cities show the highest percentage of bicycle accidents compared to total accidents (average 10.7%), which indicates that in these cities, a higher proportion of accidents involve cyclists. In addition, the highest standard deviation (7.98) is also found in larger cities, suggesting greater variability in this percentage. As regards the rate of bicycle accidents per 100,000 inhabitants, the highest average is also found in big-sized cities (22.59), which indicates a higher frequency of cycling accidents per inhabitant in these cities. The highest standard deviation (17.04) is also seen in these larger cities, suggesting greater variability in the rate of cycling accidents. The rate of deaths and seriously injured victims per 100,000 inhabitants is also higher in cities with more than 250,001 inhabitants (1,40), indicating a higher frequency of deaths and seriously injured among cyclists in these cities. The highest standard deviation (1,36) is again found in larger cities, suggesting greater variability in this rate. Finally, the rate of minor injured victims per 100,000 inhabitants is higher in cities with more than 250,000 inhabitants (18,97), indicating a higher frequency per inhabitant of minor injured cyclists in these cities. The highest standard deviation (14,59) is also found in larger cities, suggesting greater variability in the rate of minor injuries. In summary, cities with more than 250,000 inhabitants have the highest values both in the average and in the standard deviation for all the metrics analyzed.
A more detailed data analysis can be found in Figure 2, which reveals clear differences in the incidence of cycling accidents, serious and minor injuries between cities of different sizes. Larger cities tend to have higher rates of accidents and serious injuries, likely due to higher population and traffic density. On the other hand, smaller cities show a lower incidence of accidents, but also greater variability, which could suggest that the number of accidents and severity varies considerably. As the size of the city decreases, so do the average rates and variability in bicycle accidents and injuries. These findings highlight the need for road safety policies adapted to the specific characteristics of each urban environment, especially in larger cities where the incidence and variability in cycling accidents are greater.
Figure 2.
Comparison of accident frequency and severity indicators of cities with a population greater than 50,000 inhabitants.
3.3. Variables Conditioning Cyclist Road Safety
To predict bicycle accidents in cities, it is necessary to understand the interactions between urban characteristics and accidents. Analytical accident models facilitate the identification of patterns and determinants of risk through data processing. Models identifying factors affecting traffic accidents can incorporate various types of independent variables, such as mobility, road characteristics, urban design elements and demographic, socioeconomic information, and weather pickpockets that allow us to predict the incidence and/or severity of accidents. For this paper’s methodology, a complex database has been elaborated from 152 cities with more than 50,000 during the period of 2020 to 2023. Table 4 summarizes the independent variables identified and defined variables and data sources used to collect their values.
Table 4.
Description of the proposed variables studied by city.
The data model includes several variables grouped into the following categories: cycling accidents, which encompasses the total number of cycling accidents and the accident rate per 100,000 inhabitants; sociodemographic variables, including data on population, density, per capita income and motorization rate; urban morphology, which describes the urban surface, aspect ratio and relief; weather variables, which provide data on the frequency of days with extreme temperatures and rainy days; mobility urban, which includes information on the use of different modes of transport, such as bicycles, cars and motorcycles, as well as the existence of public bicycle systems; urban infrastructure, which covers the length of urban roads, roundabouts, number of traffic lights and pedestrian crossings; and cycling infrastructure, which includes the length of cycling routes, surface accessible to cycling routes, connected bicycle paths and number of bike parks. There is a wide range of bicycle infrastructure types, and the terminology used in each country (and even in each city) is diverse [25,42,43]. For this study, we have considered bicycle infrastructure types in which cyclists do not share traffic with motor vehicles and are exclusive to bicycles, as established by the definition of cycling paths from the Ministry of Interior in Spain [44]. We did not consider streets with no bicycle facilities installed or those with only “sharrows” (car lanes shared with bicycles, like the “ciclo-carriles” in Spain).
To interpret the results of the proposed models, a conceptual framework based on the interaction between exposure, infrastructure and traffic is used. The mobility variables (M1 and M2) indicate exposure to risk and the safety in numbers [45]; a higher volume of cyclists (M1) theoretically increases their visibility and predictability, while a larger proportion of cars (M2) increases the potential for conflict. On the other hand, cycling infrastructure (C4) and traffic light regulation (U4) act as determinants of the operational quality of safety. Connectivity (C4) plays a role in reducing critical maneuvers at transition points (where cyclists must return to mixed traffic), while traffic light density (U4) determines priority at the points of greatest potential conflict: intersections.
The data sources used in the model are the following: the General Directorate of Traffic (DGT), which provides data on cycling accidents and the motorization rate; the National Statistics Institute (INE), which periodically publishes information on population, density, per capita income and other sociodemographic data and the National Geographic Institute (IGN), which offers online data on urban surface and relief. Weather data, such as the frequency of days with extreme temperatures and rainy days was obtained through the State Meteorological Agency (AEMET), which offers online weather data, such as the frequency of days with extreme temperatures and rainy day. Moreover, the Google Environmental Insights Explorer (GEIE), can provide information on urban mobility, including the use of bicycles, cars and motorcycles; data on urban and cycling infrastructure (including the length of roads and the number of traffic lights and crossings) can be obtained through OpenStreetMap (OSM). This primary data underwent a processing, using Geographic Information Systems (GIS) tools, such as QGIS version 3.36.3 and the R version 4.4.2 programming language, to obtain the final independent variables values for each city.
The following paragraphs describe the methodological framework for processing statistical data that has been followed to obtain the most novel variables in this study.
In the urban morphology group, an indicator of urban relief was defined. The analysis of urban topography is extremely important, since it allows us to identify how terrain variations can influence the behavior of cyclists and the frequency of accidents. To quantify and compare the urban topographic relief between different urban areas, the difference between the maximum and minimum values of 90% of the elevation data (i.e., 95% and 5% percentiles, respectively) has been calculated based on the reference data of the Copernicus digital elevation model (DEM), which has a spatial resolution of 30 m, Figure 3. The Copernicus DEM (Reference) was obtained from radar measurements made by the TanDEM-x satellite and has a vertical accuracy of less than 4 m. To determine the urban extension accessible to cyclists and motor vehicles, we used the official total urban area data of ING and its IRG Populations database, as well as data obtained from the OpenStreetMap (OSM) “Urban Roads” graphic layer, using the spatial analysis software QGIS and the R programming language to outline the envelope of urban road surfaces on which the topographic relief of cities has been evaluated.
Figure 3.
Example of a relief map of the urban relief of the city of Vitoria (maximum and minimum elevations).
In the cycling infrastructure group, two innovative variables have been defined: one of accessibility to bicycle routes and the other of connectivity of cycling routes. This analysis can determine which cities have a greater number of accessible areas for cyclists, as well as identify critical safety points. To determine the urban surface, Figure 4, that is close to these cycling routes, buffer analysis and spatial superposition techniques have been applied. For this purpose, a spatial analysis tool has been used in QGIS, which allows for creating 150 m zones of influence around the cycling routes obtained from the “Cycling Paths” layer of OpenStreetMap.
Figure 4.
Example of accessibility area to cycling paths and connectivity of cyclist infrastructure, cities of Vitoria and Alcalá de Henares.
The study of the connectivity of cycling routes is also essential to identify the safe and efficient use of bicycles, since a continuous network reduces the risk of accidents and increases mobility. To determine how many kilometers of the cycling network are connected, Figure 4, vector discontinuity analysis techniques have been applied. For this purpose, a spatial analysis tool has been used in QGIS, which allows us to determine sections of cycling routes with discontinuities greater than 50 m, based on data obtained from the OSM “Cycling Paths” layer.
Once the urban variables have been identified and collected, in the next Section 4, an exploratory study is carried out using Principal Component Analysis (PCA) with the objective of simplifying the complexity of the data and revealing the underlying dimensions that best explain its variability, as well as to interpret possible patterns and trends.
3.4. Data Processing
To identify patterns and determine factors to formulate safer and more effective urban mobility policies focused on reducing cycling accidents, the following analysis has been carried out. First, a detailed statistical examination of cycling accidents and fatalities was carried out in 152 urban areas with a population of more than 50,000 inhabitants, between 2020 and 2023. Among the 152 cities with more than 50,000 inhabitants, a total of 20 relevant variables were determined that are susceptible to comparison, making it easier to identify the most important factors and existing correlations that may influence traffic accidents and their corresponding consequences. Of the 152 cities, 116 have been analyzed, since, for 36 of them, it has not been possible to obtain urban mobility data from GEIE.
Subsequently, various models and approaches were developed to determine the most significant factors, analyzing 24 variables of each city. Prior to the analysis using statistical models, as a complementary exploratory study, Principal Component Analysis (PCA) was carried out in order to reveal the underlying dimensions that best explain the data, as well as to interpret possible patterns and trends. Finally, the negative binomial regression model was applied to study the frequency of bicycle accidents in cities, creating two different models with the dependent variables: total number of bicycle accidents (model A1) and number of bicycle accidents involving a passenger car (model A2). This approach allows us to explore different aspects of cycling accidents, comparing the significance of the independent variables their influence on the likelihood of a cycling accident.
3.4.1. Principal Component Analysis (PCA)
Principal Component Analysis (PCA) is a statistical technique that helps reduce the dimensionality of large data sets. This method makes it possible to identify patterns and relationships in data, which facilitates the interpretation of complex information about urban characteristics and user behavior by reducing the dimensionality of the data, identifying patterns and eliminating redundancies. The results provide a graphical representation that allows us to observe how cities are grouped according to the characteristics of the variables analyzed. PCA can reveal new patterns and trends, address the limitations of traditional assessment methods, and improve understanding of accident trends [46].
Principal components (PCs) are new variables that are created as linear combinations of the original variables in a data set. These components are constructed in such a way that the first principal component (PC1) captures as much of the variability in the data as possible, and the second principal component (PC2) captures the second largest amount of variability. In this way, a data set with n variables is transformed into a new data set with n principal components. Working with some of these PCs preserves most of the original information, facilitating the visualization and analysis of complex data by reducing their dimensionality. Table 5 identifies the variables that have been analyzed, together with the respective municipalities ordered according to the size of their population.
Table 5.
Variables and cities analyzed in the PCA.
The selection of variables for Principal Component Analysis (PCA) was based on criteria aimed at ensuring the inclusion of the most relevant and influential elements that condition road safety for cyclists. The selected variables were chosen because of their direct relevance to urban cycling, covering aspects related to cycling infrastructure, urban morphology, weather conditions and mobility patterns. We sought to cover multiple factors that may have an influence, such as sociodemographic factors (population density and per capita income), urban design elements (urban form and relief) and mobility patterns (use of bicycles and cars), to achieve a deeper understanding of the interaction between urban characteristics and cycling safety. The availability and quality of the data were also determining criteria, ensuring the reliability and consistency of the variables used.
The biplot of Figure 5 is a graphic representation resulting from PCA, where observations and variables are simultaneously visualized in a two-dimensional space defined by the first two principal components, PC1 on the horizontal axis and PC2 on the vertical axis, which capture 23.7% and 17.5% of the variance, respectively. The numbered dots on the graph represent the cities, and their proximity indicates similarity in terms of the variables, while the dots close to the center suggest average values for the variables. The numbered dots of the cities indicate the position they occupy according to the number of inhabitants (Table 5). The vectors, indicated with arrows, represent the variables, with their direction indicating the increase in the variable and their length reflecting its importance in the variability in the variable. In addition, the direction of the vectors also indicates correlations between the variables: vectors in the same direction determine positive correlation, opposite directions suggest negative correlation, and orthogonal vectors indicate a lack of correlation.
Figure 5.
Biplot of PCA.
The analysis of the PCA biplot shows that the relationships between variables of the same orientation reveal important urban dynamics. Cities with high bicycle mobility (M1) tend to have many cycling routes (C1), which could indicate that cycling infrastructure encourages the use of bicycles. In addition, cities with developed public bicycle systems (M4) tend to have a high parking rate for bicycles (C5), which could suggest well-integrated sustainable mobility policies. Finally, cities with high per capita incomes (S3) tend to have a high population density (S2). The relationships between the most significant opposing variables show that cities with high mobility by car (M2) tend to have low mobility by bicycle (M1), which could mean a preference for motorized transport rather than bicycles. The higher presence of many traffic lights (U4) is negatively correlated with the number of roundabouts (U3), which could reflect different approaches to traffic management by local administrations. Finally, climatic differences are manifested in the negative relationship between cold days (CL1) and hot days (CL2).
The examination of the results obtained reveals significant information about the most relevant variables between cities in the first dimension (Dim-1) and the second dimension (Dim-2). These dimensions explain the largest proportion of the total variability in the data and identify the main axes in which cities differ most markedly. In this context, several variables stand out for their high contribution to Dim-1 and Dim-2, which implies that their differences between cities are fundamental to explain the observed variability.
The most significant variables with respect to Dim-1 are grouped into different categories. In the field of cycling infrastructure, variables related to the quality and length of bicycle infrastructure have a considerable influence. The cycling infrastructure in general, evidenced by long and well-defined arrows in the biplot, underlines its importance as a differentiating factor. Specifically, accessibility to cycling routes (C3), the proportion of cycling routes on urban roads (C2) and the existence of connected cycling routes (C4) are particularly relevant. This suggests that cities that have a developed and well-integrated cycling infrastructure tend to cluster in a specific direction within the space defined by Dim-1, differentiating themselves from those with less investment or development in this regard. With regard to urban mobility, mobility by car (M2) emerges as a key factor in differentiating between cities, also showing a long arrow in the biplot. This indicates that the importance and use of cars are aspects that vary significantly between the cities analyzed. In addition, bicycle mobility (M1) and public bicycle systems (M4) also show a high contribution in grouping cities. This finding suggests that cities with a greater adoption of bicycles as a means of transport and with efficient public bicycle systems tend to form different groups in Dim-1, probably contrasting with those where the private car has a predominant weight. Regarding the street infrastructure variables, the number of traffic lights (U4) and the number of pedestrian crossings (U5) make a high contribution to Dim-1. The significant presence of these infrastructures, reflected in long arrows, indicates that they are important elements in explaining the variability between cities. Those cities with a greater number of traffic lights and pedestrian crossings tend to cluster in a particular direction of the biplot, which could be related to certain traffic management policies. Finally, in the sociodemographic variables dimension, population density (S2) stands out for its high contribution to Dim-1. The long arrow associated with this variable in the biplot indicates that population density is a crucial factor in differentiating cities. Cities with a high population density tend to form a specific group in Dim-1, which could influence other aspects such as transportation demand, urban planning and service provision.
On the other hand, the analysis also identifies variables with the lowest contribution to Dim-1. These are the aspect ratio (R2), per capita income (S3), the number of roundabouts (U3), urban roads (U2) and motorcycle mobility (M3). The low contribution of these variables to Dim-1 suggests that, although they may be relevant in other contexts or to explain variability in other dimensions of the PCA, they are not the main factors that distinguish cities along this first axis of variability. In other words, differences in these variables are not the ones that best explain the greater disparities between the cities analyzed in Dim-1.
On the other hand, in the Dim-2 analysis, the significant variables related to climate are the most influential: percentage of days a year with a temperature > 30 °C (CL2), days a year with a temperature < 5 °C (CL1) and days a year with rain (CL3). This observation suggests that cities with similar weather characteristics are grouped in this dimension, which underlines the importance of considering climatic factors when classifying cities. In addition, mobility on motorcycles (M2) and bicycles (M1) also shows a great contribution. This finding suggests that cities with a greater adoption of motorcycles or bicycles as a means of transportation tend to form different groups in Dim-2.
The PCA methodology also identifies the variables with the least significant contribution in both Dim-1 and Dim-2, specifically, the relationship with urban morphology, shape (R2) and relief (R3), per capita income (S3), the number of roundabouts (U3), urban roads (U2) and public bicycle rental systems (M4). The minimal contribution of these variables suggests that, while they may be relevant in other contexts or to explain variability in other dimensions of PCA, they are not the main factors that distinguish cities. In other words, the differences between these variables are not the ones that best explain the greater disparities between the cities analyzed. In summary, the Dim-1 and Dim-2 of the PCA reveal that the differences between cities are strongly influenced by the quality and scope of cycling infrastructure, the characteristics of urban mobility in the use of cars, motorcycles and bicycles, the presence of urban infrastructure such as traffic lights and pedestrian crossings, population density and climatic conditions. These factors define the main axes of differentiation between the cities analyzed.
To facilitate the assessment of the relation between the incidence of the rate of bicycle accidents per hundred thousand inhabitants (CAR) and the explanatory variables, cities are represented in Figure 6 by applying Principal Component Analysis (PCA), which has been used to assign a color categorization to each city, where red indicates the highest CAR value and green the lowest.
Figure 6.
PCA of cities categorized by the accident rate per hundred thousand inhabitants (CAR).
Figure 6 illustrates the spatial distribution of urban centers in relation to the main components, where the numerical designations reflect the range from highest to lowest depending on the size of the population, and the color gradient indicates the incidence of accidents per hundred thousand residents (CAR), where red represents the highest crash frequency per 100.000 inhabitants and green indicates the lowest. The proximity of cities with a similar CAR suggests that they share underlying characteristics captured by the principal components. In addition, the location of these clusters in relation to the vectors of the variables in the biplot allows us to argue about possible associations between certain urban characteristics and the risk for cyclists. For example, in the lower left quadrant, cities with a high rate of cycling accidents (red color) predominate, such as Barcelona (2), Valencia (3) and Sevilla (4). Then, variables such as bicycle mobility (M1) and population density (S2) seem to be correlated with an increase in accidents. On the contrary, cities located in the opposite quadrant, the upper right, such as Ferrol (98) and Ponferrada (100), tend to have a lower rate of cycling accidents (green color), as well as lower cycling mobility and low density. Also, a clear difference is observed in the spatial distribution of cities based on their size. A total of 70.59% of big cities (those with more than 250,000 inhabitants) are located in the left quadrants. In contrast, 72.73% of small cities (between 50,000 and 100,000 inhabitants) are situated in the right quadrants. The distribution of medium-sized cities (between 100,000 and 250,000 inhabitants) is homogeneous across all four quadrants. In summary, by examining the main components, urban areas can be classified according to the rates of cycling accidents and similar variables relevant to each city, making it easier to identify patterns and trends in road safety.
In summary, this attempt to group (through a PCA methodology) urban variables and cities, using variables conditioning bike safety PCA, shows the high complexity of comparing cities attending only to their cyclist accidents figures per inhabitants. In order to obtain a fair assessment of public policies related to bike infrastructure, this city comparison should consider similar levels of accident risk exposure (bike mobility and motorized traffic mobility) together with other features that are more difficult to measure systematically, like the connectivity of the cyclist infrastructure network. In fact, with this methodology, cities with a well-developed and integrated cycling infrastructure tend to cluster in a specific direction within the space defined by Dim-1, differentiating themselves from those with less investment or development in this regard.
In the next Section 3.4.2, once the relationships between the variables of cities have been analyzed using the PCA, a statistical study of variables affecting the occurrence of accidents is carried out under other approach (negative binomial regression models).
3.4.2. Negative Binomial Regression Models
Regression models are statistical tools used to explore the relationships between a dependent variable and one or more independent variables, allowing us to understand data patterns and make predictions. The choice of regression model depends on the nature of the data and the specific relationships being investigated and there are different types of linear regression model. The simplest, linear regression, in which the relationship between dependent and independent variables is assumed to be linear, is widely used because of its simplicity and interpretability, especially when the assumption of linearity is true. However, when relationships are more complex or nonlinear, models such as polynomial regression or logistic regression can be considered, which offer greater flexibility to capture patterns in data and improve the accuracy of predictions [47]. To determine cyclist accidents, negative binomial regression models are often used to predict the frequency of accidents, especially when it comes to counting data that are too scattered, which is common in data sets on accidents [31].
Regression models for accident-counting data require specialized techniques when they have overdispersion, that is, variance greater than the average, as is the case in this study. In the case of the Poisson model, is assumed, while the negative binomial model incorporates a dispersion parameter α to model the extra variability [48]. In this model, the response variable Y follows a negative binomial distribution with mean μ and dispersion parameter α, denoted as Y∼NB(μ,α). The probability mass function, where Γ(·) represents the gamma function, is given by:
The regression model is formulated as a generalized linear model with log link function: log(μᵢ) = β0 + β1Xᵢ1 + … + βₚXᵢₚ + offsetᵢ, where μᵢ is the expected mean for the i observation, β are regression coefficients, X are predictor variables, and the offset term adjusts for exposure. The variance in this model has a quadratic relationship with the mean: Var(Y) = μ + αμ2, which captures overdispersion when α > 0.
Parameters β and α are estimated via maximum likelihood estimation. The corresponding log-likelihood function is:
Accident risk exposure variables play a fundamental role normalizing the number of events (accidents) in relation to the number of “opportunities” for them to occur. In the proposed model, two variables have been used. The first variable (E1) estimates total vehicle kilometers traveled (VKT) in Spanish cities, calculated by multiplying population by percentage of car transport relative to the total urban mobility and by the average trip distance 2.8 km [49], for a study period duration of 2020–2023 (3 years × 365 days), and the average daily trips 2.9 trip/person/day [49]. Equation (3) also considers VKT per person, dividing the total VKT by an estimated vehicle occupancy rate of 1.2 persons/vehicle [50]. The second variable (E2) quantifies bicycle kilometers traveled (BKT) using analogous parameters specific to cycling 2.3 km per trip and unitary occupancy [51]).
- Vehicle Traveled (VKT)
- P = Total population of the study area;
- %C = Percentage of trips made by car relative to total urban mobility;
- Td = Duration of the study period (in days);
- Tr = Average number of trips per person per day;
- DC = Average distance per car trip (2.8 km, [49]);
- Ov = Average vehicle occupancy (1.2 persons/vehicle, [50]).
- Bicycle Kilometers Traveled (BKT)
- P = Total population of the study area;
- %B = Percentage of trips made by bicycle relative to total urban mobility;
- Td = Duration of the study period (in days);
- Tr = Average number of trips per person per day;
- DB = Average distance per car trip (2.3 km, [51]);
- Ov = Average vehicle occupancy (1.2 persons/vehicle, [50]).
These exposure metrics are integrated into the negative binomial regression models as logarithmic offset terms, wherein μi denotes the anticipated accident count for the ith observation, E1 and E2 represent the exposure metrics utilized as an offset, and Xij signifies the independent variables.
In the process of selecting the predictive variables for the analytical model, among the 24 urban variables outlined in Table 4, the variables M1 (percentage of bicycle transport relative to the total urban mobility), M2 (percentage of car transport relative to the total urban mobility) and P1 (number of inhabitants) were excluded since these variables give rise to the variables dependent on the Ei model. On the other hand, a statistical analysis of linear correlation was carried out with the remaining variables to determine significant interrelationships between them, which led to the exclusion of the variable R1 (urban surface area) since it showed a very high linear correlation coefficient of 0.97 with the variable U1 (total length of all roads, inside municipality). In summary, to define the cycling accident analysis model of the 116 cities with more than 50,000 inhabitants, a total of 21 independent variables have been considered appropriate for inclusion in the analytical framework of the model, as shown in Table 6.
Table 6.
Variables for the analytical model.
For the study of cycling accidents in the 116 cities, the negative binomial model has been applied. To this end, two dependent variables have been analyzed in order to explore different aspects of cycling accidents between the years 2020 and 2023, allowing us to compare the significance of the independent variables in different scenarios:
- -
- Number of total bicycle accidents with independence of type of collision (A1).
- -
- Number of car–bicycle accidents, bike crashes in which a passenger car has been involved (A2).
In order to carry out a mathematical analysis, the methodology related to the automatic selection of variables is used for an optimal fit of a negative binomial regression model. To this end, an initial model was built that incorporated all 21 predictor variables considered and logarithmic transformations were applied to the exposure variables E1 and E2. Subsequently, an automatic variable selection procedure using stepwise regression was implemented using an algorithm in the R programming environment, combining inclusion and exclusion strategies guided by the Akaike Information Criterion (AIC). This criterion reduces the complexity of the model and favors those with greater explanatory capacity, thus making it possible to eliminate non-significant predictors and to preserve only those that contribute in a substantive way to the adjustment. This methodology allowed for the formulation of robust models, which are more suitable for describing the relationship between explanatory variables and the frequency of accidents.
The findings derived from the optimal calibration of the negative binomial regression model A1, which examines all bicycle-related accidents that occurred in 116 Spanish municipalities with populations greater than 50,000 inhabitants during the period between 2020 and 2023, are presented in Table 7. The A1 model demonstrated a satisfactory statistical alignment (AIC = 1147.1; θ = 2.06), which confirmed the suitability of the model for the analysis of these over dispersed data. The exposure variables E1 and E2, which indicate the kilometers travelled by motor vehicles (VKT) and bicycles (BKT), respectively, showed positive and statistically significant coefficients (p < 0.001). This result corroborates the idea that increased mobility, which encompasses both motorized transport and cycling, is intrinsically correlated with an increase in the occurrence of accidents (frequency of accidents). It should be noted that the log (E2) coefficient (1.03) exceeds that of log (E1) (0.71), and that of standardized model coefficients log (E2) coefficient (1.02) and log (E1) (0.46), which indicates that cycling-related exposure has a comparatively greater influence on accidents, which could be attributed to the vulnerability of cyclists in the urban road environment.
Table 7.
Negative binomial model. Total number of bicycle accidents (A1).
Among the independent variables selected through the stepwise regression process, several statistically significant factors were identified. Per capita income (S3) showed a positive relationship with the accident rate (b = 0.00008, p < 0.001), which could reflect a greater adoption of cycling in cities with greater investment capacity in policies to promote cycling mobility. Urban relief (R3) was also positively associated with accidents (b = 0.00211, p = 0.047), since cities with higher relief indicators tend to have steeper cycling routes; this can lead to higher speeds, make driving difficult and increase risk. The presence of public bicycle systems (M4) showed a significant positive effect (b = 0.37, p = 0.032), suggesting that, although these initiatives promote sustainable mobility, they also increase the number of users, many of them probably with little cycling experience, which could increase exposure to risk, unless such measures have been complemented by adequate investment to improve the road safety infrastructure of infrastructures.
With regard to cycling infrastructure, it was observed that the length of cycling routes (C1) presented a significant negative coefficient (b = −0.0087, p = 0.004), evidencing its protective function against accidents, which would imply that a greater provision of exclusive infrastructure for bicycles contributes to reducing accidents. On the contrary, accessibility to cycling network (C3) was positively correlated with accidents (b = 0.0142, p = 0.012), which could be interpreted as an indicator of an increase in bicycle traffic due to easier access to cycling routes. The variable of urban intersections with traffic lights (U4) (p = 0.096) suggests that more complex urban environments, with greater interaction between cyclists and other users, present a greater risk of accident.
The negative binomial model A2 was formulated with the objective of analyzing cycling accidents involving a tourist-type vehicle, offering a more detailed view of the interaction between bicycles and motor vehicles in the urban environment (Table 8). Although it shares the basic structure of the A1 model, the A2 model allows us to identify key differences in the risk factors associated with this specific type of accident rate. From the point of view of statistical adjustment, the A2 model presents a satisfactory statistical fit (AIC = 1147.1; θ = 2.06) and an adequate modeling of the overdispersion inherent in data related to accidents.
Table 8.
Negative binomial model. Number of bicycle accidents in which a passenger car has been involved (A2).
As in the A1 model, the exposure variables log (E1) and log (E2) presented positive and highly significant coefficients (0.69 and 0.93; p < 0.001), which corroborates the statement that increased mobility, which encompasses both motor transport and cycling, amplifies the likelihood of collisions between these two modes of transport. However, the influence of cycling exposure remains more important, with a coefficient that exceeds that of motorized mobility by approximately 35%, suggesting that the risk of collision with cars increases significantly with the increase in the use of bicycles, underlining the need to effectively regulate mixed traffic conditions in urban environments.
Among the independent variables, per capita income (S3) maintained its positive effect (b = 0.0000557, p = 0.014), although with less intensity than in the A1 model, implying that the socioeconomic factor is still relevant, but with a more moderate impact on accidents involving vehicles. The public bicycle system (M4) showed a more pronounced positive influence (b = 0.4451, p = 0.006), suggesting that these systems could be particularly associated with collisions with cars, possibly due to the lack of user experience or the insufficiency of segregated infrastructure.
A significant distinction in relation to the A1 model is that the variable intersections with traffic lights (U4) reached statistical significance (b = 0.2472, p = 0.014), which indicates that intersections regulated by traffic lights are critical points in bicycle accidents when there is interaction with cars. This observation suggests that, although traffic lights are intended to order traffic flow, in practice, they could be creating risky situations for cyclists, especially if there is no modal segregation or if traffic light phases are not properly respected.
The length of cycling routes (C1) once again showed a protective effect (b = −0.00695, p = 0.013), although with a smaller magnitude than in the A1 model, which underlines the importance of specific infrastructure as an effective measure to reduce accidents, particularly in accidents where motor vehicles are involved. In conclusion, the comparison of the A2 model with the A1 model reveals slight differences: greater variability in the data, reduced protective efficacy of bicycle paths, and a more pronounced correlation between public bicycle systems and incidents involving cyclists and motor vehicles.
To ensure the robustness of the negative binomial regression models presented, diagnostic tests have been performed that include the evaluation of the goodness of fit, the detection of multicollinearity and the analysis of overdispersion. The choice of the negative binomial model versus the Poisson model is validated by the dispersion statistic and the associated p-value. In both models (A1 and A2), the p-value of the dispersion test is significantly low, confirming that the variance is higher than the average and that there is overdispersion in the accident data. The following indicators in Table 9 validate the explanatory capacity of the models and confirm the suitability of the negative binomial distribution compared to that of Poisson.
Table 9.
Indicators of adjustment and diagnostic statistics.
The Variance Inflation Factor (VIF) was calculated to rule out excessive linear relationships between predictors that could bias the coefficients. In Model A1, the VIF values range from 1.25 (R3) to 4.73 (C1). In Model A2, the VIF values range from 1.28 (U4) to 4.72 (C1). Since all VIF values are lower than 5, the absence of significant multicollinearity in the analytical framework is confirmed. Below, the marginal effects (dF/dX) and the Incidence Rate Ratio (IRR), Table 10, are detailed, which allow us to quantify the real impact of each variable on the number of accidents.
Table 10.
Marginal effects and Incidence Rate Ratio (IRR).
The analysis of the Incidence Rate Ratio (IRR) and the marginal effects allows us to draw the following conclusions about the factors that influence cycling accident risk. Exposure variable (LogE1 and LogE2): Both models confirm that increased mobility is the main predictor of accidents. The IRR of bicycle use (LogE2) is higher than that of the motor vehicle in both scenarios (2.80 in A1 versus 2.53 in A2), which indicates that for every logarithmic unit that increases cycling exposure, the risk of an accident is multiplied almost threefold. Cycling Paths (C1): The length of cycling routes is the only infrastructure variable with a consistent and statistically significant protective effect. With an IRR of less than 1 (0.99) in both models, it is demonstrated that the provision of exclusive bicycle networks directly contributes to the reduction in the frequency of accidents, both total and involving cars. Public Bicycle System (M4): These systems have a positive and significant impact on accidents, with an increase in the risk of 44% in total accidents (IR. R = 1.44) and 56% in collisions with cars (IRR = 1.56). This suggests that the increase in users attracted to these services, often with less experience, increases exposure to risk if it is not accompanied by adequate segregated infrastructure. Traffic Lights (U4): The presence of traffic lights acts as a risk factor, especially in the A2 model (IRR = 1.28). The marginal effect indicates that these intersections are critical points where the interaction between cyclists and car drivers generates conflict situations, possibly due to the lack of specific traffic light phases or segregation at the intersection. Per capita income (S3): The variable shows a positive relationship with accidents in both models, while relief (R3) increases the total accident rate (IRR = 1002). In addition, regions characterized by high per capita income often show more pronounced travel behaviors and increased rates of vehicle ownership. This phenomenon generates a higher traffic density and a greater number of cars on the roads, which aggravates the likelihood of accidents involving cyclists. Relief (R3): The variable increases the total accident rate (IRR = 1002), probably due to the higher speeds achieved on routes with steep slopes. Accessibility Area to Cycling Paths (C3): Although greater accessibility to cycling routes encourages use, it is also associated with a marginal increase in accidents in the A1 model (IRR = 1014), reinforcing the idea that the greater the ease of access, the greater the flow of cyclists and, therefore, the likelihood of accident events. This phenomenon would also mean an increase in the density of conflict points in highly connected areas. If this accessibility is based on infrastructures with a low level of segregation or designs that do not physically isolate the cyclist from motorized traffic, the likelihood of collisions increases. Therefore, the higher exposure at these critical junctions, combined with the coexistence of motor vehicles, may be related to the increase in the observed accident rate.
4. Conclusions and Future Research Lines
The main objective of this research is to identify the variables that condition cyclist road safety in urban environments. When accident data is compared across different cities—in this case, Spanish cities—it is not sufficient to rely exclusively on cyclist accident figures or on very general macro-level indicators. Such an approach risks overlooking the structural differences that distinguish one city from another. For this reason, this study places particular emphasis on identifying those variables that allow cities to be compared under conditions of relative homogeneity, taking into account not only accident outcomes but also the underlying urban and mobility contexts in which those accidents occur.
A central contribution of this research lies in the extensive effort required to construct a harmonized database for a large number of cities. Cycling mobility data obtained from open-access sources is especially difficult to systematize, particularly when the analysis involves more than 150 Spanish cities. Beyond compiling these data, this study goes a step further by designing innovative indicators that describe the quality of cycling infrastructure. These indicators move beyond simple measures of infrastructure length and focus instead on qualitative aspects of cycling networks, such as connectivity and coverage. Connectivity captures the extent to which different cycling routes are effectively linked, allowing cyclists to move through the city via continuous itineraries. Coverage reflects the proportion of the population that has real access to the cycling network. The construction of these indicators required a significant methodological effort, as it involved standardizing complex spatial information so that it could be consistently compared across all cities included in the analysis.
Two complementary analytical approaches were applied in order to extract meaningful insights from the data set: Principal Component Analysis (PCA) and negative binomial regression models. PCA was used as an exploratory tool to reflect on which variables tend to be more closely related within the group of cities analyzed. This approach makes it possible to identify clusters of cities that may exhibit similar behavior in terms of cycling infrastructure, mobility patterns and urban characteristics. In this respect, the analysis suggests a clear relationship between cities that present high levels of cycling network connectivity and those that also exhibit high levels of network coverage. These cities tend to be those that have consciously invested in the design of higher-quality cycling networks, rather than implementing isolated or fragmented cycling facilities.
Independently of this exploratory grouping exercise, the negative binomial regression models were applied to accident data in order to identify the factors most strongly associated with cyclist accident frequency. Two types of accidents were analyzed: total cyclist accidents and the subset of accidents involving collisions between cyclists and motorized vehicles. Across both models, the importance of exposure-to-risk variables clearly emerges. Cities with a high increased mobility, which encompasses both motor transport and cycling, exhibit a higher frequency of cyclist accidents. This finding should not be interpreted in a simplistic or alarmist manner. A higher frequency of accidents does not necessarily imply worse safety conditions. Rather, it reflects the fact that when cycling mobility increases, the number of interactions between cyclists and other road users also increases. In cities where high levels of cycling mobility coincide with substantial volumes of motorized traffic, the potential for conflict is inevitably greater. The key issue, therefore, is not merely whether accident frequency increases, but how severe those accidents are.
The differences between car–bike accidents and the rest of bike accidents in the modeling also shows the need to separate these two groups in future investigations. Both accident profiles per inhabitant are less frequent in cities with high population density and higher length of cycling routes. This latter result should encourage local administrations to widen their cycling infrastructure networks.
At this stage, the models developed in this research operate at a macro level and do not distinguish between slight, serious or fatal accidents. This limitation is explicitly acknowledged. An increase in accident frequency may be associated primarily with minor incidents, which have very different implications from accidents involving serious injuries or fatalities. Specifically, it is theoretically expected that accidents occurring within dedicated cycling infrastructure should be less severe than those occurring in mixed traffic; however, the current data set does not allow for a comparative analysis of severity based on location. Furthermore, there is a lack of disaggregated data to establish a direct relationship between the total length of the cycling network in each city and the occurrence of serious injuries. Consequently, future research should focus on disaggregating accident data by severity in order to better understand the real safety implications of increased cycling mobility. Without this distinction, aggregate accident figures can be misleading and may obscure important differences between cities.
Closely linked to this issue is the concept of exposure to risk. Cities characterized by higher volumes of motorized traffic and higher traffic speeds are likely to experience more severe cyclist accidents. While this research incorporates exposure variables at an aggregate level, it cannot fully capture the complexity of how traffic intensity, speed and infrastructure design interact to shape accident outcomes. This highlights the need for future studies to refine these models and to explore exposure mechanisms in greater detail.
Another relevant finding concerns the role of public bicycle-sharing systems. This variable appears to be significant and deserves particular attention in future research. Many cities are still in an experimental phase with respect to public bicycle rental schemes, and these systems introduce new dynamics into urban cycling. Shared bicycles typically cover more kilometers per day than privately owned bicycles, which increases exposure to risk. In addition, many of these systems rely on electrically assisted bicycles, whose operating characteristics differ substantially from those of conventional bicycles. Accidents involving electric bicycles may therefore present different patterns in terms of speed, severity and user behavior. Furthermore, in cities such as Madrid, public bicycle-sharing systems are frequently used by tourists, many of whom may be cycling in an urban environment for the first time. This lack of familiarity with traffic conditions, infrastructure and local regulations can increase accident risk. The presence of multiple public or private bicycle-sharing operators in a city also tends to reflect an already high level of cycling mobility, which implies a higher probability of cyclist involvement in accidents. For these reasons, the relationship between bicycle-sharing systems and cyclist safety must be interpreted with caution and analyzed in greater depth in future studies.
Beyond the variables already considered, there is clear potential to further refine the description of cycling infrastructure. This study has analyzed network length, coverage, connectivity and the number of signalized intersections. However, additional characteristics of cycling infrastructure are likely to be highly relevant. These include the degree of physical segregation from motorized traffic, the level of protection offered to cyclists, and the proportion of cycling infrastructure that is shared with pedestrians. Such features may have a decisive influence on both accident frequency and severity.
Considering these findings, urban planning must go beyond the quantitative analysis of the network to implement specific interventions at points of greatest conflict. Since the density of signposted intersections is associated with a greater probability of collision, it is essential to prioritize the redesign of these nodes, for example, through segregated traffic light phases for cyclists or the transformation to protected intersection designs that minimize the angle of conflict with motor vehicles. In addition, speed management through the establishment of “Zones 30” in areas of high connectivity and cycling coverage is presented as an essential measure to mitigate the severity of accidents in environments where exposure to risk is greater due to high traffic intensity.
The authors are fully aware that the current analysis is based on macro-level data. As a result, an important next step will be to move towards micro-level analyses in selected cities, ideally comparing urban areas of similar size and population density. City size and density have already been shown to be key conditioning factors, and micro-scale studies would allow for a more detailed examination of specific cyclist infrastructure elements, intersection design and local traffic conditions.
This research should therefore be understood as a first exploratory step. Several variables have already emerged as deserving particular attention in future work, especially those related to exposure, infrastructure quality and public bicycle-sharing systems. At the same time, a core objective of this study has been to develop a methodology and a set of innovative indicators that can be transferred beyond the Spanish context. Many of the variables and analytical approaches proposed here are applicable to other European cities and, potentially, to cities outside Europe.
Based on these findings, recommendations are proposed for urban planning and traffic management. It is important to prioritize the continuity and extension of the length of bicycle paths as a structural preventive measure. Regarding traffic management, it is advisable to intervene at intersections with high traffic light density by implementing traffic light phases exclusive to cyclists or the transformation to protected intersections that reduce physical contact with motorized vehicles. These interventions, combined with a reduction in the speed of motor vehicles in areas of high connectivity, constitute the technical road map for mitigating the risk of cyclists in the urban environment.
Ultimately, the intention is for these findings to support local public policies. By improving the understanding of how urban characteristics, mobility patterns and cycling infrastructure interact to shape cyclist road safety, this research aims to support the design of more targeted and effective policies that promote cycling while minimizing crash risk.
Author Contributions
Conceptualization, D.d.V.-J., D.G.-P. and B.G.; methodology, D.d.V.-J.; software, D.G.-P.; validation, B.G. and A.O.; formal analysis, D.d.V.-J. and D.G.-P.; investigation, D.d.V.-J., B.G. and A.O.; resources, D.G.-P.; data curation, D.G.-P.; writing—original draft preparation, D.d.V.-J., B.G. and A.O.; writing—review and editing, D.G.-P., B.G. and A.O.; visualization, D.d.V.-J.; supervision, B.G. and D.d.V.-J.; project administration, B.G. All authors have read and agreed to the published version of the manuscript.
Funding
The publication is part of the project PID2024-155313OB-I00 funded by “MCIN/AEI/10.13039/501100011033/ERDF, EU”, where PID2024-155313OB-I00 is the reference that appears in the award resolution; MCIN is the acronym of the Ministry of Science and Innovation; AEI is the acronym of the State Research Agency; 10.13039/501100011033 is the DOI (Digital Object Identifier) of the Agency; and ERDF is the acronym of the European Regional Development Fund.
Institutional Review Board Statement
Not applicable.
Informed Consent Statement
Not applicable.
Data Availability Statement
The data presented in this study is available on request from the corresponding author.
Acknowledgments
The authors wish to express their gratitude to the Dirección General de Tráfico (DGT) for providing the traffic accident data used in this study.
Conflicts of Interest
The authors declare no conflicts of interest. The funders had no role in the design of this study; in the collection, analyses, or interpretation of data; in the writing of the manuscript; or in the decision to publish the results.
References
- European Cyclists’ Federation. Cycling Facts and Figures: How the EU Can Unleash the Full Potential of Cycling; European Cyclists’ Federation: Brussels, Belgium, 2021; Available online: https://ecf.com/ (accessed on 24 February 2025).
- Gomes-Bastos, E.; Pillajo-Quijia, G.; Arenas-Ramírez, B.; Aparicio-Izquierdo, F. La Accidentalidad Ciclista en Algunas Ciudades Españolas. Rev. Iberoam. Ing. Mec. 2022, 26, 61–71. [Google Scholar] [CrossRef] [Scilit]
- Reynolds, C.C.O.; Harris, M.A.; Teschke, K.; Cripton, P.A.; Winters, M. The impact of transportation infrastructure on bicycling injuries and crashes: A review of the literature. Environ. Health 2009, 8, 47. [Google Scholar] [CrossRef] [Scilit]
- Castañon, U.N.; Ribeiro, P.J.G.; Mendes, J.F.G. Evaluating urban bikeability: A comprehensive assessment of Póvoa de Varzim’s network. Sustainability 2024, 16, 9472. [Google Scholar] [CrossRef] [Scilit]
- Logan, G.; Somers, C.; Baker, G.; Connell, H.; Gray, S.; Kelly, P.; McIntosh, E.; Welsh, P.; Gray, C.M.; Gill, J.M.R. Benefits, risks, barriers, and facilitators to cycling: A narrative review. Front. Sports Act. Living 2023, 5, 1168357. [Google Scholar] [CrossRef] [Scilit]
- Castells-Graells, D.; Salahub, C.; Pournaras, E. On cycling risk and discomfort: Urban safety mapping and bike route recommendations. Computing 2020, 102, 1259–1274. [Google Scholar] [CrossRef] [Scilit]
- Gogola, M.; Senko, Š.; Mikušová, M. Finding the correlation between transport infrastructure and the fatal accident rate of cyclists—An international perspective. In Automotive Safety; CRC Press: Boca Raton, FL, USA, 2025. [Google Scholar]
- Scarano, A.; Aria, M.; Mauriello, F.; Riccardi, M.R.; Montella, A. Systematic literature review of 10 years of cyclist safety research. Accid. Anal. Prev. 2021, 156, 106135. [Google Scholar] [CrossRef] [Scilit]
- Blanco, J.C.; Fernández-Aracil, P.; Ortuño-Padilla, A. Built environment and tourism as road safety determinants in Benidorm (Spain). Eur. Plan. Stud. 2019, 27, 1314–1328. [Google Scholar] [CrossRef] [Scilit]
- Castro-Nuño, M.; Arévalo-Quijada, M.T. Assessing urban road safety through multidimensional indexes: Application of multicriteria decision making analysis to rank the Spanish provinces. Transp. Policy 2018, 68, 118–129. [Google Scholar] [CrossRef] [Scilit]
- Castro-Nuño, M.; Castillo-Manzano, J.I.; Fageda, X. The role of road safety in a sustainable urban mobility: An econometric assessment of the Spanish NUTS-3 case. Int. J. Sustain. Transp. 2018, 12, 205–217. [Google Scholar] [CrossRef] [Scilit]
- Gálvez-Pérez, D.; Guirao, B.; Ortuño, A.; Picado-Santos, L. The Influence of Built Environment Factors on Elderly Pedestrian Road Safety in Cities: The Experience of Madrid. Int. J. Environ. Res. Public Health 2022, 19, 2280. [Google Scholar] [CrossRef] [Scilit]
- Gálvez-Pérez, D.; Guirao, B.; Ortuño, A. Age-Friendly Urban Design for Older Pedestrian Road Safety: A Street Segment Level Analysis in Madrid. Sustainability 2024, 16, 8298. [Google Scholar] [CrossRef] [Scilit]
- Campisi, T.; Basbas, S.; Skoufas, A.; Akgün, N.; Ticali, D.; Tesoriere, G. The impact of COVID-19 pandemic on the resilience of sustainable mobility in Sicily. Sustainability 2020, 12, 8829. [Google Scholar] [CrossRef] [Scilit]
- Katrakazas, C.; Michelaraki, E.; Sekadakis, M.; Yannis, G. A descriptive analysis of the effect of the COVID-19 pandemic on driving behavior and road safety. Transp. Res. Interdiscip. Perspect. 2020, 7, 100186. [Google Scholar] [CrossRef] [Scilit]
- Castro-Nuño, M.; López-Valpuesta, L.; Pozo-Barajas, R. Are Spanish streets ready for bikes? Evidence from urban traffic accidents. Int. J. Inj. Control. Saf. Promot. 2025, 32, 2533202. [Google Scholar] [CrossRef] [Scilit]
- Government of Spain. Recovery, Transformation and Resilience Plan. 2021. Available online: https://planderecuperacion.gob.es/ (accessed on 20 February 2025).
- Council of the European Union and European Parliament. Directive 2008/50/EC of the European Parliament and of the Council of 21 May 2008 on Ambient Air Quality and Cleaner Air for Europe. 008, L 152, 1–44. Available online: https://eur-lex.europa.eu/legal-content/EN/TXT/?uri=CELEX:32008L0050 (accessed on 20 May 2025).
- Dirección General de Tráfico. DGT en Cifras. 2024. Available online: https://www.dgt.es/menusecundario/dgt-en-cifras/ (accessed on 20 February 2025).
- Jaber, A.; Csonka, B. Towards a sustainable and safe future: Mapping bike accidents in urbanized context. Safety 2023, 9, 60. [Google Scholar] [CrossRef] [Scilit]
- NACTO. Urban Bikeway Design Guide; Island Press: Washington, DC, USA, 2014; ISBN 1-61091-565-8. [Google Scholar]
- Medeiros, R.M. Does bikeway design matter? A bicycle-motor vehicle crash prediction model. Res. Sq. 2024. [Google Scholar] [CrossRef] [Scilit]
- Graser, A.; Aleksa, M.; Straub, M.; Saleh, P.; Wittmann, S.; Lenz, G. Safety of urban cycling: A study on perceived and actual dangers. In Traffic Safety; Wiley: Hoboken, NJ, USA, 2016; pp. 145–159. [Google Scholar]
- Fischer, J.; Sersli, S.; Nelson, T.; Yu, H.; Laberee, K.; Zanotto, M.; Winters, M. Spatial variation in bicycling risk based on crowdsourced safety data. Can. Geogr. 2022, 66, 556–568. [Google Scholar] [CrossRef] [Scilit]
- Guirao, B.; Gálvez-Pérez, D.; Casado-Sanz, N. The impact of the cyclist infrastructure type on bike accidents: The experience of Madrid. Transp. Res. Procedia 2023, 71, 403–410. [Google Scholar] [CrossRef] [Scilit]
- Salmon, P.M.; Naughton, M.; Hulme, A.; McLean, S. Bicycle crash contributory factors: A systematic review. Saf. Sci. 2022, 145, 105511. [Google Scholar] [CrossRef] [Scilit]
- Cantisani, G.; Moretti, L.; De Andrade Barbosa, Y. Safety problems in urban cycling mobility: A quantitative risk analysis at urban intersections. Safety 2019, 5, 6. [Google Scholar] [CrossRef] [Scilit]
- Ye, Y.; Zhong, C.; Suel, E. Unpacking the perceived cycling safety of road environment using street view imagery and cycle accident data. Accid. Anal. Prev. 2024, 206, 107677. [Google Scholar] [CrossRef] [Scilit]
- Schröter, B.; Hantschel, S.; Huber, S.; Gerike, R. Determinants of bicycle crashes at urban signalized intersections. J. Saf. Res. 2023, 87, 132–142. [Google Scholar] [CrossRef] [Scilit] [PubMed]
- Uijtdewilligen, T.; Ulak, M.B.; Wijlhuizen, G.J.; Bijleveld, F.; Dijkstra, A.; Geurs, K.T. How does hourly variation in exposure to cyclists and motorised vehicles affect cyclist safety? A case study from a Dutch cycling capital. Saf. Sci. 2022, 152, 105740. [Google Scholar] [CrossRef] [Scilit]
- Chum, A.A.; Labetski, A.A. Built environmental correlates of cycling accidents involving fatalities and serious injuries in London, UK. Front. Sustain. Cities 2020, 2, 599635. [Google Scholar] [CrossRef] [Scilit]
- Abbasi, S.; Ko, J. Cycling safely: Examining the factors associated with bicycle accidents in Seoul, South Korea. Accid. Anal. Prev. 2024, 206, 107691. [Google Scholar] [CrossRef] [Scilit] [PubMed]
- Benites, S.L.; de Barros Carvalho, M.D.; Pelloso, S.M. Time Trend and Associated Factors Involving Accidents with Cyclists. Preprints 2024, 2024090205. [Google Scholar] [CrossRef] [Scilit]
- Jiang, M.I.; Sato, H.; Diao, X.; Mothafer, G.I.M.A.; Yamamoto, T. Bicycle Accident Risk Factors for Different Age Groups in Nagoya, Japan. Transp. Res. Rec. 2023, 2677, 1106–1118. [Google Scholar] [CrossRef] [Scilit]
- Kane, C.; Kythreotis, S. Relationships Between Weather and Cycling. Deleted J. 2024, 6, 142999. [Google Scholar] [CrossRef] [Scilit]
- Nosal, T.; Miranda-Moreno, L.F. The effect of weather on the use of North American bicycle facilities: A multi-city analysis using automatic counts. Transp. Res. Part A-Policy Pract. 2014, 66, 163–173. [Google Scholar] [CrossRef] [Scilit]
- Hansen, A.; Kirsch, B.; Burgemeister, F.; Radtke, J.; Dorff, H.; Regier, S.; Medina, B.M. Assessing the weather conditions for urban cyclists by spatially dense measurements. In Proceedings of the EMS Annual Meeting 2022, Bonn, Germany, 4–9 September 2022. [Google Scholar] [CrossRef] [Scilit]
- Lee, E.H. Understanding gender gap in bike-sharing services via explainable artificial intelligence. Transp. Res. Rec. 2025, 2679, 622–633. [Google Scholar] [CrossRef] [Scilit]
- Yang, Z.; He, J.; Al-Khasawneh, M.B.; Pandit, D.; Cinzia, C. E-bike agents: Large Language Model-Driven E-Bike Accident Analysis and Severity Prediction. arXiv 2025, arXiv:2506.04654. [Google Scholar] [CrossRef] [Scilit]
- Ziakopoulos, A.; Yannis, G. A review of spatial approaches in road safety. Accid. Anal. Prev. 2020, 135, 105323. [Google Scholar] [CrossRef] [Scilit]
- Daraei, S.; Pelechrinis, K.; Quercia, D. A data-driven approach for assessing biking safety in cities. EPJ Data Sci. 2021, 10, 11. [Google Scholar] [CrossRef] [Scilit]
- Sabbaghian, M.H.; Llopis-Castelló, D.; García, A. Assessing micromobility safety on horizontal curves of bike lanes: A video motion analysis methodology. Traffic Saf. Res. 2024, 7, e000057. [Google Scholar] [CrossRef] [Scilit]
- Cicchino, J.B.; McCarthy, M.L.; Newgard, C.D.; Wall, S.P.; DiMaggio, C.J.; Kulie, P.E.; Arnold, B.N.; Zuby, D.S. Not all protected bike lanes are the same: Infrastructure and risk of cyclist collisions and falls leading to emergency department visits in three U.S. cities. Accid. Anal. Prev. 2020, 141, 105490. [Google Scholar] [CrossRef] [Scilit] [PubMed]
- Gobierno de España; Ministerio del Interior. Texto Refundido de la Ley Sobre Tráfico, Circulación de Vehículos a Motor y Seguridad Vial. Real Decreto Legislativo 6/2015, 30 de oct. de 2015. Available online: https://www.boe.es/buscar/act.php?id=BOE-A-2015-11722&p=20251204&tn=1 (accessed on 10 February 2025).
- Jacobsen, P.L. Safety in numbers: More walkers and bicyclists, safer walking and bicycling. Inj Prev. 2003, 9, 205–209. [Google Scholar] [CrossRef] [Scilit] [PubMed]
- Jia, Y.; Wu, G.; Chang, S. Principal Component Clustering Analysis Method Applied to Road Traffic Safety. J. Transp. Eng. 2011, 137, 2832–2837. [Google Scholar] [CrossRef] [Scilit]
- Latha, N.; Geetha, K.; Damodharan, S. Overview of Regression Models and How to Determine the Best Model for Data. J. Sci. Res. Rep. 2024, 30, 627–636. [Google Scholar] [CrossRef] [Scilit]
- Hilbe, J.M. Negative Binomial Regression, 2nd ed.; Cambridge Univ. Press: Cambridge, UK, 2011. [Google Scholar]
- Instituto para la Diversificación y Ahorro de la Energía (IDAE). PTT: Guía Práctica Para la Elaboración e Implantación de Planes de Transporte al Centro de Trabajo; IDAE: Madrid, Spain, 2006; Available online: https://www.idae.es/uploads/documentos/documentos_10250_Guia_PTT_A2006_A_8ab6195c.pdf (accessed on 20 May 2025).
- Ministerio de Transportes y Movilidad Sostenible. Encuesta de Movilidad de las Personas Residentes en España MOVILIA 2006-2007; Ministerio de Fomento: Madrid, Spain, 2007; Available online: https://www.transportes.gob.es/informacion-para-el-ciudadano/informacion-estadistica/movilidad/movilia-20062007/encuesta-de-movilidad-de-las-personas-residentes-en-espan%CC%83a-movilia-20062007 (accessed on 20 May 2025).
- Instituto para la Diversificación y Ahorro de la Energía (IDAE). Guía Metodológica Para la Implantación de Sistemas de Bicicletas Públicas en España; IDAE: Madrid, Spain, 2007; Available online: https://www.idae.es/uploads/documentos/documentos_Guia_Bicicletas_8367007d.pdf (accessed on 20 May 2025).
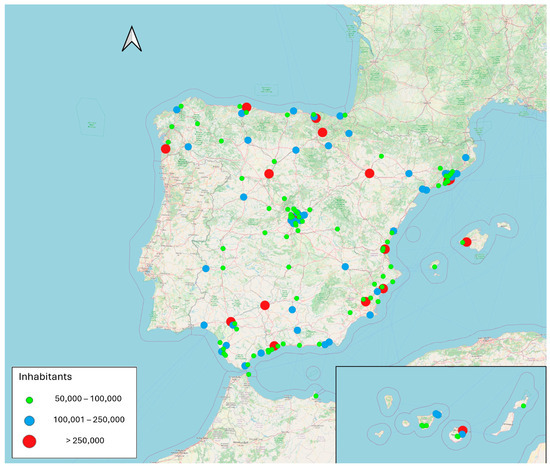
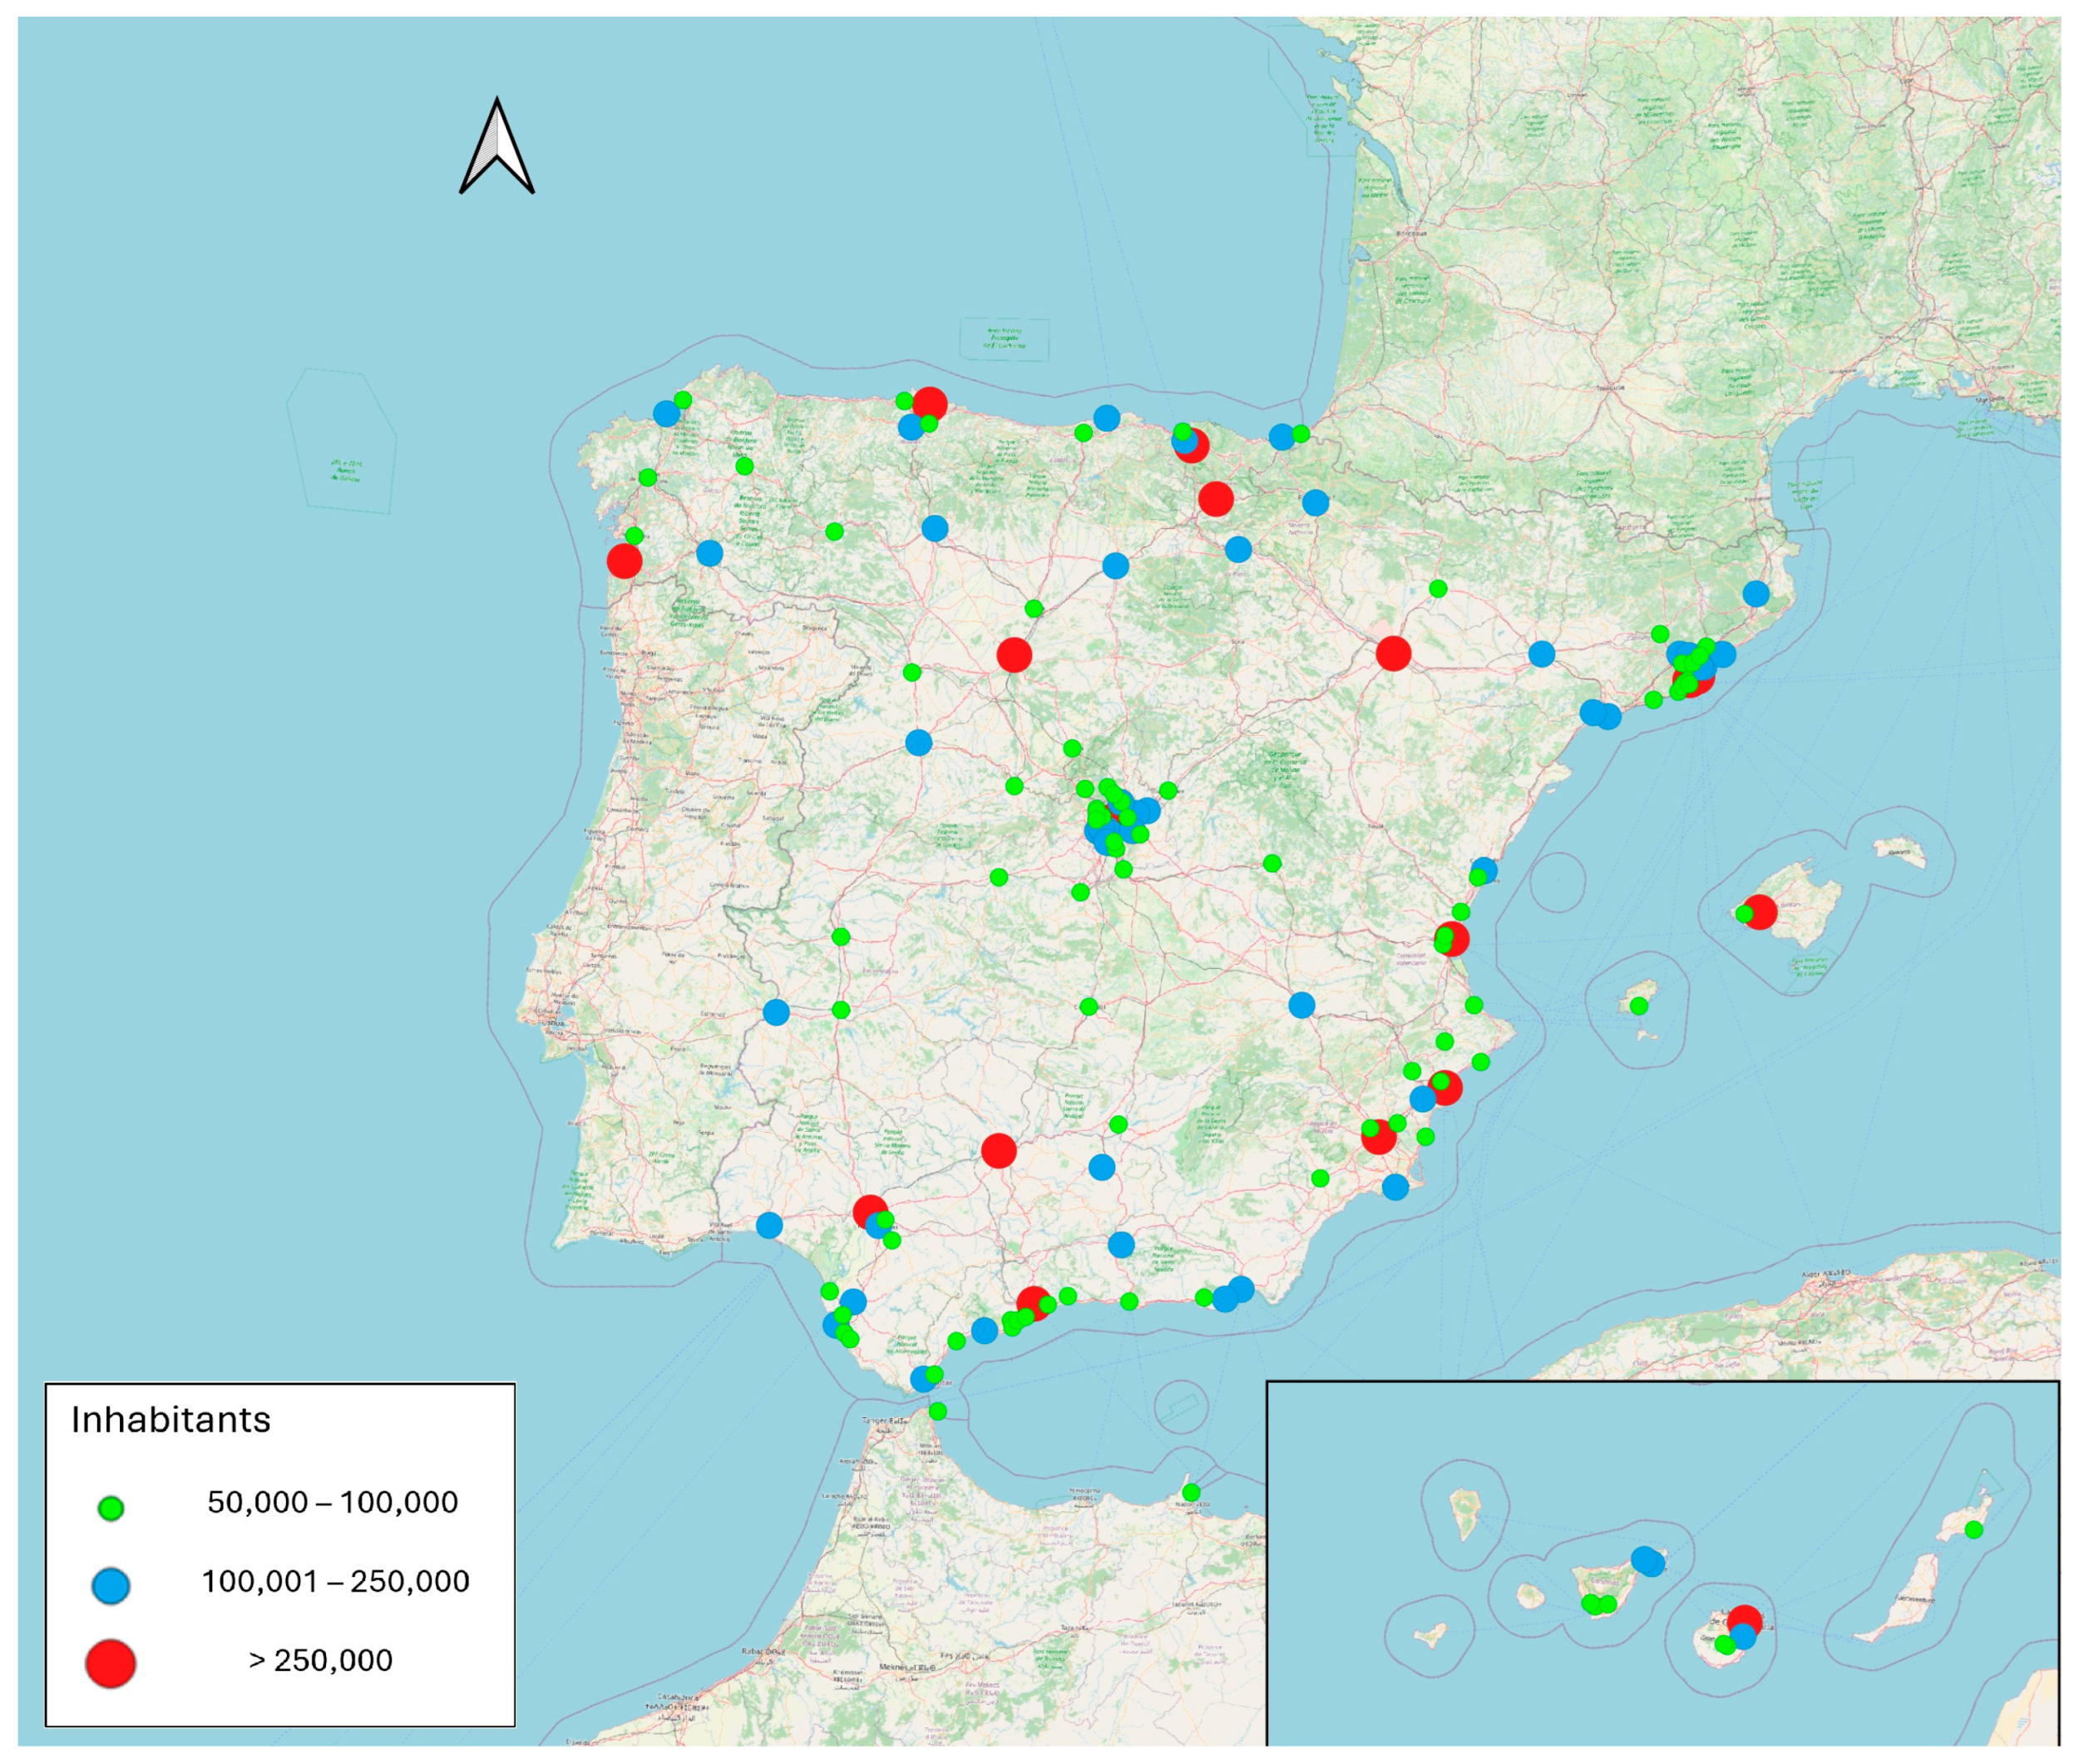
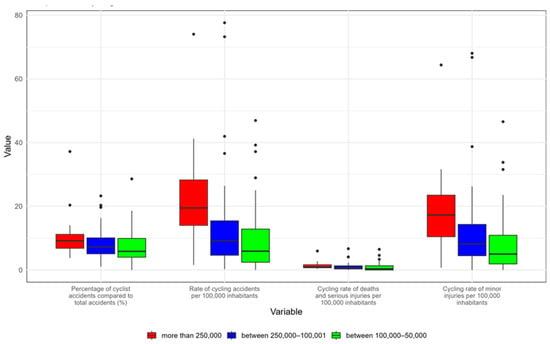
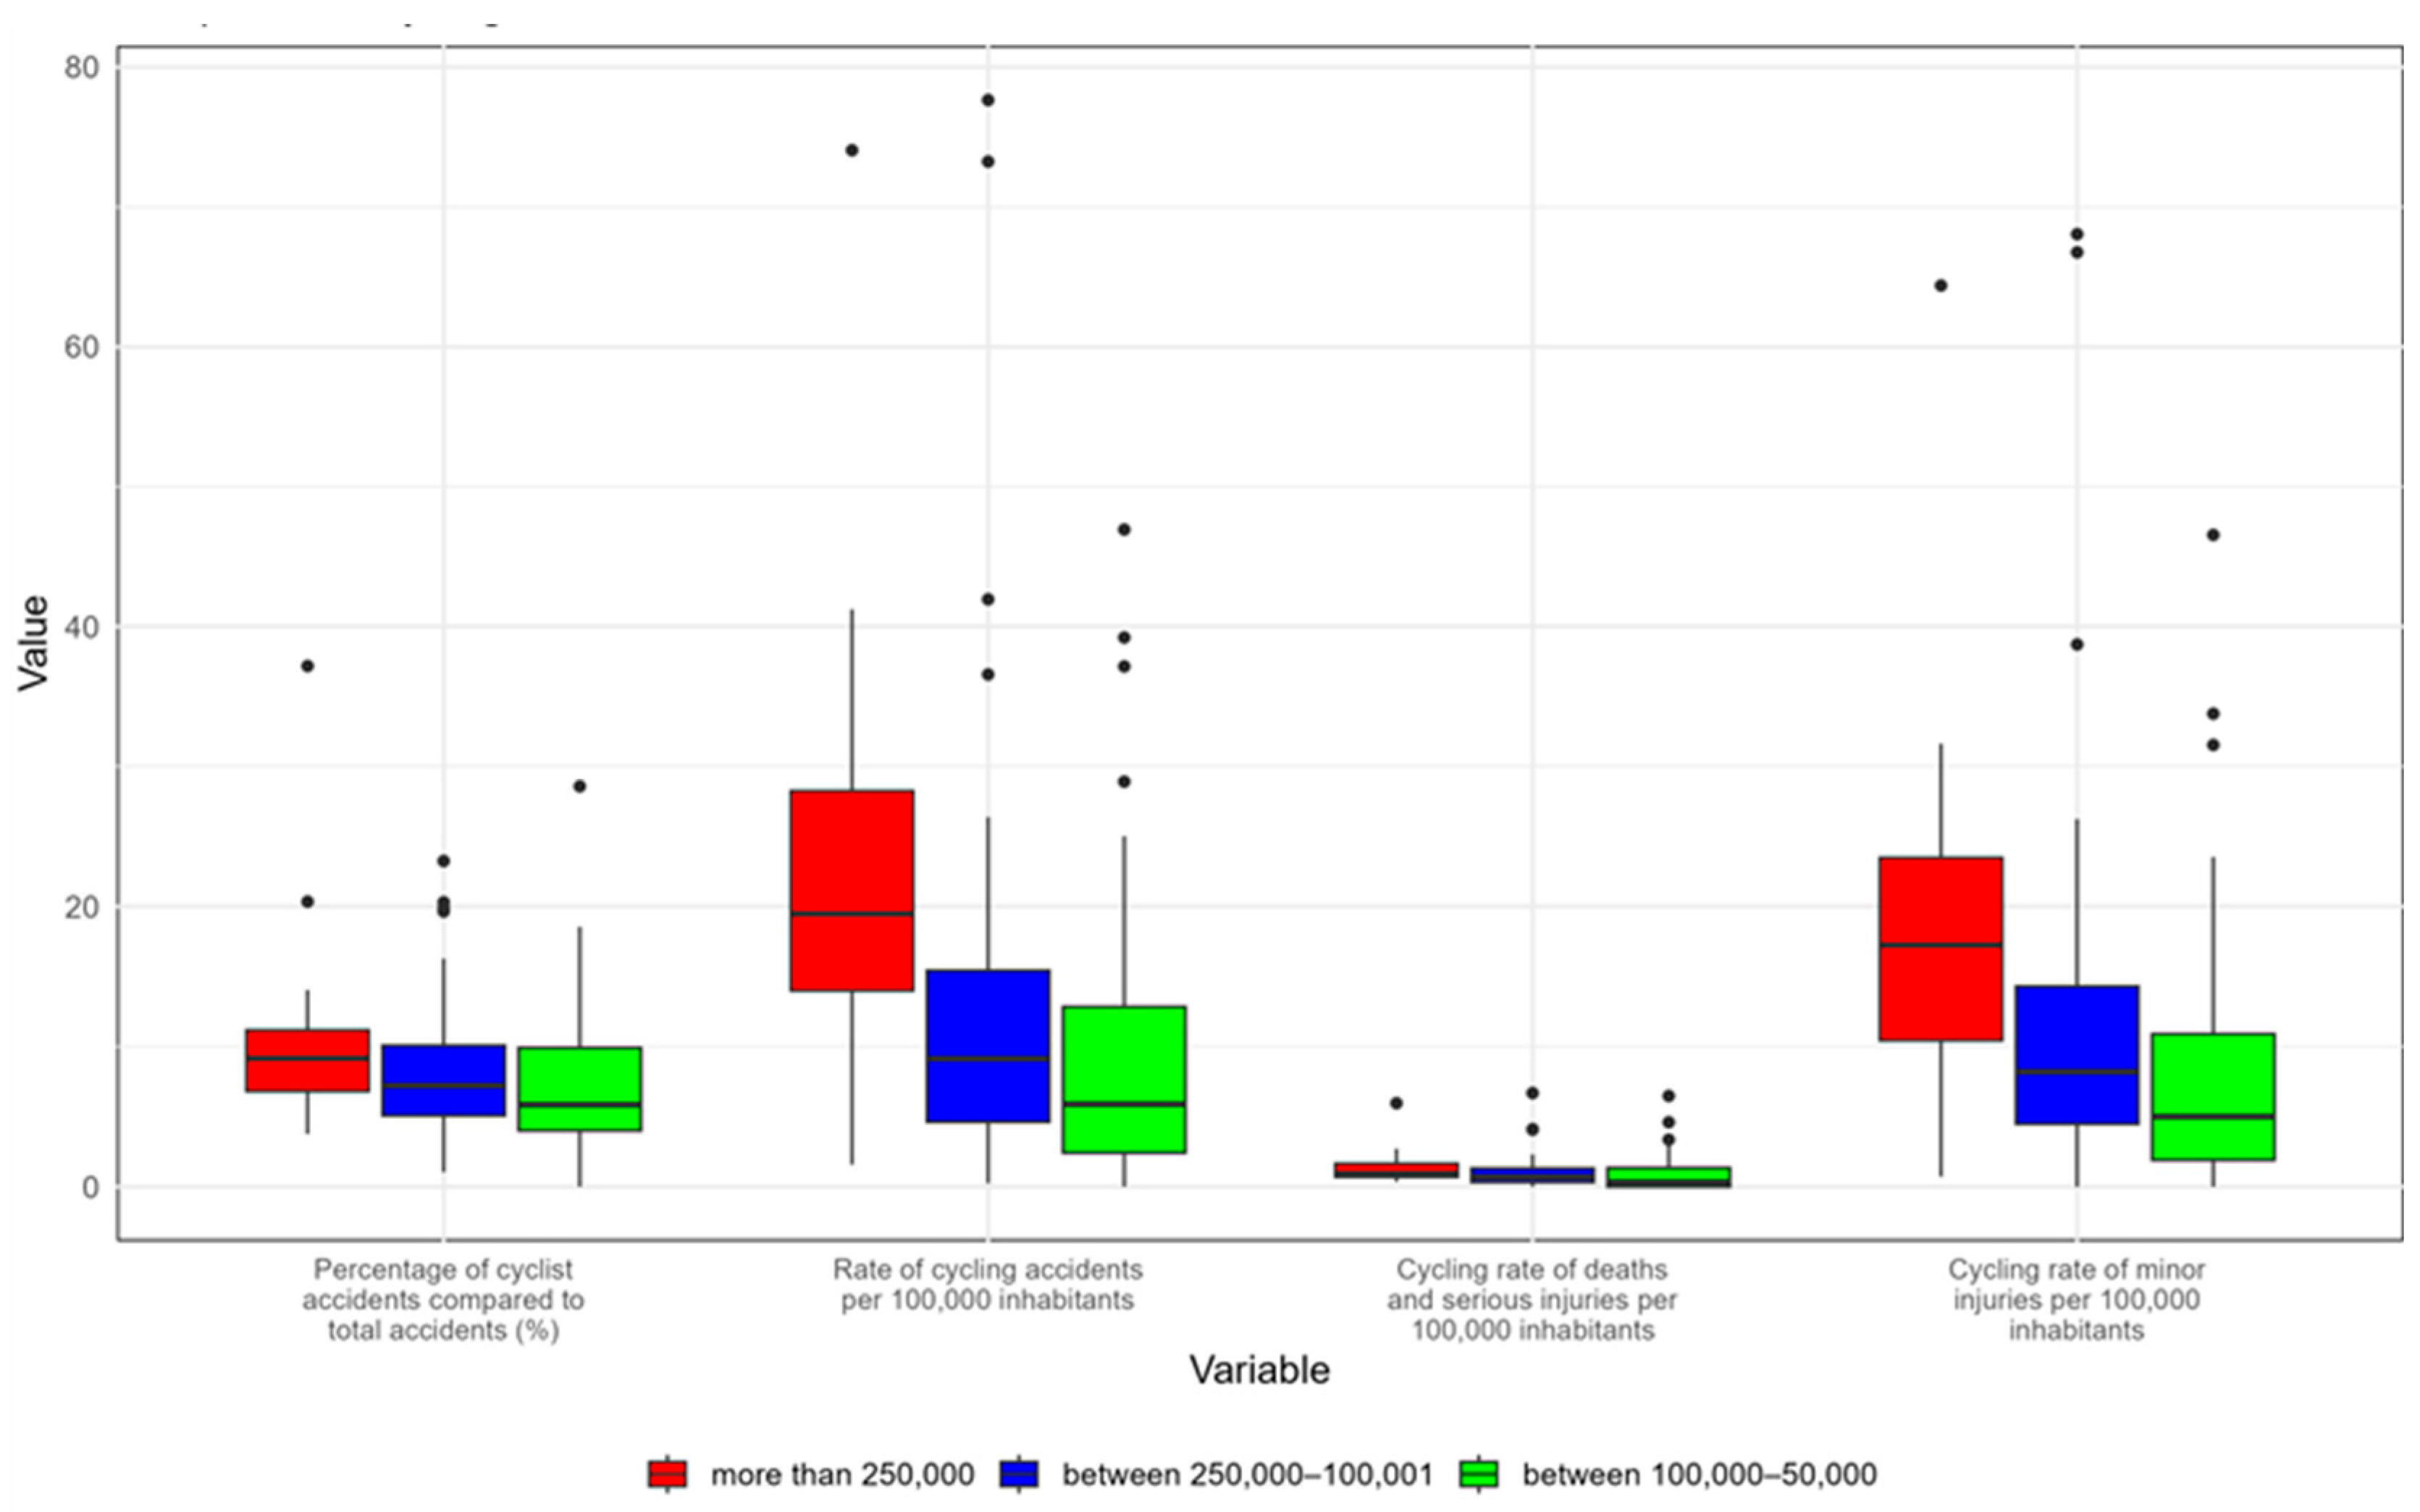
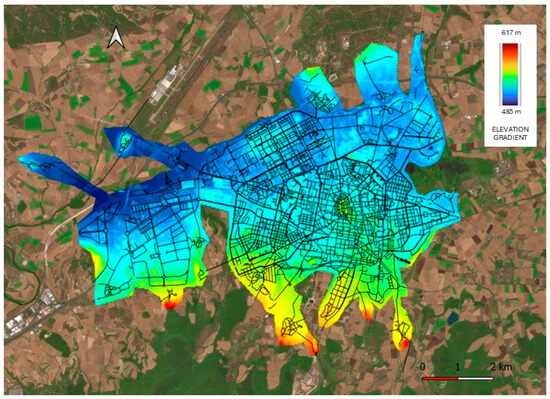
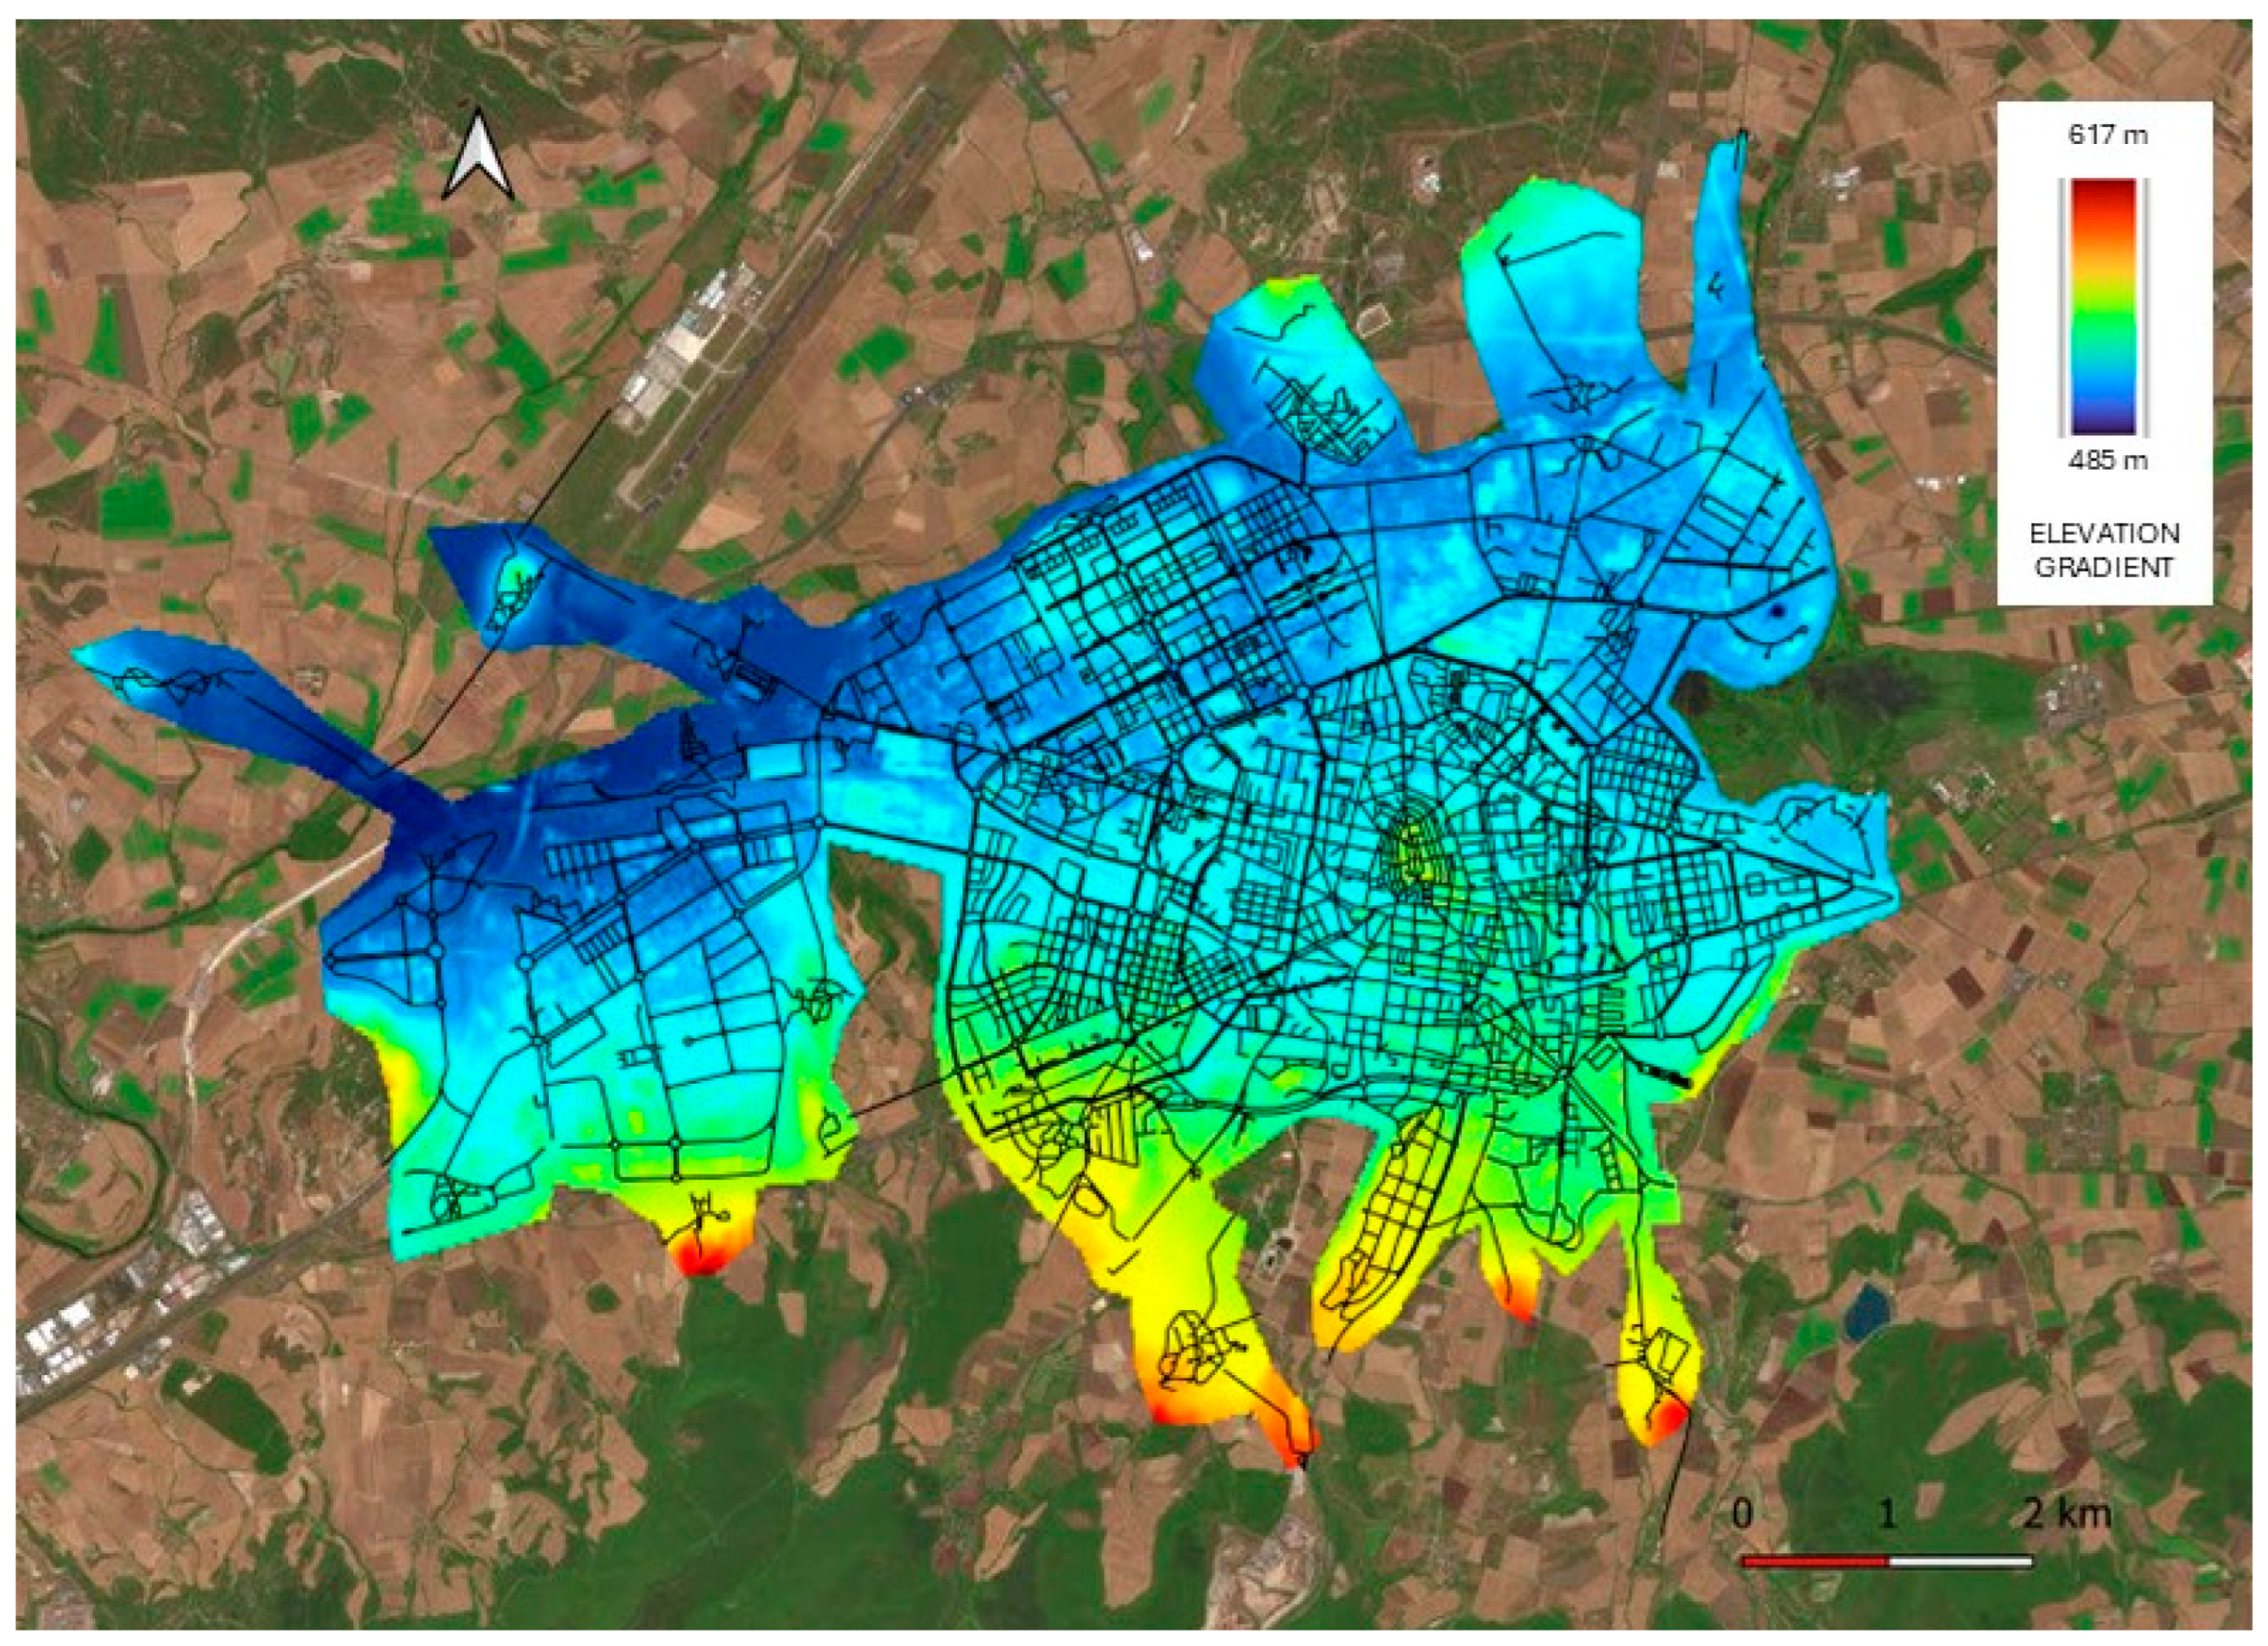
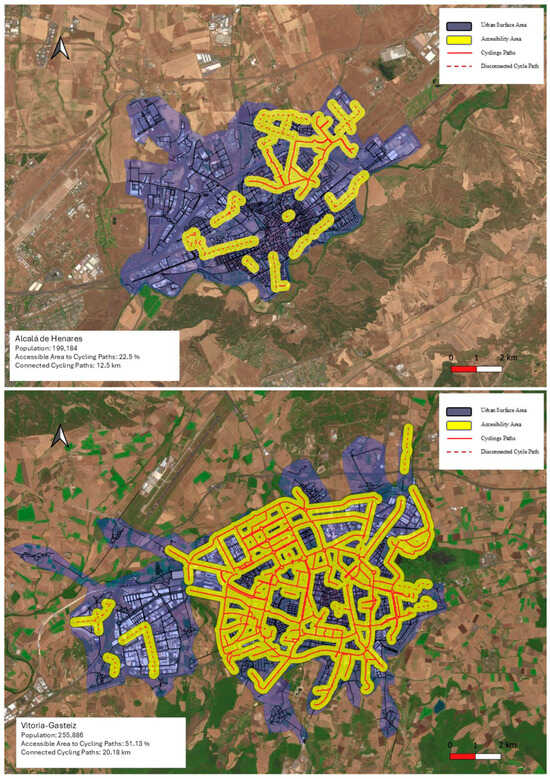
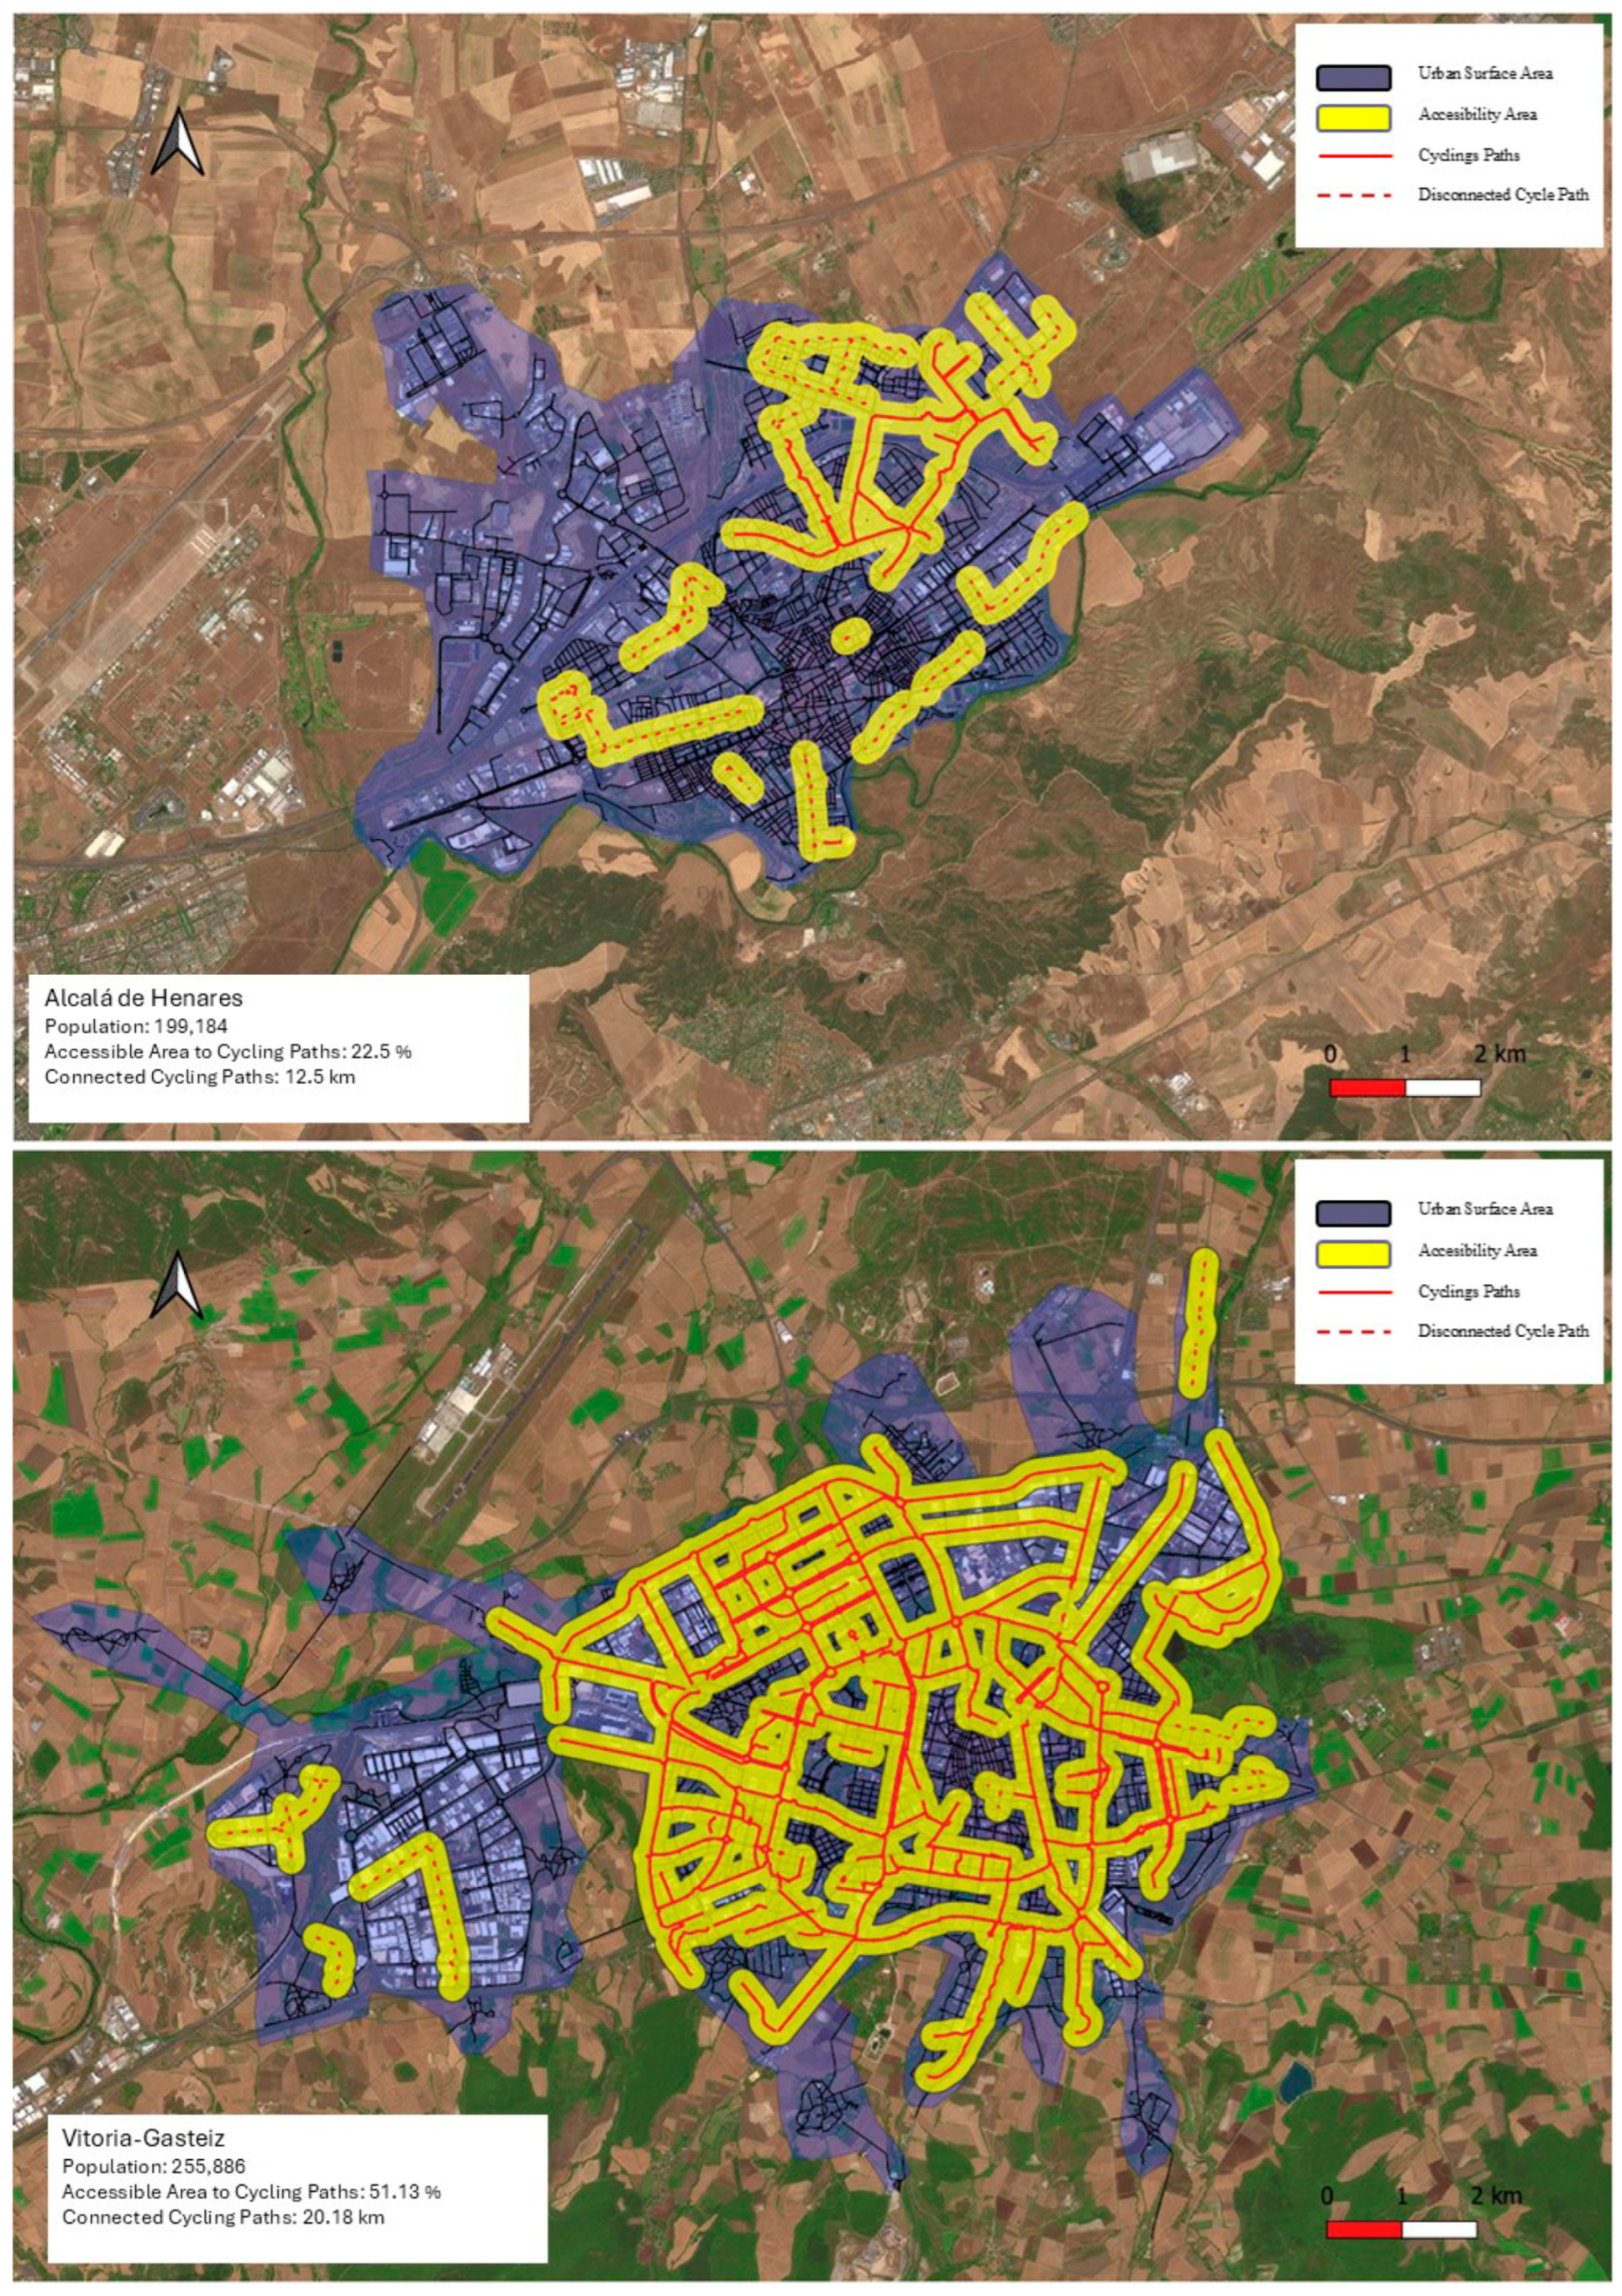
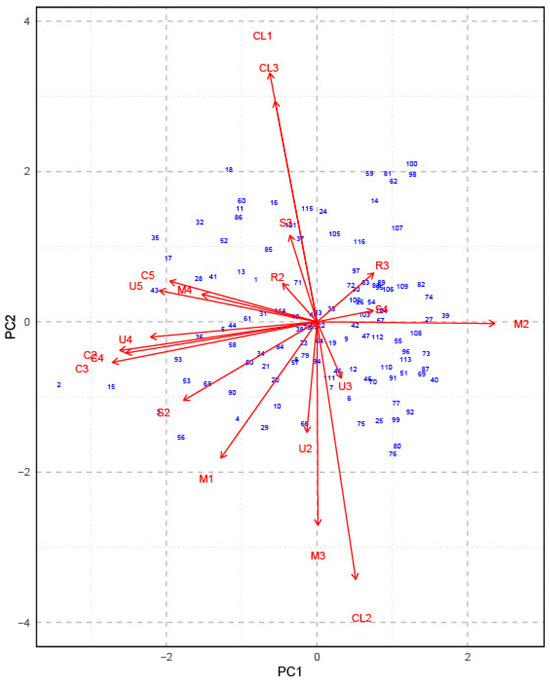
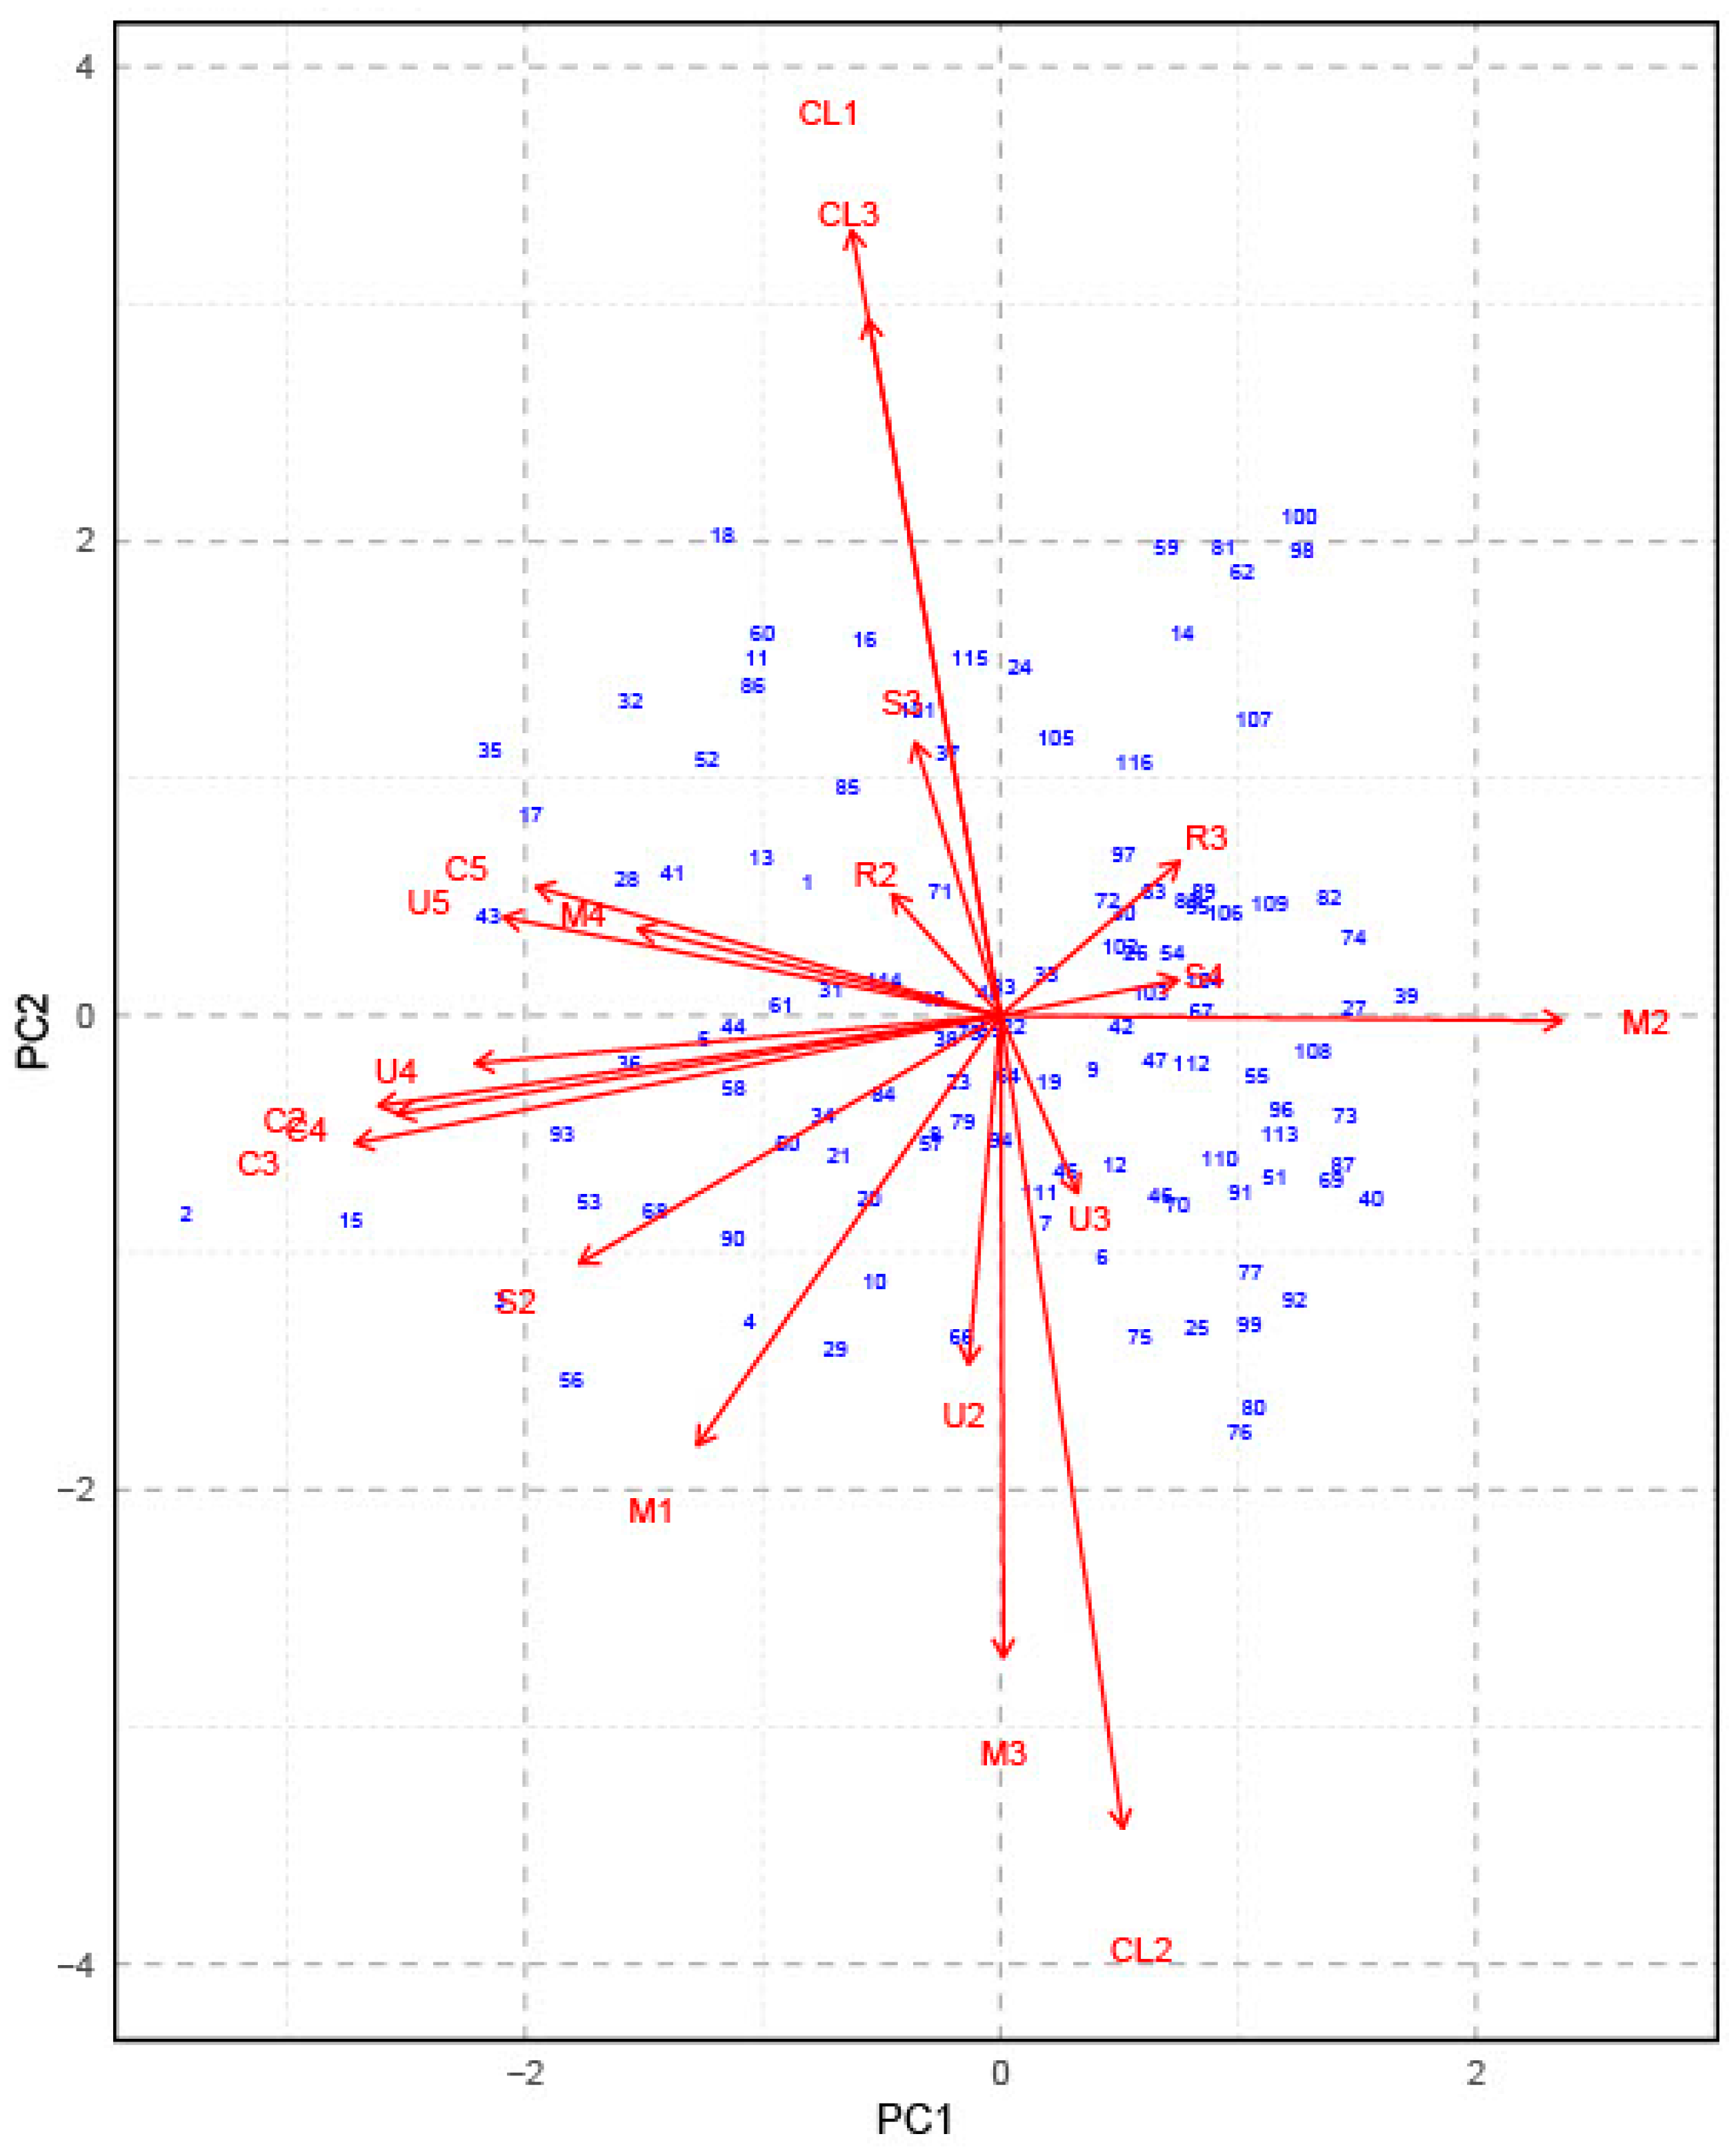
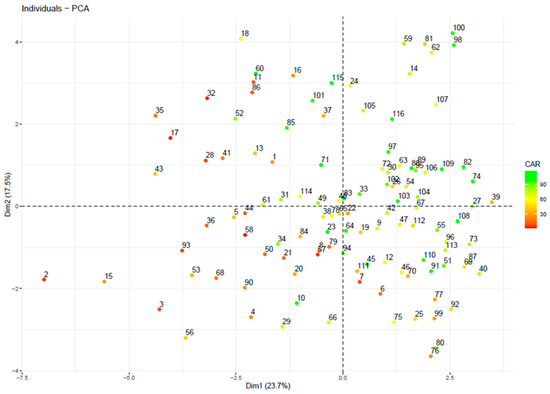
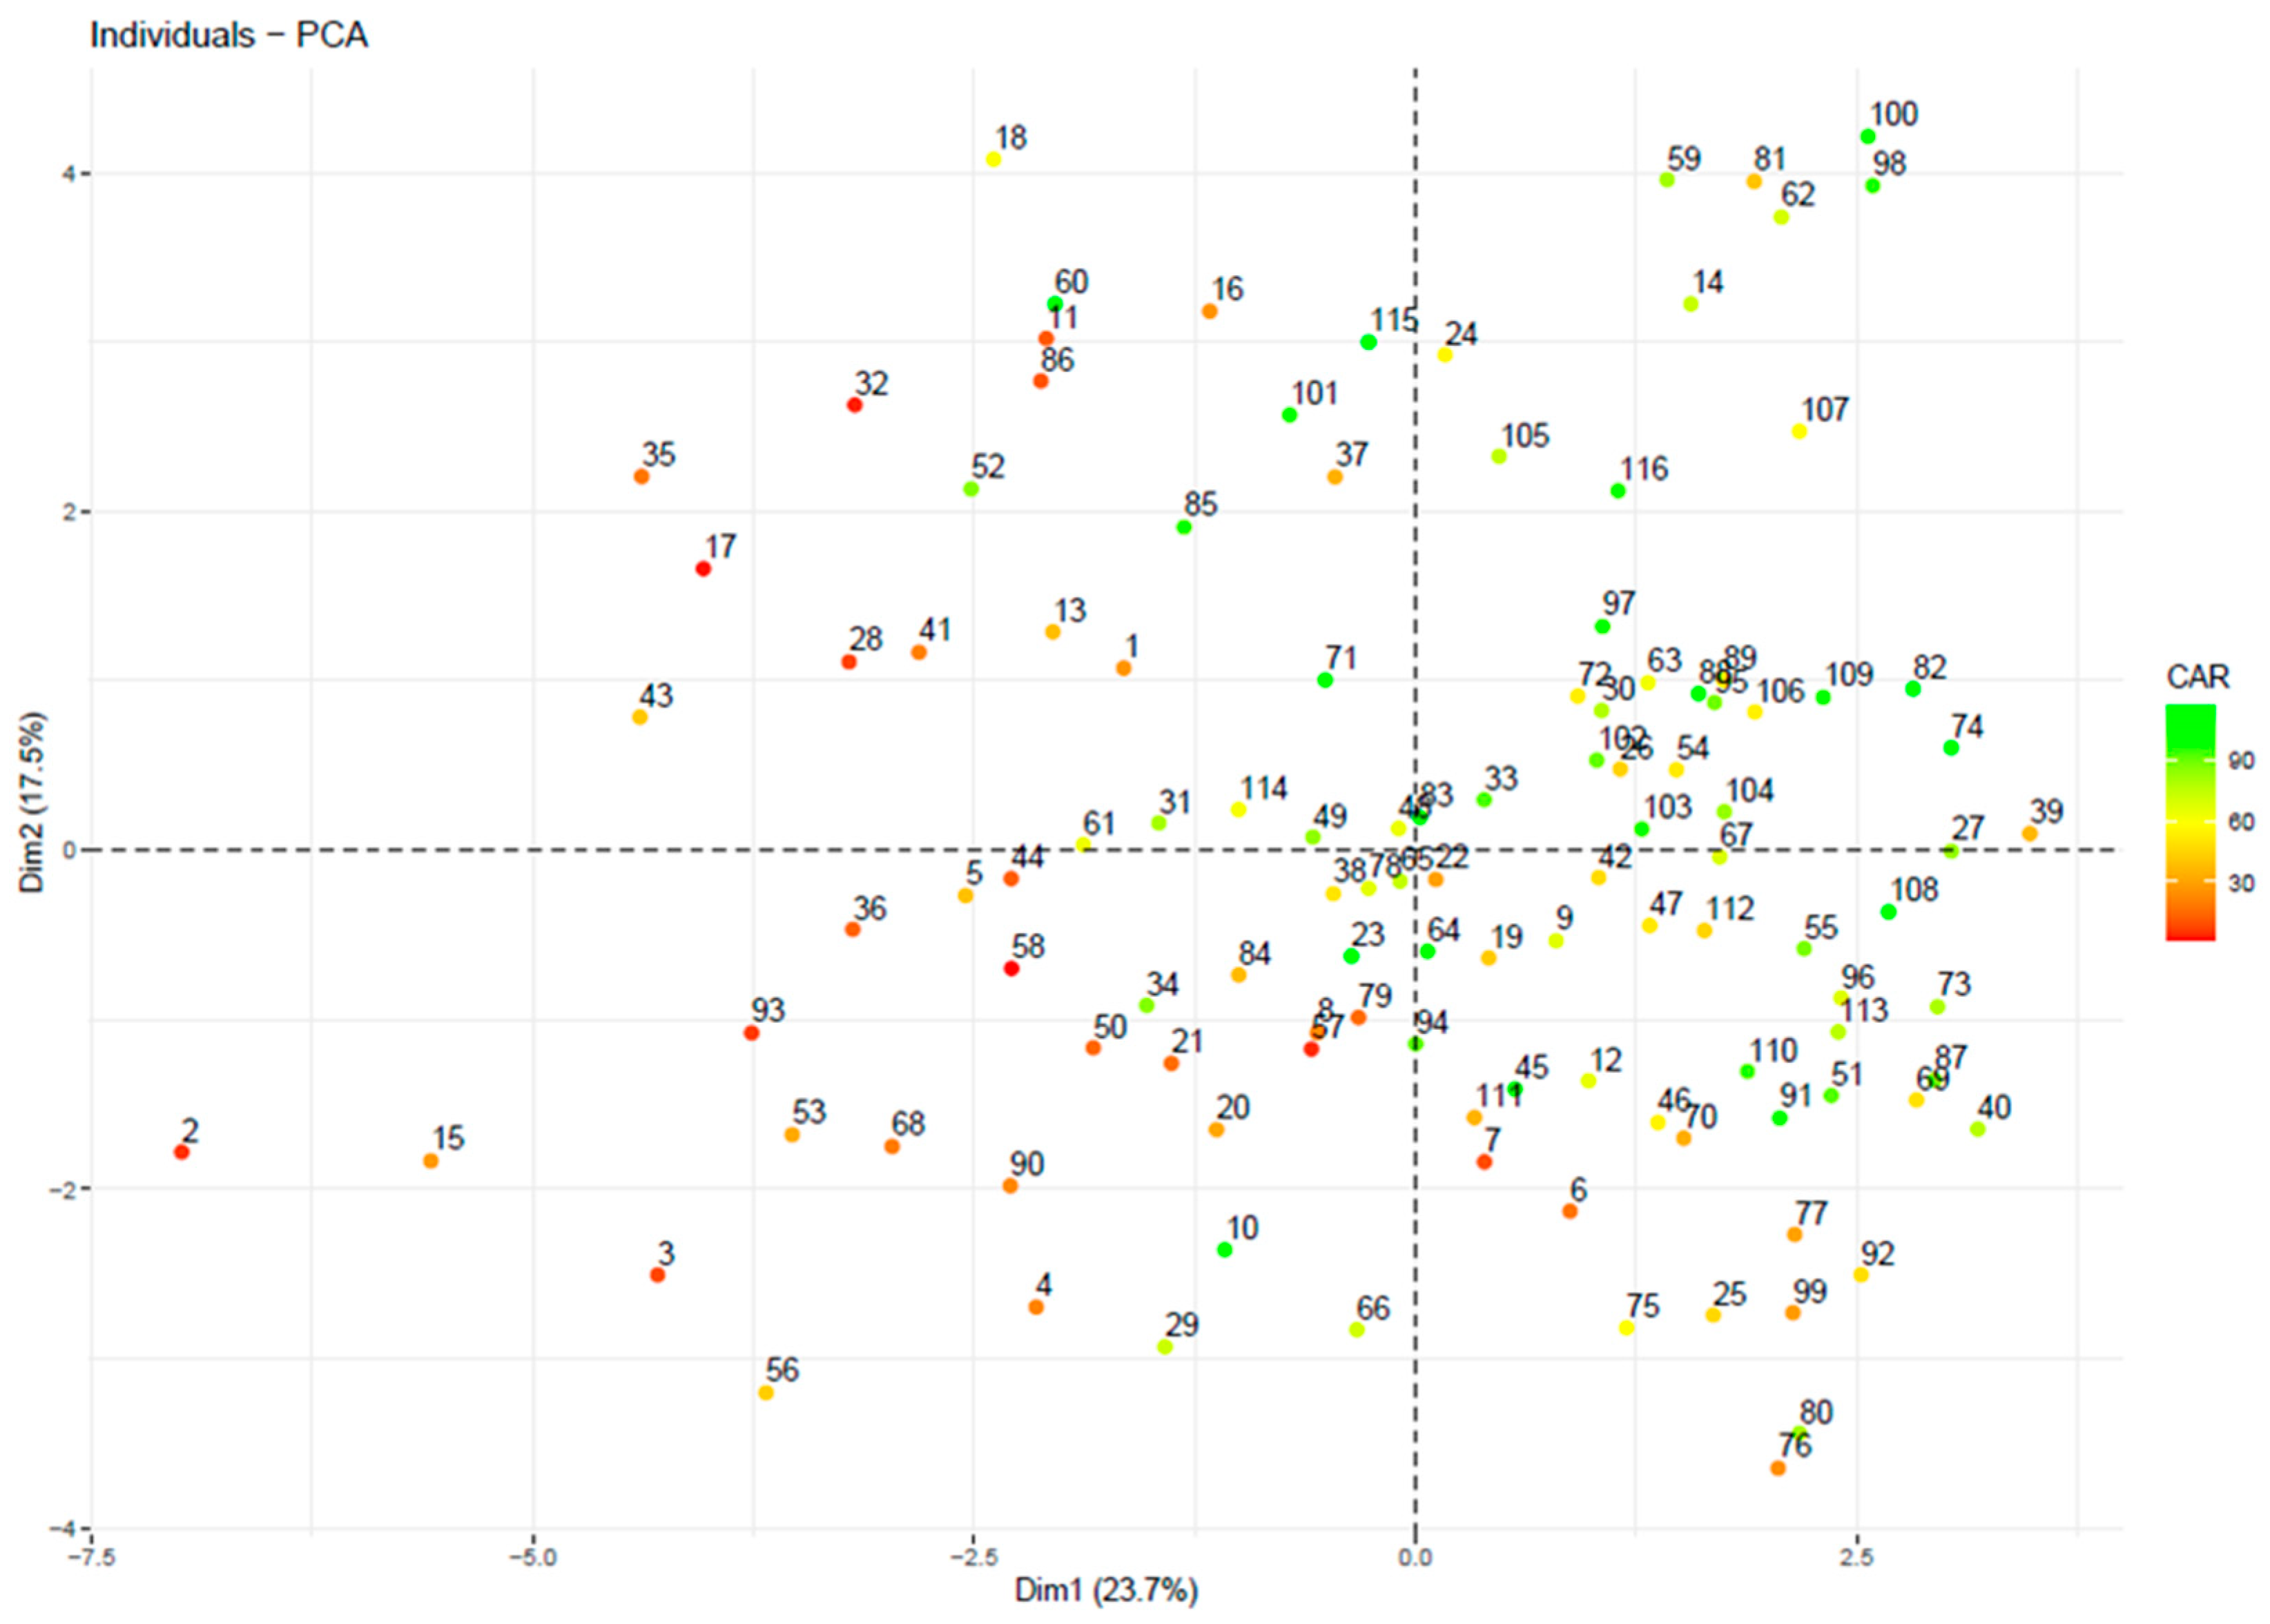

Disclaimer/Publisher’s Note: The statements, opinions and data contained in all publications are solely those of the individual author(s) and contributor(s) and not of MDPI and/or the editor(s). MDPI and/or the editor(s) disclaim responsibility for any injury to people or property resulting from any ideas, methods, instructions or products referred to in the content. |
© 2026 by the authors. Licensee MDPI, Basel, Switzerland. This article is an open access article distributed under the terms and conditions of the Creative Commons Attribution (CC BY) license.