


Abstract
Gross Primary Productivity (GPP) in grassland ecosystems is a fundamental eco-biophysical indicator for assessing carbon cycling, grazing capacity, and ecosystem responses to climatic stress. However, robust estimation of GPP in arid and semi-arid rangelands remains challenging because of pronounced spatial heterogeneity, strong climate variability, and inherent uncertainties associated with remotely sensed observations. Together, these factors constrain both modeling performance and out-of-sample generalization beyond the training domain. In this dryland grassland context, this study compares the performance of machine learning (ML) models for grassland GPP proxy-based characterization, downscaling, and predictive agreement using a multivariate dataset that integrates Sentinel-2-derived spectral and phenological features, a Moderate-Resolution Imaging Spectroradiometer (MODIS)-derived GPP proxy, and complementary climatic and geographic information. Pixel-level observations spanning multiple years are analyzed, with ordinary linear regression used as a baseline benchmark and ensemble decision-tree models, including Random Forest, Gradient Boosting, and Histogram-based Gradient Boosting (HGB), compared. Instead of relying solely on random cross-validation, model performance is systematically assessed using a combination of spatially structured validation and a leave-one-year-out scheme to explicitly examine spatial and temporal generalization. The results indicate that ensemble tree-based models outperform linear approaches, with the HGB model showing the strongest agreement with the MODIS-derived GPP proxy (R2 = 0.95, RMSE = 0.035 on the test set) and maintaining stable performance across spatial and temporal validations (R2 = 0.86–0.96 across years). Taken together, the findings demonstrate that integrating multi-source remote sensing data with climatic information within a rigorous validation framework enables a more reliable assessment of model generalization and gap-filling consistency with respect to a remote-sensing-based proxy target, rather than an absolute validation against ground-based measurements, thereby supporting sustainability-relevant monitoring of arid grassland ecosystems.
1. Introduction
Pastoral systems based on extensive grasslands, including nomadic and semi-nomadic livestock production, are among the most climate-sensitive agricultural systems worldwide. In such rangeland-dominated systems, GPP represents a key biophysical indicator that is directly linked to grazing capacity, forage availability for livestock, ecosystem functioning, and ultimately sustainable human livelihoods [1,2]. In particular, in arid and semi-arid ecosystems, GPP responds strongly to short-term climatic fluctuations and has been shown to contribute disproportionately to the interannual variability of global terrestrial productivity [1,3].
Recent international studies have documented increasing frequency and intensity of climate extremes in arid and semi-arid regions, including droughts, pronounced temperature variability, and episodic cold events. Although these regions account for a relatively small share of global primary production, their influence on year-to-year variability is substantially greater than that of many other ecosystem types [2,4]. This heightened sensitivity underscores the importance of robust and spatially explicit characterization of productivity dynamics in dryland grassland ecosystems under a changing climate, particularly in the context of sustainability-oriented land management [5].
Under these conditions, the need for spatially and temporally explicit estimation of grassland GPP has become increasingly important for sustainable rangeland management and monitoring. However, ground-based measurement approaches, such as eddy-covariance flux tower observations, remain constrained by limited spatial coverage and substantial logistical and financial requirements. As a result, remote sensing-based GPP products, particularly those derived from MODIS algorithms, have been widely adopted in practice. Nevertheless, previous studies have reported that such products may exhibit systematic underestimation and increased uncertainty when applied to grassland ecosystems and dryland environments [6,7,8].
In recent years, improvements in satellite spatial resolution, together with the growing availability of spectral, phenological, and climate-related derivative variables, have driven a rapid expansion of ML approaches for GPP assessment. In particular, ensemble models built on decision tree architectures have demonstrated the capacity to flexibly capture nonlinear, threshold-dependent, and interactive relationships across multi-source datasets. Accordingly, these approaches have demonstrated greater robustness than traditional regression and index-based methods in heterogeneous grassland environments [8,9].
Despite these advances, model validation remains a critical methodological concern when applying ML techniques to variables such as GPP that exhibit strong spatial autocorrelation. Methodological studies have cautioned that reliance on random cross-validation alone may substantially overestimate true generalization performance, motivating the adoption of validation strategies explicitly tailored to spatially structured environmental data, especially for sustainability-relevant regional assessments.
Dryland regions characterized by frequent climatic extremes and strong dependence on pastoral livestock production provide particularly important case systems for investigating the challenges outlined above. In these areas, natural grasslands represent a primary economic resource, and spatial and temporal variability in GPP is therefore directly linked not only to ecological processes but also to socio-economic outcomes and long-term sustainability of pastoral livelihoods [9].
Against this background, the present study focuses on climate-sensitive, grassland-based pastoral systems and systematically evaluates the performance of ensemble ML models based on decision-tree architectures. By integrating high-resolution Sentinel-2 observations, a MODIS-derived GPP proxy, and climate-related indicators, and by applying spatially structured and temporal validation schemes, this study explicitly examines model generalization capacity and robustness under climatic stress within a proxy-based GPP framework, with direct relevance to sustainability-focused grassland monitoring.
2. Literature Review
2.1. GPP in Grassland Ecosystems and Remote Sensing-Based Assessment
GPP is a key indicator of carbon cycling in arid and semi-arid ecosystems, which contribute disproportionately to the interannual variability (IAV) of terrestrial productivity [1,2,3]. In grassland ecosystems, GPP responds primarily to short-term variations in precipitation and soil moisture, while temperature generally plays a secondary role under most conditions [4,10].
Remote sensing–based approaches provide spatially extensive and temporally continuous estimates of GPP but rely on conceptual models rather than direct measurements. Widely used products, including those derived from the MODIS, integrate satellite observations with climatic inputs and have been applied extensively in global and regional ecosystem studies [11,12,13]. Several reviews have summarized the theoretical foundations and limitations of such approaches for monitoring vegetation carbon uptake 5].
However, multiple studies report that MODIS-based GPP products tend to systematically underestimate productivity in grassland and dryland ecosystems, particularly relative to flux-based upscaling methods and solar-induced chlorophyll fluorescence (SIF) products [6,7,14]. Although SIF is more closely linked to photosynthetic processes, its limited spatial and temporal coverage constrains its regional applicability [15,16]. Vegetation indices such as the Normalized Difference Vegetation Index (NDVI) are also widely used to characterize greenness and structure, but their relationship with actual photosynthetic activity often weakens under water-stressed conditions [17,18]. Consequently, MODIS GPP and related products are increasingly interpreted as proxy-based indicators of long-term spatial and temporal productivity dynamics rather than as direct measurements [17].
2.2. Application of ML Approaches in Grassland GPP Assessment
In recent years, the application of ML approaches to grassland GPP assessment has expanded rapidly, primarily because they can more effectively represent nonlinear relationships and complex interactions among multiple ecological drivers than conventional statistical models [8,19]. Grassland ecosystems are shaped by interacting influences of climate variability, soil moisture dynamics, and pronounced geographic heterogeneity, conditions under which linear modeling assumptions often fail to fully capture combined effects.
Within this context, decision tree–based ML approaches, including Random Forest, Gradient Boosting, Extreme Gradient Boosting, and Light Gradient Boosting, are commonly regarded as well-suited for grassland ecosystem data. These methods capture nonlinear, threshold-dependent, and interaction-driven relationships that are characteristic of ecological systems [8,9]. Comparative studies further indicate that boosting-based algorithms tend to deliver relatively more stable performance under conditions of high noise and heterogeneous data distributions [9,19].
Recent research has also shown that ML-based upscaling strategies integrating multi-source satellite observations, such as optical, thermal, and microwave data, can effectively represent spatially heterogeneous carbon and water flux dynamics in dryland environments [20]. Evidence from the Mongolian Plateau and other comparable dryland regions similarly suggests that tree-based ML models can, under certain conditions, provide more reliable estimates of ecosystem productivity than conventional regression-based approaches [21].
2.3. Model Validation and Spatial Generalization Capacity
Recent methodological studies caution that performance evaluation based on random cross-validation can substantially overestimate true generalization capacity when applied to ecological datasets characterized by strong spatial autocorrelation [9,19]. In pixel-level grassland datasets, neighboring spatial units are often highly correlated, leading to overlap between training and test samples that can artificially inflate accuracy estimates and fail to reflect practical, real-world predictive performance.
To address this limitation, validation strategies that explicitly account for spatial structure, including spatial block cross-validation and leave-one-region-out approaches, are increasingly regarded as more appropriate for assessing model generalization [9]. This consideration is particularly important in dryland ecosystems, where pronounced spatial heterogeneity and climate-driven variability are common. Previous studies further emphasize that spatially structured validation frameworks are essential for analyses intended to support regional-scale inference and policy-relevant applications [19].
2.4. Interannual Variability and Uncertainty of GPP in Dryland Ecosystems
Arid and semi-arid regions account for a relatively small share of global Gross Primary Productivity, yet a substantial body of research has shown that they exert a disproportionately large influence on the IAV of terrestrial GPP [1,2,3]. In these environments, short-term climatic fluctuations play a dominant role, with seasonal precipitation patterns and soil moisture dynamics generally exerting stronger controls on GPP variability than temperature [4,10]. During periods characterized by concurrent drought and elevated temperatures, grassland GPP often declines sharply, reflecting strong hydrological constraints on ecosystem productivity.
Under such conditions, commonly used vegetation indices, including the NDVI, have been shown to inadequately capture actual carbon uptake [9]. Recent evidence further indicates that soil moisture becomes the primary driver of GPP variability during hot drought events in dryland ecosystems, outweighing the direct effects of temperature and reinforcing the central role of water availability in regulating productivity [22,23].
At the same time, previous studies have demonstrated substantial discrepancies among different GPP products, including MODIS-based estimates, solar-induced chlorophyll fluorescence–derived products, and flux-measurement-based upscaling approaches [6,7,24,25]. In dryland grassland ecosystems, MODIS GPP has been reported to exhibit systematic underestimation. Nevertheless, many studies recognize its utility as a proxy for representing long-term temporal trends and relative spatial contrasts in ecosystem productivity. Consequently, recent research emphasizes moving beyond reliance on a single GPP product and instead integrating proxy-based GPP information with climatic, soil, and geographic variables within ML frameworks to improve robustness and interpretability [8,19].
2.5. Research Gaps and Hypothesis Development
A synthesis of existing studies highlights several unresolved research gaps. First, many investigations of grassland GPP in dryland environments rely predominantly on random cross-validation, which can lead to overly optimistic estimates of predictive performance by failing to adequately assess spatial generalization capacity [9,21]. Second, although MODIS GPP is widely used as a proxy indicator, its associated uncertainty, particularly its systematic bias during extremely dry years, is rarely explicitly examined [19,20]. Third, grassland ecosystems exposed to pronounced climatic extremes play a disproportionate role in driving global-scale variability in dryland GPP, yet remain underrepresented in comparative international analyses [9,21]. Building on these gaps, the present study formulates the following hypotheses.
H1.
Tree-based ML models that integrate multiple climatic and geographic variables provide higher predictive agreement with MODIS-derived GPP proxies in dryland grassland regions than simple regression models and index-based approaches.
H2.
When spatially structured validation strategies are applied, the predictive performance of ML models is statistically lower than that from random cross-validation but more accurately reflects their true generalization capacity.
H3.
During drought-dominated years, precipitation and soil moisture exert a stronger influence on grassland GPP variability than temperature, and this relationship is better captured by multivariate ML models.
H4.
ML models that use MODIS GPP as a proxy indicator can consistently explain IAV in grassland GPP across both normal and extremely dry years.
3. Data and Methods
3.1. Study Area and Data Sources
This study focuses on a dryland ecosystem characterized by strong sensitivity to climate variability and a dominant reliance on pastoral livestock production. Such pastoral rangeland systems exhibit pronounced spatial and temporal variability in vegetation productivity and are strongly dependent on seasonal precipitation and soil moisture patterns. For these reasons, they are well-suited as representative systems for investigating grassland GPP dynamics under climate stress conditions.
The analysis uses multispectral satellite observations from the Sentinel-2 Multi-Spectral Instrument (European Space Agency, Paris, France) acquired from 2018 to 2024. Sentinel-2 provides spatial resolutions of 10–20 m, which allows a relatively detailed representation of within-grassland heterogeneity. Standard masking procedures were applied to remove clouds, cloud shadows, and low-quality pixels, thereby ensuring that only reliable observations were retained for subsequent analysis.
Initial samples were extracted using the Google Earth Engine environment (Google LLC, Mountain View, CA, USA) by integrating Sentinel-2 imagery with MODIS-derived GPP data. Subsequent preprocessing steps included removing observations with missing values and filtering out physically implausible GPP estimates. Importantly, these data-cleaning procedures were designed to remove sensor-related artifacts and non-physical values rather than to exclude ecologically meaningful extreme events associated with climate variability in arid grasslands. A detailed summary of the sampling strategy and data-cleaning procedures is provided in Table S1 of the Supplementary Materials.
MODIS-derived GPP (NASA, Washington, DC, USA) products were used as the target variable in this study. These data were explicitly treated as proxy indicators of long-term spatial and temporal patterns in ecosystem productivity rather than as independent biophysical ground-truth measurements. Consequently, the modeling framework was designed to assess the consistency, downscaling potential, and gap-filling capability of Sentinel-2–derived features with respect to MODIS-derived GPP patterns, rather than to claim improved absolute GPP accuracy or to perform independent validation against flux tower observations.
3.2. Variable Construction and Preprocessing
From Sentinel-2 data, spectral bands (B2, B3, B4, B8, B11, and B12), vegetation indices (Normalized Difference Vegetation Index and Enhanced Vegetation Index), and seasonal phenology–derived metrics were computed and used as explanatory variables. To represent intra-seasonal variability more explicitly, these variables were aggregated using representative statistics for the early, peak, and late stages of the growing season.
In addition, environmental drivers known to influence GPP were incorporated, including climatic variables such as precipitation, temperature, and soil moisture, as well as static geographic variables describing elevation and spatial location. Geographic coordinates (longitude and latitude) were included as auxiliary descriptors of broad-scale spatial gradients related to climate, topography, and unresolved environmental heterogeneity, rather than as direct ecological drivers of photosynthesis. A comprehensive description of all variable groups, their definitions, and data sources is provided in Table S2 in the Supplementary Materials.
All datasets were harmonized to a common spatial grid and temporal resolution to ensure comparability across data sources. After removing erroneous records and observations with missing values, the final dataset consisted of 10,770 observations and 57 explanatory variables. Outlier filtering based on the interquartile range (IQR) was applied conservatively to selected input variables to reduce the influence of extreme sensor-related noise, while preserving biologically meaningful interannual variability associated with droughts or unusually wet years.
3.3. ML Models, Validation Strategy, and Performance Evaluation
To capture the nonlinear and multivariate interactions that characterize grassland GPP dynamics, several ML models were evaluated and compared. Linear regression (OLS) was used as a baseline, and the main non-linear benchmarks included Random Forest, Extra Trees, k-nearest neighbors, Support Vector Regression, Elastic Net, Ridge regression, and Histogram-based Gradient Boosting.
All statistical analyses and machine learning modeling were conducted using Python (version 3.10) with the scikit-learn library (version 1.3). Data preprocessing and sample extraction were performed using Google Earth Engine (Google LLC, Mountain View, CA, USA).
Model hyperparameters were optimized on the training data, and standard regularization strategies were applied to mitigate overfitting. The optimal hyperparameter configurations for the best-performing models are reported in Table S3 in the Supplementary Materials. To mitigate overly optimistic performance estimates arising from spatial autocorrelation, model evaluation was conducted using a spatially structured validation framework based on spatial block cross-validation. This choice reflects the need to evaluate model generalization under spatial dependence and is widely regarded as more appropriate than random cross-validation for assessing performance with respect to a proxy-based evaluation target in spatially structured ecological data. In addition, spatial block cross-validation and leave-one-year-out temporal validation were explicitly combined to reduce the likelihood that static geographic variables contribute to predictive performance through spatial memorization, rather than through learned associations with environmental drivers.
The 0.5° spatial block size was selected to exceed the empirical spatial autocorrelation range of GPP residuals, following common practice in spatial cross-validation studies. Temporal generalization was evaluated using a leave-one-year-out scheme, which allowed a systematic assessment of model stability when predicting GPP dynamics for years not included in the training set. Together, the combined use of spatial and temporal validation was intended to reduce the risk of spatial leakage and inflated performance estimates that frequently occur in pixel-level ecosystem datasets.
Model performance was quantified using the coefficient of determination, RMSE, and mean absolute error. The joint use of these metrics enabled a comprehensive comparison of predictive agreement, robustness, and generalization capacity across models in reproducing MODIS-derived GPP patterns. It is explicitly acknowledged that MODIS-derived GPP represents a model-derived product subject to systematic uncertainties and potential biases, particularly in arid and sparsely vegetated regions. Such uncertainties may therefore be inherited by ML models trained on this proxy. Accordingly, the reported metrics should be interpreted as reflecting consistency with, and refinement of, the MODIS GPP proxy through downscaling and gap-filling, rather than as evidence of improved absolute GPP accuracy. Nevertheless, integrating multiple spectral, climatic, and geographic variables within a machine learning framework provides a more complete representation of the spatial and temporal dynamics embedded in proxy-based representations of grassland GPP.
4. Results
4.1. Data Characteristics and Preprocessing Outcomes
The initial dataset comprised 10,836 sample observations derived from Sentinel-2 imagery, MODIS-derived GPP data, and associated spectral and vegetation index derivatives for grassland ecosystems from 2018 to 2024. During data cleaning, observations with missing values in the target variable (GPP_SUM) or in explanatory variables were systematically removed. Records outside the study’s defined temporal scope were also excluded. Following these steps, the final dataset consisted of 10,770 observations and 57 explanatory variables.
Descriptive statistics of the GPP_SUM variable indicate a mean value of 0.335 with a standard deviation of 0.148, while the minimum and maximum values were 0.067 and 0.768, respectively. This range reflects substantial spatial and interannual variability in grassland GPP as represented by the MODIS-based proxy. Across years, approximately 1530 to 1550 observations were retained, resulting in a relatively balanced temporal structure in the dataset. Data preprocessing focused on removing physically implausible or low-quality observations, rather than indiscriminately excluding statistically extreme values. Consequently, ecologically meaningful extremes associated with drought or unusually productive years were retained to preserve genuine interannual variability characteristic of arid grassland systems.
To evaluate ML model performance, the data were split into training, validation, and test sets. This design ensured comparability of model performance with respect to the MODIS GPP proxy and generalization capacity across models. A total of seven ML models were applied to predict grassland GPP in Mongolia using an identical set of explanatory variables and the same training–validation–test partitioning scheme. Model performance on the validation and test datasets was assessed using the root mean square error (RMSE), mean absolute error, and coefficient of determination. A summary of these metrics is provided in Table 1.
Table 1.
Predictive performance of competing models with respect to the MODIS-derived GPP.
The results indicate that ensemble models based on decision-tree architectures, including Histogram-based Gradient Boosting, Extra Trees, and Random Forest, exhibited consistently stronger agreement with the MODIS-derived GPP proxy than linear and kernel-based models, such as Ridge regression, Elastic Net, and Support Vector Regression. Among the evaluated approaches, the Histogram-based Gradient Boosting model achieved the highest performance on the test dataset, with an RMSE of 0.035, a mean absolute error of 0.025, and a coefficient of determination of 0.949. On this relative basis, this model was selected as the primary framework for subsequent detailed analyses.
4.2. Prediction Accuracy and Error Analysis
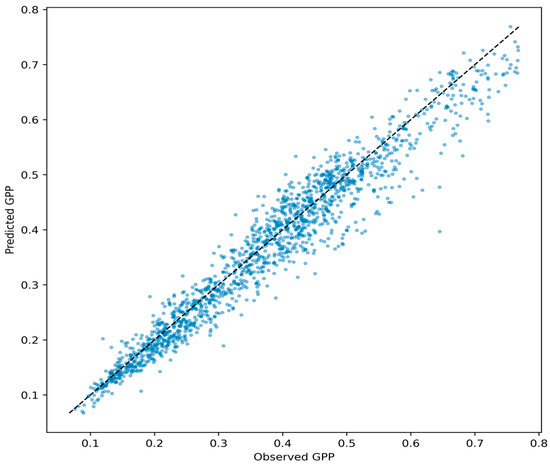
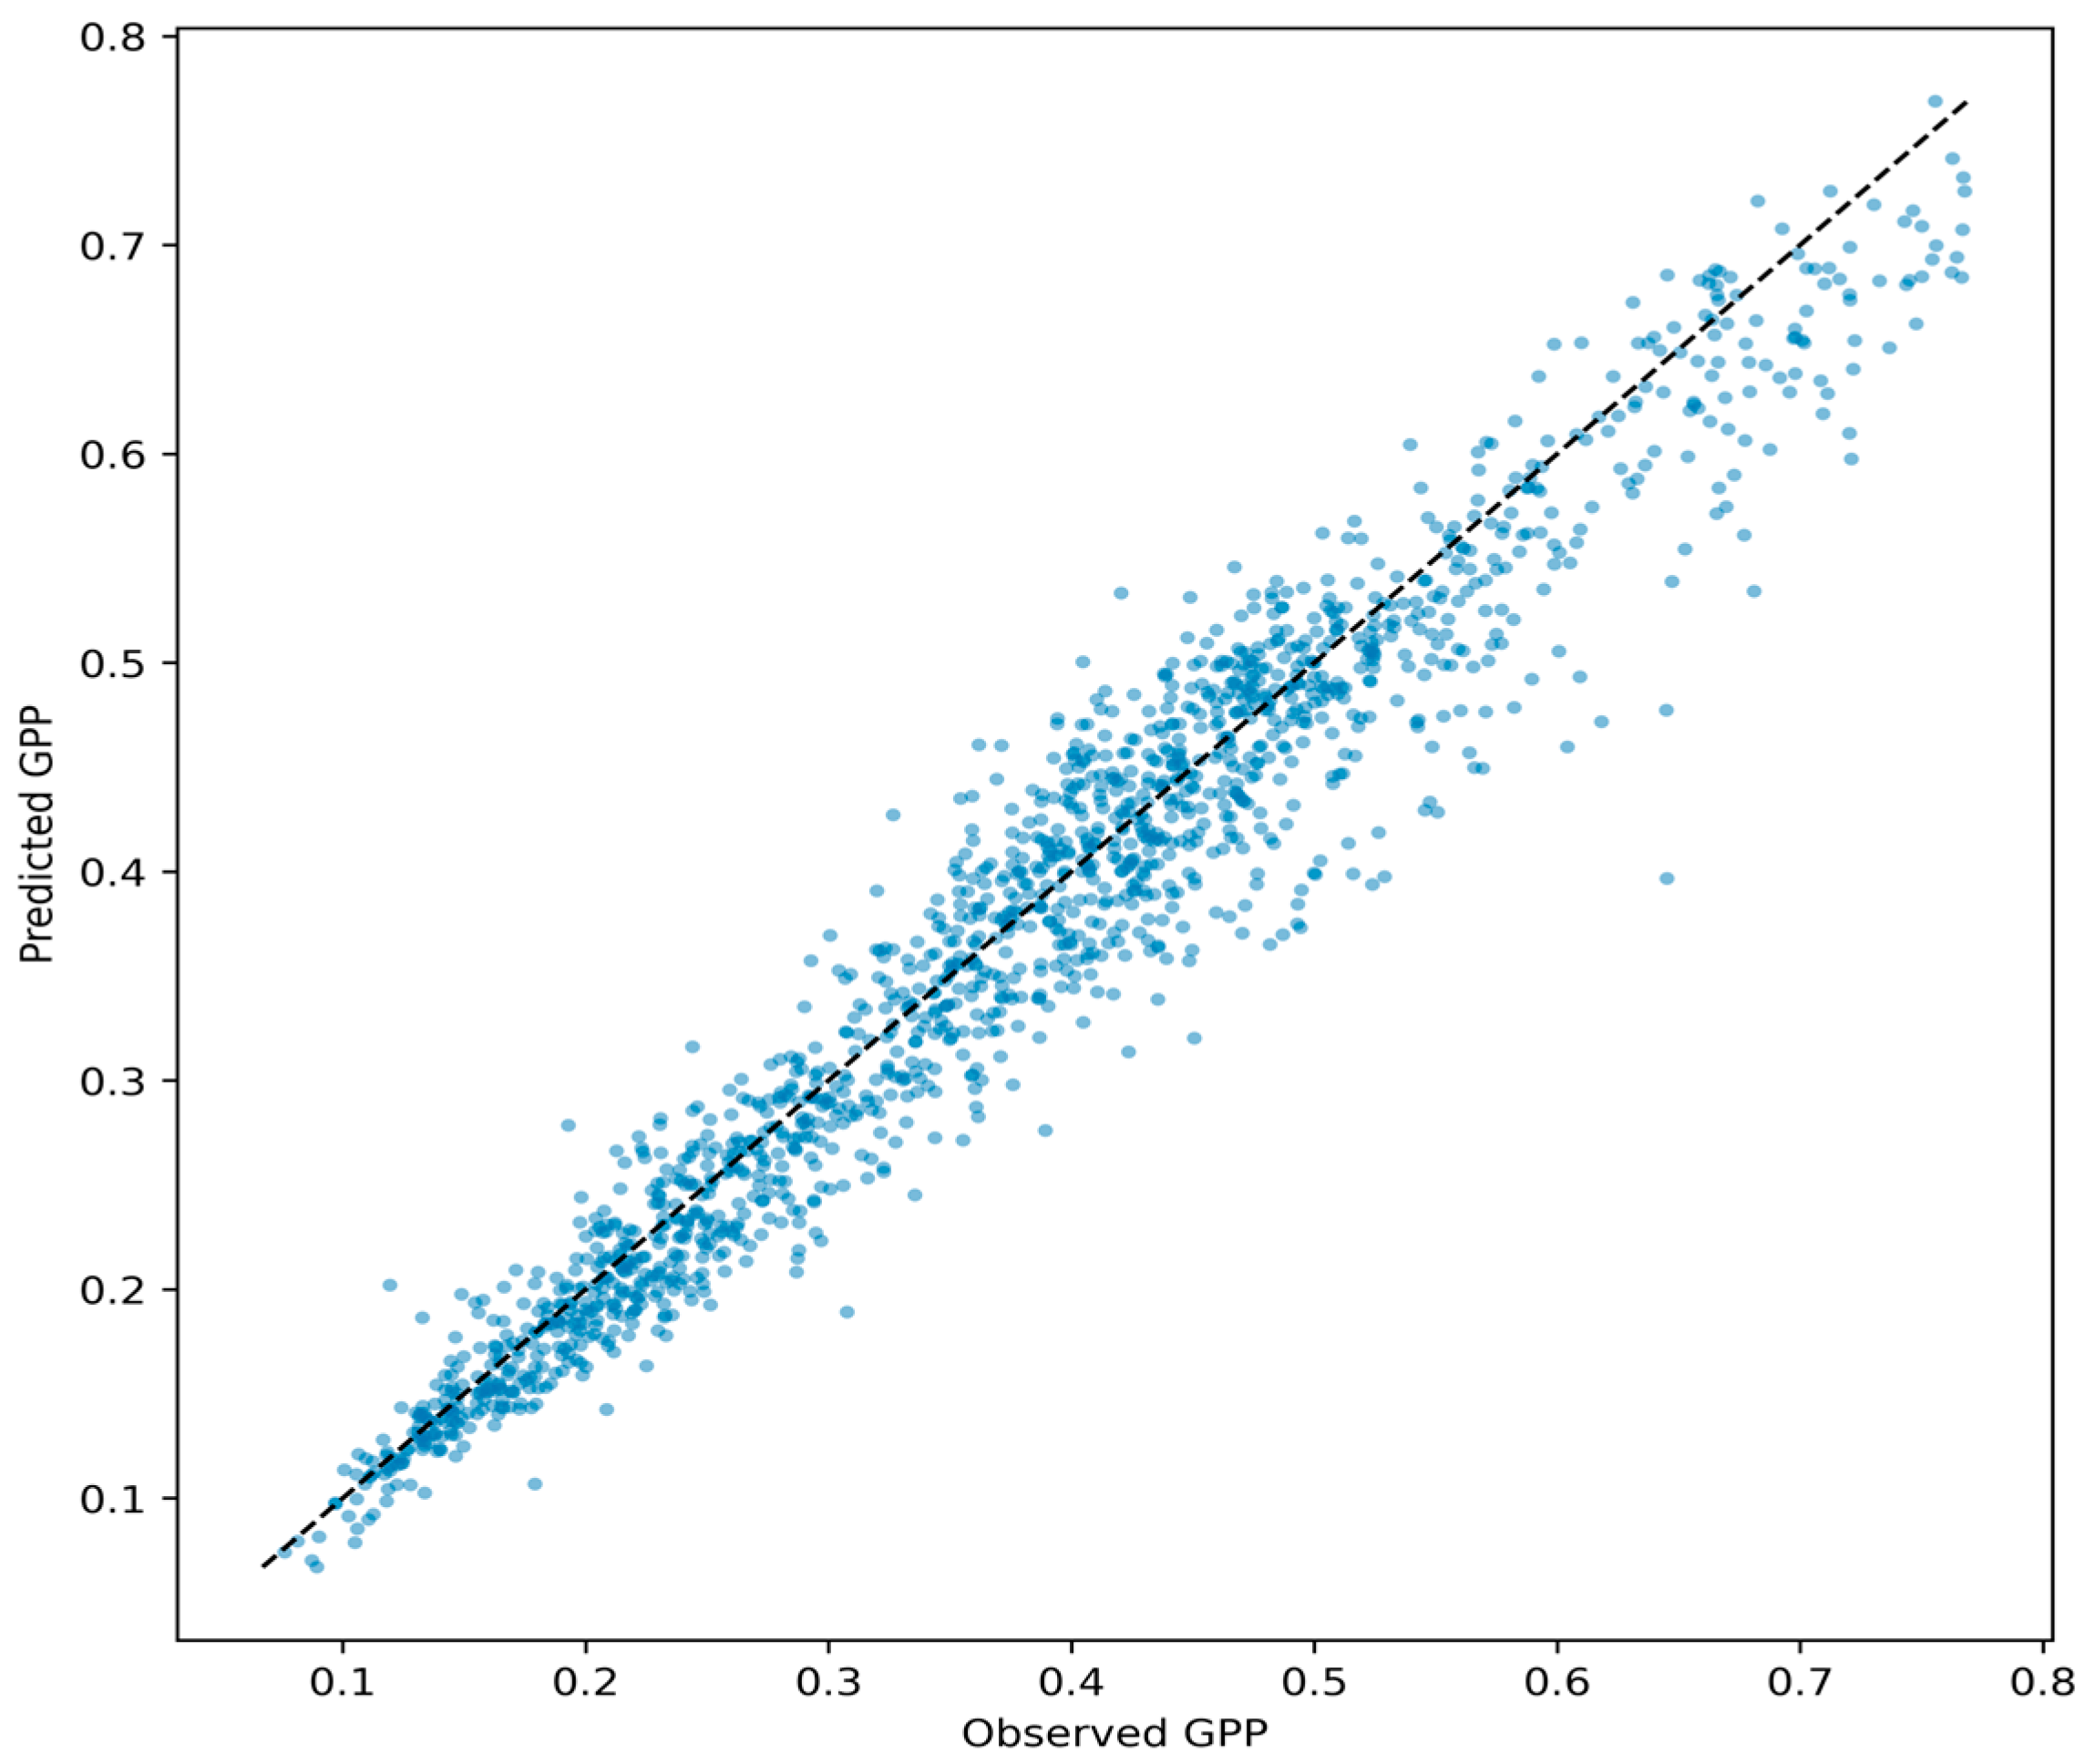
Figure 1 illustrates the relationship between observed and predicted GPP values obtained from the Histogram-based Gradient Boosting model on the test dataset. The predicted values are closely clustered around the one-to-one reference line, indicating a high level of agreement between model predictions and the MODIS-derived GPP proxy across the full range of GPP values. This pattern suggests that the HGB model reproduces the spatial and interannual variability in proxy-based GPP data rather than representing direct ecological measurements and maintains strong agreement with the MODIS reference.
Figure 1.
Observed versus predicted GPP using the HGB model (test set). Blue dots represent individual observations, and the dashed line indicates the 1:1 reference line.
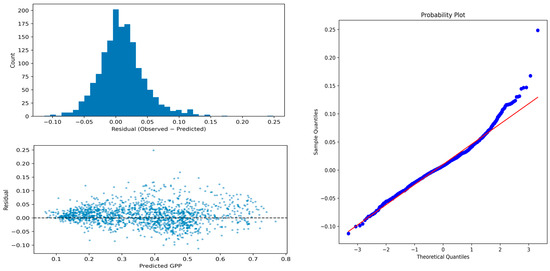
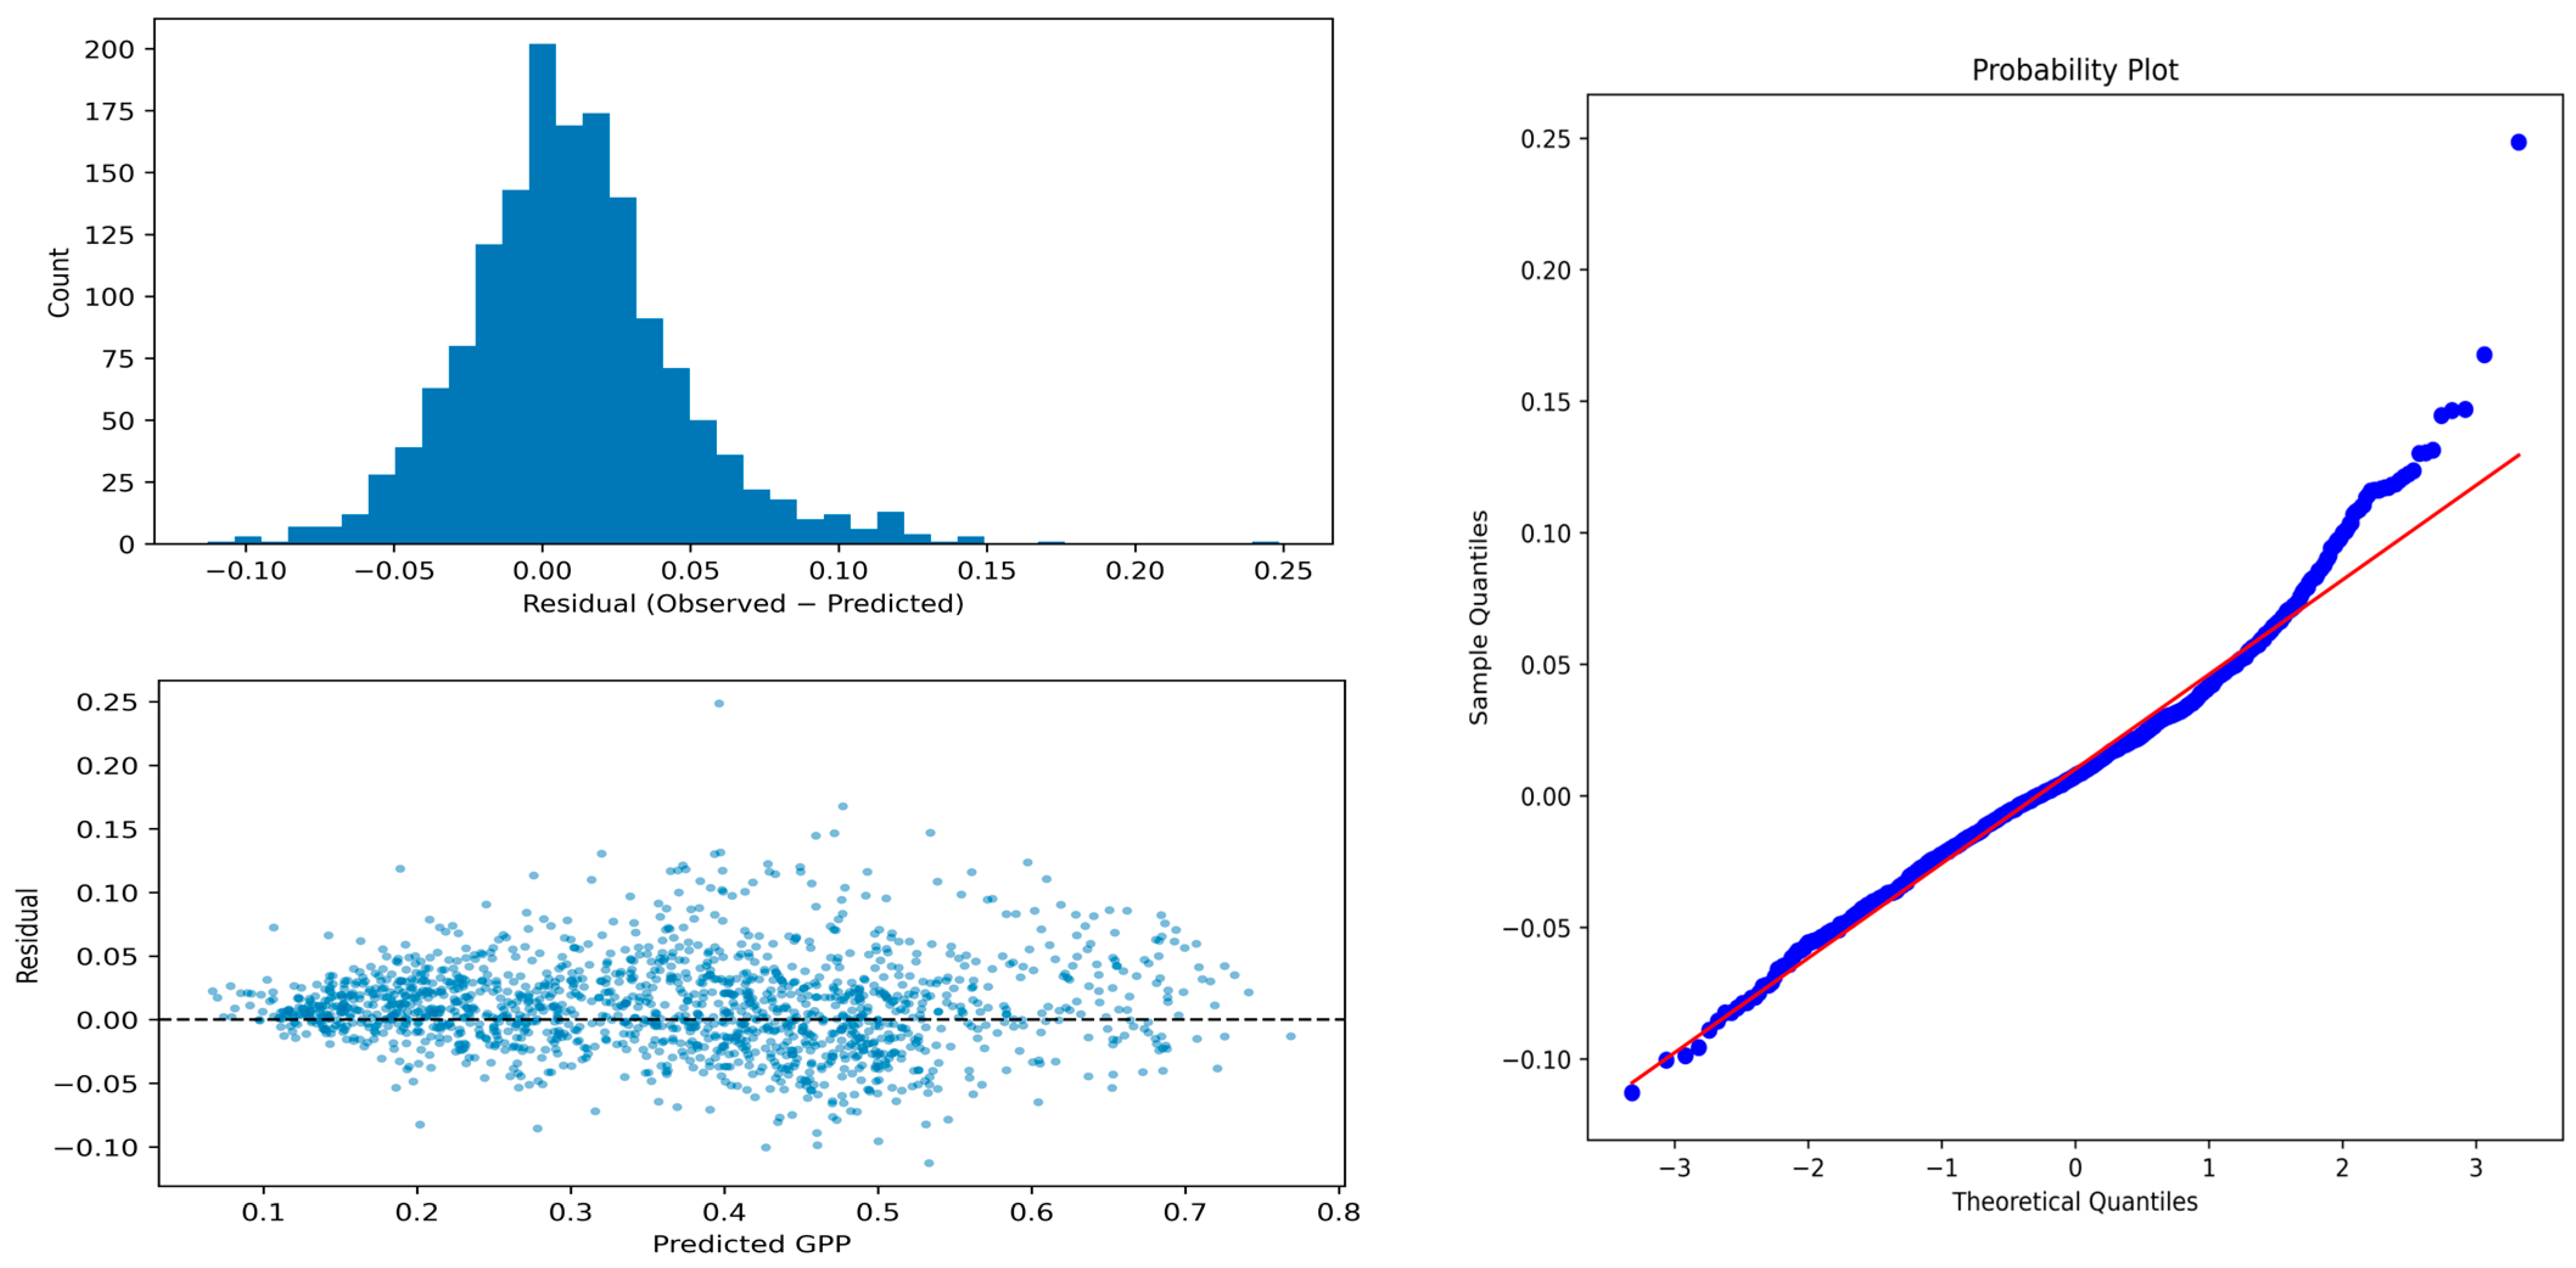
To further examine model error behavior, the residual distribution, the relationship between residuals and predicted values, and the quantile–quantile plot are jointly examined in Figure 2. The residuals are centered around zero and approximately normally distributed, suggesting limited systematic bias with respect to the MODIS GPP proxy. In the quantile–quantile plot, minor deviations in the tails are likely attributable to the presence of extreme values common in ecosystem datasets. However, these deviations do not imply a substantial departure from the overall distributional structure.
Figure 2.
Residual diagnostics of the HGB model (test set). Blue dots represent residual observations, the dashed horizontal line indicates zero residual, and the red line in the Q–Q plot represents the theoretical normal reference line.
Inspection of the residuals plotted against predicted values indicates a modest increase in error dispersion at higher GPP levels. Importantly, this pattern does not form a distinct or systematic structure and is consistent with the natural variability and spatial heterogeneity that characterize grassland ecosystems as represented in remotely sensed proxy data. Taken together, the residual diagnostics support the numerical stability and consistency of the HGB model predictions and provide additional evidence of its generalization capacity within the limits of proxy-based GPP modeling, across varying productivity conditions.
4.3. Temporal Generalization: LOYO
To assess the model’s temporal generalization capacity, a leave-one-year-out validation approach was used, in which each year was iteratively excluded from training and used for evaluation. This design provides a more realistic assessment of performance under temporal shifts by explicitly testing predictions on years not observed during training. Performance metrics for each year from 2018 to 2024, together with their means and standard deviations, are summarized in Table 2.
Table 2.
LOYO evaluation results for the HGB model (2018–2024).
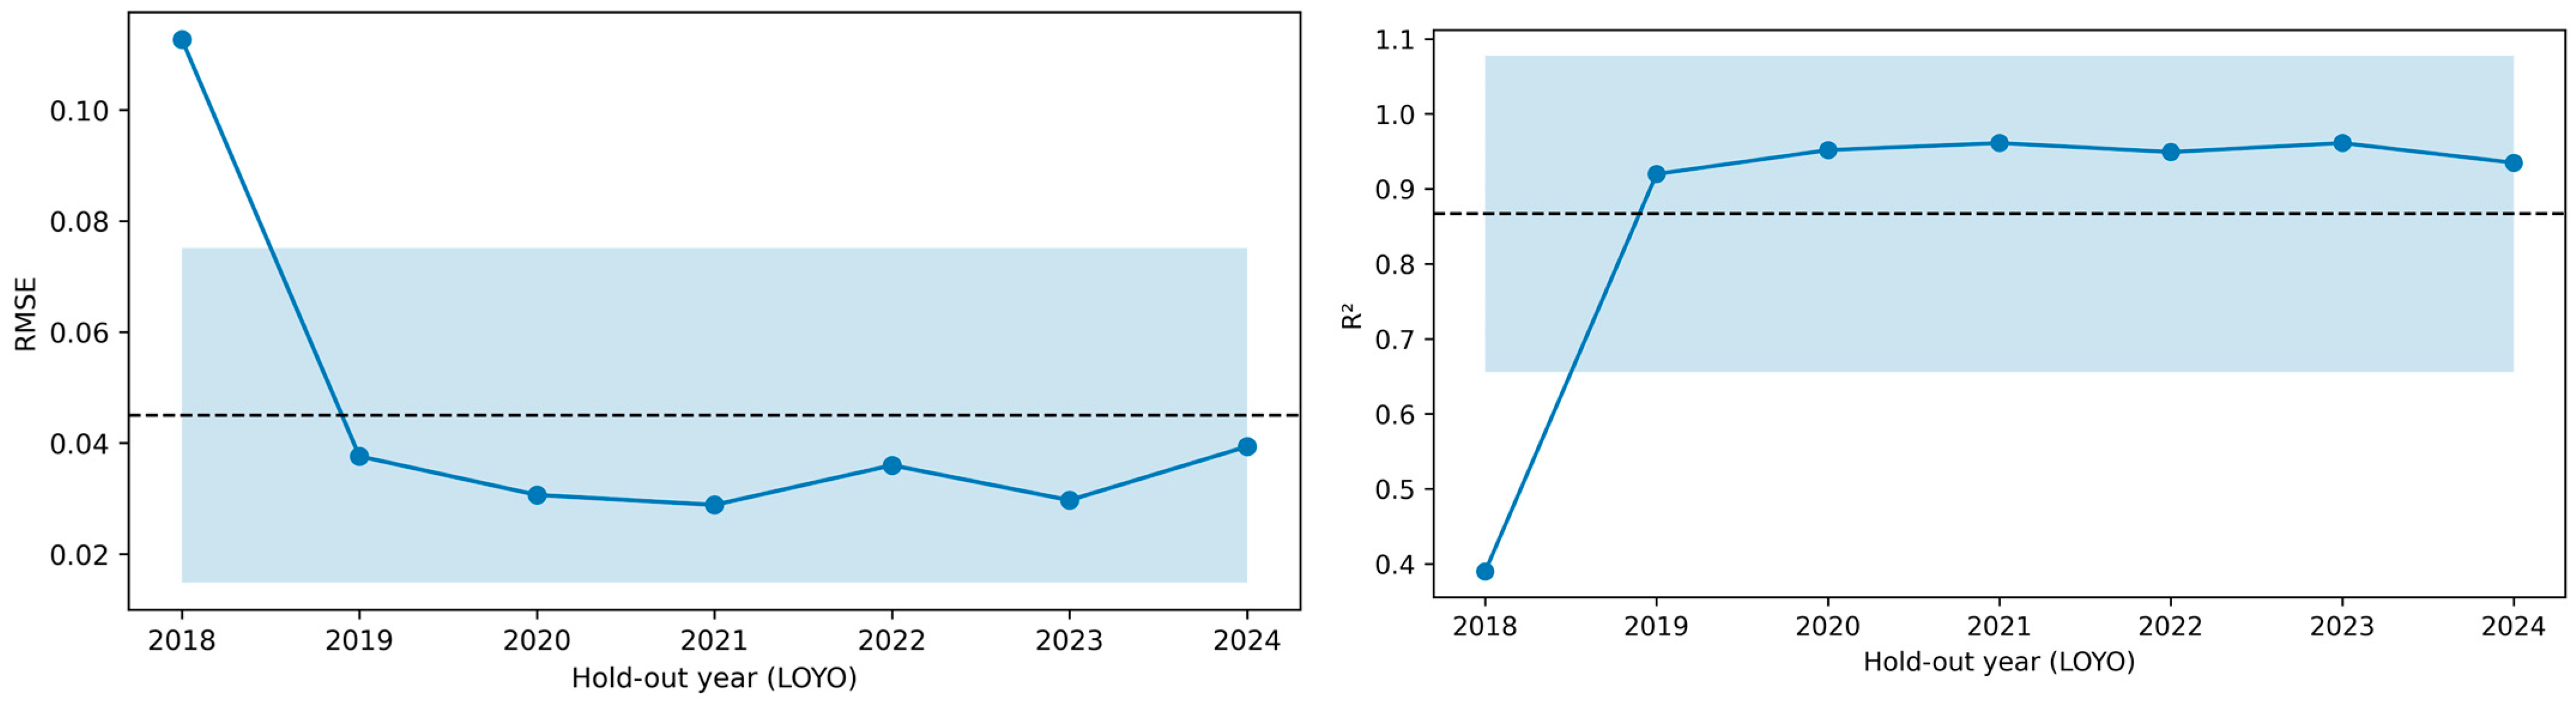
The leave-one-year-out evaluation indicates that the HGB model achieved an average performance across all years with an RMSE of 0.0450 ± 0.0301, a mean absolute error of 0.0340 ± 0.0230, and a coefficient of determination of 0.8668 ± 0.2108. From 2019 to 2024, model performance remained relatively stable, with coefficient of determination values generally ranging from approximately 0.92 to 0.96. This pattern suggests temporal consistency when the model is applied to years not included in the training set.
In contrast, performance for 2018 was substantially lower, with a coefficient of determination of approximately 0.39. This reduction is plausibly associated with higher uncertainty during the early phase of the Sentinel-2 time series, rather than with the removal or suppression of ecologically extreme events. Possible contributing factors include reduced observation density and more limited seasonal coverage. Potentially atypical climatic conditions during that year may also have contributed. Importantly, extreme low- and high-productivity years were retained in the dataset, ensuring that interannual variability under climatic stress was preserved rather than artificially smoothed by preprocessing.
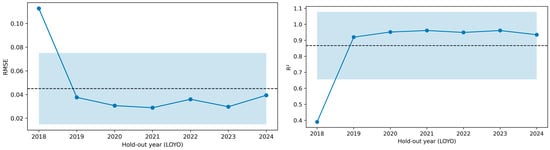
Figure 3 presents the year-by-year variation in RMSE and the coefficient of determination. Except for 2018, performance metrics remain stable across years, supporting the interpretation of generally strong temporal generalization within the proxy-based modeling framework.
Figure 3.
Year-wise RMSE and R2 from LOYO evaluation.
4.4. Feature Importance and Model Interpretability
The contribution of individual variables to model predictions was assessed using permutation importance. This approach quantifies the relative importance of a variable by measuring the change in model performance (RMSE) when the variable’s values are permuted. Owing to its model-agnostic nature, permutation importance is commonly applied to assess the interpretability of ensemble models with decision-tree architectures.
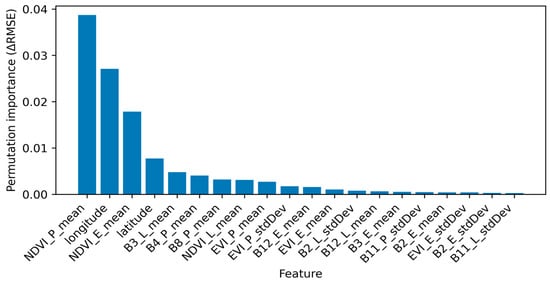
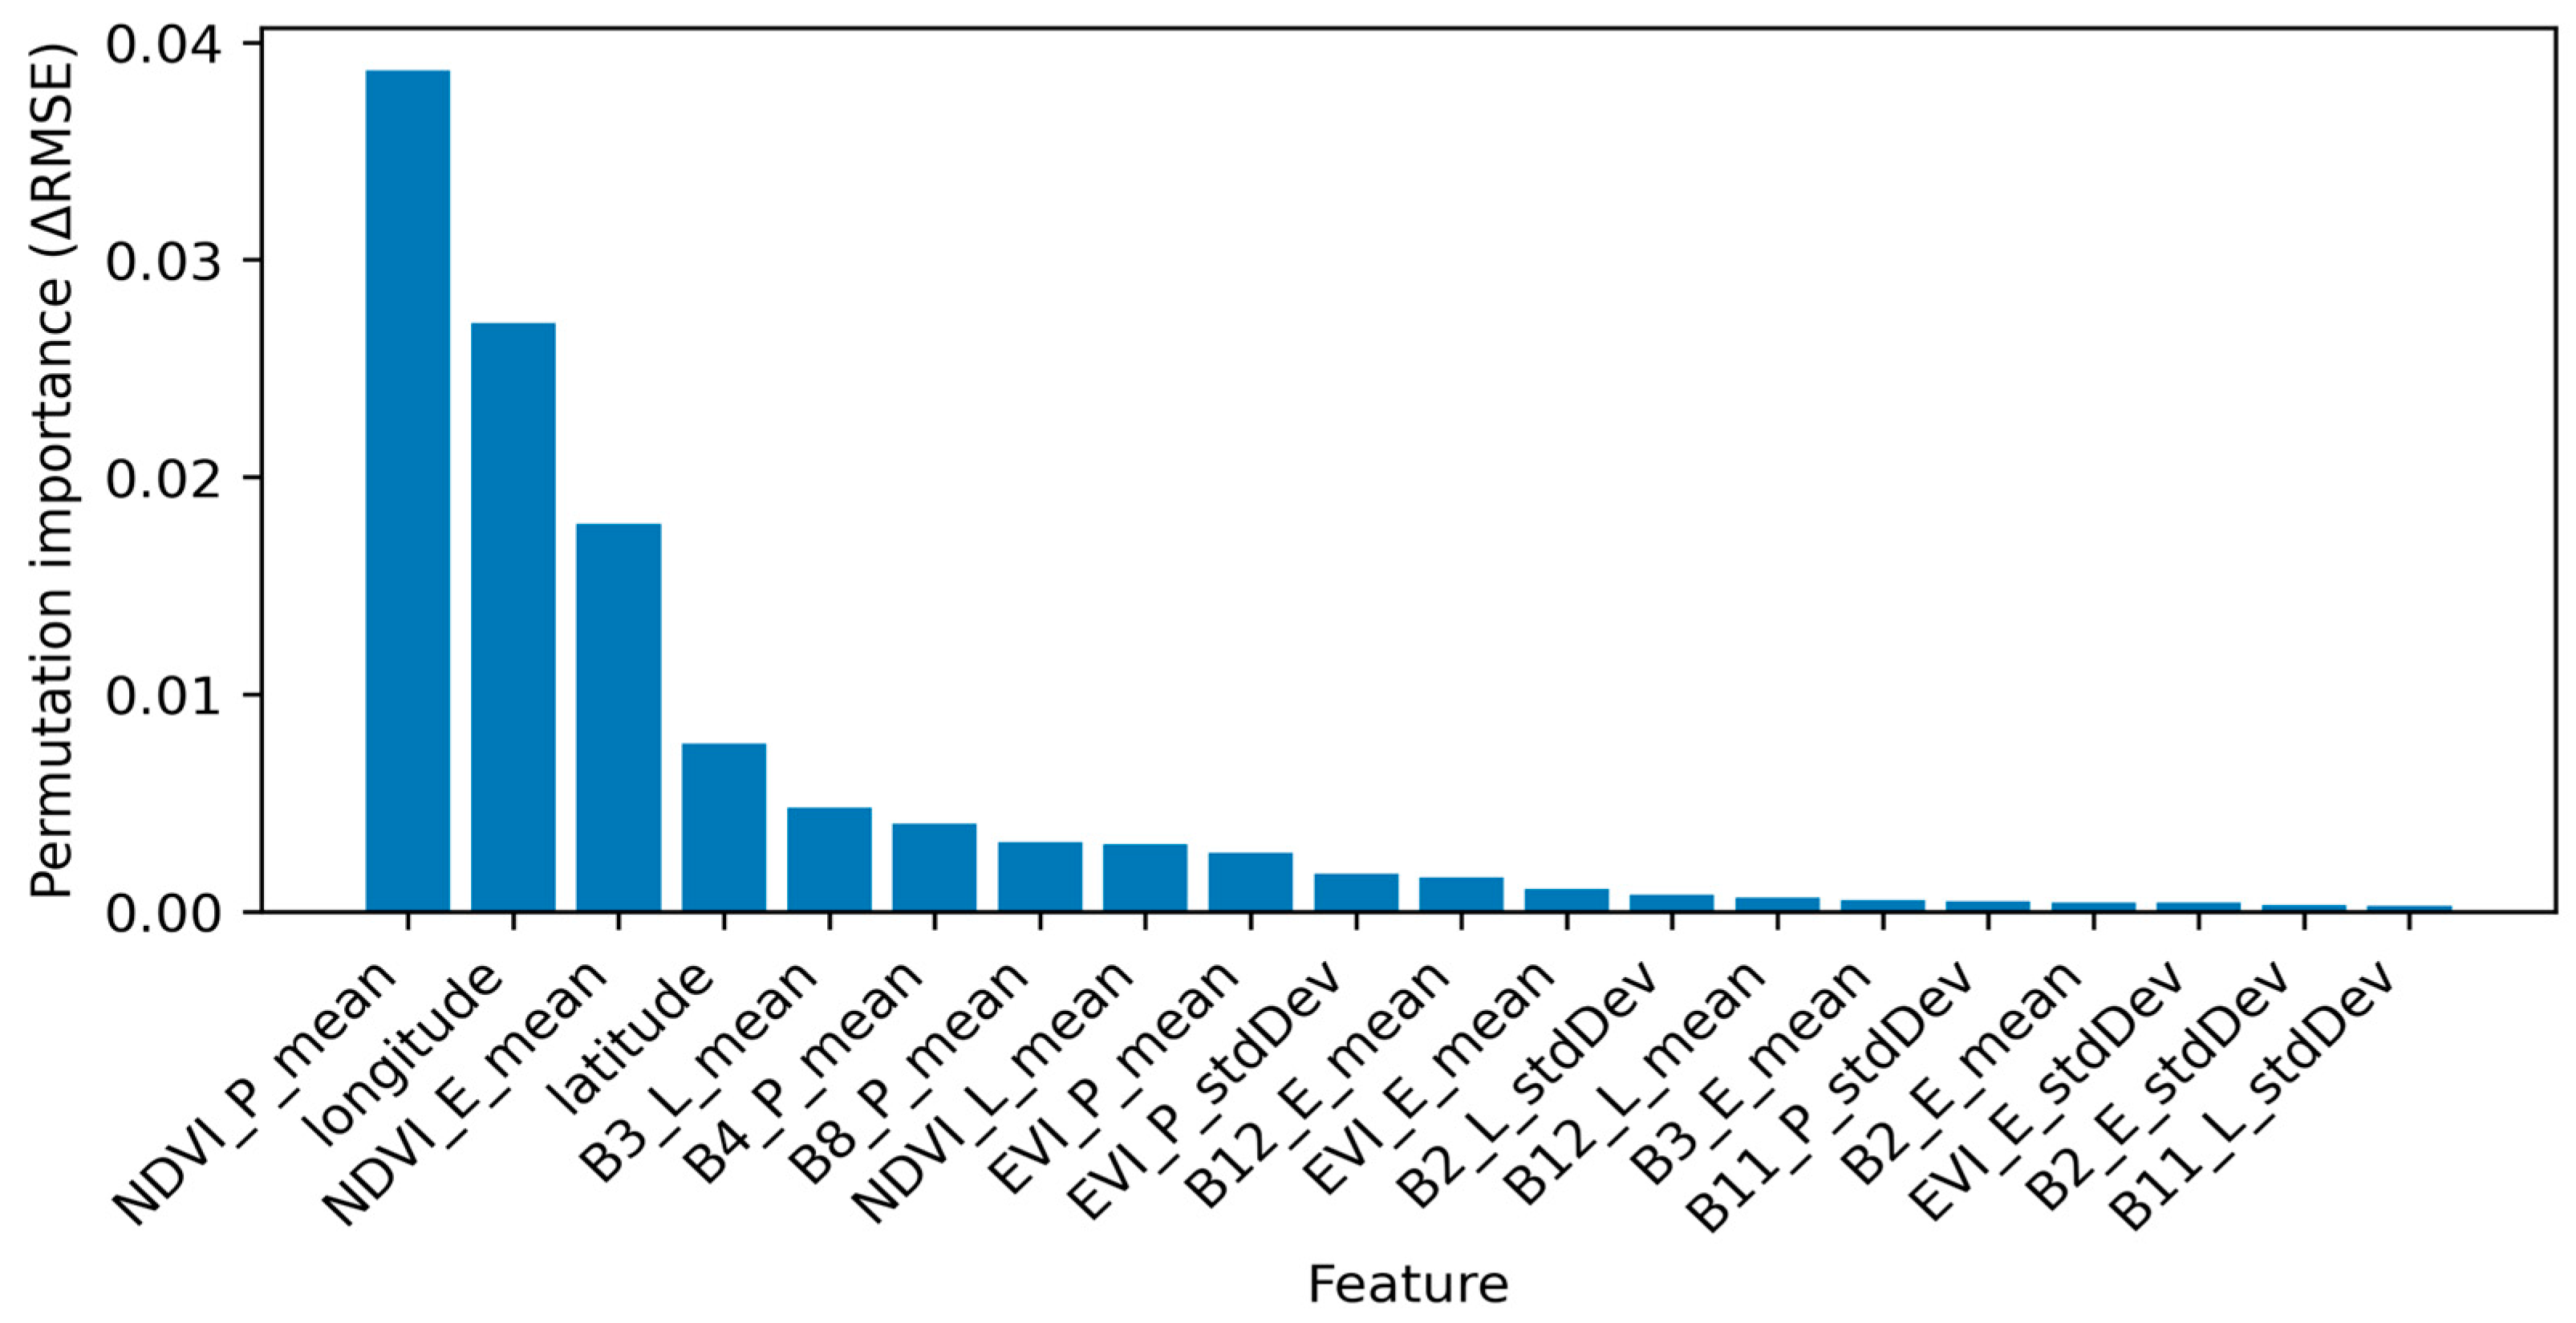
The top 20 variables, ranked by their impact on RMSE on the test dataset, are presented in Figure 4. The results show that phenology-related metrics derived from the Normalized Difference Vegetation Index, including NDVI_P_mean, NDVI_E_mean, and NDVI_L_mean, contribute most strongly to model predictions. This pattern underscores the role of seasonal vegetation dynamics in explaining proxy-based variability in grassland GPP. Variables representing geographic location, specifically longitude and latitude, also exhibit relatively high importance, indicating that large-scale spatial gradients influence modeled productivity patterns. Importantly, the high ranking of geographic coordinates does not imply pixel-level memorization. Rather, these variables serve as proxies for broad-scale climatic and biogeographic gradients that are not fully resolved by the available environmental covariates.
Figure 4.
Top-20 features ranked by permutation importance (test set).
Spectral bands from the Sentinel-2 satellite, particularly B3, B4, B8, and B12, together with seasonal statistical descriptors representing the early, peak, and late stages of the growing season, provide complementary information for characterizing spatial and seasonal variability in GPP as represented in the MODIS-based proxy data, beyond what is captured by vegetation indices alone. This observation suggests that integrating raw spectral information with phenological summaries enhances the model’s ability to resolve heterogeneity in grassland productivity within a correlational, data-driven framework. The mean values and associated standard deviations of the importance scores for the top twenty variables are reported in Table 3.
Table 3.
Top-20 features ranked by permutation importance.
Permutation importance analysis consistently identifies NDVI-based metrics as the most influential variables for explaining grassland GPP as captured by the proxy target variable. Variables describing geographic location capture regional ecosystem contrasts and contribute to the model’s capacity for spatial generalization. The persistence of strong model performance across spatial blocks in cross-validation supports the interpretation that the contribution of geographic variables reflects transferable regional structure rather than reliance on static location identifiers. In contrast, spectral bands and seasonal indices complement vegetation indices by providing additional information related to ecosystem structure, moisture conditions, and seasonal variability.
Overall, ML models that integrate multiple data sources offer a richer representation of the spatial and temporal variability of GPP than the MODIS-based reference alone. It should be emphasized, however, that permutation importance reflects associations learned by the model and does not imply causal relationships. Geographic coordinates are therefore not interpreted mechanistically or causally; rather, they are treated as proxies for large-scale climatic and biogeographic gradients that are not fully captured by the available environmental variables.
4.5. Spatial Distribution of Predicted GPP
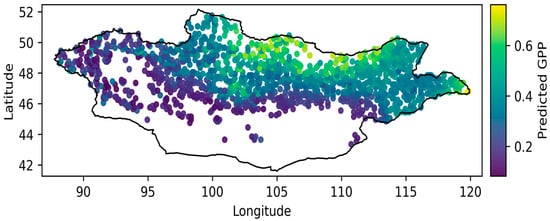
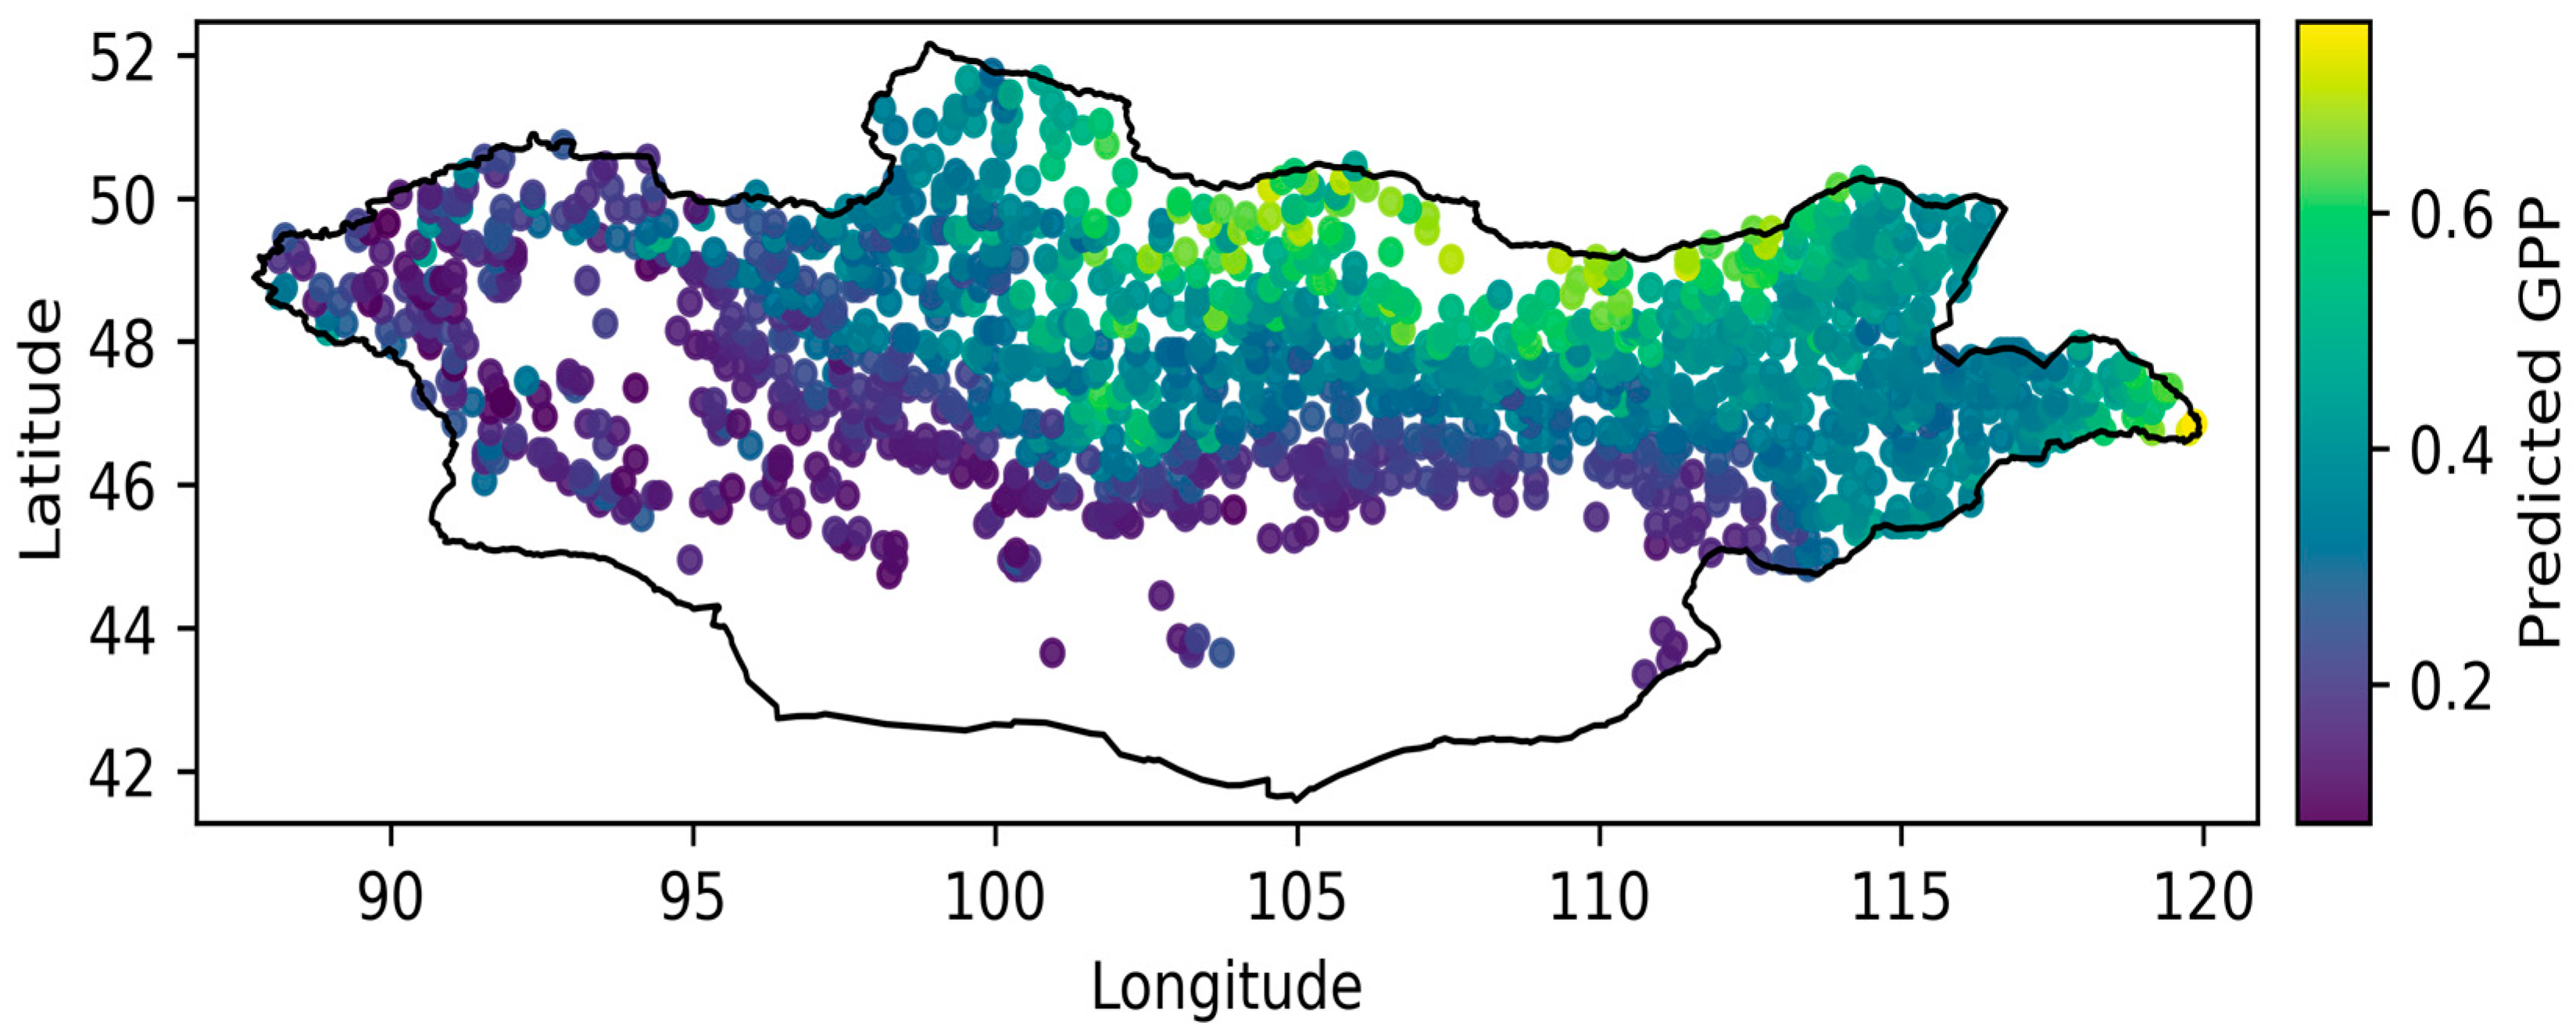
Figure 5 presents the spatial distribution of grassland GPP estimated using the Histogram-based Gradient Boosting model. The predicted GPP values exhibit pronounced regional differentiation, with discernible spatial patterns across the study area. In general, relatively higher GPP values are observed in northern and central regions, whereas lower values tend to occur in southern and more arid areas. These contrasts are broadly consistent with ecosystem gradients related to precipitation regimes, temperature conditions, and zonal patterns in vegetation structure as represented in the proxy-based input data.
Figure 5.
Spatial distribution of modeled (proxy-based) GPP estimated using the HGB model.
It is important to note, however, that the map represents a spatial depiction derived from model predictions trained against the MODIS-derived GPP proxy, rather than direct measurements. Accordingly, the observed patterns should be interpreted as indicative of relative spatial variability in grassland GPP, not as validation of absolute productivity levels.
The spatial patterns shown in Figure 5 are consistent with the model performance metrics reported in Section 4.1, Section 4.2 and Section 4.3 and with the feature importance results presented in Section 4.4. In particular, the high importance assigned to vegetation indices and geographic location variables supports the interpretation that these factors explain spatial contrasts learned by the model, rather than implying direct ecological causation. Taken together, the spatial distribution of predicted GPP reflects both the model’s generalization capacity and its ecological plausibility within a proxy-based, data-driven framework.
4.6. Model Calibration and Uncertainty Assessment
To evaluate the reliability and statistical robustness of the HGB model predictions, calibration analysis and performance uncertainty assessment were conducted. Calibration was assessed by comparing observed and predicted GPP values with respect to the MODIS-derived GPP proxy using a decile-based aggregation approach. This approach is commonly employed to examine whether systematic bias is present in model predictions across different levels of the response variable.
4.6.1. Decile-Based Calibration Analysis
Based on the empirical distribution of the GPP_SUM variable in the test dataset, ten equal-frequency decile bins were constructed. For each decile, mean values of observed and predicted GPP were calculated to assess calibration performance relative to the proxy target variable. The results of this analysis are summarized in Table 4.
Table 4.
(a). Decile-based calibration summary for observed and predicted GPP (test set). (b). Uncertainty estimation with 95% confidence intervals (test set).
Across all deciles, the mean predicted GPP values closely correspond to the observed means, suggesting that model calibration remains stable across the full range of GPP values represented by the MODIS-based proxy. A slight tendency toward overestimation is observed in the lowest GPP deciles, while minor underestimation appears in the highest decile. These differences, however, do not exhibit a consistent directional pattern and are not indicative of systematic bias. Overall, these results indicate that the HGB model demonstrates reasonable calibration with respect to the proxy-based GPP target across a broad range of grassland productivity conditions, within the limits of proxy-based evaluation rather than direct biophysical validation.
4.6.2. Performance Uncertainty Assessment (95% CIs)
To evaluate the statistical robustness of model performance, bootstrap-based ninety-five percent confidence intervals were estimated for RMSE, MAE, and the coefficient of determination. This procedure provides an empirical indication of the sensitivity of performance metrics to sampling variability within the test dataset.
The estimated 95% confidence intervals reported in Table 4 are relatively narrow, suggesting that the HGB model’s performance metrics are not strongly affected by random sampling variability. Within this evaluation framework, the results indicate that model performance remains consistent when assessed against the MODIS-derived GPP proxy under conditions of limited uncertainty, rather than implying validation of absolute ecological productivity levels.
4.7. Spatial Generalization and Assessment of Spatial Leakage
Pixel-level datasets derived from remote sensing observations tend to exhibit strong spatial autocorrelation. As a consequence, random train–test partitioning can yield overly optimistic estimates of model performance that may not fully reflect true spatial generalization capacity. To obtain a more realistic assessment of the HGB model’s spatial generalization, two validation schemes were compared: random cross-validation and spatially structured cross-validation.
For random cross-validation, a five-fold K-fold strategy was applied. For spatial cross-validation, a Group K-fold scheme based on 0.5-degree spatial blocks was used, also with five folds. In both evaluation settings, the same set of explanatory variables and identical model configurations were employed, ensuring that differences in performance can be attributed to the validation strategy rather than to model specification.
As shown in Table 5, model performance under the spatial cross-validation scheme is slightly reduced compared to that obtained using random cross-validation. This reduction reflects a more conservative evaluation that explicitly accounts for spatial autocorrelation in the data. Accordingly, the results from random cross-validation are likely to partially benefit from information overlap among spatially proximate observations, suggesting limited spatial leakage.
Table 5.
Comparison of random and spatial cross-validation schemes (mean ± std).
Despite this stricter evaluation setting, model performance under spatial cross-validation remains relatively strong, with an R2 of approximately 0.86. The persistence of comparable performance across spatial blocks supports the interpretation that the contribution of geographic variables reflects transferable regional structure rather than dependence on static location identifiers. Overall, these results indicate that the model demonstrates acceptable spatial generalization within the proxy-based modeling framework and that the influence of spatial leakage on the reported performance is present but constrained.
5. Discussion
5.1. ML Performance and Model Adequacy
The results of this study suggest that tree-based ML models integrating Sentinel-2 observations, MODIS-derived GPP proxy data, and climatic and geographic covariates can achieve strong agreement with MODIS-based proxy representations of spatiotemporal patterns in grassland productivity in dryland ecosystems. Among the evaluated approaches, the HGB model consistently exhibited the highest performance across evaluation metrics, supporting its use for modeling relative GPP variability within a proxy-based representation framework.
Across all performance metrics, tree-based ensemble models systematically outperformed linear and kernel-based methods. This performance advantage is plausibly associated with their capacity to flexibly represent nonlinear relationships, threshold effects, and complex interactions among explanatory variables. Such characteristics are typical of grassland ecosystem processes and are often inadequately captured by parsimonious parametric models.
Residual diagnostics and error behavior analyses did not reveal evidence of pronounced systematic bias in model predictions. Within a proxy-based evaluation context, this finding supports the interpretation that the reported performance metrics reflect statistical agreement with the MODIS-derived GPP proxy rather than artefacts of model overfitting. Because the target variable represents a modeled proxy rather than direct measurements of carbon fluxes, the results should be interpreted as indicating model adequacy for spatial and temporal comparison within the MODIS-based framework, rather than as evidence of improved absolute GPP estimation or validation against independent biophysical measurements.
5.2. Temporal Generalization and Interannual Variability
The LOYO validation results provide a comparatively stringent assessment of the model’s temporal generalization capacity. For most years, model performance remained high, indicating that the learned relationships are temporally transferable within the observational domain defined by the MODIS GPP proxy and the Sentinel-2 feature space.
The weaker performance observed for 2018 is plausibly associated with data-related constraints rather than intrinsic model limitations. In particular, the early phase of the Sentinel-2 time series is characterized by lower observation density, uneven seasonal coverage, and reduced data completeness. Such characteristics are common in remote-sensing-based proxy datasets and are expected to influence model performance during initial observation periods. As no formal statistical test was conducted to evaluate the significance of this deviation, the 2018 results should be interpreted cautiously.
Taken together, these findings suggest that, even when MODIS-derived GPP is used as a proxy target variable, ML models can consistently represent relative interannual variability in grassland productivity. This supports their application in long-term monitoring and comparative analysis contexts, rather than in tasks requiring precise, absolute year-specific prediction.
5.3. Spatial Generalization, Spatial Leakage, and Evaluation Realism
Previous studies have shown that applying random cross-validation to datasets characterized by strong spatial autocorrelation can yield overly optimistic estimates of model performance. The comparison between random and spatial block-based cross-validation schemes in this study provides empirical support for this concern. The slight reduction in performance observed under spatial cross-validation reflects a more conservative evaluation after explicitly controlling for spatial information overlap. Notably, model performance remained relatively high even under the spatial block-based validation scheme.
Despite this stricter evaluation, model performance remained comparatively strong, suggesting that the HGB model learns transferable spatial associations embedded in MODIS-based proxy patterns rather than relying solely on local spatial proximity. This pattern indicates that spatial leakage, while present, is unlikely to dominate the reported results. Importantly, the spatial validation outcomes support the application of tree-based ensemble models for regional-scale grassland studies when the objective is to reproduce spatial structure in proxy-based productivity representations and when evaluation strategies explicitly account for spatial dependence.
5.4. Feature Importance, Eco-Biophysical Interpretation, and Limitations
Permutation importance analysis suggests that vegetation phenology metrics, geographic location, and Sentinel-2 spectral bands play a central role in the model’s representation of MODIS-based proxy variability in grassland GPP. The high importance assigned to NDVI-based indicators from the early and peak growing seasons is consistent with established eco-biophysical understanding, whereby seasonal precipitation patterns and soil moisture dynamics exert dominant controls on productivity in dryland grasslands. In addition, the contributions of individual spectral bands and seasonally aggregated statistics indicate that these features provide complementary information beyond vegetation indices alone, supporting the model’s ability to differentiate spatial and seasonal patterns reflected in the proxy data.
Recent studies have shown that discrepancies among NDVI products arising from sensor differences can be addressed through cross-product consistency analysis and fusion approaches, which support the interpretation of NDVI-based indicators as proxy representations of long-term vegetation dynamics rather than direct measurements [26].
Although geographic coordinates (longitude and latitude) appear among the top-ranked predictors, their contribution should be interpreted with caution and does not imply spatial memorization or causal control. Instead, these variables function as proxies for large-scale climatic and biogeographic gradients that are incompletely captured by the available environmental covariates. Consistent model performance under spatial block cross-validation further supports the interpretation that the model learns transferable regional structure rather than relying on static pixel-level location identifiers. Moreover, the IQR-based data filtering was applied conservatively, removing only non-physical or clearly erroneous values and retaining climatically meaningful extremes, as reflected by preserved interannual variability and stable performance during temporal validation.
Nevertheless, this study is subject to an important limitation arising from the use of MODIS-derived GPP as the target variable. Because this product is a model-derived proxy subject to systematic uncertainties and potential biases in arid and sparsely vegetated regions, these uncertainties may propagate into ML models trained on it. Accordingly, the results cannot be interpreted as validating absolute GPP magnitudes. Instead, the findings characterize relative spatial patterns and interannual dynamics within the MODIS GPP proxy framework. Future integration of solar-induced chlorophyll fluorescence products and eddy covariance flux-tower observations, where available, would be required to assess absolute GPP accuracy and to quantify potential bias propagation.
6. Conclusions
This study suggests that a machine learning framework integrating Sentinel-2 observations, MODIS-derived GPP proxy data, and climatic–geographic covariates can represent spatiotemporal patterns of grassland productivity in dry and semi-arid ecosystems. Among the evaluated approaches, tree-based ensemble models, especially the Histogram-based Gradient Boosting model, showed the strongest agreement with the MODIS-derived GPP proxy.
By combining random, spatially structured, and leave-one-year-out validation schemes, the analysis provides a more realistic evaluation of model generalization under spatial and temporal constraints. The relatively stable performance under spatial block cross-validation suggests that spatial leakage is limited, while temporal validation indicates robust representation of relative interannual variability within a proxy-based GPP framework.
The feature importance results highlight the dominant contributions of vegetation phenology metrics, along with geographic gradients and Sentinel-2 spectral information, in explaining the spatial and seasonal variability captured by the MODIS GPP proxy. These patterns are consistent with established eco-biophysical understanding of dryland grassland systems and remain within the interpretive limits of proxy-based analysis.
An important limitation of this study is that MODIS-derived GPP is a model-based proxy rather than a direct observation of carbon fluxes. Accordingly, the findings should not be interpreted as validation of absolute GPP magnitudes, but as evidence of relative spatial patterns and interannual dynamics within the uncertainty bounds of the proxy product. Future integration of solar-induced chlorophyll fluorescence and ground-based flux observations would be necessary to assess the accuracy of absolute GPP estimates and potential bias propagation.
Taken together, the results support the application of multi-source remote sensing and machine learning approaches as a proxy-aware, transferable framework for monitoring grassland productivity in dryland regions, provided that spatially and temporally appropriate validation strategies are employed.
Supplementary Materials
The following supporting information can be downloaded at: https://www.mdpi.com/article/10.3390/su18041944/s1. Table S1: Summary of sample screening and data cleaning procedures; Table S2: Feature groups and descriptions; Table S3: Hyperparameter settings of the machine learning models; Table S4: Coordinate ablation analysis assessing the sensitivity of the HGB model to geographic coordinates; Figure S1: SHAP summary plot for the HGB model; Figure S2: Mean absolute SHAP feature importance.
Funding
This research received no external funding. The article processing charge (APC) was covered by the author.
Institutional Review Board Statement
Not applicable.
Informed Consent Statement
Not applicable.
Data Availability Statement
Publicly available satellite data were used in this study. Sentinel-2 imagery and MODIS Gross Primary Productivity products are available through the Google Earth Engine platform. The derived datasets and model outputs generated in the current study are available from the author upon reasonable request.
Conflicts of Interest
The author declares no conflicts of interest.
Abbreviations
| Abbreviation | Full Term |
| GPP | Gross Primary Productivity |
| ML | Machine Learning |
| HGB | Histogram-based Gradient Boosting |
| RF | Random Forest |
| GB | Gradient Boosting |
| SVR | Support Vector Regression |
| NDVI | Normalized Difference Vegetation Index |
| EVI | Enhanced Vegetation Index |
| SIF | Solar-Induced Chlorophyll Fluorescence |
| EO | Earth Observation |
| RS | Remote Sensing |
| CV | Cross-Validation |
| LOYO | Leave-One-Year-Out |
| RMSE | Root Mean Square Error |
| MAE | Mean Absolute Error |
| R2 | Coefficient of Determination |
| MODIS | Moderate-Resolution Imaging Spectroradiometer |
| MSI | MultiSpectral Instrument |
| IAV | Interannual Variability |
References
- Yao, J.; Liu, H.; Huang, J.; Gao, Z.; Wang, G.; Li, D.; Yu, H.; Chen, X. Accelerated dryland expansion regulates future variability in dryland gross primary production. Nat. Commun. 2020, 11, 1225. [Google Scholar] [CrossRef] [Scilit]
- Sitch, S.A.; Friedlingstein, P.; Gruber, N.; Jones, S.; Murray-Tortarolo, G.N.; Ahlström, A.; Doney, S.C.; Graven, H.D.; Heinze, C.; Huntingford, C.; et al. Recent trends and drivers of regional sources and sinks of carbon dioxide. Biogeosciences 2015, 12, 653–679. [Google Scholar] [CrossRef] [Scilit]
- Beer, C.; Reichstein, M.; Tomelleri, E.; Ciais, P.; Jung, M.; Carvalhais, N.; Rödenbeck, C.; Arain, M.A.; Baldocchi, D.; Bonan, G.B.; et al. Terrestrial gross carbon dioxide uptake: Global distribution and covariation with climate. Science 2010, 329, 834–838. [Google Scholar] [CrossRef] [Scilit] [PubMed]
- Lomax, G.A.; Powell, T.W.R.; Lenton, T.M.; Economou, T.; Cunliffe, A.M. Untangling the environmental drivers of gross primary productivity in African rangelands. Commun. Earth Environ. 2024, 5, 164. [Google Scholar] [CrossRef] [Scilit]
- Prentice, I.C.; Balzarolo, M.; Bloomfield, K.J.; Chen, J.M.; Dechant, B.; Ghent, D.; Janssens, I.A.; Luo, X.; Morfopoulos, C.; Ryu, Y.; et al. Principles for satellite monitoring of vegetation carbon uptake. Nat. Rev. Earth Environ. 2024, 5, 818–832. [Google Scholar] [CrossRef] [Scilit]
- Qiu, R.; Han, G.; Ma, X.; Xu, H.; Shi, T.; Zhang, M. A comparison of OCO-2 SIF, MODIS GPP, and GOSIF data from gross primary production (GPP) estimation and seasonal cycles in North America. Remote Sens. 2020, 12, 258. [Google Scholar] [CrossRef] [Scilit]
- Dong, J.; Li, L.; Li, Y.; Yu, Q. Inter-comparisons of mean, trend and interannual variability of global terrestrial gross primary production retrieved from remote sensing approach. Sci. Total Environ. 2022, 822, 153343. [Google Scholar] [CrossRef] [Scilit]
- Bangira, T.; Mutanga, O.; Sibanda, M.; Dube, T.; Mabhaudhi, T. Remote sensing grassland productivity attributes: A systematic review. Remote Sens. 2023, 15, 2043. [Google Scholar] [CrossRef] [Scilit]
- Wang, H.; Shao, W.; Hu, Y.; Cao, W.; Zhang, Y. Assessment of six machine learning methods for predicting gross primary productivity in grassland. Remote Sens. 2023, 15, 3475. [Google Scholar] [CrossRef] [Scilit]
- Sun, Y.; Frankenberg, C.; Wood, J.D.; Schimel, D.S.; Jung, M.; Guanter, L.; Drewry, D.T.; Verma, M.; Porcar-Castell, A.; Griffis, T.J.; et al. OCO-2 advances photosynthesis observation from space via solar-induced chlorophyll fluorescence. Science 2017, 358, eaam5747. [Google Scholar] [CrossRef] [Scilit]
- Zhao, M.; Heinsch, F.A.; Nemani, R.R.; Running, S.W. Improvements of the MODIS terrestrial gross and net primary production global data set. Remote Sens. Environ. 2005, 95, 164–176. [Google Scholar] [CrossRef] [Scilit]
- Turner, D.P.; Ritts, W.D.; Cohen, W.B.; Gower, S.T.; Running, S.W.; Zhao, M.; Costa, M.H.; Kirschbaum, A.A.; Ham, J.M.; Saleska, S.R.; et al. Evaluation of MODIS NPP and GPP products across multiple biomes. Remote Sens. Environ. 2006, 102, 282–292. [Google Scholar] [CrossRef] [Scilit]
- Zhang, Y.; Xiao, X.; Wu, X.; Zhou, S.; Zhang, G.; Qin, Y.; Dong, J. A global moderate resolution dataset of gross primary production of vegetation for 2000–2016. Sci. Data 2017, 4, 170165. [Google Scholar] [CrossRef] [Scilit]
- Lu, Q.; Liu, H.; Wei, L.; Zhong, Y.; Zhou, Z. Global prediction of gross primary productivity under future climate change. Sci. Total Environ. 2024, 912, 169239. [Google Scholar] [CrossRef] [Scilit]
- Guanter, L.; Zhang, Y.; Jung, M.; Joiner, J.; Voigt, M.; Berry, J.A.; Frankenberg, C.; Huete, A.R.; Zarco-Tejada, P.; Lee, J.-E.; et al. Global and time-resolved monitoring of crop photosynthesis with chlorophyll fluorescence. Proc. Natl. Acad. Sci. USA 2014, 111, E1327–E1333. [Google Scholar] [CrossRef] [Scilit] [PubMed]
- Joiner, J.; Yoshida, Y.; Zhang, Y.; Duveiller, G.; Jung, M.; Lyapustin, A.; Wang, Y.; Tucker, C.J. Estimation of terrestrial global gross primary production (GPP) with satellite data-driven models and eddy covariance flux data. Remote Sens. 2018, 10, 1346. [Google Scholar] [CrossRef] [Scilit]
- Badgley, G.; Field, C.B.; Berry, J.A. Canopy near-infrared reflectance and terrestrial photosynthesis. Sci. Adv. 2017, 3, e1602244. [Google Scholar] [CrossRef] [Scilit] [PubMed]
- Li, Y.; Yuan, X.; Zheng, L.; Zhang, W.; Zhang, Y. Decoupling and insensitivity of greenness and gross primary productivity across aridity gradients in China. Remote Sens. 2024, 16, 4234. [Google Scholar] [CrossRef] [Scilit]
- Zhu, Z.; Piao, S.; Myneni, R.B.; Huang, M.; Zeng, Z.; Canadell, J.G.; Ciais, P.; Sitch, S.; Friedlingstein, P.; Arneth, A.; et al. Greening of the Earth and its drivers. Nat. Clim. Change 2016, 6, 791–795. [Google Scholar] [CrossRef] [Scilit]
- Dannenberg, M.; Barnes, M.; Smith, W.; Johnston, M.; Meerdink, S.; Wang, X.; Scott, R.; Biederman, J. Upscaling dryland carbon and water fluxes with artificial neural networks of optical, thermal, and microwave satellite remote sensing. In Proceedings of the EGU General Assembly 2023, Vienna, Austria, 23–28 April 2023. [Google Scholar] [CrossRef] [Scilit]
- Reinermann, S.; Asam, S.; Kuenzer, C. Remote sensing of grassland production and management—A review. Remote Sens. 2020, 12, 1949. [Google Scholar] [CrossRef] [Scilit]
- Qiu, R.; Han, G.; Li, S.; Tian, F.; Ma, X.; Gong, W. Soil moisture dominates the variation of gross primary productivity during hot drought in drylands. Sci. Total Environ. 2023, 899, 165686. [Google Scholar] [CrossRef] [Scilit] [PubMed]
- Shi, W.; Zhang, K.; Chen, Z.; Xie, Y.; Forzieri, G. Projected increase in global compound agricultural drought and hot events under climate change. Glob. Planet. Change 2025, 253, 104962. [Google Scholar] [CrossRef] [Scilit]
- Jung, M.; Reichstein, M.; Bondeau, A. Towards global empirical upscaling of FLUXNET eddy covariance observations: Validation of a model tree ensemble approach using a biosphere model. Biogeosciences 2009, 6, 2001–2013. [Google Scholar] [CrossRef] [Scilit]
- Liu, J.; Chen, Q.; Shao, C.; Li, S.; Zhang, X.; Zhang, Z.; Chen, S.; Ohta, T.; Varlagin, A.; Miyata, A.; et al. Estimation of gross primary production over the terrestrial ecosystems in China. Ecol. Model. 2013, 261–262, 80–92. [Google Scholar] [CrossRef] [Scilit]
- Di, K.; Chen, W.; Pang, H.; Khan, Z.; Zhang, W.; Jiao, Y.; Fan, Z.; Jin, C. Extension of GIMMS3g on MODIS NDVI for Long-Term Global Vegetation Trend Analysis. Int. J. Remote Sens. 2025, 46, 7866–7883. [Google Scholar] [CrossRef] [Scilit]

Disclaimer/Publisher’s Note: The statements, opinions and data contained in all publications are solely those of the individual author(s) and contributor(s) and not of MDPI and/or the editor(s). MDPI and/or the editor(s) disclaim responsibility for any injury to people or property resulting from any ideas, methods, instructions or products referred to in the content. |
© 2026 by the author. Licensee MDPI, Basel, Switzerland. This article is an open access article distributed under the terms and conditions of the Creative Commons Attribution (CC BY) license.