


Abstract
Against the backdrop of the synergistic advancement of Industry 4.0 and the dual-carbon strategy, traditional university mathematics education struggles to meet the demands for cultivating engineering talents’ integrated competencies in mathematics, specialization, and application. The STEM education paradigm urgently needs innovation. Guided by sustainable development principles, this study explores integrated approaches to university mathematics teaching for advanced manufacturing. It constructs a four-stage cyclical framework, Concept–Algorithm–Equipment–Evaluation (CAEE), and integrates Fourier Transform systems into industrial inspection workflows, using silicon carbide wafer thickness measurement as a case study. Targeting second-year students in Measurement and Control Technology and Instrumentation, a comparative design involving an experimental and a control group was employed. Comprehensive evaluation utilized AI-powered dynamic questionnaires, multimodal eye-tracking and EEG data, along with mixed-methods research. Results indicate that the assessment tools achieved high reliability and validity (0.906). The experimental group demonstrated significantly superior performance in deep learning proficiency and subject-specific educational structure (effect size 0.67) compared to the control group, along with modest positive enhancements in cognitive engagement and social interaction dimensions. This pedagogical model transcends conventional ‘knowledge collage’ integration, transforming mathematics from an external auxiliary tool into an ‘endogenous variable’ within industrial systems. It establishes a replicable and scalable STEM education practice paradigm.
1. Introduction
Under the synergistic impetus of Industry 4.0 and the dual-carbon strategy, the sustainable competitiveness of engineering talent is increasingly determined not solely by static mathematical knowledge, but by the dynamic ability to cycle and transform among mathematical theory, professional expertise, and real-world industrial applications [1,2,3,4]. As a cornerstone of STEM education, university mathematics curricula that are restricted to the traditional role of a ‘toolkit provider’ are insufficient for preparing students to tackle rapidly evolving technological and complex societal challenges [5,6,7,8]. A paradigm shift is thus urgently required. Guided by the genuine demands of advanced manufacturing, this shift should transform mathematics from a mere ‘prerequisite course’ into tangible ‘on-site productivity’. This transformation is essential for realizing the value of knowledge in genuine industrial contexts and for cultivating a sustainable, collaborative ecosystem between education and industry.
Current educational practices often utilize superficial multidisciplinary combinations, attempting to superficially integrate mathematics, data science, and specific engineering problems through short-term projects [9,10,11,12,13]. However, such efforts typically remain at the level of ‘task-based alignment’, failing to uncover the deep, structural coupling between mathematical concepts and manufacturing processes over extended periods. This results in a lack of epistemic resilience within the educational framework, leaving students ill-equipped to continuously transfer and apply mathematical knowledge in authentic manufacturing settings [14,15,16,17]. The core challenge lies in transforming advanced manufacturing scenarios into incubators for cognitive development—where mathematics evolves from an external tool into an endogenous variable for understanding, predicting, and optimizing industrial systems. This critical transition remains underexplored in existing research.
To address this gap, this paper proposes a reform pathway for university mathematics education, driven by the demands of advanced manufacturing. Taking the online thickness measurement of silicon carbide (SiC) wafers as a concrete context, we systematically integrate the Fourier Transform (FT) into the complete data workflow for defect identification, constructing a four-tier cyclical mechanism: ‘mathematical concept–core algorithm–equipment integration–teaching evaluation’. By further incorporating AI-driven dynamic questionnaires with eye-tracking and EEG multimodal data collection, we capture real-time declines in engagement and cognitive disconnection during simulated production-line tasks. This enables adaptive adjustments in teaching strategies and supports the regeneration of knowledge. Our study not only responds to the industry’s pressing need for rapid detection expertise in SiC manufacturing but also investigates whether embedding mathematical knowledge deeply within high-value-density industrial processes can help students develop a transferable and evolving ‘mathematics-engineering’ dual perspective.
2. Literature Review
Education for Sustainable Development (ESD) has emerged as a rapidly growing field, garnering significant attention from both academic and educational communities in recent years [18,19,20]. Against the backdrop of the advancing global sustainability agendas, the systematic integration of ESD principles into disciplinary teaching has become a crucial trend in educational innovation. As a core discipline within STEM education, mathematics plays an indispensable role in cultivating students’ critical thinking, enhancing their problem-solving capabilities, and developing their competencies to address future societal challenges [21,22,23].
Current research has generated diverse integration pathways for ESD in mathematics education [24,25,26,27]. For example, Sun Y et al. proposed an Incremental Progressive Fuzzy C-Means Clustering (IPFCMC) algorithm to optimize classroom teaching strategies and evaluate students’ performance in entrepreneurship education and innovative thinking [28]. Avelar A and colleagues systematically incorporated the Sustainable Development Goals (SDGs) into management courses, assessing the effectiveness of teaching interventions by comparing students’ knowledge, attitudes, and behaviors (KAB) before and after their participation in sustainability projects [29]. Zhicheng D et al. adopted an ecological perspective, analyzing students’ perceptual preferences for learning environments to identify key environmental characteristics influencing learning outcomes, and integrating the “ecological classroom” concept into mathematics teaching to overcome limitations such as “simplified contexts” and “single-answer approaches” commonly present in traditional instruction [30]. Collectively, these studies illustrate efforts to enhance the sustainability of mathematics education by creating authentic, complex learning contexts. Recent scholarship emphasizes structured learning pathways [31] and contextualized frameworks [32] for ESD, moving beyond peripheral sustainability content toward authentic, industry-relevant mathematical problem-solving. These studies collectively underscore that effective ESD-mathematics integration requires locally responsive case studies, such as the SiC measurement scenario, rather than generic exercises. Alongside this, interdisciplinary collaboration [33] is needed to break down silos between pure mathematics and applied engineering, validating systemic approaches like the CAEE framework. These studies collectively demonstrate efforts to enhance the sustainability of mathematics education by creating authentic, complex learning contexts.
Concurrently, with the rapid advancement of engineering technology, ESD principles have gradually permeated engineering education [34,35,36,37,38]. Fidan I et al. effectively stimulated students’ interest in STEM disciplines by integrating sustainability and entrepreneurial thinking into innovative practice teaching modules [39]. Fatima A attempted to introduce feminist pedagogy into engineering classrooms, endowing technical courses with greater inclusivity, engagement, and social responsiveness [40]. Rahman A utilized computer simulation technology to optimize students’ learning experiences in manufacturing courses [41]. Despite these advancements, the systematic integration of sustainability concepts remains insufficient in many engineering programs, particularly in manufacturing-related disciplines. A critical challenge lies in how to more closely and effectively integrate mathematics into engineering curricula and develop representative integration cases. In this context, case-based teaching has been widely recognized as a key bridge, enabling the infusion of ESD throughout mathematics instruction. This approach not only helps students better understand disciplinary knowledge but also guides them to contribute to building a sustainable future through their engagement with the world [42,43,44].
3. A Systemic Framework for University Mathematics Curriculum Reform: Deeply Embedding ESD into Mathematics Education
To achieve a “genetic-level” integration of Education for Sustainable Development (ESD) with university mathematics [45,46,47]—going beyond the superficial “green-washing” of curricula—this study proposes a four-dimensional, synergistic, and iteratively cyclical reform framework (Figure 1). Centered on the core dimensions of “values-content-methods-assessment” and supported by teacher development and community engagement, this framework aims to transform traditional “tool-training” mathematics courses into “empowerment platforms” that cultivate sustainable thinking and action capabilities.
Figure 1.
Schematic Diagram of the Education Reform Framework.
3.1. Instructional Design: Value Reconstruction and Content Restructuring
Instructional design serves as the crucial initial phase of curriculum reform, addressing the core questions of “what to teach” and “why to teach it.” By clarifying teaching objectives and integrating instructional content, it sets the direction for subsequent implementation and evaluation. This section focuses on two core components: goal orientation and content support, providing the fundamental guidance for execution and assessment.
3.1.1. The Why: Value Reconstruction—From Instrumental Rationality to Sustainability-Driven Guidance
Value reconstruction is the intrinsic driver of the entire reform. Course objectives must evolve from “mastering knowledge and algorithms” to “using mathematics to discern complex sustainability issues”. To this end, we emphasize the cultivation of three higher-order thinking skills:
Goal Elevation: Course objectives should be elevated from “mastering mathematical knowledge and skills” to “developing the ability to use mathematical thinking to perceive, analyze, and solve complex problems related to sustainable development.” This involves focusing on fostering students’ systems thinking (understanding the mathematical interconnections among system components), critical thinking (evaluating the reliability and limitations of data, models, and conclusions), and forward-looking responsibility (considering the long-term economic, social, and environmental consequences of mathematical decisions).
Value Integration: Explicitly articulate the connection between mathematics and the Sustainable Development Goals (SDGs) in both course introductions and each teaching module. For example, when teaching calculus, link concepts such as rates of change and accumulation effects to analyze the relationship between carbon emission rates and total global warming. When covering linear programming, frame it within contexts like “optimal resource allocation” or “low-carbon logistics network design.” By doing so, mathematics is positioned as a key language for understanding and supporting sustainable development, thereby enhancing students’ intrinsic motivation.
The CAEE framework explicitly demonstrates alignment with the United Nations Sustainable Development Goals (SDGs), particularly SDG 4 (Quality Education) and SDG 9 (Industry, Innovation and Infrastructure).
Specifically, the Conceptual Stage elevates mathematical learning from rote memorization to systematic thinking, addressing SDG 4.4 (substantially increasing the number of youth with relevant skills for employment and entrepreneurship). The Algorithmic Stage advances SDG 9.5 (strengthening scientific research and enhancing technological capabilities) by emphasizing Fourier transforms in semiconductor metrology. The Equipment Phase embodies SDG 9.4 (upgrading infrastructure and industrial transformation for sustainable development) by integrating green manufacturing practices into the curriculum. The Assessment Phase supports SDG 4.1 (ensuring all learners acquire knowledge and skills for sustainable development) through multidimensional competency evaluations.
This systematic mapping ensures that the CAEE framework transcends localized pedagogical innovation to directly advance the global sustainable development agenda.
3.1.2. The What: Content Design—A Modular Knowledge System Oriented Towards SDGs
This reform aims to break down the barriers between traditional mathematical branches, such as “Calculus–Linear Algebra–Probability & Statistics.” While preserving the essential foundations of the mathematical system, it introduces or adapts modules centered on sustainability themes, such as:
Module 1: Modeling and Simulation of Resource and Environmental Systems
This includes differential equations (population dynamics, pollutant dispersion), statistics and time series analysis (climate change trend forecasting, resource consumption monitoring), and network analysis (traffic flow, energy grid optimization).
Module 2: Green Economics and Decision Optimization
Topics encompass linear and nonlinear programming (sustainable supply chain management, renewable energy siting), game theory (cooperation and competition in environmental policy), and cost–benefit analysis (evaluating the full lifecycle costs of green technologies).
Module 3: Social Equity and Data Ethics
This module covers probability and statistics (data-driven insights into socio-economic inequality, fair algorithm design) and data visualization (communicating sustainability information justly and clearly).
Each module is supported by an open-source case library, which features real-world examples like “Energy Saving and Consumption Reduction in SiC Wafer Thinning Based on SPC” or “Watershed Water Quality Vulnerability Assessment Based on Random Forest,” ensuring a tight integration between the course content and practical realities.
3.2. Implementation Pathway: Pedagogical Innovation Based on Authentic Projects
The implementation pathway is the core link for operationalizing the framework, translating the “design” from the case studies into “practice.” It represents a shift in the classroom paradigm from “teacher-led instruction” to “student-driven inquiry.”
3.2.1. The How: Method Innovation—Implementing Project-Based Learning (PjBL) and Interdisciplinary Teaching
The classroom paradigm shifts from “teacher-led instruction” to “student-driven inquiry.” Project sources include campus carbon footprint analysis, urban e-bike sharing system scheduling, and online thickness monitoring for SiC in local manufacturing enterprises.
Students engage in a six-step iterative cycle: problem definition–data acquisition–model construction–sensitivity analysis–stakeholder communication–solution iteration.
Mathematics instructors collaborate with faculty from manufacturing, environmental science, economics, and sociology to form “interdisciplinary teaching clusters,” holding weekly “clinic” sessions to help students bridge knowledge gaps.
3.2.2. Key Implementation Stages: Scenario Embedding and Process Guidance
Using authentic industrial scenarios as the carrier, mathematical knowledge is systematically integrated into the entire workflow. Through a step-by-step guidance process of “concept introduction–algorithm derivation–equipment operation–outcome feedback,” students are supported in achieving the transformation from “mathematics–specialization–application.”
3.2.3. Scaffolding for Diverse Mathematical Proficiencies
The CAEE framework accommodates varying mathematical backgrounds through tiered implementation:
- (1)
- Foundational Level: Utilizes visual simulations and pre-coded tools, emphasizing physical interpretation over derivation.
- (2)
- Intermediate Level (current study): Conducts full derivations with guided worksheets and simplified datasets.
- (3)
- Advanced Level: Involves open-ended optimization tasks and peer mentoring roles.
Pilot testing confirmed accessibility across tiers: Tier 1 students (n = 15) engaged through “black box” approaches focusing on industrial relevance, while Tier 3 graduates (n = 8) developed automated reporting systems. This ensures that the framework’s sustainability-focused pedagogical logic scales without compromising disciplinary rigor.
3.3. How Well: Assessment Reform—Process-Oriented, Multi-Dimensional Competency Evaluation
Assessment methods provide the tools for measuring the effectiveness of the reform. Moving away from a “single final exam,” a scientifically rigorous and comprehensive assessment toolkit has been developed.
3.3.1. Definition and Quantification of Multi-Dimensional Evaluation Indicators
The academic connotations and quantification methods for the five core competency dimensions are defined to ensure objective assessment.
Mathematical Technical Ability: This dimension focuses on a deep understanding of concepts and the precise application of computational skills. Quantitative metrics include: “Accuracy in explaining the physical meaning of the Fourier Transform formula,” “Reasonableness of parameter settings in spectrum analysis,” and “Error rate in thickness calculation results” (e.g., ≤5% = Excellent, 5–10% = Good, 10–15% = Pass).
Modeling and Application Ability: This dimension evaluates the ability to translate real-world problems into mathematical models. Quantitative metrics include: “Completeness of problem decomposition,” “Rationality of model assumptions,” “Appropriateness of data preprocessing methods,” and “Fit between model results and industrial requirements.” These are assessed via expert rating scales (1–5 points).
Data Analysis and Critical Thinking: This section focuses on the reflective capacity regarding models and results. Quantitative metrics include “Depth of understanding of the limitations of the Fourier Transform”, “Comprehensiveness of sensitivity analysis”, and “Accuracy in identifying sources of measurement error”. These are evaluated through qualitative analysis of reflection journals and performance during Q&A sessions.
Sustainability Literacy: This section assesses the integrated consideration of environmental, social, and economic dimensions. Quantitative metrics include: “Articulation of the environmental friendliness of the detection scheme,” “Analysis of the contribution to SiC manufacturing industry sustainability,” and “Awareness of balancing stakeholder needs.” These are scored based on relevant discussions in project reports and presentation performance.
Communication and Collaboration Skills: This section focuses on teamwork and the presentation of outcomes. Quantitative metrics include: “Rationality of project task division,” “Level of participation in group discussions,” “Clarity of logic and effectiveness of visualization in academic reports,” and “Quality of interaction during presentations,” which are determined through a combination of self-assessment, peer assessment, and instructor evaluation.
3.3.2. Integration of Formative and Summative Assessment
A weighting system of “Formative Assessment (≥60%) + Summative Assessment (≤40%)” is adopted to emphasize both the learning process and the final outcomes.
Implementation of Formative Assessment:
This includes project progress monitoring (30%), reflection journals (20%), and group collaboration performance (10%). Progress is monitored and scored through staged reports. Reflection journals necessitate weekly entries on topics like “difficulties in adapting mathematical knowledge to engineering practice,” “cognitive conflicts in interdisciplinary collaboration,” and “reflections on integrating sustainability concepts,” with instructors offering formative feedback through annotations. Group collaboration is assessed based on task-completion quality, communication efficiency, and conflict resolution via peer and instructor reviews.
Core Elements of Summative Assessment: This focuses on knowledge transfer capability and solution feasibility, comprising a case-based practical assessment (25%) and a knowledge transfer test (15%). The practical assessment requires students to independently complete mathematical modeling for an unfamiliar scenario, evaluating their ability to apply knowledge. The transfer test uses open-ended questions to assess students’ integration of mathematical methods with ESD issues.
3.4. Evaluation Outcomes: Competency-Oriented Feedback and Optimization
Evaluation results are not merely for grading but serve as the basis for teaching improvement and student development. Personalized feedback reports are provided to students, clearly outlining strengths and weaknesses across different competency dimensions. Furthermore, teaching strategies are dynamically adjusted based on evaluation data. For instance, if most students score low on the “sensitivity analysis” dimension, specialized training on parameter optimization can be added in subsequent instruction, thereby establishing a closed loop of “assessment–feedback–improvement”.
3.4.1. Personalized Feedback Mechanism
Personalized feedback reports are provided to students, clearly outlining strengths and areas for improvement across dimensions and offering tailored support for the identified weaknesses.
3.4.2. Dynamic Optimization of Teaching Strategies
Based on aggregated evaluation data, instructional content and methods are adjusted. For instance, if a large number of students perform poorly in “sensitivity analysis,” targeted training on parameter optimization is incorporated to realize the closed loop of “assessment–feedback–improvement.”
4. Research Design, Case Implementation, and Instructional Effect Evaluation
4.1. Research Design
To ensure a comprehensive and objective evaluation of the teaching reform effects, this study adopts a multi-dimensional and multi-temporal data collection strategy, clarifying the research subjects, data types, and collection procedures.
4.1.1. Research Subjects
Second-year undergraduate students majoring in Measurement and Control Technology and Instrumentation were selected as the research sample. Through cluster sampling, they were divided into a control group (n = 94) and an experimental group (n = 89).
The control group (pre-reform) was composed of 94 engineering students who took the traditional Advanced Mathematics course in the 2021 academic year (before the introduction of the case). The experimental group (post-reform) consisted of 89 students from the same major who completed the corresponding course in the 2025 academic year (after the introduction of the case). The same sampling methods were applied to both groups.
To ensure baseline comparability between the groups, all participating students had completed the core module of Advanced Mathematics (including fundamentals of Fourier series and transforms). Independent samples t-tests were conducted on relevant baseline indicators, which revealed no statistically significant differences between the two groups in terms of entrance mathematics scores (t = 0.87, p = 0.38), prior foundational course grade point averages (t = 0.92, p = 0.36), or mathematics cognitive ability test scores (t = 0.75, p = 0.45). These results confirm good consistency and comparability between the groups. Figure 2 shows the radar chart of the test results.
Figure 2.
Radar Chart of Test Results.
4.1.2. Research Hypotheses
Based on the theoretical framework of experiential learning and prior evidence on case-based instruction in STEM education, we formulated the following directional hypotheses prior to data collection:
H1:
The experimental group (CAEE-structured instruction) will demonstrate significantly higher deep-learning proficiency compared to the control group (traditional instruction), with an effect size of practical significance (Cohen’s d > 0.5).
H2:
The experimental group will demonstrate significantly improved disciplinary educational structure (DS) competency compared to the control group (d > 0.5), which reflects the framework’s emphasis on mathematical-industrial integration.
H3:
The experimental group will demonstrate modest improvements in the cognitive activation (CA) and student support (SS) dimensions (d > 0.2). However, it may encounter temporary declines in classroom management (CM) scores because of the increased task complexity (d < −0.2).
H4:
Baseline equivalence will be maintained between cohorts in terms of prior mathematics achievement, general cognitive ability, and demographic composition (all p > 0.05).
Hypothesis Justification: The d > 0.5 threshold for H1 and H2 represents the minimum effect size regarded as educationally meaningful in STEM reform literature, indicating that the intervention brings about noticeable enhancements in student capability beyond mere statistical significance.
4.1.3. Data Types and Collection Tools
An AI-powered dynamic questionnaire system was developed to adaptively adjust the difficulty and focus of items according to students’ real-time performance across various task stages. The questionnaire encompasses four dimensions: Classroom Management (CM), Student Support (SS), Cognitive Activation (CA), and Disciplinary Educational Structure (DS), and it consists of 12 items in total. Responses were gathered using a 5-point Likert scale (1 = Strongly Disagree; 5 = Strongly Agree), and the data was synchronized in real-time to a cloud database.
4.1.4. Data Collection Process
Data collection spanned the entire four-stage cycle of “Concept–Algorithm–Equipment–Evaluation”:
- After the Concept Stage, initial subjective questionnaire data and basic cognitive ability test data were collected.
- During the Algorithm Stage, eye-tracking data, electroencephalography (EEG) data, and programming logs were recorded simultaneously.
- Following practical operations in the Equipment Stage, a second round of subjective questionnaire data and operational behavior data was collected.
- In the Evaluation Stage, data from the entire process was integrated. The AI questionnaire system generated personalized feedback surveys, additionally capturing students’ subjective perceptions regarding the difficulty of knowledge transfer and scenario adaptability.
4.2. Case Implementation and Outcomes—Using SiC Thickness Measurement as a Vehicle
This study utilizes online thickness measurement of silicon carbide (SiC) wafers as a real-world industrial scenario and systematically integrates Fourier Transform (FT) techniques into the entire teaching process.
4.2.1. Problem Introduction
The thickness of silicon carbide (SiC) epitaxial layers is a critical parameter that determines the performance of semiconductor devices. Its precise measurement directly affects product yield and reliability. The industry urgently needs standardized, non-destructive, high-precision inspection solutions. Fourier Transform Infrared Spectroscopy (FTIR), thanks to its advantages of operating without chemical reagents and low energy consumption, emerges as a sustainable inspection paradigm that aligns with green manufacturing principles.
This case study takes “FTIR inversion for SiC epitaxial layer thickness” as a teaching scenario. Its core objective is to guide students to go beyond rote memorizing the Fourier transform formula and deeply understand its physical essence and industrial application value.
Before delving into mathematical formalism, we establish the physical intuition underlying this application. Any measurement signal—whether sound, light, or electrical—can be understood as a composite of simpler wave patterns. Fourier analysis provides a mathematical “prism” that decomposes a complex signal into its constituent frequencies, revealing hidden periodic structures.
4.2.2. Conceptual Algorithm
The coefficients of a Fourier series quantify the amplitude weighting of each harmonic component within a complex signal. This mathematical principle can be mapped onto sustainability governance: by designing specific indicators, the “frequencies” (i.e., multidimensional demands) of various stakeholders are weighted and integrated to calibrate a robust system development pathway. Its mathematical expression is given by (1).
In the formula, represents the period of the function, 2 denotes the angular frequency of the periodic function, and indicates the harmonic order.
The Fourier transform treats any non-periodic signal as a continuous integral of infinite frequency components. By utilizing the complex exponential base defined by Euler’s Formula (2), it maps time-domain signals losslessly to the frequency domain. It not only fully preserves the signal’s original information but also provides a crucial global perspective for analysis by highlighting its frequency structure characteristics.
for non-periodic functions, their Fourier transform is given by Equation (3):
Here, represents the transformed angular frequency, denoting different components of the signal in the frequency domain.
Figure 3a visually depicts the periodic characteristics of the signal and its amplitude spectrum distribution in the frequency domain. The corresponding spectrum in Figure 3b contains only odd-order sinusoidal harmonics. The amplitude of each harmonic decays rapidly as the order increases, which is consistent with the energy distribution pattern predicted by odd function theory.
Figure 3.
Signal Synthesis and Spectrum Analysis−Classic Examples; (a) Harmonic Synthesis of a Square Wave; (b) Spectrum of a Square Wave; (c) Time-Domain Waveform of a Multi−Frequency Signal; (d) Spectrum of a Multi−Frequency Signal.
Figure 3c shows the waveform of a non-periodic continuous signal in the time domain, while Figure 3d presents its corresponding one-sided amplitude spectrum. It is obvious that after Fourier transform, the signal is effectively decomposed into three dominant sinusoidal components. The spectrum features distinct main peaks, significant side-lobe suppression, and a near-zero noise floor, indicating excellent spectral purity overall.
4.2.3. SiC Thickness Measurement
This section presents data on reflectance from interferometric spectra at different wavenumbers, measured using infrared interferometry with an incident angle of 10°. Selected data are shown in Table 1. (Detailed data can be found in Tables S1 and S2. The data are all derived from publicly available competition records, and no biological measurement data or personal identification information was collected).
Table 1.
Data Presentation Section.
This section operationalizes the “Algorithm” dimension through a four-step workflow that translates raw interferometric spectra into precise thickness measurements.
- Step 1: Data Preprocessing. Raw reflectance data undergo outlier removal, averaging, and linear trend elimination to enhance the signal-to-noise ratio for subsequent spectral analysis.
- Step 2: Frequency Domain Analysis. The preprocessed data are transformed into the frequency domain using Fourier analysis (detailed derivations in Supplementary Material S1). A Hann window function is applied to minimize spectral leakage and extract the dominant frequency component that encodes the wafer’s optical path information.
- Step 3: Thickness Calculation. Based on the thin-film interference condition (Equation (4)), the epitaxial layer thickness d is derived from the dominant frequency spacing ΔV, effective refractive index n, and incident angle θ. The effective refractive index is first determined by solving the boundary conditions established from dual-wavelength measurements (Supplementary Material S1), which enables subsequent thickness computation.
- Step 4: Signal Reconstruction and Validation. The extracted dominant frequency is used to reconstruct the reflectance signal via finite-term Fourier series fitting. The reconstruction quality is validated through residual analysis, where near-zero mean residuals confirm the accuracy of the thickness estimation (detailed methodology in Supplementary Material S1).
Key Instructional Focus: Rather than performing rote calculations, students must understand the physical meaning of each transformation—recognizing how mathematical operations in the frequency domain correspond to measurable material properties (d, n) in the industrial context.
4.2.4. Case Implementation Results
The experimental workflow yielded valid thickness measurements through the following key outcomes:
Signal Processing and Frequency Extraction: After removing 4.8% outlier points to enhance the signal-to-noise ratio, the Fourier transform successfully identified the dominant frequency component from the reflectance spectra (Supplementary Material S1).
Thickness Determination: Application of the interference condition (Equation (4)) yielded epitaxial layer thickness measurements consistent with industrial tolerance requirements (Supplementary Material S1).
Validation through Signal Reconstruction: To verify the adequacy of the extracted frequency component, the reflectance sequence underwent Fourier series reconstruction. The high consistency between the original data and the fitted curves (Figure 4a) confirmed the effective capture of the dominant periodic structure. Residual analysis (Figure 4b) demonstrated near-zero mean values with minimal boundary effects, validating the robustness of the thickness estimation.
Figure 4.
Fourier Reconstruction Results: (a) baseline-corrected reflectance vs. fitted curve; (b) residual sequence.
Figure 4a shows that the baseline-corrected reflectance data (blue curve) exhibits high consistency in both phase and amplitude with the Fourier reconstruction results (red dashed line), indicating that the dominant periodic component has been fully extracted. The residual sequence in Figure 4b has a mean close to zero, with only minor ringing effects at the boundary () and no systematic bias, demonstrating the robustness of the fitting results.
In summary, the mutual validation between time-domain reconstruction and frequency-domain analysis in Step 4 (Supplementary Material S1) fully demonstrates the effectiveness and reliability of the Fourier method in analyzing such data.
Instructional Outcome: Students successfully navigated the complete workflow—from spectral data acquisition to validated thickness reporting—demonstrating proficiency in applying Fourier analysis to solve authentic industrial measurement problems while adhering to green manufacturing protocols (chemical-free, non-destructive testing).
4.3. Data Analysis Methods
To examine the impact of the case study on students’ understanding of classroom knowledge, a questionnaire survey was conducted to compare students’ classroom comprehension before and after the intervention. The questionnaire consisted of 12 items, corresponding to four theoretical dimensions: Classroom Management (CM), Student Support (SS), Cognitive Activation (CA), and Disciplinary Educational Structure (DS). A mixed-methods research approach was adopted to enable cross-validation and in-depth interpretation of multi-source data, ensuring a comprehensive analysis. The specific analytical procedures and techniques are detailed below.
4.3.1. Analysis of Behavioral Performance Data
Quantitative metrics, including programming task scores, thickness measurement errors, and assignment grades, were analyzed using descriptive statistics (mean, standard deviation, coefficient of variation). Data normality was assessed via the Shapiro–Wilk test, and differences in behavioral performance between the experimental and control groups were examined using independent samples t-tests.
4.3.2. Analysis of Subjective Questionnaire Data
The reliability and validity of the questionnaire data were rigorously evaluated. Reliability was assessed using Cronbach’s α coefficient, while validity was examined through the Kaiser-Meyer-Olkin (KMO) measure of sampling adequacy and Bartlett’s test of sphericity.
Principal component analysis (PCA) was conducted to extract common factors and verify the structural validity of the questionnaire. Reverse-scored items (e.g., “I often feel unclear about what to do in this class”) were recoded (6–original score).
Mean scores were calculated for the four dimensions: Classroom Management (CM), Student Support (SS), Cognitive Activation (CA), and Disciplinary Educational Structure (DS). Subsequently, two composite scores were derived: Process Experience Score (Process_score) and Deep Learning Score (Deep_score).
Effect sizes were computed using Cohen’s d to quantify the practical educational significance of differences between the two groups.
4.3.3. Reliability and Validity Testing of the Questionnaire
Reliability and validity serve as fundamental prerequisites for ensuring the quality of the questionnaire. Satisfactory levels of both suggest high data reliability and consistency, justifying further modeling and analysis.
First, the reliability was assessed, yielding a Cronbach’s α of 0.906, which exceeds the acceptable threshold of 0.80, indicating excellent internal consistency.
Next, the validity was examined, and the detailed results are presented in Table 2.
Table 2.
KMO and Bartlett’s Test for Questionnaire Data.
Bartlett’s sphericity test was highly significant (p < 0.001), indicating that the questionnaire data is suitable for factor analysis. A KMO value of 0.643 supports the use of factor analysis.
Finally, factors were extracted using principal component analysis. The explanation of the total variance is shown in Table 3.
Table 3.
The Meaning of Total Variance in Questionnaire Data.
The table indicates that there are two components with eigenvalues greater than 1, which together explain 80.2% of the variance. Therefore, according to Kaiser’s criterion, this scale statistically aligns more closely with a “two-factor structure”.
Consequently, at a higher level, the data can be consolidated into two factors: “Classroom Process Experience” and “Deep Learning Outcomes”. The results of the factor analysis are consistent with the dimensional classification of the questionnaire, suggesting good validity of the questionnaire.
To maintain consistency with the instructional design, subsequent reporting will continue to use four sub-dimensions, thus ensuring the operational feasibility and replicability of the intervention strategies.
4.4. Assessment of Teaching Effectiveness
4.4.1. Inter-Group Comparison of Teaching Effectiveness
Data were collected using a 5-point Likert scale. Among the questionnaire items, “I often feel unclear about what to do in this class” and “When completing tasks, I do not know how to choose the appropriate tools for the conversation” were identified as reverse-scored items. After recoding these to the original score, mean values for each dimension and composite indices were calculated.
The class that did not introduce the SiC-FT case study was designated as the control group (n = 94), while the class that introduced the case study was designated as the experimental group (n = 89). Table 4 presents the mean (standard deviation) and effect size for each dimension across the two groups.
Table 4.
Mean (Standard Deviation) and Effect Size for Both Groups Across Dimensions.
4.4.2. Verification of Classroom Management (CM): Optimization of Teaching Core
Analysis of the collected data revealed the following characteristics: the control group had a mean score of 3.82 (SD = 0.55), while the experimental group had a mean score of 3.59 (SD = 0.61). Results from the independent-samples t-test showed p = 0.004 (p < 0.01), indicating high statistical significance. The Cohen’s d value was −0.38, corresponding to a small-to-medium negative effect. These results suggest that:
- The experimental group scored significantly lower than the control group on the classroom management dimension. This is related to the introduction of the real-world SiC reflectance data Fourier modeling task in the curriculum reform.
- The increased task complexity led to short-term adaptation challenges for students in areas such as understanding classroom objectives and adjusting to the teaching pace. This phenomenon aligns with the typical characteristics observed in the early stages of teaching complex tasks, where learners undergo a process of adjusting cognitive load and adapting their behavioral patterns.
- The negative effect in this dimension did not significantly disrupt the overall teaching process, as its impact was offset by positive effects in other dimensions. This indicates that short-term fluctuations in classroom management did not affect the core functionality of the teaching system.
4.4.3. Verification of Social Interaction (SS): Building a Social Interaction Foundation for Learning
The data for this dimension exhibited the following characteristics: the control group had a mean score of 3.70 (SD = 0.58), while the experimental group had a mean score of 3.86 (SD = 0.54). The p-value was 0.046 (p < 0.05), indicating statistical significance. The Cohen’s d value was 0.25, representing a small positive effect. These results suggest that:
- The experimental group scored significantly higher than the control group on the social interaction dimension, confirming the positive guiding role of case-based teaching on students’ interactive behaviors.
- Inquiry-based tasks grounded in real-world problems provided students with multi-scenario and multi-level interaction opportunities, promoting social learning behaviors such as collaborative communication and idea exchange.
- Although the effect size was small, the statistical significance indicates that this difference was not due to random fluctuation but rather a systematic outcome of optimizing interactive elements in the curriculum design. This establishes a solid social interaction foundation for the implementation of deep learning.
4.4.4. Cognitive Activation (CA) Validation: High Alignment with Instructional Intervention
Data Characteristics: The control group recorded a mean of 3.95 (SD = 0.52), while the experimental group achieved a mean of 4.12 (SD = 0.49). The difference was statistically significant (p = 0.034, p < 0.05), with a Cohen’s d of 0.26, indicating a small positive effect. These results demonstrate that:
- The significant improvement in the cognitive activation dimension confirms the effectiveness of the case-based teaching approach in stimulating students’ higher-order cognitive engagement.
- The Fourier modeling tasks set in authentic contexts moved beyond the traditional knowledge-transmission model, actively engaging students in complex problem-solving and knowledge transfer. This effectively activated higher-order thinking skills such as critical thinking and logical reasoning.
- The findings align with the core constructivist principle that learning grounded in authentic tasks promotes deep processing and active construction of knowledge. The modest yet statistically significant gain suggests that strengthening cognitive activation is a gradual process, which is highly consistent with the underlying logic of the instructional intervention.
4.4.5. Disciplinary Educational Structure (DS) Validation: Substantiating Curriculum Reform
Data Characteristics: The mean of the control group was 3.93 (SD = 0.50), while that of the experimental group was 4.32 (SD = 0.46). This difference was highly statistically significant (p = 1.8 × 10⁻⁷, p < 0.001), with a Cohen’s d of 0.67, indicating a medium-to-large positive effect. This suggests that:
- The disciplinary educational structure dimension exhibited the most notable improvement in this reform, with a mean increase of 0.39 and an effect size falling within the medium-to-large range. This emphasizes the substantial and significant nature of the enhancement in this area.
- The results robustly validate the pedagogical value of the Fourier modeling task based on real SiC reflectance data. The concrete disciplinary task effectively enhances students’ core disciplinary competencies, including symbolic manipulation, algorithm comparison, and result verification, thereby promoting the systematization and structuring of disciplinary thinking.
- The marked improvement in this dimension serves as key evidence for achieving the core objective of the curriculum reform. It highlights the distinctive advantage of authentic case-based teaching in deepening students’ core disciplinary literacy and constructing a coherent disciplinary cognitive framework. Figure 5 shows the results of the average effect assessment.
Figure 5.
Mean Effect Evaluation Results Chart.
4.4.6. Integrated Multi-Dimensional and Overall Instructional Effect Analysis
To further assess the comprehensive impact of the instructional intervention, three integrated metrics were analyzed using independent samples t-tests and Cohen’s d effect sizes: the Process Score, Deep Learning Score, and Total Score. These metrics are collectively analyzed here as a composite dimension. Figure 6 presents the corresponding means, standard deviations, and effect sizes for this composite analysis.
Figure 6.
Mean (Standard Deviation) and Effect Size of Composite Dimensions.
4.4.7. Integrated Multi-Dimensional and Overall Instructional Effect Analysis
- (1)
- Integrated Process Score:
As a weighted composite of classroom management and social interaction, this metric showed no statistically significant difference between the experimental and control groups (p = 0.63), with a negligible effect size (Cohen’s *d* = −0.06). This indicates that the curriculum reform did not substantially disrupt the overall stability of the instructional process.
Although the introduction of complex tasks initially posed short-term adaptive challenges in classroom management, these challenges were effectively compensated for by positive gains in the social interaction dimension. This dynamic underscores the instructional system’s inherent coherence and adaptive capacity, ensuring the integrity and operational efficiency of the teaching process.
- (2)
- Deep Learning Score:
This score, which represents a synthesis of cognitive activation and disciplinary educational structure, was significantly higher in the experimental group (p = 8.5 × 10⁻⁶), demonstrating a medium positive effect (Cohen’s *d* = 0.56). This confirms that the curriculum reform effectively promoted and deepened meaningful learning.
The higher-order cognitive engagement stimulated in the cognitive activation dimension provided the motivational foundation for deep learning. Meanwhile, the strengthened disciplinary thinking cultivated in the structural dimension offered crucial cognitive support. Their synergistic effect enabled learners to achieve a clear cognitive progression, moving from superficial knowledge recall to deep understanding, transfer, and innovative application. This validates the scientific efficacy of the authentic case-based teaching model in improving learning quality.
- (3)
- Total Score:
As an aggregate of all assessment items, the total score for the experimental group showed a highly statistically significant improvement (p = 0.006), corresponding to a small-to-medium positive effect (Cohen’s *d* = 0.35). This provides holistic evidence for the practical value and feasibility of the curriculum reform.
Despite the short-term adaptive challenges observed in classroom management, the positive effects in core dimensions—namely cognitive activation, disciplinary educational structure, and social interaction—were predominant. This resulted in a favorable trade-off characterized by “localized adaptive costs” being outweighed by “overall benefit gains.”
This outcome suggests that the design and implementation of the reform are well-aligned with educational principles and students’ cognitive development needs. Its significant positive impact on deepening core disciplinary literacy and promoting holistic student development clearly outweighs the potential drawbacks of short-term adaptation issues, providing a solid empirical foundation for the further refinement and wider application of the teaching reform.
In summary, the empirical analysis across the seven instructional effect metrics presents a coherent picture: The classroom management dimension showed a small-to-medium negative effect (p < 0.01), which can be attributed to short-term adaptation difficulties arising from complex tasks. Both the social interaction and cognitive activation dimensions exhibited small positive effects (p < 0.05), confirming that case-based teaching positively activates interactive behaviors and higher-order cognition. The disciplinary educational structure dimension demonstrated a medium-to-large positive effect (p < 0.001), representing the core achievement of the reform. The lack of a significant difference in the Integrated Process Score (p > 0.05) highlights the inherent stability of the system. The medium positive effect for the Deep Learning Score (p < 0.001) indicates that cognitive and disciplinary thinking synergistically promoted deep learning. Finally, the small-to-medium positive effect for the Total Score (p < 0.01) validates the overall effectiveness of the reform. The dominant positive effects in the core dimensions successfully outweighed the short-term adaptive challenges, providing robust empirical support for subsequent educational reforms.
4.4.8. Qualitative Insights into Student-Perceived Impact
To complement the quantitative findings, we conducted semi-structured interviews with 12 randomly selected students from the experimental group immediately after the course was completed. The interview protocol focused on three themes: (1) perceived changes in understanding Fourier transform applications, (2) experiences of connecting mathematics to industrial sustainability, and (3) suggestions for instructional improvement.
Theme 1: From Abstraction to Application
Students consistently reported a shift in their perception of Fourier transforms from “abstract formulas” to “practical tools.” One student noted: *“Previously, I memorized the equations for exams. Now, I see how the frequency domain analysis directly solves the SiC thickness problem—we’re not just calculating; we’re quality-controlling.”* This aligns with the significant improvement in the Disciplinary Educational Structure dimension (d = 0.67).
Theme 2: Sustainability Awareness
Seven students explicitly mentioned an enhanced awareness of sustainability in manufacturing. A representative quote: *”I never thought mathematical precision could reduce material waste. The case made me realize that accurate measurement means fewer defective wafers, which means less energy consumption.”* This supports the framework’s value reconstruction objective.
Theme 3: Adaptive Challenges
Four students reported initial struggles with the interdisciplinary nature of the tasks. *”At first, understanding both the physics of infrared spectroscopy and the mathematics was overwhelming,”* one student reflected, corroborating the negative effect observed in Classroom Management (d = −0.38). However, all four noted that peer collaboration and instructor scaffolding facilitated adaptation by Week 3.
Integration with CAEE Assessment
These qualitative findings reinforce the quantitative results while offering nuanced insights: the negative effect in Classroom Management reflects productive struggle rather than design flaws, and the positive effects in Social Interaction and Cognitive Activation are manifested in students’ metacognitive awareness of interdisciplinary connections. This validates the CAEE model’s iterative design, where short-term adaptation costs result in long-term competency gains.
4.4.9. Scalability and Cross-Disciplinary Transferability of the CAEE Framework
Disciplinary Educational Structure (DS) as Universal Anchor: The DS dimension, emphasizing symbolic manipulation, algorithm comparison, and result verification, transcends specific mathematical content. Pilot applications in two additional contexts support this claim:
- Renewable Energy Materials (Physics Department, n = 34): CAEE conducted structured X-ray diffraction analysis for perovskite solar cell characterization, achieving comparable effect sizes for deep learning (d = 0.61).
- Carbon Footprint Assessment (Environmental Science, n = 28): Remote sensing data analysis using regression techniques demonstrated improved sustainability literacy (d = 0.52) when integrated into the CAEE cycle compared to traditional lectures.
These preliminary extensions suggest that CAEE functions as a “meta-framework” for STEM education reform. In this context, the sustainable industrial context offers motivational authenticity, while the mathematical core remains adaptable to curricular requirements.
4.5. Satisfaction Analysis
4.5.1. Reliability Analysis
In this study that examines student satisfaction with sustainable-oriented mathematics teaching reform, Cronbach’s Alpha coefficient was used to evaluate the reliability of the 12-item satisfaction measurement scale. The results show that the scale obtained a Cronbach’s Alpha coefficient of 0.846. According to the widely recognized reliability standards in academic research, this value lies within the 0.8–0.9 range, indicating strong internal consistency reliability. This means that the 12 assessment items reliably and consistently reflect the core dimensions of student satisfaction with the teaching reform, and the measurement results are minimally influenced by random error.
4.5.2. Validity Analysis
- (1)
- KMO Sampling Adequacy Test
The KMO value for this study was 0.751. According to Kaiser’s criteria, a KMO value between 0.7 and 0.8 indicates good sampling adequacy, suggesting numerous common factors among variables and suitability for factor analysis. This result confirms that the collected student satisfaction data have a sound structural validity foundation, enabling further extraction of latent core dimensions through factor analysis.
- (2)
- Bartlett’s Sphericity Test
In this study, Bartlett’s sphericity test yielded an approximate chi-square value of 727.800 with 66 degrees of freedom and a significance level (p-value) of 0.000, which is less than 0.001 and thus extremely significant. This result rejects the null hypothesis that the correlation matrix is an identity matrix, indicating significant inter-item correlations. The data thus satisfy the prerequisites for factor analysis. Table 5 presents the validity test results:
Table 5.
KMO and Bartlett’s Test for Student Satisfaction.
4.5.3. Factor Analysis
Factor extraction was carried out on the 12 satisfaction assessment items using Principal Component Analysis (PCA). According to the Kaiser criterion (eigenvalues greater than 1), four principal components were extracted, corresponding to the four main dimensions of this reform: Instructional Design, Implementation Pathway, Assessment Reform, and Assessment Outcomes (Feedback and Optimization).
From the total variance explained results, the initial eigenvalues of these four principal components were 4.483, 1.871, 1.731, and 1.526, all exceeding the critical value of 1. Their cumulative variance explanation reached 80.086%, indicating that these four principal components can explain 80.086% of the variance in the original data.
According to general requirements for factor extraction in academic research, a cumulative variance explanation of over 60% is considered sufficient to ensure that the extracted factors are representative. In this study, the cumulative variance explanation far exceeds this standard, demonstrating that the four extracted principal components comprehensively and effectively reflect the core dimensions of student satisfaction.
After rotation, the rotated sums of squared loadings for the four principal components were 2.448, 2.446, 2.386, and 2.331, with corresponding variance percentages of 20.398%, 20.381%, 19.880%, and 19.427%. The cumulative variance explanation remained unchanged at 80.086%.
The rotated factor structure was clearer, with the loadings of items under each principal component more concentrated. This further validates the rationality and scientificity of the four-dimensional classification.
This provides robust statistical support for subsequently defining the four principal components as satisfaction dimensions: Instructional Design, Implementation Pathway, Assessment Reform, and Assessment Outcomes (Feedback and Optimization). Table 6 indicates the significance of the total variance across the four principal components.
Table 6.
The Meaning of the Total Variance in Student Satisfaction.
4.5.4. Overall Satisfaction Level Analysis
Based on assessment data from a five-point Likert scale (1 = Very Dissatisfied, 2 = Dissatisfied, 3 = Neutral, 4 = Satisfied, 5 = Very Satisfied), the satisfaction scores across the four dimensions are shown in Figure 7.
Figure 7.
Satisfaction rate distribution across five key evaluation categories.
As shown in Figure 7, the students’ overall satisfaction score regarding the sustainability-oriented mathematics teaching reform was 3.742, indicating an above-average level. This outcome implies that most students have a positive attitude towards the overall effectiveness of the mathematics teaching reform. The core concepts, goal orientation, and practical exploration of the reform are widely accepted by the student group.
The standard deviation of the overall satisfaction score was 0.812, which is relatively small. This indicates that the students’ evaluations are concentrated and consistent, without extreme polarization.
From the perspectives of the satisfaction rate (score ≥ 4) and the dissatisfaction rate (score ≤ 2), the overall satisfaction rate reached 43.9%, while the dissatisfaction rate was only 6.5%. This further confirms that the reform has received generally positive feedback from students.
Instructional Design Dimension: The instructional design dimension scored a mean of 3.698 (SD = 1.201), with a satisfaction rate of 65.4% and a dissatisfaction rate of 20.6%. This dimension primarily encompasses core elements such as course objectives, content organization, and teaching methods.
Although its satisfaction level is slightly below the overall mean, it still remains within the above-average range. These findings suggest that students recognize the integration of sustainability-oriented content and the efforts to link course material with real-life contexts and disciplinary frontiers.
However, the 20.6% dissatisfaction rate implies that some students believe there is room for enhancement in terms of relevance, engagement, or differentiation within the instructional design. For example, the difficulty gradient of certain content may not fully adapt to different student cognitive levels, or the innovation and practicality of teaching methods may not have lived up to expectations.
Implementation Pathway Dimension: The implementation pathway dimension yielded a mean score of 3.735 (SD = 1.247), a satisfaction rate of 66.4%, and a dissatisfaction rate of 22.4%. This dimension focuses on how the teaching reform was carried out in actual classroom settings, including the organization of teaching activities, the utilization of teaching resources, and teacher–student interaction modes. Its mean score is slightly higher than that of the instructional design dimension, and its satisfaction rate is also relatively higher, indicating general student approval of teaching activities and resource support during implementation.
However, this dimension exhibited the largest standard deviation among the four and the highest dissatisfaction rate, suggesting significant variability in students’ experiences. This variability may be attributable to differences in teachers’ instructional execution, classroom management abilities, and resource accessibility. Some students reported lower satisfaction due to issues such as fragmented lesson flow, insufficient resource availability, or suboptimal interaction experiences.
Assessment Reform Dimension: The assessment reform dimension achieved a mean of 3.779 (SD = 1.147), a satisfaction rate of 66.4%, and a dissatisfaction rate of 15.9%. This dimension primarily relates to reforms in the assessment framework, evaluation methods, and diversification of assessment participants. Its mean score is the highest among the four dimensions, and its dissatisfaction rate is the lowest. These results demonstrate strong student endorsement of the optimized assessment system.
Compared with traditional evaluation models, the reformed approach was perceived as more comprehensive and objective in reflecting students’ learning processes and overall competencies—particularly its emphasis on sustainability awareness, innovative thinking, and practical skills, which received widespread recognition. The relatively low standard deviation (1.147) further indicates consistent student perceptions and experiences regarding assessment reform, underscoring the rationale and feasibility of the reformed evaluation philosophy and practices.
Assessment Outcomes (Feedback and Optimization) Dimension: The dimension of assessment outcomes (feedback and optimization) recorded a mean score of 3.757 (SD = 1.150), a satisfaction rate of 69.2%, and a dissatisfaction rate of 18.7%.
Focusing on the timeliness and relevance of feedback, as well as teaching adjustments and student learning improvements based on evaluation results, this dimension attained the highest satisfaction rate among the four. The data strongly indicate that students highly value and clearly perceive mechanisms such as personalized feedback based on assessment data and dynamic adjustments to teaching content and methods.
Students generally agreed that timely, specific feedback helped clarify their learning gaps, while instructional refinements informed by evaluation outcomes better addressed their learning needs and enhanced learning effectiveness. The strong performance in this dimension also confirms that assessment reform goes beyond methodological innovation—it enables the effective use of evaluation results, forming a virtuous cycle of “assessment–feedback–optimization”. Figure 8 shows the performance analysis of the satisfaction dimension.
Figure 8.
Importance-Performance Analvsis (lPA).
4.6. Cost–Efficiency Analysis
Cost–Efficiency: Initial preparation required 40 h (compared to 15 h in traditional methods). The preparation time amortizes to 72 h over 5 years, while repeated lectures require 75 h. The incremental cost is $128 per student (including equipment and software), which can be reduced to $58 with simulations. The cost per effect-size unit is $229 (compared to the benchmark of $400–800), achieving a “low input–high gain” outcome through replicability.
4.7. Conclusions and Implications
This study employed multiple statistical methods, including reliability analysis, validity testing, factor analysis, and Importance-Performance Analysis (IPA), to systematically examine student satisfaction with the sustainability-oriented mathematics teaching reform and its influencing factors. The following conclusions were drawn:
- The assessment scale demonstrated good reliability and validity. The four extracted dimensions—Instructional Design, Implementation Pathway, Assessment Reform, and Assessment Outcomes (Feedback and Optimization)—comprehensively and reliably reflect the core components of student satisfaction, providing a valid measurement tool for subsequent related research.
- Students’ overall satisfaction with the sustainability-oriented mathematics teaching reform was at an above-average level, and the majority expressed positive recognition. This indicates that the overall direction and practical exploration of the reform have achieved favorable outcomes.
- Satisfaction levels varied across dimensions: the Assessment Outcomes dimension had the highest satisfaction rate; the Assessment Reform dimension showed the highest mean score and the lowest dissatisfaction rate; whereas the Implementation Pathway dimension exhibited the highest dissatisfaction rate and the most pronounced divergence in student experiences.
- IPA identified key areas for optimization: The Implementation Pathway and Instructional Design fall into the “high importance–low performance” quadrant and should be prioritized for improvement; Assessment Outcomes belongs to the “high importance–high performance” quadrant and requires sustained excellence; Assessment Reform is categorized as “low importance–high performance,” suggesting that resource allocation could be adjusted accordingly.
Based on these findings, the following implications for reform optimization are proposed:
- Focus on Optimizing the Implementation Pathway to Enhance Reform Effectiveness.
- To address issues such as uneven resource allocation and variability in execution capabilities, targeted measures should be taken. These include strengthening specialized teacher training, improving mechanisms for sharing teaching resources, and establishing a quality monitoring system for teaching implementation. These steps will enhance consistency and effectiveness in teaching delivery and reduce disparities in student experiences.
- Refine Instructional Design Details to Increase Relevance and Engagement. By aligning with students’ cognitive levels and learning needs, optimize the difficulty gradient of teaching content. Introduce innovative teaching methods and approaches, and strengthen the integration of course content with sustainability concepts and real-life contexts to improve student engagement and learning outcomes.
- Maintain Strengths in Feedback on Assessment Outcomes and Deepen the “Assessment–Feedback–Optimization” Cycle. The timeliness, relevance, and personalization of feedback based on assessment results should continue to be enhanced. A more precise mechanism for diagnosing student learning should be established, enabling teachers to dynamically adjust instructional strategies based on the feedback. Simultaneously, students should be guided to utilize assessment results for self-directed learning improvement, further refining this virtuous cycle.
- Optimize Resource Allocation to Improve Overall Reform Efficiency.
- Resource investment in non-core aspects of assessment reform can be appropriately reduced. The redirected resources should be allocated to priority improvement areas such as Implementation Pathway and Instructional Design. This rational reallocation will maximize the overall effectiveness of the reform and promote deeper, higher-quality development of sustainability-oriented mathematics teaching.
5. Conclusions
This study constructed a four-stage cyclical framework of “Concept–Algorithm–Equipment–Evaluation” and explored a teaching reform pathway that deeply integrates university mathematics with engineering practice, driven by “hardcore manufacturing.” Taking the SiC wafer thickness measurement as a representative case, it systematically incorporated the Fourier Transform (FT) into the entire industrial inspection process. The main conclusions are as follows:
- (1)
- Empirical Validation of Teaching Model Effectiveness: The designed evaluation questionnaire exhibited excellent internal consistency and structural validity. On the premise of “low input,” the experimental group achieved “high gain,” showing significant improvement in deep learning scores and the disciplinary educational structure dimension, along with a modest yet statistically significant enhancement in cognitive activation. These results effectively enhanced students’ cross-domain thinking and knowledge transfer abilities.
- (2)
- Theoretical Breakthrough: Beyond Traditional “Knowledge Collage” Integration Paradigms. The study revealed the long-term, in-depth coupling mechanism between mathematical knowledge and manufacturing processes, transforming mathematics from an external tool into an “endogenous variable” for understanding industrial systems. This enriches the integration pathways of Education for Sustainable Development (ESD) within STEM education and provides theoretical support for redefining the paradigm of university mathematics education.
- (3)
- Significant Practical Value: The SiC thickness measurement teaching case addresses industrial talent demands, establishing a replicable and scalable teaching model that can be extended to interdisciplinary fields such as renewable energy material characterization and carbon footprint remote sensing assessment. It lays a practical foundation for building a collaborative ecosystem between education and industry.
- (4)
- Clear Directions for Future Research: Future efforts can expand the scope of case studies, integrate more advanced manufacturing technologies and mathematical tools, enhance the AI-enabled dynamic evaluation system, and continuously optimize the adaptability and evolvability of the teaching framework.
This study establishes the CAEE framework as a theoretically grounded and practically validated pathway for sustainable mathematics education reform. By embedding mathematical learning in authentic, high-stakes manufacturing contexts such as SiC wafer metrology, the framework challenges the traditional “prerequisite course” model. It provides assessable standards for national STEM policies, including concrete localization mechanisms for SDG 4 (Quality Education) and SDG 9 (Industry and Innovation). Moreover, it maintains scalability through its “low input–high gain” architecture. The framework’s four-stage logic demonstrates inherent cross-disciplinary transferability. Pilot applications in renewable energy materials (d = 0.61) and carbon footprint assessment (d = 0.52) confirm its function as a meta-framework.
6. Limitations
Although the distinction between the control group (2021) and the experimental group (2025) is clear, limitations still exist due to potential confounding variables, such as changes in teaching staff and shifts in the campus learning environment after the pandemic. The 2021–2025 interval presents potential confounds, including teaching disruptions during the pandemic era, turnover of teaching assistants (TAs), and secular trends in students’ AI usage. Baseline equivalence testing indicated no significant differences (p > 0.05), and the lead instructor remained the same. Unmeasured motivational shifts (e.g., increased awareness of the semiconductor industry) cannot be completely excluded.
7. Future Research
Future work will focus on three strategic directions to advance the CAEE framework: validating long-term educational outcomes through empirical tracking, enhancing instructional scalability via intelligent systems, and ensuring global applicability through cross-cultural testing. These efforts will further solidify CAEE as a rigorously tested, theoretically grounded, and policy-aligned pathway for sustainable mathematics education reform—fundamentally transforming how engineering students learn, value, and apply mathematical thinking in service of industrial sustainability.
- (1)
- Longitudinal Tracking: Conduct extended follow-up studies on CAEE-trained students’ workplace performance to verify the sustainability and long-term effectiveness of competency development.
- (2)
- Intelligent Instructional Support: Develop automated AI tutoring systems that reduce instructor preparation workload while maintaining personalized and targeted teaching.
- (3)
- Cross-Cultural Validation: Extend the framework to non-Asian educational contexts to test its universality and transferability across cultures.
Supplementary Materials
The following supporting information can be downloaded at: https://www.mdpi.com/article/10.3390/su18041900/s1, Table S1—Test results at an incident angle of 10°; Table S2—Test results at an incident angle of 15°; Supplementary Materials S1—Detailed Mathematical Derivations.
Author Contributions
Conceptualization, C.X.; methodology, S.X.; software, C.X.; validation, S.X., Y.G. and H.D.; formal analysis, Y.G.; investigation, H.D.; resources, C.X.; data curation, C.X.; writing—original draft preparation, C.X.; writing—review and editing, H.D.; visualization, S.X.; supervision, Y.G.; project administration, H.D.; funding acquisition, H.D. All authors have read and agreed to the published version of the manuscript.
Funding
This research was supported by Hebei Province College Student Innovation and Entrepreneurship Projects (S202410081048), Hebei Provincial Online Open Courses (Linear Algebra), and the Virtual Learning and Research Office Project for College Mathematics Courses Group of the Ministry of Education of China (North China University of Science and Technology).
Institutional Review Board Statement
This research was conducted in accordance with the guidelines of the Helsinki Declaration and has been approved by the Medical Ethics Committee of North China University of Science and Technology (Approval Number: 2026008, Approval Date: 1 January 2026).
Informed Consent Statement
Informed consent was obtained from all subjects involved in the study.
Data Availability Statement
The data used in this study have been uploaded in the form of Supplementary Material S1.
Conflicts of Interest
The authors declare no conflicts of interest.
Abbreviations
The following abbreviations are used in this manuscript:
| CAEE | Concept–Algorithm–Equipment–Evaluation |
| CM | Classroom Management |
| DS | Disciplinary Educational Structure |
| EEG | Electroencephalography |
| ESD | Education for Sustainable Development |
| FT | Fourier Transform |
| FTIR | Fourier Transform Infrared Spectroscopy |
| IPA | Importance-Performance Analysis |
| KAB | Knowledge, Attitudes, and Behaviors |
| PjBL | Project-Based Learning |
| PCA | Principal Component Analysis |
| SDG | Sustainable Development Goal |
| SiC | Silicon Carbide |
| SS | Student Support |
| STEM | Science, Technology, Engineering, Mathematics |
References
- Khan, H.S.; Mourad, I.H.A. Integrating Industry 4.0 in engineering education: Implementation patterns, pedagogical strategies, and industry alignment. Cogent Educ. 2025, 12, 2588010. [Google Scholar] [CrossRef] [Scilit]
- Reyes, M.P.; Visich, K.J. Preparing for tomorrow’s supply chain leaders today in the Industry 4.0 era: Student perceptions on learning modes. Decis. Sci. J. Innov. Educ. 2025, 23, e70016. [Google Scholar] [CrossRef] [Scilit]
- Ahmad, W.; Khan, S.; Mazhar, T.; Shahzad, T.; Jiang, W.; Hamam, H. Industry 4.0 for smart transport systems: Foundations and applications. Telemat. Inform. Rep. 2025, 20, 100255. [Google Scholar] [CrossRef] [Scilit]
- Li, P.; Zhai, L.; Shahzad, U.; Li, C. Enhancing innovation performance in renewable energy through sustainable business model innovation: The moderating role of industry 4.0 technologies. J. Environ. Manag. 2025, 395, 395127766. [Google Scholar] [CrossRef] [Scilit]
- Done, E.J.; Knowler, H.; Lazar, I.; Hayes, S.; Lait, J.; Porres, A.P. (Un)just transitions for youth and the disabled? The exclusionary pressures facing science, technology, engineering and mathematics (STEM) education. Energy Res. Soc. Sci. 2025, 129, 104371. [Google Scholar] [CrossRef] [Scilit]
- Brunengo, M.T.; Rocca, A.; Mollo, A.; Guevara, R.; Ortega, M.; Núñez, I.; González, G. Inclusive design for chemistry laboratories: A participatory approach to supporting students with disabilities in STEM education. Educ. Chem. Eng. 2026, 54, 100493. [Google Scholar] [CrossRef] [Scilit]
- Bayaga, A. AI-powered platforms in STEM education, insights from UTAUT model: PLS-SEM and artificial neural networks hybrid analysis. Telemat. Inform. Rep. 2025, 20, 100266. [Google Scholar] [CrossRef] [Scilit]
- Gao, L.; Jong, M.S.-Y.; Chai, C.S.; Li, K. STEM education: Understanding secondary students’ epistemic cognition in the design process with the support of a personalized multi-agent system. Comput. Educ. 2026, 242, 105504. [Google Scholar] [CrossRef] [Scilit]
- Bertolaccini, L.; Bardoni, C.; Casiraghi, M.; Spaggiari, L. Reflections on the ThoRN Consensus: Toward a Multidisciplinary Integration. Ann. Thorac. Surg. 2025, 121, 262–263. [Google Scholar] [CrossRef] [Scilit]
- Phei, S.E. BIOI Virtual Academic Series PART 1: Multidisciplinary Integration in Academia. BIO Integr. 2020, 1, 101–103. [Google Scholar] [CrossRef] [Scilit]
- Zhong, W.; Zhang, W.; Zhang, G. AI + Education: Discrete Mathematics Teaching Reform Integrated with Multiple Disciplines. New Explor. Educ. Teach. 2025, 3. [Google Scholar]
- Jiabo, T. Information Analysis of Advanced Mathematics Education-Adaptive Algorithm Based on Big Data. Math. Probl. Eng. 2022, 2022, 7796681. [Google Scholar] [CrossRef] [Scilit]
- Wang, X.; Wei, R.; Chen, Z.; Pang, H.; Li, H.; Yang, Y.; Hua, Q.; Shen, G. Bioinspired Intelligent Soft Robotics: From Multidisciplinary Integration to Next-Generation Intelligence. Adv. Sci. 2025, 12, e06296. [Google Scholar] [CrossRef] [Scilit]
- Dantan, Y.J.; Homri, L. Overview of mathematical concepts for tolerance analysis. Procedia CIRP 2024, 129, 73–78. [Google Scholar] [CrossRef] [Scilit]
- Chowdhury, P.P.; Khan, M.M.A.; Sayem, A.; Asif, A.R.; Roy, A. Assessment of organizations’ maturity towards circular economy practice in manufacturing industries: Evidence from a developing economy. Clean. Logist. Supply Chain 2025, 17, 100286. [Google Scholar] [CrossRef] [Scilit]
- Jianwei, L. Mathematical optimization strategy for online scheduling of complex manufacturing systems based on thermal energy optimization and fuzzy mathematical model. Therm. Sci. Eng. Prog. 2024, 55, 102949. [Google Scholar] [CrossRef] [Scilit]
- AlKhader, W.; Jayaraman, R.; Salah, K.; Antony, J.; Omar, M. Transformations in manufacturing quality in the Industry 4.0 era: A semi-centennial review using latent Dirichlet allocation. Comput. Ind. Eng. 2025, 208, 111340. [Google Scholar] [CrossRef] [Scilit]
- Sugimura, M. Advancing Education for Sustainable Development and Roles of Higher Education Networks. J. Educ. Sustain. Dev. 2025, 19, 248–258. [Google Scholar] [CrossRef] [Scilit]
- Garg, S.; Mittal, S.; Garg, A. Investigating the role of education, renewable energy and governance in sustainable economic development: Empirical insight from ASEAN economies. Renew. Energy 2025, 249, 123239. [Google Scholar] [CrossRef] [Scilit]
- Yan, H.; Zhang, H. External Resource Dependence and Implementation Efficiency of Education for Sustainable Development (ESD): A Hybrid Design Based on Data Envelopment Analysis (DEA) and Dynamic Qualitative Comparative Analysis (QCA). Sustainability 2025, 17, 3809. [Google Scholar] [CrossRef] [Scilit]
- Balonier, S.; Huber, G.S. Governance of the Implementation of Education for Sustainable Development (ESD) in Schools—Perceptions of Key Stakeholders in Education. Sustainability 2025, 17, 9734. [Google Scholar] [CrossRef] [Scilit]
- Xu, B.; Ma, X.; Zhang, Y.; Wu, X. How does mathematical literacy affect creative thinking? Independent effects and differential impacts across proficiency groups. Acta Psychol. 2025, 260, 105509. [Google Scholar] [CrossRef] [Scilit] [PubMed]
- Péter, S.B.; Jeana, K. Future geography teachers for the planet. Powerful (disciplinary) knowledge and education for sustainable development (ESD) in initial teacher education (ITE). Int. Res. Geogr. Environ. Educ. 2023, 32, 1–3. [Google Scholar] [CrossRef] [Scilit]
- Singh, M.; Sun, D.; Yang, Y. Design and implementation of Math City: An inquiry-based metaverse platform for mathematics education. Comput. Educ. Artif. Intell. 2025, 9, 100462. [Google Scholar] [CrossRef] [Scilit]
- Guo, Z.; Fryer, K.L. Personal relevance and interest: Exploring the relationships among three types of perceived personal relevance and middle school students’ interest in a math lesson. Learn. Individ. Differ. 2025, 122, 102733. [Google Scholar] [CrossRef] [Scilit]
- Rincón, R.Y.; Munárriz, A. From math aversion to effective integration: Theoretical framework for building quantitative skills in Economics and Business students. Int. J. Manag. Educ. 2025, 23, 101193. [Google Scholar] [CrossRef] [Scilit]
- Danielle, S.; Ponnock, A.R.; Jordan, W.J.; Kuriloff, P.; Hoffman, B. Sustainable Teaching: Three urban teachers make acase for teachereducation 3.0. Teach. Teach. Educ. 2021, 99, 103271. [Google Scholar] [CrossRef] [Scilit]
- Sun, Y.; Yang, M. Teaching strategy of innovation and entrepreneurship education and mathematical modelling course integra tion based on cluster analysis. Syst. Soft Comput. 2025, 7, 200388. [Google Scholar] [CrossRef] [Scilit]
- Avelar, A.; Michell, S.; Guimarães, S.L. Integrating sustainable development goals in management education: Impact on student knowledge, attitudes, and behaviors. Int. J. Manag. Educ. 2025, 23, 101116. [Google Scholar] [CrossRef] [Scilit]
- Zhicheng, D.; Junxia, X.; Liang, Z.; Zhu, X. Smart classroom learning environment preferences of higher education teachers and students in China: An ecological perspective. Heliyon 2023, 9, e16769. [Google Scholar] [CrossRef] [Scilit]
- Boman, J.; Omrcen, E.; Weldemariam, K.; Hanning, A.; Lodin, J. Building learning pathways to enhance education for sustainable development (ESD), quality and relevance. Int. J. Sustain. High. Educ. 2025, 26, 353–371. [Google Scholar] [CrossRef] [Scilit]
- Danageuzian, H.; Barakat, B.L.; Hage, E.F. Designing an education for sustainable development (ESD) curriculum: Insights from a semi-structured interview study in Lebanon. Environ. Educ. Res. 2025, 31, 1420–1435. [Google Scholar] [CrossRef] [Scilit]
- Supple, B.; Lorenzutti, N.; McCullough, K.; Ortiz, R.M.C. Teaching for tomorrow: A qualitative exploration of ESD in initial teacher education across five European universities. Int. J. Sustain. High. Educ. 2025, 26, 448–465. [Google Scholar] [CrossRef] [Scilit]
- Isenmann, R.; Landwehr-Zloch, S.; Zinn, S. Morphological box for ESD—Landmark for universities implementing education for sustainable development (ESD). Int. J. Manag. Educ. 2020, 18, 100360. [Google Scholar] [CrossRef] [Scilit]
- Nousheen, A.; Zai, S.A.Y.; Waseem, M.; Khan, S.A. Education for sustainable development (ESD): Effects of sustainability education on pre-service teachers’ attitude towards sustainable development (SD). J. Clean. Prod. 2019, 250, 119537. [Google Scholar] [CrossRef] [Scilit]
- Aasar, E.M.; Shafik, Z.; Bakr, A.D. Outdoor learning environment as a teaching tool for integrating education for sustainable development in kindergarten, Egypt. Ain Shams Eng. J. 2024, 15, 102629. [Google Scholar] [CrossRef] [Scilit]
- Mariem, Z.F.; Sana, D.; Muammer, K. Embedding Education for Sustainable Development (ESD) and SDGs values in curriculum: A comparative review on Qatar, Singapore and New Zealand. J. Clean. Prod. 2021, 319, 128534. [Google Scholar] [CrossRef] [Scilit]
- Ismael, D.; Jovanovic, V. Advancing manufacturing engineering education through sustainability integration. Manuf. Lett. 2025, 46, 37–41. [Google Scholar] [CrossRef] [Scilit]
- Fidan, I. Shaping tomorrow’s engineering education with sustainable design and manufacturing practices. Manuf. Lett. 2025, 46, 102–106. [Google Scholar] [CrossRef] [Scilit]
- Fatima, A.; Irwin, L.J. Integrating feminist pedagogy into manufacturing education: A digital twin-based teaching module. Manuf. Lett. 2025, 46, 30–33. [Google Scholar] [CrossRef] [Scilit]
- Rahman, S.A.; Molla, S.; Sultana, J.; Chiou, R.Y.; Tseng, T.L.B.; Rahman, M.F. Development of digital laboratory modules using computer simulation for enhanced learning experience in manufacturing education. Manuf. Lett. 2025, 46, 107–110. [Google Scholar] [CrossRef] [Scilit]
- Koçulu, A. Preparing Future Science Teachers to Build a Sustainable World: Supporting Pre-Service Science Teachers’Competencies in Instructional Planning for Teaching the Sustainable Development Goals (SDGs) in K-12 Classrooms. Sustainability 2025, 17, 10427. [Google Scholar] [CrossRef] [Scilit]
- Mahima, K.; Micheal, J.; Benjamin, H.; Borda, A. Expanding Formal School Curricula to Foster Action Competence in Sustainable Development: A Proposed Free-Choice Project-Based Learning Curriculum. Sustainability 2022, 14, 16315. [Google Scholar] [CrossRef] [Scilit]
- Fernando, R.R.A.; Tajan, P.G. Education for sustainable development (ESD)through participatory research (PR): A systematic review. J. Clean. Prod. 2024, 482, 144237. [Google Scholar] [CrossRef] [Scilit]
- Beynaghi, A.; Trencher, G.; Moztarzadeh, F.; Mozafari, M.; Maknoon, R.; Filho, W.L. Future sustainability scenarios for universities: Moving beyond the United Na- tions Decade of Education for Sustainable Development. J. Clean. Prod. 2016, 112, 3464–3478. [Google Scholar] [CrossRef] [Scilit]
- Manteaw, O.O. Education for sustainable development in Africa: The search for pedagogical logic. Int. J. Educ. Dev. 2012, 32, 376–383. [Google Scholar] [CrossRef] [Scilit]
- Kopnina, H. Education for sustainable development (ESD) as if environment really mattered. Environ. Dev. 2014, 12, 37–46. [Google Scholar] [CrossRef] [Scilit]
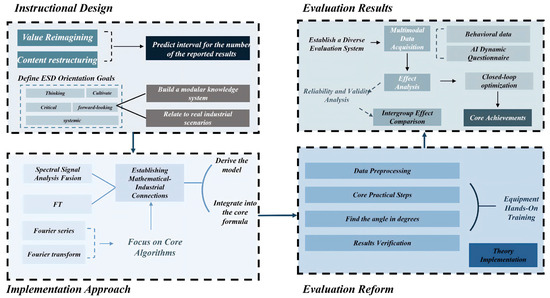
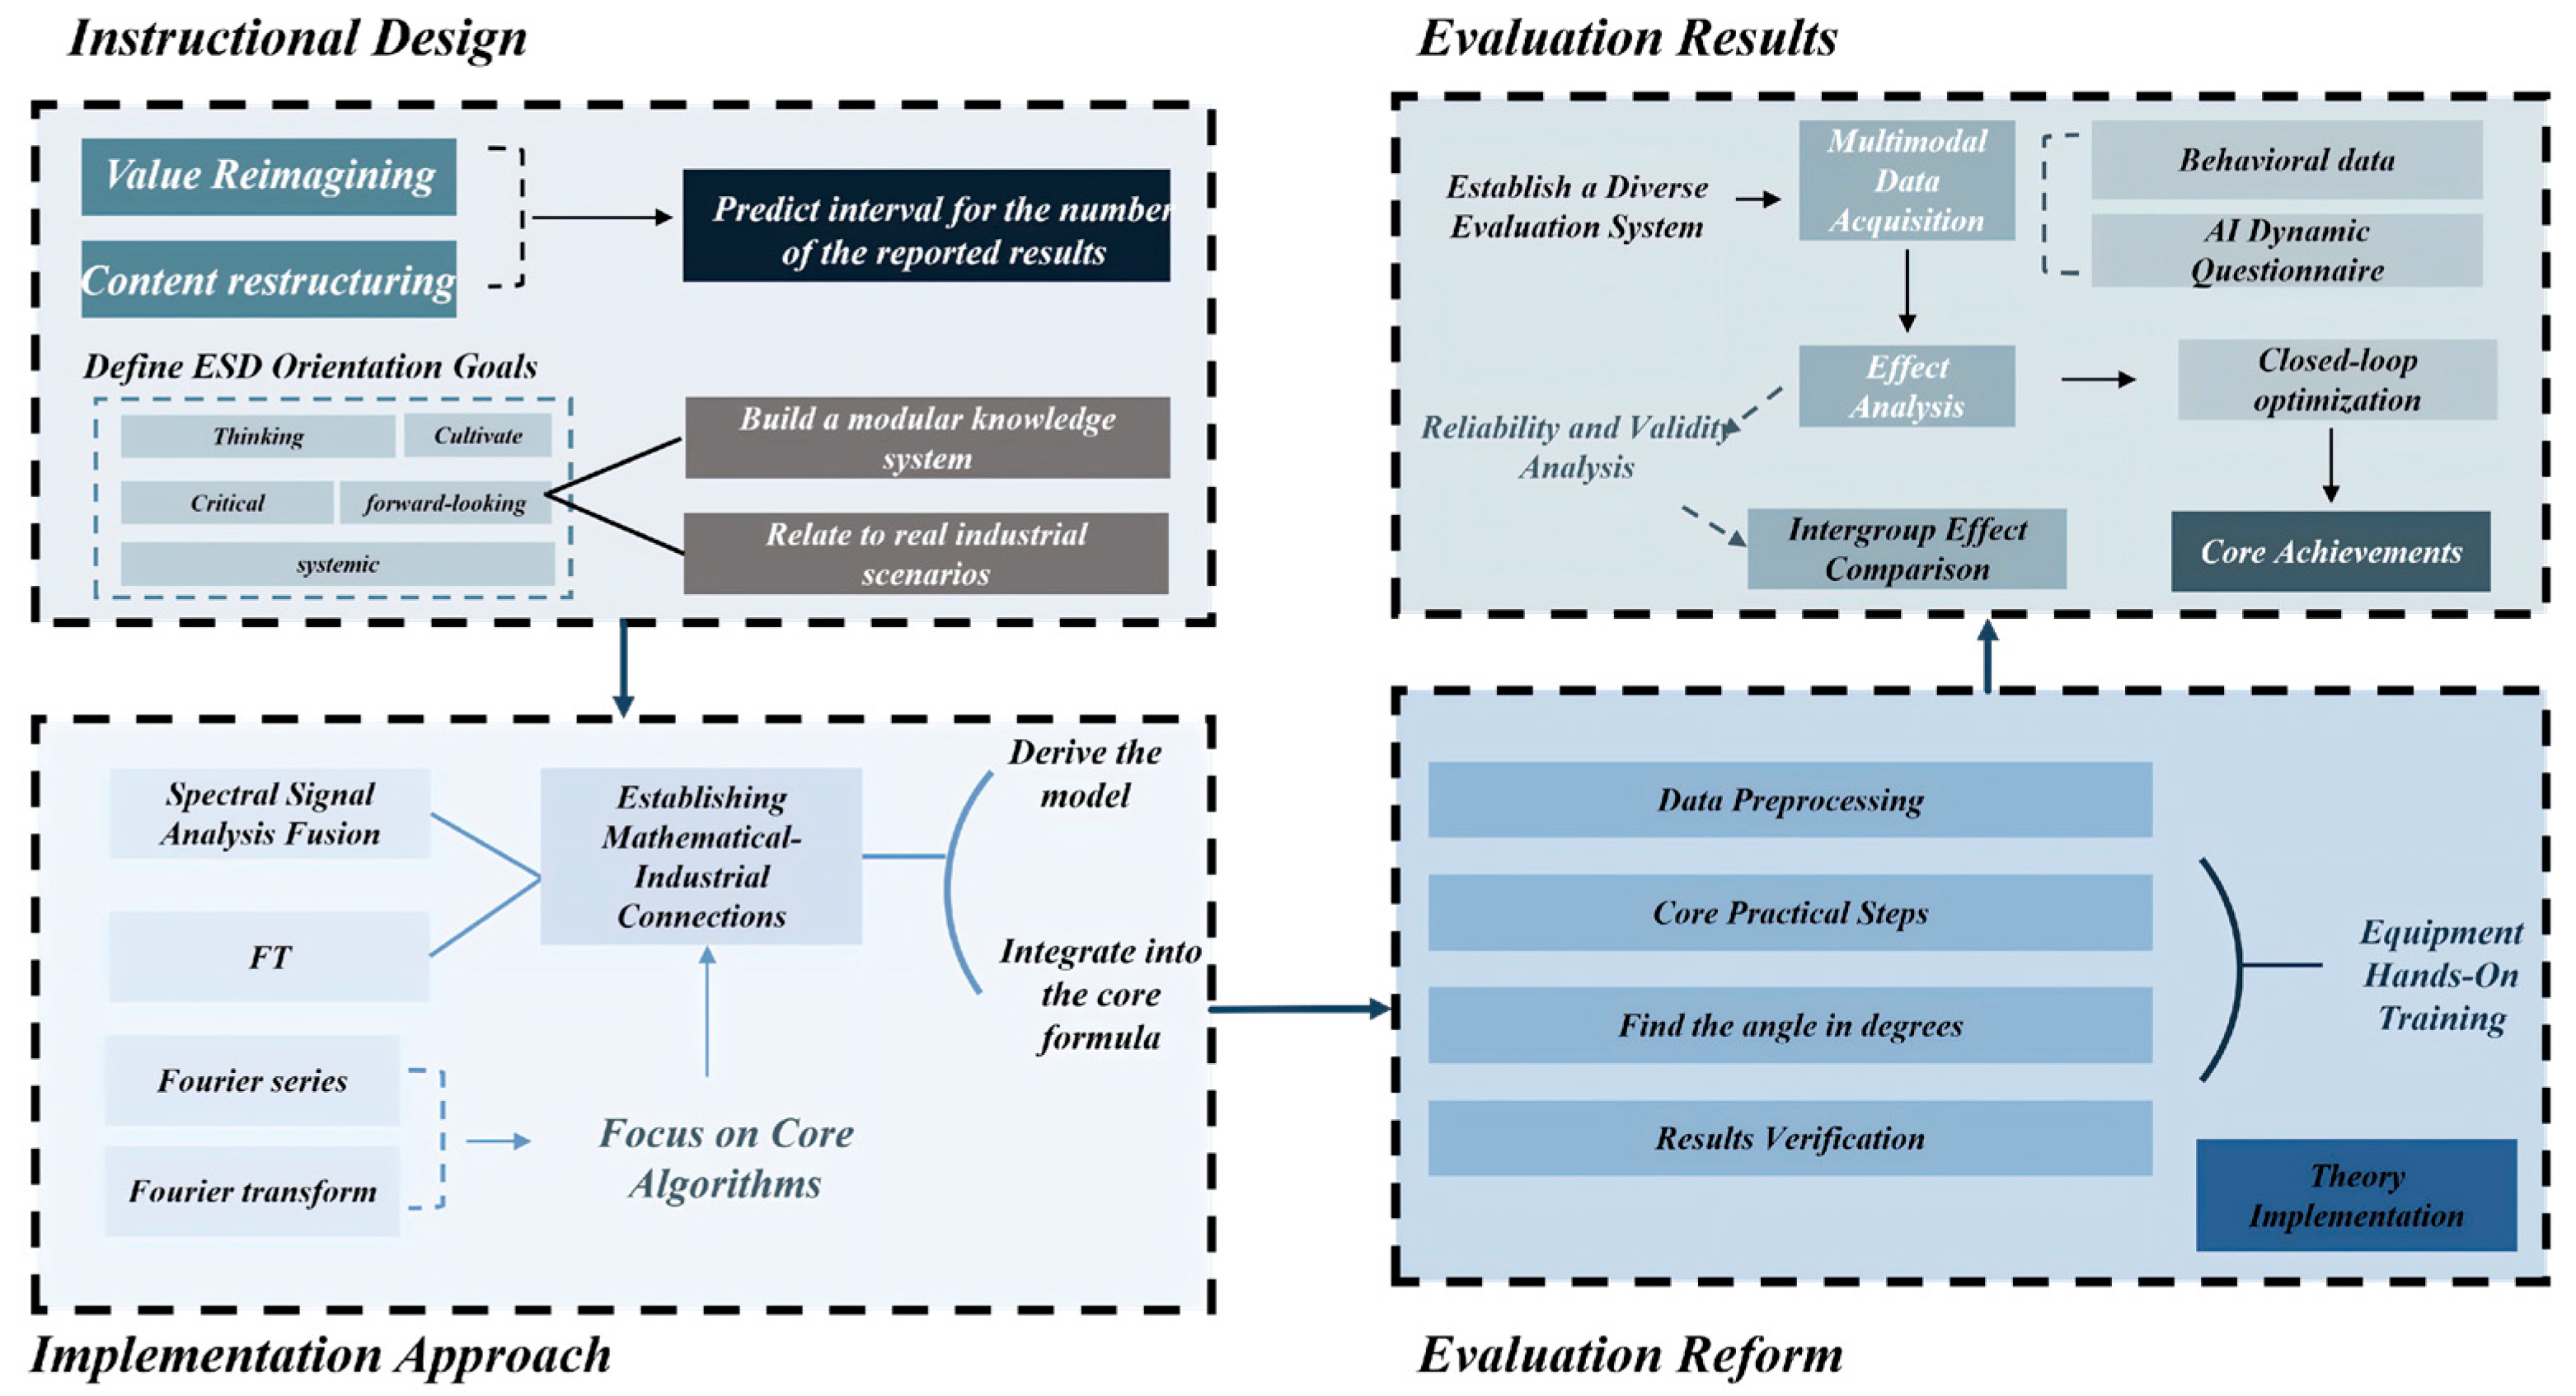
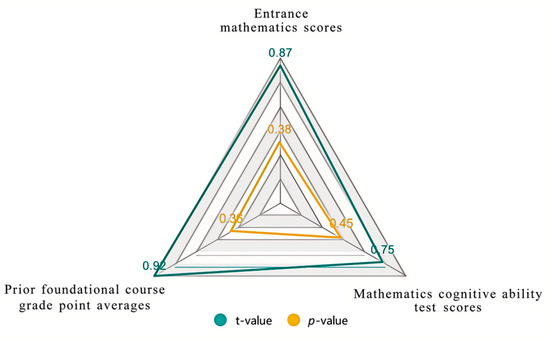
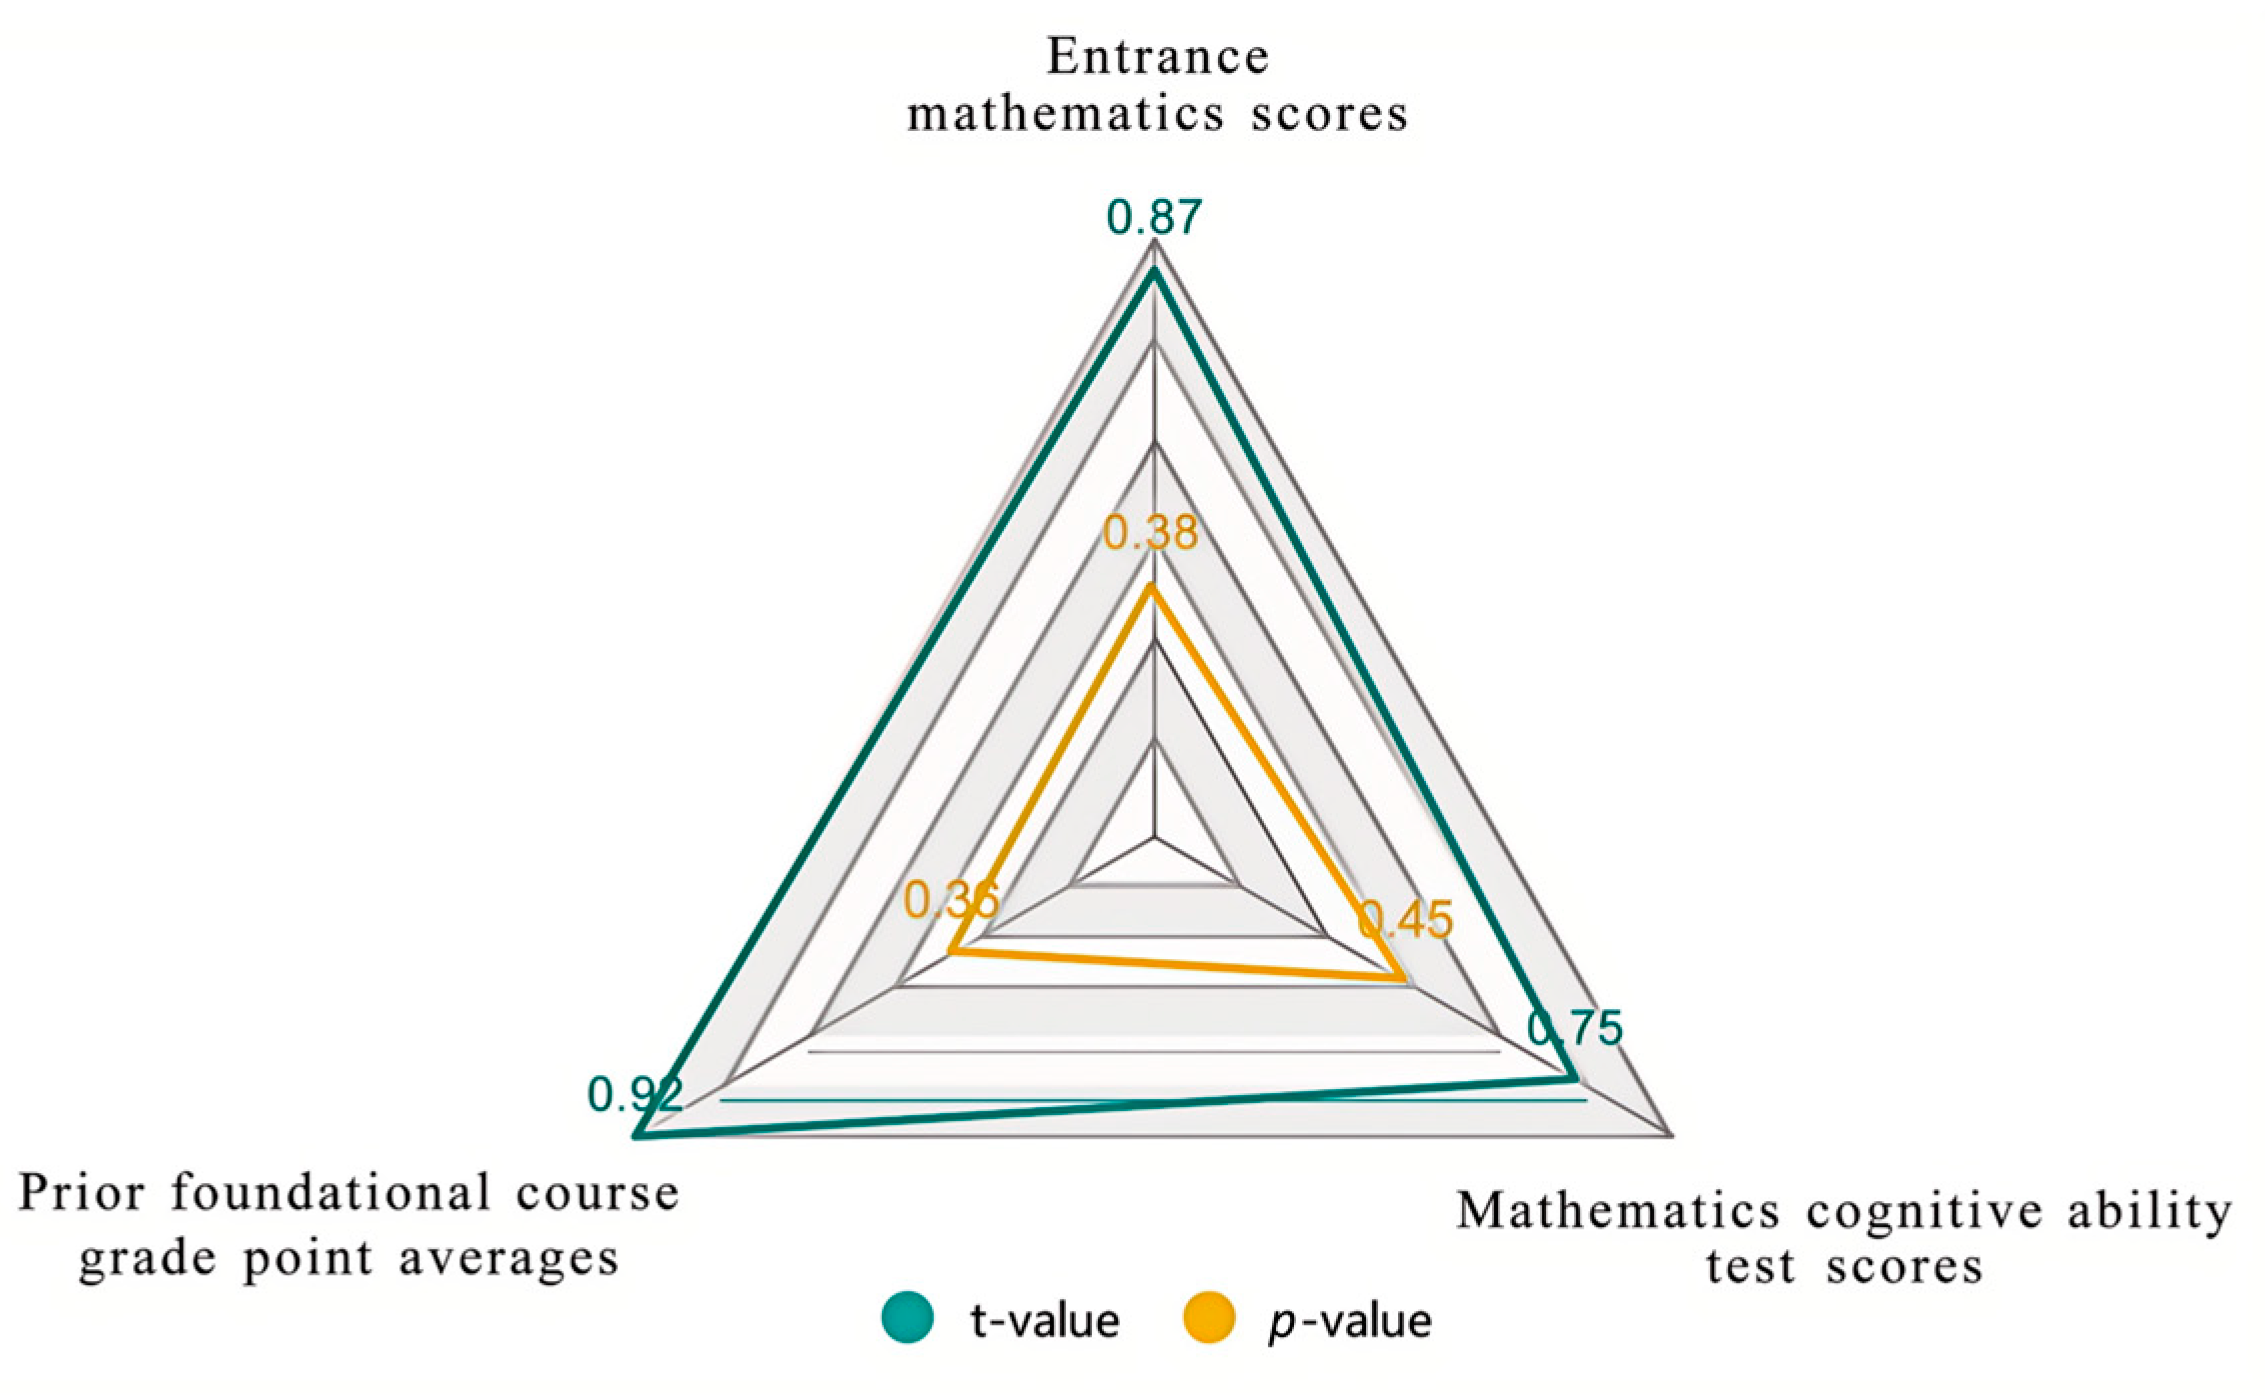
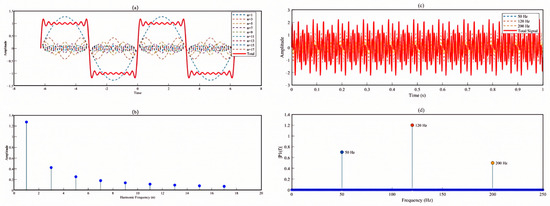
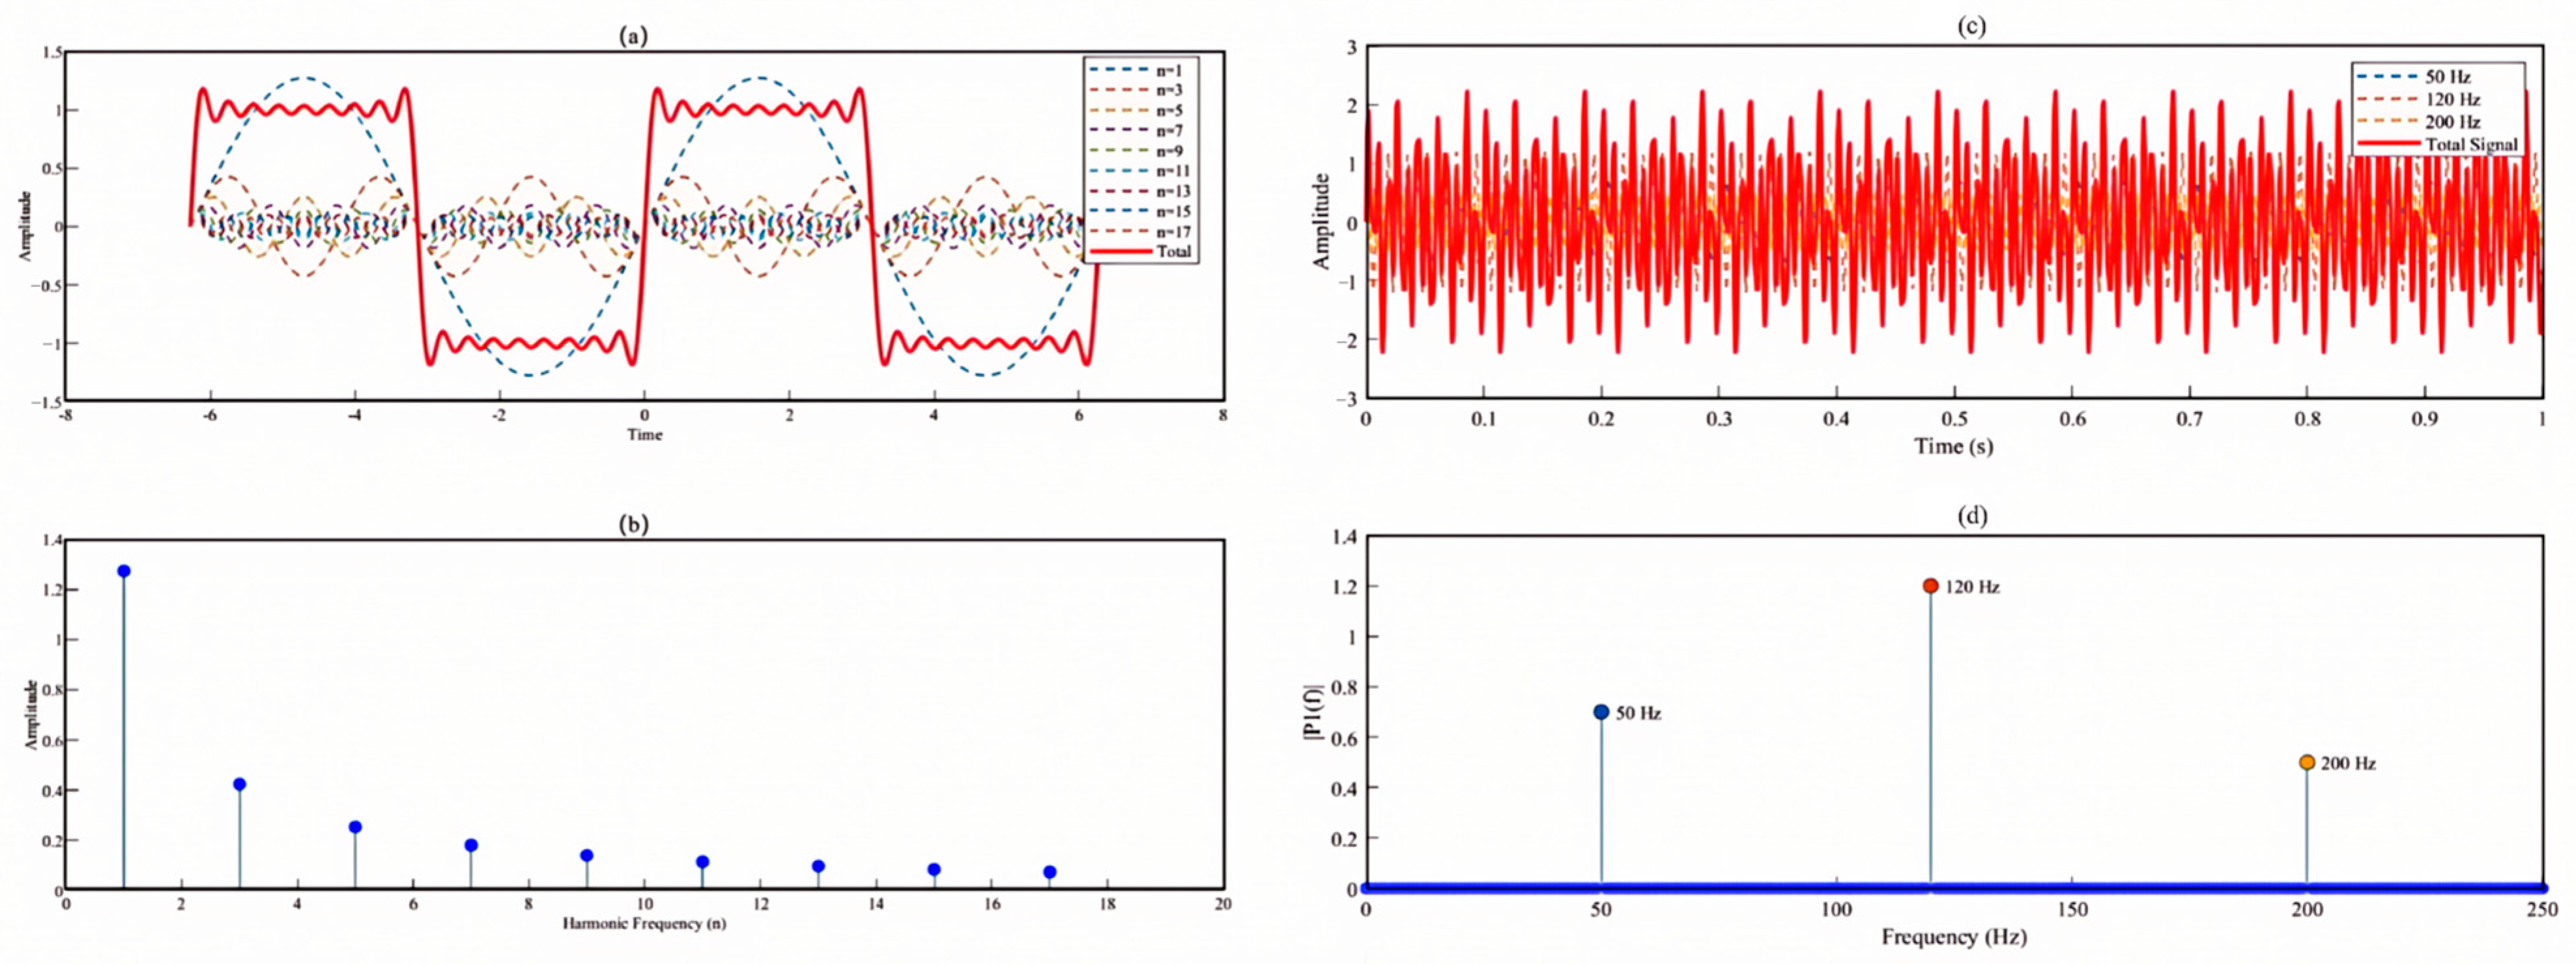
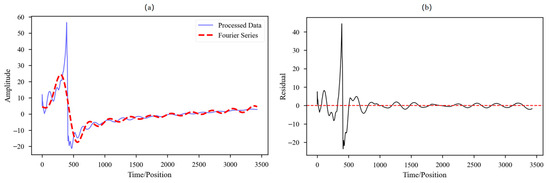
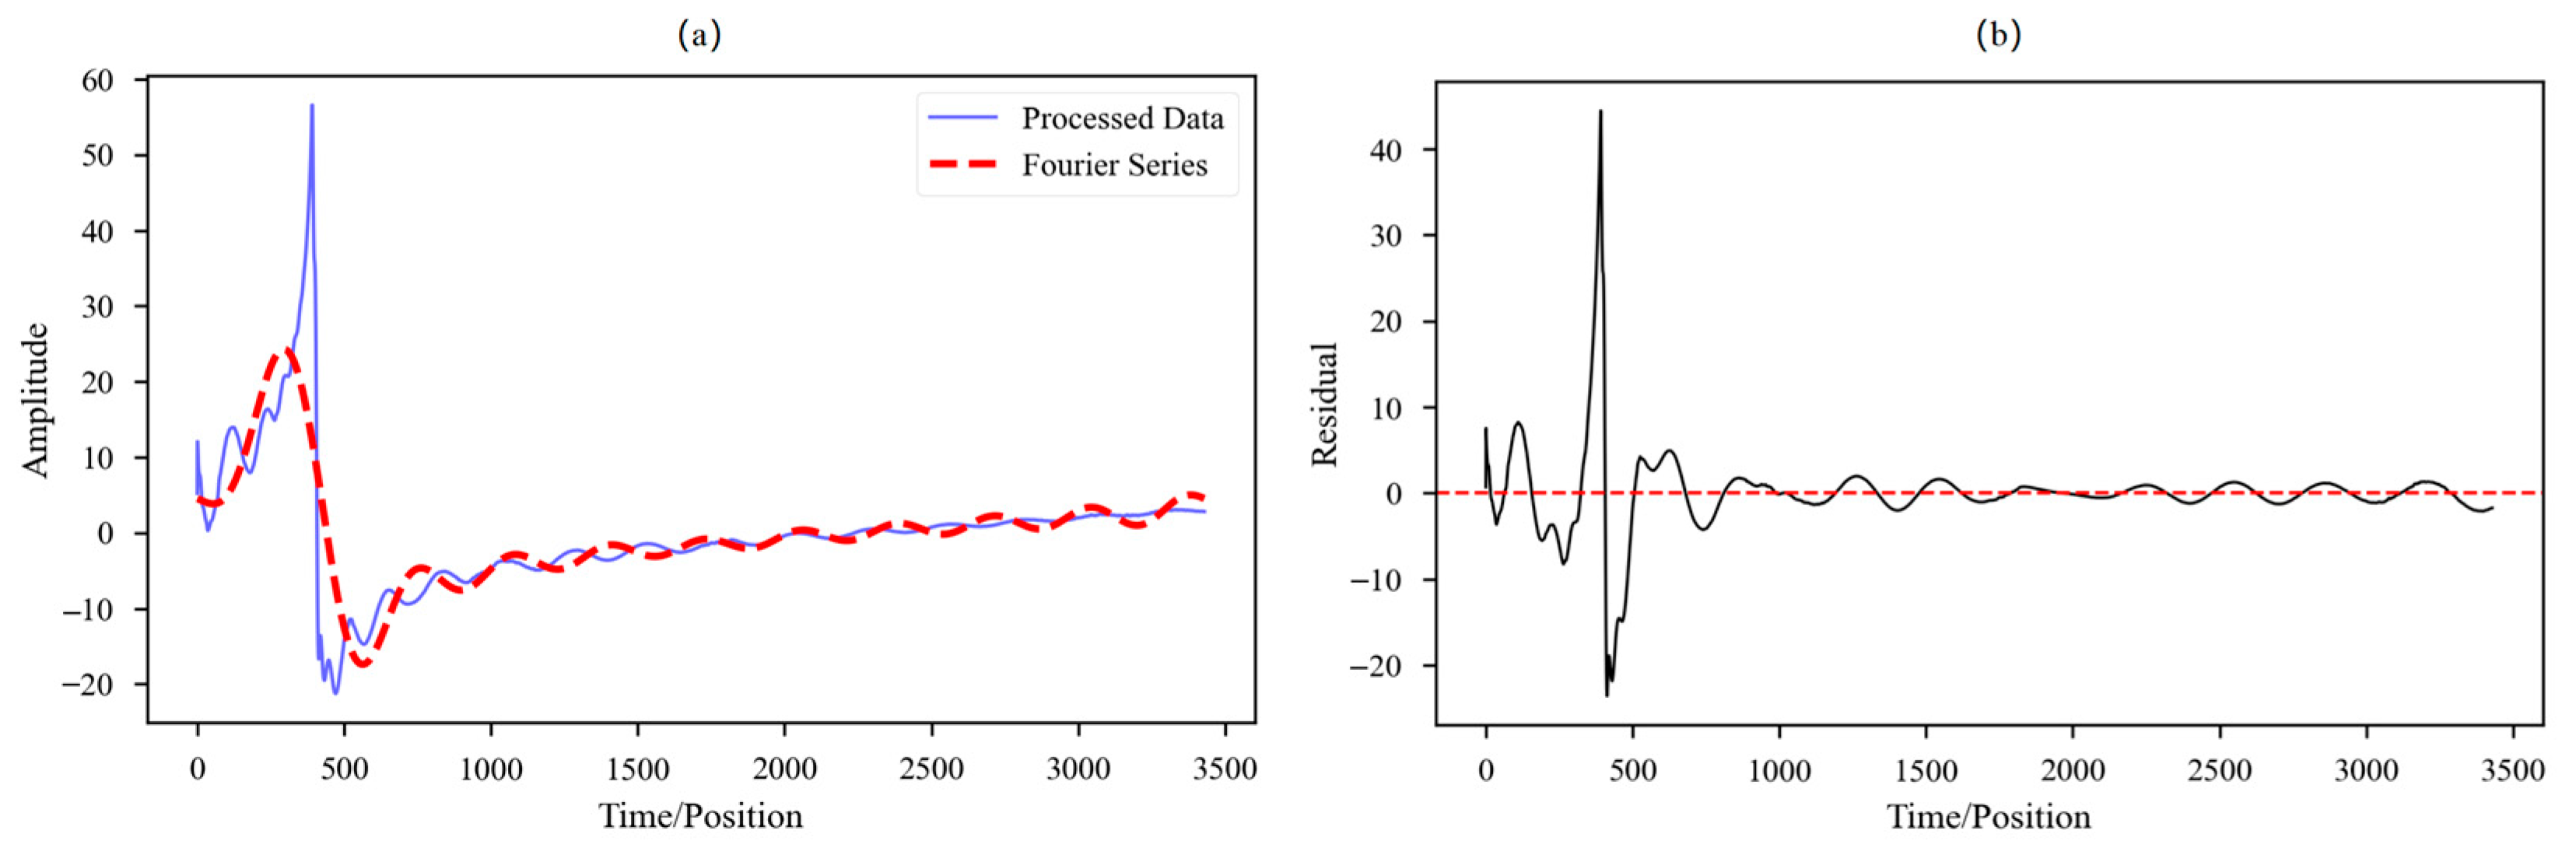
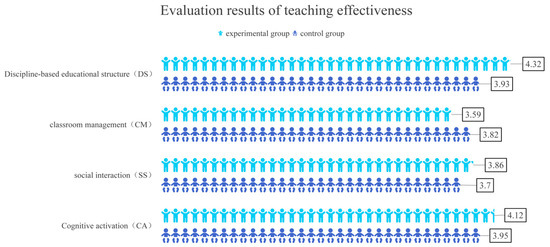
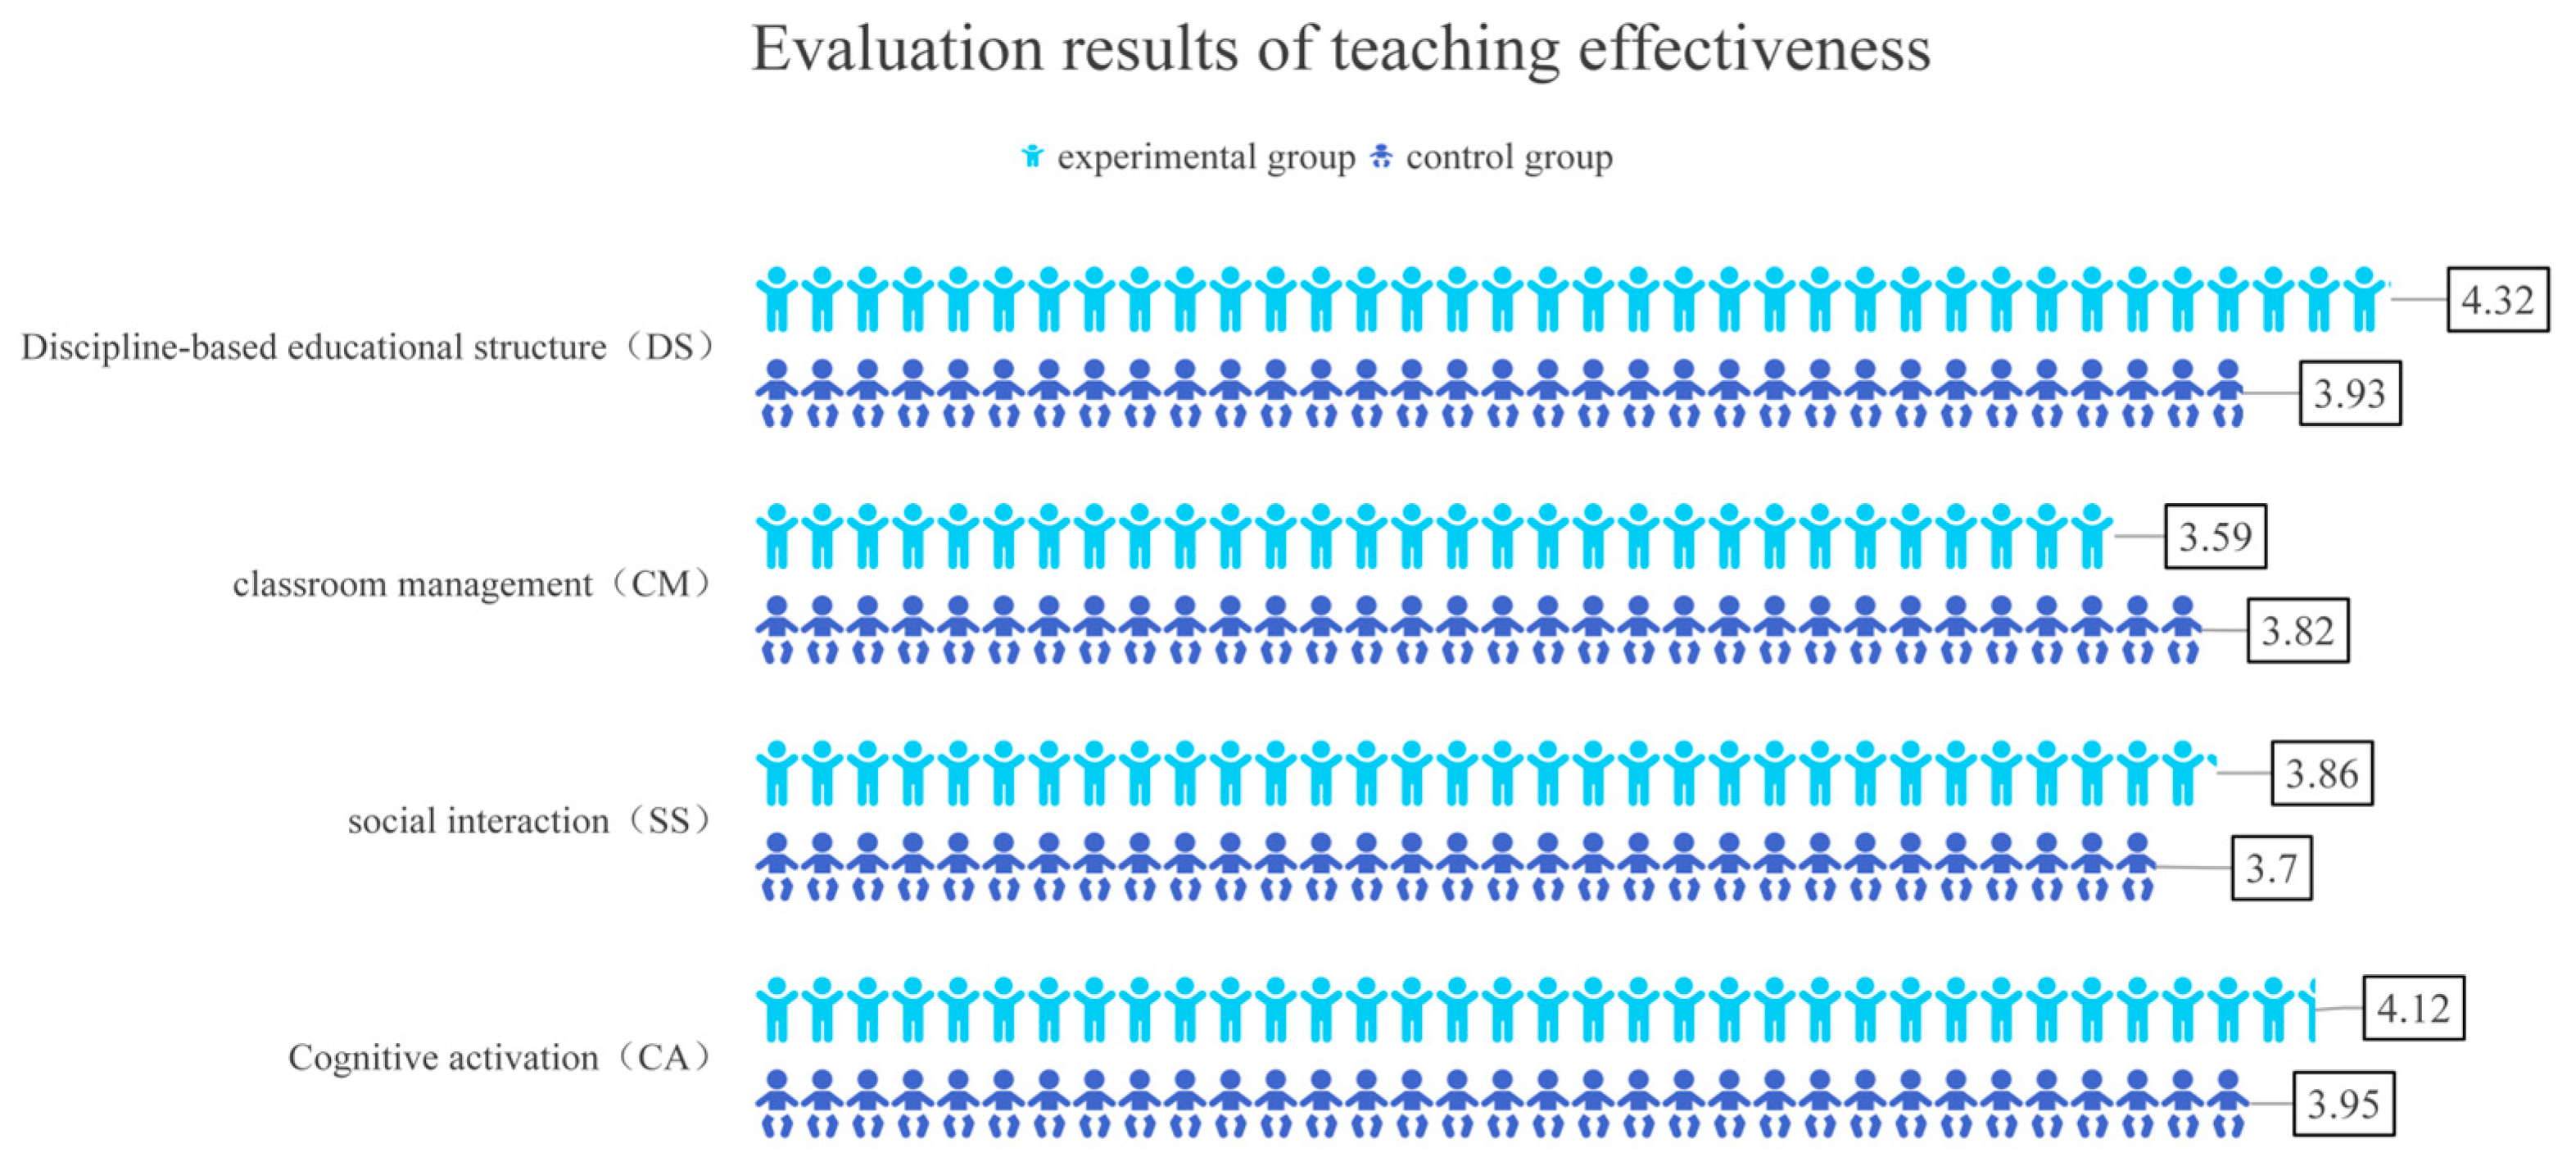
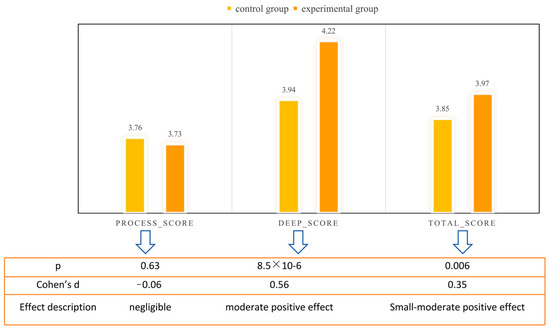
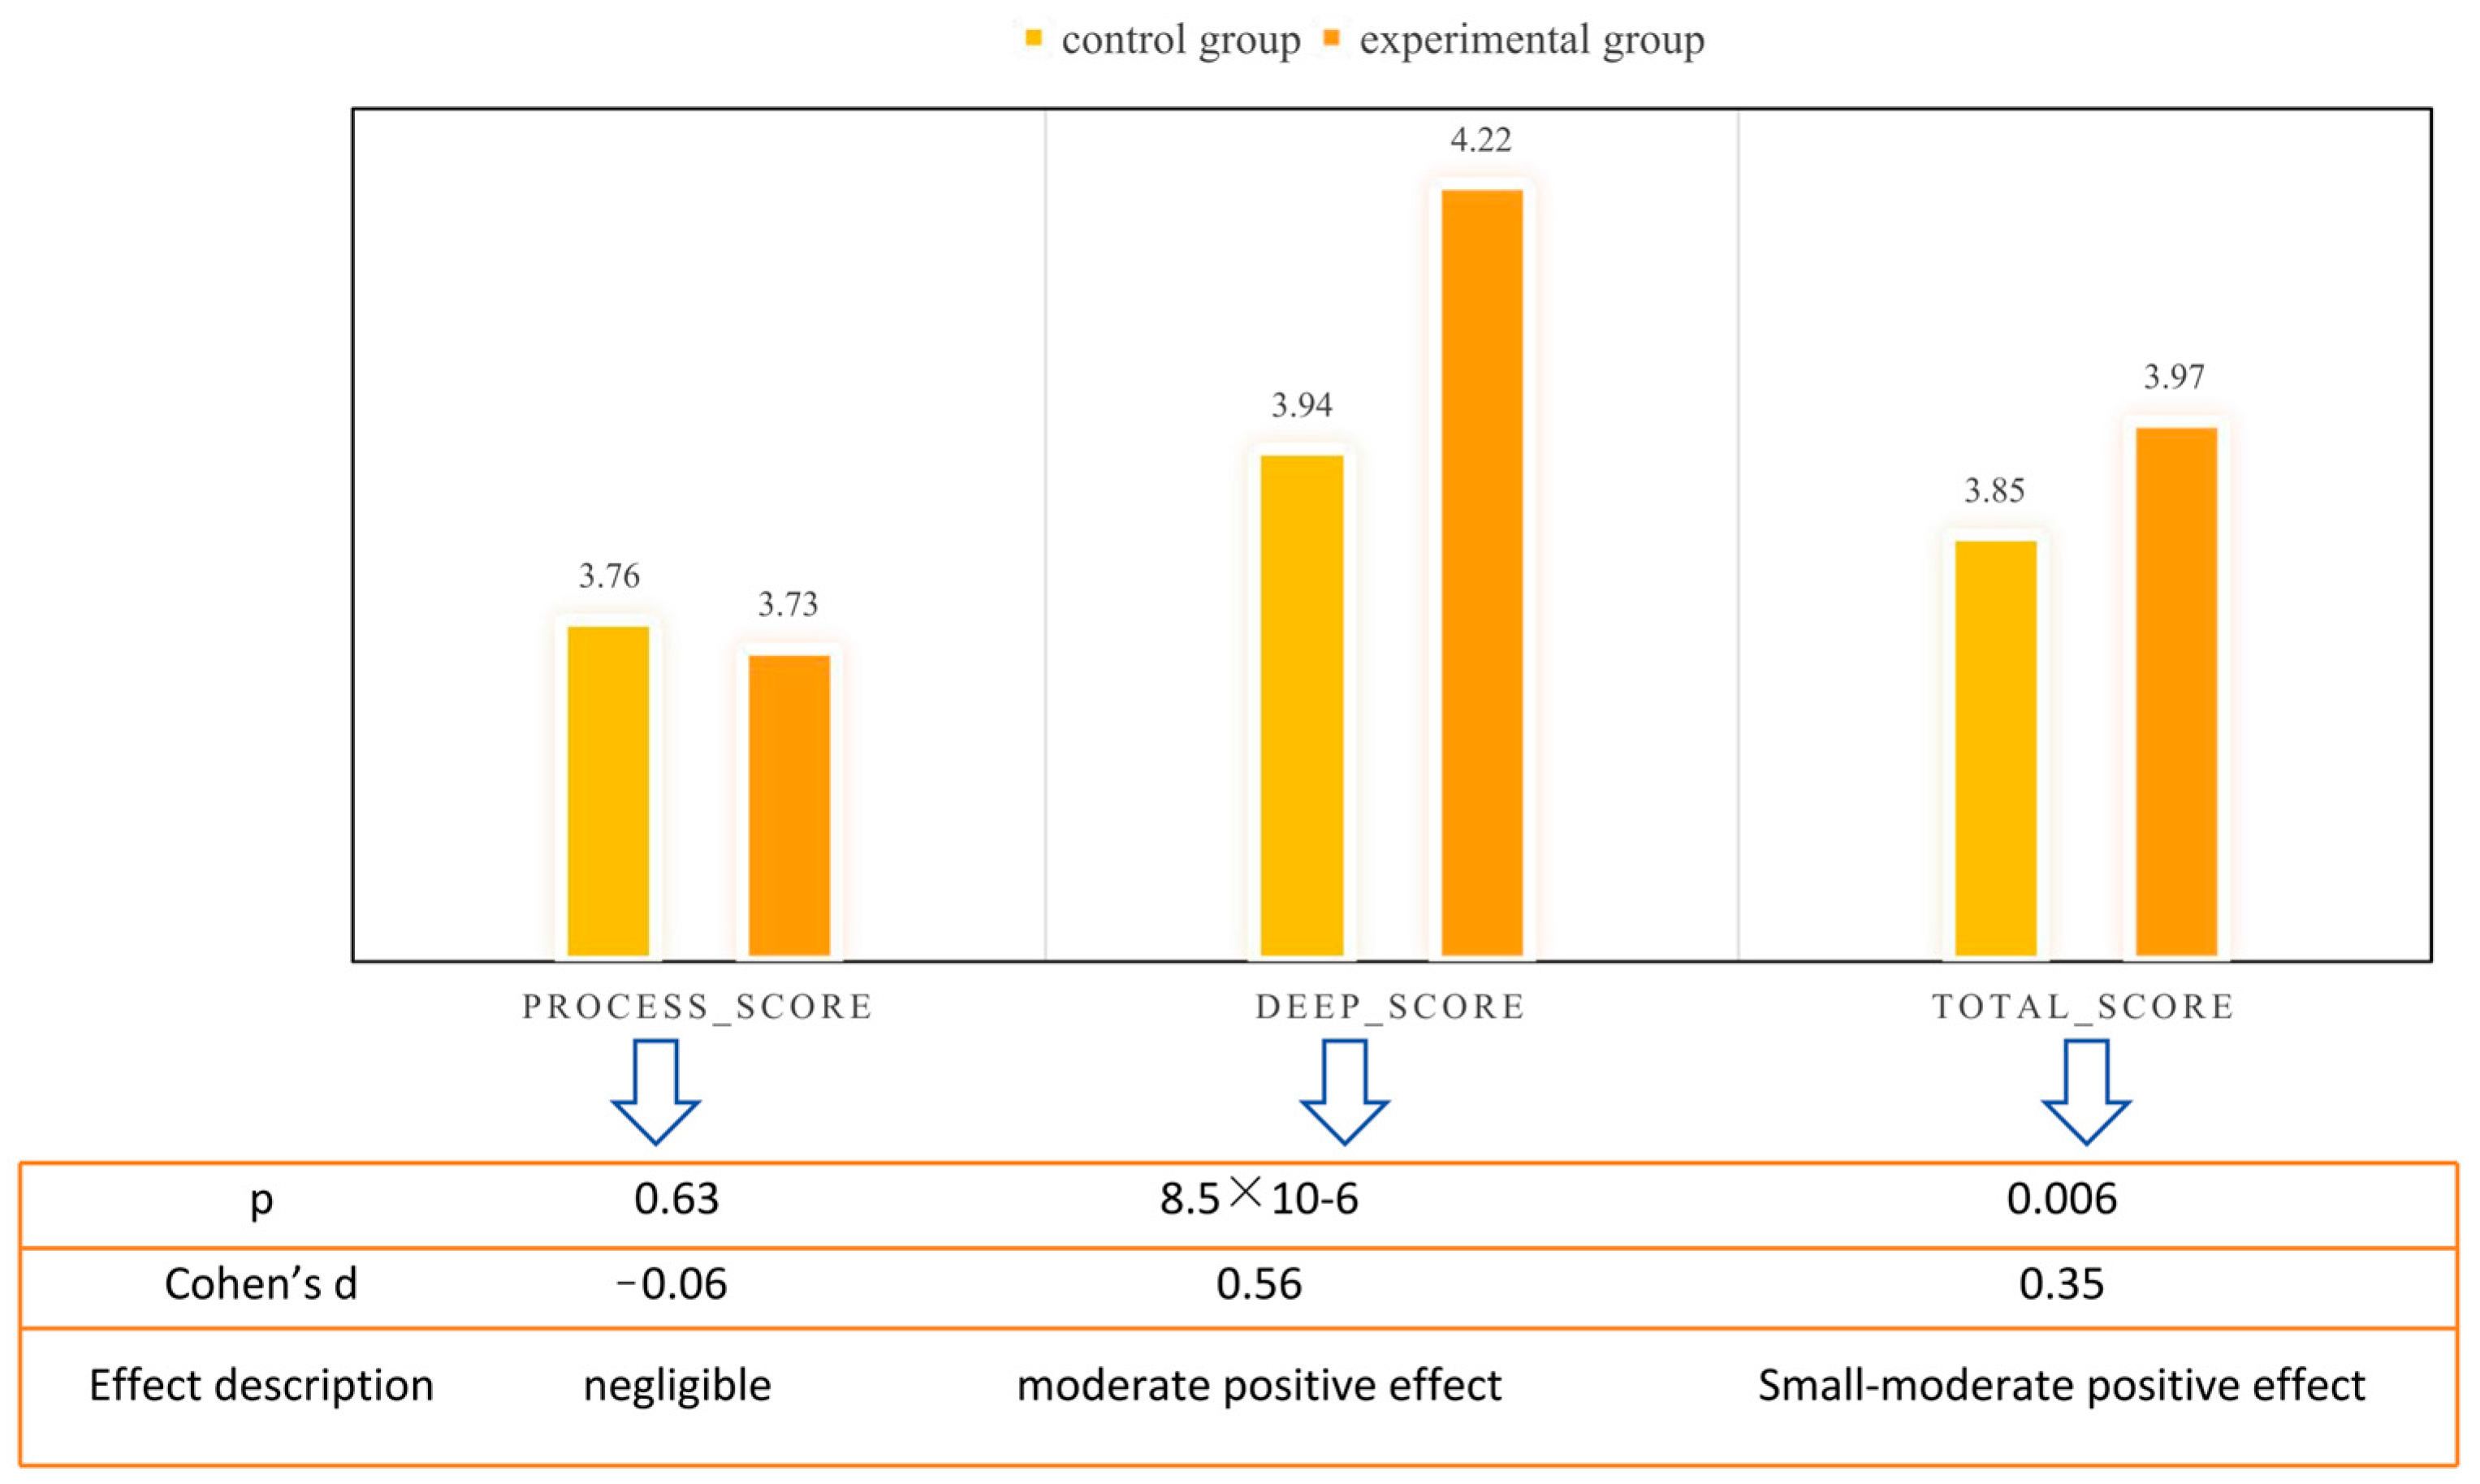
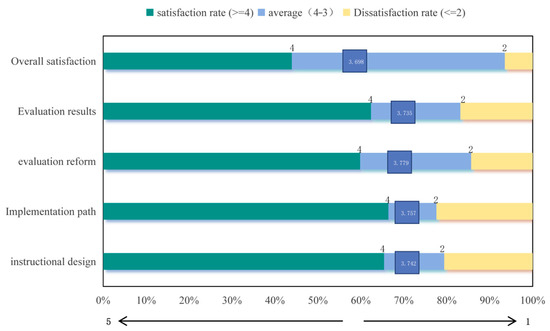
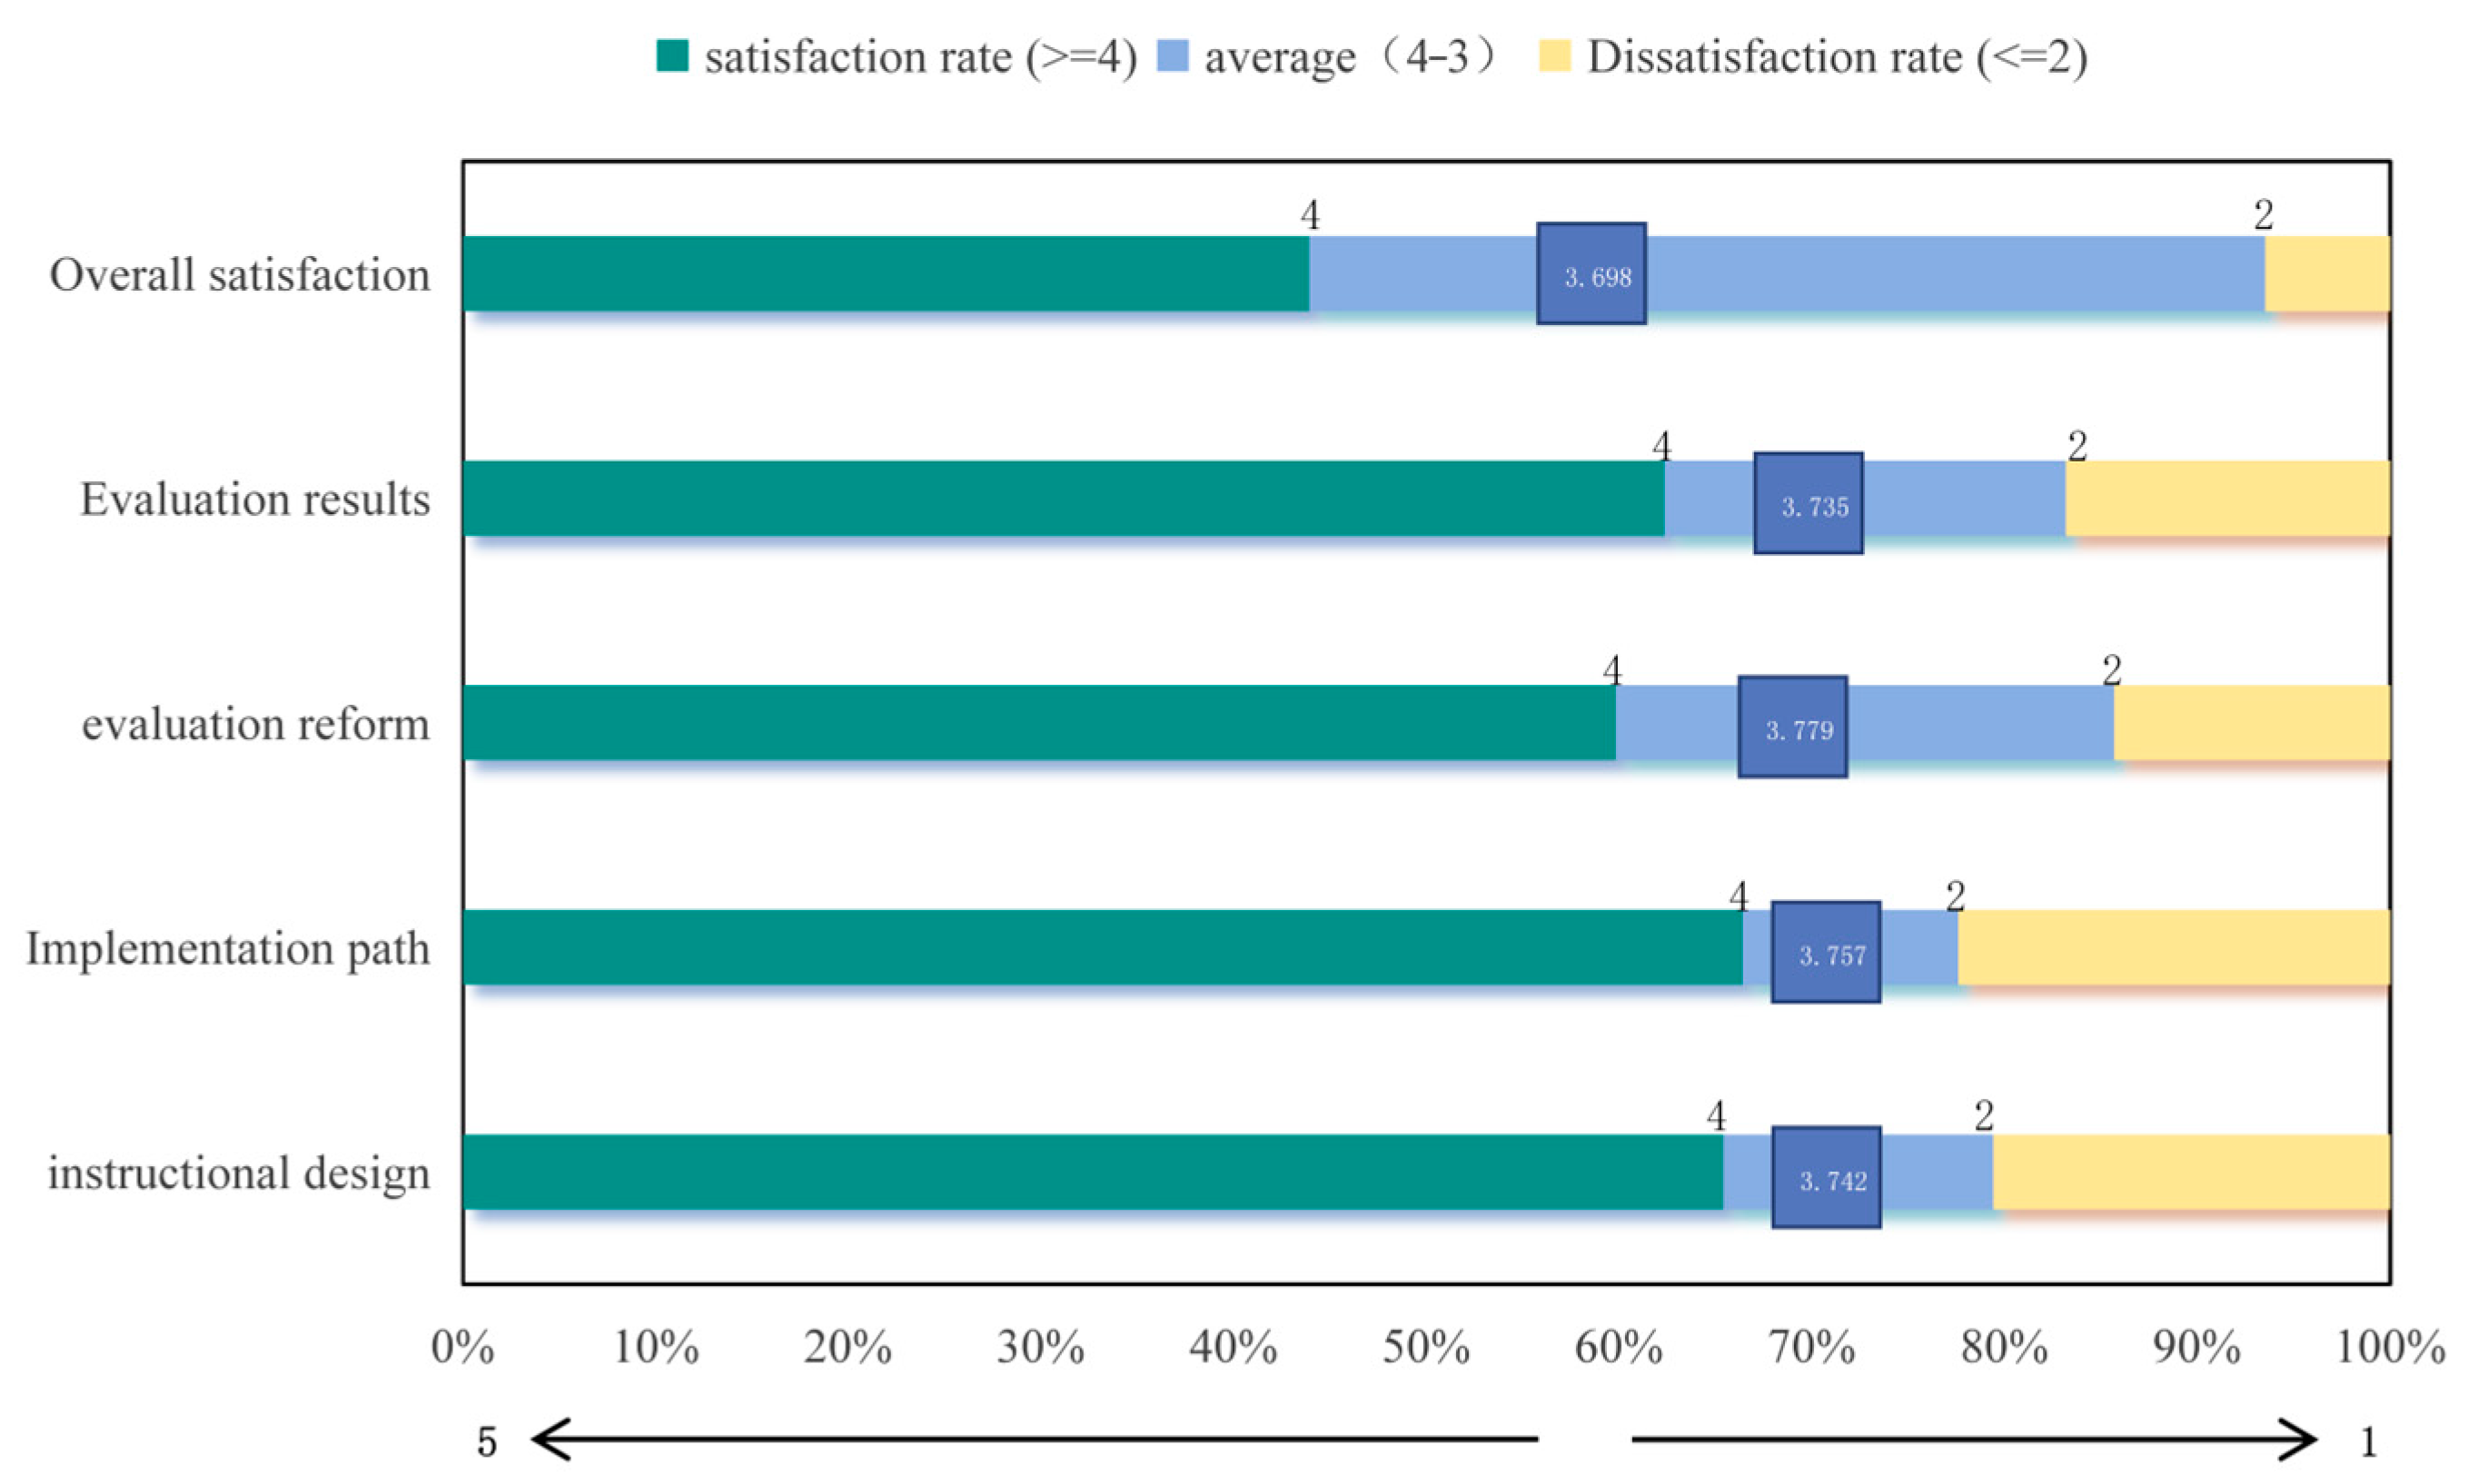
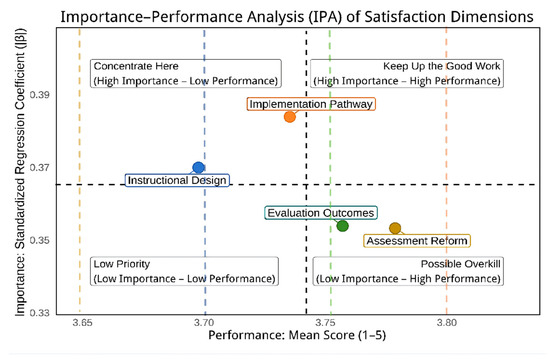
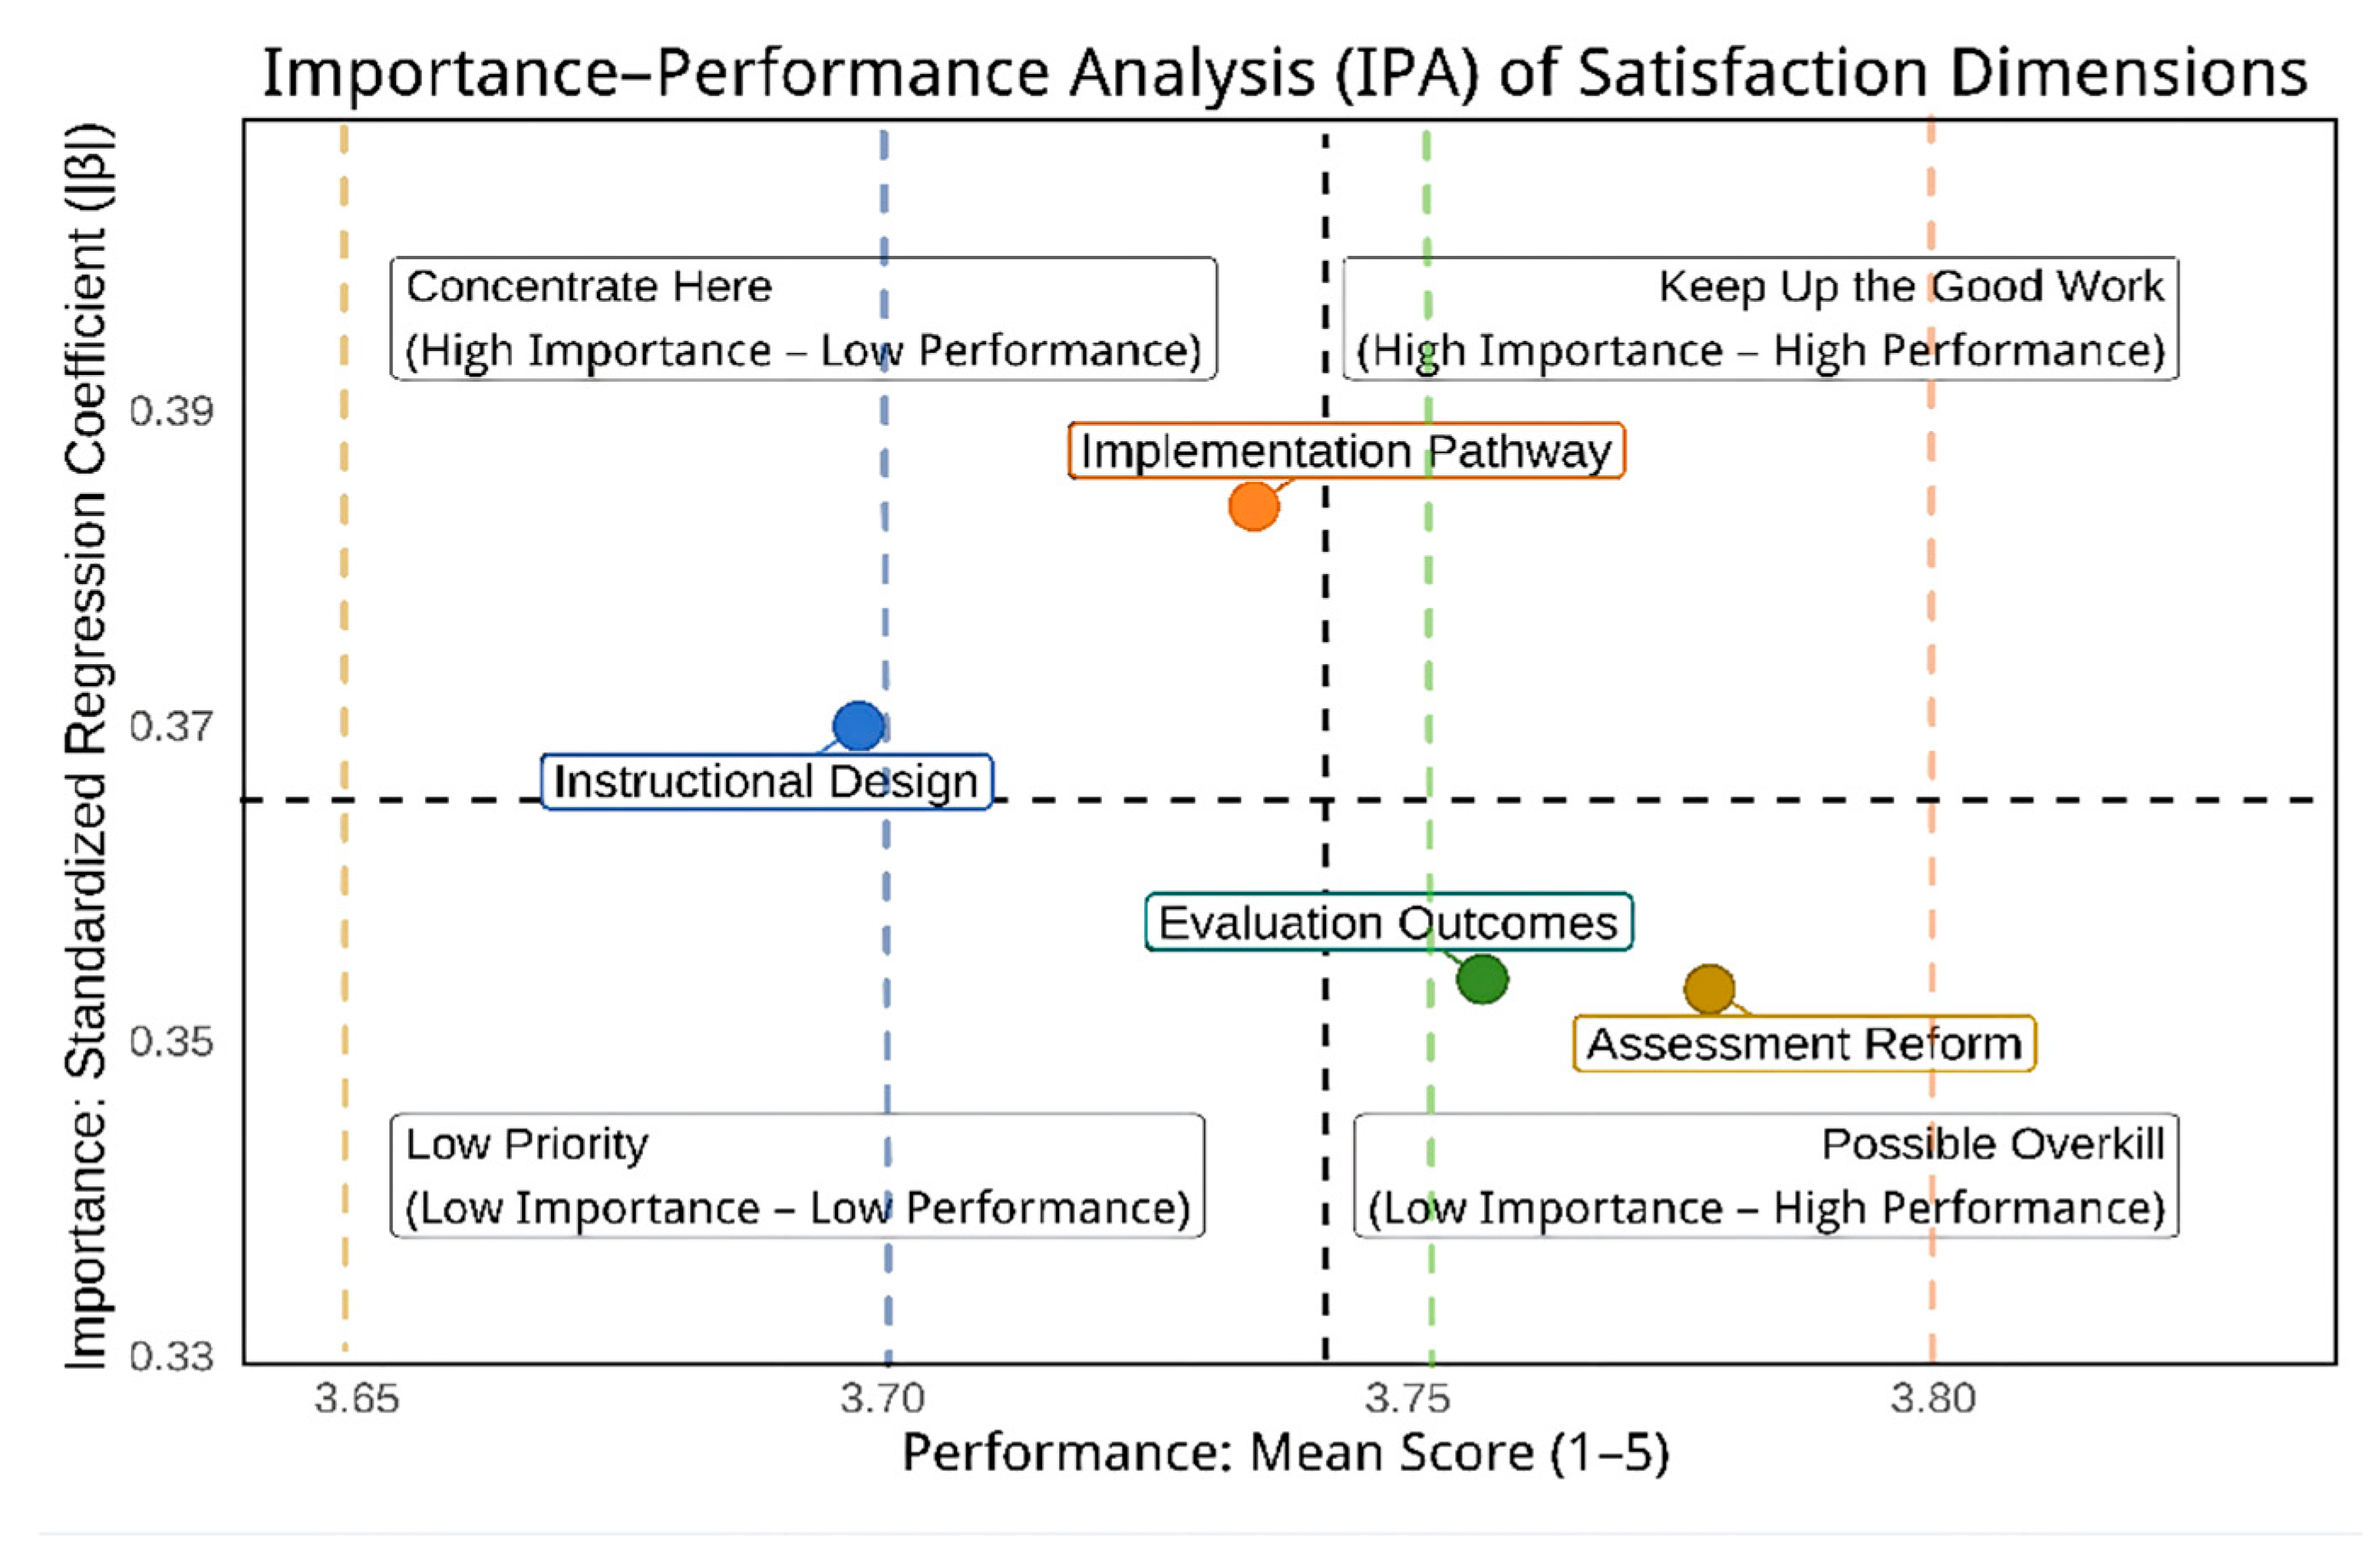

Disclaimer/Publisher’s Note: The statements, opinions and data contained in all publications are solely those of the individual author(s) and contributor(s) and not of MDPI and/or the editor(s). MDPI and/or the editor(s) disclaim responsibility for any injury to people or property resulting from any ideas, methods, instructions or products referred to in the content. |
© 2026 by the authors. Licensee MDPI, Basel, Switzerland. This article is an open access article distributed under the terms and conditions of the Creative Commons Attribution (CC BY) license.