


Abstract
The long-term inclusion of migrant-background youth can be framed, following the social-sustainability literature, as part of the social pillar of sustainability and of the Sustainable Development Goals on inclusive quality education (SDG 4) and reduced inequalities (SDG 10), yet the relational resources surrounding these young people have rarely been modelled at the individual level over more than a few years. This theory-guided descriptive study fits multilevel linear growth models to the 12 released waves (waves 1–10, 12, and 14; 2011–2024) of the first-cohort Multicultural Adolescents Panel Study of the Korean National Youth Policy Institute, following 1635 children of multicultural families from the fourth grade of elementary school in 2011, of whom 892 (54.6%) provided a valid composite at the final released wave; model-specific person-wave observations range from 6593 to 12,237. Six constructs are modelled as seven measurement series, because the self-esteem instrument was replaced in 2017 with no overlap wave; each series is analysed strictly within its own window: perceived peer support, teacher support, and acculturative stress from late elementary school to the final year of middle school (2011–2016); bicultural acceptance and family support from late elementary school to the final year of high school (2011–2019); and self-esteem as two separate series (2011–2016; 2017–2024). Across late elementary and middle school, perceived peer and teacher support rose—peer support fastest, with growth concentrated before the middle-school years and a reversal in the final middle-school year—while acculturative stress declined. Family support, observed through the end of high school, showed no robust directional change, and an equivalence test bounds any change below the magnitude of the acculturative-stress decline, the smallest trend interpreted substantively. Individuals differed reliably in their rates of change on every construct, and bivariate latent growth models show that those rates covaried within persons: young people with larger estimated gains in school-based support also tended to show larger gains in self-esteem and larger decreases in acculturative stress. The between-person spread of perceived school-based support narrowed across waves, although regression to the mean cautions against a strong compensatory reading. The direction of every trend was unchanged under person fixed effects and inverse-probability-of-retention weighting, and re-estimation from the item subset common to all waves yielded larger, not smaller, school-based support increases; a reliability audit established that the post-2017 self-esteem instrument requires reverse-scoring of its four negatively worded items; under the released, unreversed scoring, the resulting composite has effectively no internal consistency. The design is observational and no causal inference is warranted, but the results give an individual-level baseline, bounded by each construct’s measurement window, for monitoring the relational resources of migrant-background youth as a candidate social-sustainability indicator under SDG 4 and SDG 10, a possible application rather than a validated indicator framework.
1. Introduction
1.1. Migrant-Background Youth as a Sustainability Question
The population of migrant-background (in Korean policy usage, “multicultural”) youth in the Republic of Korea has continued to grow even as the overall school-age population declines, reaching 202,208 students, or 4.0% of all students enrolled in elementary, middle, and high schools, in the 2025 national Basic Education Statistics [1]. The Fourth Basic Plan for Multicultural Family Policy (2023–2027) places the identity development of second-generation adolescents, and the strengthening of their school and community relationships, among its policy tasks [2]. The cohort that entered Korean elementary schools in the early 2010s is now entering adulthood, and whether that transition reproduces or attenuates disadvantage is a question about whether the receiving society sustains inclusion over time rather than about any single programme.
Framed this way, the issue belongs to sustainability and not only to education policy. The 2030 Agenda commits signatory states to inclusive and equitable quality education (SDG 4) and to reducing inequalities within countries, including those of origin and migration status (SDG 10), and states that these commitments extend to migrants [3]. The constructs studied here map onto these commitments directly: perceived peer and teacher support operationalise the school belonging that SDG 4’s inclusive-education target presupposes [4], and the distribution of those resources across individuals speaks to SDG 10’s concern with within-country inequality. The UNESCO Global Education Monitoring Report on migration and displacement documents how school systems mediate whether migration produces inclusion or entrenched disadvantage [5], and comparative PISA evidence shows that the well-being of students with an immigrant background depends substantially on their sense of belonging at school rather than on academic preparation alone [4].
These commitments engage the social pillar of sustainability, the least theorised of the three. Vallance and colleagues distinguish development social sustainability (meeting basic needs), bridge social sustainability (changing behaviour toward environmental goals), and maintenance social sustainability—the preservation of the socio-cultural relationships that allow for a community to persist through change [6]. Dempsey and colleagues identify social equity and the sustainability of community—interaction, participation, and a sense of belonging—as the two principal components of the social dimension of sustainable development [7], and Eizenberg and Jabareen place equity, safety, and forms that support solidarity at the centre of their conceptual framework [8]. Boström’s assessment notes that the social pillar remains conceptually thin and empirically underserved relative to the other two, and calls for concrete empirical accounts of how social relationships are sustained or eroded over time [9].
The link to the present study is analytical rather than merely rhetorical. If maintenance social sustainability consists in the persistence of relationships through demographic change [6,7], then three properties of the relational resources of migrant-background young people are measurable and jointly informative: whether those resources grow or erode over time; whether their growth is shared across the population or concentrated in some individuals while others fall behind; and whether the school-based and family-based components move together or diverge. Each is a quantity that a long panel can estimate, and each maps onto a distinct policy question—respectively, whether perceived relational support increased, whether its distribution narrowed or widened, and which relational context the observed change is associated with. These three quantities were specified from this literature before the data were inspected, and Section 5.2 assesses the results against each.
The research gap has three parts. What is known: Comparative evidence establishes that belonging and relational support condition the well-being of immigrant-background students [4,5], and the developmental literature establishes that the relative weight of peer and family relationships is reorganised across adolescence [10,11]. What is insufficiently investigated: Whether the relational resources of migrant-background youth grow or erode over many years, whether individuals differ in those rates, and whether relational and psychosocial change covary within persons—questions that require individual-level growth modelling of a long panel, which the existing Korean literature, reviewed in Section 2.4, has addressed only construct by construct over sub-windows. What this study adds: A joint individual-level growth account of six psychosocial and relational constructs over the longest windows the panel’s instruments permit, with the panel’s measurement history treated as an object of analysis. To our knowledge, it is the first MAPS-based study to estimate the covariation of individual growth rates across these constructs jointly, the first to document the reverse-scoring requirement of the post-2017 self-esteem instrument, and the first to test the school-based against the family-based support trajectories formally. Within this journal, research on migrant-background students has concentrated on interventions and on the perspectives of educators: an umbrella review of school-based interventions for migrant students within a health-promoting whole-school approach synthesises programme evidence [12], and a qualitative study examines teachers’ perceptions of immigrant students and families [13]. What is missing is a long-run, individual-level account of the relational resources themselves, measured on the young people rather than on the programmes or the professionals.
1.2. The Korean Context
Three features of the Korean case bear directly on the design and its interpretation. First, “multicultural family” (damunhwa gajeong) is a legal-administrative category defined chiefly by marriage between a Korean national and a foreign national. In the years relevant to this cohort, the modal family form was a Korean father and a foreign-born mother, most often from China, Vietnam, the Philippines, or Japan, a composition documented in the official statistics underlying the Basic Plans for Multicultural Family Policy [2] and reflected in the MAPS sampling frame [14]. The young people studied here are therefore in the large majority Korean citizens, born and schooled in Korea; their migrant background derives from a parent rather than from their own migration. This distinguishes the Korean case from settings where the comparable population consists mainly of first-generation immigrant students, and it means that legal status and, for most, language of instruction are less often the binding constraints than in first-generation immigrant settings; identity, belonging, and social treatment move to the foreground.
Second, the Korean school system is a single national structure of six years of elementary school, three of middle school, and three of high school, with entry at age six. The cohort studied here entered the fourth grade in 2011, completed elementary school in 2013, attended middle school in 2014–2016, attended high school in 2017–2019, and would ordinarily have graduated from high school in February 2020. The measurement window 2011–2016 therefore covers late elementary school and the whole of middle school, and the window 2011–2019 extends to the final year of high school. Class assignment is centrally administered, and the homeroom teacher (damim seonsaengnim) is responsible for a fixed class group throughout each school year, with classes and homeroom teachers reassigned annually, so “teacher support” in this setting denotes a relationship with an identifiable individual rather than a diffuse impression of school staff. Peer groups are likewise structured by a stable class unit during the elementary years.
Third, national policy for this population has been organised through successive five-year Basic Plans for Multicultural Family Policy, now in a fourth cycle [2], alongside annual multicultural education support plans of the Ministry of Education. The policy vocabulary shifted across the study window from an early emphasis on adaptation and Korean-language acquisition toward bicultural competence and social participation, which is one reason a long individual-level series covering the whole period is of policy interest. These policy developments are contextual background only; no policy variable enters the analysis.
1.3. The Present Study
This study uses the 12 released waves (2011–2024) of the first-cohort adolescent panel of the Multicultural Adolescents Panel Study (MAPS) of the National Youth Policy Institute (NYPI) to address four questions. RQ1: What average rate of change do global self-esteem, bicultural acceptance attitude, and acculturative stress display over the waves in which each was measured, and do individuals differ reliably in that rate? RQ2: How do perceived peer, teacher, and family support change over the same period, do individuals differ in those rates, and do the school-based and family-based components change at different average rates? RQ3: Do the individual rates of change covary across constructs—that is, do the young people who gain in relational support also gain in the psychosocial constructs? RQ4: How do the constructs covary in level when the repeated waves are aggregated, and how heterogeneous is that association across waves?
RQ3 is the question that distinguishes this analysis from a description of wave means. A set of average trajectories can rise in parallel without any individual’s gains being connected; only the covariation of person-specific growth rates can show whether relational gain and psychosocial gain covary within persons. The contribution is accordingly threefold: individual-level growth models rather than aggregate trend lines; an explicit test of covariation among growth rates; and treatment of the panel’s measurement history as an object of analysis, including wave-by-wave reliabilities, a documented scoring error in the released self-esteem instrument, and re-estimation of the trends most exposed to instrument change from the item set common to all waves.
This is a theory-guided descriptive study, not a theory-contributing one. The hypotheses of Section 2.3 are directional expectations drawn from existing frameworks—the need to belong, the developmental reorganisation of personal relationships, and the acculturation literature—and the analyses test whether those expectations hold in this population and estimate the quantities they imply; no framework is modified or extended. Careful description of this kind is a legitimate and underprovided scientific product in its own right [15], and the Discussion returns to what the description does and does not license. Each research question maps onto the hypotheses and analyses as follows: RQ1 and RQ2 are addressed by the univariate growth models (H1–H3), RQ3 by the bivariate growth models and growth-rate correlations (H4), and RQ4 by the wave-aggregated correlation matrix, which carries no hypothesis and is reported descriptively. Table 1 maps the six constructs and seven measurement series onto their instruments, windows, school stages, analytic samples, and research questions.
Table 1.
Study overview: Constructs, measurement series, windows, analytic samples, and research questions.
2. Theoretical Background and Hypotheses
2.1. Acculturation, Identity, and Their Critics
Berry’s acculturation framework, which cross-classifies orientation toward the heritage culture with orientation toward the receiving culture to yield integration, assimilation, separation, and marginalisation, remains the organising model in this literature [16]. Its influence justifies attention to bicultural acceptance as a construct, but the framework has attracted substantial and arguably well-founded criticism. Rudmin’s critical history shows that the fourfold typology was not derived from data, that the marginalisation category is empirically rare and psychometrically unstable, and that the apparent superiority of integration is partly an artefact of how the categories are constructed and scored [17]. Schwartz and colleagues argue further that treating acculturation as a categorical type obscures its multidimensionality—practices, values, and identifications need not move together—and that the receiving context, including the opportunities and the discrimination it supplies, is a determinant of acculturation outcomes rather than a backdrop [18].
These criticisms shape the present design. They argue against assigning individuals to acculturation types and in favour of modelling separate, continuously measured constructs and their change over time, which is what the MAPS instruments supply and what is done here.
The developmental literature on ethnic identity supplies the second strand. Phinney established ethnic identity as a developmental achievement involving exploration and commitment rather than a fixed attribute [19], and the later interactional account emphasised that its relation to well-being depends on the national context and on how the receiving society responds to the group [20]. The integrated conceptualisation advanced by Umaña-Taylor and colleagues distinguishes identity content from identity process and stresses that development continues through adolescence into young adulthood [21]. A limitation of this literature for present purposes is that it was largely built in North American and European settings on populations whose migrant status is their own; whether its developmental expectations transfer to Korean-born children of intermarried families is an open question that a Korean individual-level series can help inform; those expectations motivate the constructs examined here but are not directly tested.
Why relational resources should matter is supplied by the need-to-belong theory, which holds that stable and positive interpersonal relationships are a fundamental prerequisite for psychological adjustment rather than one desirable outcome among many [11]. Social-network theory supplies the structural counterpart: the homophily principle predicts that adolescent ties form disproportionately within similar groups, which, for a numerically small minority, implies constrained relational opportunity [22], and the brokerage perspective describes the positional advantage available to individuals who bridge otherwise disconnected groups [23]. This study measures perceived support—a functional, self-reported quantity—and not network structure; the network literature motivates the constructs and frames a limitation, but no structural claim is tested here.
2.2. What the Three Psychosocial Constructs Are, and Are Not
The three non-support constructs are not treated here as interchangeable indicators of a single latent cultural identity; without the following distinctions, the grouping would be misleading. Global self-esteem is a general evaluation of personal worth; it is not a culturally specific construct, and in this population, it is best understood as the psychosocial outcome against which acculturative experience is read, in the sense in which the need-to-belong account treats relational belonging as a determinant of self-evaluation [11]. Bicultural acceptance attitude is the culturally specific construct of the three: it measures the young person’s endorsement of both the Korean and the parental heritage culture, and is related to, though not equivalent to, the integration orientation of the acculturation framework—it measures endorsement of both cultures as attitudes rather than Berry’s full behavioural strategy—and to the content dimension of ethnic identity [16,21]. Acculturative stress measures the experienced burden of that cultural position, including perceived discrimination and exclusion, and is therefore a measure of the receiving context as it reaches the individual rather than of the individual’s identity as such [18].
These three are analysed jointly because they plausibly change together, not because they are one thing, and each is modelled separately throughout; no composite or latent identity factor is formed. Section 4.4 reports an empirical check on the grouping: if the three were indicators of one underlying construct, their person-specific growth rates would be expected to intercorrelate strongly, although only a common-factor growth model could test that proposition formally.
2.3. Hypotheses
The framing above yields four expectations, stated in advance of the results and tested in Section 4.
Hypothesis 1 (H1).
Perceived peer and teacher support will increase (a positive slope in raw scale units) from late elementary school through middle school, as peer relationships assume developmental importance [10,11] and as the cohort accumulates time in a stable school setting [4]. This expectation is not universal in the literature: United States studies report declines in perceived teacher support across the middle-school years [24], so H1 is a substantive claim about this cohort in the Korean school structure rather than a restatement of a settled finding.
Hypothesis 2 (H2).
Perceived family support will change at a lower rate, in scale-normalised terms, than the school-based supports over the same period, reflecting the developmental reorganisation of the relative weight of relational contexts documented for adolescence [10], rather than a decline in the family.
Hypothesis 3 (H3).
Individuals will differ reliably in their estimated linear rates of change on every measured series. This follows from the observation that relational opportunity is unequally distributed among a numerically small minority [22] and, if supported, is what makes an average trajectory an insufficient description.
Hypothesis 4 (H4).
Individual rates of change will covary across the relational and psychosocial constructs: young people whose perceived support grows faster will also show faster gains in self-esteem and faster reductions in acculturative stress [11]. Because this is an observational design, H4 concerns covariation only and carries no directional claim; and because correlations among estimated individual slopes are affected by estimation error, shrinkage, and missingness, H4 is tested primarily with jointly estimated bivariate growth models (Section 3.3.3).
2.4. Korean Panel Research on Migrant-Background Youth
Longitudinal research based on MAPS and related domestic panels has accumulated along two strands. The first concerns acculturative stress and the relational resources that accompany adjustment. Kim and Kim modelled longitudinal developmental pathways from family support and Korean-language proficiency to school adjustment, with acculturative stress and depressive symptoms as mediating processes [25]. Eun, Lee, and Lee identified distinct types of acculturative-stress change trajectories and reported that predictors of type membership and psychosocial adjustment differed across types [26].
The second strand concerns bicultural acceptance and school-related adjustment. Park and colleagues examined bicultural acceptance attitudes as an acculturation strategy in relation to school adjustment [27], and Hong and Lee applied a latent growth model to longitudinal change in bicultural acceptance [28]. At the policy level, Yang and Ham analysed the association between multicultural education policy and school belonging [29], while Lee traced processes of identity change and school adjustment [30], and Lee and colleagues modelled latent classes of depressive-symptom trajectories through middle and high school [31]. Table 2 summarises these studies against the three features that define the present design.
Table 2.
Prior longitudinal research on Korean migrant-background adolescents cited in this study, compared on the features of the present design.
Two features of this body of work define the gap addressed here. Substantively, these studies typically model one construct or one outcome pathway at a time over sub-windows of the panel, so that no single account estimates individual growth in the psychosocial constructs and the relational resources jointly, or asks whether those growth rates covary within persons. Methodologically, and more consequentially, the panel’s measurement history is not the object of analysis in any of the studies reviewed here (Table 2): the instrument changes at waves 6 and 7 and wave-by-wave reliability evidence are not their focus, even though composites from before and after those changes are routinely compared in this literature. The reliability audit reported in Section 4.1 indicates that this omission is not innocuous.
3. Materials and Methods
3.1. Data and Sample
The raw data of the 12 released waves of the first-cohort adolescent panel of MAPS were used; the design and instrumentation of the panel are documented in the NYPI summary report [14]. The MAPS first cohort was constructed as a nationwide panel of children of multicultural families enrolled in the fourth grade of elementary school in 2011. This study used the adolescent-response data of waves 1–10 (2011–2020), 12 (2022), and 14 (2024), as distributed through the NYPI Youth Panel Data service (SPSS format data files, obtained April–May 2026, documented by the first-panel User’s Guide revised on 31 December 2025 and its codebook [32]). Waves 11 (2021) and 13 (2023) were conducted as panel-retention surveys and have not been publicly released, so the analysis covers the 12 released waves. Their absence removes two occasions from the second self-esteem series but does not distort the within-person time metric, which is calendar time.
The initial cohort comprised 1635 adolescents; 892 (54.6%) provided a valid composite at the final released wave (wave 14). The long-format derived panel is a balanced grid of 19,620 individual-by-wave cells (), of which 15,227 contain at least one valid construct composite. Because the constructs were fielded over different windows, the number of valid person-wave observations differs by construct: 12,237 for bicultural acceptance and family support (nine waves each), 8634 for acculturative stress, peer support, teacher support, and the 2011–2016 self-esteem instrument (six waves each), and 6593 for the 2017–2024 self-esteem instrument (six waves). Wave-by-wave valid N, means, standard deviations, and confidence intervals are given in Supplementary Table S1. This study is a secondary analysis of a public research-use panel and, per the release documentation [32], handles no personally identifying information.
3.2. Measures
Six constructs were composited as equally weighted item means, with a composite computed only when at least three valid item responses were available (for the four-item self-esteem I scale, this permits at most one missing item); responses carrying the panel’s conventional missing codes (9, 99, and the negative codes used from wave 14) were set to missing, and reverse-coding was applied, before compositing. Released variable stems, the wave-6 item crosswalk, and scoring instructions are given in Supplementary Table S9, and the released wording of every item in Supplementary Table S9c. Table 3 reports for each construct the item count, response format, waves fielded, and the wave-by-wave range of Cronbach’s [33]; full wave-by-wave reliabilities are in Supplementary Table S2.
Table 3.
Constructs, measurement windows, and internal consistency.
Three features of the measurement history constrain what the growth models can be taken to mean.
Differing measurement windows. Peer support, teacher support, and acculturative stress were last fielded at wave 6 (2016), the cohort’s final year of middle school, so those windows cover late elementary school and the whole of middle school. Family support and bicultural acceptance were fielded through wave 9 (2019), the final year of high school, so statements about these two constructs extend across the high-school years. Only self-esteem spans the full panel window, as two separate instruments. Inferences about the school-based supports are therefore confined to the period ending with middle school (2016), those about family support and bicultural acceptance to the period ending with high school (2019), and none concerns any relational construct during the transition to young adulthood.
Item reduction at wave 6. The peer-support item set was reduced from seven items to three and the teacher-support set from six to three at wave 6. Inspection of the item wording establishes that the wave-6 sets are exact subsets of the earlier sets (peer: items 5–7; teacher: items 4–6), which makes it possible to rebuild both constructs from the three common items at every wave; the item crosswalk is reproduced in Supplementary Table S9. Section 4.5 reports that re-estimation.
Instrument replacement and a scoring correction at wave 7. Self-esteem was measured in waves 1–6 with four items drawn from a Korean adaptation of the Coopersmith self-esteem inventory on a four-point response format, and from wave 7 with nine items which the panel’s User’s Guide identifies as drawn from the Rosenberg Self-Esteem Scale [32,34], on a five-point format. The two differ in item content and response range, so their levels are not comparable and they are modelled throughout as two separate series rather than one twelve-wave trajectory. The nine-item scale contains four negatively worded items (“I think I am generally a failure”; “I feel I have little to be proud of”; “I sometimes feel that I am useless”; “I sometimes think I am not a good person”) that must be reverse-scored before compositing, as the standard scoring of the Rosenberg instrument prescribes for its negatively worded items [34]. The panel’s version is a Korean adaptation of the original items rather than the validated instrument itself. The codebook confirms the polarity of the four items and shows that all nine are released on a single coding from 1 (“not at all”) to 5 (“very much”), that is, unreversed; the User’s Guide specifies reverse-scoring for other scales in the panel but gives no such instruction for this one [32]. At the item level, the corrected item–total correlations of the four negatively worded items are −0.35 to under the released scoring and to after reversal, and omega coefficients from a one-factor confirmatory model of the reversed items are – across waves (Supplementary Table S9b). Computing the composite from the released values without reversal yields at wave 7 falling to at wave 14, that is, no usable scale; with the four items reverse-scored, ranges from 0.87 to 0.92. All analyses use the reverse-scored composite. The uncorrected composite is what a straightforward reading of the released variable list produces, and the correction materially changes the wave-level means.
A fourth issue was identified in the audit and handled as a sensitivity analysis rather than a correction. Item 10 of the acculturative-stress scale (“I will be able to live better in Korea than in my foreign parent’s country”) is not a stress statement and shows a corrected item–total correlation of 0.00–0.06 at every wave; excluding it raises from 0.74–0.78 to 0.83–0.86. The ten-item composite, which is the panel’s own scale definition and the version used in the prior literature, is retained as primary for comparability, and the nine-item version is reported alongside it as a sensitivity analysis under a conventional corrected item–total criterion (<0.20).
Peer and teacher support use a five-point Likert format and the remaining constructs a four-point format. This was verified directly against the response-value labels in the released data files and is consistent with prior MAPS-based work [31]. Absolute levels and raw slopes are therefore not comparable across the two groups of constructs, and every cross-construct comparison is made on a scale-normalised metric, the percentage of the theoretical response range per year—a descriptive standardisation for comparing directions and relative magnitudes, not a fully comparable effect measure across instruments.
3.3. Analytic Strategy
3.3.1. Primary Model: Multilevel Linear Growth
Each construct is modelled with a two-level linear growth model in which repeated observations are nested within respondents:
where is the composite for respondent i at time t, is calendar years since the construct’s first measurement wave (uncentred, so the intercept is the model-implied level at that first wave; a midpoint-centred specification is reported as a sensitivity analysis in Section 4), is the average annual rate of change, is respondent i’s deviation from that rate, and is the between-person variance in growth rates. This is the multilevel formulation of a linear latent growth model and is estimated by maximum likelihood, which supplies valid estimates under a missing-at-random assumption and uses all available observations rather than complete cases. Whether individuals differ reliably in their rate of change (H3) is tested by comparing the random-intercept model with the random-intercept-plus-random-slope model by likelihood ratio, referred to a 50:50 mixture of and for a variance on the boundary of its parameter space, with rejection at the mixture’s quantile. Variance components are reported from restricted maximum likelihood, which is less biased in finite samples, while the likelihood-ratio test uses maximum likelihood, under which nested models with different random-effects structures have comparable likelihoods.
Higher-order growth terms were fitted selectively. With six measurement occasions for four of the seven series, curvature estimated over so few occasions is difficult to distinguish from wave-specific measurement fluctuation, so the linear model is primary throughout. For peer support, however, the wave means are visibly non-monotonic—rising to a plateau and turning down at the final wave—so a quadratic specification and a piecewise specification with a knot at the middle-school entry year (2014) were fitted in addition to the linear model and are reported in Section 4. For the remaining constructs, the wave means (Figure 1, Figure 2 and Figure 3) give no indication of systematic curvature within any single instrument period, and a quadratic term fitted to teacher support as a check was not distinguishable from zero.
Figure 1.
Wave-by-wave mean trajectory of self-esteem with 95% confidence intervals, shown separately for the two instruments: (a) the four-item, four-point scale fielded in waves 1–6 (2011–2016); (b) the nine-item, five-point scale fielded in waves 7–14 (2017–2024), with its four negatively worded items reverse-scored. The panels use different items and different response formats; their vertical positions are not comparable and no trend is estimated across the boundary. Annotated slopes are the population-average estimates with respondent-clustered standard errors; the multilevel growth-model estimates are given in Section 4.2. Intervals are conventional 95% confidence intervals of each wave mean, computed from the respondents with a valid composite at that wave (valid N per wave in Supplementary Table S1).
Figure 2.
Wave-by-wave mean trajectory of acculturative stress with 95% confidence intervals, 2011–2016, for the released ten-item scale and for the nine-item version excluding item 10 (Section 3.2). Both versions decline at the same rate. The annotated slope is the population-average estimate (Section 4.2). Intervals are conventional 95% confidence intervals of each wave mean, computed from the respondents with a valid composite at that wave (valid N per wave in Supplementary Table S1).
Figure 3.
Wave-by-wave mean trajectories of the three perceived relational-support constructs with 95% confidence intervals. Peer and teacher support were fielded in 2011–2016 only and family support in 2011–2019; no support construct was measured after 2019. Peer and teacher support use a five-point response format and family support a four-point format, so the vertical positions of the three series are not directly comparable and only their shapes should be compared. Intervals are conventional 95% confidence intervals of each wave mean, computed from the respondents with a valid composite at that wave (valid N per wave in Supplementary Table S1).
3.3.2. Robustness Estimators
Because a growth model imposes distributional assumptions on the random effects and a missing-at-random assumption on attrition, every trend is re-estimated with one descriptive check (R1) and two robustness estimators (R2, R3), reported alongside the primary model. Each relaxes a stated assumption: R1 makes no within-person assumptions at all, R2 drops the random-effects distributional assumption, and R3 removes all time-invariant confounding—though fixed effects do not address time-varying influences or measurement error.
(R1) Wave-mean ordinary least squares: A straight line fitted to the k wave means, with a t interval on degrees of freedom. This is the descriptive summary of the plotted trajectory and is reported for comparability with the descriptive literature; with or 9 points, it has very little power and supports no inference.
(R2) Population-average regression with respondent-clustered standard errors: Makes no distributional assumption about individual heterogeneity.
(R3) Person fixed effects: Identifies the slope only from within-person change, so it is orthogonal to every time-invariant respondent characteristic, including any that predicts panel retention. Agreement between R3 and the growth model indicates that the estimated change is not an artefact of who remained in the panel.
3.3.3. Covariation of Growth Rates
To test H4, two complementary estimators are used, a direct one and a descriptive one.
The direct estimator is a bivariate latent growth model, fitted in its structural-equation form for the four pairs with the longest shared measurement windows: peer with teacher support, peer support with self-esteem I, peer support with acculturative stress (all 2011–2016), and bicultural acceptance with family support (2011–2019). Multivariate change of this kind is the standard object of multilevel and latent-curve treatments of co-development [35]. Each model specifies intercept and slope factors per construct with fixed loadings, free covariances among the four factors, free residual variances per indicator, and free within-occasion residual covariances between the two constructs, the last of which prevents same-wave shared method variance from being absorbed into the latent covariances [36]. Outcomes are expressed as percent of scale range. The slope–slope correlation from these models is the primary estimate of co-development, with a Wald test on the slope covariance.
The descriptive complement extracts person-specific growth rates from each univariate growth model as empirical Bayes predictions () and correlates them across all construct pairs whose measurement windows overlap in at least four years; this excludes the pairs involving the 2017–2024 self-esteem instrument, whose three-year overlaps are reported as a sensitivity analysis. Three properties of this complement are stated in advance. First, empirical Bayes predictions are shrunken toward the mean by construct-specific amounts that depend on measurement precision and the number of contributing waves, so correlations among them are attenuated non-uniformly and any p-value that treats them as observed data is anticonservative; no inference is based on them, and the bivariate growth models above supply the inference. Second, each correlation is computed only on respondents with at least two valid waves on both constructs, and the contributing n is reported per pair; as a check, the correlations were recomputed from unshrunken ordinary least squares slopes fitted to each respondent with at least four valid waves. Third, because growth rates and baseline levels are correlated within construct, partial correlations controlling both constructs’ model-implied baseline levels are reported alongside the raw values, so that co-development is distinguished from baseline association.
3.3.4. Comparing Trends Across Constructs
Because the constructs differ in response range, all cross-construct comparisons use the slope expressed as a percentage of the construct’s theoretical response range per year (range 4 for five-point constructs, 3 for four-point constructs); the common-window comparisons are primary and the full-window comparisons supplementary, since the latter span partially different periods. The primary test of a slope difference stacks the two range-normalised outcomes into one long dataset and fits a single model with construct, time, and the construct × time interaction, whose coefficient is the slope difference estimated with the cross-construct dependence inside the model rather than assumed away. Two specifications are reported: a mixed model with construct-specific random intercepts and random slopes per respondent, and a population-average regression with respondent-clustered standard errors. The statistic for the equality of coefficients from independent estimations [37] is reported in the Supplementary Materials only as a consistency check; its independence assumption is not defensible for constructs measured on the same respondents, so the stacked models are primary. Because family support was fielded over nine waves and the school-based constructs over six, each comparison is reported both over each construct’s own window and over the common 2011–2016 window.
3.3.5. Aggregation of Wave-Level Correlations
For each wave, the Pearson correlation matrix among the six constructs was computed, including only waves with at least 30 valid cases per construct. Wave-level correlations were Fisher-z transformed and combined by inverse-variance weighting with weights , so that waves contribute in proportion to their precision rather than equally, and the observed range of wave-level correlations is given for every cell. The pooled value is a within-panel descriptive summary rather than an estimate of a stable population parameter, because sample composition changes across waves through attrition. Because the contributing waves are repeated measurements of one panel and not independent studies, no meta-analytic heterogeneity statistics or random-effects estimates are attached: the weighted mean is a descriptive summary, the range is its measure of wave-to-wave variation, and the effective information is far below the summed sample sizes. The number of contributing waves k differs by cell: for pairs among self-esteem, bicultural acceptance, and family support, and for all pairs involving peer support, teacher support, or acculturative stress. Self-esteem enters this matrix as a single variable because each wave fields only one self-esteem instrument, so every wave-level correlation is computed within a single instrument; the pooled cell nevertheless mixes the two series across waves, is annotated accordingly, and period-specific values are given in Supplementary Table S10.
This aggregated matrix describes association in level, not co-development. The longitudinal question—whether change in one construct accompanies change in another—is addressed only by the bivariate growth models and growth-rate correlations of Section 3.3.3, and the two are reported separately and interpreted separately. No significance tests or multiplicity corrections are attached to the level matrix: it is a set of descriptive point estimates, and no pair is selected or interpreted on the basis of statistical significance.
3.3.6. Attrition and Weighting
Three treatments of attrition are reported. First, wave-1 characteristics of eventual completers and non-completers are compared on all six constructs. Second, retention to the final released wave is modelled by logistic regression on wave-1 sex, region, highest parental education, and all six wave-1 construct scores, and the trend models are re-estimated with stabilised inverse-probability-of-retention weights. Because several constructs end before wave 14, final-wave retention is not the relevant event for them, so construct-specific retention models—retention defined as a valid composite at each construct’s final measurement wave, on the six wave-1 construct scores—were additionally estimated and the weighted trends recomputed per construct (Supplementary Table S11). Third, the person fixed-effects estimator (R3) provides an estimate that is invariant to selection on any time-invariant characteristic, whether or not it is observed.
The released first-cohort adolescent data files contain no sampling or attrition weight variable: the only variables whose names match “weight” are body-weight items in the growth-and-development module. Design-weighted estimation is therefore not possible with the released data, and all estimates describe the panel rather than the national population of migrant-background youth.
Analyses were performed in Python 3.12: mixed models with statsmodels 0.14 (MixedLM), structural-equation models with semopy 2.3, data handling with pandas 3.0 and numpy 2.5, and figures with matplotlib. The analysis code deriving every composite, model, table, and figure from the released files is provided as Supplementary Code S1. This is a descriptive secondary analysis of publicly released research-use panel data; no causal identification strategy was applied and none of the estimates should be read as an effect.
4. Results
4.1. Sample, Reliability, and Wave-Level Descriptives
The valid wave-by-wave sample—identical across the constructs fielded at a given wave in the derived panel—declined from 1635 in 2011 to 1329 in 2016, 1146 in 2019, and 892 in 2024. Internal consistency was high and stable for the three support constructs (–) and for the corrected nine-item self-esteem scale (–), adequate for the four-item self-esteem scale (–), and acceptable but lower for bicultural acceptance (–) and acculturative stress (–; – without item 10). Each construct’s reliability remained within a similar range across its measurement window, and the wave-6 item reduction lowered peer- and teacher-support only marginally, to 0.95 and 0.92. Table 4 reports wave means at selected waves.
Table 4.
Wave means and 95% confidence intervals by construct (excerpt).
4.2. Average Growth and Individual Differences in Growth (RQ1, RQ2, H1–H3)
Table 5 reports the growth models. Peer support grew by points per year (95% CI [, ], ), or of the scale range annually, and teacher support by ([, ], ; of range), consistent with H1 over the observed window (Figure 3). The peer-support trajectory is, however, not monotonic: the wave means rise steeply from 2011, plateau in 2014–2015—the first two middle-school years—and turn down in 2016, the final middle-school year. A quadratic term is clearly supported (), and a piecewise model with a knot at middle-school entry (2014) estimates a rise of points per year to the knot ([, ]) followed by a decline of per year after it ([, ], ). The average linear slope is therefore a summary of growth concentrated in late elementary school and early middle school, not a constant rate; Section 5.1 returns to the substantive reading of the final-year reversal. Teacher support shows no comparable curvature (quadratic term ). Acculturative stress declined by per year ([, ], ; of range; Figure 2), and the estimate is unchanged when the problematic tenth item is removed. Bicultural acceptance shows a small positive estimate whose confidence interval includes zero ( [, ]); the population-average and retention-weighted estimators return similar point estimates with intervals that narrowly exclude zero (Table 6; Section 4.6), so its detectability depends on the estimator and no directional change is claimed.
Table 5.
Multilevel linear growth models: Average rate of change and between-person variation in rate.
Table 6.
Robustness of the average rate of change across four estimators.
Self-esteem measured on the 2011–2016 instrument showed no detectable average change ( [, ], ; Figure 1a), and the interval bounds annual change below points, a cumulative change under 0.05 points across the window—an absence of a detected trend rather than positive evidence of invariance. Self-esteem on the 2017–2024 instrument increased slightly ( [, ], ; of range), amounting to roughly 0.06 points on a five-point scale over eight years, a magnitude of little practical significance. The level difference between the two panels of Figure 1 is an artefact of the instrument change and carries no substantive meaning; only the within-panel slopes are interpretable.
Family support, observed through the final year of high school, is the construct on which the result is most estimator-sensitive. The growth model returns a small negative average slope whose interval excludes zero by a narrow margin ( [, ], ), whereas the population-average, fixed-effects, and inverse-probability-weighted estimators all return intervals that include zero (, , and respectively; Table 6). The construct-specific retention weights of Section 4.6, in turn, reproduce the growth-model estimate ( [, ], ). Family support is therefore described as showing no robust directional change—a statement about what was detected, not positive evidence of stability. Two further quantities bear on whether this null is informative rather than merely underpowered. The minimum detectable annual change at 80% power is points ( of range), half the smallest trend interpreted substantively (the acculturative-stress decline of of range), so the design had ample power to detect a change of the size discussed elsewhere. And a two-one-sided equivalence test [38] against bounds of of range per year—the magnitude of the acculturative-stress trend, the smallest substantively interpreted here—rejects any change at or beyond those bounds (). Any annual change in family support across these nine years was therefore smaller in magnitude than the acculturative-stress decline.
H3 is supported for every construct. Adding a random slope improved fit decisively in all seven series (likelihood-ratio to , all ), so individuals differ reliably in their rate of change. The magnitude of that heterogeneity is substantial relative to the average rates. For peer support, the between-person standard deviation of growth rates is points per year against an average of , implying—under the model’s normality assumption for random slopes—that the central 95% of respondents have annual rates between and , and that roughly 32% of individual peer-support rates and 39% of teacher-support rates are negative: the average increase is a net figure that conceals a sizeable minority whose perceived peer support was falling. The same pattern holds for teacher support (SD against an average of ) and, in relative terms, for every other construct (Table 5, Figure 4).
Figure 4.
Individual growth for (a) peer support and (b) self-esteem on the first instrument, 2011–2016. Grey lines are the observed trajectories of a random sample of 120 respondents with at least four valid waves; the solid line is the average growth trajectory from the multilevel model, the dotted line the observed wave means, and the shaded band the 95% range of individual growth rates implied by the estimated between-person slope variance. The average trend is a summary of substantial individual heterogeneity, not a description of a typical respondent.
In every model, the intercept–slope correlation is negative ( to ) when the intercept is placed at baseline. This is not, by itself, evidence that those who began lowest gained most, because a negative baseline intercept–slope covariance is equally the statistical signature of regression to the mean and of measurement error in the baseline [39], and, for constructs whose means sit high in the response range, of ceiling compression: re-estimating the models with the intercept centred at the window midpoint, where that artefact is minimised, shrinks the correlations to near zero for the school-based supports ( for peer and for teacher support). What survives this check is a weaker and directly observable form of the same tendency: the between-person standard deviation of observed scores contracted across the waves for peer support, teacher support, and acculturative stress (by roughly 8–15% from first to last wave, Levene in each case), while it was essentially constant for self-esteem I, bicultural acceptance, and family support. The distribution of perceived school-based support narrowed as its mean rose, although part of that narrowing may itself reflect compression near the top of the response range as means approached it. The stronger claim that gains were concentrated among the initially least-supported is not identified by this design, and Section 5.2 interprets the equity question on the narrower, defensible basis.
4.3. Do the School-Based and Family Supports Change at Different Rates? (H2)
Table 7 reports the formal tests of H2, each estimated in a single stacked model in which the construct × time interaction is the slope difference, so that the dependence between constructs measured on the same respondents is inside the model rather than assumed away (Section 3.3). Over the common 2011–2016 window, the peer-support rate exceeds the family-support rate by 1.42 percentage points of scale range per year under the mixed specification (95% CI [, ]; clustered specification 1.41 [, ]), and the teacher-support rate exceeds it by 0.85 points ([, ]; clustered [, ]); all . Both comparisons hold when family support is estimated over its full nine-wave window. The peer- and teacher-support rates also differ from each other, though by less (mixed [, ], ; clustered [, ], ). The results are therefore consistent with H2 on the descriptive range-normalised metric: the divergence between school-based and family-based support is a tested difference and not an impression, subject to the comparability assumptions of that metric, and it remains an observed association with no causal content. The independent-estimates statistic [37] gives materially identical differences (Supplementary Table S6).
Table 7.
Tests of the difference between support trends (percentage of scale range per year).
4.4. Covariation of Individual Growth Rates (RQ3, H4)
The primary evidence for H4 is the set of four bivariate latent growth models (Table 8), which estimate the correlation between growth rates directly, with no intermediate slope extraction. All four slope covariances are individually significant and in the hypothesised direction: respondents whose perceived peer support grew faster also gained faster in teacher support and in self-esteem and lost acculturative stress faster, and growth in bicultural acceptance covaried with growth in family support. H4’s associational component is supported by direct estimation; the substantive reading of that covariation remains interpretive. Inference attaches to the bivariate models (Wald tests and respondent-level bootstrap intervals in Table 8), all four of whose intervals exclude zero; the widest, for peer support with acculturative stress, reflects the low between-person variance of stress slopes near the scale floor. The descriptive matrix below carries no inference by design. These are correlations between rates of change: they indicate that change co-occurred within the same individuals, not that one process produced the other, and no direction of influence is identified.
Table 8.
Bivariate latent growth models: Direct estimates of the correlation between growth rates.
Table 9 reports the descriptive complement: correlations among empirical Bayes growth rates for all fifteen eligible pairs, each computed on respondents with at least two valid waves on both constructs (contributing n per pair in the table), with the unshrunken ordinary-least-squares cross-check and with partial correlations controlling both constructs’ model-implied baseline levels. Three regularities support the reading given above. First, the empirical Bayes values are uniformly smaller in magnitude than the direct bivariate estimates for the four pairs where both exist (for example, peer with teacher support against ), which is the direction differential shrinkage predicts; the descriptive matrix is conservative, and no inference is based on it. Second, the ordinary-least-squares cross-check tracks the empirical Bayes values closely (largest discrepancy ), so the ordering of pairs is not an artefact of shrinkage. Third, the partial correlations controlling baseline levels are, for every pair, at least as large as the raw values, so the covariation of growth rates is not a disguised baseline association. As a sensitivity analysis for the four-year overlap rule, the two excluded pairs involving the 2017–2024 self-esteem instrument (three years of overlap with bicultural acceptance and family support) yield small negative correlations ( in both cases, ); estimated over so short an overlap, these are not interpreted, and their inclusion would change no conclusion.
Table 9.
Correlations between respondent-specific estimated growth rates (empirical Bayes predictions): Descriptive complement with unshrunken and baseline-adjusted cross-checks.
Two features of these results answer questions the wave-averaged matrix cannot. First, the covariation is genuinely longitudinal: it concerns rates of change, not levels, and it supports an association between estimated individual rates, so the parallel average rises in Figure 3 are not merely unrelated population shifts. Second, the pattern provides an empirical check on the construct grouping discussed in Section 2.2. If self-esteem, bicultural acceptance, and acculturative stress were indicators of a single latent cultural-identity construct, their growth rates would be expected to intercorrelate strongly. They do not: the growth-rate associations among the three psychosocial constructs are uniformly weak (Table 9), with bicultural acceptance and acculturative stress changing essentially independently of one another. The three change substantially independently and are accordingly treated as three separate constructs rather than one. Because all constructs are self-reported in the same instrument, shared method variance remains a candidate inflator of these associations; the bivariate models’ within-occasion residual covariances absorb the same-wave component of it, but a method component that itself drifts within persons over years cannot be excluded [36], and this is carried as a limitation.
4.5. Measurement Continuity and Robustness
Because the peer- and teacher-support increases coincide with an item reduction at wave 6, both constructs were rebuilt from the three items fielded at every wave from 2011 to 2016 (Figure 5). The common-item series reproduces the increases and estimates them as steeper than the released-item series: peer support per year ([, ], ) against , and teacher support ([, ], ) against . At wave 5, where both composites can be formed on the same respondents, they correlate (peer) and (teacher) and differ in mean by only and points. In a stacked model with respondent-clustered errors, the common-item slope exceeds the released-item slope by points per year for peer support (95% CI [, ]) and for teacher support ([, ]). The common-item composites therefore yield larger, not smaller, estimated increases, so the observed trends are not attributable to the item reduction, and neither their direction nor their detectability is affected. Excluding wave 6 altogether leaves the peer-support trend clearly positive ( per year, [, ]) and the teacher-support wave-mean trend positive but undetectable on five points (, [, ]), a low-power sensitivity analysis whose wide interval reflects the five-point wave-mean fit rather than evidence against the trend.
Figure 5.
Measurement-continuity check for (a) peer support and (b) teacher support. Solid lines are composites from the released item sets (seven and six items, reduced to three at wave 6); dashed lines are composites built from only the three items fielded at all six waves. The common-item series shows the same increases, slightly steeper, indicating that the observed trends are not attributable to the wave-6 item reduction.
No comparable check is available for self-esteem, because the wave-7 instrument shares no items with the earlier one and uses a different response format; this is why the two series are modelled separately and no trend is estimated across the boundary. Within respondents observed at both wave 7 and wave 8—entirely inside the second instrument—the composite is stable (3.818 to 3.802, ), so the second series is internally well behaved. Only the comparison across the boundary is unavailable, and measurement invariance across the boundary cannot be established from these data alone: with no shared items and no overlap wave, there is no basis on which the two instruments could be linked. For the constructs with unchanged item sets, continuity of the item set is likewise not equivalent to measurement invariance of the construct metric, a distinction carried in the limitations.
The family-support series contains a shallow local minimum at 2017 (3.159, against 3.187 in 2016 and 3.172 in 2018). The full nine-wave range of this series is 3.159–3.230, that is, 0.071 scale points or 2.4% of the scale range, with overlapping wave-level confidence intervals throughout. The 2017 value is read descriptively as wave-to-wave fluctuation; no prespecified criterion marks it as substantively meaningful.
4.6. Attrition
Of the 1635 respondents at wave 1, 892 (54.6%) provided a valid self-esteem composite at wave 14. Wave-1 scores of eventual completers and non-completers differ negligibly on all six constructs (Supplementary Table S3): self-esteem 3.153 versus 3.106 (, ), bicultural acceptance 2.917 versus 2.874 (, ), acculturative stress 1.486 versus 1.488 (, ), peer support 3.819 versus 3.804 (, ), teacher support 3.712 versus 3.653 (, ), and family support 3.217 versus 3.181 (, ). Only bicultural acceptance reaches conventional significance, at a magnitude () conventionally regarded as negligible; with , these comparisons are well powered to detect small differences, so the null results are informative rather than merely underpowered.
A logistic model of retention on wave-1 sex, region, highest parental education, and all six wave-1 construct scores explains very little (McFadden pseudo-, model ), with only one regional category reaching significance. Re-estimating the trends with stabilised inverse-probability-of-retention weights (range 0.69 to 1.58, so no truncation was required) leaves the direction of every trend unchanged: peer support ([, ]), teacher support ([, ]), acculturative stress ([, ]), self-esteem I ([, ]), family support ([, ]), and bicultural acceptance ([, ]), whose interval, unlike the growth model’s, excludes zero (Supplementary Table S5). Construct-specific retention models, with retention defined at each construct’s final measurement wave (81.3% retained to 2016; 70.1% to 2019), again leave every slope estimate materially unchanged, with intervals that exclude zero for bicultural acceptance ( [, ]) and, as in the unweighted growth model, for family support ( [, ]) (Supplementary Table S11). Because the person fixed-effects estimator (Table 6) is additionally invariant to selection on any time-invariant characteristic, observed or not, and agrees with the primary model throughout, these sensitivity analyses did not materially alter the estimates; attrition related to time-varying characteristics cannot be excluded by any of these procedures.
4.7. Association in Level, and Its Heterogeneity (RQ4)
Table 10 reports the precision-weighted summary of the wave-level correlations together with the observed range across waves, and Figure 6 places it beside the growth-rate matrix. Because the contributing waves are repeated measurements of one panel, not independent studies, no meta-analytic heterogeneity statistics are attached: the weighted mean is a descriptive summary and the wave-to-wave range is the appropriate statement of its variability (Section 3.3). The strongest pair in level is peer with teacher support (), followed by self-esteem with peer support (), self-esteem with family support (), self-esteem with teacher support (), bicultural acceptance with family support (), and peer with family support (). All ten pairwise correlations among the five constructs other than acculturative stress (treating self-esteem as one pooled series) are positive and moderate (–), and acculturative stress correlates negatively with all five ( to ).
Table 10.
Association in level: Precision-weighted mean of wave-level correlations, with the observed range across waves.
Figure 6.
Two kinds of association among the six constructs: (a) correlations among levels, Fisher-z averaged across the waves in which both constructs were fielded (–9); (b) correlations among person-specific growth rates from the multilevel models, restricted to pairs whose measurement windows overlap by at least four years. Panel (a) describes which young people score high on which constructs; only panel (b) describes whether change covaries within individuals.
Wave-to-wave variation is modest in absolute terms—no cell’s range spans more than in r—but it is not negligible for the cells involving self-esteem, which pool two instruments across the 2017 replacement, one plausible source of their wider ranges; the same cells computed separately within each instrument period are similar in direction and magnitude (Supplementary Table S10). These summaries describe which young people score high on which constructs; nothing longitudinal follows from them, and all constructs being self-reported by the same respondents, common-method variance plausibly inflates them [36].
5. Discussion
5.1. Interpretation of the Main Findings
In plain terms, the study finds four things. Across late elementary and middle school, these young people reported growing support from classmates and teachers while the burden of acculturative stress eased; support from the family showed no robust directional change through the end of high school. Individuals differed widely around those averages, and the young people who gained most in school-based support also tended to gain most in self-esteem and to lose acculturative stress fastest. All of this is association, not cause, and each statement is bounded by the years in which its instrument was fielded.
The clearest result is the divergence within relational support and its individual-level structure. From late elementary school through the end of middle school, perceived peer and teacher support rose while family support showed no robust directional change; the difference between the school-based and family rates is statistically discernible in the stacked models, and it survives rebuilding the school-based constructs from an item set held constant across all waves. Because the fixed-effects estimates coincide with the growth-model estimates, the pattern is consistent with change within individuals rather than with a purely compositional artefact of who remained in the panel, although estimators of this kind cannot exclude time-varying influences; and every developmental reading of these results is subject to the age–period–cohort confounding stated in the limitations.
This pattern is consistent with what the developmental literature on the reorganisation of personal relationships predicts—a candidate explanation, not a demonstrated mechanism: across adolescence, the perceived importance and supportiveness of peers rise relative to parents without parental support collapsing [10], and the need-to-belong account supplies the motivational reading of why school-based ties carry increasing weight [11]. Two aspects of the present findings sharpen rather than merely confirm that literature. First, the agreement is not trivial, because the direction was not a foregone conclusion: United States studies of the middle-school years report declining perceived teacher support and school climate across precisely this age range [24]. That the Korean cohort shows rising teacher support through middle school is consistent with the structural feature noted in Section 1.2—a homeroom teacher responsible for a fixed class group—though this design cannot test that explanation, and it remains a candidate rather than a conclusion. Second, the peer trajectory is not monotonic: growth is concentrated in late elementary school and the first middle-school years, with a reversal in the final middle-school year. The final year of Korean middle school is the year of transition to competitive high-school placement, and a dip in peer-centred relational experience in that year is developmentally plausible; but with a single wave carrying the reversal, it stands as a hypothesis for replication rather than a finding; it is the kind of structure an average linear slope conceals.
Family support showed no robust decline; it remained approximately level not merely through middle school but through the final year of high school, across the high-school transition that the international literature identifies as the period when belonging is most at risk [4]. A flat family-support series across nine years that include two school transitions is, on the developmental-reorganisation reading [10], the theoretically expected profile of a stable background resource. The reorganisation consists in school-based resources growing while family support remained approximately level, not in families being displaced. The school-based instruments end with middle school, so nothing here speaks to peer or teacher support during high school; the family and bicultural series end with high school, so nothing speaks to any relational construct during the transition to work.
The individual-level results add two findings that an aggregate description could not have produced. First, the average rates conceal wide heterogeneity: for peer support, the between-person standard deviation of growth rates is twice the average rate, so that while the cohort as a whole gained, a substantial minority—about a third under the model’s normality assumption—experienced declining perceived peer support across the same years. An average trajectory is therefore a poor summary of any individual’s experience, and policy framed on the average would misdescribe the population it addresses. Second, growth rates covary: the young people whose perceived support grew faster tended also to show faster rises in self-esteem and faster declines in acculturative stress. That covariation is the basis for describing these processes as associated within persons, and it is a finding that no wave-averaged correlation matrix could deliver. Its direction is not identified: gains in support may plausibly raise self-evaluation, higher self-evaluation may plausibly elicit more supportive relationships, and a third process may plausibly drive both. Nothing in this design separates these possibilities.
Acculturative stress declined, robustly across all four estimators and both scale versions. This agrees with the domestic panel literature: the trajectory-typology study of this construct found that the dominant latent classes among Korean multicultural adolescents are low or declining [26], and the pathway literature treats declining acculturative stress as part of the normative adjustment process in this population [25]. The present results extend those accounts: the decline is accompanied by reliable individual differences in its rate, and faster stress decline covaries with faster relational gain within the same individuals. The design cannot identify the mechanism—language mastery, cumulative school adjustment, changed experiences of discrimination, or changed willingness to report them are all consistent with the data—and the proximity of the distribution to the floor of the scale (9–12% of respondents at the scale minimum each wave; skewness 1.2–1.4) means the decline may be understated or partly an artefact of restricted range.
Self-esteem is the construct about which these data say least: because the instrument was replaced in 2017 with no overlap wave, a fourteen-year self-esteem trajectory is not a measurable quantity, and within each instrument period, the movement is small. A conclusion that self-esteem was stable across the whole span would require an invariance assumption that the item content itself contradicts.
Finally, the observed growth-rate correlations do not provide strong evidence that the three psychosocial measures share a single common trajectory. Their growth rates correlate only weakly, and bicultural acceptance and acculturative stress change essentially independently; these observed correlations do not amount to a formal test of a common latent trajectory, which would require a common-factor growth model, but they offer no support to aggregation. This is consistent, within one cohort, with the argument that acculturation-related constructs are multidimensional and should not be collapsed into a single identity dimension [18]; whatever theoretical convenience there might be in grouping self-esteem, bicultural acceptance, and acculturative stress under a single heading, these data do not support treating them as indicators of one underlying process, and the results are reported construct by construct accordingly.
5.2. Contribution to the Social Sustainability of Migrant-Background Inclusion
Section 1.1 proposed three measurable properties of relational resources that bear on maintenance social sustainability. The results speak to each.
Whether perceived relational support increased. Over late elementary and middle school, perceived support from the two school-based sources grew, and grew faster than family support. The school appears in these data not merely as a site of instruction but as the setting in which the measured relational gains occurred, which supports the emphasis on belonging in the comparative evidence on immigrant-background students [4,5]. The school was the setting in which the measured gains in perceived support occurred; whether school processes produced them is a causal question beyond this design, and the statement is bounded by the window the instruments cover, which ends with middle school.
Whether its distribution narrowed. This is where the individual-level models matter most. A natural reading of the negative baseline intercept–slope correlations is that those who began with the least gained the most. That reading is not identified: a negative baseline covariance is equally the signature of regression to the mean, baseline measurement error, and ceiling compression [39], and centring the intercept at the window midpoint reduces the correlations to near zero. What the data do show is weaker but real: the between-person spread of perceived peer and teacher support contracted across the waves, so the distribution narrowed as the mean rose—itself a pattern that may partly reflect compression near the scale ceiling, and therefore read here as descriptive convergence rather than as demonstrated equity. In terms of the social-equity component of social sustainability [7,8], the observed window is consistent with converging rather than diverging relational resources—inequality of perceived support did not widen—while the stronger compensatory claim is not supported. The wide between-person variation in growth rates still means a substantial minority moved in the opposite direction, and identifying who those young people are is beyond what these data support.
Which relational context the change is associated with, and over which period. This question is answerable in part, and the partition matters. Through the end of middle school, the school-based sources are those that grew, and the bivariate growth models show those gains covarying within individuals with rising self-esteem and falling acculturative stress. Through the end of high school, the family series shows a resource with no robust directional change. What remains unobservable is everything after 2019—the transition to work and young adulthood, the period in which, on the comparative evidence, belonging is most at risk [4]. The sustainability question that matters most for this cohort’s adult inclusion is therefore unanswerable from the panel as released, which is a finding about the monitoring system rather than about the young people.
These three answers concern the social dimension of sustainability only. Links to the economic dimension—through human capital and later labour-market integration—are plausible but lie outside what these data measure, and no environmental implication is claimed. That last point generalises, and bears on Boström’s observation that the social pillar is empirically underserved [9]. Indicators of social sustainability are only as good as their measurement continuity. In the present case, a widely used national panel changed the instrument for a central psychological construct without an overlap wave; the released item values for the replacement instrument require a reverse-scoring step that is easy to omit; and the resulting composite has no internal consistency at all if the step is omitted. A monitoring system for the social pillar that is not audited in this way may produce trend estimates whose substantive interpretation is not defensible. This is a general caution for sustainability indicators built from long-running social surveys, not a criticism of one panel.
5.3. Recommendations
For policy. Within the observed window—late elementary school through middle school—perceived peer and teacher support grew, their gains covaried within individuals with rising self-esteem and falling acculturative stress, and their distribution narrowed. This supports treating them as routine monitoring indicators in programmes for migrant-background youth of this age range rather than as incidental outcomes, and it supports monitoring their distribution and not only their mean, since the average conceals a minority moving the other way. Used as indicators, they would require the conditions this panel did not maintain: a stable instrument, administration at every wave, published wave-by-wave reliabilities, and reporting of dispersion alongside the mean—conditions that programme evaluators and the panel operator, rather than individual researchers, are positioned to secure. This is consistent with the direction of recent policy research on youth-facility-based activity programmes intended to strengthen the competencies and agency of migrant-background youth [40]. This is a recommendation about measurement and monitoring for the school years the instruments cover, not a claim that any programme caused the observed increases and not a statement about high school or young adulthood.
For panel design. The most consequential recommendation follows from what could not be studied. The peer- and teacher-support items were discontinued after the final middle-school year and the family-support items after the final high-school year, so the school-based side of the relational reorganisation is unobservable throughout high school, and every relational construct is unobservable in the transition to young adulthood—the period of greatest policy concern, given the growing attention to the social integration of migrant-background young adults [41]. Reinstating these items would close an identified gap, since the instruments exist and the panel is still in the field; the cost of reinstatement is an operational question for the panel. Where an instrument must be replaced, fielding both versions at a single overlap wave, followed by formal longitudinal measurement-invariance assessment, would make the two series linkable; the absence of such an overlap at wave 7 is why the self-esteem data form two series rather than one. The panel would also benefit from publishing wave-by-wave reliability statistics, explicit scoring instructions for reverse-worded items, and sampling or attrition weights, none of which accompany the released first-cohort adolescent files.
For research. The individual-level baseline established here should be extended by bivariate and multivariate growth models where measurement windows permit, by cross-lagged models within instrument-stable windows, by cohort-sequential or repeated-cohort designs that can separate age, period, and cohort effects, and—most valuably—by designs that add a comparison group of non-migrant-background peers, which the MAPS first cohort by construction cannot supply. Studies that pool composites across the wave-6 and wave-7 instrument changes without testing invariance should be treated with caution, and published estimates that span those boundaries merit re-examination.
5.4. Limitations
Design and interpretation. The design is observational: the growth models describe change and its covariation, not effects, and the direction of the association between support growth and psychosocial growth is not identified. A single birth cohort observed over a single historical period confounds age, period, and cohort, so every developmental reading of these results is equally a reading of the 2011–2019 period; because the MAPS first cohort samples only migrant-background youth, it also cannot be determined whether the observed trends are specific to this population or shared with the wider Korean cohort. Negative baseline intercept–slope correlations are not interpreted substantively because they are confounded with regression to the mean, baseline measurement error, and ceiling compression [39], and the variance-narrowing finding substituted for them is descriptive. The equivalence bound for family support is a reasoned but chosen benchmark [38].
Measurement. All constructs are self-reported by the same respondents in the same instrument. Common-method variance plausibly inflates the level correlations [36]; the bivariate growth models protect the slope correlations from its same-wave component, but a method component that drifts within persons over years—including changes in response style across adolescence—cannot be excluded. The support variables measure perceived support, not network structure. Formal latent-variable measurement invariance was not established: the wave-7 self-esteem change cannot be bridged by any analysis of these data, and for the constructs with unchanged item sets, continuity of items is not the same as invariance of the construct metric, which remains an assumption of the growth models. Linear growth is primary; curvature was modelled only for peer support, and six occasions per instrument period leave any curvature estimate resting on few points.
Sampling and attrition. The measurement windows are unequal and every relational series ends before young adulthood. The growth models assume that missingness is at random conditional on the modelled trajectory; the final-wave and construct-specific weighting analyses support but cannot prove this, and person fixed effects remove selection only on time-invariant characteristics, so attrition related to time-varying characteristics is not addressed by any of these procedures. No sampling weights accompany the released files, so all estimates describe the panel rather than the national population.
6. Conclusions
Across late elementary and middle school, perceived peer and teacher support rose among the first MAPS cohort of migrant-background children while acculturative stress declined, and perceived family support, observed through the end of high school, showed no robust directional change. The direction of the school–family divergence was unchanged under person fixed effects and inverse-probability-of-retention weighting, and an item set held constant across waves yielded larger, not smaller, school-based increases. Around these averages, individuals differed reliably, and bivariate latent growth models show that respondents with larger estimated increases in perceived support also tended to show larger increases in self-esteem and larger decreases in acculturative stress. The spread of perceived school-based support narrowed across the window; whether gains were concentrated among those who began lowest cannot be distinguished from regression to the mean in this design.
These conclusions are bounded by what the panel measured: self-esteem cannot be followed as one fourteen-year trajectory, school-based support cannot be followed into high school, and no relational construct can be followed into young adulthood. For secondary users of the panel, the reverse-scoring of the post-2017 self-esteem instrument is a correction to verify before any analysis (Supplementary Table S9).
For the social pillar of sustainability, the results provide an individual-level baseline compatible with one conception of maintained and converging relational capacity [6,7], and they support the distribution of perceived peer and teacher support as a candidate monitoring indicator under SDG 4 and SDG 10 for the school years the instruments cover. Improving measurement continuity—reinstating the support instruments in the young-adult waves and publishing reliability, scoring, and weights alongside the data—is the precondition for extending that substantive knowledge, rather than a substitute for it.
Supplementary Materials
The following supporting information can be downloaded at https://www.mdpi.com/article/10.3390/su182111301/s1, Table S1: Wave-by-wave means, standard deviations, 95% confidence intervals, and valid sample sizes for all constructs across the 12 MAPS waves; Table S2: Wave-by-wave Cronbach’s , item counts, and complete-case sample sizes for every construct, including the nine-item self-esteem scale with and without reverse scoring; Table S3: Wave-1 comparison of eventual completers and non-completers; Table S4: Full multilevel growth model output including variance components and optimiser notes; Table S5: Inverse-probability-of-retention-weighted trend estimates and the retention model; Table S6: Slope-difference tests, including the independent-estimates statistic retained as a consistency check for the stacked models; Table S7: Bivariate latent growth model estimates and the growth-rate correlation audit (per-pair contributing n, partial correlations controlling baselines, and the overlap-threshold sensitivity analysis); Table S8: Wave-by-wave between-person standard deviations and the midpoint-centred intercept–slope correlations; Table S9: Released variable stems, the wave-6 item crosswalk, and scoring instructions, including the reverse-scored self-esteem items; Table S9b: Item–total correlations of the post-2017 self-esteem items before and after reversal, with omega coefficients; Table S9c: Released wording of every item, from the official codebook; Table S10: Self-esteem level correlations computed separately within each instrument period; Table S11: Construct-specific retention models and weighted trends; Code S1: Analysis scripts.
Funding
This research received no external funding.
Institutional Review Board Statement
Not applicable.
Informed Consent Statement
Not applicable.
Data Availability Statement
The MAPS data analysed in this study are third-party data available from the National Youth Policy Institute (NYPI) Youth Panel Data service (https://www.nypi.re.kr) upon application and approval. The author does not have permission to redistribute the raw data. The analysis code that derives every composite, model, table, and figure in this paper from the released files, including the reverse-scoring correction described in Section 3.2, is provided as Supplementary Code S1.
Acknowledgments
During the preparation of this manuscript, the author used a generative AI large language model (Anthropic Claude, model Claude Fable 5, accessed via the Claude Code environment) for English-language translation of the original Korean draft, LaTeX formatting assistance, and drafting assistance for the descriptive and multilevel analysis code. All analytical decisions, verification of outputs against the source data, and interpretation are the author’s own; the author has reviewed and edited all output and takes full responsibility for the content of this publication.
Conflicts of Interest
The author declares no conflicts of interest.
Abbreviations
The following abbreviations are used in this manuscript:
| MAPS | Multicultural Adolescents Panel Study |
| NYPI | National Youth Policy Institute |
| CI | Confidence Interval |
| SDG | Sustainable Development Goal |
| OLS | Ordinary Least Squares |
| EB | Empirical Bayes |
| IPW | Inverse Probability Weighting |
References
- Ministry of Education; Korean Educational Development Institute. 2025 Basic Education Statistics; (Press Release, 29 August 2025); Ministry of Education: Sejong, Republic of Korea, 2025. Available online: https://eiec.kdi.re.kr/policy/materialView.do?num=270346 (accessed on 27 July 2026). (In Korean)
- Ministry of Gender Equality and Family. The Fourth Basic Plan for Multicultural Family Policy (2023–2027); Joint Ministries: Sejong, Republic of Korea, 2023. Available online: https://www.mogef.go.kr (accessed on 14 July 2026). (In Korean)
- United Nations General Assembly. Transforming Our World: The 2030 Agenda for Sustainable Development; Resolution A/RES/70/1, adopted 25 September 2015; United Nations: New York, NY, USA, 2015; Available online: https://docs.un.org/en/A/RES/70/1 (accessed on 20 August 2026).
- OECD. The Resilience of Students with an Immigrant Background: Factors That Shape Well-Being; OECD Reviews of Migrant Education; OECD Publishing: Paris, France, 2018. [Google Scholar] [CrossRef] [Scilit]
- UNESCO. Global Education Monitoring Report 2019: Migration, Displacement and Education—Building Bridges, Not Walls; UNESCO: Paris, France, 2019. [Google Scholar] [CrossRef] [Scilit]
- Vallance, S.; Perkins, H.C.; Dixon, J.E. What Is Social Sustainability? A Clarification of Concepts. Geoforum 2011, 42, 342–348. [Google Scholar] [CrossRef] [Scilit]
- Dempsey, N.; Bramley, G.; Power, S.; Brown, C. The Social Dimension of Sustainable Development: Defining Urban Social Sustainability. Sustain. Dev. 2011, 19, 289–300. [Google Scholar] [CrossRef] [Scilit]
- Eizenberg, E.; Jabareen, Y. Social Sustainability: A New Conceptual Framework. Sustainability 2017, 9, 68. [Google Scholar] [CrossRef] [Scilit]
- Boström, M. A Missing Pillar? Challenges in Theorizing and Practicing Social Sustainability: Introduction to the Special Issue. Sustain. Sci. Pract. Policy 2012, 8, 3–14. [Google Scholar] [CrossRef] [Scilit]
- Furman, W.; Buhrmester, D. Age and Sex Differences in Perceptions of Networks of Personal Relationships. Child Dev. 1992, 63, 103–115. [Google Scholar] [CrossRef]
- Baumeister, R.F.; Leary, M.R. The Need to Belong: Desire for Interpersonal Attachments as a Fundamental Human Motivation. Psychol. Bull. 1995, 117, 497–529. [Google Scholar] [CrossRef]
- Meroni, C.; Velasco, V. School-Based Interventions for Migrant Students in the Framework of the Health Promoting Whole-School Approach: An Umbrella Review. Sustainability 2023, 15, 1894. [Google Scholar] [CrossRef] [Scilit]
- Medina Podadera, M.d.C.; González-Jimenez, A.J. Teachers’ Perceptions of Immigrant Students and Families: A Qualitative Study. Sustainability 2023, 15, 12632. [Google Scholar] [CrossRef] [Scilit]
- Yang, K.-M.; Lee, J.-M.; Jeong, Y.-M.; Eom, J.-S.; Jang, Y.-S.; Jeon, K.-S. 2022 Longitudinal Study of Multicultural Adolescents: Summary Report; (Research Report 22-General-03); National Youth Policy Institute: Sejong, Republic of Korea, 2022. (In Korean) [Google Scholar]
- Gerring, J. Mere Description. Br. J. Polit. Sci. 2012, 42, 721–746. [Google Scholar] [CrossRef] [Scilit]
- Berry, J.W. Immigration, Acculturation, and Adaptation. Appl. Psychol. Int. Rev. 1997, 46, 5–34. [Google Scholar] [CrossRef] [Scilit]
- Rudmin, F.W. Critical History of the Acculturation Psychology of Assimilation, Separation, Integration, and Marginalization. Rev. Gen. Psychol. 2003, 7, 3–37. [Google Scholar] [CrossRef]
- Schwartz, S.J.; Unger, J.B.; Zamboanga, B.L.; Szapocznik, J. Rethinking the Concept of Acculturation: Implications for Theory and Research. Am. Psychol. 2010, 65, 237–251. [Google Scholar] [CrossRef] [Scilit]
- Phinney, J.S. Ethnic Identity in Adolescents and Adults: Review of Research. Psychol. Bull. 1990, 108, 499–514. [Google Scholar] [CrossRef]
- Phinney, J.S.; Horenczyk, G.; Liebkind, K.; Vedder, P. Ethnic Identity, Immigration, and Well-Being: An Interactional Perspective. J. Soc. Issues 2001, 57, 493–510. [Google Scholar] [CrossRef] [Scilit]
- Umaña-Taylor, A.J.; Quintana, S.M.; Lee, R.M.; Cross, W.E., Jr.; Rivas-Drake, D.; Schwartz, S.J.; Syed, M.; Yip, T.; Seaton, E. Ethnic and Racial Identity in the 21st Century Study Group. Ethnic and Racial Identity During Adolescence and Into Young Adulthood: An Integrated Conceptualization. Child Dev. 2014, 85, 21–39. [Google Scholar] [CrossRef] [Scilit]
- McPherson, M.; Smith-Lovin, L.; Cook, J.M. Birds of a Feather: Homophily in Social Networks. Annu. Rev. Sociol. 2001, 27, 415–444. [Google Scholar] [CrossRef] [Scilit]
- Burt, R.S. Structural Holes and Good Ideas. Am. J. Sociol. 2004, 110, 349–399. [Google Scholar] [CrossRef] [Scilit]
- Way, N.; Reddy, R.; Rhodes, J. Students’ Perceptions of School Climate During the Middle School Years: Associations with Trajectories of Psychological and Behavioral Adjustment. Am. J. Community Psychol. 2007, 40, 194–213. [Google Scholar] [CrossRef] [Scilit]
- Kim, Y.; Kim, H.K. Longitudinal Effects of Family Support and Fluency in Korean on Adolescents’ School Adjustment among Multicultural Families in Korea: The Role of Acculturative Stress and Depressive Symptoms. Korean J. Youth Stud. 2020, 27, 367–396. (In Korean) [Google Scholar] [CrossRef] [Scilit]
- Eun, S.; Lee, S.; Lee, K. Acculturative Stress amongst Multicultural Adolescents: Patterns, Predictors, and Psychosocial Outcomes. Stud. Korean Youth 2019, 30, 177–211. (In Korean) [Google Scholar] [CrossRef] [Scilit]
- Park, H.; Park, H.; Lee, C.-H.; Shin, H.-J. Bicultural Acceptance Attitude and School Adjustment among Multicultural Adolescents: Biculturalism as an Acculturation Strategy. Multicult. Peace 2024, 18, 95–113. (In Korean) [Google Scholar] [CrossRef]
- Hong, M.; Lee, J. The Longitudinal Study of Bicultural Acceptance of Multicultural Adolescents: Application of Latent Growth Model. J. Educ. Innov. Res. 2023, 33, 163–187. (In Korean) [Google Scholar] [CrossRef]
- Yang, K.; Ham, S. Multicultural Policy and Social Integration: The Case of Multicultural Education Policy and Its Effect on Immigrant Children’s Sense of Belonging to School. Korea Soc. Policy Rev. 2015, 22, 9–31. (In Korean) [Google Scholar] [CrossRef] [Scilit]
- Lee, H.-J. An Analysis on the Process of Identity Transformation and School Adaptation of Adolescents in Korea’s Multicultural Families. Korean J. Sociol. 2018, 52, 77–115. (In Korean) [Google Scholar] [CrossRef] [Scilit]
- Lee, S.; Lee, S.J.; Kim, H. Trajectories of Depressive Symptoms among Multicultural Middle and High School Adolescents: A Longitudinal Study Using Latent Class Growth Model. Res. Community Public Health Nurs. 2024, 35, 401–414. [Google Scholar] [CrossRef] [Scilit]
- National Youth Policy Institute. Multicultural Adolescents Panel Study (MAPS) User’s Guide: First Panel, Waves 1–10, 12, and 14; (Last Revised 31 December 2025). Distributed with the MAPS Data Through the NYPI Youth Panel Data Service; National Youth Policy Institute: Sejong, Republic of Korea, 2025; Available online: https://www.nypi.re.kr (accessed on 10 July 2026).
- Cronbach, L.J. Coefficient Alpha and the Internal Structure of Tests. Psychometrika 1951, 16, 297–334. [Google Scholar] [CrossRef] [Scilit]
- Rosenberg, M. Society and the Adolescent Self-Image; Princeton University Press: Princeton, NJ, USA, 1965. [Google Scholar] [CrossRef] [Scilit]
- MacCallum, R.C.; Kim, C.; Malarkey, W.B.; Kiecolt-Glaser, J.K. Studying Multivariate Change Using Multilevel Models and Latent Curve Models. Multivar. Behav. Res. 1997, 32, 215–253. [Google Scholar] [CrossRef] [Scilit]
- Podsakoff, P.M.; MacKenzie, S.B.; Lee, J.-Y.; Podsakoff, N.P. Common Method Biases in Behavioral Research: A Critical Review of the Literature and Recommended Remedies. J. Appl. Psychol. 2003, 88, 879–903. [Google Scholar] [CrossRef] [Scilit]
- Paternoster, R.; Brame, R.; Mazerolle, P.; Piquero, A. Using the Correct Statistical Test for the Equality of Regression Coefficients. Criminology 1998, 36, 859–866. [Google Scholar] [CrossRef] [Scilit]
- Lakens, D. Equivalence Tests: A Practical Primer for t Tests, Correlations, and Meta-Analyses. Soc. Psychol. Personal. Sci. 2017, 8, 355–362. [Google Scholar] [CrossRef] [Scilit] [PubMed]
- Barnett, A.G.; van der Pols, J.C.; Dobson, A.J. Regression to the Mean: What It Is and How to Deal with It. Int. J. Epidemiol. 2005, 34, 215–220. [Google Scholar] [CrossRef] [Scilit] [PubMed]
- Yang, K.-M.; Kwon, O.-Y. A Study on Competency Enhancement for Migrant-Background Youth: Focusing on Youth Activity Programs; (Research Report 25-Occasional-02); National Youth Policy Institute: Sejong, Republic of Korea, 2025; Available online: https://www.nypi.re.kr/repository/handle/2022.oak/6624 (accessed on 14 July 2026). (In Korean)
- Yang, K.-M.; Kwon, O.-Y.; Seo, J.-A.; Byun, S.-J.; Jang, Y.-S. A Study on Social Integration Measures for Migrant-Background Young Adults I; (Research Report 25-General-03); National Youth Policy Institute: Sejong, Republic of Korea, 2025; Available online: https://www.nypi.re.kr/repository/handle/2022.oak/6591 (accessed on 14 July 2026). (In Korean)
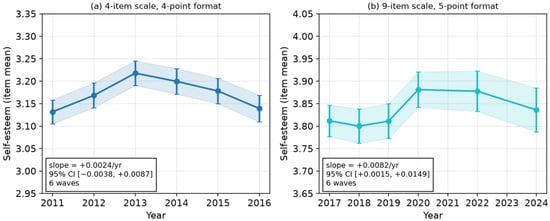
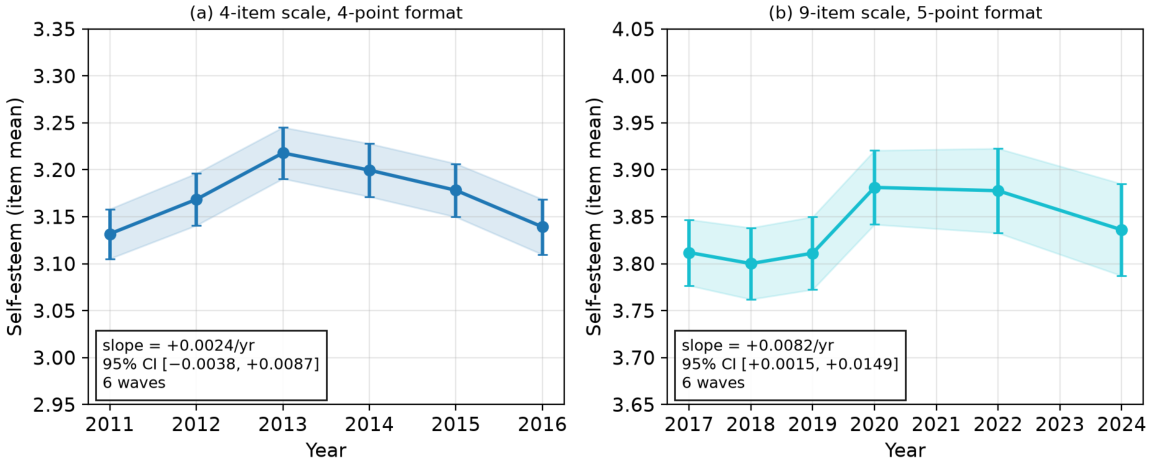
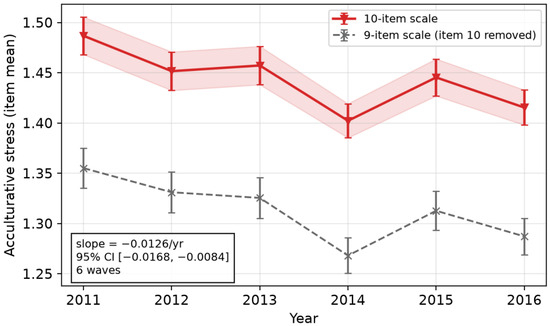
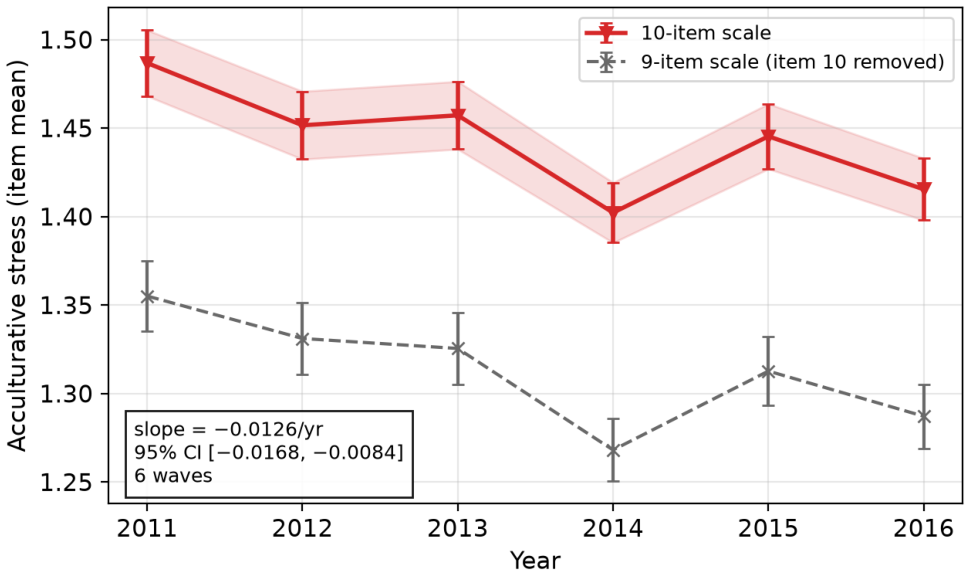
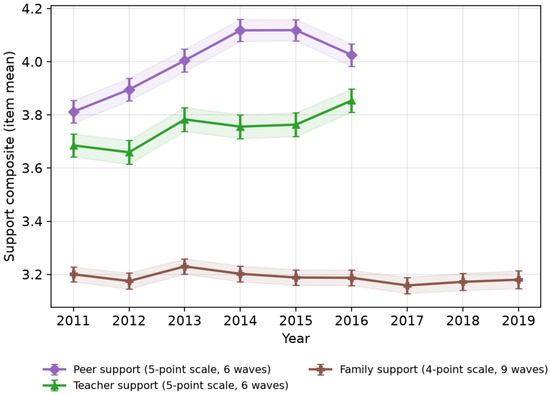
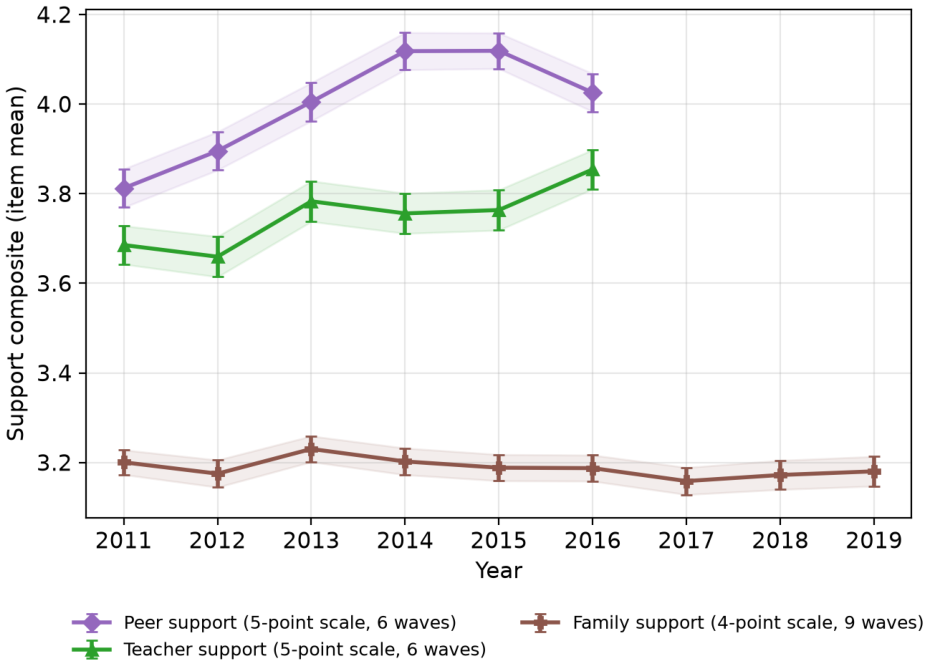
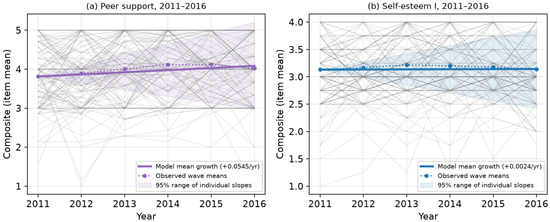
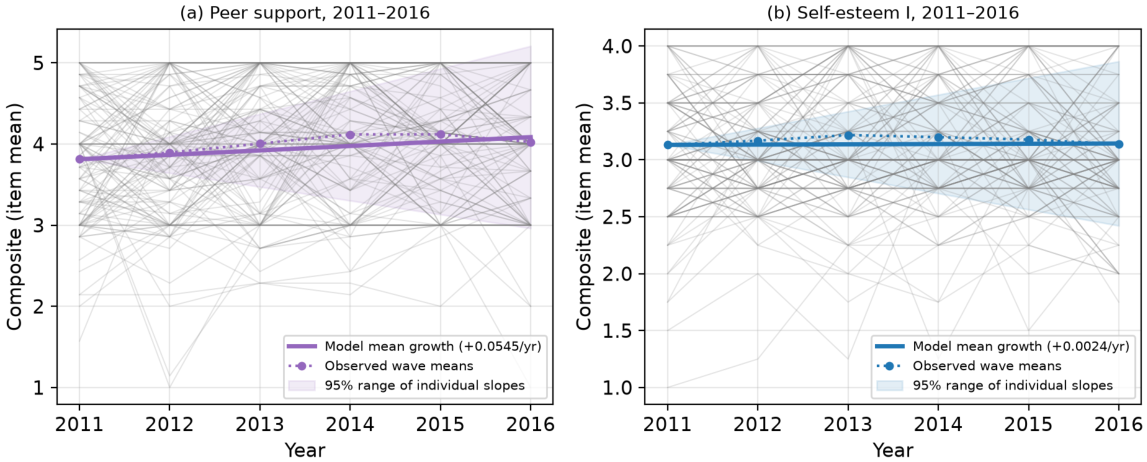
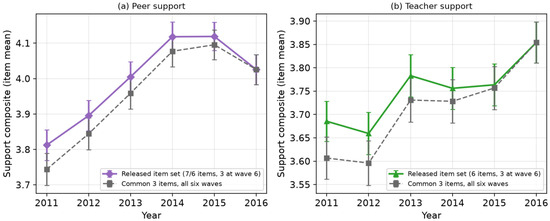
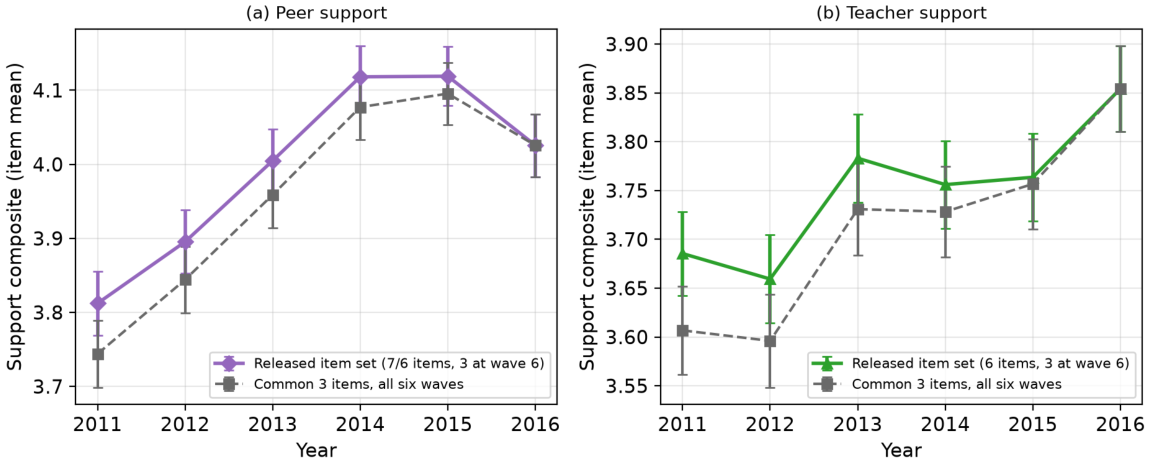
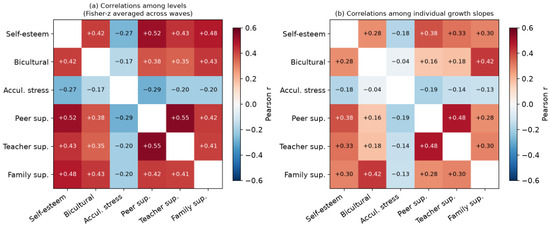
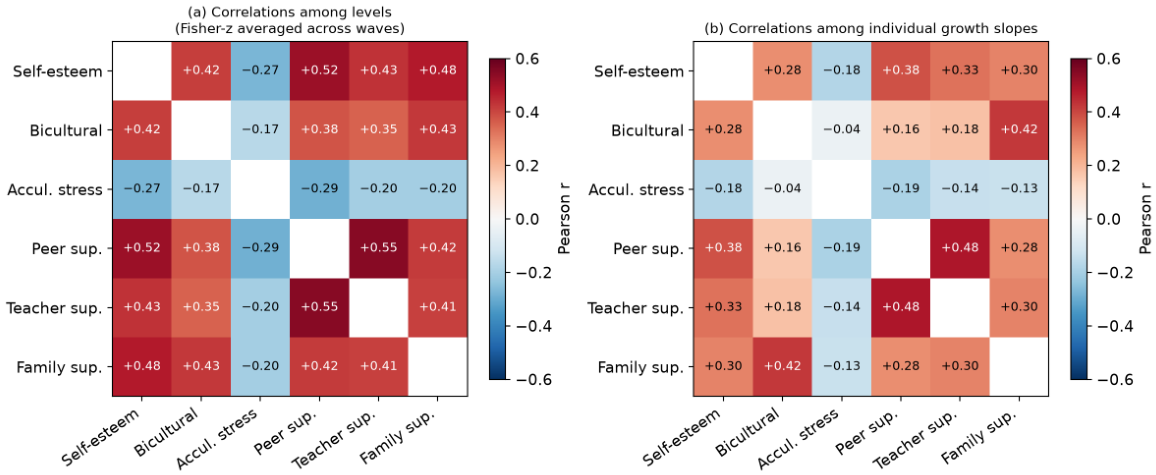

Disclaimer/Publisher’s Note: The statements, opinions and data contained in all publications are solely those of the individual author(s) and contributor(s) and not of MDPI and/or the editor(s). MDPI and/or the editor(s) disclaim responsibility for any injury to people or property resulting from any ideas, methods, instructions or products referred to in the content. |
© 2026 by the author. Licensee MDPI, Basel, Switzerland. This article is an open access article distributed under the terms and conditions of the Creative Commons Attribution (CC BY) license.