


Abstract
The rising instability in global energy markets and fuel supply challenges in 2026 have intensified the search for sustainable alternative fuels. Since most plastics originate from petrochemical sources, they represent a valuable feedstock for energy recovery once they become waste. In this study, high-density polyethylene plastic waste was processed via pyrolysis to produce pyrolytic oil, which was characterized and compared with conventional extra-light heating oil. Evaluating the atomization performance of high-density polyethylene pyrolytic oil represents an important technical step toward assessing its potential for more sustainable plastic waste valorization and alternative heating applications. The atomization behavior of both fuels was investigated through a combined experimental and numerical approach. The spray characteristics were measured using the VISISIZE 60N droplet characterization system, enabling detailed analysis of the droplet size distribution. In parallel, CFD simulations were conducted in Ansys FLUENT using the Euler–Lagrange framework. The pressure-swirl atomizer was modeled with a Linear Instability Sheet Atomization model to describe the primary breakup, with emphasis on the influence of the model constants. The results show that the pyrolytic oil exhibits spray characteristics comparable to heating oil, with only minor differences in the droplet size distribution and breakup behavior. The CFD simulations captured the droplet size distribution trends successfully, confirming the predictive capability of the Euler–Lagrange framework. These findings indicate that pyrolytic oil is a viable alternative fuel for pressure-swirl atomization systems, contributing to both waste valorization and mitigation of the current energy challenges.
1. Introduction
The global energy demand continues to increase, while fossil fuel consumption remains persistently high. In 2025, the global energy demand increased by 1.3%, accompanied by an increase in the consumption of oil, natural gas, and coal. At the same time, the global energy-related CO2 emissions increased by approximately 0.4% and reached a new record level [1]. These trends indicate the continued dependency and importance of fossil fuels in the global energy system and the challenges associated with reducing their consumption. Recent geopolitical events and disruptions in supply chains have highlighted the importance of ensuring energy security and a reliable energy supply further. Consequently, reducing dependence on conventional fuels has become an increasingly important part of national energy policies, with measures aimed at reducing dependence on individual energy sources currently being implemented in approximately 150 countries, while increasing attention is also being devoted to the development and innovation of alternative fuels [2].
Heating represents a particularly important sector of final energy in use. In the European Union, households accounted for 26% of the final energy consumption in 2024, with space heating accounting for 61.5% of household energy consumption. Of the energy used for space heating, natural gas accounted for 34.7%, renewable energy sources for 32.3%, and petroleum products for 12.7% [3]. At the national level, extra light heating oil (ELKO) still accounted for around 8% of the total household energy consumption in Slovenia in 2024, compared with approximately 7% for natural gas [4]. These trends emphasize the continued importance of liquid fuels in heating applications and provide a basis for investigating alternative fuels that could replace conventional petroleum-based fuels partially.
One of the potential technologies for producing alternative fuels, suitable for use in household space heating applications, is the thermal pyrolysis process of plastic wastes, which are fundamentally hydrocarbon-based products. In this process, heat is supplied in an inert, oxygen-free atmosphere to achieve the decomposition of long-chain polymers into smaller, lower molecular weight compounds. The products of this process have high energy potential, while simultaneously addressing the issue of plastic waste and the associated environmental concerns [5,6]. Recent studies have also examined the optimization of processing conditions for mixed plastic waste [7], the techno-economic feasibility of catalytic pyrolysis [8], and the carbon footprint of polyethylene waste treatment pathways, including pyrolysis [9]. One of the most interesting products of pyrolysis is pyrolytic oil, which has been investigated most commonly for use in internal combustion engines [10,11,12,13], while some studies have also been reported in the field of gas turbines [14,15,16,17], boilers and heaters [18,19,20]. The available literature indicates that pyrolytic oil can be used as a partial or complete substitute for conventional liquid fuels. However, the combustion characteristics, thermal system efficiency, and emissions depend strongly on the oil composition, the degree of its processing, and its proportion in blends with conventional fuels. Most studies have therefore focused primarily on the thermal system performance and emission characteristics, while considerably less attention has been devoted to the atomization process itself, and to the influence of the physical properties of pyrolytic oil on droplet formation and size.
The atomization process itself is one of the key factors influencing the operating efficiency of thermal systems, as it affects the uniformity of fuel–air mixing, the evaporation rate, and mass and heat transfer between fuel droplets and gas in the combustion chamber directly [21,22]. Experimental characterization of the atomization of waste plastic pyrolytic oils has so far been investigated by the research groups of Szwaya et al. [23], Malode et al. [24] and Karthik et al. [25]. In a comparative analysis of the atomization of distilled pyrolytic oil derived from high-density polyethylene plastic and 91-octane gasoline, Szwaya et al. [23] observed similar droplet size distribution, with the Sauter mean diameter of the pyrolytic oil being approximately 1 μm larger than that of gasoline. Based on the injection results, the authors did not identify any significant limitations regarding the use of distilled pyrolytic oil in high-pressure direct injection. Malode et al. [24], in a qualitative analysis of the atomization of a blend of polypropylene (PP) pyrolytic oil and diesel fuel using an air-assisted nozzle, found that the velocity of the injected air affects the reduction in breakup length, breakup frequency and spray angle significantly. Karthik et al. [25] likewise conducted a qualitative assessment of the atomization performance of a blend containing 10% PP pyrolytic oil and 90% diesel fuel using an effervescent atomizer. Similarly to Malode et al. [24], they found that increasing the injected air velocity decreases the jet breakup length and increases the spray angle. During the initial stage of the breakup, they also observed the occurrence of dilatational or symmetric instabilities on the continuous jet at the nozzle exit.
In addition to the experimental investigation of the atomization performance of waste plastic pyrolytic oils, only a few numerical studies have addressed the related phenomena associated with fuel injection, spray formation, and in-nozzle flow. Naima et al. [26] analyzed the combustion of pyrolytic oil derived from polyethylene (PE) waste in a direct-injection (DI) diesel engine experimentally and numerically using a modified Kelvin-Helmholtz-Rayleigh-Taylor (KH-RT) model to describe the spray breakup. They found that PE pyrolytic oil, due to its lower viscosity, achieved a slightly greater penetration length initially than diesel fuel, whereas, during the later stages of injection, diesel achieved a greater jet penetration length, which was attributed to its longer ignition delay. Since the flow phenomena inside the injection nozzle also have a significant influence on atomization performance [27], Lešnik et al. [28] analyzed the influence of high-density (HDPE) and low-density (LDPE) polyethylene pyrolytic oils on cavitation formation in a common-rail diesel injector. They found that the lower density and viscosity of pyrolytic oil promote cavitation formation and lead to a more rapid development of cavitation structures; a larger vapor phase fraction was also observed within the nozzle orifice. Kevorkijan et al. [29] extended the study of Lešnik et al. [28] by incorporating a cavitation erosion prediction model. The cavitating flow of HDPE and LDPE pyrolytic oils was modeled using a Zwart–Gerber–Belamri cavitation model, while for assessing the cavitation erosion risk, the erosion risk indicator (ERI) was implemented into the CFD code. They found that the earlier onset of cavitation and more rapidly developed cavitation structures due to the lower density and lower viscosity of pyrolytic oils resulted in the occurrence of cavitation erosion closer to the nozzle outlet.
While these studies provide valuable insight into spray-related and in-nozzle flow phenomena, the use of waste plastic pyrolytic oils in pressure-swirl atomization systems for heating applications remains insufficiently explored. The present study therefore addresses this research gap by assessing undistilled HDPE-derived pyrolytic oil as a potential alternative for use in liquid-fuel heating systems by comparing its spray behavior directly with that of conventional extra light heating oil. The comparison combines experimental measurements with Euler–Lagrange CFD simulation, in which the liquid sheet primary breakup is described using the Linear Instability Sheet Atomization (LISA) model. Particular attention is paid to the droplet size characteristics, spatial distribution, and droplet transport, as these are the key factors governing fuel evaporation and fuel–air mixing and, consequently, influence the combustion performance and emission formation. The numerical investigation therefore complements the experimental comparison by extending the analysis of spray development beyond the experimentally accessible region.
2. Materials and Methods
2.1. Experimental Setup
2.1.1. Pyrolysis Process and Oil Characteristics
The HDPE pyrolytic oil used in the present study was produced from waste bottle caps by thermal pyrolysis in a fixed-bed batch reactor. A detailed description of the process and the complete physicochemical characterization were reported in our previous study [30]. Prior to heating, the pyrolysis reactor was flushed with nitrogen. In each run of the pyrolysis experiment, 100 g of HDPE waste was heated from the ambient temperature to 420 °C. The generated vapors were passed through a water-cooled condenser, where the liquid fraction was recovered as pyrolytic oil. The average product yields from three experiments were 76.0% oil, 12.6% solid residue, and 11.4% gas. Before use, the oil was filtered through a 4–12 μm filter paper.
Compared with conventional heating oil (ELKO) commercially sourced from Petrol d.d. (Ljubljana, Slovenia), the obtained pyrolytic oil exhibited similar overall properties, with the most relevant differences being lower density, viscosity, and surface tension. The density (ρ) was approximately 4% lower, while the dynamic (μ) and kinematic (υ) viscosities were lower by 24.4% and 19.6%, respectively. The surface tension (σ) of the HDPE pyrolytic oil was 11.6% lower compared to ELKO. The corresponding values, which were also used in the numerical analysis, are summarized in Table 1.
Table 1.
Physical properties of ELKO and HDPE oil.
2.1.2. Spray Visualization and Droplet Characterization Methodology
The experimental spray data used for comparison with the numerical results were obtained using the VisiSize N60 system (Oxford Lasers Ltd., Didcot, Oxfordshire, UK), following the methodology described in detail in reference [30]. The system is based on the Particle/Droplet Image Analysis (PDIA) technique. The experiments were conducted using a Steinen Twin Filter pressure-swirl nozzle (Wm. Steinen Manufacturing Co., Parsippany, NJ, USA) at an injection pressure of 10 bar. The temperature of the ambient air and both oils was 24 °C. The pressure was measured upstream of the nozzle using a Kistler 7031 pressure transducer (Kistler Instrumente AG, Winterthur, Switzerland), which was calibrated prior to the experiments, with a reported calibration error below 1%. Before image acquisition, the flow was allowed to stabilize for 3 s.
For each fuel, 100 images were recorded at 15 fps and processed within a field of view of approximately 10 × 6 mm positioned at the nozzle exit. The VisiSize N60 system was operated using the manufacturer’s factory calibration for the corresponding optical configuration, with a spatial calibration factor of 5.617 µm/pixel. The recorded images were processed using the VisiSize software version 6.5.44 to determine the droplet-size distributions and characteristic droplet diameter used for validation of the numerical results. Identical image processing settings were applied to both fuels, including an adaptive threshold of 85 and a shape parameter of 0.7. The adaptive threshold was used to distinguish droplet shadow from the illuminated background, while the shape parameter, calculated from the ratio of the principal moments of inertia of the detected droplet shadow, was used to evaluate deviations from the circular shape. Focus, shape and border rejection were enabled to exclude out-of-focus, overlapping and partially visible droplets, as well as strongly non-spherical structures, including elongated liquid ligaments. In addition, depth of field (DOF) correction was applied to account for differences in the sampling depth associated with droplet size. The analysis yielded 4416 accepted in-focus droplet detections for ELKO and 3899 for HDPE pyrolytic oil. The corresponding shape-rejection rates were 10.1% and 10.9%, respectively.
2.2. Numerical Setup
2.2.1. Governing Equations and Primary Breakup Model
An Euler–Lagrange framework based on the URANS formulation was employed to simulate the atomization performance of ELKO and HDPE oils. The gas phase (air) was treated as the continuous Eulerian phase, while the dispersed liquid phase (oil) was represented by a large number of discrete Lagrangian particles. The conservation of mass and momentum for the continuous gas phase are written as:
where and denote the mean velocity and pressure of the continuous gas phase, ρgas represents the gas density, g is the gravitational acceleration vector, while is the viscous stress tensor and represents the Reynold stresses, which were modeled using the k − ω SST turbulence model. The term Smom,d represents the momentum exchange between the discrete and continuous phases resulting from the enabled two-way coupling.
The trajectories of the droplets were obtained from the Lagrangian force balance, defined by Newton’s second law as:
where md and ρd are the mass and density of the droplet, respectively, Ud is the droplet velocity vector, Ugas is the local gas velocity vector at the droplet position, τr represents the droplet relaxation time, and F represents the additional forces acting on the droplet. The drag force was evaluated using the Spherical Drag Law, and the influence of turbulent fluctuations on droplet motion was modeled using the Discrete Random Walk model.
The primary breakup of the liquid sheet generated by the pressure-swirl nozzle was modeled using the LISA model proposed by Schmidt et al. [31]. The model consists of two main steps. First, the flow conditions and the properties of the liquid sheet are determined at the nozzle exit. In the second step, the growth of disturbances on the liquid sheet is evaluated according to the linear stability analysis proposed by Senecal et al. [32], which determines the breakup location and the characteristic size of the resulting ligaments and droplets.
A characteristic feature of the pressure-swirl nozzles is the formation of an air core, which affects the thickness and velocity of the liquid sheet at the nozzle exit directly [33]. In the LISA model, the corresponding liquid-sheet thickness t at the nozzle exit is calculated as:
where d0 is the nozzle outlet diameter, is the liquid mass flow rate, ρliq. is the liquid density, and v is the axial component of the liquid-sheet velocity at the nozzle exit. The latter is related to the total liquid velocity U and the experimentally prescribed spray half-angle θ according to:
v = U cos(θ)
The total liquid velocity at the nozzle exit is determined from the pressure difference across the nozzle as:
where kv is the velocity coefficient. In the LISA formulation, kv is determined from the following expression:
The lower limit of 0.7 is an empirical approximation accounting for nozzle-related losses in the adopted LISA formulation [34]. The second term follows from mass conservation and ensures a non-negative air-core area at the nozzle exit. For the investigated conditions, this term remains below 0.7 for both fuels, and the empirical lower limit therefore governs the velocity coefficient kv.
In the second step, the LISA model considers a two-dimensional viscous liquid sheet of thickness 2 h, moving with velocity U through an initially quiescent, inviscid gas phase. Infinitesimal disturbances are imposed on the liquid sheet in the form:
where η0 is the initial disturbance amplitude, is the wave number, and ω represents the disturbance growth.
η = η0eixk+ωt
The LISA model distinguishes between long- and short-wave disturbance regimes according to the gas-phase Weber number:
In the long-wave regime, the inertial and surface tension effects are dominant, whereas viscosity and surface tension become important in the short-wave regime [32].
The breakup of the liquid sheet is assumed to occur when the amplitude of the most unstable disturbance reaches a critical value ηb, defined as:
and the breakup time τ is therefore calculated as:
where Ω = ωr,max is the maximum disturbance growth rate and represents an empirical sheet constant with a default value of 12. The corresponding breakup length Lb is defined as:
ηb = η0eΩτ
Following the liquid-sheet breakup, ligaments are formed with a characteristic diameter dL. Different expressions are used, depending on the disturbance regime for dL:
where ks is the wave number of the dominant disturbance, CL is the ligament constant with a default value of 0.5, and hb is the liquid-sheet half thickness at the breakup location. The latter decreases with the increasing breakup length according to:
where r0 is the radial distance between the nozzle exit and the liquid-sheet centreline, and is the initial liquid-sheet half-thickness.
Finally, the characteristic droplet diameter resulting from ligament breakup is calculated as:
where is the Ohnesorge number. The diameters of the injected droplets are subsequently described using a Rosin-Rammler distribution with the spread parameter 3.5.
In addition, the LISA model includes the atomizer dispersion angle β with the default value of 6°, which defines the angular dispersion of the droplets around the prescribed spray direction.
2.2.2. Computational Domain and Setup
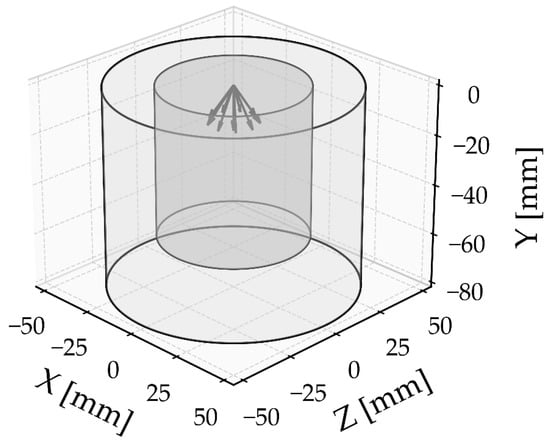
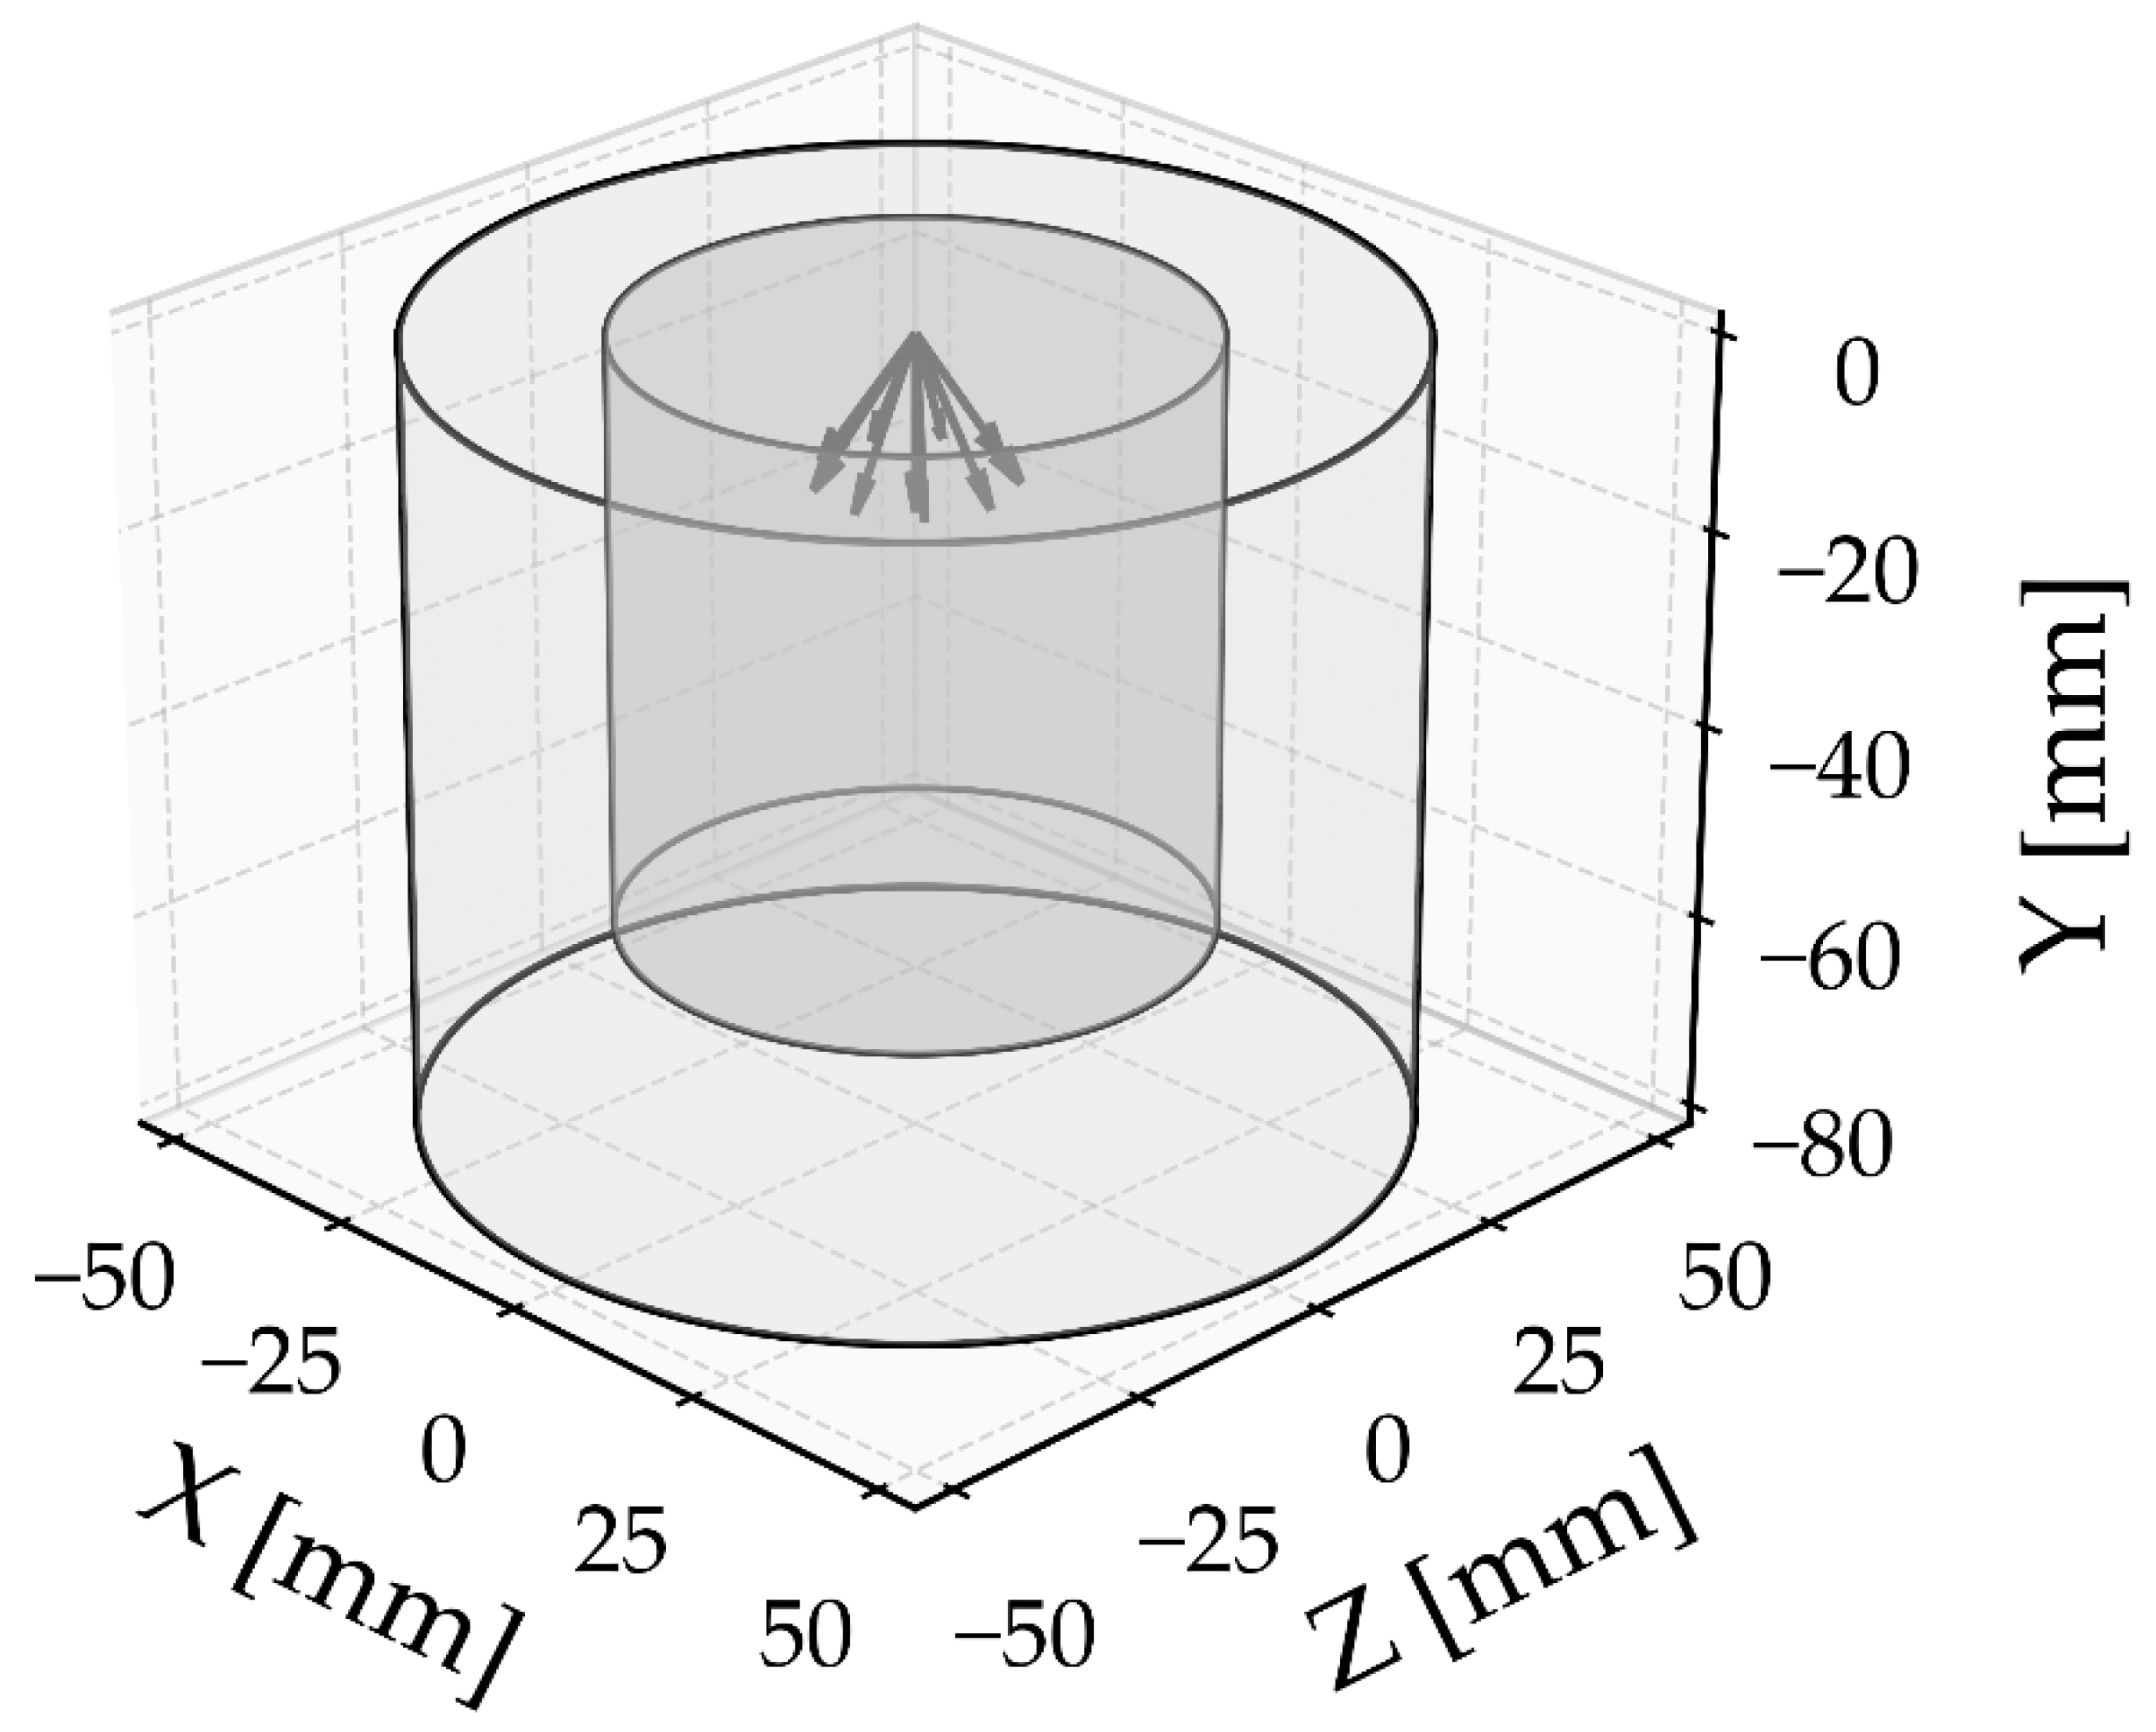
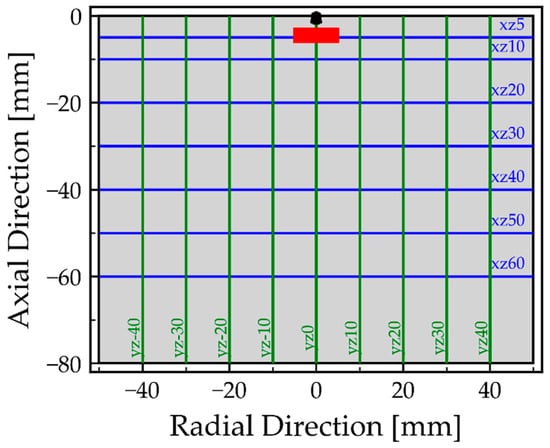
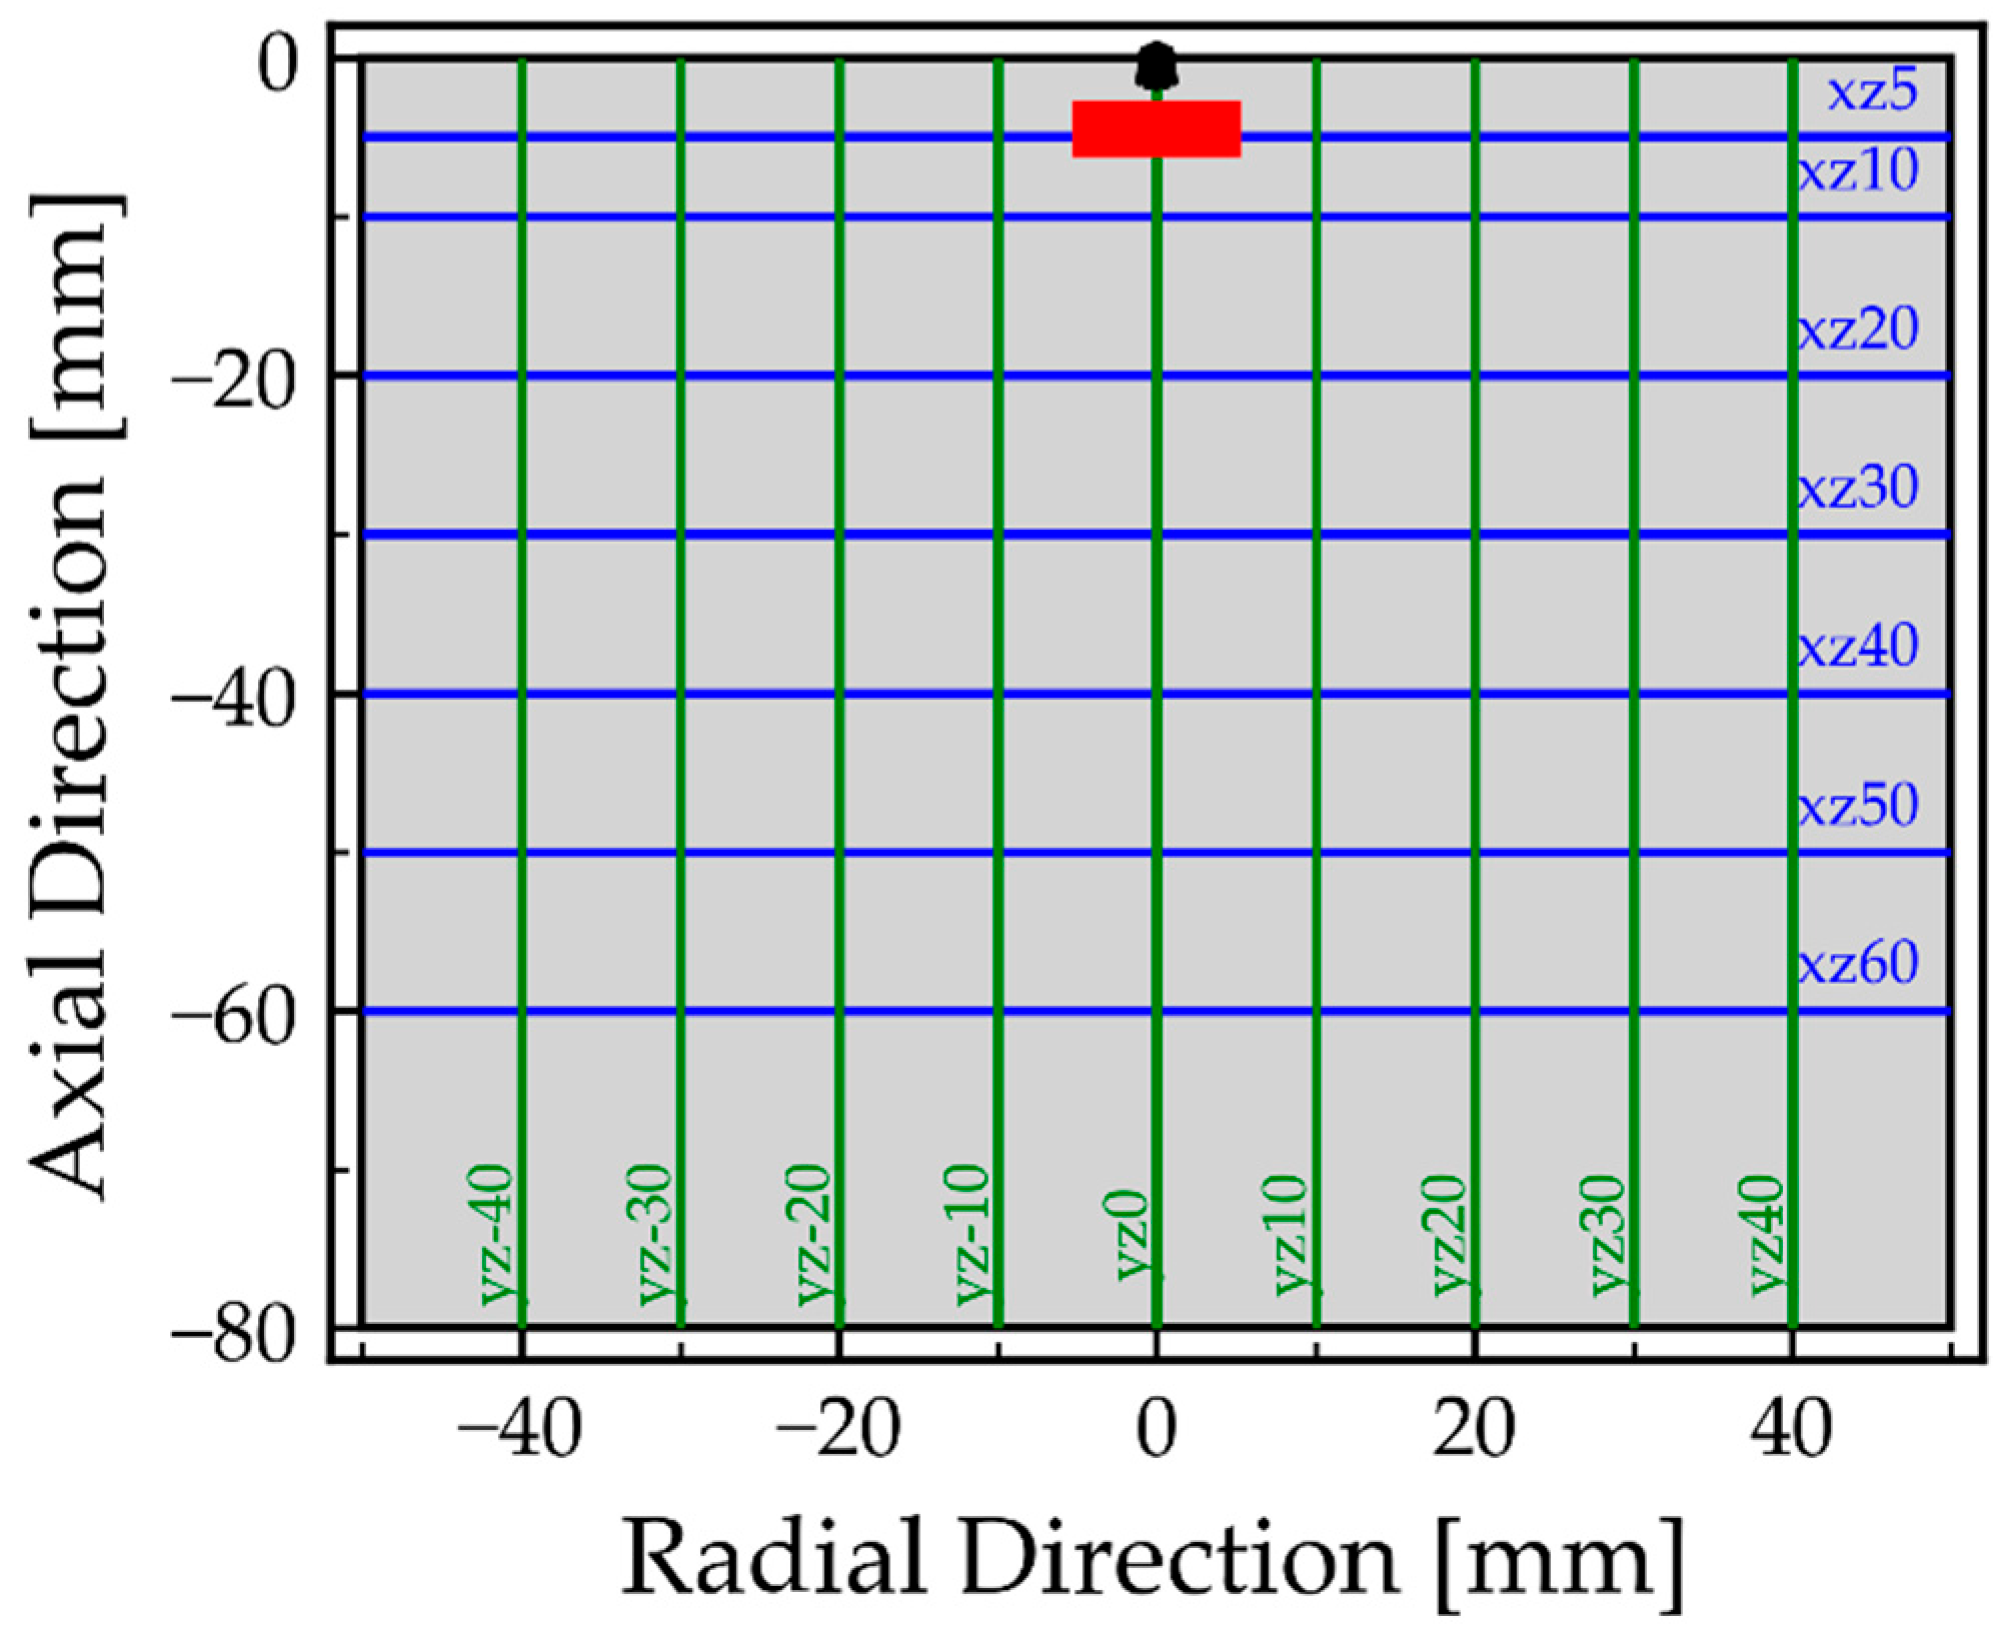
The computational domain used for the numerical analysis of the atomization performance of both oils is shown in Figure 1. In the present study, the domain was created as a cylinder with a diameter of 100 mm and height of 80 mm. An additional refinement region was introduced within the domain to provide a finer computational mesh to better resolve the aerodynamic interactions between the Eulerian gas phase and the Lagrangian dispersed phase, represented by the fuel droplets. The refinement region had a diameter of 60 mm and a height of 60 mm.
Figure 1.
Injection location and computational domain.
A characteristic feature of liquid sheet breakup modeling using the LISA model is that several parameters, including the nozzle outlet diameter, fuel mass flow rate, injection pressure, and spray-half angle, must be specified prior to the simulations as injection boundary conditions. The injection location was set on the top surface of the domain. In the present study, all of the quantities for injection were determined experimentally, and their values are provided in Table 2. The remaining boundary conditions prescribed on the domain surfaces were as follows: the upper surface of the domain was defined as a no-slip wall, while the bottom surface and the cylindrical lateral surface were defined as pressure outlets, with the relative pressure set to 0 Pa. The operating pressure for all the simulations was set to 1 atm.
Table 2.
Injection conditions for ELKO and HDPE oil.
Prior to the analysis of the numerical simulation results, a mesh independence study was performed to quantify the numerical discretization error using the Grid Convergence Index (GCI) [35,36]. The quantities selected for assessing the mesh accuracy were the time-averaged velocity at two monitoring points located 10 mm and 15 mm below the injection location, as well as the SMD evaluated for the entire domain from the Summary Report at the final time step. Furthermore, HDPE oil was selected as the reference fuel for the comparative analysis, and the default LISA parameters were applied for the primary breakup. For all three simulations, however, the spray-half angle was set to 35°, corresponding to the nominal spray-half-angle of the STEINEN nozzle used in the experiment.
Table 3 presents the characteristics of the investigated computational meshes and the corresponding analysis results. Three poly-hexcore meshes were generated, with different hexahedral cell sizes. The characteristic cell size of each mesh in Table 3 is denoted by ΔxBOI, while the cells outside the refinement region were assigned a size of 6 mm in all three cases.
Table 3.
Mesh independence study.
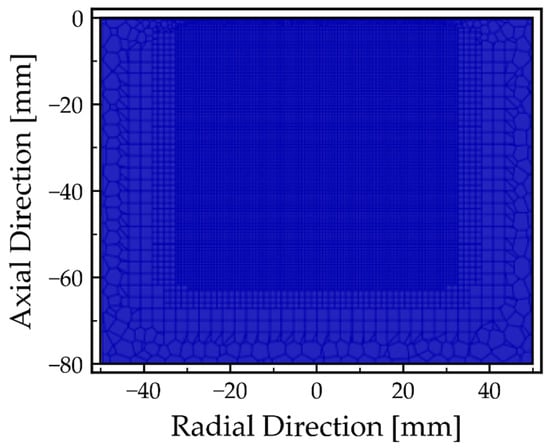
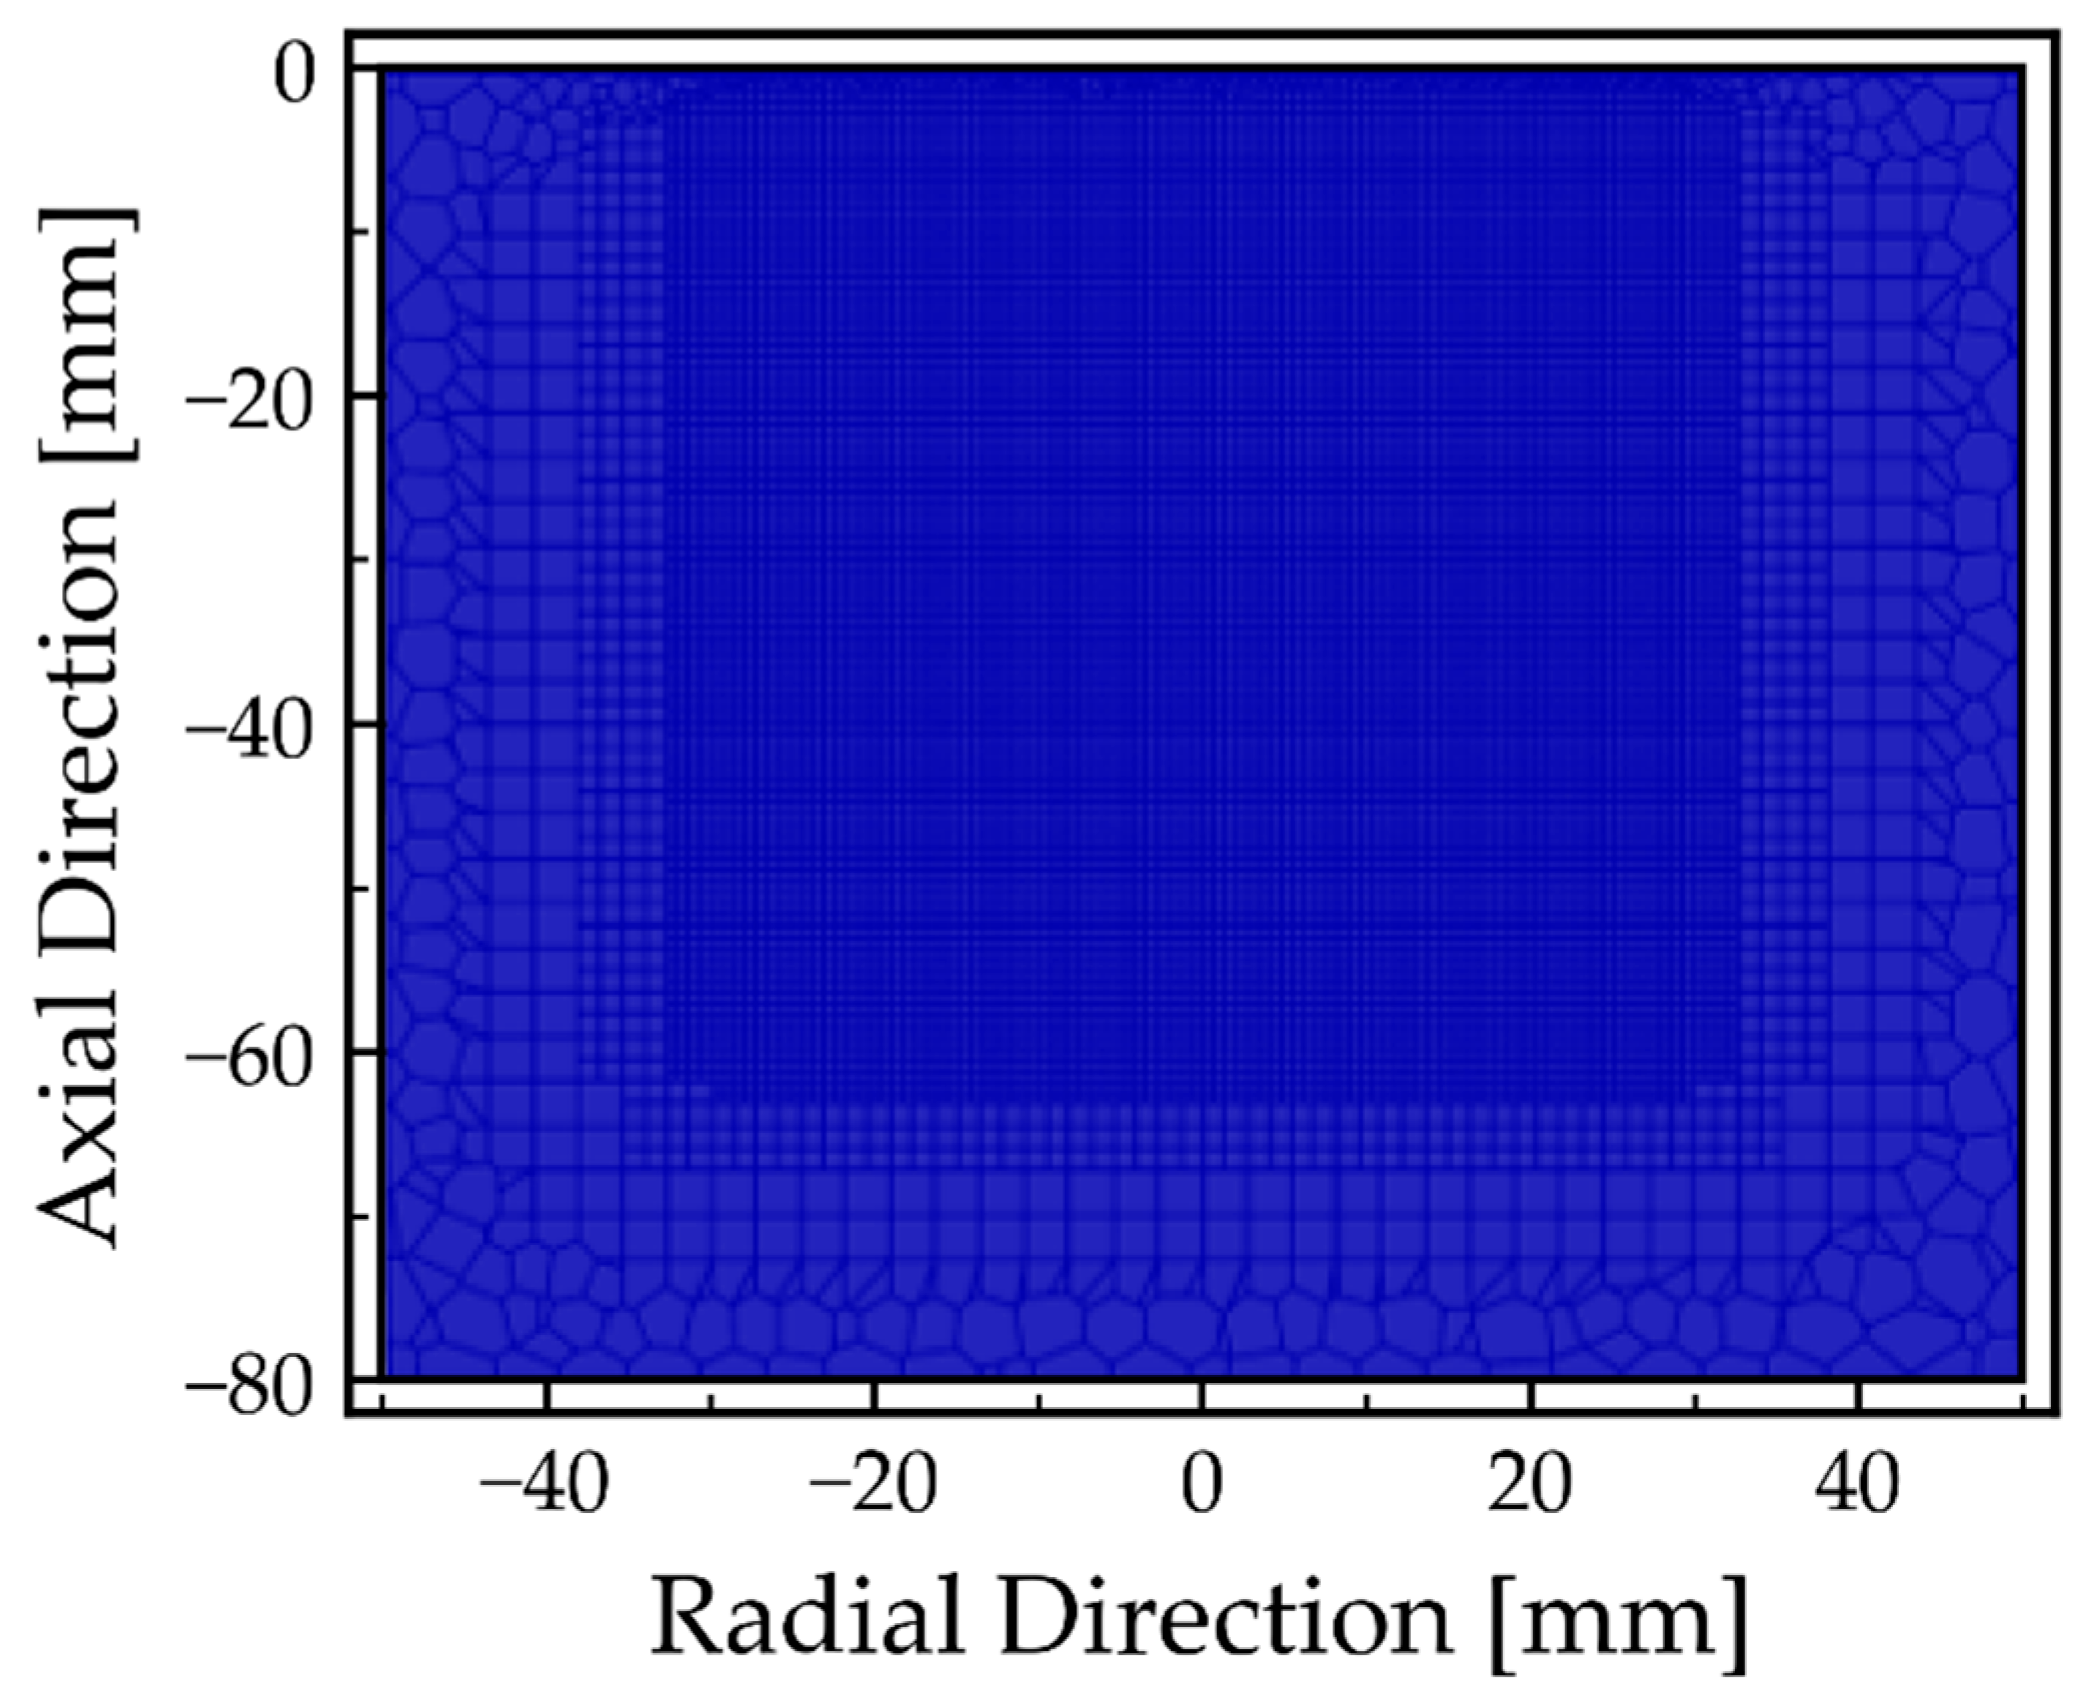
Based on the mesh independence study, the medium mesh, with a characteristic cell size of 0.68 mm and a total of 721,395 cells, was selected for the subsequent analysis of the simulation results. The medium computational mesh used in the present study is shown in Figure 2.
Figure 2.
Cross-sectional view of the medium computational mesh.
Table 4 presents the numerical schemes and other settings used throughout the simulations performed in Ansys FLUENT 2024R2 (Ansys, Inc., Canonsburg, PA, USA).
Table 4.
Numerical schemes and solver settings.
2.2.3. Droplet Size Sampling Strategy
For the analysis and validation of the droplet sizes, sampling planes for droplet tracking were defined within the computational domain, as shown in Figure 3. The experimental VisiSize data were provided as the number of droplets within an individual size class. For the subsequent statistical analysis, all the droplets belonging to the j-th size class were therefore assigned the corresponding mean diameter Dc,j as:
where Dmin,j and Dmax,j denote the lower and upper limits of the j-th size class, respectively, while Dc,j represents its mean diameter. In the subsequent equations, Di therefore denotes the diameter of the j-th considered droplet. For the experimental data, Di corresponds to the mean diameter of the respective size class j, whereas, for the numerical data, it represents the diameter of an individual DPM parcel.
Figure 3.
Sampling planes in a cross-section of the computational domain.
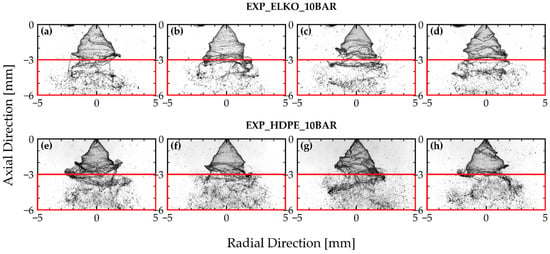
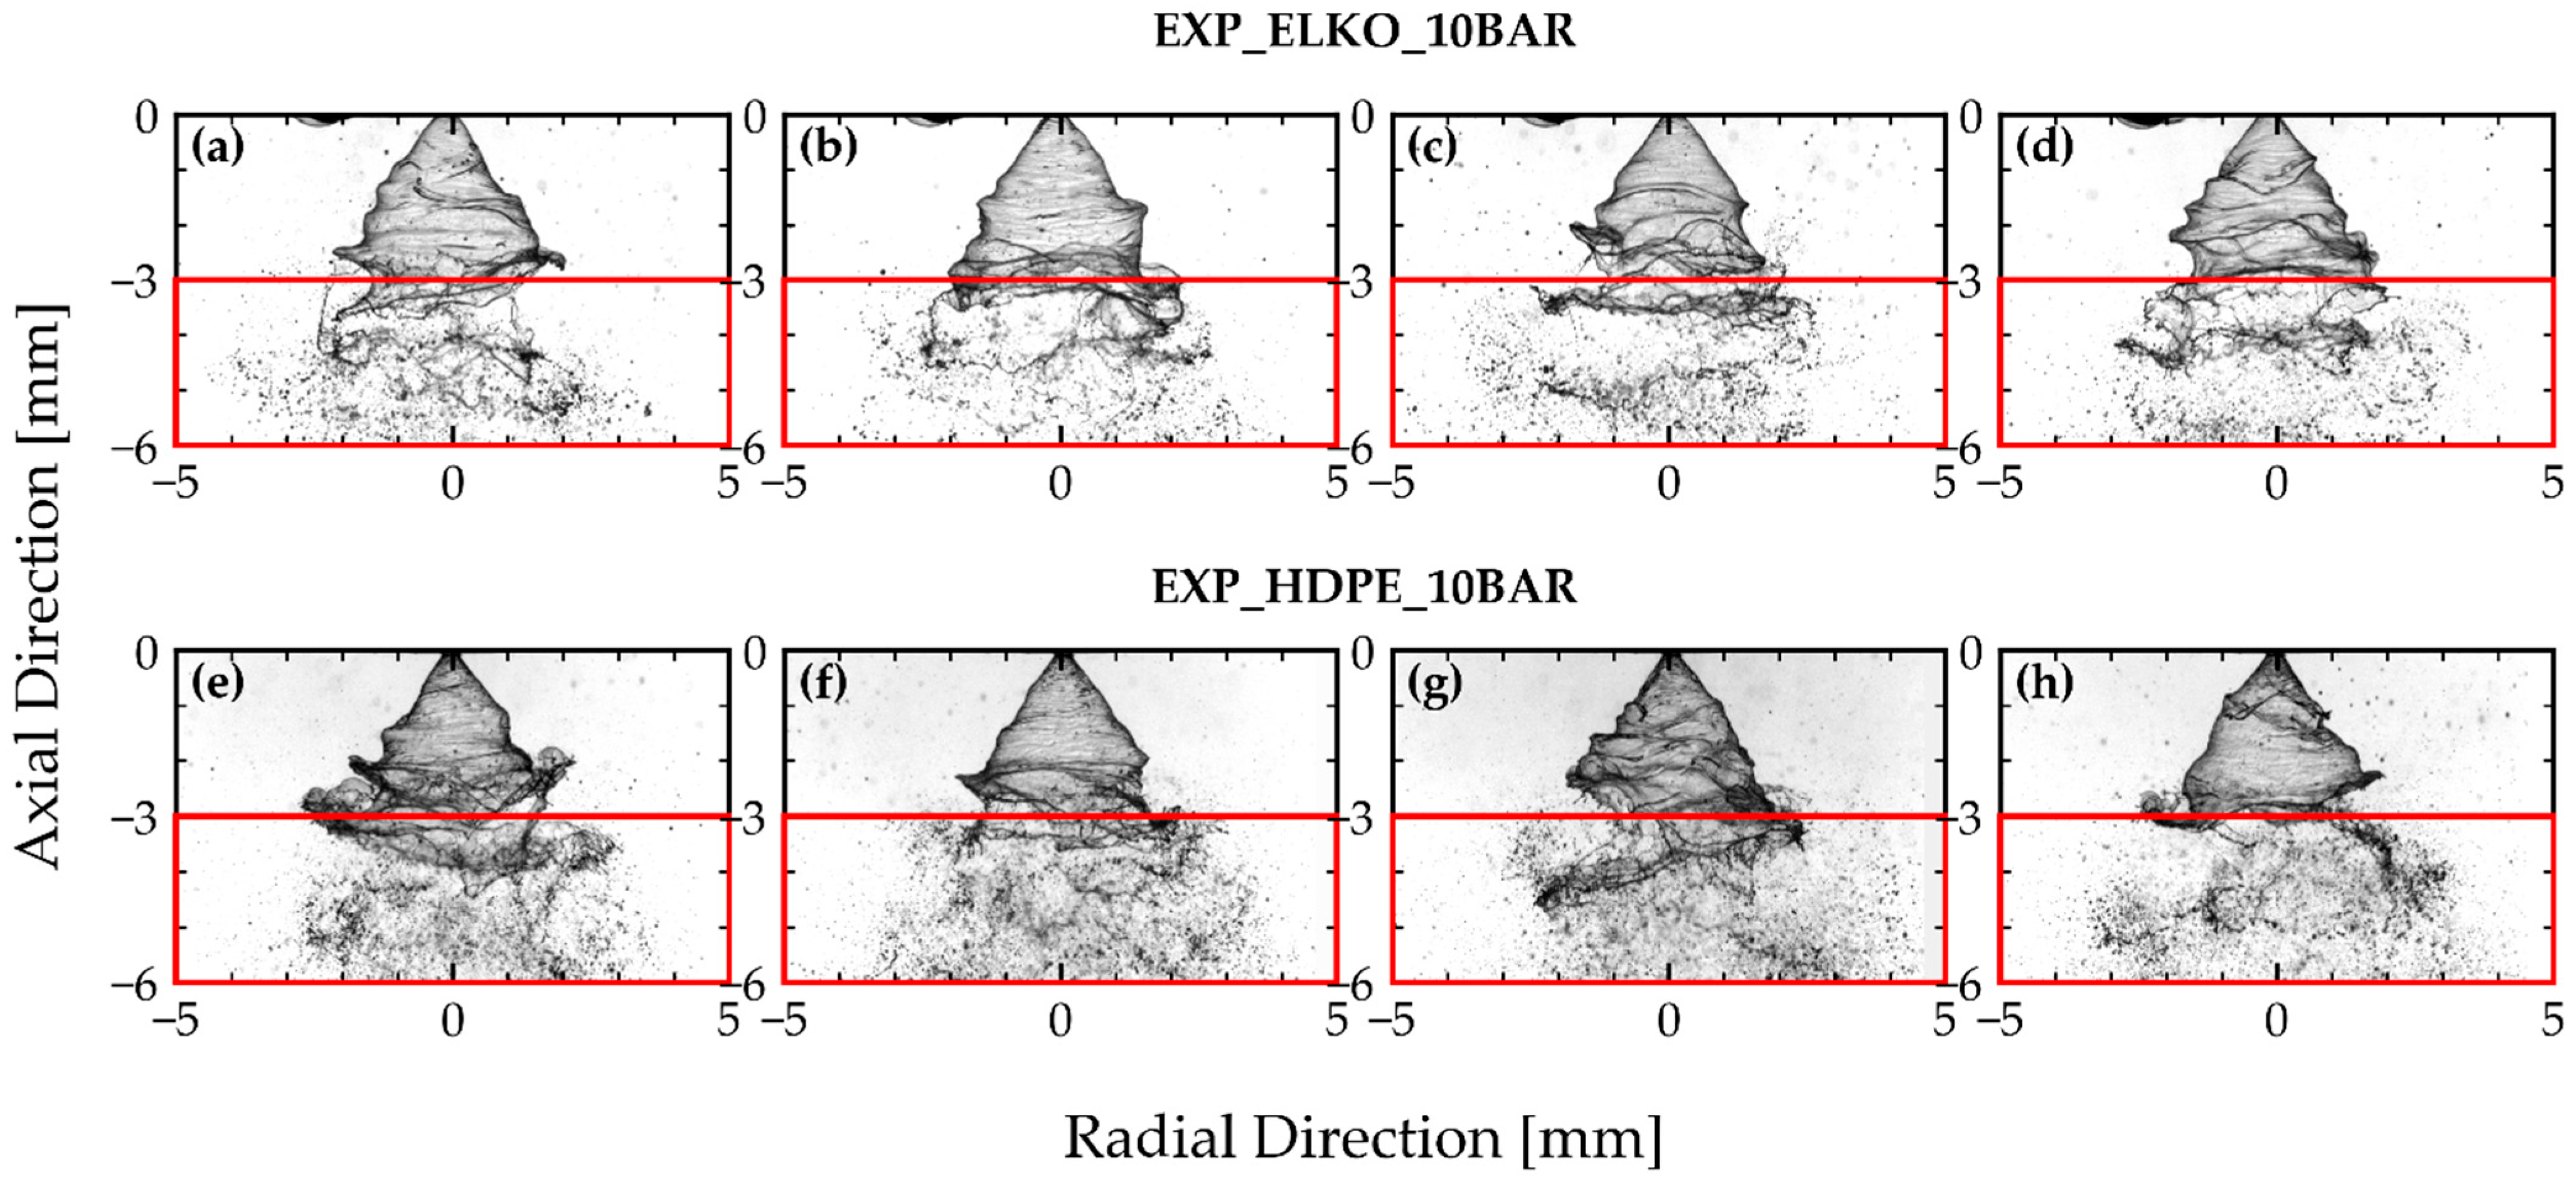
Due to the limited field of view of the VisiSize system, the region indicated by the red rectangle in Figure 3 was selected for validation of the numerical results against the experimental data. This region corresponds to the part of the experimental field of view where the continuous liquid sheet was no longer visible in the averaged images, where the primary breakup into ligaments and droplets begins, as shown in Figure 4. The droplet-size information in the numerical simulations was collected throughout the entire simulation time of 20 ms.
Figure 4.
Representative experimental spray image for ELKO (a–d) and HDPE pyrolytic oil (e–h) at an injection pressure of 10 bar. The red rectangle indicates the region selected for validation of the numerical results.
For validation of the droplet-size distribution between the numerical simulations and the experimental measurements, the log-normal Probability Density Function (PDF) and Cumulative Distribution Function (CDF) were evaluated within the red sampling region in Figure 3.
For each dataset, the log-normal probability density function was defined as:
where D is the droplet diameter, Dg = eμ is the geometric mean droplet diameter, and represents the characteristic diameter of the log-normal distribution, is the mean of the logarithms of the droplet diameters, and is the standard deviation of the logarithmic droplet diameters, and determines the width of the log-normal distribution. In the definitions of the log-normal distribution parameters, N represents the total number of diameter values in the considered dataset. The corresponding log-normal cumulative distribution function (CDF) was defined as:
where erf denotes the Gaussian error function.
For the characterization of atomization performance and validation against the experimental data, the Sauter mean diameter (SMD) was also calculated on the prescribed planes. Equation (19) presents the definition used for calculating the SMD, where ni represents the number of droplets with diameter Di.
3. Results and Discussion
3.1. Sensitivity Analysis of the LISA Parameters and Numerical Validation of the Experiment
Since LISA relies on empirical constants, a sensitivity analysis of the LISA model parameters was performed first for both oils. The analysis provided a systematic assessment of how the individual model constants affect the droplet size distribution for the two oils, which differ in their physical properties and injection conditions, as presented in Table 2. For each oil, nine cases were selected systematically, in which the constants , CL and β were varied, and the corresponding numerical results were compared with the experimental measurements. The strategy used for the comparison between the numerical simulations and experimental results is described in more detail in the Section 2.2.3. Table 5 summarizes the adopted strategy for varying the LISA model parameters, where case L2 corresponds to the default LISA parameter values.
Table 5.
LISA model parameter variations used in the sensitivity analysis.
The influence of parameter was investigated in the first three cases (L1, L2 and L3). The influence of the constant CL was investigated in the subsequent three cases (L4, L5 and L6). The droplet dispersion angle β was varied in cases L7 and L8. Following the evaluation of cases L1–L8, the results of these simulations were used to select the LISA model parameters for case L9.
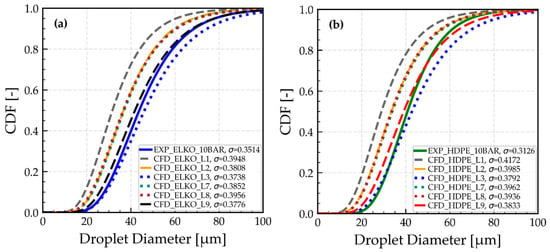
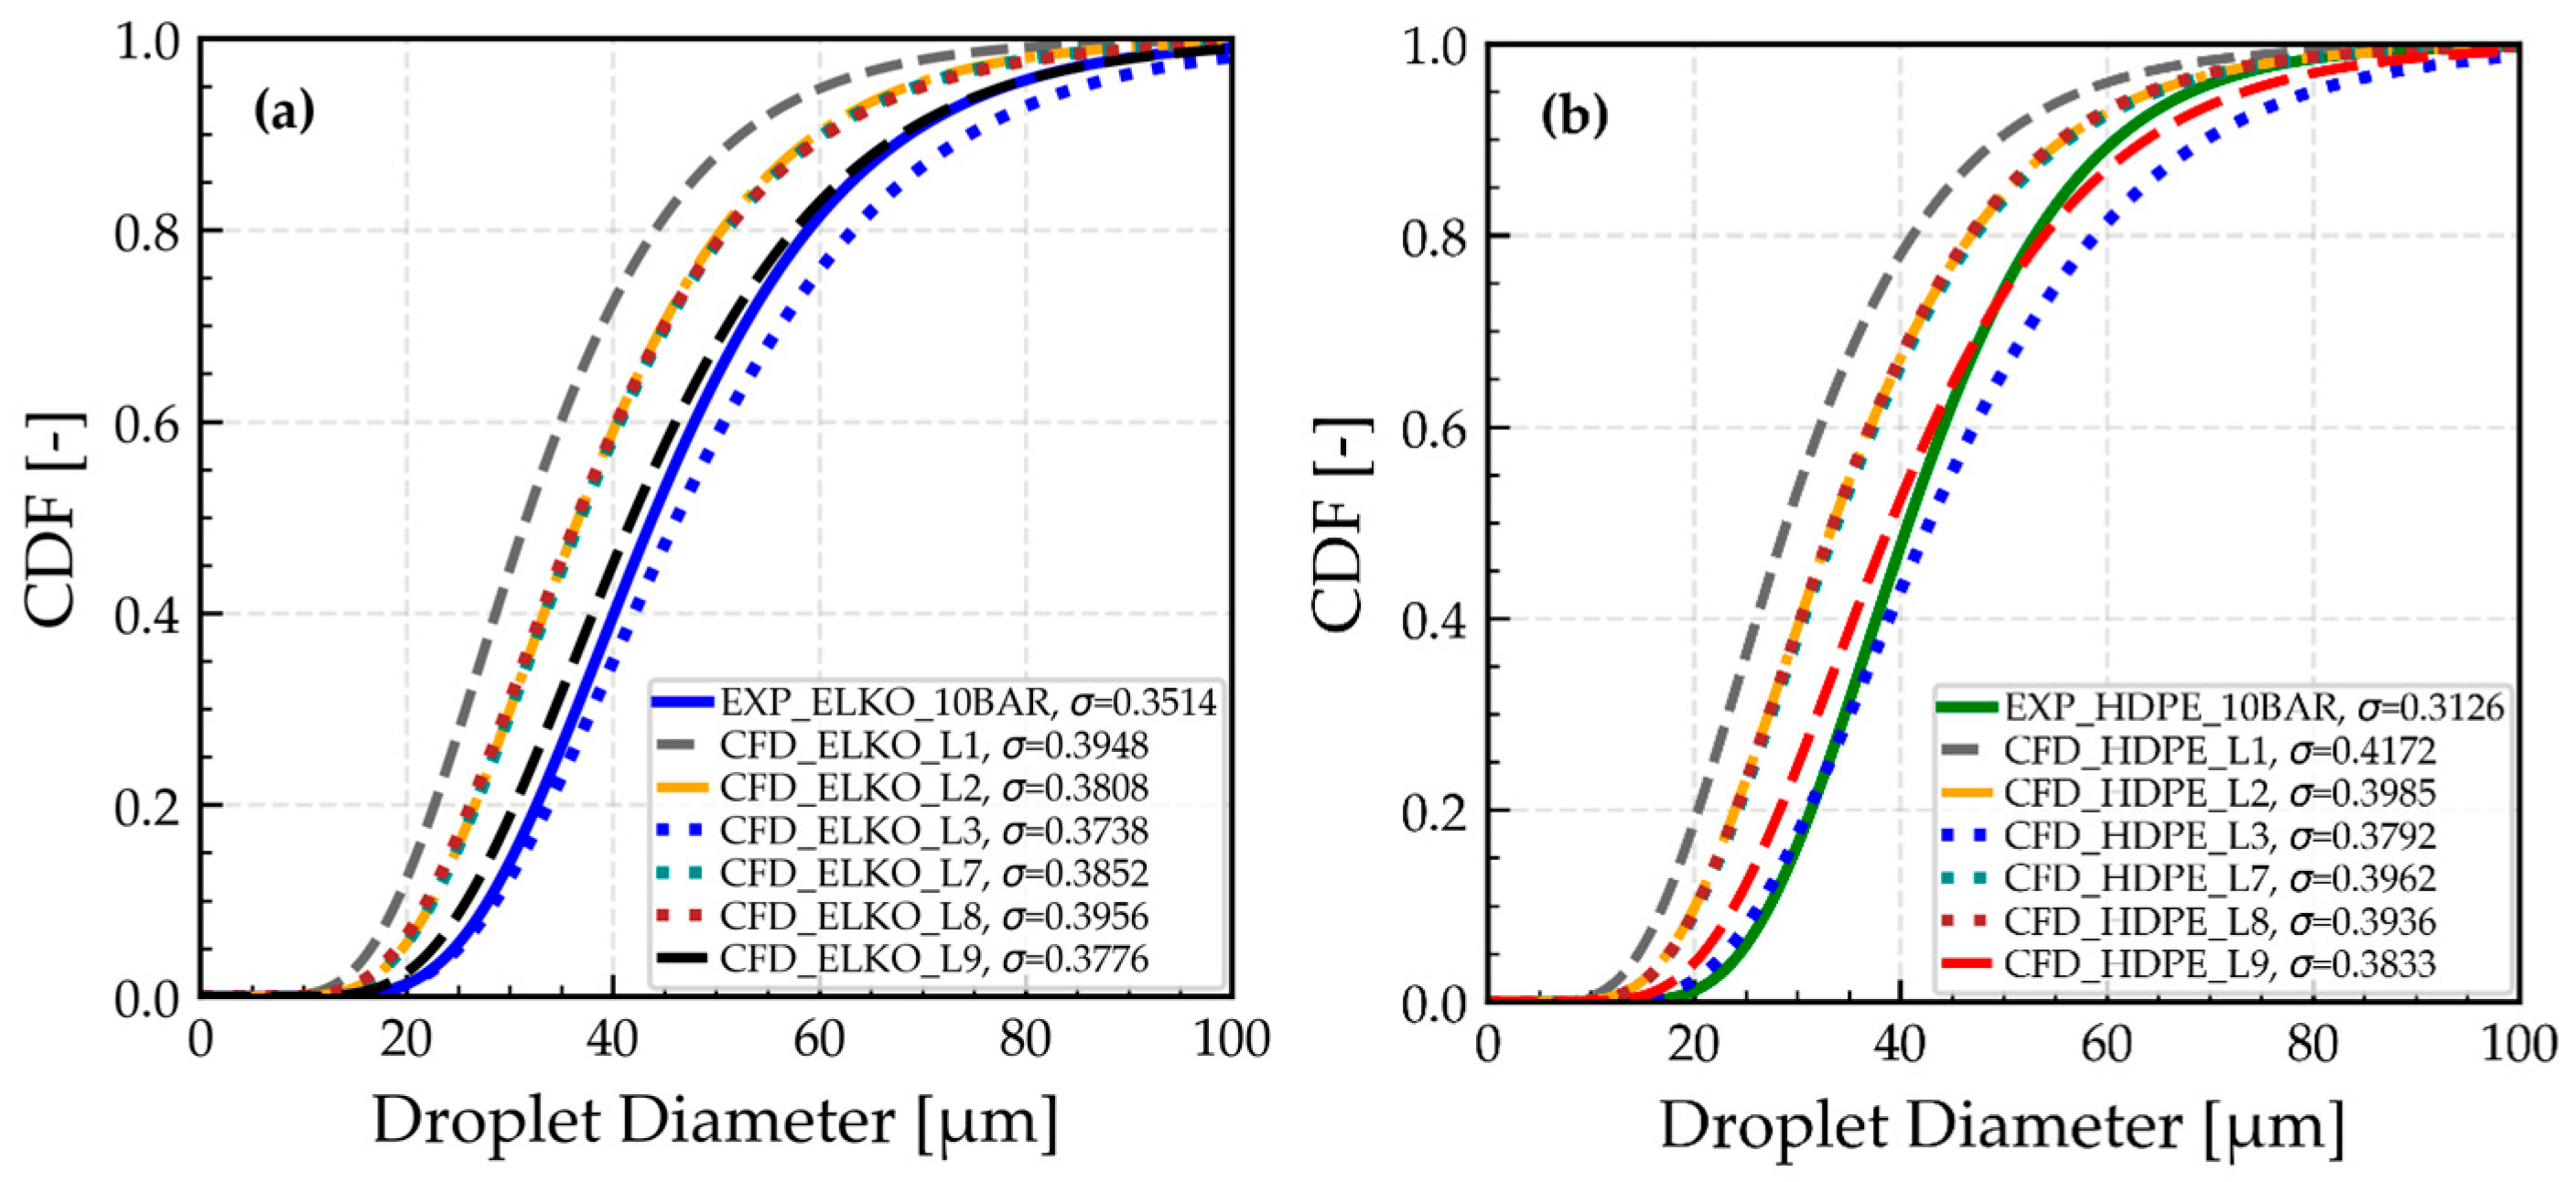
Figure 5 presents the corresponding CDF results, with Figure 5a showing the results for ELKO and Figure 5b for HDPE oil. The legends in the graphs also report the spread parameter σ for each case, providing an indication of the width of the corresponding distribution.
Figure 5.
Comparison of the experimental and CFD log-normal cumulative droplet size distribution for (a) ELKO and (b) HDPE pyrolytic oil for the investigated LISA parameter cases.
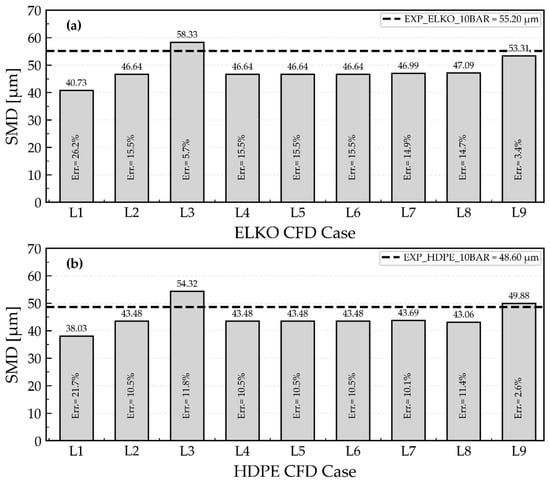
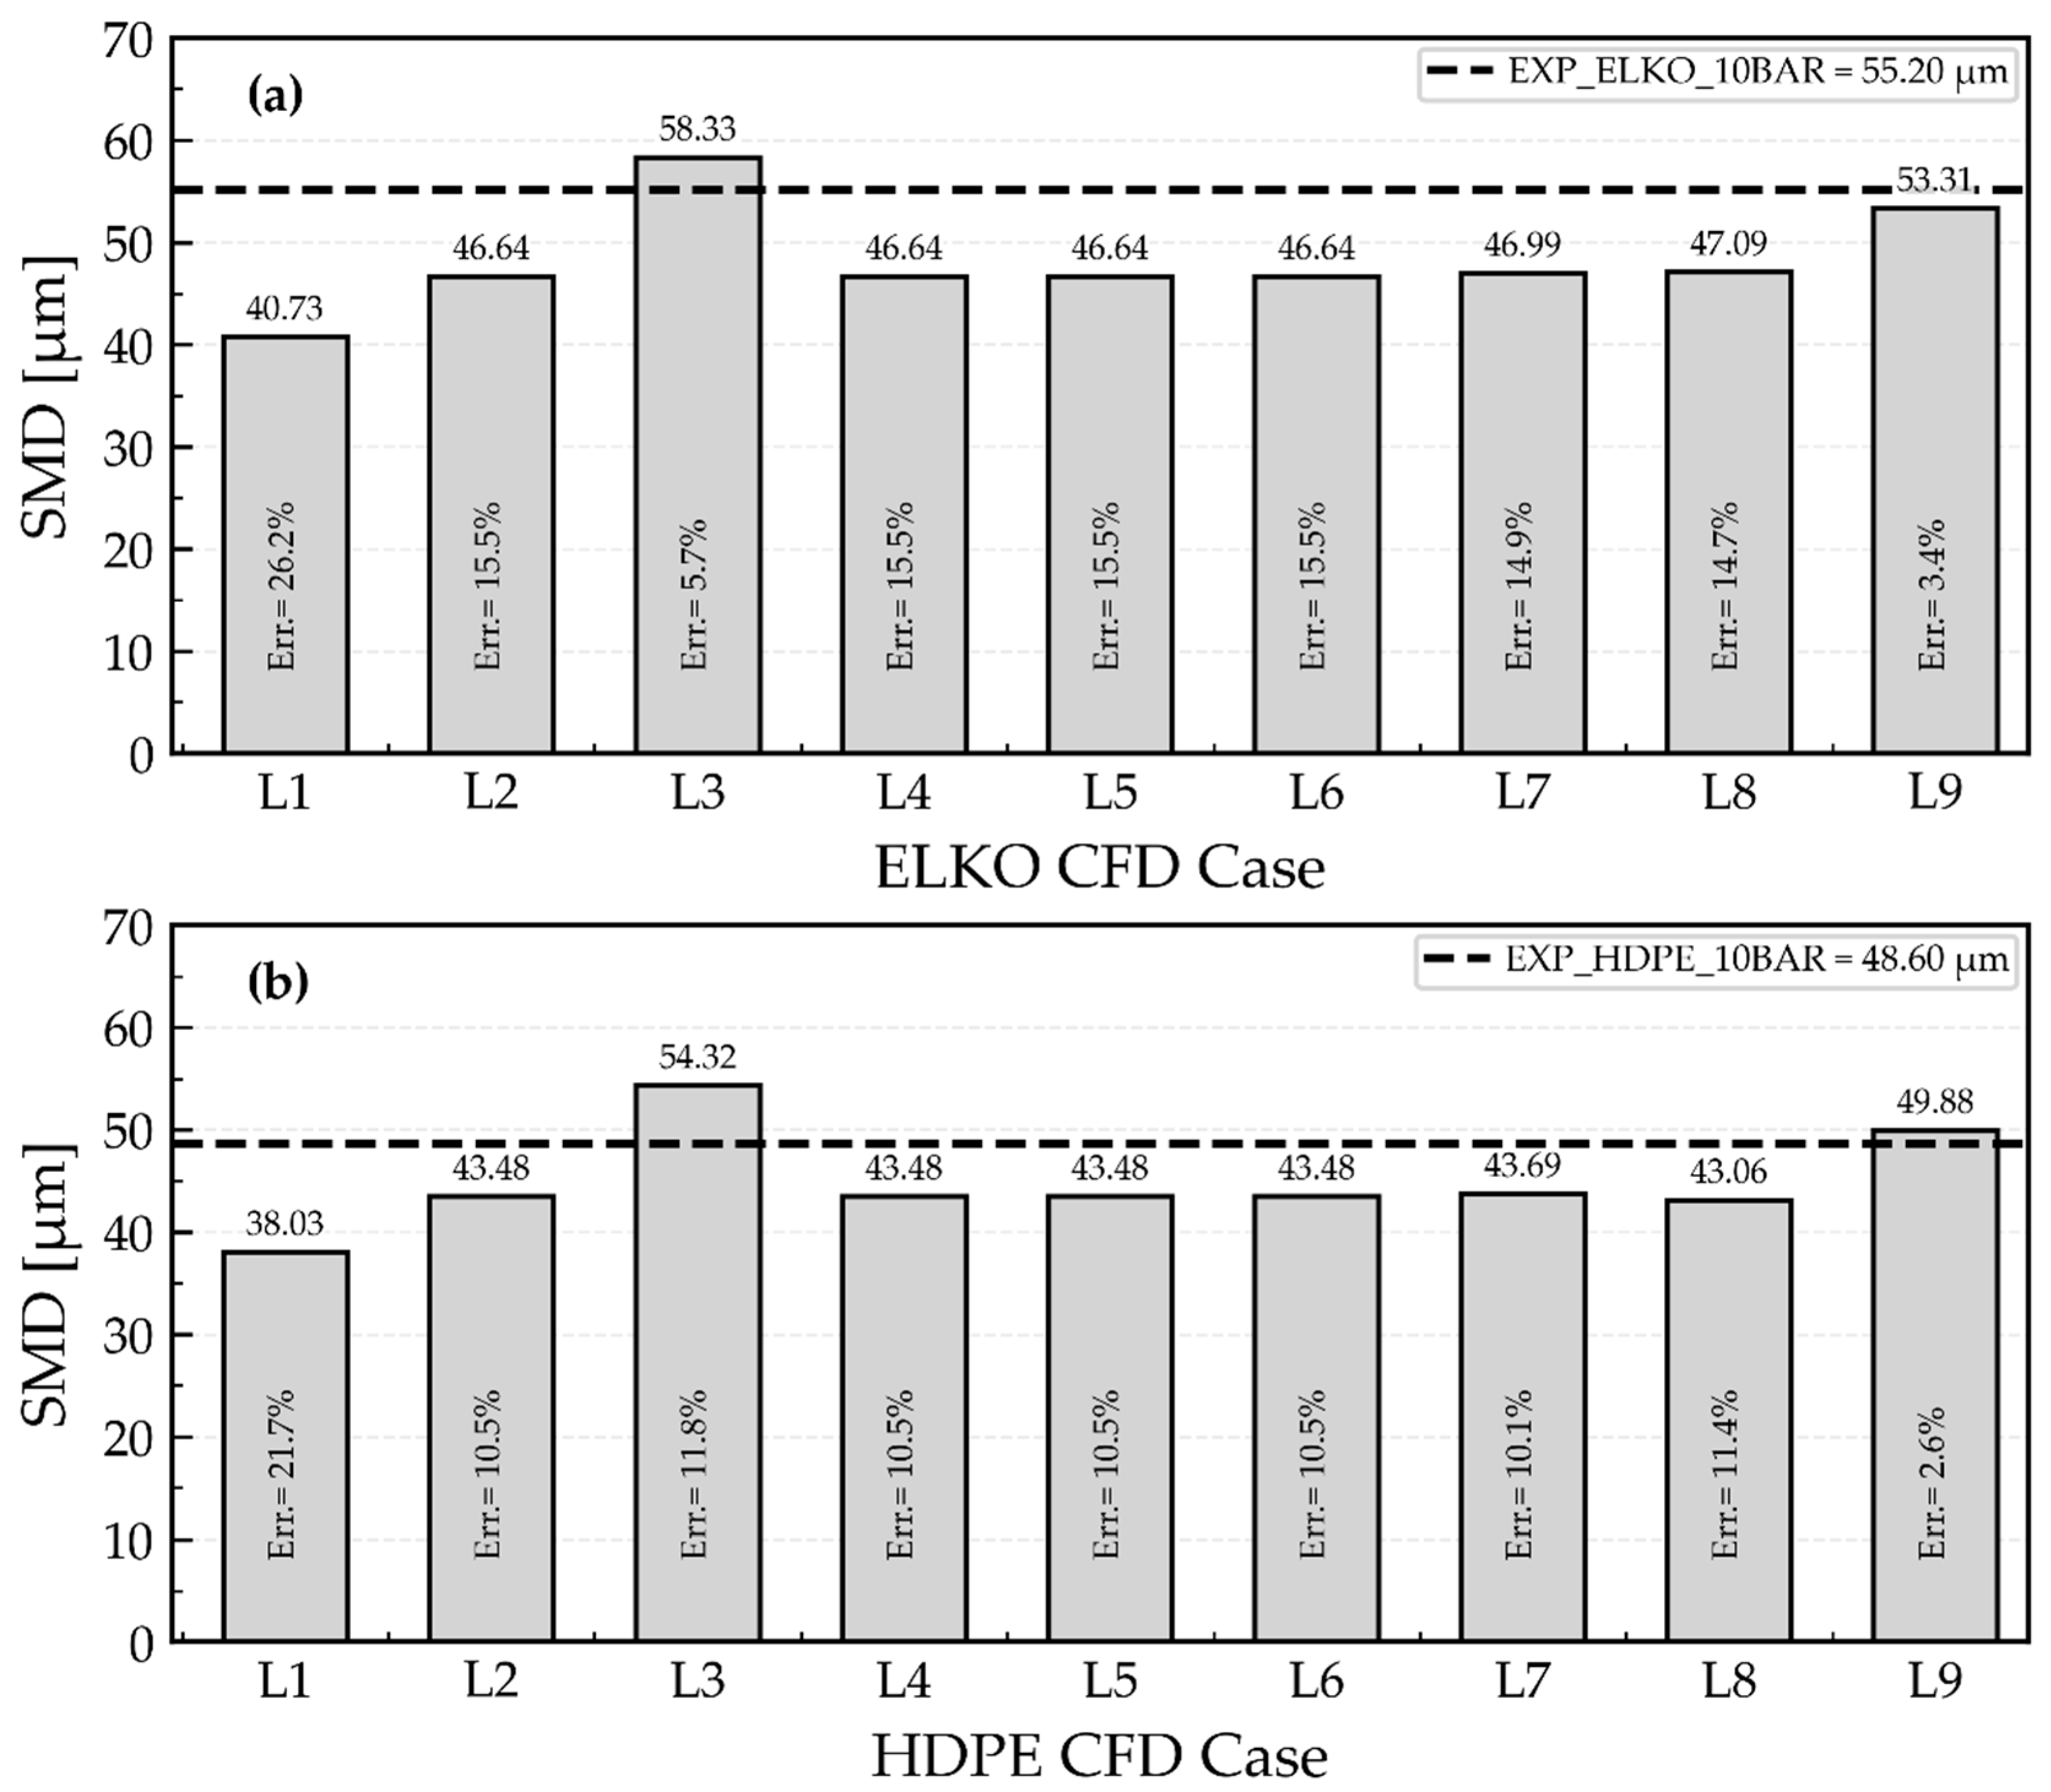
The sensitivity analysis revealed that had the most pronounced influence on the predicted droplet size distribution for both oils. As can be seen in the CDF curves, decreasing this parameter from 18 to 6 gradually shifted the droplet size distribution toward the larger droplet diameters. This trend can also be observed in Figure 6, where the SMD is presented for all cases. With decreasing parameter the SMD increased from 40.73 µm to 58.33 µm for ELKO and from 38.03 to 54.32 µm for HDPE. In addition to the shift in the characteristic droplet size, decreasing resulted in a reduction in the spread parameter σ for both oils, indicating a narrower droplet size distribution. The effect of this parameter can be related to its role in determining the time required for an initial disturbance on the liquid sheet to reach the critical amplitude for breakup length.
Figure 6.
Comparison of the CFD-predicted SMD for the LISA sensitivity analysis cases L1–L9 with the corresponding experimental values for (a) ELKO and (b) HDPE pyrolytic oil. The relative deviations from the experimental values are indicated for each case.
The interpretation of this behavior is supported further by the results obtained for the ligament constant CL. The variations in CL in cases L4 to L6 produced no noticeable changes in either the SMD or the droplet size distribution compared with case L2. Consequently, the corresponding CDF curves overlapped and are not shown separately in Figure 5.
Variations in the droplet dispersion angle β, on the other hand, produced only minor changes in the predicted droplet size distribution and SMD values. In cases L7 and L8, β was changed from a baseline value of 6° to 0° and 12°, respectively. The resulting SMD values ranged only from 46.99 µm to 47.09 µm for ELKO and from 43.69 µm to 43.06 µm for HDPE oil. In contrast, the variation of β produced a clear change in the predicted spray angle, which increased from 68.59° to 77.31° for ELKO and from 75.49° to 83.97° for HDPE oil between cases L7 and L8.
Since the default value of = 12 underpredicts the experimental SMD for both oils, whereas a value of 6 overpredicts it, a value of 8 was selected for Case L9. This selection was based on the SMD comparison and assessment of the corresponding experimental and numerical CDF curves. The value was applied to both ELKO and HDPE pyrolytic oil as an empirical calibration for the investigated nozzle and operating conditions.
3.2. Spatial Droplet Size Distribution
Following the LISA parameter sensitivity analysis, the L9 configuration was selected as the reference CFD case for both the ELKO and HDPE oils. Table 6 summarizes the parameters used in the L9 LISA configuration.
Table 6.
Summary of the LISA model parameters used in the L9 configuration.
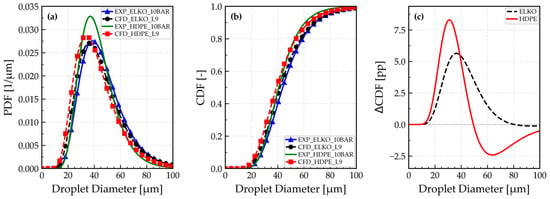
The present section examines the spatial droplet-size distribution obtained with this configuration. Figure 7 compares the log-normal PDF and CDF of the selected L9 configuration with the corresponding experimental droplet-size distribution, including the differences between the cumulative distributions as a function of droplet diameter.
Figure 7.
Comparison of the experimental and CFD droplet size distribution for ELKO and HDPE pyrolytic oil; (a) probability density function (PDF), (b) cumulative distribution function (CDF), and (c) differences between CFD and experimental CDFs.
The probability density function (PDF) in Figure 7a shows how the droplet population is distributed over the diameter range, from approximately 0 to 100 µm. Most droplets are concentrated approximately between 20 and 70 µm, while droplets larger than about 80 µm represent only a small fraction of the total population. For the ELKO, both the experimental and CFD PDFs have their main peak in approximately the same droplet-diameter range, around 35–40 µm. The CFD curve is shifted slightly toward smaller diameters compared with the experimental curve, and is also marginally broader, which suggests a slightly higher predicted fraction of the droplets below approximately 35 µm, and a comparable representation of droplets above 50 µm. The tail toward larger droplets is also represented, although small deviations are visible in the intermediate and large-diameter ranges. For the HDPE oil, the difference between the experimental and CFD results is more pronounced. The experimental PDF shows a sharper and higher peak at around 35–40 µm, whereas the HDPE CFD curve reached its maximum at a slightly smaller diameter, approximately in the 30–35 µm range. The CFD lower and broader peak indicates that the CFD prediction distributes the HDPE droplets over a wider diameter interval, with a stronger contribution of smaller droplets below approximately 35 µm. Compared with ELKO, the HDPE distribution is generally shifted toward smaller droplet diameters, especially in the CFD results. This behavior is consistent with the lower viscosity and surface tension of HDPE oil.
For ELKO, the experimental and CFD cumulative distribution function (CDF) curves in Figure 7b are relatively close over most of the diameter range. The ELKO CFD curve is slightly above the experimental curve in the lower-diameter range, indicating a mildly higher predicted fraction of small droplets. However, the overall cumulative trend remains similar. For HDPE, the difference between the experimental and CFD results is more noticeable. The CFD CDF lies above the experimental HDPE CDF in the fine and intermediate droplet-size range, approximately between 25 and 50 µm, meaning that the CFD simulation predicts a larger cumulative fraction of smaller HDPE droplets than measured experimentally. Between approximately 50 and 60 µm, all the curves continue to rise rapidly, showing that a large fraction of the droplet population lies in this diameter. Toward larger diameters, approximately 80 µm, all the CDF curves approach unity, indicating that only a small fraction of droplets remains in the very large-diameter tail. The experimental HDPE curve also rises earlier than the ELKO curve, confirming that HDPE produces a finer droplet population than ELKO experimentally, whereas the CFD result amplifies this trend.
To further quantify the differences between numerical and experimental results, Figure 7c presents the difference between CFD and experimental CDFs, expressed in percentage points (pp). The maximum absolute differences are 5.64 pp at 36.34 µm for ELKO and 8.30 pp at 30.93 µm for HDPE. For ELKO, the difference decreases to nearly zero at 80 µm, whereas for HDPE it changes sign at approximately 50 µm, reaching −2.31 pp at 60 µm. This change indicates that the simulation predicts a higher cumulative fraction of fine HDPE droplets, but also a greater fraction of droplets above 60 µm compared with experiment.
The fitted log-normal spread parameter σ provides a quantitative measure of distribution width in the logarithmic space. For ELKO, the experimental distribution has σ = 0.3514, while the CFD result gives σ = 0.3776. The slightly larger CFD value of the spread parameter indicates that the simulated ELKO distribution is somewhat broader than the experimental one, but the difference is relatively small and amounts to approximately 7%. For the HDPE oil, the experimental value is lower, σ = 0.3126, indicating the narrowest distribution among the four cases, while the CFD result gives σ = 0.3833. This confirms that the CFD prediction for HDPE is broader than the experimental distribution.
The tendency of the HDPE to produce smaller droplets is consistent with its lower dynamic viscosity and lower surface tension compared with ELKO. The lower surface tension reduces the stabilizing capillary effect on the liquid sheet, while the lower viscosity reduces the damping of disturbances on the liquid sheet [32,34,37].
Overall, as shown in Figure 6 and Figure 7, the selected L9 configuration shows good agreement with the main characteristics of the experimental droplet size distribution for both oils, despite a slightly higher fraction of fine droplets predicted by the CFD simulations. This difference could influence oil vaporization and subsequent mixture formation in thermal systems under comparable operating conditions; smaller droplets generally exhibit shorter characteristic evaporation times, which could lead to earlier local oil vapor formation and affect its spatial distribution within the combustion chamber. In combustion simulations, this could result in differences in the predicted local fuel–air mixture composition and heat release distribution, potentially affecting flame stability and pollutant formation. Nevertheless, relatively close experimental and numerical SMD values presented in Figure 6 for both oils suggest that the overall surface area to volume characteristics of the sprays are reasonably reproduced. Thus, while local differences in evaporation and mixture formation may occur, the agreement in the overall droplet size characteristics supports the selected L9 configuration for the spray conditions investigated.
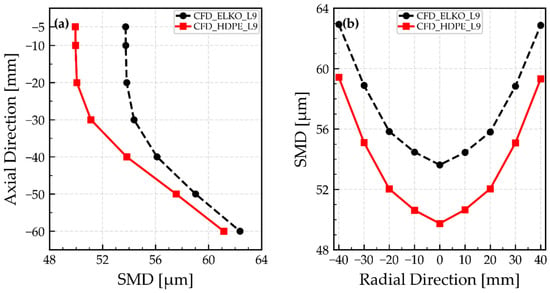
While the preceding log-normal PDF and CDF analysis provides validation of the numerical approach against the PDIA measurements using the selected L9 parameters, this comparison is limited spatially by the finite PDIA field of view (FOV). As described in the Section 2.2.3, the CFD sampling plane was adjusted to represent the effective experimental sampling region as closely as possible. Therefore, the PDF and CDF comparison should be interpreted as a localized validation of the droplet-size distribution near the measurement region, rather than as a representation of the entire spray field. To assess the spatial development of the droplet size field beyond this localized validation region, the Sauter mean diameter (SMD) was evaluated from the CFD results on a series of additional axial and radial sampling planes. The injection location is defined as 0 mm, and the spray propagates downward in the negative axial direction. The results are shown in Figure 8.
Figure 8.
Axial (a) and radial (b) profiles of the CFD-predicted SMD for ELKO and HDPE pyrolytic oil.
Figure 8a shows the axial variation of the SMD. For both fuels, the SMD increased with the downstream distance. The ELKO SMD increased from approximately 54 µm near Y = −5 mm to about 62 µm at Y = −60 mm. The HDPE oil followed the same trend, but remained consistently lower, increasing from approximately 50 µm near Y = −5 mm to about 61 µm at Y = −60 mm. The downstream increase in SMD reflects the size-dependent droplet transport and inertial sorting within the spray. Smaller droplets have lower mass and lower inertia, so they are decelerated and redistributed more easily by the surrounding gas phase. The larger droplets retain their axial momentum more effectively and are therefore more likely to be sampled farther downstream, which was also observed by [38,39,40]. Consequently, the downstream planes contain a relatively greater contribution from larger droplets, which increases the local SMD. The consistently lower SMD of HDPE oil over the full axial range confirms that the finer droplet-size distribution observed in the PDF and CDF comparison is preserved spatially along the spray axis. Therefore, under the experimentally prescribed injection conditions, the HDPE liquid sheet is expected to fragment more readily and produce a finer droplet population than ELKO.
Figure 8b shows the radial variation of the SMD. Both oils exhibit a minimum near the spray centerline (X = 0 mm) and higher SMD values toward the radial periphery. For ELKO, the SMD was lowest near the centerline, around 54 µm, and increased to approximately 63 µm at X = ±40 mm. The HDPE droplets’ SMD shows the same U-shaped radial trend, with a minimum of approximately 50 µm near the centerline, and values increasing to about 59–60 µm near the outer radial position. This radial increase indicates that the droplet-size distribution is not uniform across the spray. The central region contains a stronger contribution of finer droplets, whereas the spray periphery contains a larger contribution of larger droplets. Across the entire radial range, HDPE maintained lower SMD values than ELKO. This means that the finer HDPE droplet population is not limited to the spray center, but persists throughout the cross-section of the spray. The difference between the two fuels is approximately 3–5 µm over most radial positions, which is consistent with the axial SMD profile.
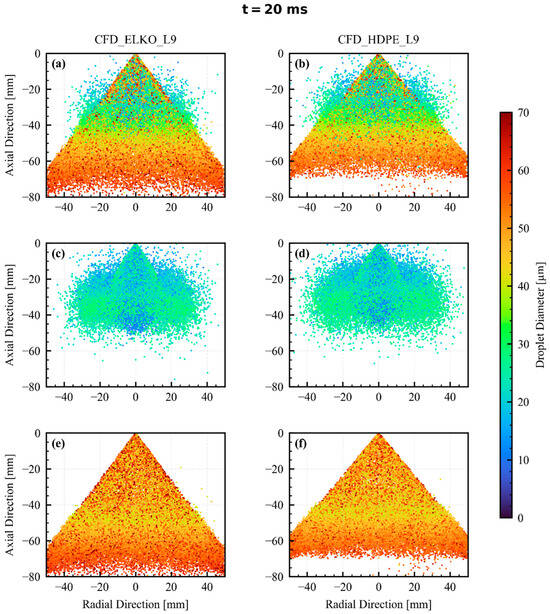
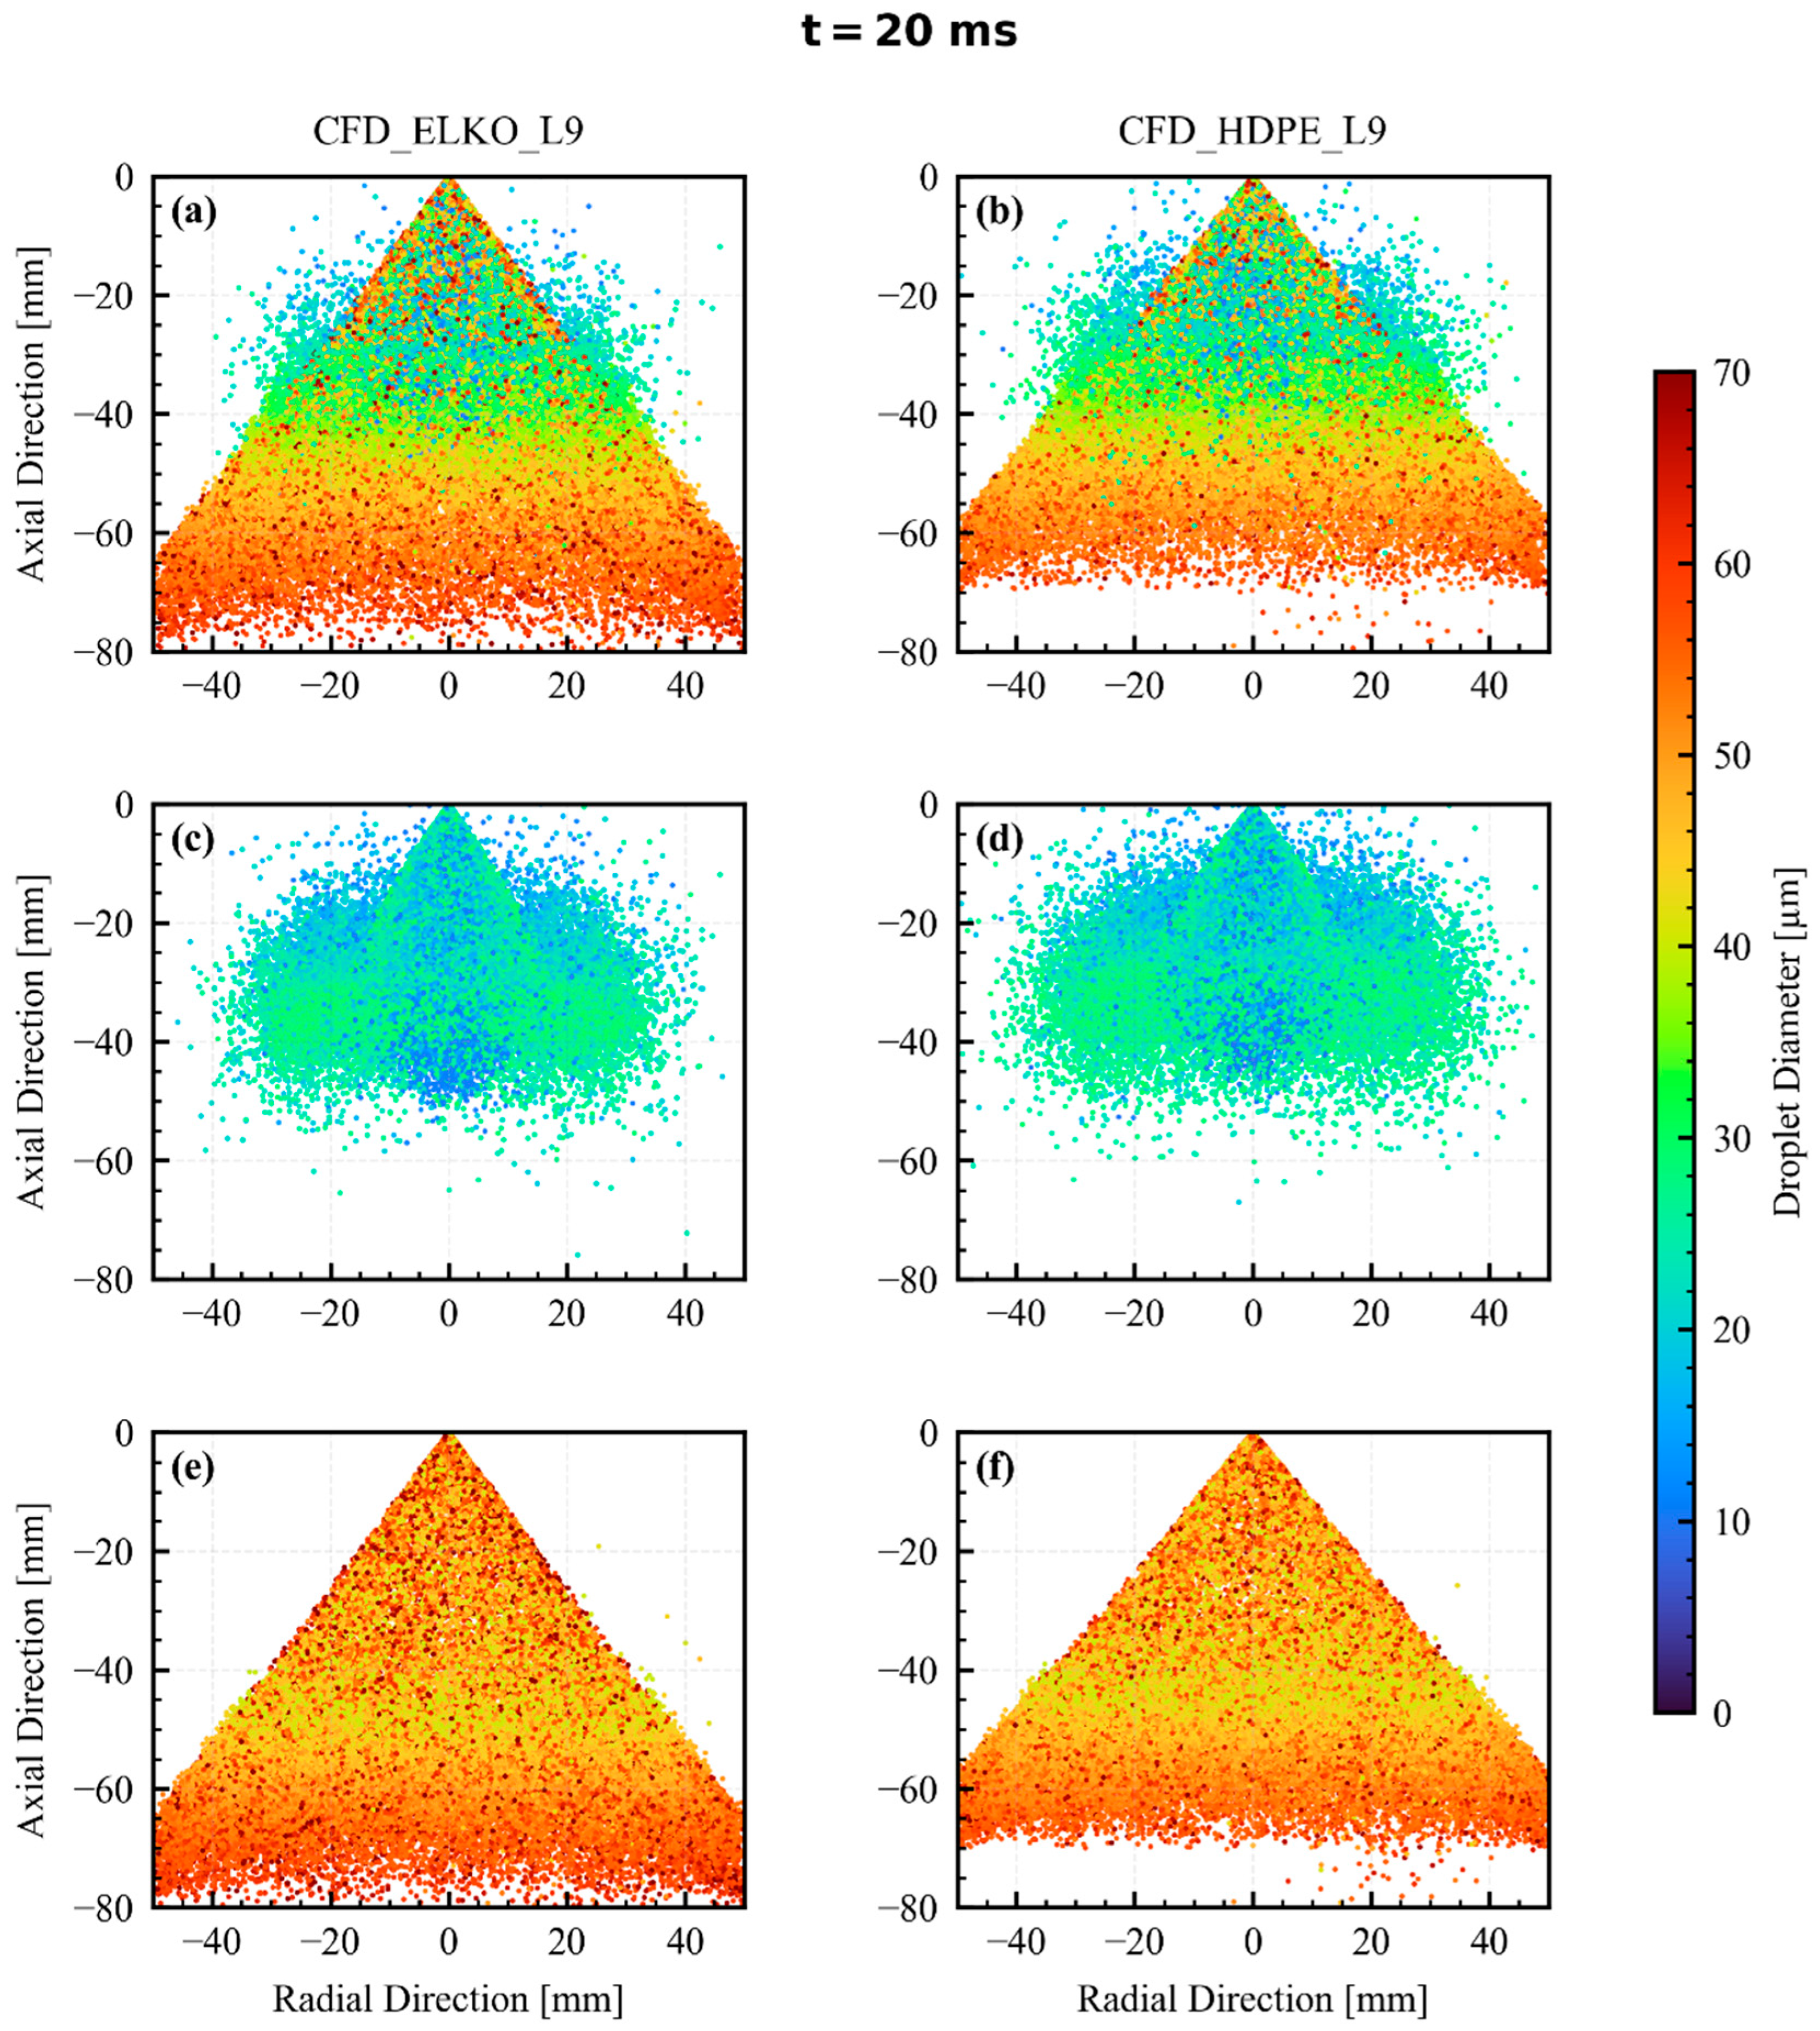
Figure 9 shows the spatial distribution of DPM droplet parcels at the final time of 20 ms. The left column corresponds to ELKO, while the right column corresponds to HDPE. Figure 9a,b show the complete droplet population; Figure 9c,d isolate the fine droplet fraction with a droplet diameter less than 30 µm, while Figure 9e,f show the coarse droplet fraction with a droplet diameter greater than 40 µm. Up to 50,000 DPM parcels are shown in each panel. In each panel, the droplets are colored according to the droplet diameter.
Figure 9.
Spatial distribution of DPM droplets at t = 20 ms: ELKO (a,c,e) and HDPE pyrolytic oil (b,d,f). Panels (a,b) show the complete droplet population, (c,d) droplets with diameter less than 30 µm, and (e,f) droplets with a diameter of more than 40 µm.
The complete droplet fields in Figure 9a,b show that the two fuels develop different spatial spray structures. The ELKO spray appears more axially penetrating, whereas the HDPE spray is expended more radially. This is consistent with the experimentally prescribed injection conditions; the HDPE was injected with a larger spray half-angle (39.4°) than ELKO (36.1°), while ELKO had a slightly higher mass flow rate. Although the visualization window extends to Y = −80 mm, the HDPE spray does not reach this downstream region as strongly as ELKO at 20 ms. This indicates lower axial penetration of the HDPE droplet field within the analyzed time interval. Therefore, the axial SMD profile in Figure 9a was evaluated only up to Y = −60 mm, where both oils still provided a meaningful and comparable droplet population. The difference in spray penetration was also consistent with the previously discussed droplet-size trend. HDPE oil produces a finer droplet population, as shown by the PDF and CDF and lower SMD values. As mentioned before, smaller droplets have lower mass and therefore lower inertia, and, consequently, they are redistributed more easily by the surrounding gas. As a result, the HDPE droplets show stronger radial spreading but weaker axial penetration compared with ELKO, as can be seen in Figure 9c,d, where at the location between Y = 0 mm and Y = −50 mm HDPE droplets occupy a broader radial region than the corresponding ELKO droplets.
The coarse droplet fraction in Figure 9e,f exhibits a different spatial behavior. Droplets with a diameter greater than 40 µm remain associated more closely with the conical spray envelope and are represented more strongly in the downstream region, especially below approximately Y = −40 mm. The largest droplets, approaching 60–70 µm, are observed mainly farther downstream and along the outer part of the spray. This supports the axial SMD trend, where the SMD increases with downstream distance, due to preferential penetration of the larger, more inertial droplets.
3.3. Droplet Transport
To complement the spatial droplet-size analysis, the following section examines the transport of the dispersed droplet phase. Particular attention is given to the droplet–gas interaction, axial transport, and radial-tangential motion, which govern the subsequent evolution of the spray after the primary breakup. Therefore, the Reynolds number and droplet–gas Weber number were analyzed first, in order to characterize the aerodynamic interaction between the dispersed droplets and the surrounding gas.
For each DPM i-th droplet, the droplet Reynolds number (Red,i) and droplet–gas Weber number (Wed,i,gas) were calculated as:
where ρgas is the gas density, μgas is the gas dynamic viscosity, σ is the liquid surface tension, dd,i is the droplet diameter, Ugas and Ud,i are the local gas-phase and droplet velocity vectors, respectively, and |Ugas − Ud,i| is the magnitude of the relative velocity between the gas and the droplet.
Analyzing both quantities as a function of time provides a general indication of how the aerodynamic interaction between the droplets and the gas phase evolves during spray development.
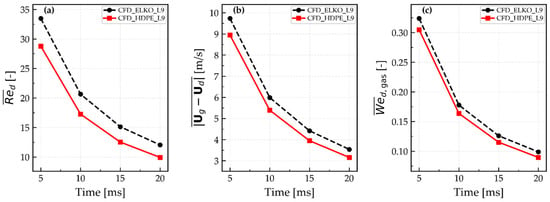
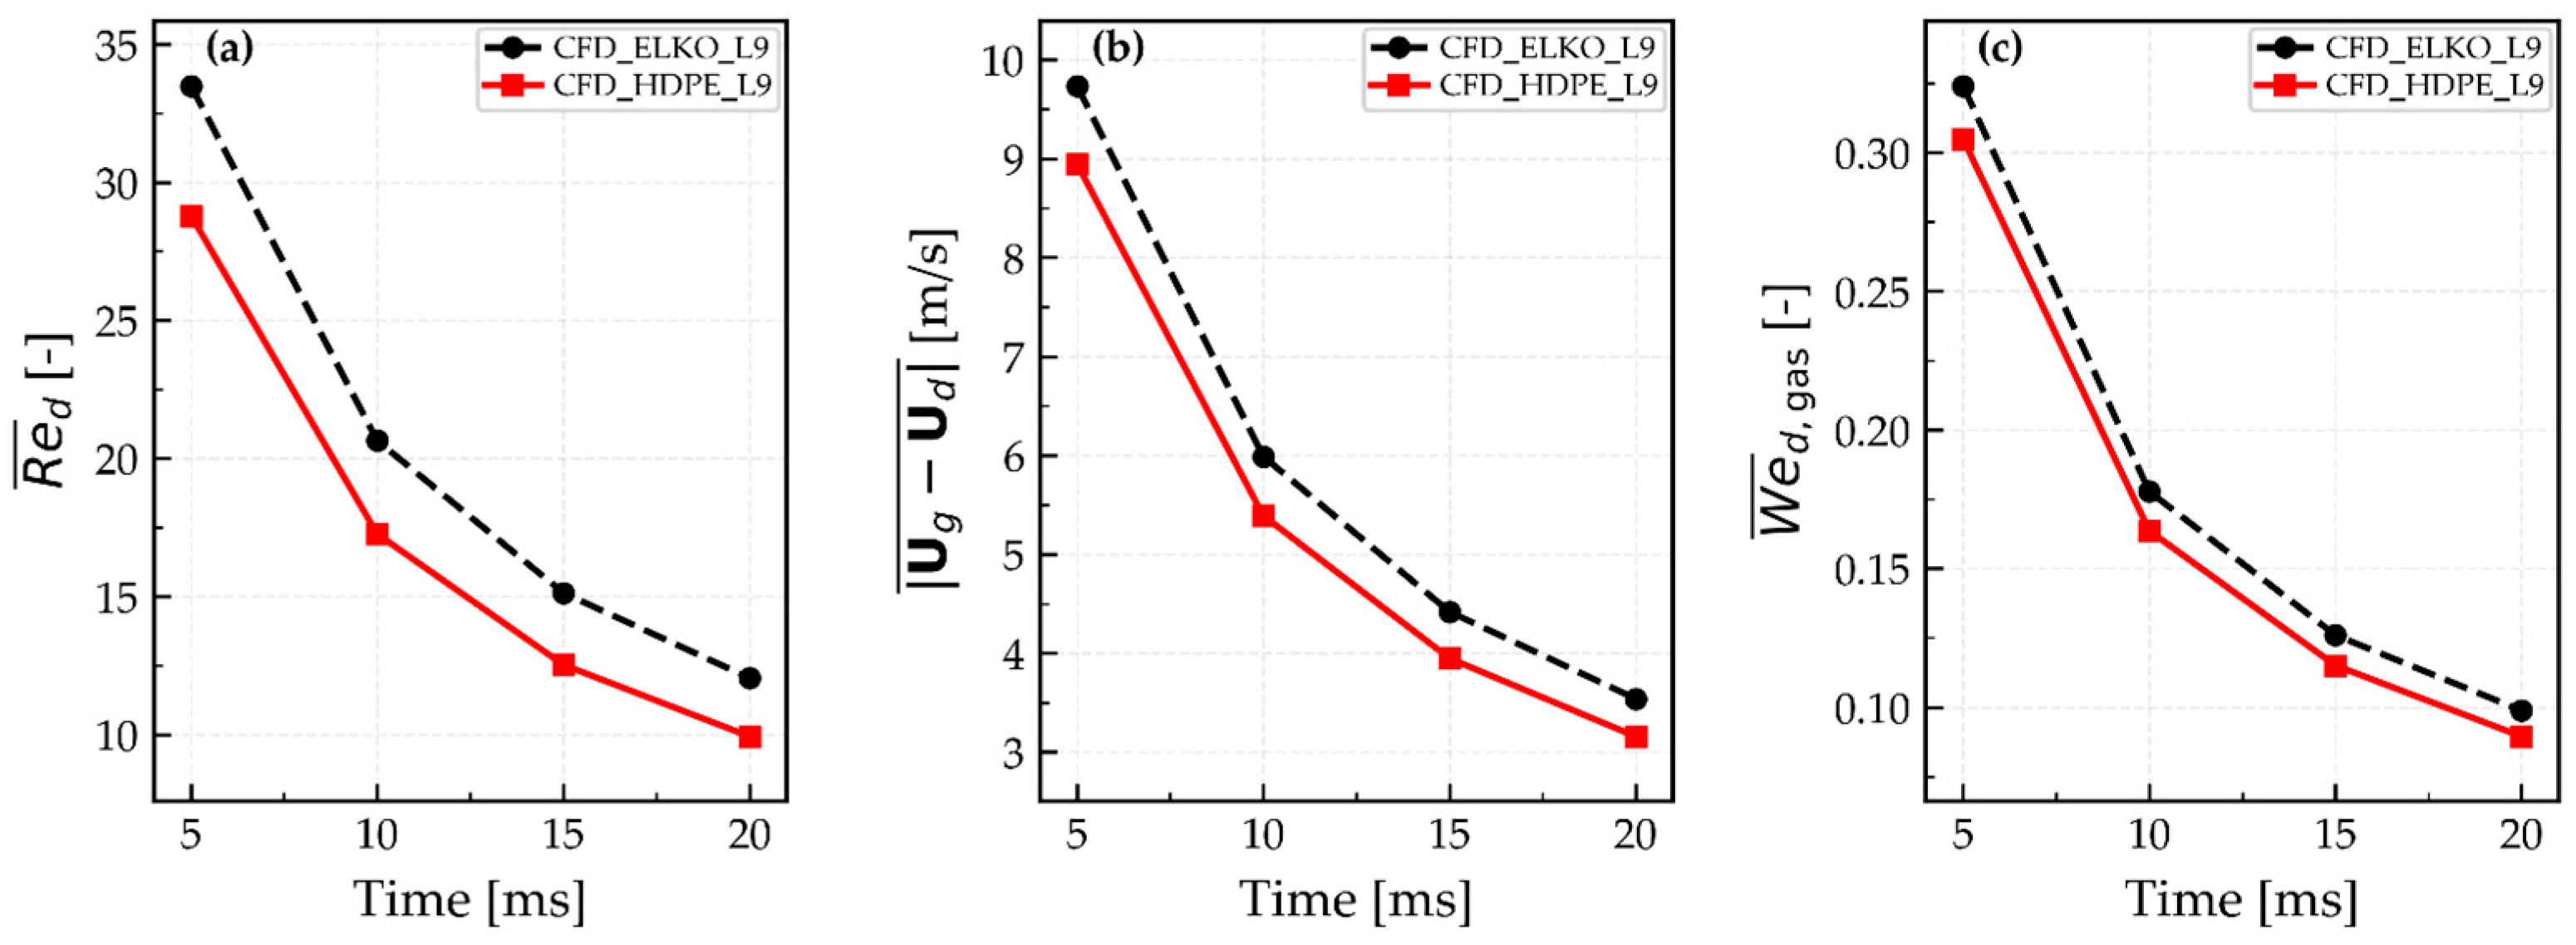
Figure 10 presents the temporal evolution of the population-averaged droplet Reynolds number , mean droplet–gas relative velocity , and droplet–gas Weber number for ELKO and HDPE oils.
Figure 10.
Temporal evolution of the population-averaged (a) droplet Reynolds number, (b) gas-droplet relative velocity magnitude, and (c) droplet Weber number for ELKO and HDPE pyrolytic oils.
As can be seen in Figure 10a, the decreases with time for both oils, from approximately 34 to 12 for ELKO, and from approximately 29 to 10 for HDPE between 5 and 20 ms. This indicates a gradual reduction in the characteristic droplet–gas aerodynamic interaction during spraying. ELKO exhibits consistently higher values than HDPE, which is consistent with the previously observed stronger axial extended droplet distribution and higher SMD values. To distinguish the contribution of droplet–gas relative motion from the diameter dependence of , Figure 10b shows the corresponding mean droplet–gas relative velocity . This relative velocity decreased with time for both fuels, from approximately 9.7 to 3.6 m/s for ELKO, and from approximately 8.9 to 3.2 m/s for HDPE. HDPE exhibited lower values throughout the analyzed time interval, indicating weaker relative motion between the droplets and the surrounding gas phase. Since depends on both the droplet diameter and droplet–gas relative velocity, the lower for HDPE are therefore consistent with both its finer droplet population and its lower relative velocity between droplets and the gas phase. This supports the interpretation that HDPE droplets, on average, remain more closely aligned with the local gas phase motion during spray transport.
The mean droplet–gas Weber number in Figure 10c shows a similar trend and remains well below unity for both fuels throughout the analyzed interval. This indicates that the aerodynamic effects of the surrounding gas are, on average, smaller than the stabilizing effect of surface tension. In addition, the maximum droplet–gas Weber number remained below approximately 3.3 for both fuels, which is well below the commonly reported critical value of Wegas,crit. ~ 12 for aerodynamic breakup of droplets [41]. Additional sensitivity analysis using the TAB secondary breakup model resulted in only minor changes in the predicted droplet size statistics, with maximum relative SMD differences of approximately 2% for ELKO and 3% for HDPE pyrolytic oil in the axial direction. Consequently, the secondary breakup is not expected to play a significant role in the subsequent droplet-size evolution after the LISA primary breakup.
The axial, radial, and tangential components of the droplet velocity were analyzed to characterize the droplet transport behavior further. Since the spray axis is aligned with the Y-direction, the axial droplet velocity was evaluated as the mean absolute value of the Y-velocity component ():
where vd,i is the axial velocity component of the i-th droplet, and N is the number of DPM droplets included in the corresponding sampling region.
The radial (Ud,r,i) and tangential (Ud,θ,i) velocity components of the i-th droplet, were calculated as:
where is the radial distance, while xi and zi represent the position coordinates of the i-th droplet relative to the spray axis. The velocity components ud,i and wd,i denote the velocities of i-th droplet in the X and Z-directions, respectively.
The RMS values were calculated for quantification of the radial and tangential motion magnitude of the droplets at the sampled locations. The corresponding radial and tangential intensities, which describe the relative contribution of radial and tangential droplet motion compared with the mean axial transport, were defined as:
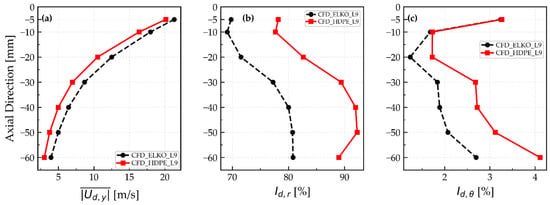
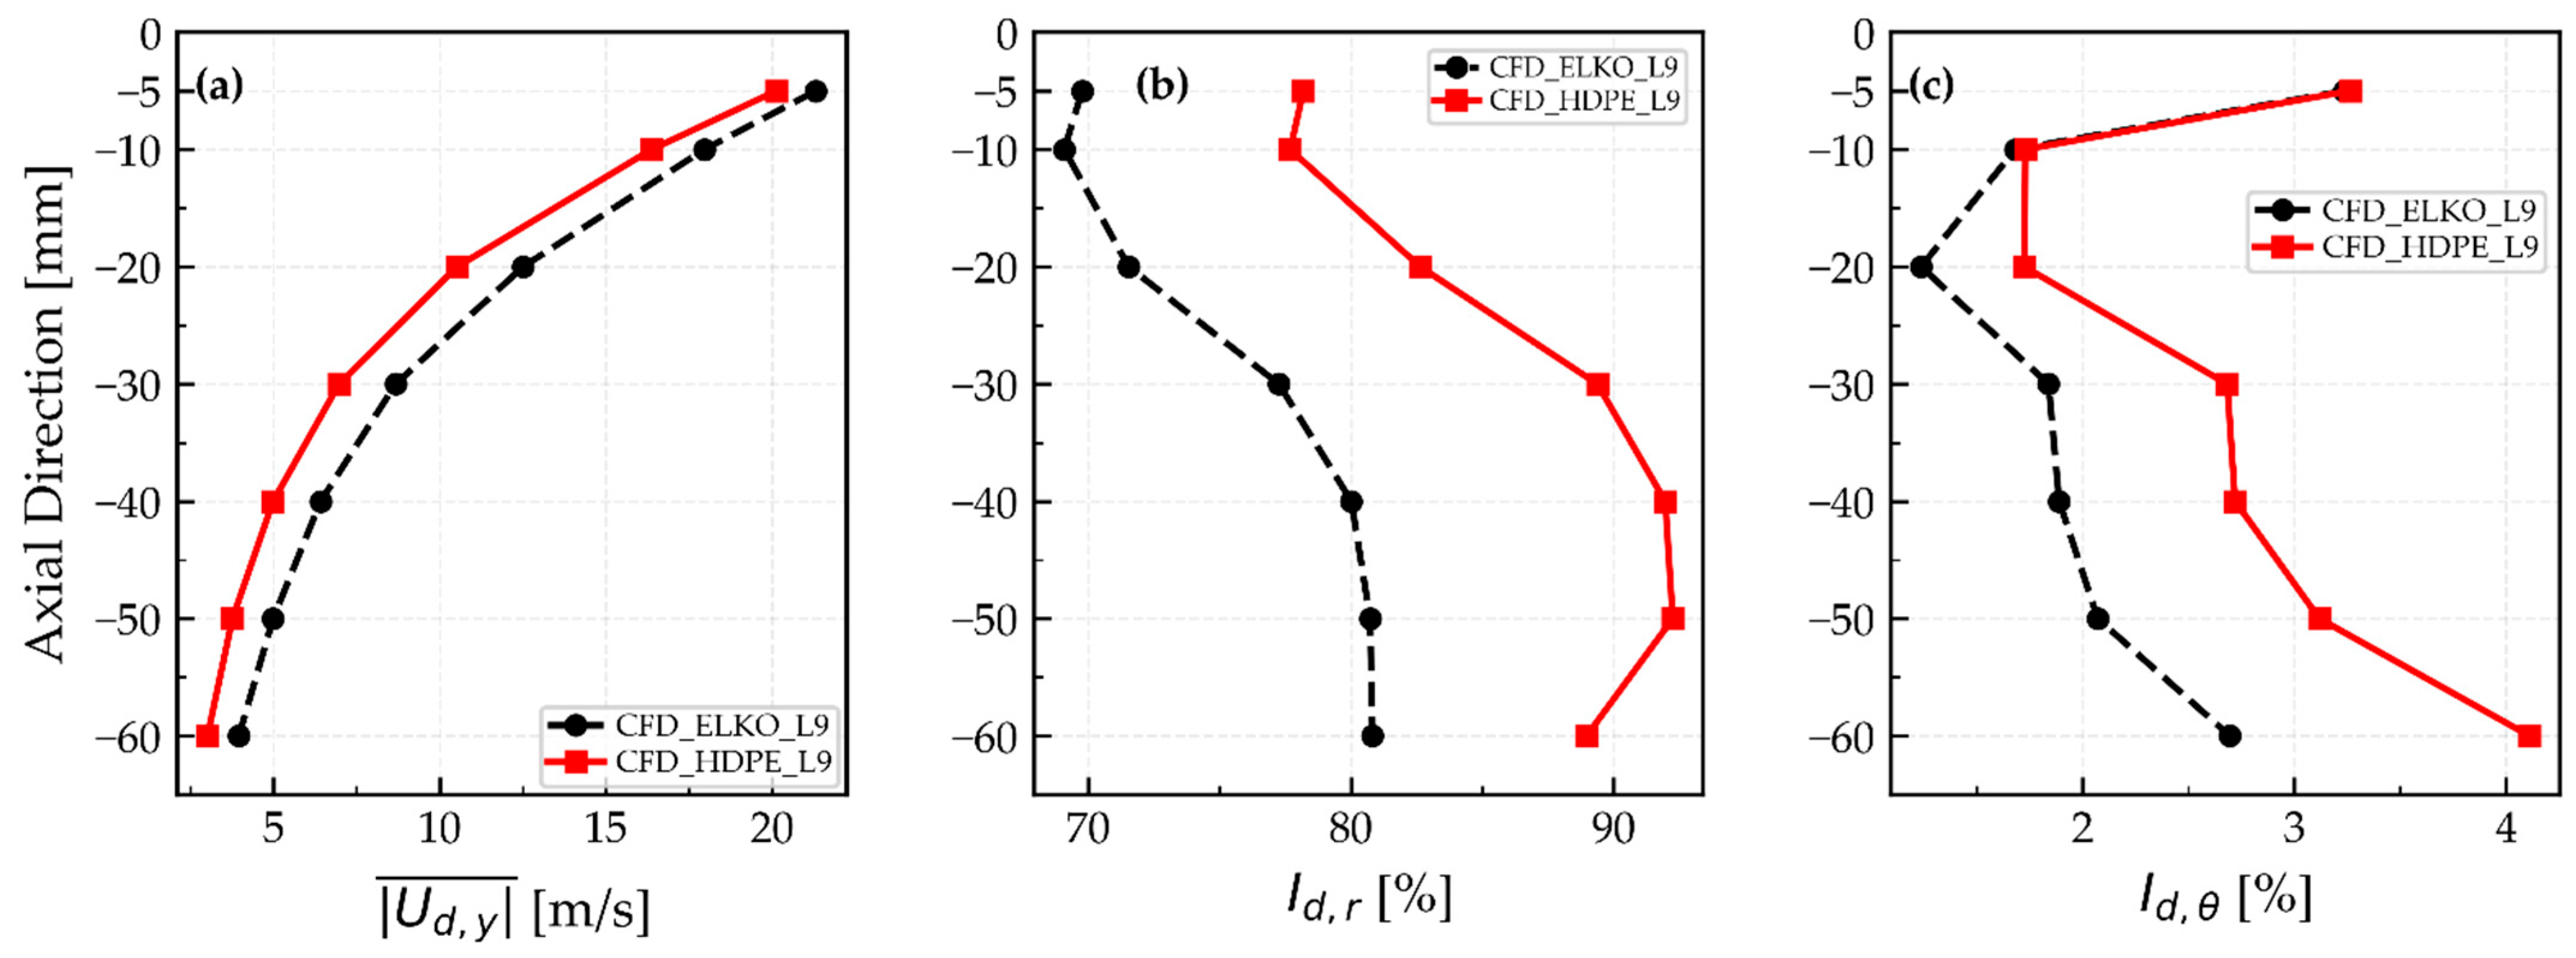
Figure 11 shows the axial variation of the mean axial droplet velocity , radial intensity Id,r and tangential intensity Id,θ, defined by Equations (22), (25) and (26). All the quantities were evaluated on individual axial sampling planes spanning the region from 5 mm to 60 mm below the injector exit.
Figure 11.
Axial profiles of (a) mean axial droplet velocity, (b) radial droplet motion intensity Id,r and (c) tangential droplet motion intensity Id,θ.
As shown in Figure 11a, the mean axial velocity decreased with the downstream distance for both fuels, indicating a gradual reduction in axial droplet transport as the spray develops. This trend is consistent with the drag-induced droplet deceleration during the downstream transport, and with the decrease in the population-averaged droplet Reynolds number reported in Figure 10. ELKO exhibited slightly higher values than HDPE over most of the analyzed range, which corresponds to the more axially extended ELKO droplet distribution observed in the spatial droplet maps in Figure 9, and with the slightly higher SMD values obtained for ELKO, indicating the larger contribution of coarser and more inertial droplets. The difference is also consistent with the LISA pressure swirl formulation, in which the axial component of the liquid velocity is related to the total liquid velocity by Equation (6). Although the lower density of HDPE oil increased the liquid sheet velocity slightly, its larger spray angle reduced the axial velocity component relative to ELKO. However, because this angular difference is relatively small, the downstream droplet velocities are also governed by droplet inertia and aerodynamic interaction with the surrounding gas.
Figure 11b,c shows the corresponding radial and tangential droplet intensities Id,r and Id,θ. These quantities represent the radial and tangential RMS velocity components normalized by the mean axial droplet velocity, and therefore indicate the relative importance of non-axial droplet motion compared with axial transport. As can be seen from Figure 11b,c, Id,r is considerably higher than Id,θ for both fuels, indicating that radial motion represents the dominant non-axial contribution to droplet transport.
The HDPE droplets exhibited higher Id,r values than ELKO over the complete analyzed axial range. For ELKO, Id,r remained approximately between 69% and 81%, while for HDPE, it reached values of about 78% to 92%. The difference is particularly pronounced in the intermediate and downstream regions, between 20 mm and 60 mm downstream from the injection location, where HDPE reached approximately 89–92%, compared with about 78–81% for ELKO. These results show that the radial droplet motion is more pronounced relative to the axial motion for HDPE.
The tangential intensity Id,θ, as seen in Figure 11c, remained relatively low compared with the radial intensity, but it still reveals a clear difference between the two fuels. For ELKO, Id,θ remained approximately between 1.2% and 2.7%, while for HDPE, it ranged from about 1.7% to 4.1%. After an initial decrease near the injection location, Id,θ increased again in the downstream region, particularly beyond 30 mm. At 60 mm, HDPE reached approximately 4.1%, compared with about 2.7% for ELKO. This indicates that the tangential droplet motion becomes more important, especially for HDPE, due to the decreasing axial velocity as the spray develops.
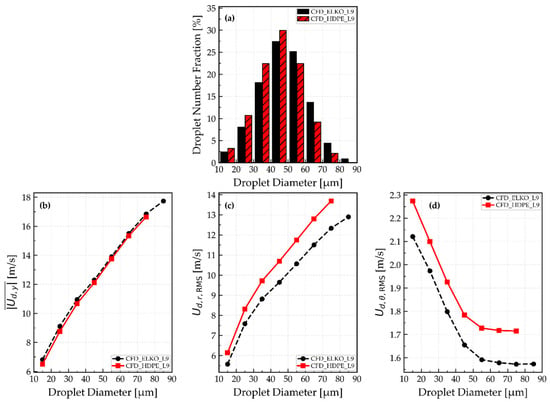
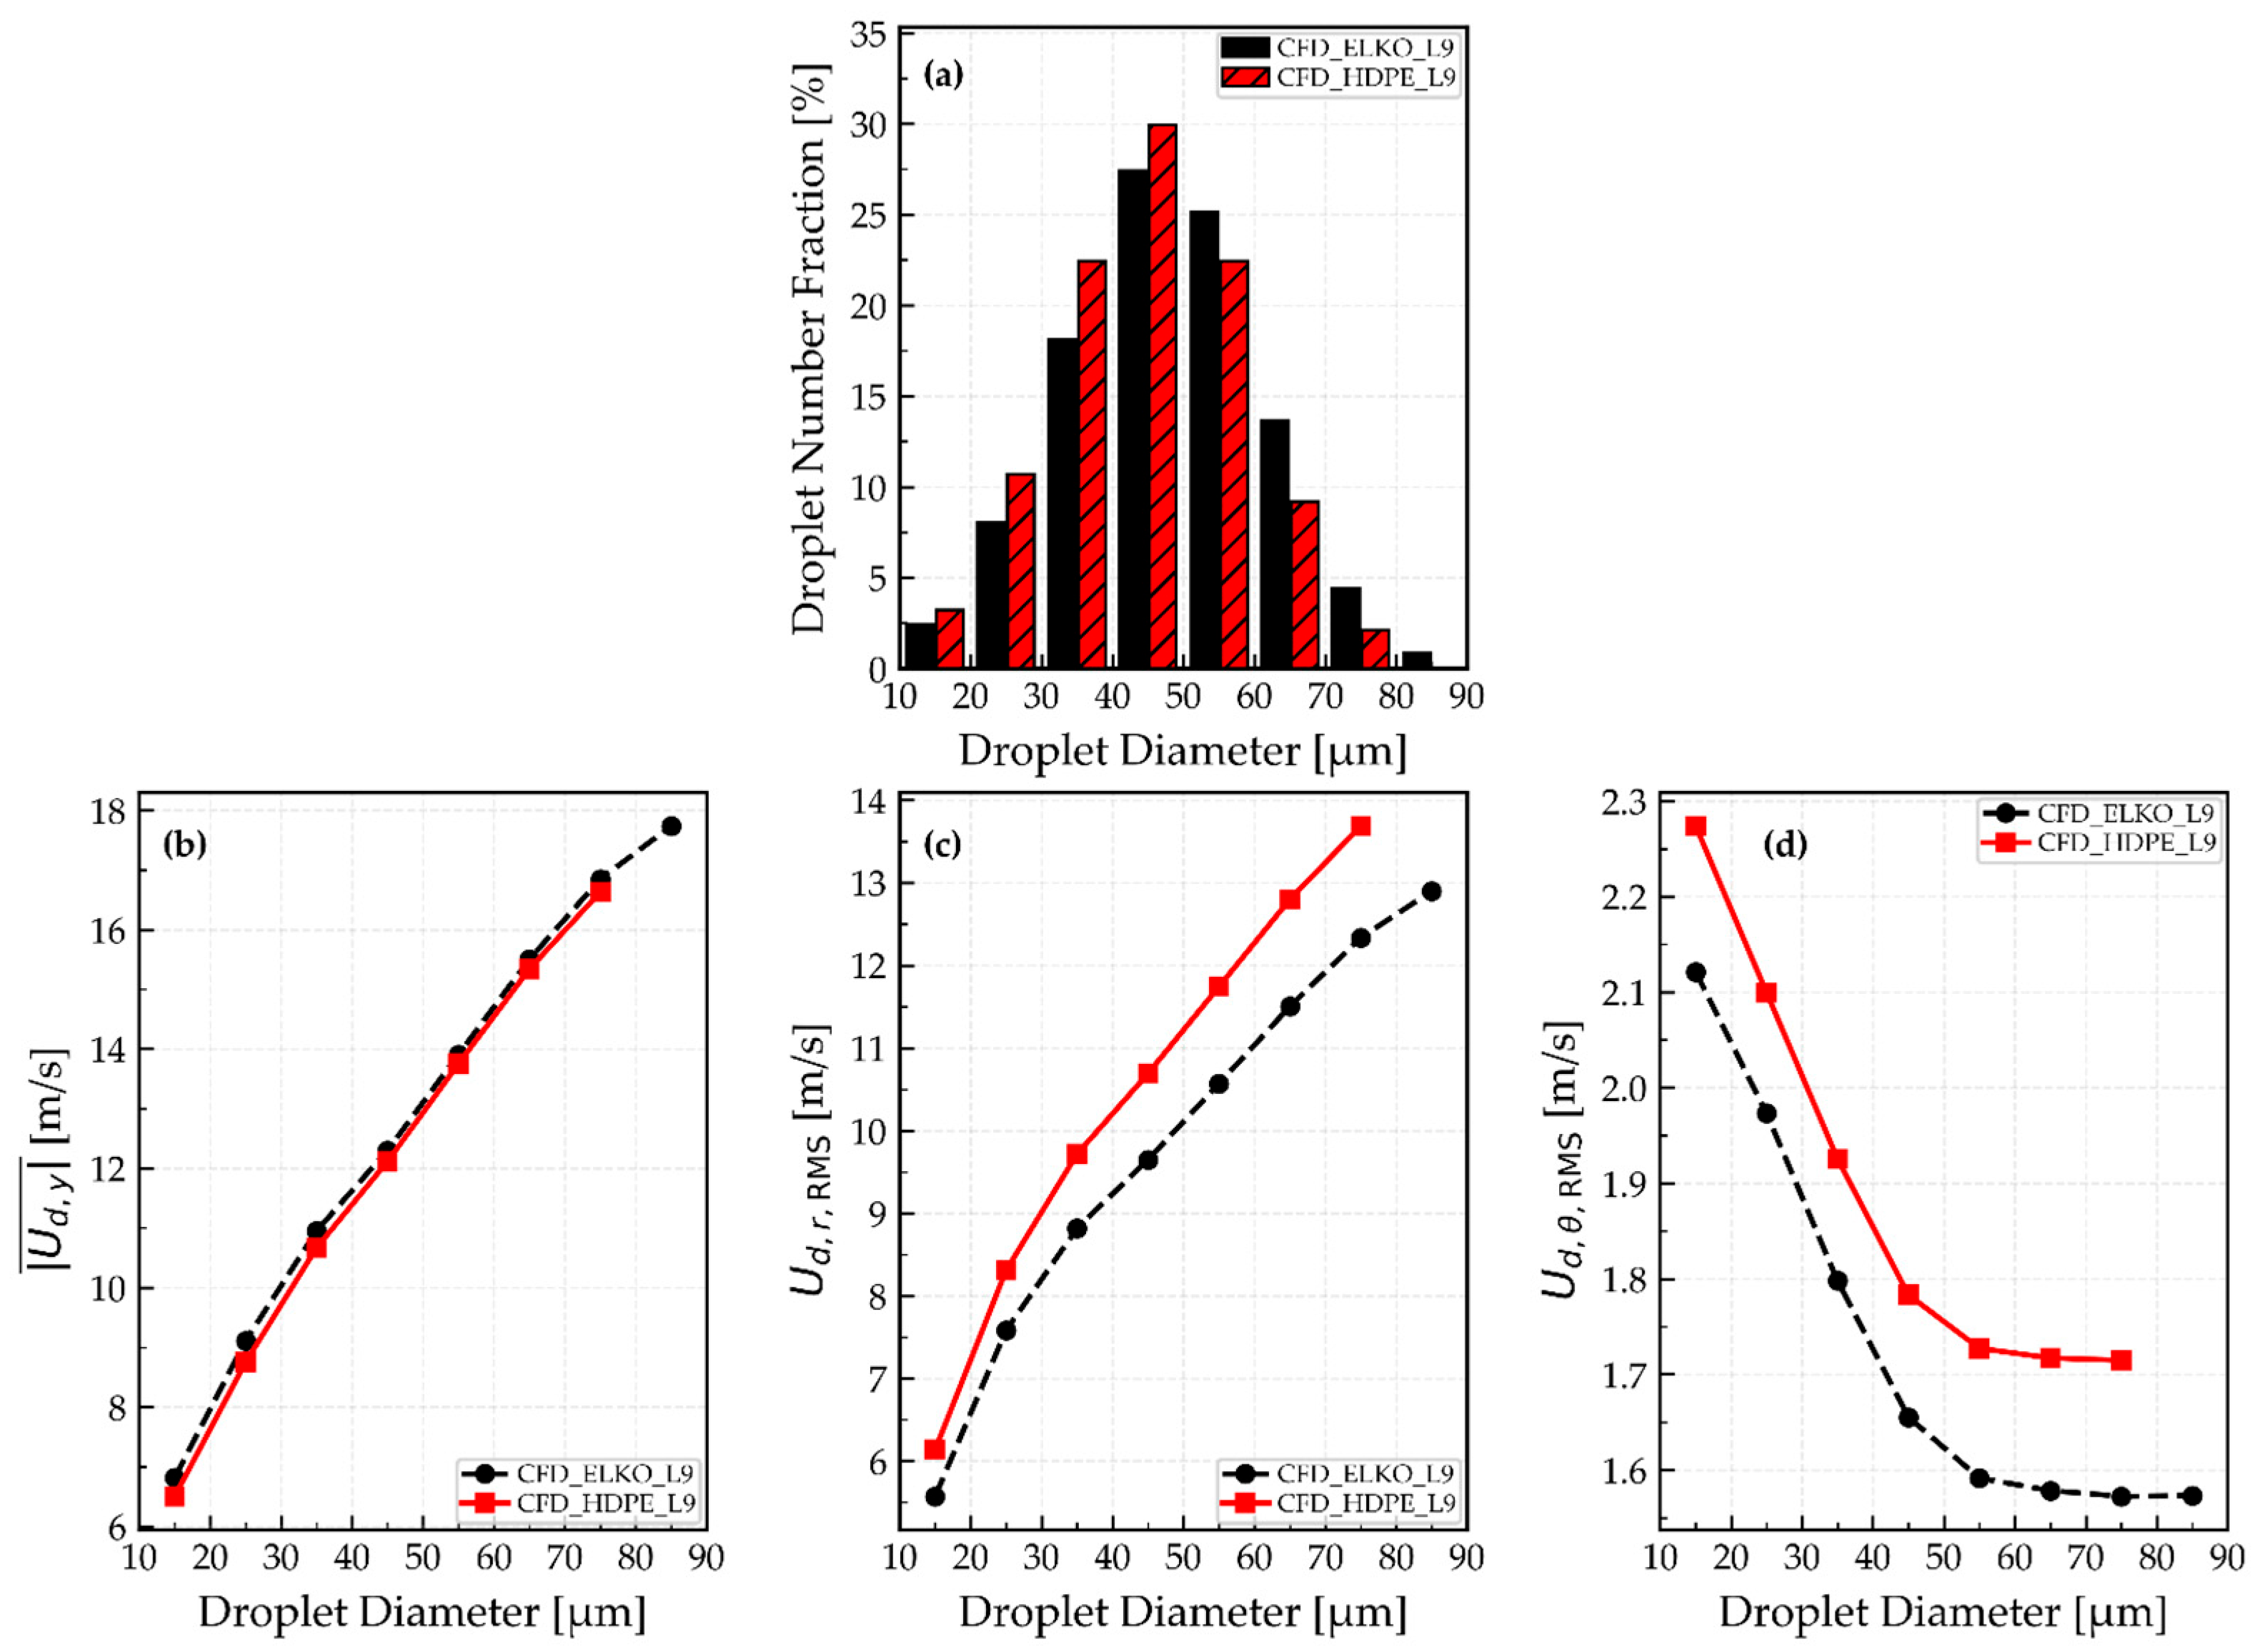
Figure 12a compares the number-based droplet size distributions of the two oils. HDPE shows higher fractions in the 20–30 and 30–40 µm classes by about 2.5 and 4.5 percentage points, respectively, and a slightly higher peak in the 40–50 µm class. In contrast, ELKO has a larger fraction in the 50–60, 60–70 and 70–80 µm classes, with the largest difference occurring at the 60–70 µm class. Overall, droplets below 50 µm account for about 66% of the HDPE oil and 56% of ELKO, confirming the finer droplet distribution of HDPE pyrolytic oil.
Figure 12.
Number-based droplet size distribution and droplet velocity characteristics for ELKO and HDPE pyrolytic oil; (a) droplet number fraction, (b) droplet mean axial velocity, (c) droplet radial RMS velocity, and (d) droplet tangential RMS velocity.
The corresponding diameter-conditioned velocity statistics are shown in Figure 12b–d. As shown in Figure 12b, the mean axial droplet velocity increased with the droplet diameter for both fuels, indicating that larger droplets retain a greater fraction of their axial momentum during downstream transport. ELKO exhibited marginally higher axial velocities over most diameter classes. Since the diameter-conditioned axial velocities of the two fuels are very similar, the slightly higher spatially resolved mean axial velocity previously observed for ELKO in Figure 11a is likely related mainly to its larger contribution of coarse droplets, which are associated with higher axial velocities.
The radial RMS velocity also increased with the droplet diameter and remained systematically higher for HDPE over the analyzed size range. This confirms that the higher radial intensity Id,r reported in Figure 11 is not solely a consequence of normalization by the lower mean axial velocity of HDPE, but is also accompanied by a larger absolute radial RMS component. The higher radial RMS velocity observed for HDPE is consistent with its larger spray angle, and its effects persist during the downstream droplet transport.
In contrast to the radial component, the tangential RMS velocity shown in Figure 12d decreased with the increasing droplet diameter, while remaining slightly higher for HDPE throughout the analyzed range. This size-dependent trend may reflect the shorter aerodynamic response time of smaller droplets, which allows them to respond more readily to local tangential gas-phase motion and velocity fluctuations.
4. Conclusions
This study presents a comparative analysis of the atomization performance of conventional heating oil (ELKO) and pyrolytic oil produced by the thermal pyrolysis of waste HDPE bottle caps. The atomization performance of both oils was characterized experimentally at the macroscopic and microscopic levels using the VisiSize N60 PDIA system. Due to the limited field of view of the VisiSize system, an Euler–Lagrange numerical approach was employed additionally to investigate the droplet size distribution and droplet transport beyond the experimental measurement region. The numerical framework included the LISA model to describe the primary droplet formation from a pressure-swirl nozzle. The main findings of the study are as follows:
- HDPE pyrolytic oil exhibited lower density, viscosity, and surface tension than ELKO, with the dynamic viscosity and surface tension being 24.4% and 11.6% lower, respectively. These properties are consistent with more pronounced liquid-sheet fragmentation and the formation of smaller droplets for the HDPE oil,
- with appropriately selected LISA model parameters, the Euler–Lagrange framework was able to reproduce the experimental SMD values with a deviation of 3.4% for ELKO and 2.6% for HDPE,
- both the experimental and numerical results showed that HDPE produced a finer droplet population than ELKO. The numerical simulation reproduced this overall trend correctly; however, for HDPE, it predicted a somewhat broader droplet-size distribution and a larger fraction of fine droplets than observed experimentally,
- in the axial direction, the SMD increased with downstream distance for both fuels. This trend indicates an increasing relative contribution of larger droplets farther downstream, whereas the smaller droplets respond more readily to the surrounding gas, and are consequently affected more strongly by spatial redistribution. The HDPE maintained a lower SMD throughout the analyzed axial region, although the difference between the two oils decreased gradually downstream,
- in the radial direction, the SMD was lowest near the spray axis and increased toward the spray periphery. The fine droplets were therefore represented more strongly in the inner spray region, whereas the larger and more inertial droplets were present increasingly toward the outer part of the spray. The HDPE maintained lower SMD values than ELKO across the entire analyzed radial range,
- ELKO showed stronger axial penetration, whereas HDPE exhibited larger radial intensity and broader radial dispersion. This behavior reflects the combined effects of droplet size and fuel-specific prescribed mass flow rates and spray angles. The mean gas-phase Weber number remained below unity, and the reported maximum was below approximately 3.3, indicating limited secondary breakup under the modeled conditions.
The results demonstrate that HDPE-derived pyrolytic oil can be atomized effectively with the investigated pressure-swirl nozzle. Its finer and more radially dispersed spray may support evaporation and fuel–air mixing, but atomization alone does not establish sustainable or practical fuel substitution. The agreement with the experimental data also indicates the capability of the Euler–Lagrange framework to reproduce droplet size characteristics and describe spray behavior under the investigated conditions, supporting its use for studying fuels with different physical properties. With appropriately specified injection parameters and further experimental validation, the numerical approach could support investigations of different operating conditions and the assessment of alternative fuels in existing pressure-swirl atomization systems, potentially reducing the experimental effort required. Furthermore, with appropriate model extensions, the numerical approach could also provide a basis for investigating combustion performance, flame stability, and emissions resulting from the combustion of HDPE pyrolytic oil in heating systems. Further research should also evaluate oil contaminants, storage behavior, life-cycle energy and environmental performance.
Author Contributions
Conceptualization, T.J. and L.L.; Methodology, T.J., L.K. and L.L.; Software, T.J. and L.K.; Validation, L.K. and G.B.; Formal analysis, T.J.; Investigation, T.J. and G.B.; Resources, I.B.; Data curation, T.J.; Writing—original draft, T.J.; Writing—review & editing, I.B. and L.L.; Visualization, T.J.; Supervision, G.B. and L.L.; Project administration, I.B. All authors have read and agreed to the published version of the manuscript.
Funding
This research received no external funding.
Institutional Review Board Statement
Not applicable.
Informed Consent Statement
Not applicable.
Data Availability Statement
The original contributions presented in this study are included in the article. Further inquiries can be directed to the corresponding author.
Acknowledgments
The authors wish to thank the Slovenian Research and Innovation Agency (ARIS) for the financial support in the framework of the Research Program P2-0196 in Power, Process and Environmental Engineering.
Conflicts of Interest
The authors declare no conflicts of interest.
References
- IEA. Global Energy Review 2026; IEA: Paris, France, 2026; Available online: https://www.iea.org/reports/global-energy-review-2026 (accessed on 16 September 2026).
- IEA. State of Energy Policy 2026; IEA: Paris, France, 2026; Available online: https://www.iea.org/reports/state-of-energy-policy-2026 (accessed on 16 September 2026).
- Eurostat. Energy Consumption in Households. Statistics Explained. 2026. Available online: https://ec.europa.eu/eurostat/statistics-explained/index.php?title=Energy_consumption_in_households (accessed on 16 September 2026).
- Statistical Office of the Republic of Slovenia (SURS). Energetska Odvisnost Manjša, Končna Raba Večja, StatWeb. 2025. Available online: https://www.stat.si/StatWeb/News/Index/13894 (accessed on 16 September 2026).
- Dai, L.; Zhou, N.; Lv, Y.; Cheng, Y.; Wang, Y.; Liu, Y.; Cobb, K.; Chen, P.; Lei, H.; Ruan, R. Pyrolysis Technology for Plastic Waste Recycling: A State-of-the-Art Review. Prog. Energy Combust. Sci. 2022, 93, 101021. [Google Scholar] [CrossRef] [Scilit]
- Misra, Y.; Prasanna Kumar, D.J.; Mishra, R.K.; Kumar, V.; Dwivedi, N. Thermocatalytic Pyrolysis of Plastic Waste into Renewable Fuel and Value-Added Chemicals: A Review of Plastic Types, Operating Parameters and Upgradation of Pyrolysis Oil. Water-Energy Nexus 2025, 8, 55–72. [Google Scholar] [CrossRef] [Scilit]
- Faisal, F.; Rasul, M.G.; Chowdhury, A.A.; Jahirul, M.I. Optimisation of Process Parameters to Maximise the Oil Yield from Pyrolysis of Mixed Waste Plastics. Sustainability 2024, 16, 2619. [Google Scholar] [CrossRef] [Scilit]
- Chasioti, A.; Zabaniotou, A. An Industrial Perspective for Sustainable Polypropylene Plastic Waste Management via Catalytic Pyrolysis—A Technical Report. Sustainability 2024, 16, 5852. [Google Scholar] [CrossRef] [Scilit]
- Zhang, Y.; Sun, W.; Fang, X.; Xu, J. Low-Carbon Valorization of Waste PE Mulch Film: A Carbon Footprint Comparative Analysis of Typical End-of-Life Treatment Pathways. Sustainability 2026, 18, 9047. [Google Scholar] [CrossRef] [Scilit]
- Dobó, Z.; Jakab, Z.; Nagy, G.; Koós, T.; Szemmelveisz, K.; Muránszky, G. Transportation Fuel from Plastic Wastes: Production, Purification and SI Engine Tests. Energy 2019, 189, 116353. [Google Scholar] [CrossRef] [Scilit]
- Kecsmár, G.; Koós, T.; Dobó, Z. Influence of WPO (Waste Plastic Oil)—Gasoline Mixtures for Emission Characteristics on Working Spark-Ignition Engine. Analecta Tech. Szeged. 2021, 15, 31–36. [Google Scholar] [CrossRef] [Scilit]
- Rajak, U.; Panchal, M.; Prasanna, P.L.; Nagasai, C.; Ağbulut, Ü. Waste to Power: Experimental Investigation and Prediction of Fuel Injection Pressure Effect on the Outputs of DI-CI Engine Fed by Ternary Blends Using Artificial Intelligence. J. Therm. Anal. Calorim. 2025, 150, 12479–12499. [Google Scholar] [CrossRef] [Scilit]
- Faisal, F.; Rasul, M.G.; Jahirul, M.I.; Chowdhury, A.A. Combustion Characteristics of CI Engine Fuelled with Distilled and Hydrotreated Plastic Pyrolytic Oil and Diesel Blends. Appl. Sci. 2025, 15, 11318. [Google Scholar] [CrossRef] [Scilit]
- Suchocki, T.K.; Kazimierski, P.; Januszewicz, K.; Lampart, P.; Zaniewski, D.; Klimaszewski, P.; Witanowski, Ł. Pyrolysis-Derived Waste Polypropylene Oils in Gas Turbine Engines: A Comprehensive Performance and Emission Study. Arch. Thermodyn. 2023, 44, 157–183. [Google Scholar] [CrossRef] [Scilit]
- Suchocki, T. Sustainable Energy Application of Pyrolytic Oils from Plastic Waste in Gas Turbine Engines: Performance, Environmental, and Economic Analysis. Sustainability 2024, 16, 8566. [Google Scholar] [CrossRef] [Scilit]
- Suchocki, T.; Kazimierski, P.; Januszewicz, K.; Lampart, P.; Gawron, B.; Białecki, T. Exploring Performance of Pyrolysis-Derived Plastic Oils in Gas Turbine Engines. Energies 2024, 17, 3903. [Google Scholar] [CrossRef] [Scilit]
- Lee, T.; Jung, S.; Lee, S.; Tsang, Y.F.; Lee, K.H.; Kwon, E.E. Production of Aviation Fuel via Thermal Cracking of Plastic Waste. Energy Convers. Manag. 2024, 315, 118827. [Google Scholar] [CrossRef] [Scilit]
- Sigit Cahyono, M.; Prasetya, A.; Syamsiro, M. Combustion of Plastic Pyrolysis Oil in Steam-Atomizing Burner and Its Application for Pyrolysis Process. Int. J. Innov. Technol. Explor. Eng. 2019, 8, 1488–1492. [Google Scholar] [CrossRef] [Scilit]
- Wang, S.; Rodriguez Alejandro, D.A.; Kim, H.; Kim, J.Y.; Lee, Y.R.; Nabgan, W.; Hwang, B.W.; Lee, D.; Nam, H.; Ryu, H.J. Experimental Investigation of Plastic Waste Pyrolysis Fuel and Diesel Blends Combustion and Its Flue Gas Emission Analysis in a 5 KW Heater. Energy 2022, 247, 123408. [Google Scholar] [CrossRef] [Scilit]
- Wang, S.; Hwang, S.C.; Yuan, X.; Nam, H. Experimental Investigation of Oxy-Combustion Using Plastic Waste Pyrolysis Fuel for CO2 Capture Technology. Energy 2025, 325, 136116. [Google Scholar] [CrossRef] [Scilit]
- Najafi, S.M.A.; Mikaniki, P.; Ghassemi, H. Numerical Simulation of Heavy Fuel Oil Atomization Using a Pulsed Pressure-Swirl Injector. Chin. J. Chem. Eng. 2021, 32, 61–69. [Google Scholar] [CrossRef] [Scilit]
- Khan, S.; Alzahrani, F.M. Gasoline Fuel Spray Dynamics in Direct Injection Systems: A Computational Study Using VOF-DPM Transition Model with AMR. In Proceedings of the 33rd Annual Conference on Liquid Atomization and Spray Systems (ILASS-Americas), West Lafayette, IN, USA, 19–22 May 2024. [Google Scholar]
- Szwaja, M.; Naber, J.D.; Shonnard, D.; Kulas, D.; Zolghadr, A.; Szwaja, S. Comparative Analysis of Injection of Pyrolysis Oil from Plastics and Gasoline into the Engine Cylinder and Atomization by a Direct High-Pressure Injector. Energies 2023, 16, 420. [Google Scholar] [CrossRef] [Scilit]
- Malode, A.; Tamilarasan, N.; Balaji, K.; Sakthivel, R. High Speed Flow Visualization of Primary Breakup Phenomenon of Pyrolysis Oil-Diesel Blend Using Air-Assisted Atomizer. J. Environ. Nanotechnol. 2024, 13, 484–501. [Google Scholar] [CrossRef] [Scilit]
- Karthik, P.S.; Tamilarasan, N.; Balaji, K.; Sakthivel, R.; Raj, K.A.; Mani, P. Experimental Spray characterization of pyrolysis oil-diesel blend by effervescent atomization using high speed imaging. Trans. Energy Syst. Eng. Appl. 2025, 6, 1–18. [Google Scholar] [CrossRef] [Scilit]
- Naima, K.; Liazid, A.; Tazerout, M.; Bousbaa, H. Experimental and numerical investigation of combustion behaviour in diesel engine fuelled with waste polyethylene oil. J. Eng. Sci. Technol. 2018, 13, 3204–3219. [Google Scholar]
- Hu, B.; He, Z.; Li, C.; Deng, Y.; Guan, W.; Zhang, L.; Guo, G. Study of the Effect of Cavitation Flow Patterns in Diesel Injector Nozzles on Near-Field Spray Atomization Characteristics Using a LES-VOF Method. Int. J. Multiph. Flow 2024, 174, 104791. [Google Scholar] [CrossRef] [Scilit]
- Lešnik, L.; Palomar-Torres, A.; Torres-Jiménez, E.; Mata, C.; Volmajer Valh, J.; Kevorkijan, L.; Biluš, I. The Effect of HDPE and LDPE Pyrolytic Oils on Cavitation Formation in a Common-Rail Diesel Injector. Fuel 2022, 330, 125581. [Google Scholar] [CrossRef] [Scilit]
- Kevorkijan, L.; Palomar-Torres, A.; Torres-Jiménez, E.; Mata, C.; Biluš, I.; Lešnik, L. Obtaining the Synthetic Fuels from Waste Plastic and Their Effect on Cavitation Formation in a Common-Rail Diesel Injector. Sustainability 2023, 15, 15380. [Google Scholar] [CrossRef] [Scilit]
- Jernejc, T.; Bombek, G.; Biluš, I.; Kevorkijan, L.; Lešnik, L. An Experimental Analysis of the Influence of Pyrolytic Oil on the Spray Breakup Process. Clean Technol. 2025, 7, 108. [Google Scholar] [CrossRef] [Scilit]
- Schmidt, D.P.; Nouar, I.; Senecal, P.K.; Rutland, C.J.; Martin, J.K.; Reitz, R.D.; Hoffman, J.A. Pressure-Swirl Atomization in the Near Field; SAE Technical paper 1999-01-0496; SAE International: Warrendale, PA, USA, 1999. [Google Scholar] [CrossRef] [Scilit]
- Senecal, P.K.; Schmidt, D.P.; Nouar, I.; Rutland, C.J.; Reitz, R.D.; Corradini, M.L. Modeling High-Speed Viscous Liquid Sheet Atomization. Int. J. Multiph. Flow 1999, 25, 1073–1097. [Google Scholar] [CrossRef] [Scilit]
- Som, S.K. Air core in Pressure Swirl Atomizing Nozzles. At. Sprays 2012, 22, 283–303. [Google Scholar] [CrossRef] [Scilit]
- Lefebvre, A.H.; Mcdonell, V.G. Atomization and Sprays, 2nd ed.; CRC Press, Taylor and Francis Group: Oxfordshire, UK, 2017. [Google Scholar]
- Roache, P.J. Perspective: A Method for Uniform Reporting of Grid Refinement Studies. J. Fluids Eng. 1994, 116, 405–413. [Google Scholar] [CrossRef] [Scilit]
- Celik, I.B.; Ghia, U.; Roache, P.J.; Freitas, C.J.; Coleman, H.; Raad, P.E. Procedure for Estimation and Reporting of Uncertainty Due to Discretization in CFD Applications. J. Fluids Eng. Trans. ASME 2008, 130, 078001. [Google Scholar] [CrossRef] [Scilit]
- Presser, C.; Chung, I.-P.; Pressert, C. Fluid Property Effects on Sheet Disintegration of a Simplex Pressure-Swirl Atomizer. J.Propul. Power 2001, 17, 212–216. [Google Scholar] [CrossRef] [Scilit] [PubMed]
- Santolaya, J.L.; Aísa, L.A.; Calvo, E.; García, I.; García, J.A. Analysis by Droplet Size Classes of the Liquid Flow Structure in a Pressure Swirl Hollow Cone Spray. Chem. Eng. Process. Process Intensif. 2010, 49, 125–131. [Google Scholar] [CrossRef] [Scilit]
- Jedelsky, J.; Maly, M.; Pinto del Corral, N.; Wigley, G.; Janackova, L.; Jicha, M. Air–Liquid Interactions in a Pressure-Swirl Spray. Int. J. Heat Mass Transf. 2018, 121, 788–804. [Google Scholar] [CrossRef] [Scilit]
- Jedelský, J.; Malý, M.; Vankeswaram, S.K.; Zaremba, M.; Kardos, R.; Csemány, D.; Červenec, A.; Józsa, V. Effects of Secondary Breakup, Collision Dynamics, Gravity and Evaporation on Droplet Size Distribution in a Pressure-Swirl JET A-1 Spray. Fuel 2024, 359, 130103. [Google Scholar] [CrossRef] [Scilit]
- Pilch, M.; Erdman, C.A. Use of breakup time data and velocity history data to predict the maximum size of stable fragments for acceleration-induced breakup of a liquid drop. Int. J. Multiph. Flow 1987, 13, 741–757. [Google Scholar] [CrossRef] [Scilit]

Disclaimer/Publisher’s Note: The statements, opinions and data contained in all publications are solely those of the individual author(s) and contributor(s) and not of MDPI and/or the editor(s). MDPI and/or the editor(s) disclaim responsibility for any injury to people or property resulting from any ideas, methods, instructions or products referred to in the content. |
© 2026 by the authors. Licensee MDPI, Basel, Switzerland. This article is an open access article distributed under the terms and conditions of the Creative Commons Attribution (CC BY) license.