


Abstract
Tourism-oriented regeneration can enhance the vitality of historic districts but often creates mismatches between visitor-focused functions and residents’ service needs. Grounded in Sustainable Urban Mobility Plan principles, this study evaluates pedestrian accessibility to 13 categories of public service facilities in Ciqikou Historic District using kernel density estimation and network analysis at 5, 10, and 15 min walking thresholds. Catering, retail, and scenic-attraction categories account for 82% of the 372 points of interest (POIs). These functions cluster along major tourist streets, whereas resident-oriented services are more dispersed. Under the study’s coverage benchmarks, 10 of the 13 facility categories do not cover all residential areas (for example, kindergartens and community service centers cover only 25.4% and 33.8% of residential land within 5 min), whereas public toilets and parks/green spaces achieve 100% 5 min coverage and secondary schools 100% 15 min coverage. This study integrates facility distribution, pedestrian accessibility, and comparisons of tourism-oriented and resident-oriented services into a spatial diagnostic framework focused on social sustainability. The findings can help planners identify gaps in residents’ basic public-service coverage, prioritize facility provision and pedestrian improvements, and provide a basis for resident-oriented regeneration assessments in comparable historic districts facing touristification pressures.
1. Introduction
This section establishes the conceptual and empirical rationale for examining public-service accessibility as a dimension of sustainable regeneration in tourism-oriented historic districts. It first situates the study within debates on urban regeneration, resident–tourist tensions, and sustainable mobility, and then develops the theoretical basis linking Sustainable Urban Mobility Plans (SUMPs), the 15 min community life circle concept, and pedestrian access to everyday public services.
1.1. Background
The global understanding of urban regeneration has steadily evolved, shifting from a sole focus on improving physical space to the pursuit of economic vitality and enhanced livability [1]. This progression has broadened the scope of regeneration to encompass cultural and social dimensions, including the promotion of social equity and active public participation [2]. Historic districts have become a key target of urban regeneration: their preservation and renewal are crucial to integrated urban sustainability strategies, serving as vital carriers of urban life and cultural memory [3]. In this study, historic-district regeneration is understood not merely as physical rehabilitation, but as an ongoing process of improving public services, transport environments, and residents’ living conditions within heritage-conservation constraints to achieve social sustainability. Rather than evaluating regeneration performance comprehensively, this study examines pedestrian accessibility to everyday public-service facilities as one measurable spatial dimension of this process. However, in the post-industrial and post-urbanization era, although regeneration driven by excessive commercialization brings economic activity and environmental improvement, it also generates serious social problems. It contributes to social exclusion, loss of identity, and the displacement of community inhabitants [4,5], disrupts neighborhood spatial hierarchies, and aggravates conflicts between tourists and residents, all of which undermine social sustainability [6].
A notable case is the Ciqikou Historic District, located in the riverside section of Chongqing’s Shapingba District and designated one of Chongqing’s first historical and cultural districts in 1998. Over the past two decades, annual tourist arrivals have grown from less than one million to more than ten million, establishing it as a major cultural and tourism destination in the city [7]. This tourism boom, however, has coincided with a declining resident population and a deteriorating living environment. Problems including traffic congestion, spatial polarization of public facilities, and the marginalization of local residents have emerged, eroding social resilience and undermining sustainable development [6]. Today, within the paradigm of people-oriented urban renewal, historic-district regeneration must prioritize not only economic growth but also the sustainable development of the transport environment serving local residents.
Commercialization in historic-district regeneration can marginalize residents and undermine social sustainability. Meanwhile, previous research has tended to focus on individual dimensions of the SUMP framework, limiting the range of factors considered in public-service facility accessibility assessments [8,9]. Therefore, this study uses Ciqikou Historic District as a case to examine pedestrian accessibility to 13 categories of public service facilities. Kernel density estimation based on point-of-interest (POI) data is combined with network-based service-area analysis to assess facility distribution and residential-land coverage within cumulative 5, 10, and 15 min walking thresholds. The analysis further compares accessibility patterns with street-network configuration and conservation zoning to identify spatially differentiated service gaps. By linking tourist–resident functional structure with network-based pedestrian accessibility and facility-specific evaluation thresholds, this study provides a social sustainability framework for informing targeted and conservation-sensitive regeneration in tourism-oriented historic districts.
1.2. Theoretical Framework
A SUMP, which has been growing rapidly in popularity in recent years, is an integral part of achieving sustainable development, and consists of two main components: improving accessibility for all segments of society and promoting the use of sustainable transport modes, with the 15 min community life circle concept fitting into both components. The ‘15-min community life circle’ initiative emphasizes walkable access to basic facilities [10]. Existing accessibility studies commonly use geographic information system (GIS) tools to examine road networks and public-facility accessibility. However, such research has focused predominantly on green spaces and medical facilities; a more comprehensive, multi-factor approach is needed to advance social sustainability.
1.2.1. Sustainable Mobility Study
The United Nations Sustainable Development Goals (SDGs), particularly Goal 11 on sustainable cities and communities, emphasize the importance of inclusive, safe, resilient, and sustainable urban planning [11]. In terms of mobility, progress toward the SDGs relies heavily on the implementation of SUMPs, which provide a framework for sustainable mobility planning in urban areas [12]. SUMPs aim to improve accessibility for all segments of society, ensure equitable access to transport services, and promote public transport and environmentally friendly modes such as cycling and walking. Sustainable mobility fosters environmentally friendly, efficient, equitable, and healthy transport systems that contribute to more resilient and livable urban environments for future generations [13].
Recent studies have examined SUMP-related issues from multiple perspectives. Delbosc and Currie highlight equity concerns at the intersection of land use and mobility systems [14], while El-Geneidy et al. develop measures of mobility accessibility [15]. Guzman et al. assess the social-inclusion impacts of transportation policy and measure accessibility to work and educational facilities [16], and Serrano-López et al. identify a correlation between low population density and car trip frequency, offering recommendations for sustainable transport development [17]. Sanchez-Sepulveda et al. evaluate walkability and circularity in urban environments [18], and Grande-Ayala et al. examine social sustainability outcomes [19].
Within the SUMP framework, walking and cycling are integral components of sustainable urban transport. Cycling serves not only tourism and recreation but also everyday travel, including commuting and trips to school. Its low environmental impact, limited road-space requirements, and competitive travel times over short distances underscore the importance of high-quality cycling infrastructure in supporting urban cycling [20]. Research further shows that the strategic placement of cycle lanes and bicycle parking can strengthen integration between cycling and public transport and improve accessibility [21]. However, access to safe cycling infrastructure may remain uneven across social groups [22].
For the pedestrian dimension examined here, walkability is a key determinant of public-space livability and an important criterion for assessing urban accessibility [23]. The 15 min community life circle translates this principle into a spatial planning framework that emphasizes walking access to essential services and facilities and promotes active mobility [24]. Wang et al. define the “15 min city” as a livable area offering access to basic amenities within walking radii of 400, 800, and 1200 m, thereby enhancing accessibility and livability [25].
Overall, the SUMP provides a framework for sustainable mobility and equitable service access, while the 15 min community life circle translates these goals into spatial requirements for accessing everyday services within specified walking times. Accordingly, this study adopts pedestrian accessibility to public service facilities as its core measure of residents’ everyday service coverage. Although cycling is integral to sustainable urban transport, the empirical analysis is limited to walking, consistent with the walking-time-based community life circle framework and the study’s focus on residents’ daily services. Cycling networks and equity in cycling infrastructure provision warrant further investigation. The following section reviews the concepts, assessment methods, and research gaps concerning public-service facility accessibility.
1.2.2. Public Facilities Accessibility Study
Accessibility is widely used to characterize the interaction between land use and mobility systems. It can be defined as the relative ease of reaching a facility from a given origin, accounting for distance, travel time, and associated costs (i.e., travel impedance) [26,27]. Spatial equity [28,29] reflects the fair distribution of resources within a region, and accessibility indicators can be used as a measure of the effectiveness and equity of urban facilities; Kompil et al. state that improving the accessibility of service facilities will help to reduce social and spatial inequalities and promote the sustainable development of urban societies [30]; Yan defines accessibility to public service facilities as the degree of spatial access for those who need such services [31]; and Taleai et al. state that accessibility assessment of urban facilities can help urban planners to assess the effectiveness of the current provision of urban services and facilities [32].
Public facility accessibility research is commonly conducted using GIS tools. Early studies often relied on Euclidean distances and simple buffer analysis to estimate facility catchment areas, but this method lacks scientific rigor because it disregards actual pedestrian routes and walking distances. To address this limitation, Oh et al. demonstrated that GIS-based network analysis can measure public facility accessibility more accurately [33].
International GIS accessibility research encompasses two main streams. The first focuses on road-network accessibility: Körmeçli et al. combined space syntax with GIS to assess the physical accessibility of street networks [23], while Ford et al. developed a GIS-based tool for rapidly analyzing accessibility across different transport modes [34]. The second stream employs travel-range-based service-area analysis, which delineates the area reachable from a facility in all directions within a given time threshold (e.g., a 10 min walk or a 15 min drive). Larger service areas indicate more convenient transport and thus better accessibility, and vice versa.
A review of the literature indicates that most studies of public-service facility accessibility adopt a single-factor perspective, with a strong emphasis on urban green spaces and healthcare facilities. Other facility types have received comparatively limited attention, and integrated analyses encompassing multiple facility categories remain scarce. For instance, Huang et al. integrated quantity (including area), quality, and accessibility metrics to evaluate parks and green spaces comprehensively in Hefei [35]; Murad et al. used ArcGIS Network Analyst and overlay analysis to identify districts with low health-center accessibility in Jeddah [36]; Cui et al. applied walking- and driving-based network analysis to assess children’s spaces and green spaces in Hangzhou [37]; Luqman and Khan employed GIS Network Analyst on road networks and health facilities, combined with spatial overlay analysis, to map accessibility and population coverage [38]; and Tahmasbi et al. examined accessibility equity of the Kowsar retail chain (primarily serving economically disadvantaged groups) in Isfahan, Iran [39]. However, sustainable urban development and social equity require a multifaceted approach that considers the combined provision of diverse public services.
Overall, GIS-based network analysis and service-area estimation using walking-time thresholds have become established approaches to assessing public-service facility accessibility. Existing studies have extensively examined green spaces, healthcare facilities, children’s activity spaces, and retail services. However, differences in service standards, time thresholds, and target populations often lead to separate assessments of individual or a few facility categories, leaving findings fragmented and integrated comparisons of residents’ everyday public services relatively limited. Recent research has also examined how tourism development affects facility distribution and accessibility in historic cities. Nevertheless, community-scale assessments integrating tourism-oriented functions, resident-oriented service provision, pedestrian networks, and heritage conservation to identify residential service gaps remain limited. To address these gaps, this study compares tourism-oriented functions and resident-oriented service provision in Ciqikou Historic District and evaluates pedestrian accessibility and residential-land coverage for 13 facility categories within the 5, 10, and 15 min community life circle framework. The findings are further examined in relation to street-network configuration and conservation zoning, providing a spatial diagnostic basis for resident-oriented regeneration in tourism-oriented historic districts.
The following sections develop this analysis. Section 2 introduces the data and methods; Section 3 examines the study area’s spatial structure, facility distribution, and existing service problems; and Section 4 presents accessibility results across facility categories and walking-time thresholds. Section 5 discusses differences between tourism-oriented functions and resident-oriented service provision, descriptive spatial associations between accessibility, street-network configuration, and conservation zoning, and the implications and limitations of the study. Section 6 summarizes the main findings and contributions.
2. Research Data and Methods
This section describes the data and analytical procedures used to evaluate public-service distribution and pedestrian accessibility in Ciqikou Historic District. The workflow comprises two components: preparation of facility, street-network, residential-land, and conservation-zoning datasets; and GIS-based analysis combining kernel density estimation, network service areas, facility-specific walking-time benchmarks, and area-based accessibility indicators.
2.1. Data Sources and Preparation
Three spatial data groups were prepared for the analysis: public-service facility POIs, the pedestrian road network, and residential-land and conservation-zoning layers. Together, these datasets identify service locations, represent feasible walking routes, define the residential areas for which coverage is evaluated, and provide the planning context used for descriptive comparison of accessibility patterns across different conservation zones.
2.1.1. Public-Service Facility POI Data
Public service facility data were obtained from the Amap (Gaode Maps) platform in May 2025. After cleaning—removing duplicates and excluding closed or inactive facilities verified in the field—the POIs were grouped into eight functional classes totaling 372 POIs (Table 1). This eight-class classification was used for kernel density analysis and overall facility-structure description.
Table 1.
Classification and Number of Public Service Facilities in the Ciqikou Historic District.
From these eight classes, POIs closely related to residents’ daily needs were further selected and reclassified into thirteen categories for pedestrian accessibility evaluation, including community service centers, cultural facilities, kindergartens, primary and secondary schools, sports facilities, health stations/clinics, courier facilities, markets/supermarkets, public transport stops, parking, public toilets, and parks/green spaces. The two classifications serve different purposes: the eight-class system captures the overall facility structure including tourism-oriented services, while the thirteen-category system focuses on resident-oriented everyday services. The healthcare class contained three POIs.
2.1.2. Pedestrian Road-Network Data
The pedestrian road network was derived from OpenStreetMap (OSM) vector data downloaded in May 2025, covering the Ciqikou Historic District and its immediate surroundings. The downloaded network was checked against satellite imagery and field observations; missing pedestrian lanes and alleys were added, and roads inaccessible to pedestrians were excluded.
2.1.3. Residential Land and Conservation Zoning
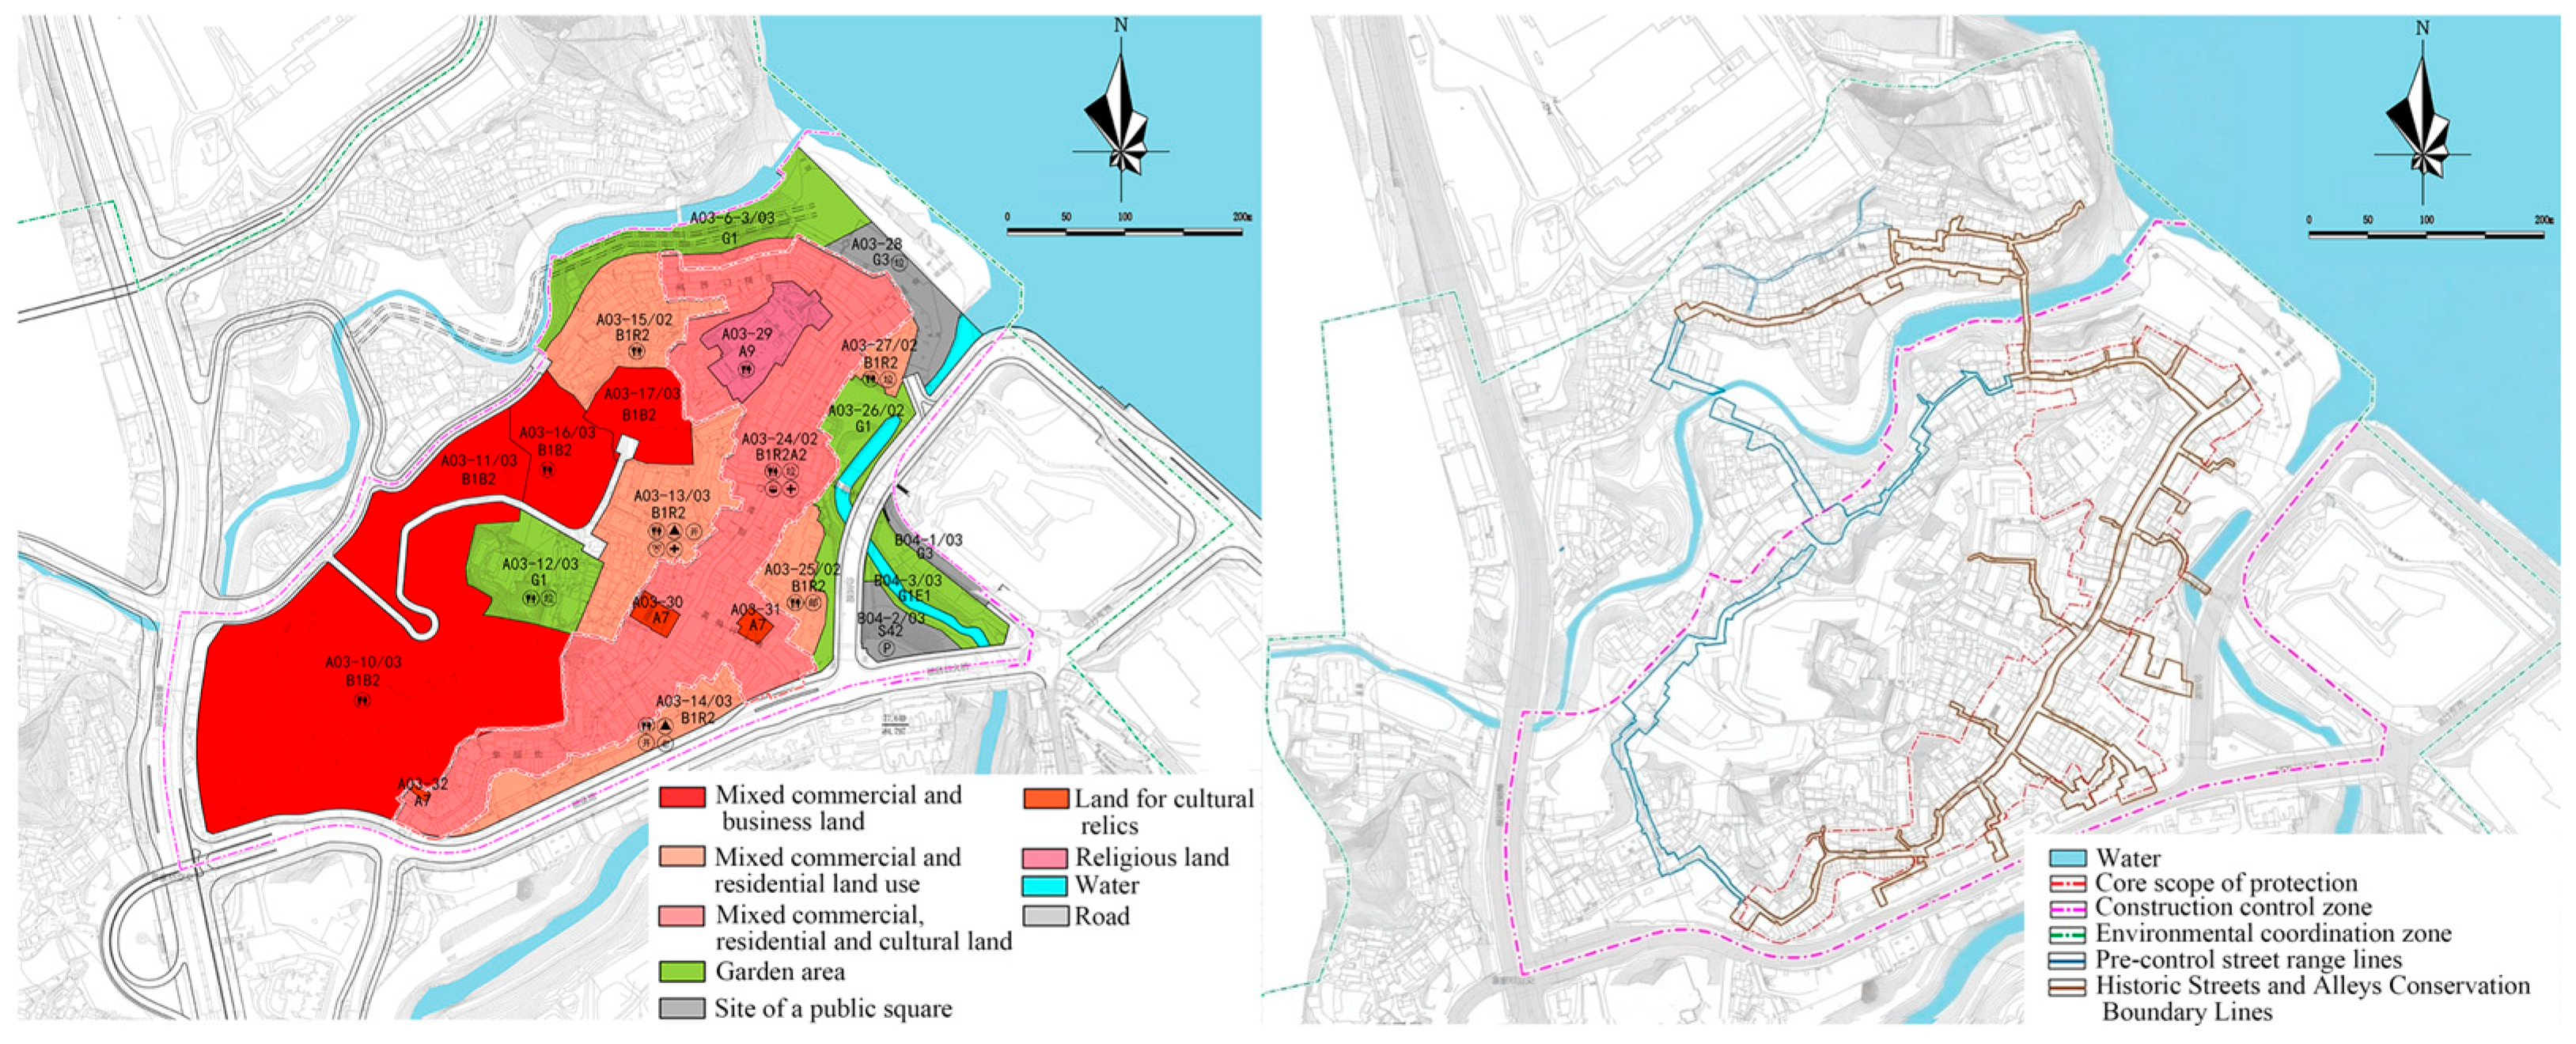
Residential-land and conservation-zoning layers were manually digitized from the official conservation plan maps of the Ciqikou Historic District, and were cross-checked against the current land-use conditions of the study area. The residential-land layer serves as the spatial reference for calculating the residential-land coverage ratio (C1), as described in Section 2.2.4. The conservation-zoning layer—comprising core protection zone, construction control zone, and style coordination zone—is used in the results section for descriptive spatial comparison of facility distribution and accessibility across zones.
2.2. Analytical Methods
This paper first identifies clustered areas of existing facility distribution through kernel density estimation. Then, road network-based service area analysis is used to simulate the reachable range of pedestrians along real street networks. Finally, we adopt walking time benchmarks for different facilities and two coverage metrics: the study area coverage ratio (C0) and residential land coverage ratio (C1). These metrics allow comparison of service coverage for the whole study area and within residential land.
2.2.1. Kernel Density Estimation
Kernel density estimation was implemented in ArcGIS 10.8 using the default search radius (bandwidth) and output cell size. It quantifies the spatial distribution of urban features, represented here primarily by POIs. The contribution of each POI decreases with distance from its location, consistent with the distance-decay pattern of the influence of urban facilities and services on surrounding areas. In point-pattern analysis, kernel density estimation is commonly used to measure relative spatial concentration by estimating local density through a moving window. It is calculated as follows:
where f(x) is the location density estimate, n is the number of POIs, h is the search radius, (x − xi) is the distance from the analyzed element to the centroid, and K is the kernel function [40].
2.2.2. Network-Based Pedestrian Service-Area Analysis
- Method selection: This study employs network-based service area analysis in ArcGIS 10.8 rather than Euclidean buffer analysis. Accessibility research generally needs to consider both land-use opportunities and transport impedance, and location-based indicators derived from network travel time offer strong interpretability and planning utility [41]. Compared with buffer analysis, the primary advantage of the network approach is that pedestrian movement is constrained to the actual street network, thereby capturing route connectivity, detours, intersections, and dead ends that straight-line buffers cannot represent. In Ciqikou Historic District, constrained by topography, roads naturally follow contour lines and slope gradients, resulting in an irregular and highly sinuous street fabric; Euclidean buffers would cut across hillsides and built structures and deviate substantially from actual walking routes, making network-based analysis considerably more realistic than simple buffering. The street-network morphology underlying the service-area analysis also indirectly reflects topographic constraints on pedestrian routing, for example, switchback routes whose actual travel distance far exceeds the straight-line distance and narrow lanes and cul-de-sacs in the historic district that further amplify path non-linearity. However, the impedance model does not explicitly incorporate segment-level slope as a modifier of walking speed, so the service-area results should be interpreted as network-constrained approximations of pedestrian travel time in a mountainous setting.
- Road network preprocessing and walking-time cost: The road network was preprocessed before network construction. Road centerlines were classified into five road classes—expressway, trunk road, secondary road, side road, and sidewalk—and split at intersections, followed by topological checking and correction of dangling links and erroneous connections. A walking-time impedance was then assigned to each road segment according to its class:where ti is the walking time (min) of segment i, li is the segment length (m), and vi is the road-class-specific walking speed (m/min), with values of 40, 55, 65, 70, and 75 m/min assigned to expressway, trunk road, secondary road, side road, and sidewalk, respectively [42].
- Network construction: Before spatial analysis, POIs, the road network, residential land, and conservation zoning were spatially aligned to the study-area boundary. POIs were snapped to the nearest network edge before service-area calculation. Following basic data processing, the existing road traffic network was constructed and simulated. A new network dataset was created, with attributes for intersection turns, road connectivity, distance costs, and other travel costs to represent the complexity of actual network conditions. Because the 15 min community life circle primarily considers walking time, walking time was selected as the travel-cost impedance.
- Service area calculation: Network analysis in GIS enables the analysis and evaluation of the spatial distribution characteristics of public service facility coverage. In this study, a service-area analysis was first created: after loading public service facility points as input facilities, the service-area analysis parameters were configured, and the service areas were subsequently computed to delineate the coverage zones of public service facilities.
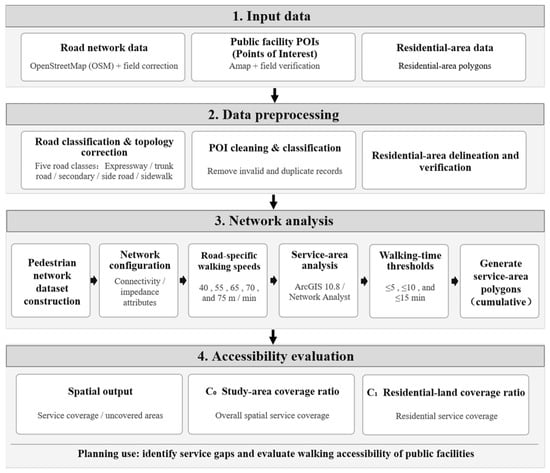
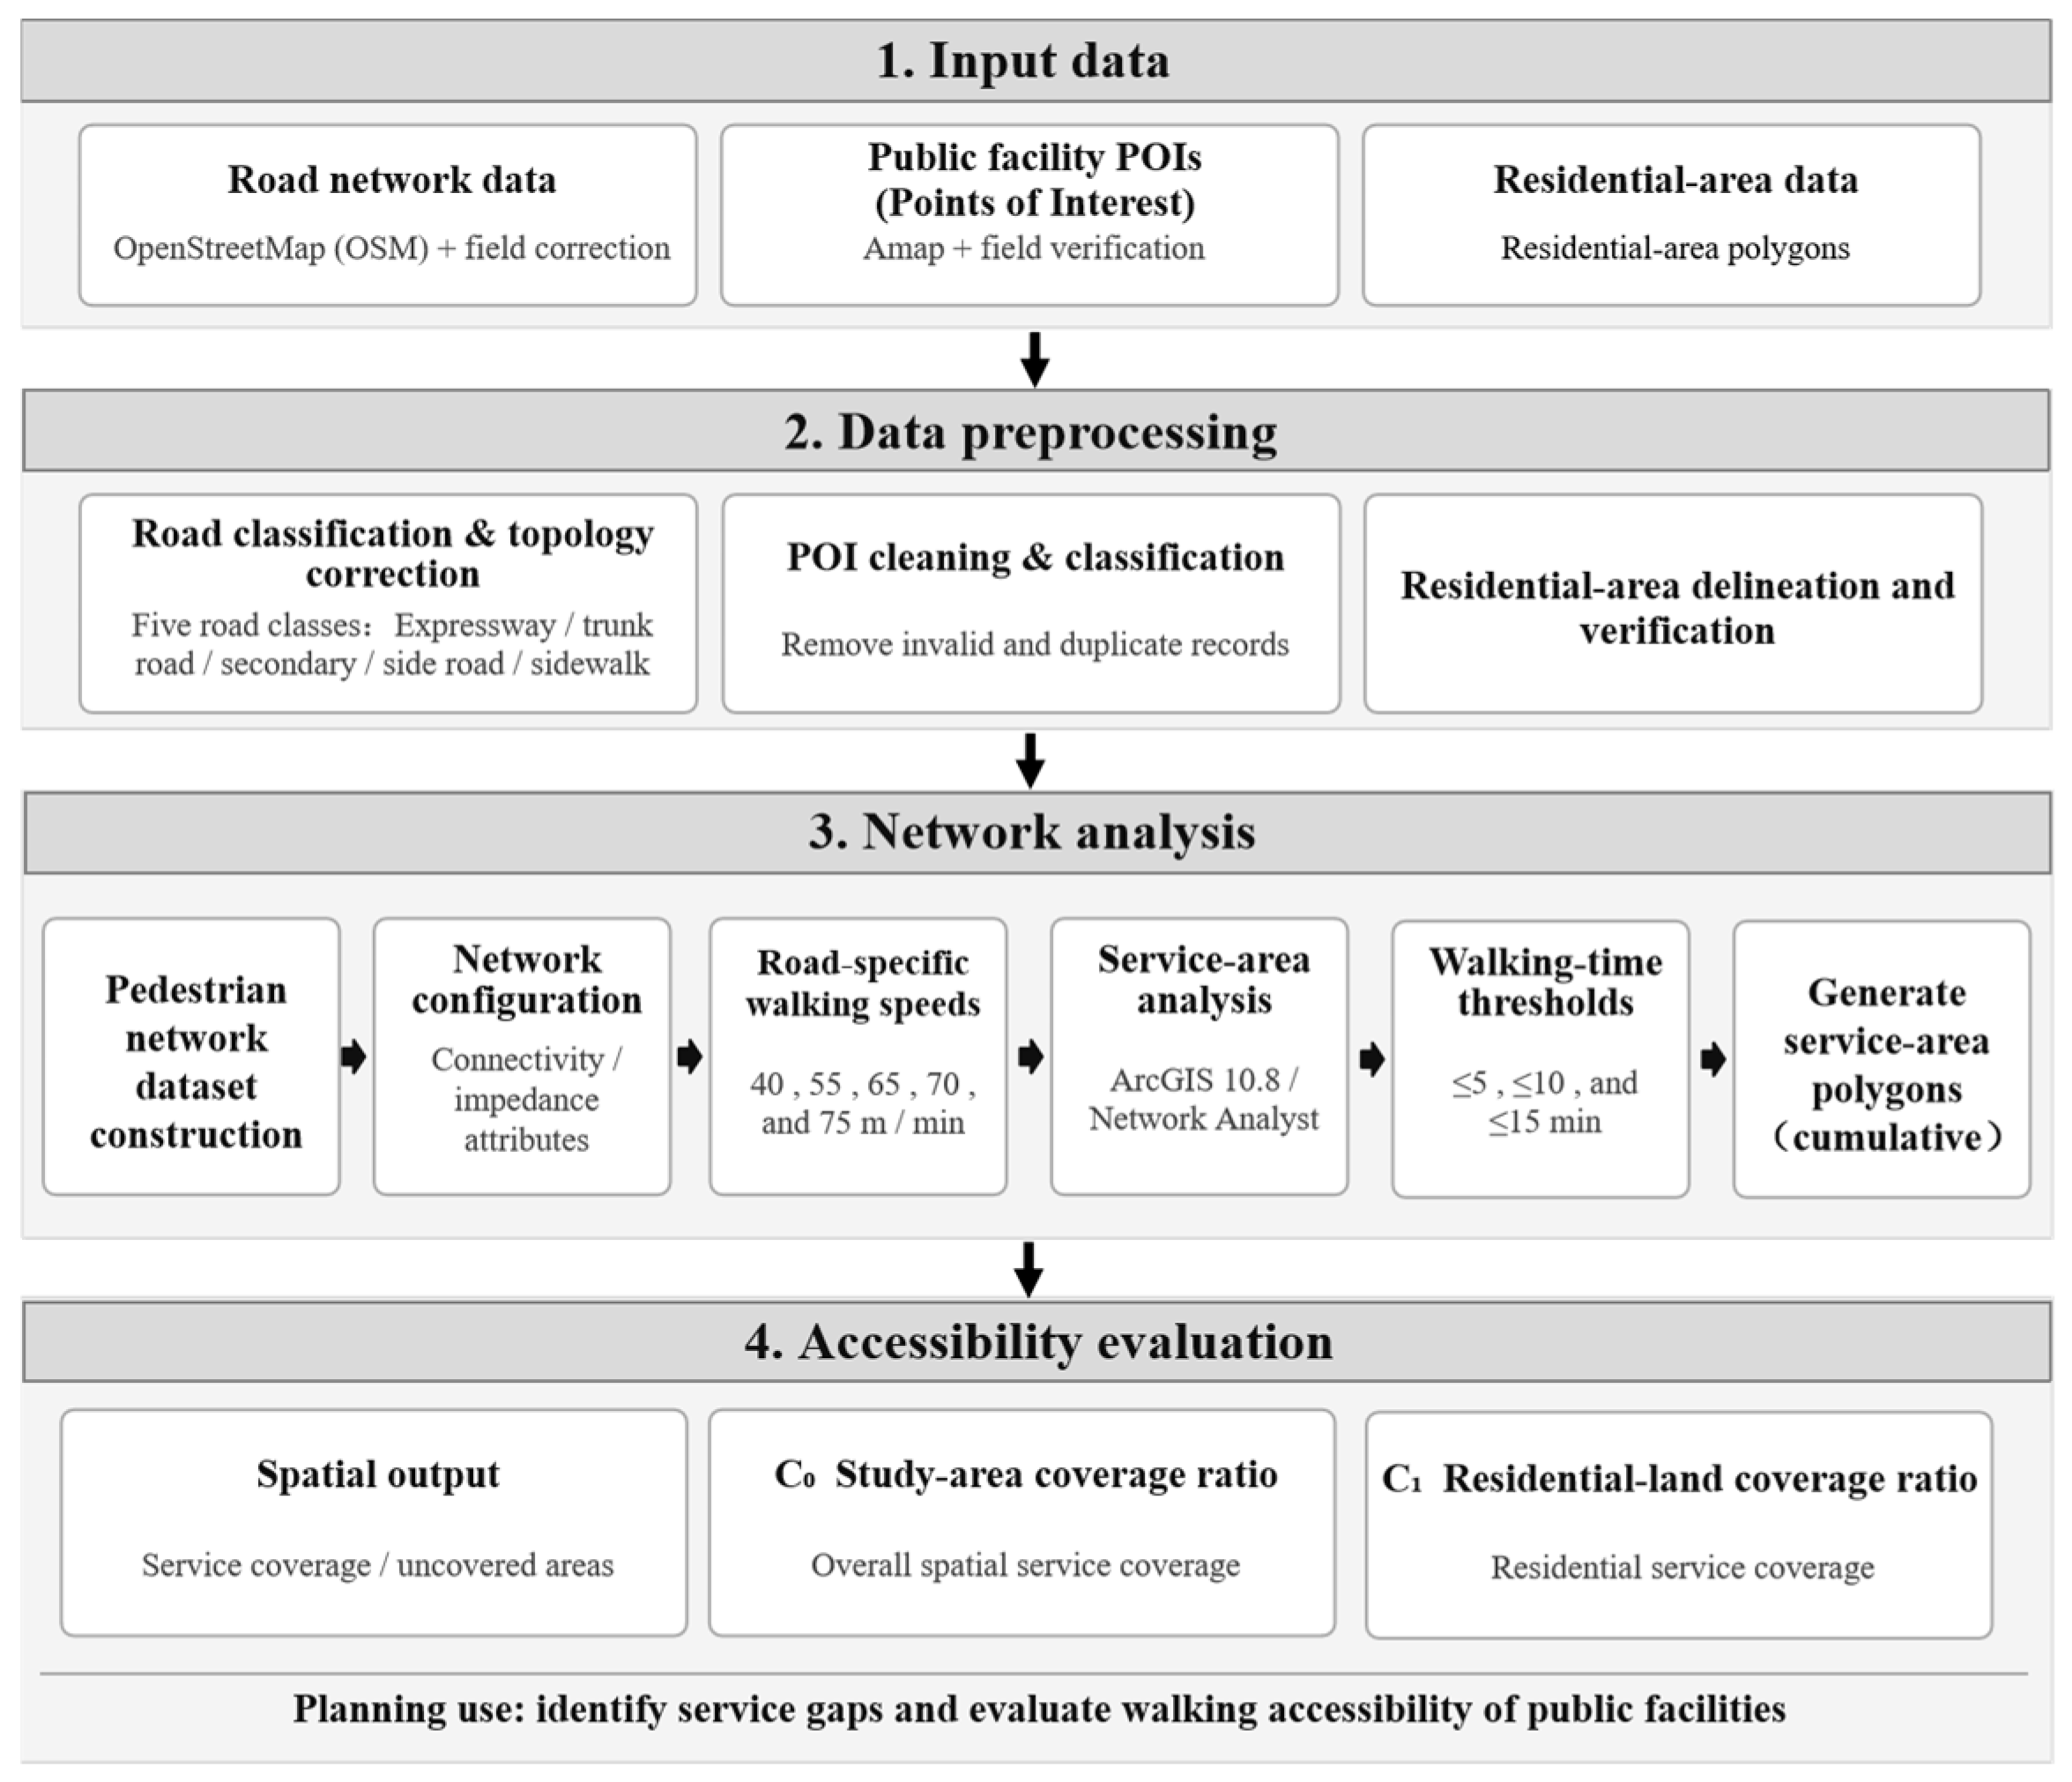
Cumulative service areas were generated for walking-time thresholds of ≤5, ≤10, and ≤15 min, corresponding to the 5, 10, and 15 min community life circles, respectively [43]. The ≤10 min service area includes the ≤5 min area, and the ≤15 min area includes both. For each facility category and time threshold, overlapping service areas generated by multiple facilities were dissolved before area calculation, so that each spatial location was counted only once. The resulting service-area polygons were intersected with the study-area boundary and residential-land polygons to calculate the coverage indicators described in Section 2.2.4. The overall workflow of the network-based service-area analysis is illustrated in Figure 1.
Figure 1.
Analytical workflow for GIS-based pedestrian accessibility assessment of public service facilities.
2.2.3. Facility Selection and Community Life Circle Evaluation Benchmarks
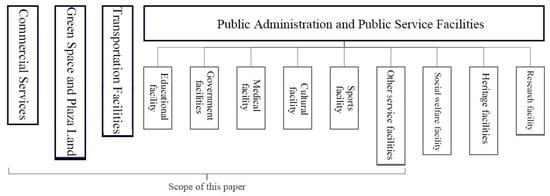
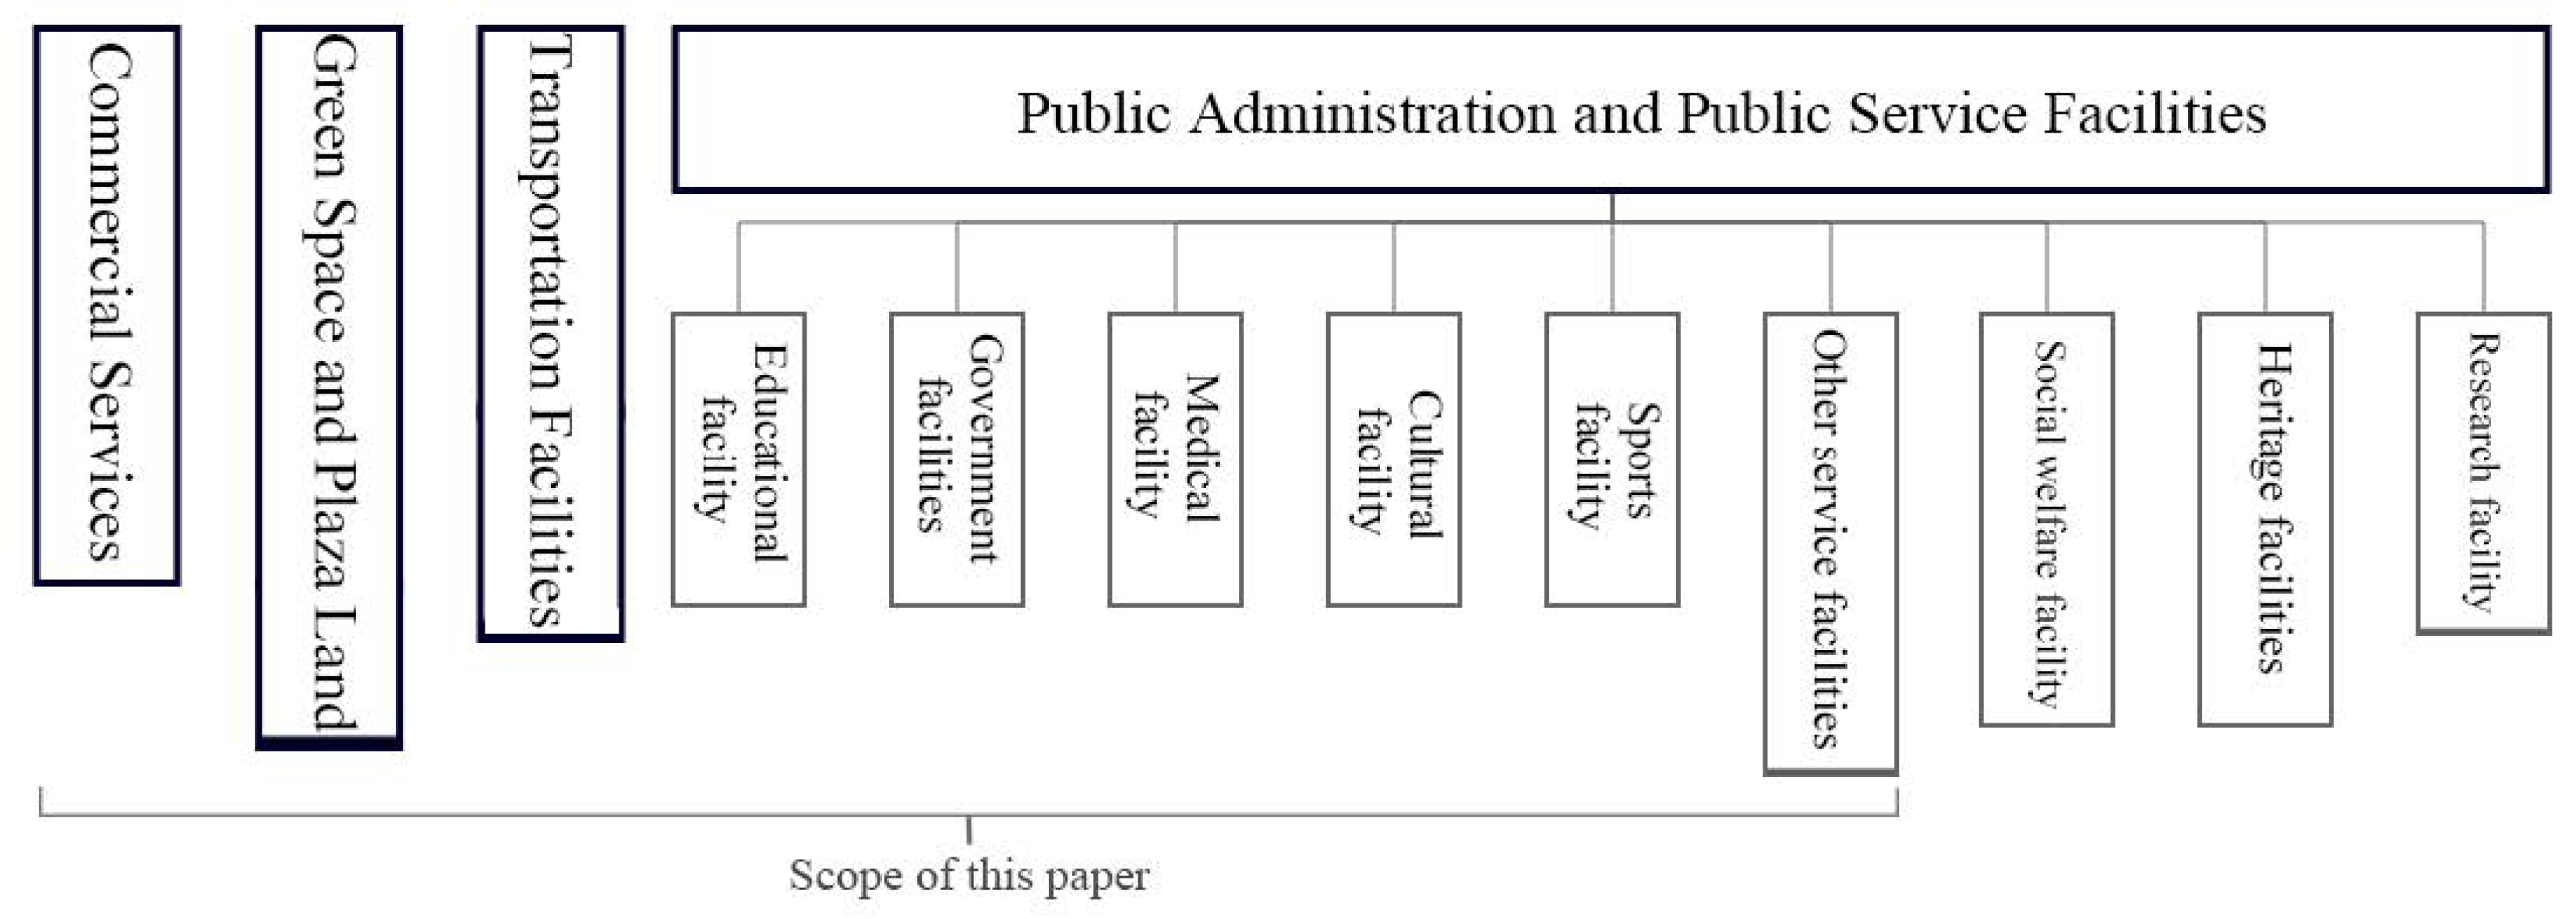
- Facility selection: According to GB 50180-2018 [43], urban public administration and public service land includes administrative offices, cultural facilities, education, sports, healthcare, social welfare, cultural relics, and scientific research categories. Building on this classification and considering the actual facility composition of Ciqikou Historic District as well as residents’ daily needs, this study selects thirteen categories of public service facilities closely related to residents’ everyday travel for accessibility assessment. These thirteen categories can be grouped into four sets: (i) basic public services (six categories: community service centers, cultural facilities, kindergartens, primary schools, secondary schools, and health stations/clinics); (ii) transport facilities (two categories: public transport stops and parking facilities); (iii) commercial services (two categories: markets/supermarkets and courier facilities); and (iv) public space and sanitation (three categories: parks/green spaces, sports facilities, and public toilets). The detailed composition of the thirteen facility categories is shown in Figure 2.Figure 2. Types of public facilities.
- Evaluation time benchmarks: According to the standard [43], community life circles in China are organized into three walking-time tiers—five, ten, and fifteen minutes—corresponding to reference service radii of approximately 300 m, 500 m, and 1000 m, respectively. This study employs network-based cumulative walking times (≤5, ≤10, and ≤15 min) as accessibility evaluation thresholds. It should be noted that the values of 300 m, 500 m, and 1000 m are planning reference radii and are not used as Euclidean buffer distances in the GIS analysis; actual service extents are derived from cumulative walking-time calculations on the road network.
- Threshold assignment and classification rule: Different facility categories are assigned evaluation time thresholds according to the standard [43]: kindergartens, sports facilities, health stations/clinics, courier facilities, markets/supermarkets, parking facilities, public toilets, parks/green spaces, cultural facilities, and community service centers use ≤5 min as a short-distance comparison threshold; primary schools and public transport stops use ≤10 min; secondary schools use ≤15 min. For courier facilities, markets/supermarkets, parking facilities, and parks/green spaces, relevant planning standards specify service radii but do not directly define 5/10/15 min time tiers. To maintain a uniform comparative framework, this study adopts ≤5 min as a study-defined short-distance benchmark for these categories. The specific evaluation thresholds for all facility categories are listed in Table 2. In the accessibility analysis presented in Section 4, a Yes/No classification is used as the evaluation criterion: a facility category is classified as “Yes” if it achieves complete coverage of the study area’s residential land (i.e., C1 = 100%) within its assigned evaluation threshold, and “No” otherwise.Table 2. Community life circle tiers and service radii of public service facilities.
2.2.4. Accessibility Indicators
The study-area coverage ratio (C0) measures the proportion of the total area covered by public-facility service zones, reflecting the spatial coverage of urban public facilities. It is calculated as follows:
where is the cumulative service area of a given public facility type within the specified travel-time threshold and is the total area of the study area.
Relevant studies show that the scope of residential areas is closely related to the distribution of permanent residents, and the coverage of residential areas can be used as a proxy indicator for population distribution [44]. The residential-land coverage ratio (C1) measures the proportion of residential land covered by public-facility service zones, reflecting the actual accessibility of public facilities for residents and their contribution to residents’ quality of life. It is calculated as follows:
where = (∑a1 + a2 + … an) − AP, a is the area of the settlements within the coverage of public facilities, n is the number of settlements within the coverage of public facilities, AP is the duplicate area of the settlements within the coverage of public facilities, is the total area of the settlements within the coverage of public facilities (excluding the overlapping area of the settlements within the coverage of public facilities), and AR is the total area of settlements.
3. Spatial Distribution of Public Facilities in Community Neighborhoods
Before evaluating pedestrian accessibility, this section establishes the spatial context and existing distribution of public-service facilities in Ciqikou Historic District. It first describes the study area, historic street structure, and residential pattern, and then examines current service and mobility problems using field observations, POI statistics, and kernel density mapping, with particular attention to the contrast between tourism-oriented and resident-oriented functions.
3.1. Study Area and Spatial Structure
The ancient town of Ciqikou was founded during the Song Dynasty. It lies adjacent to the Jialing River, backed by Geleshan Mountain, with Qingshui Creek and Phoenix Creek flanking it to the north and south, respectively, and Phoenix Mountain and Jinbi Mountain enclosing the surrounding terrain. By the late 1980s, Ciqikou’s traditional goods-distribution function had gradually disappeared, and the neighborhood entered a period of decline. In 2001, Shapingba District initiated conservation planning and design for the Ciqikou Historic Neighborhood; in November 2006, Ciqikou Ancient Town was designated a national AAAA-level tourist attraction; and in 2015, it was recognized as one of the first batch of Chinese Historical and Cultural Neighborhoods.
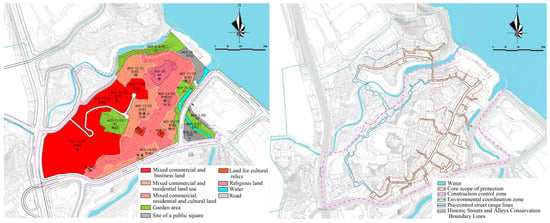
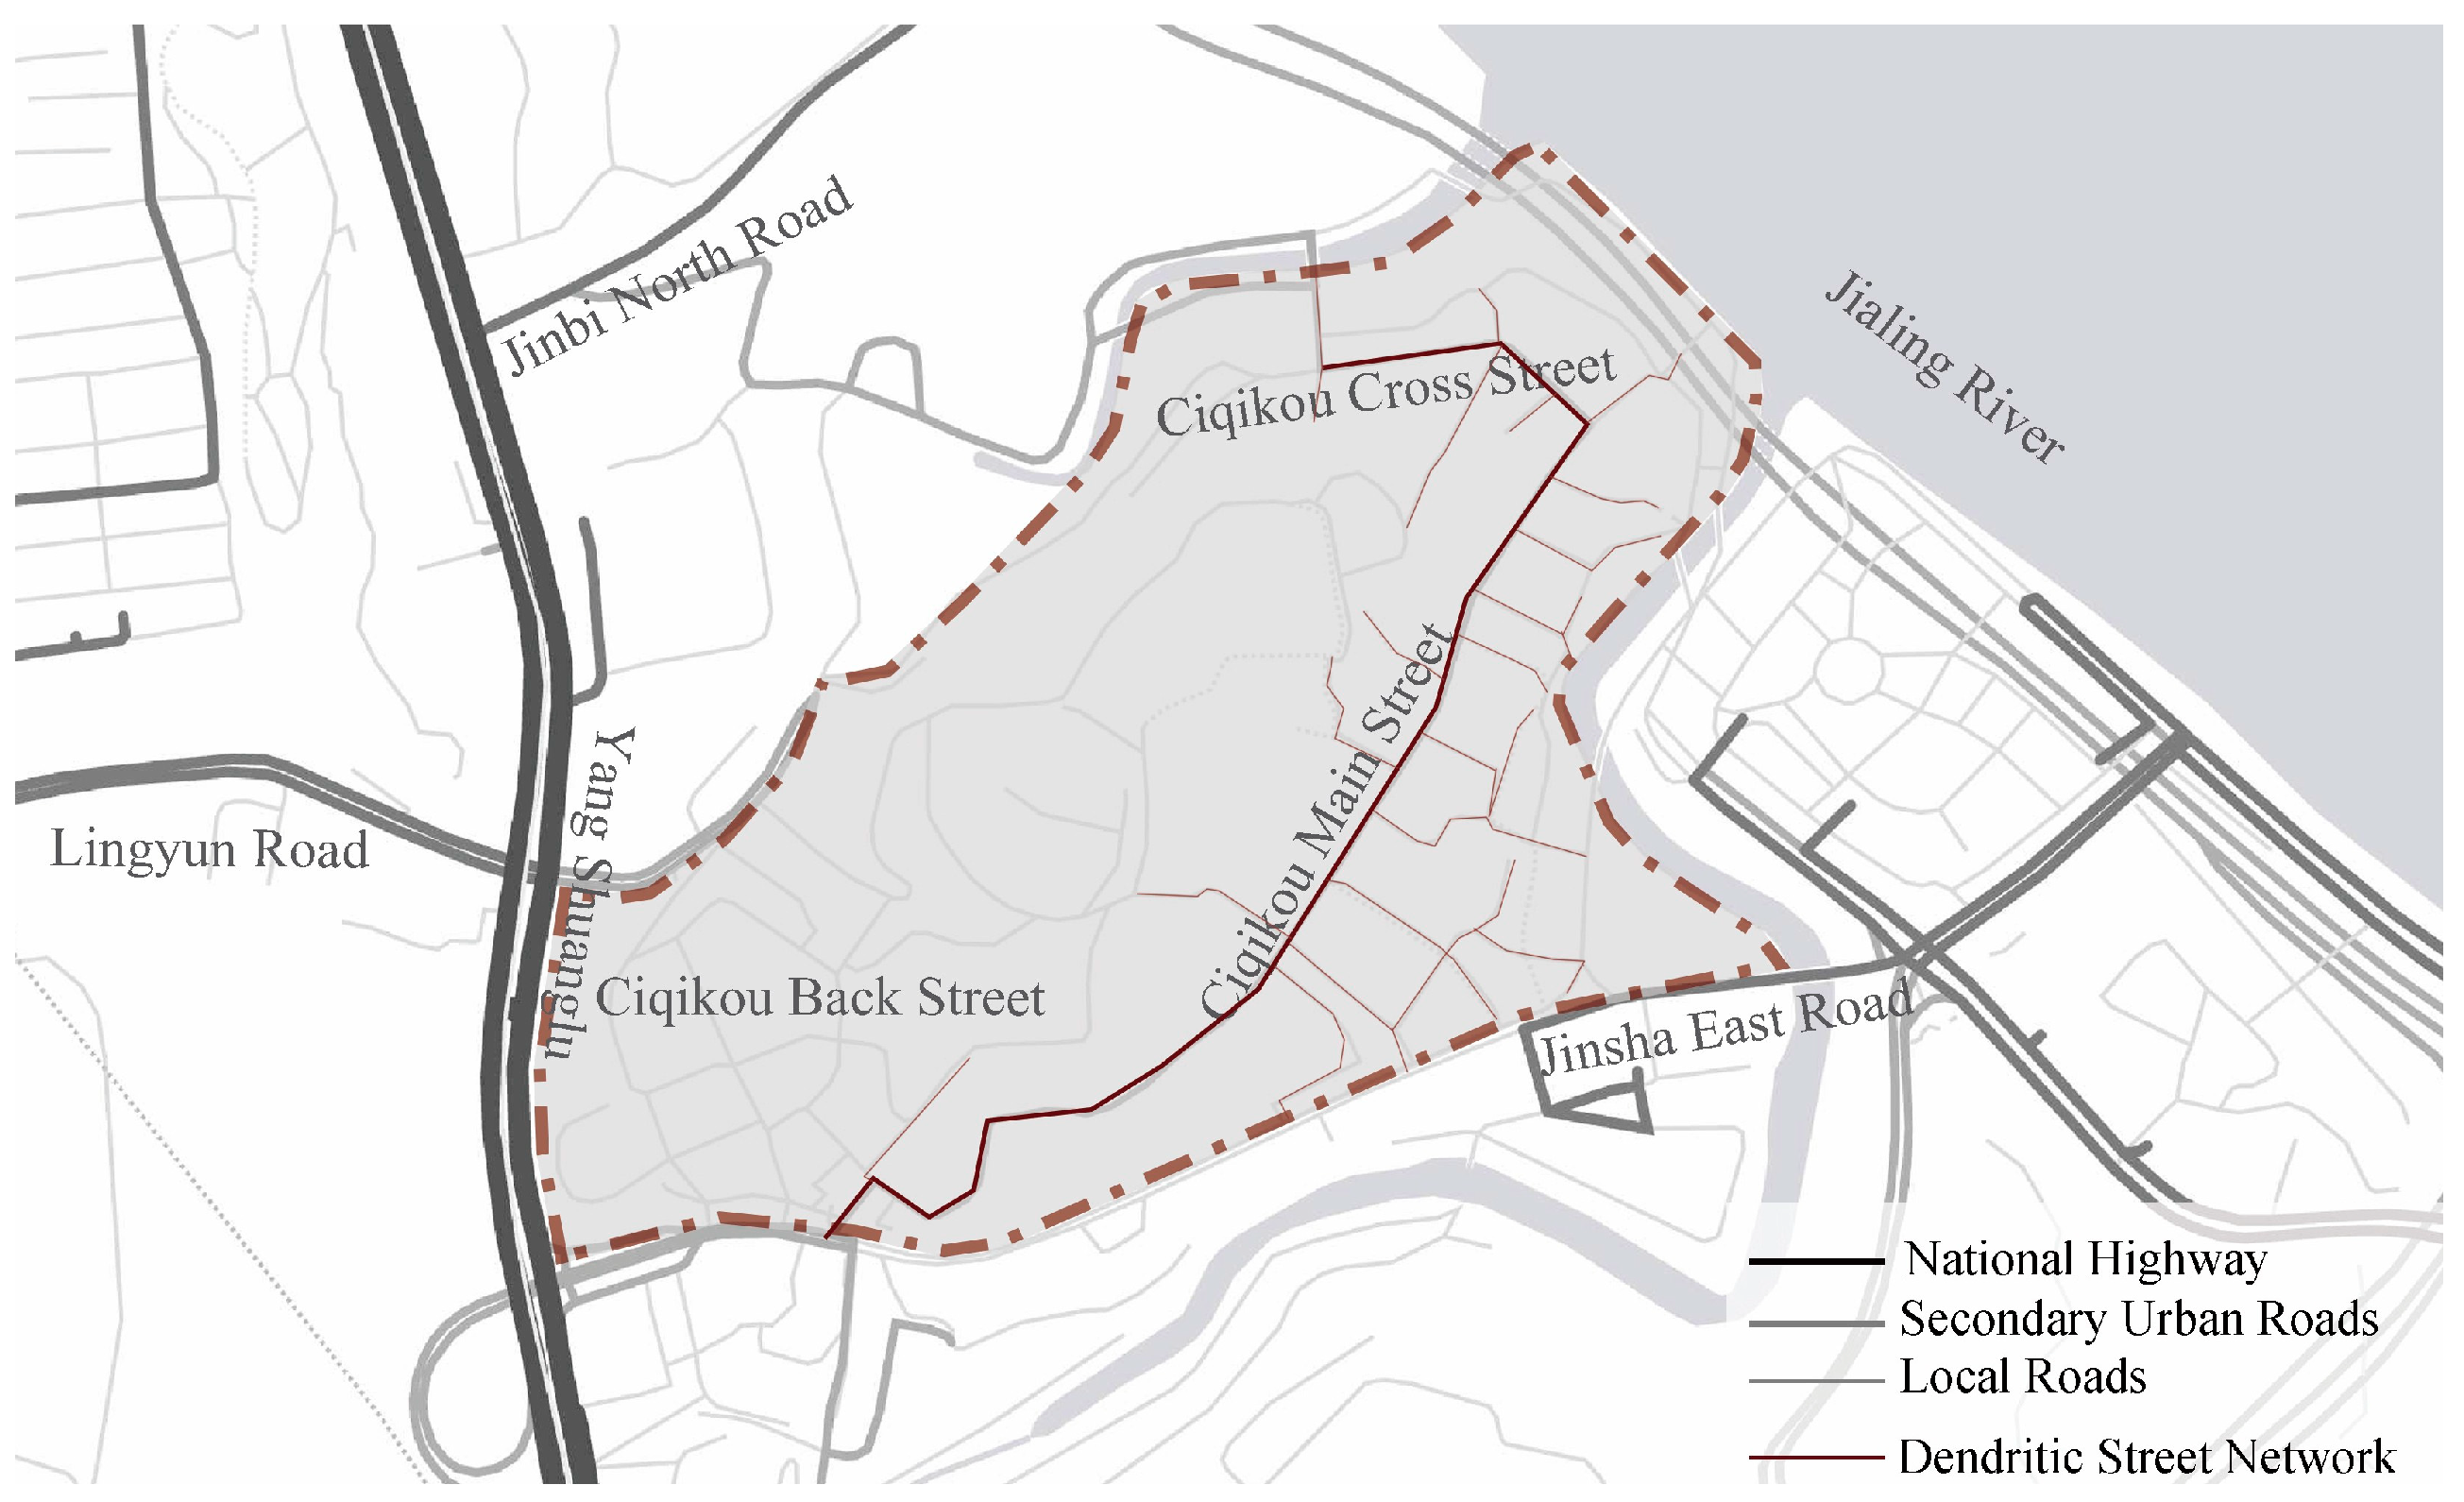
The ancient town occupies the eastern and southeastern slopes of Maanshan Mountain and comprises three principal streets—Ciqikou Main Street, Cross Street, and Back Street. Ciqikou Main Street and Cross Street form the structural backbone, while 42 lanes and alleys extend perpendicularly toward the ridges of Maanshan Mountain and the edges of adjacent creeks and gorges, producing a distinctive dendritic plan pattern. As shown in the land-use map (Figure 3), most residential buildings are concentrated along Main Street and Cross Street and in the flanking areas of the ancient town.
Figure 3.
Planning Sites and Streets.
Over the course of urban development, the contradiction between urban character and land use has become increasingly pronounced: pedestrian and vehicular circulation is poorly organized, and severe congestion frequently occurs during peak tourist periods. Architectural styles are inconsistent, residential structures have been erected in a disorderly manner, and historic buildings suffer from inadequate maintenance. Commercial activity is dominated by catering and retail, with serious homogenization, a monotonous cultural experience, and low per capita spending. In 2018, the annual visitor volume of the Ciqikou reached 12 million, with a visitor density eight times that of Lijiang and Wuzhen, and the scenic area is seriously overloaded [7].
3.2. Existing Spatial and Service Problems
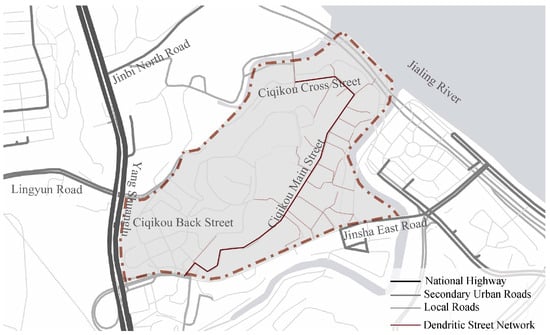
Transportation facilities and pedestrian flow organization: The Ciqikou Historical and Cultural District evolved as a self-organized residential market town. Its main street extends directly to the Jialing River and has the widest roadway in the district, functioning as both the primary circulation axis and the principal pedestrian route serving most traditional residential clusters. Forty-two streets and alleys of varying sizes developed spontaneously along this spine, producing a clear dendritic pattern with primary and secondary branches. Nevertheless, this configuration yields poor overall integration of open space: numerous streets terminate in dead ends, hindering smooth through-movement and generating spatial fragmentation and weak systemic coherence. As a result, most open spaces suffer from low accessibility, poor spatial comfort, inadequate facility integration, and diminished environmental quality around nodes and paths (Figure 4).
Figure 4.
Street-network structure and traffic organization in the Ciqikou Historic District.
Tourism expansion and the associated growth of commercial activities have increasingly disrupted residents’ daily lives. Although tourism has generated economic benefits for the district, many local residents have benefited only marginally. Meanwhile, the commercialization of open spaces and the concentration of visitor-oriented facilities have reduced the availability of medical, educational, recreational, and other essential services for residents. These changes have intensified conflicts between tourism development and residential life.
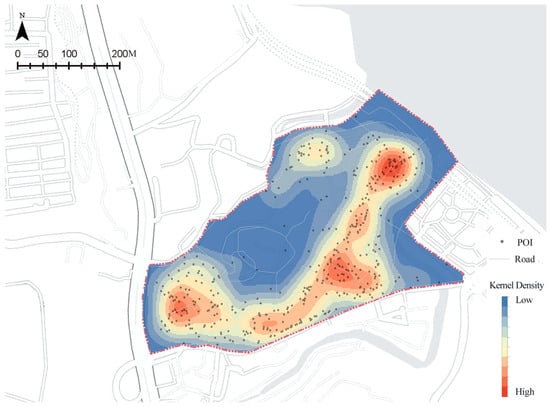
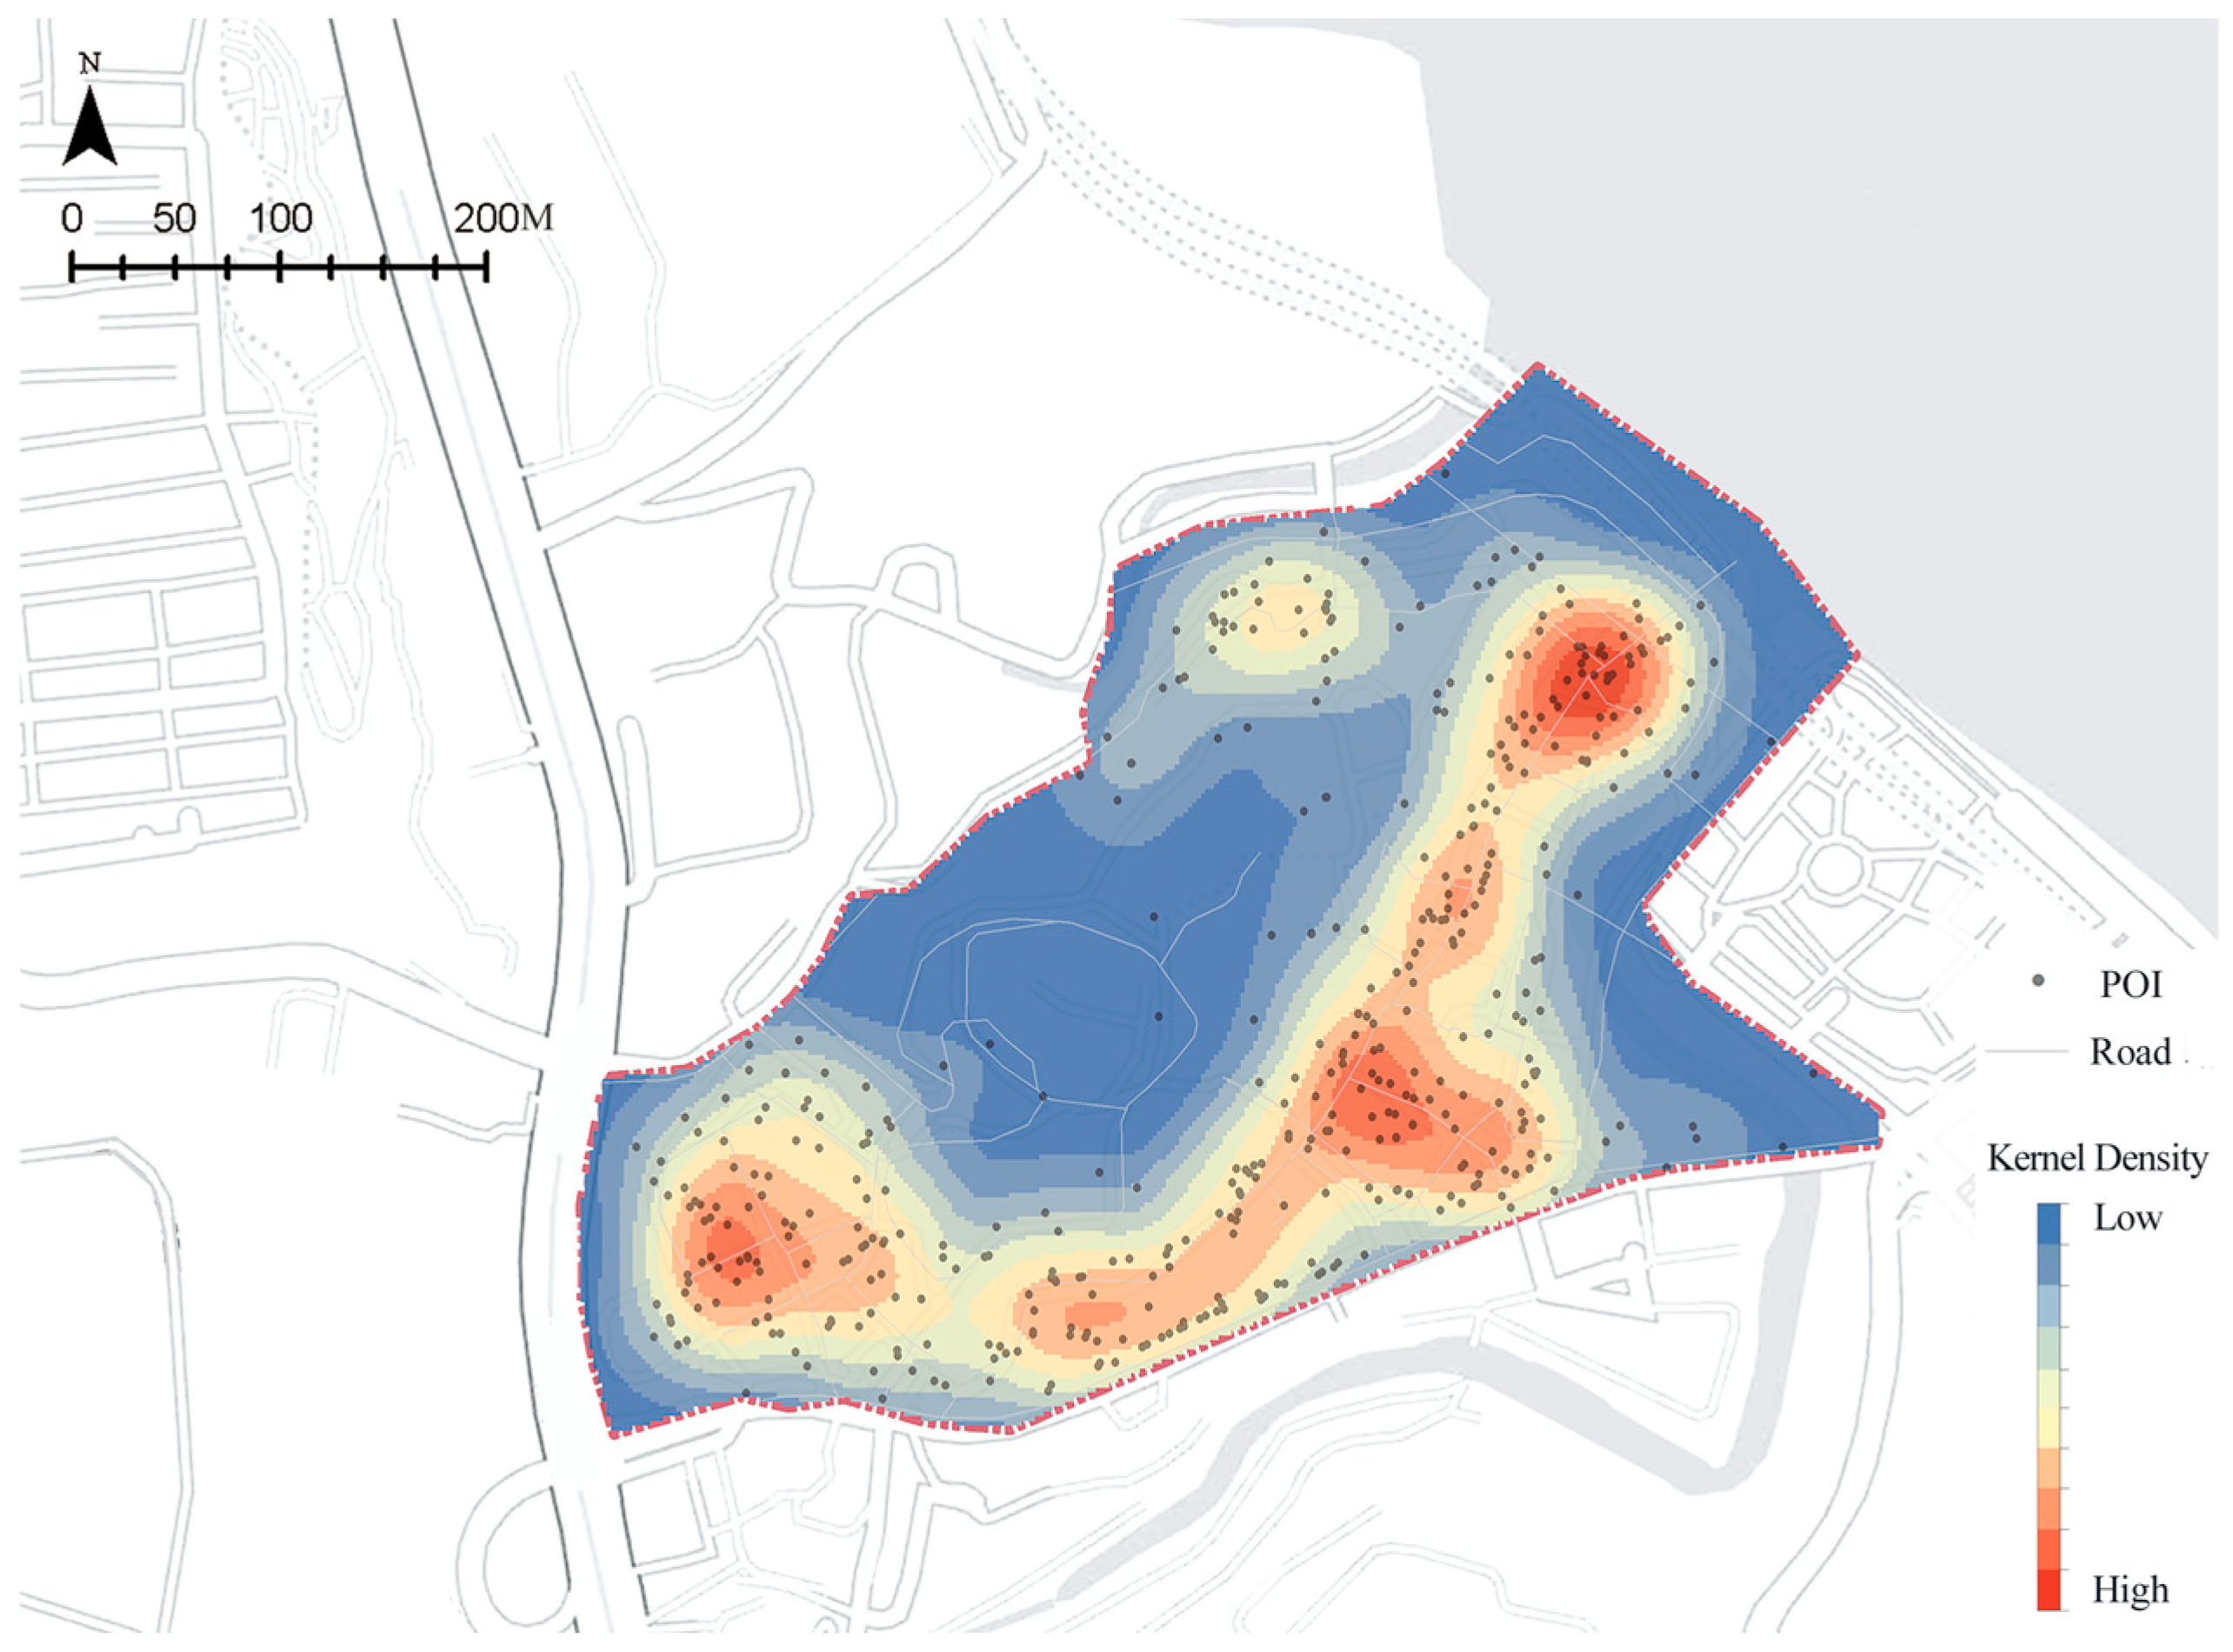
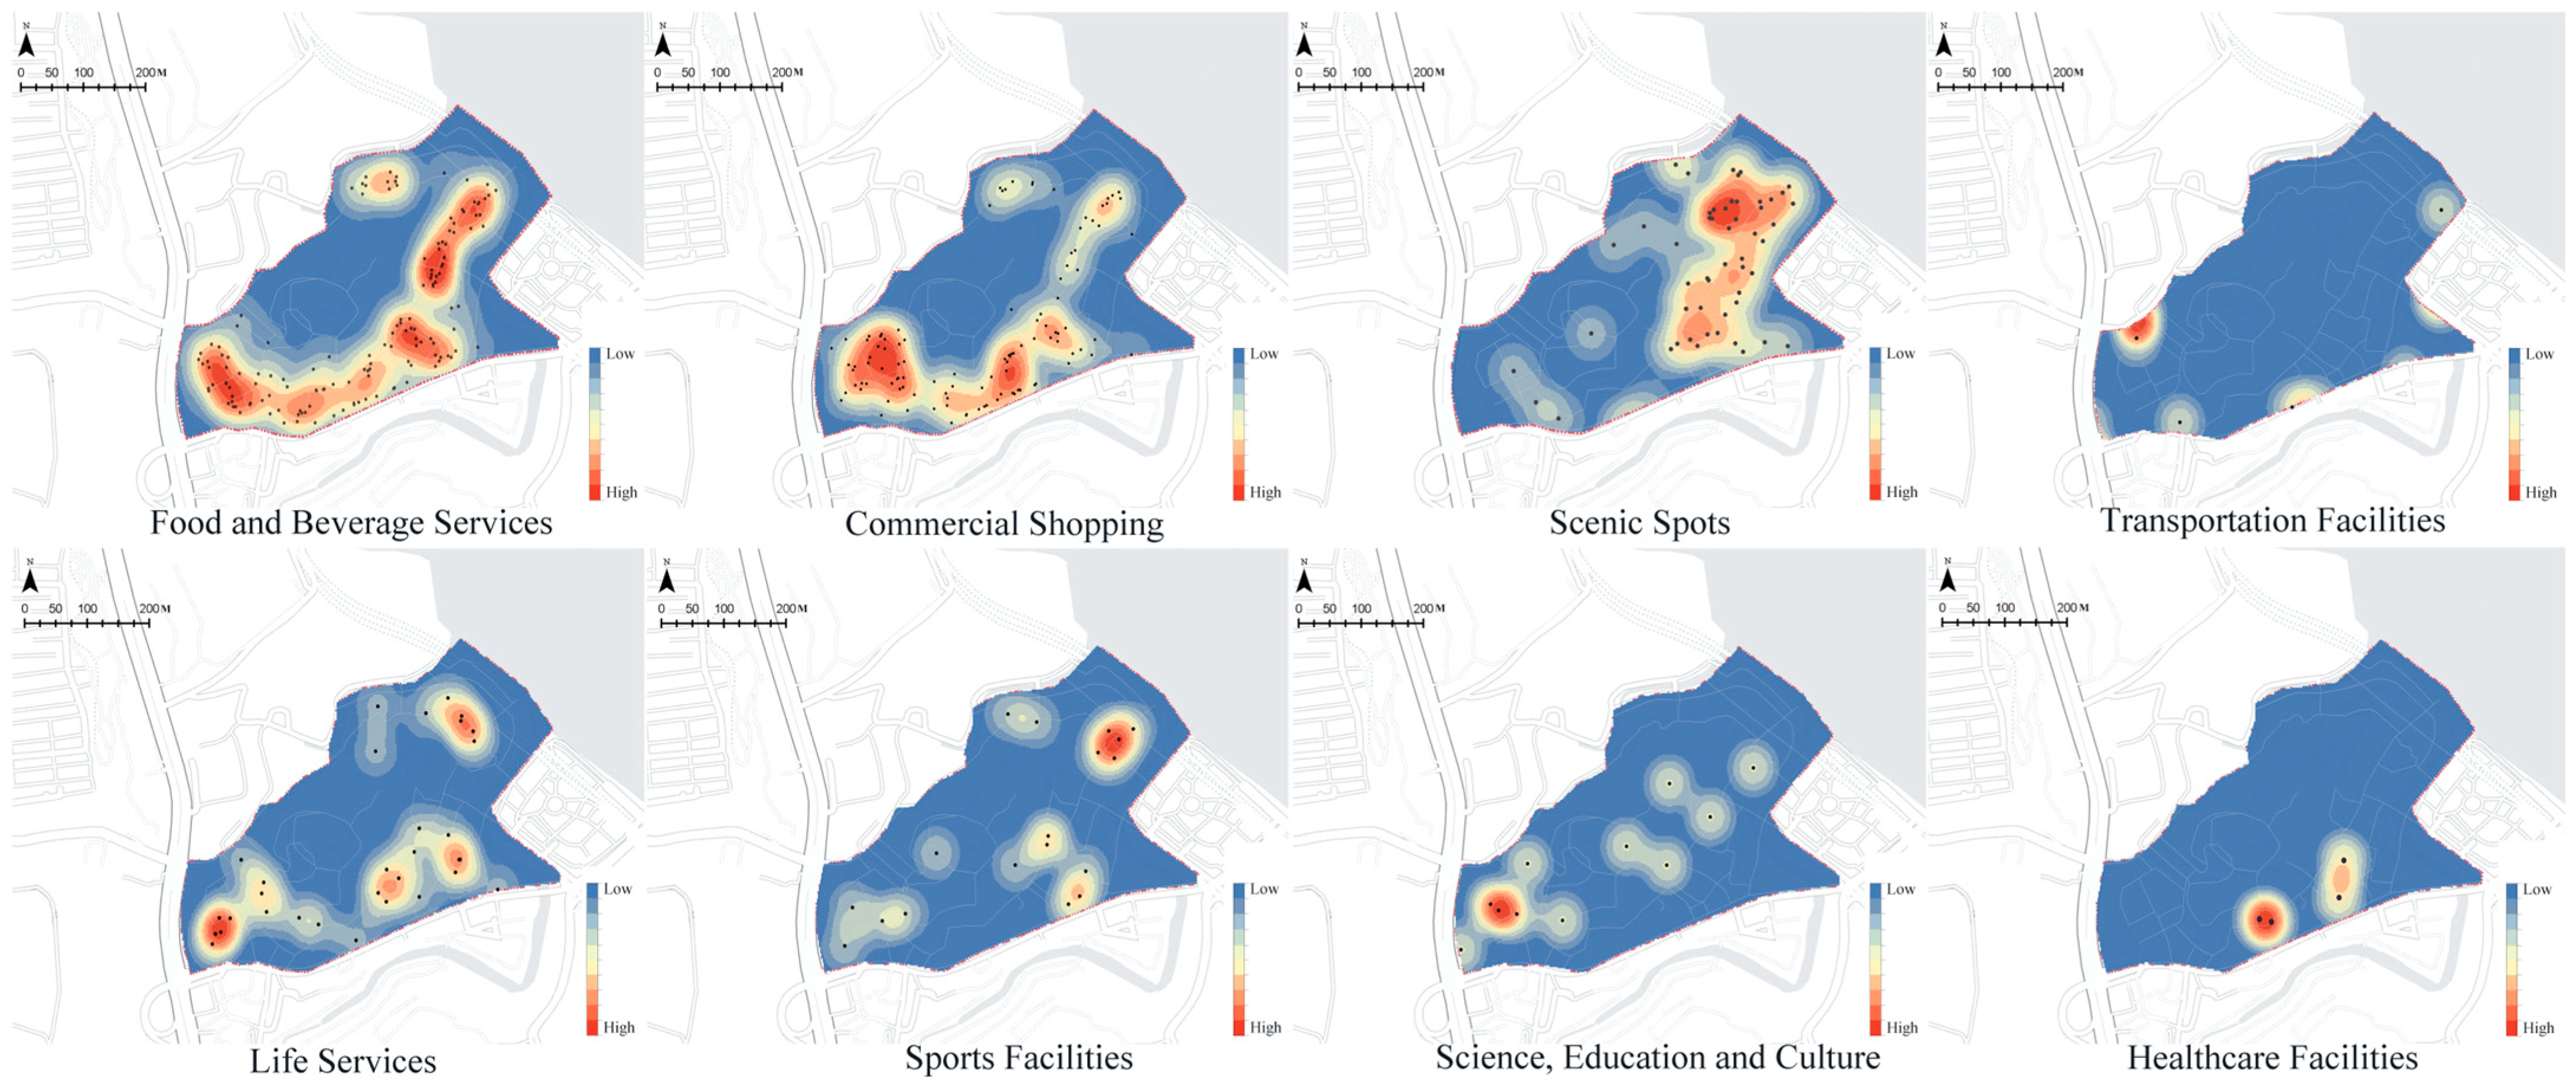
Kernel density analysis (Figure 5) confirms the pronounced spatial polarization of public facilities noted above. Across the ancient town, facilities exhibit a clear clustered pattern: Ciqikou Back Street shows a point-like concentration, while Ciqikou Main Street and Cross Street display linear, street-aligned distributions, leaving parts of the district underserved. The highest density peaks—shown in deep red—occur at the intersections of Ciqikou Main Street with Hengjiao Street and Huangjiaoping Lane 1, as well as at the commercial center of Ciqikou Back Street. These facilities are predominantly concentrated along commercial streets, consistent with the land-use map presented earlier. In contrast, public facilities within residential areas are relatively scarce and cater mainly to tourists. Furthermore, the overlap between some commercial facilities and residential zones generates conflicts between commercial and residential circulation, exacerbating holiday traffic congestion, reducing residents’ quality of life, and intensifying tensions between tourists and local residents.
Figure 5.
Kernel density of public facilities in the Ciqikou Historic District.
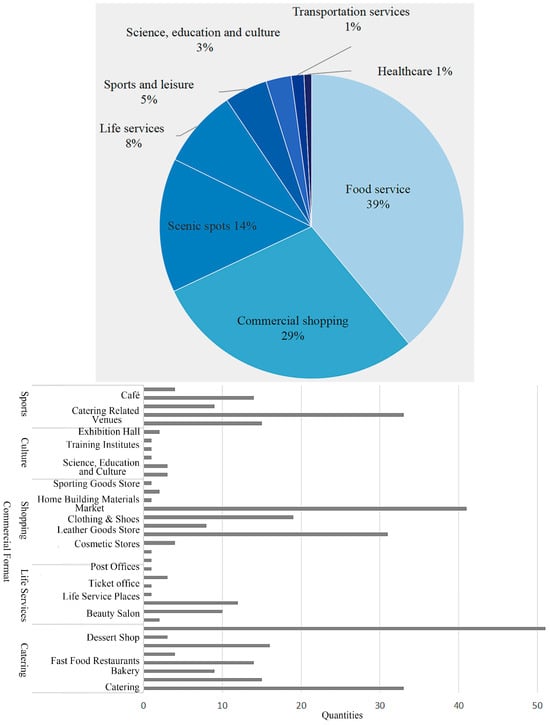
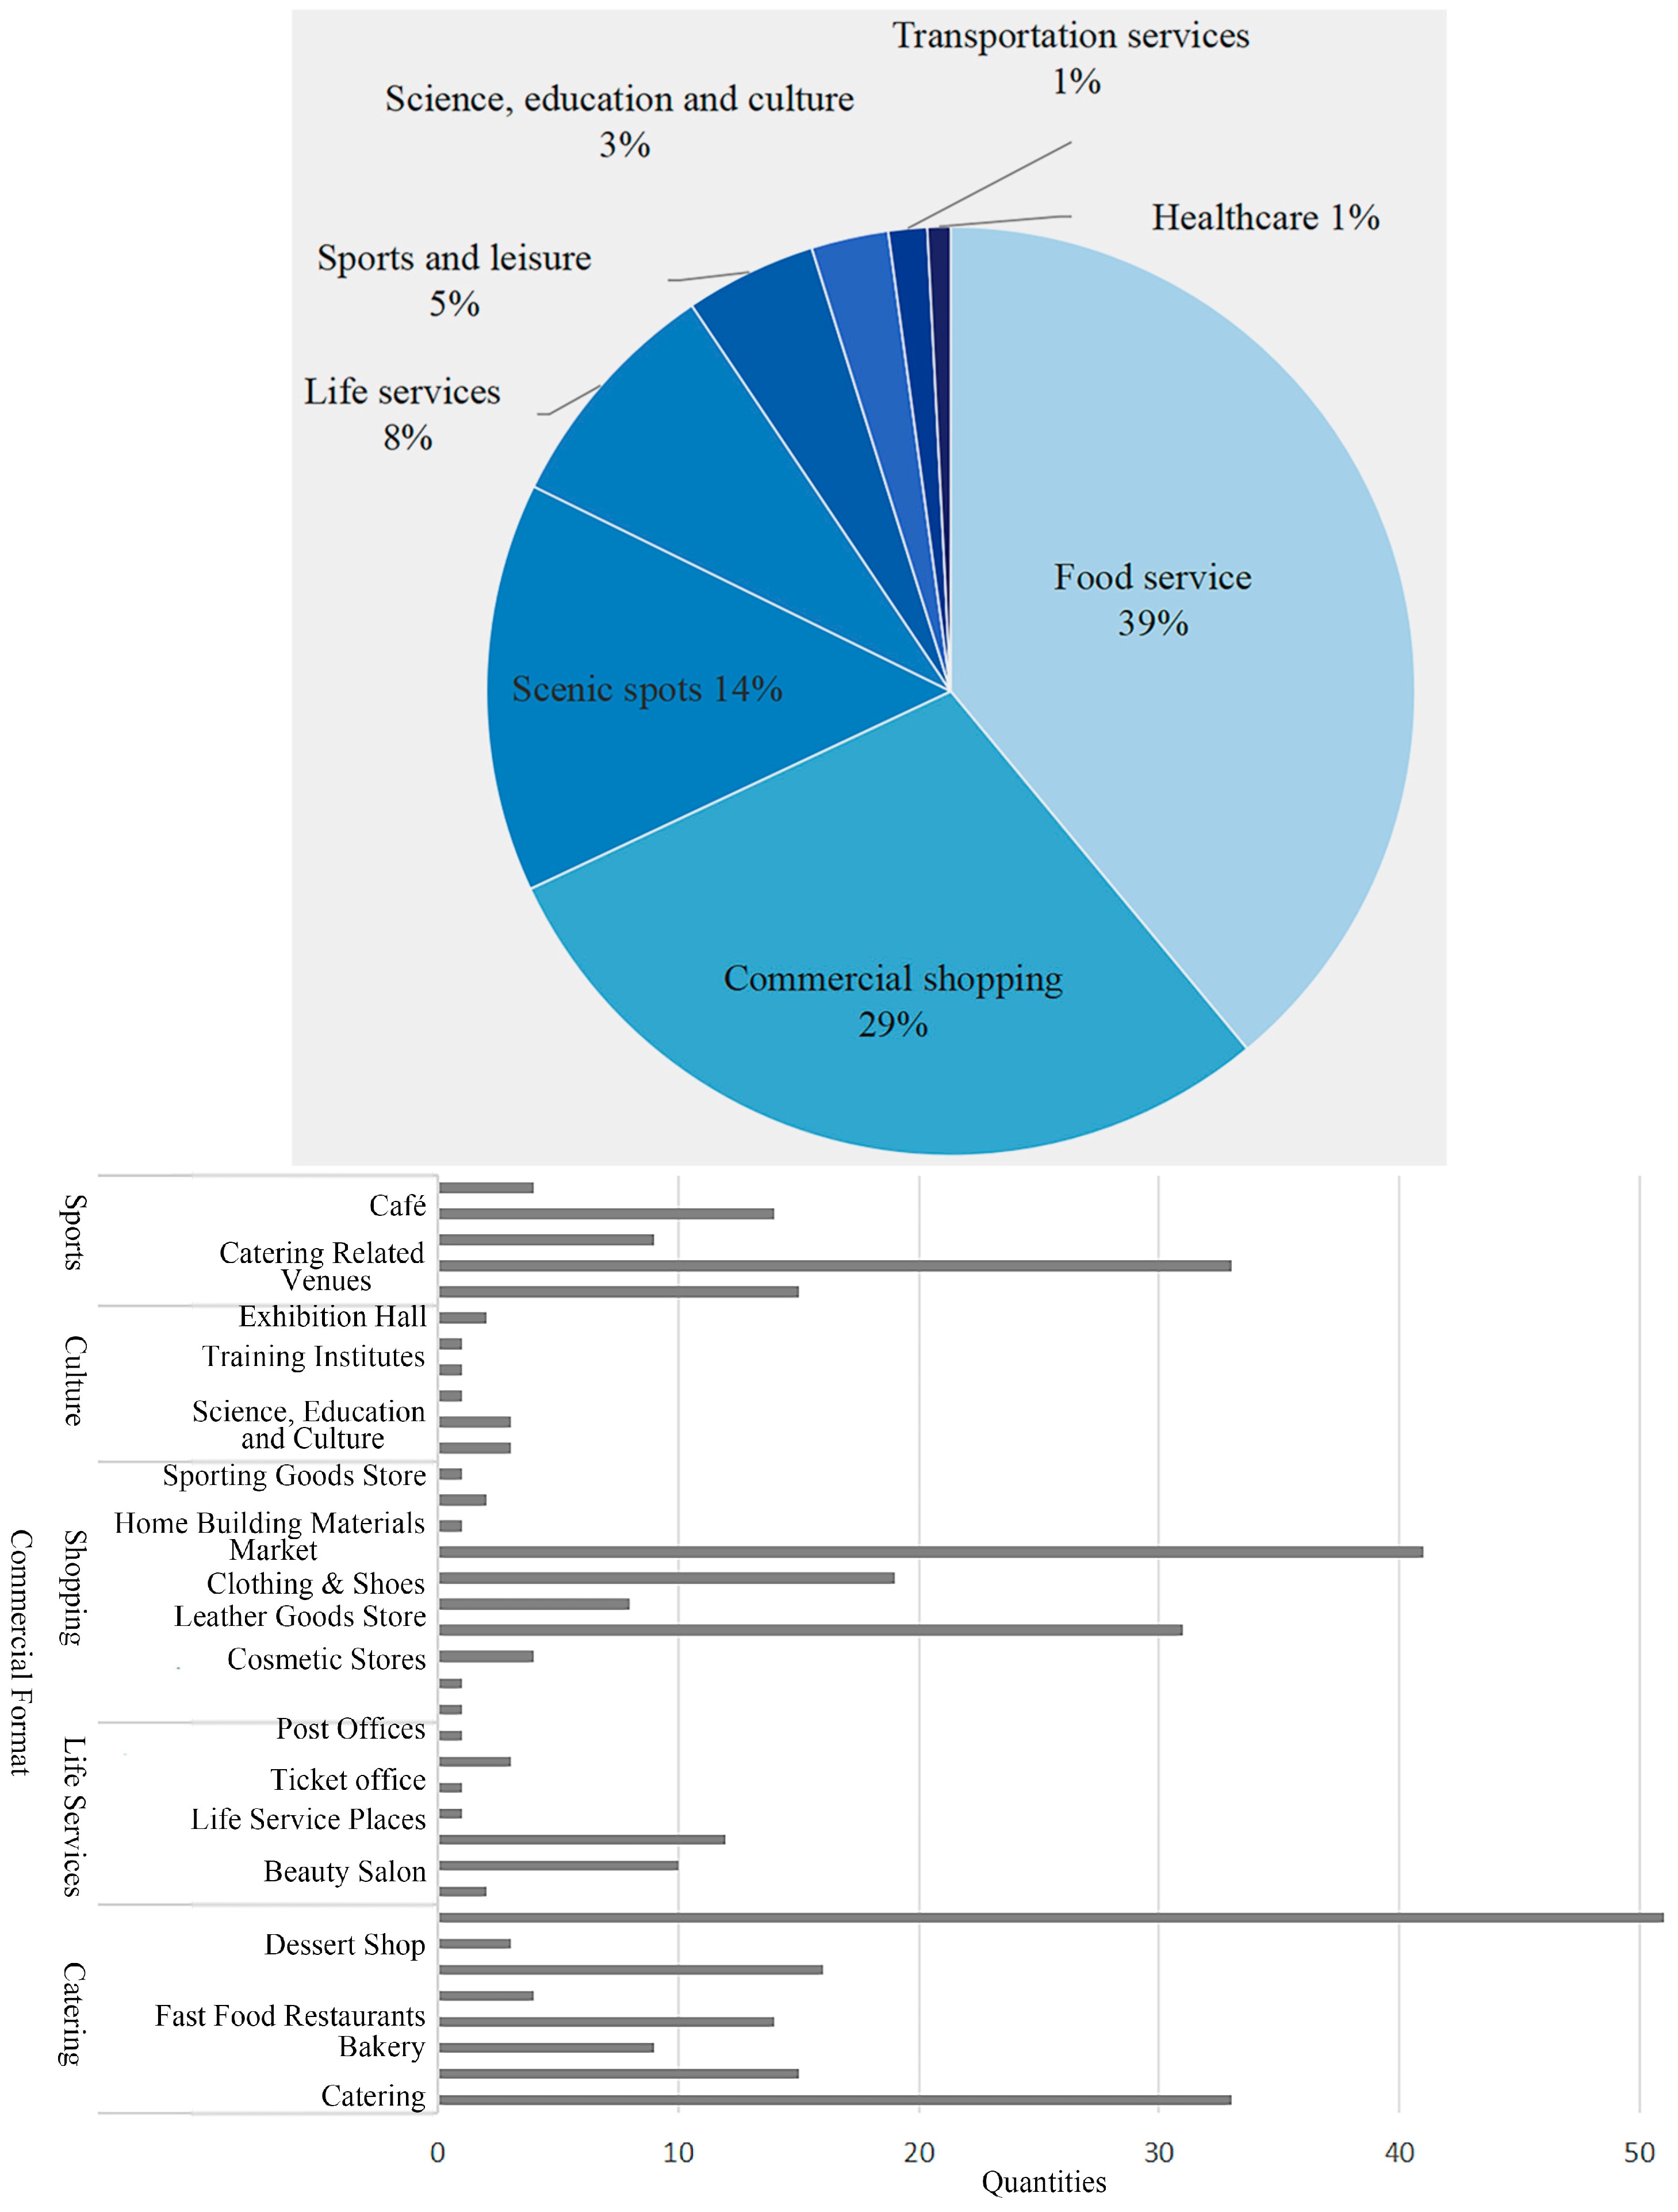
POI statistics for the eight public facility categories, kernel density analysis, a literature review, and field surveys show that facility distribution in the ancient town is highly uneven. Food and beverage services, commercial shopping, and scenic spots are the three largest categories (Figure 6). Surveys of businesses along Ciqikou Main Street and Ciqikou Cross Street indicate that most are cafés catering to foreign tourists, cultural and creative stores, restaurants, and similar establishments. Commercial activity is dominated by catering and retail, with substantial homogenization, virtually no other cultural offerings, and limited variety in cultural experiences. Among them, snacks (referring to various types of specialty foods) accounted for 20.49% of the total recorded establishments (excluding Bao Lun Temple and mobile stalls), handicrafts accounted for 27.45%, clothing and accessories accounted for 14.34%, groceries accounted for 9.83%, food and beverage (restaurants) accounted for 14.75%, and others accounted for 13.14% [45].
Figure 6.
Percentage distribution of POIs.
Building on the POI statistics, relative kernel density analysis of the eight facility categories shows that transport facilities in Ciqikou Historic District need improvement (Figure 7). Commercial shopping and food and beverage services catering to tourists are distributed mainly along Ciqikou Main Street, Ciqikou Cross Street, and Ciqikou Back Street. Density peaks occur primarily at street and alley intersections, forming a continuous, well-integrated tourist route. In contrast, facilities in the life services, sports and leisure, healthcare, and science, education, and culture categories primarily serve residents and occur as dispersed points across the ancient town. They are few in number and poorly coordinated.
Figure 7.
Kernel density distribution of public facilities by category (relative scale).
Meanwhile, existing literature shows that circa 2000, most neighborhoods in Ciqikou were dominated by residential and supporting functions, with only buildings along the main street operating as traditional shopfronts. However, driven by rapid tourism development in recent years, the majority of residents on Ciqikou’s main street and cross street have relocated out of the area, resulting in an unbalanced community population structure and pronounced population aging. At present, the residential functional types in Ciqikou can be classified into four categories: residential (self-occupied), residential (rental), commercial-residential (self-held), and commercial-residential (rental). Among them, residential (self-occupied) buildings account for 31.8% of the total building area, with approximately 2569 residents, representing 33.8% of the ancient town’s permanent population (Table 3). Together, these four residential categories constitute 93.9% of the total building area; the remaining 6.1% comprises non-residential buildings, including purely commercial premises, public service facilities, and religious or cultural-heritage structures [46]. Jinzheng Street and Jinbi Lane have also been demolished and their residents relocated, confirming the marginalization of residents driven by the spatial polarization of public facilities [46].
Table 3.
Residential types in the Ciqikou Historical District.
4. Results of the Pedestrian Accessibility Analysis
To ensure a consistent accessibility evaluation framework across facility categories, this study employs three cumulative walking-time thresholds—≤5, ≤10, and ≤15 min—each representing the cumulative reachable range within that time. Subsequent tables report, per threshold, the cumulative service area, study-area coverage ratio (C0), covered residential-land area, and residential-land coverage ratio (C1). C0 reflects facility coverage across the entire study area, whereas C1 reflects coverage of residential land (for formulas, see Section 2.2.4). Since facility categories correspond to different community life circle tiers, evaluation benchmarks are determined by Table 2; compliance is judged by whether residential land reaches full coverage (C1) at the assigned threshold, denoted “Yes” or “No,” with non-evaluation thresholds marked “—.” The subsections below analyze the accessibility of each facility group.
4.1. Pedestrian Accessibility of Educational Facilities
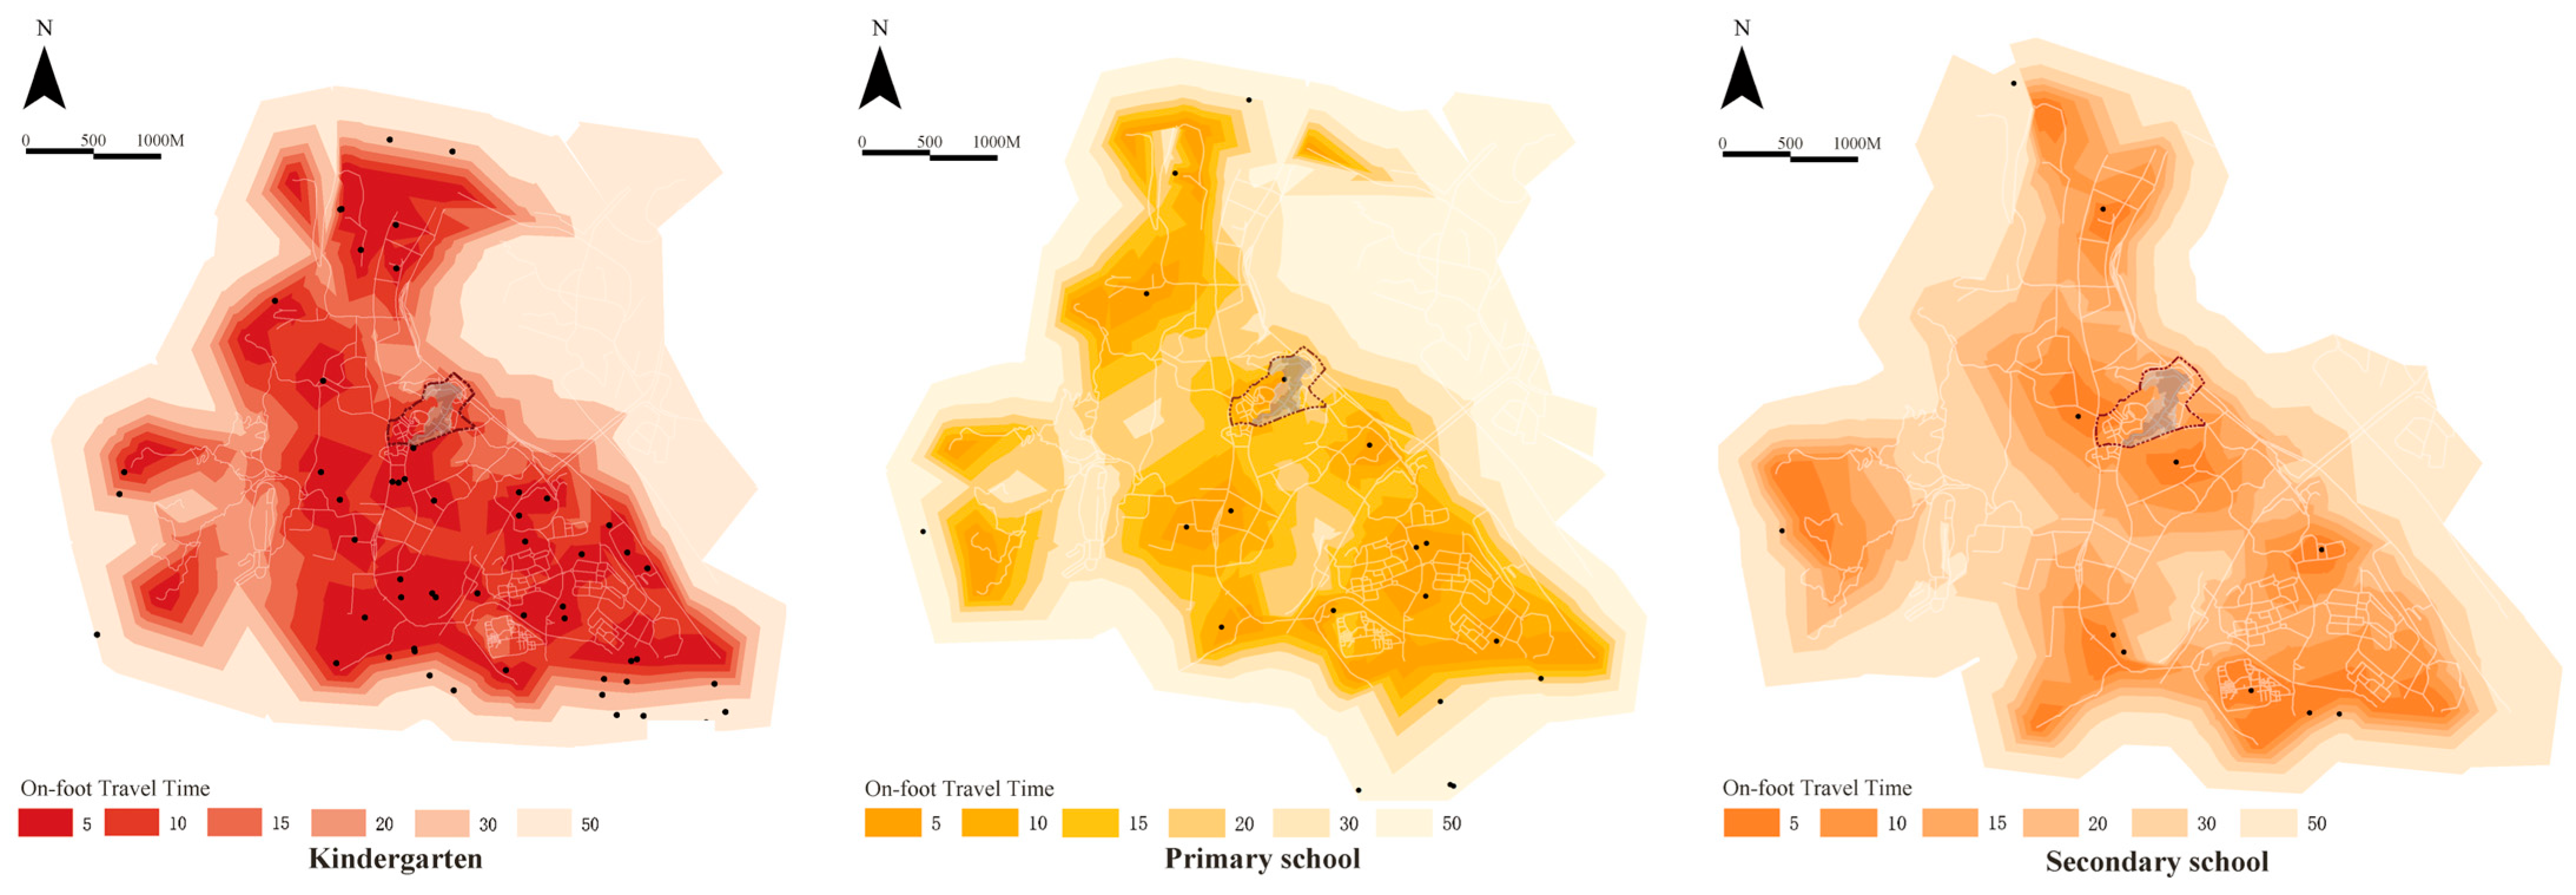
A comparative analysis of Figure 8 and Table 4 reveals accessibility patterns across three types of educational facilities under different cumulative walking-time thresholds:
Figure 8.
Accessibility of educational facilities.
Table 4.
Statistics on the accessibility of educational facilities and the accessibility of settlements.
Kindergarten (5 min community life circle): At the 5 min threshold, C0 is 28.1% and C1 is 25.4%, both indicating low coverage and failing to meet the 5 min community life circle benchmark. Spatially, the range covers only the residential districts along Happiness Street, while the residential areas surrounding Ciqikou Main Street and Ciqikou Cross Street remain in areas outside the service area. At the ≤10 min threshold, C0 and C1 rise to 80.0% and 77.2%; near-complete coverage is achieved by ≤15 min.
Primary school (10 min community life circle): At the ≤10 min threshold, C0 reaches 45.8%, whereas C1 is only 20.8%. This marked discrepancy between C0 and C1 points to a substantial spatial mismatch between primary-school service areas and the distribution of residential land, resulting in low service efficiency and failure to meet the standard of 10 min community life circle. Spatially, the 10 min service range covers only the residential area on the north side of Ciqikou Main Street, while Happiness Street, Ciqikou Cross Street, and adjacent neighborhoods remain underserved. By ≤15 min, C1 increases to 84.1%, yet a portion of residential land remains uncovered and overall accessibility remains inadequate.
Secondary school (15 min community life circle): At the ≤5 min and ≤10 min thresholds, C1 stands at 0% and 18.2%, respectively, indicating very limited short-distance walking coverage. When the cumulative walking time extends to ≤15 min, C1 reaches 100.0%, thereby satisfying the evaluation benchmark.
4.2. Pedestrian Accessibility of Public Administration and Community Service Facilities
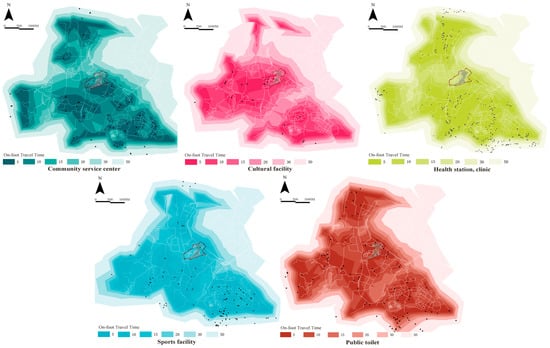
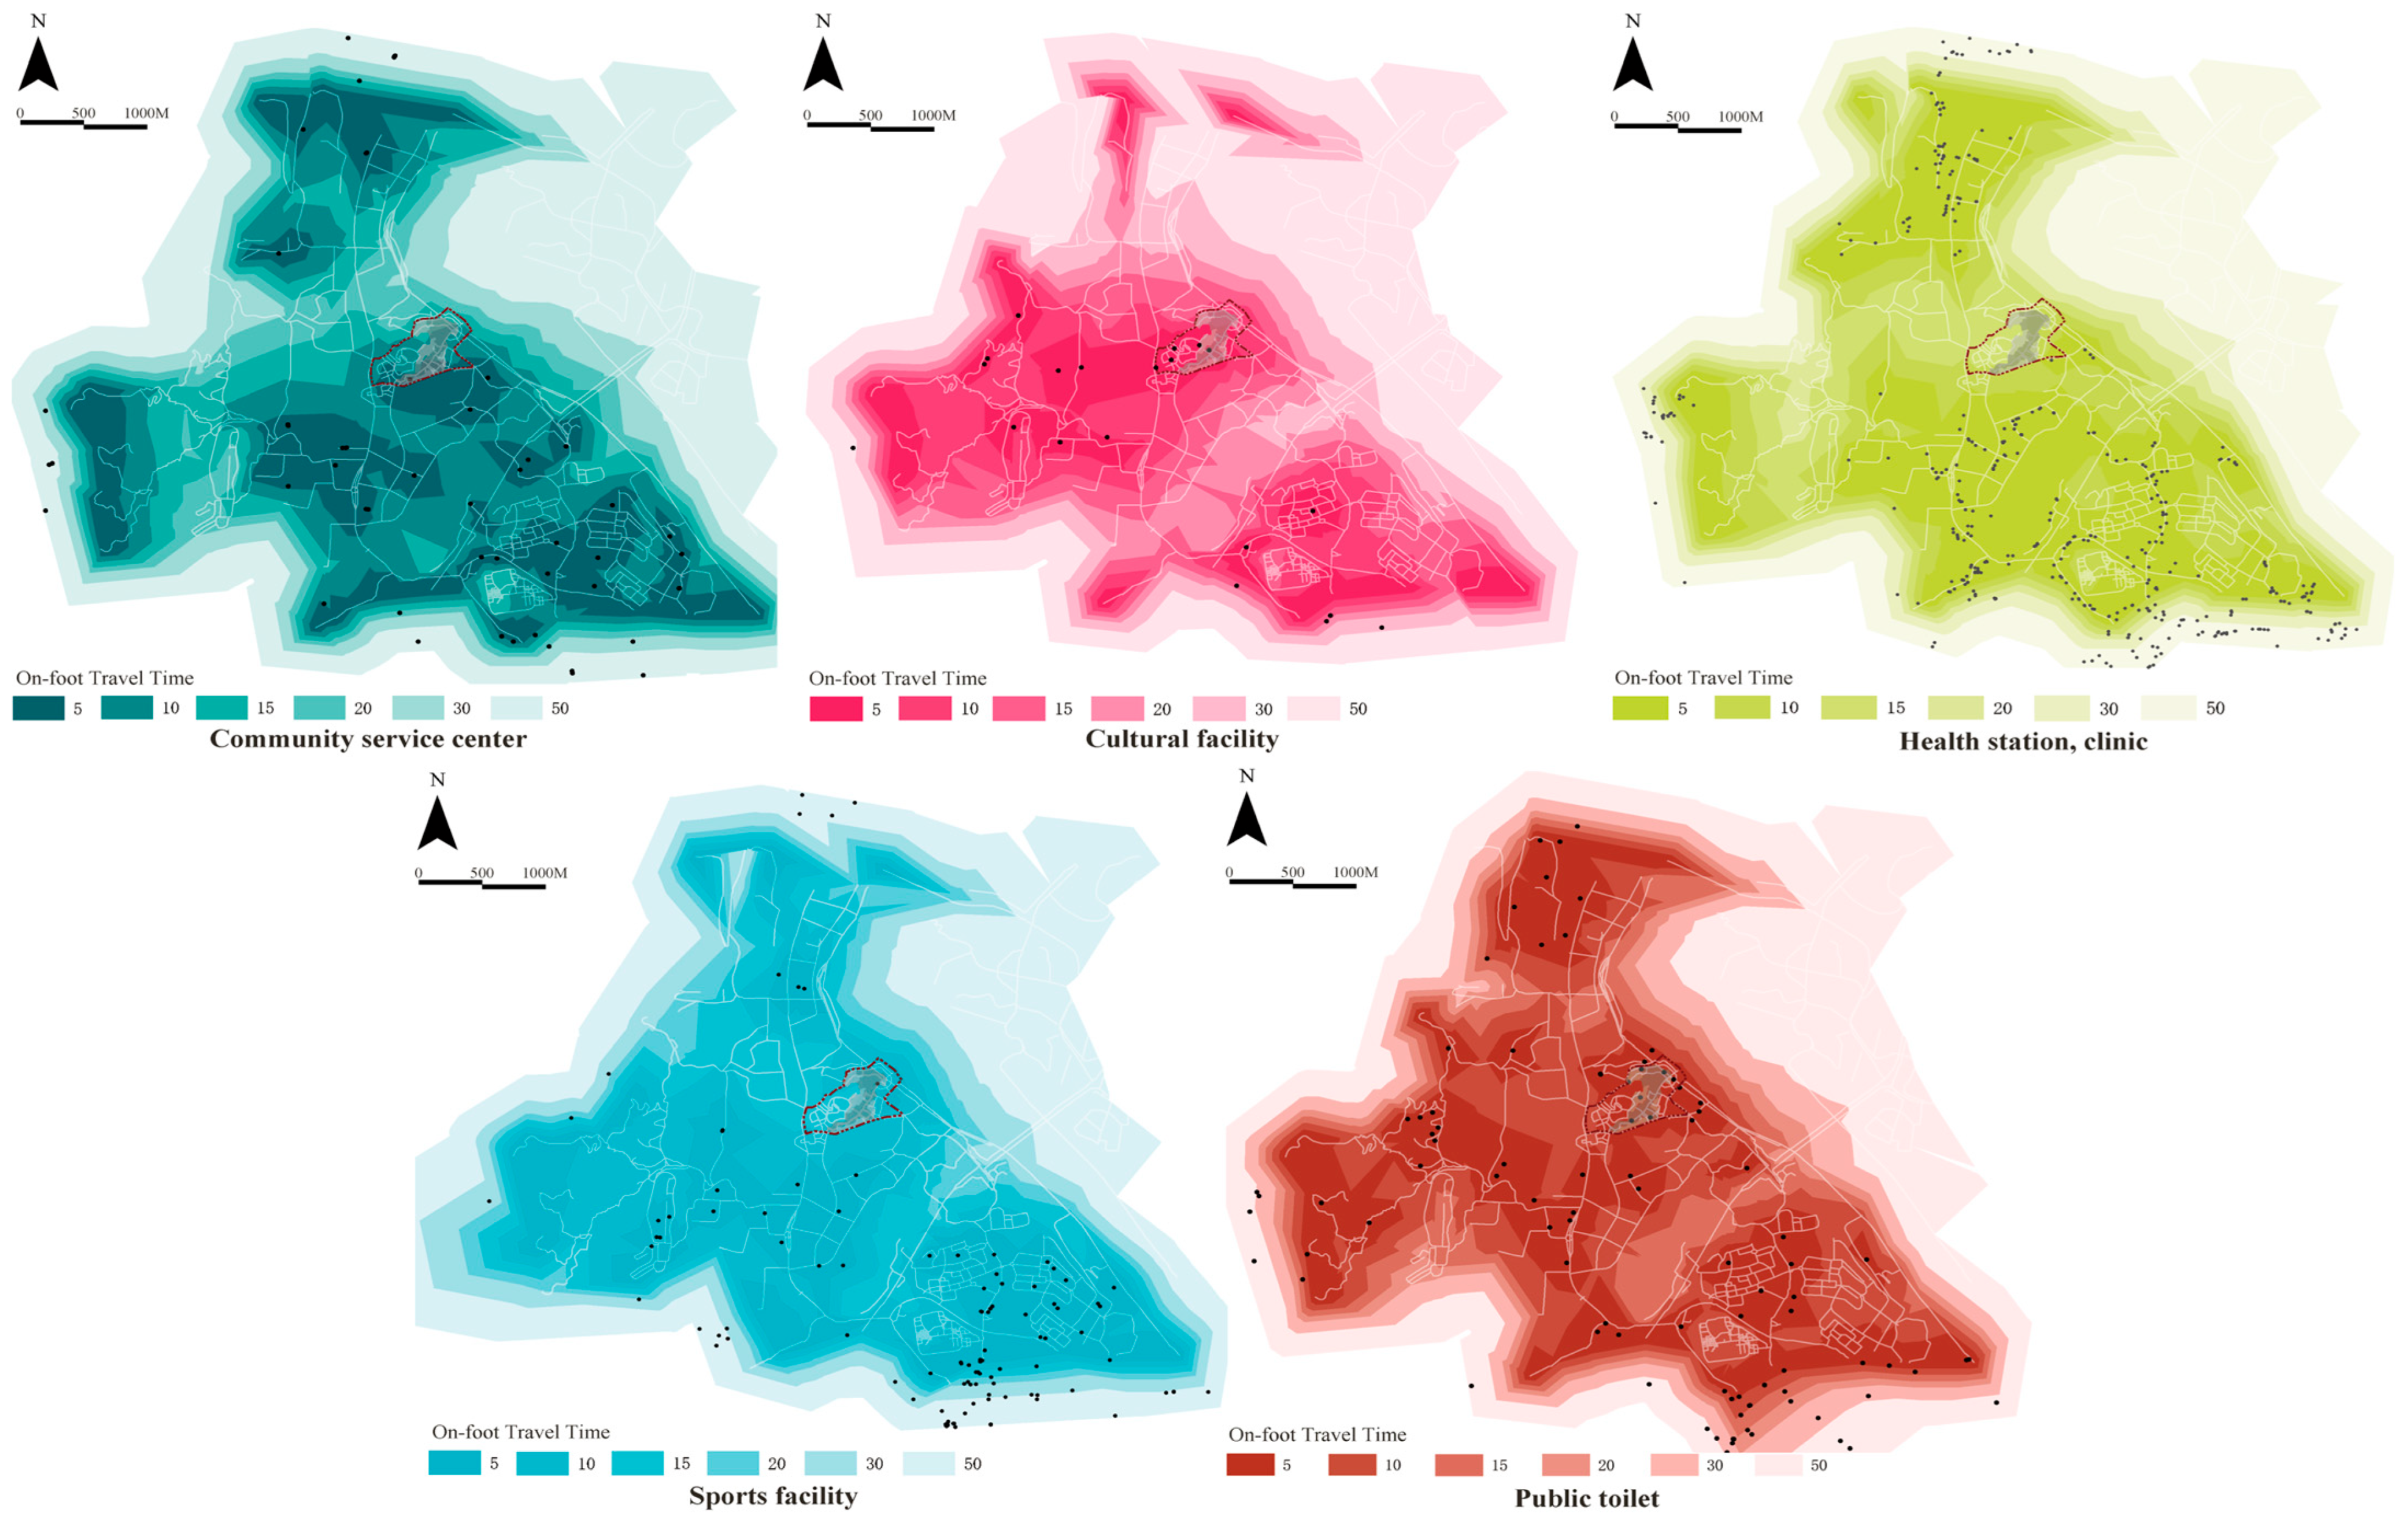
A comparative analysis of Figure 9 and Table 5 reveals the walking-accessibility characteristics of the five categories of public administration and public service facilities:
Figure 9.
Accessibility of other public administration and public service facilities.
Table 5.
Statistics on the ratio of serviceable area for public administration and community service facilities.
Community service center (5 min community life circle): At the 5 min threshold, C0 is 26.6% and C1 is 33.8%, indicating low overall coverage and non-compliance with the 5 min community life circle benchmark. Spatially, the 5 min service range covers only the front section of Happiness Street and the area along Ciqikou Main Street, while the rear section of Ciqikou Main Street and the residential areas surrounding Ciqikou Cross Street remain in service blind zones, requiring 10–15 min to reach. At the ≤10 min threshold, C0 and C1 rise to 81.8% and 80.6%, respectively, and near-complete coverage is achieved by ≤15 min.
Cultural facility (5 min community life circle): At the 5 min threshold, C0 is 72.2% and C1 is 69.6%, representing relatively high coverage yet still falling short of the 5 min community life circle benchmark. Spatially, the 5 min service area covers the residential districts around Happiness Street and Ciqikou Main Street, whereas those surrounding Ciqikou Cross Street remain uncovered. By ≤10 min, C1 increases to 98.0%, and it reaches 100.0% at ≤15 min, indicating good spatial coverage of cultural facilities.
Health station, clinic (5 min community life circle): At the 5 min threshold, C0 is 3.9% and C1 is 0.3%, reflecting extremely low coverage that falls far short of the 5 min community life circle benchmark. Spatially, the old-town residential area is almost entirely within a medical-service blind zone. At the ≤10 min threshold, C0 and C1 improve to 52.4% and 77.0%, with full coverage achieved by ≤15 min.
Sports facility (5 min community life circle): At the 5 min threshold, C0 is 41.1% and C1 is 63.3%, indicating low coverage and non-compliance with the benchmark for the 5 min community life circle. However, C1 is markedly higher than C0, suggesting a good spatial match between sports facilities and residential land. Spatially, the residential areas on the north and west sides of Ciqikou Main Street lie within sports-facility service blind zones. By ≤10 min, C0 and C1 rise to 68.4% and 96.3%, respectively, with full coverage attained at ≤15 min.
Public toilet (5 min community life circle): At the 5 min threshold, C0 reaches 91.7% and C1 reaches 100.0%, satisfying the benchmark. Public toilets are therefore the only facility category in this group that meets the applicable benchmark.
4.3. Pedestrian Accessibility of Transportation Facilities
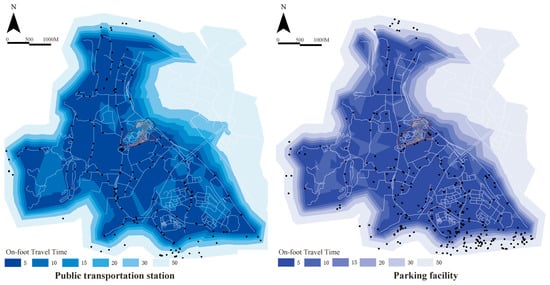
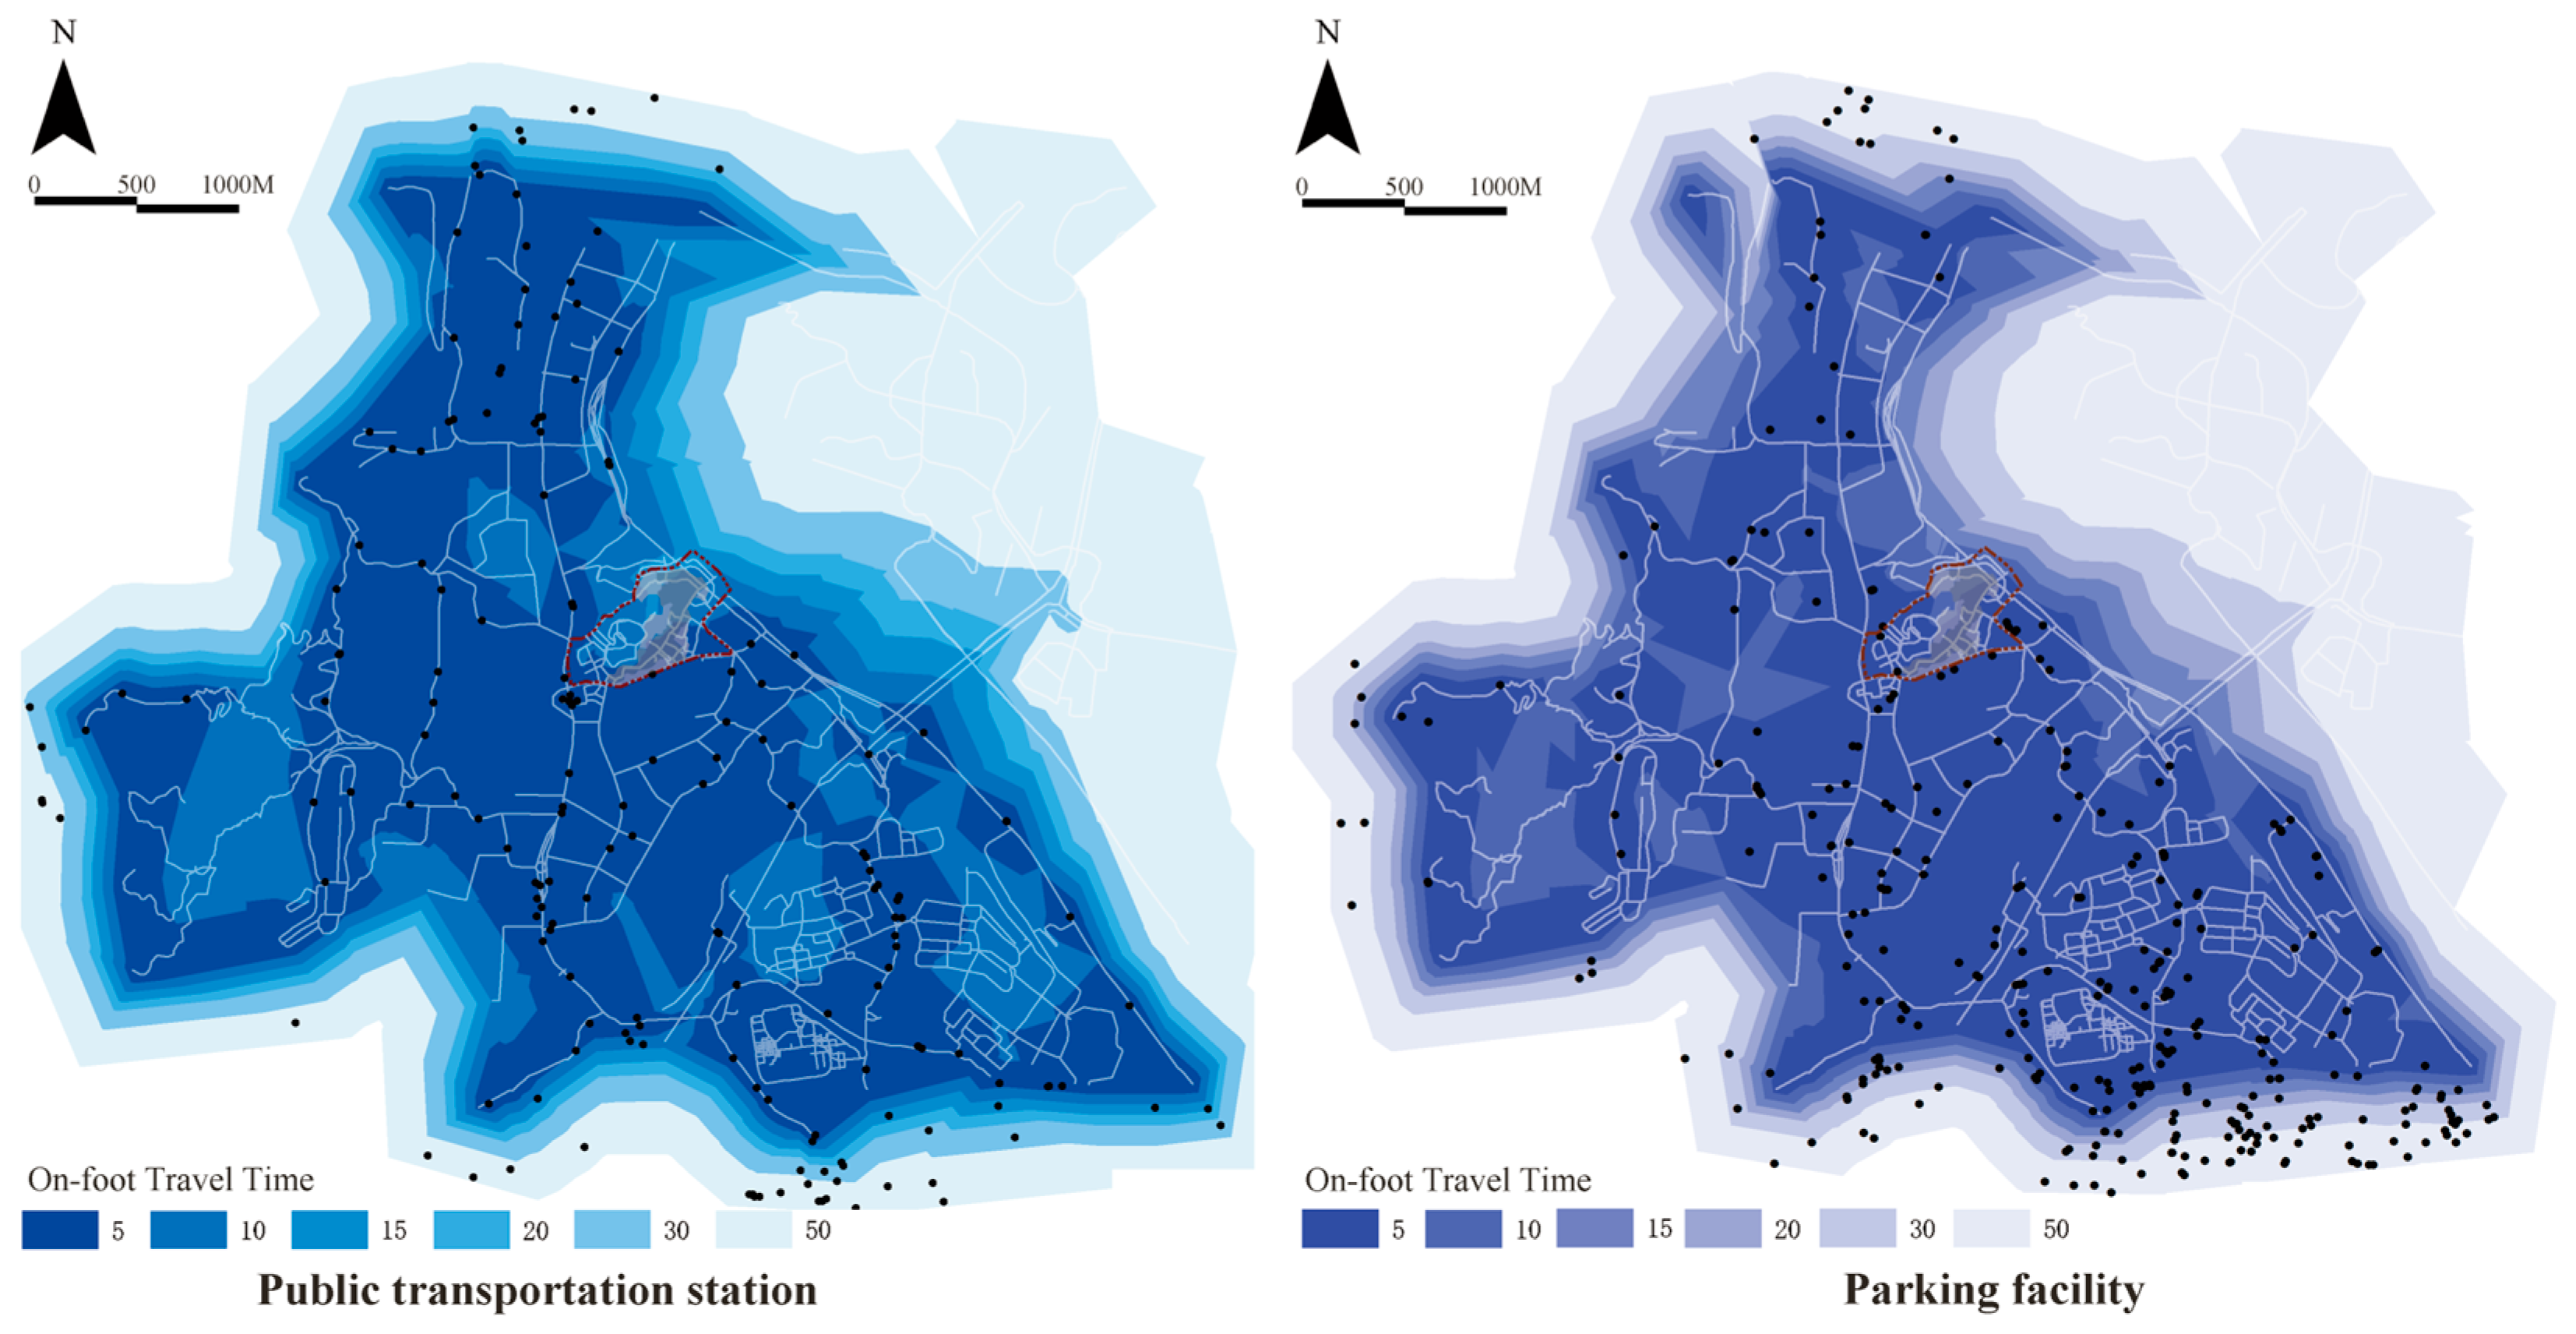
As visualized in Figure 10 and quantified in Table 6, the two categories of transportation facilities exhibit the following walking-accessibility patterns:
Figure 10.
Accessibility to transportation facilities.
Table 6.
Statistics on the ratio of serviceable area for transportation.
Public transportation station (10 min community life circle): At the ≤10 min threshold, C0 is 89.0% and C1 is 90.9%, indicating relatively high overall coverage yet non-compliance with the 10 min community life circle standard. Spatially, the ≤5 min service range already covers Happiness Street and the front section of Ciqikou Main Street, affording good accessibility; by contrast, the rear section of Ciqikou Main Street and the area along Ciqikou Cross Street require up to 15 min to reach, making public transport less convenient for residents.
Parking facility (5 min community life circle): At the 5 min threshold, C0 is 75.8% and C1 is 73.5%, indicating relatively high overall coverage but non-compliance with the 5 min community life circle benchmark. Spatially, Ciqikou Cross Street and portions of the residential area near Jinbiqiao Street lie within parking-facility service blind zones. By ≤10 min, C0 reaches 99.7% and C1 attains 100.0%, essentially achieving full coverage.
4.4. Pedestrian Accessibility of Commercial Service Facilities
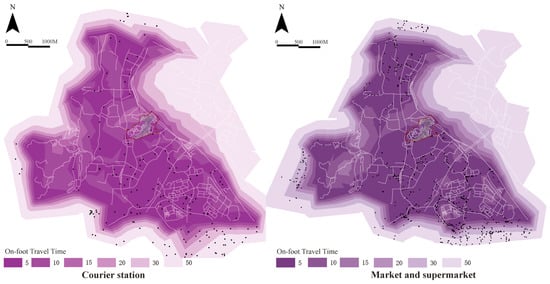
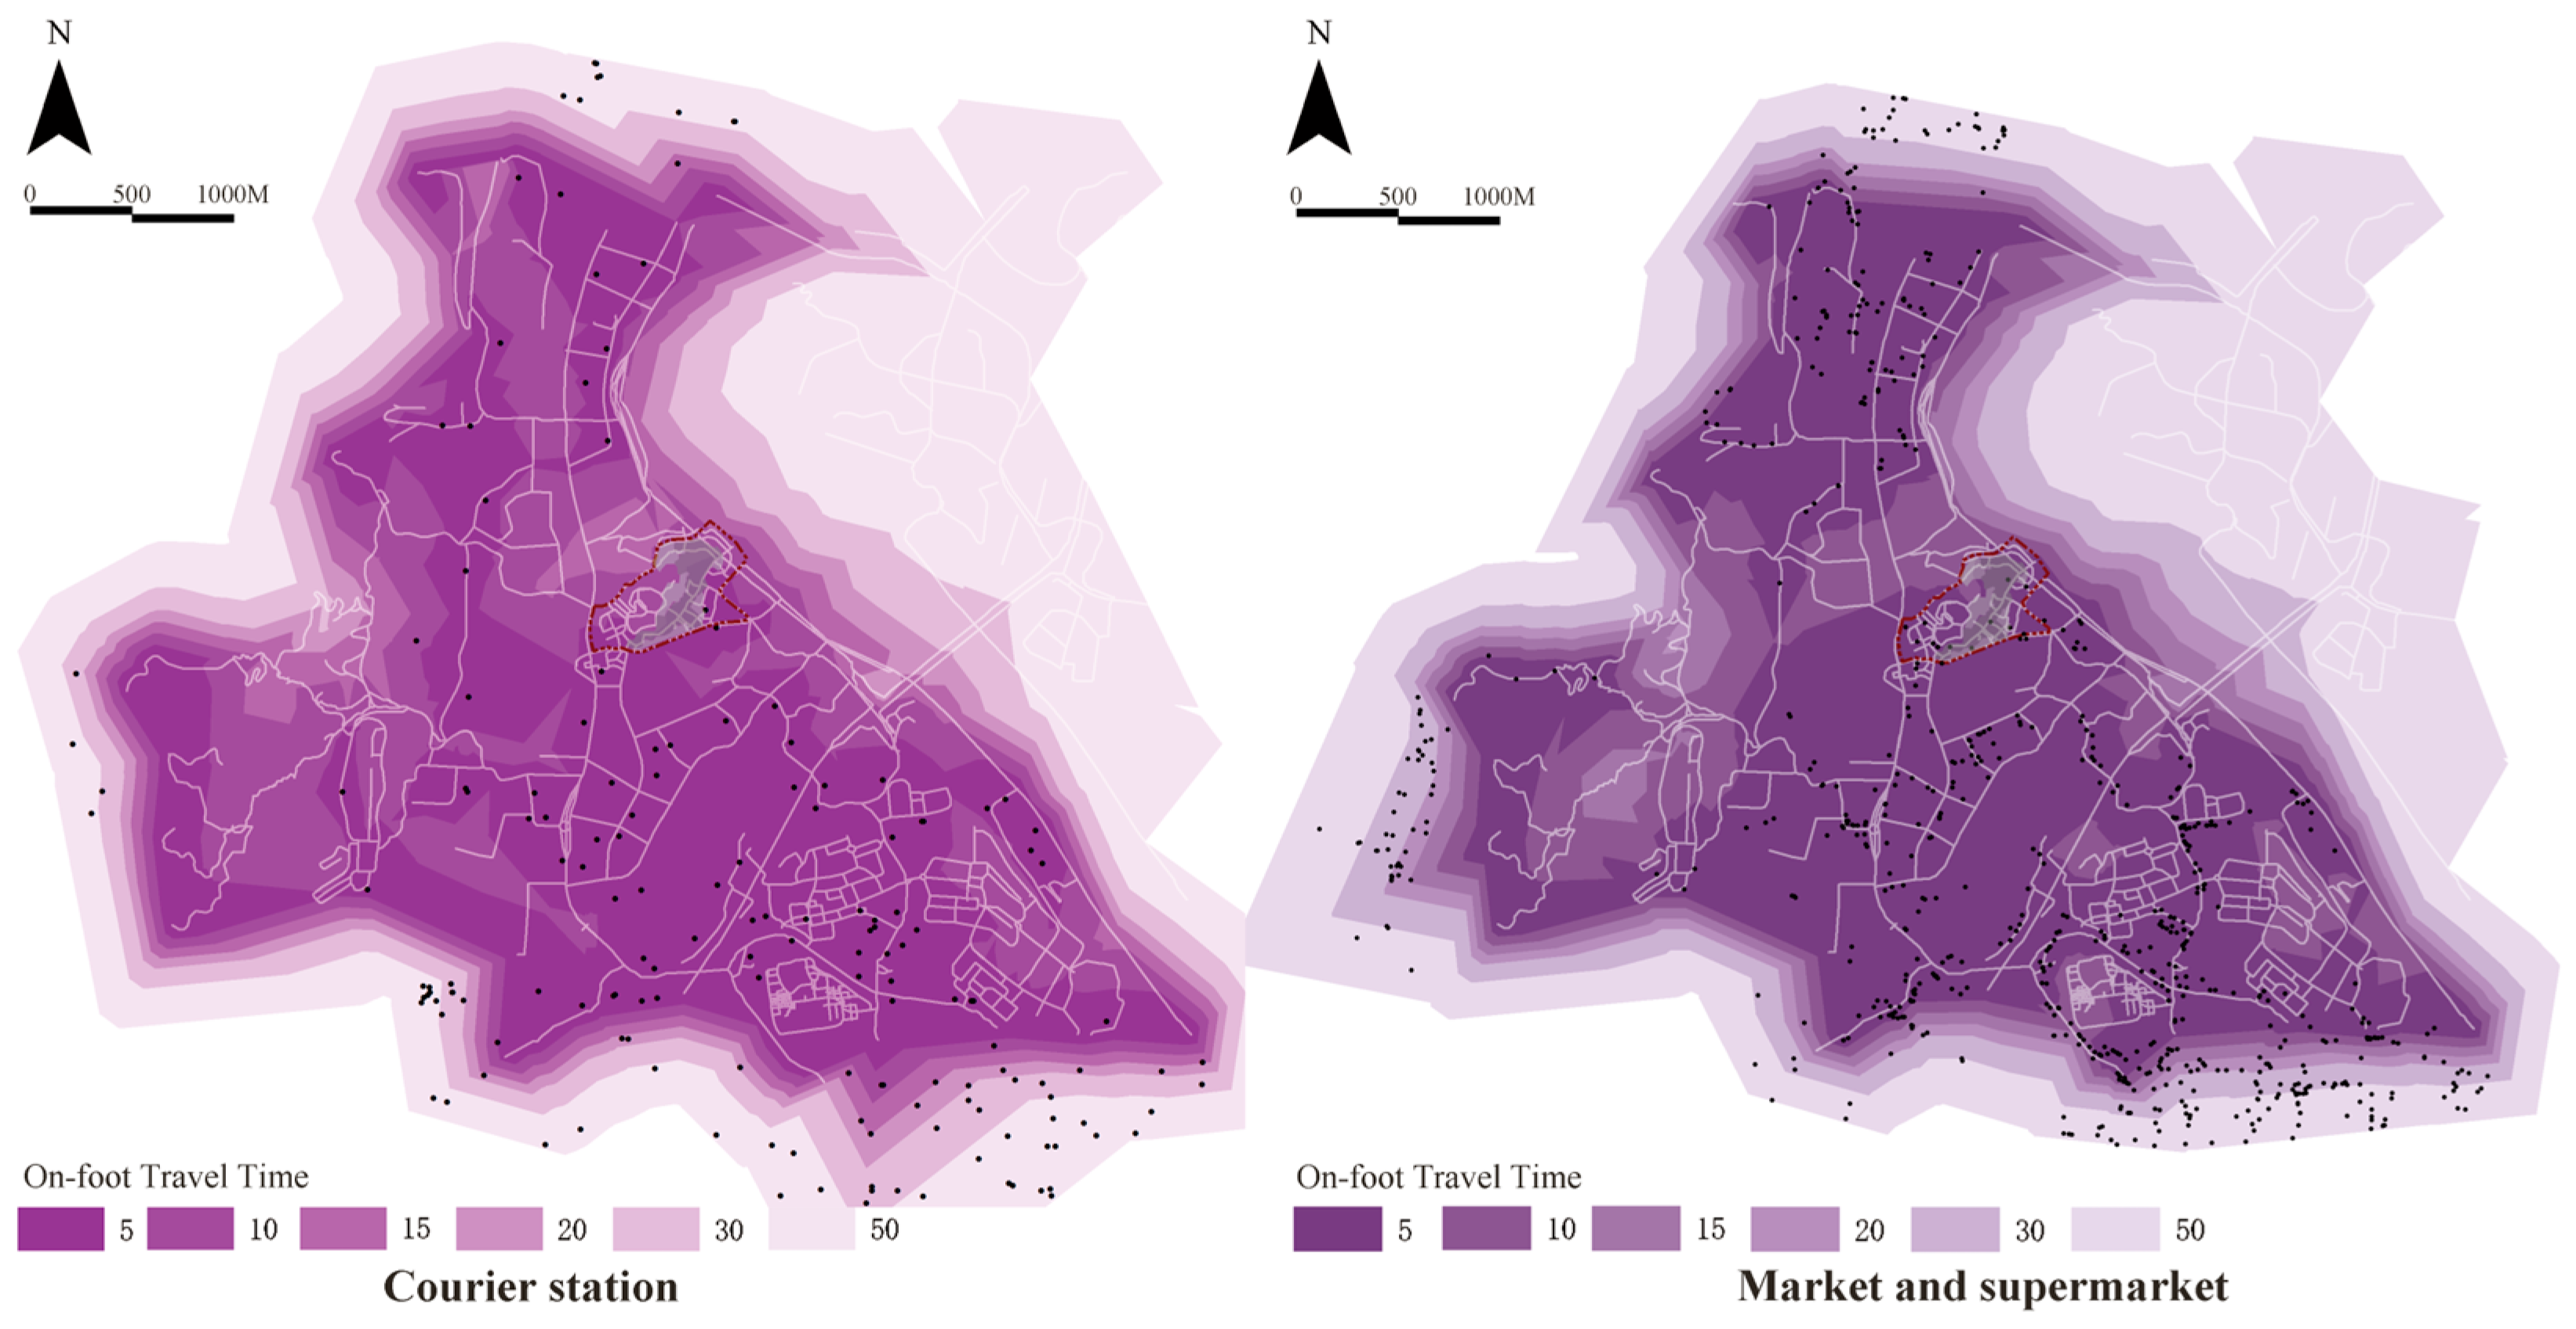
As illustrated in Figure 11 and Table 7, the two categories of commercial service facilities generally exhibit high walking-coverage levels, yet neither achieves complete coverage of residential areas under the ≤5 min benchmark adopted in this study. Specifically, market and supermarket facilities clearly outperform courier stations in short-distance accessibility:
Figure 11.
Accessibility to commercial services.
Table 7.
Statistics on the ratio of serviceable area for commercial services and the ratio of serviceable area for settlements.
Courier station (5 min community life circle): At the 5 min threshold, C0 is 46.5% and C1 is 65.6%. C1 is notably higher than C0, indicating that the spatial distribution of courier stations aligns reasonably well with that of residential areas. Spatially, the 5 min service range is concentrated primarily on the south side of Ciqikou Ancient Town, covering Happiness Street and the corridor along Ciqikou Main Street; the residential districts on the north side of Ciqikou Main Street and those surrounding Ciqikou Cross Street remain outside the service area. At the ≤10 min threshold, C0 and C1 rise to 99.3% and 100.0%, with full coverage attained by ≤15 min.
Market and supermarket (5 min community life circle): At the 5 min threshold, C0 reaches 91.9% and C1 attains 96.3%, reflecting comparatively high coverage that nevertheless falls short of the 5 min community life circle benchmark. Spatially, the service area already covers the majority of residential districts in the ancient town, providing a convenient shopping environment for both residents and tourists. By ≤10 min, both C0 and C1 reach 100.0%, achieving full coverage.
4.5. Pedestrian Accessibility of Parks and Green Spaces
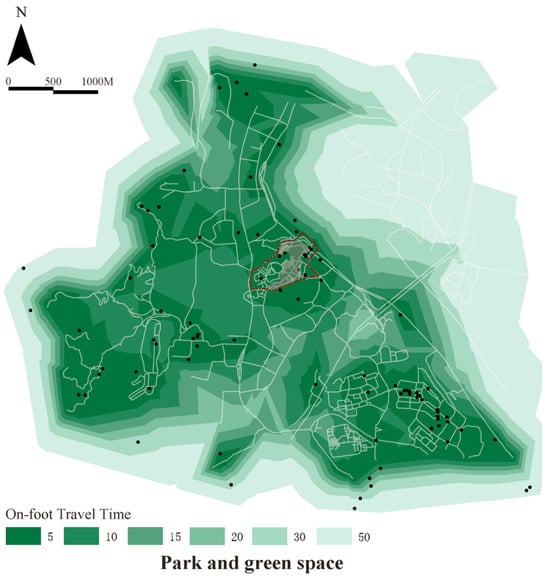
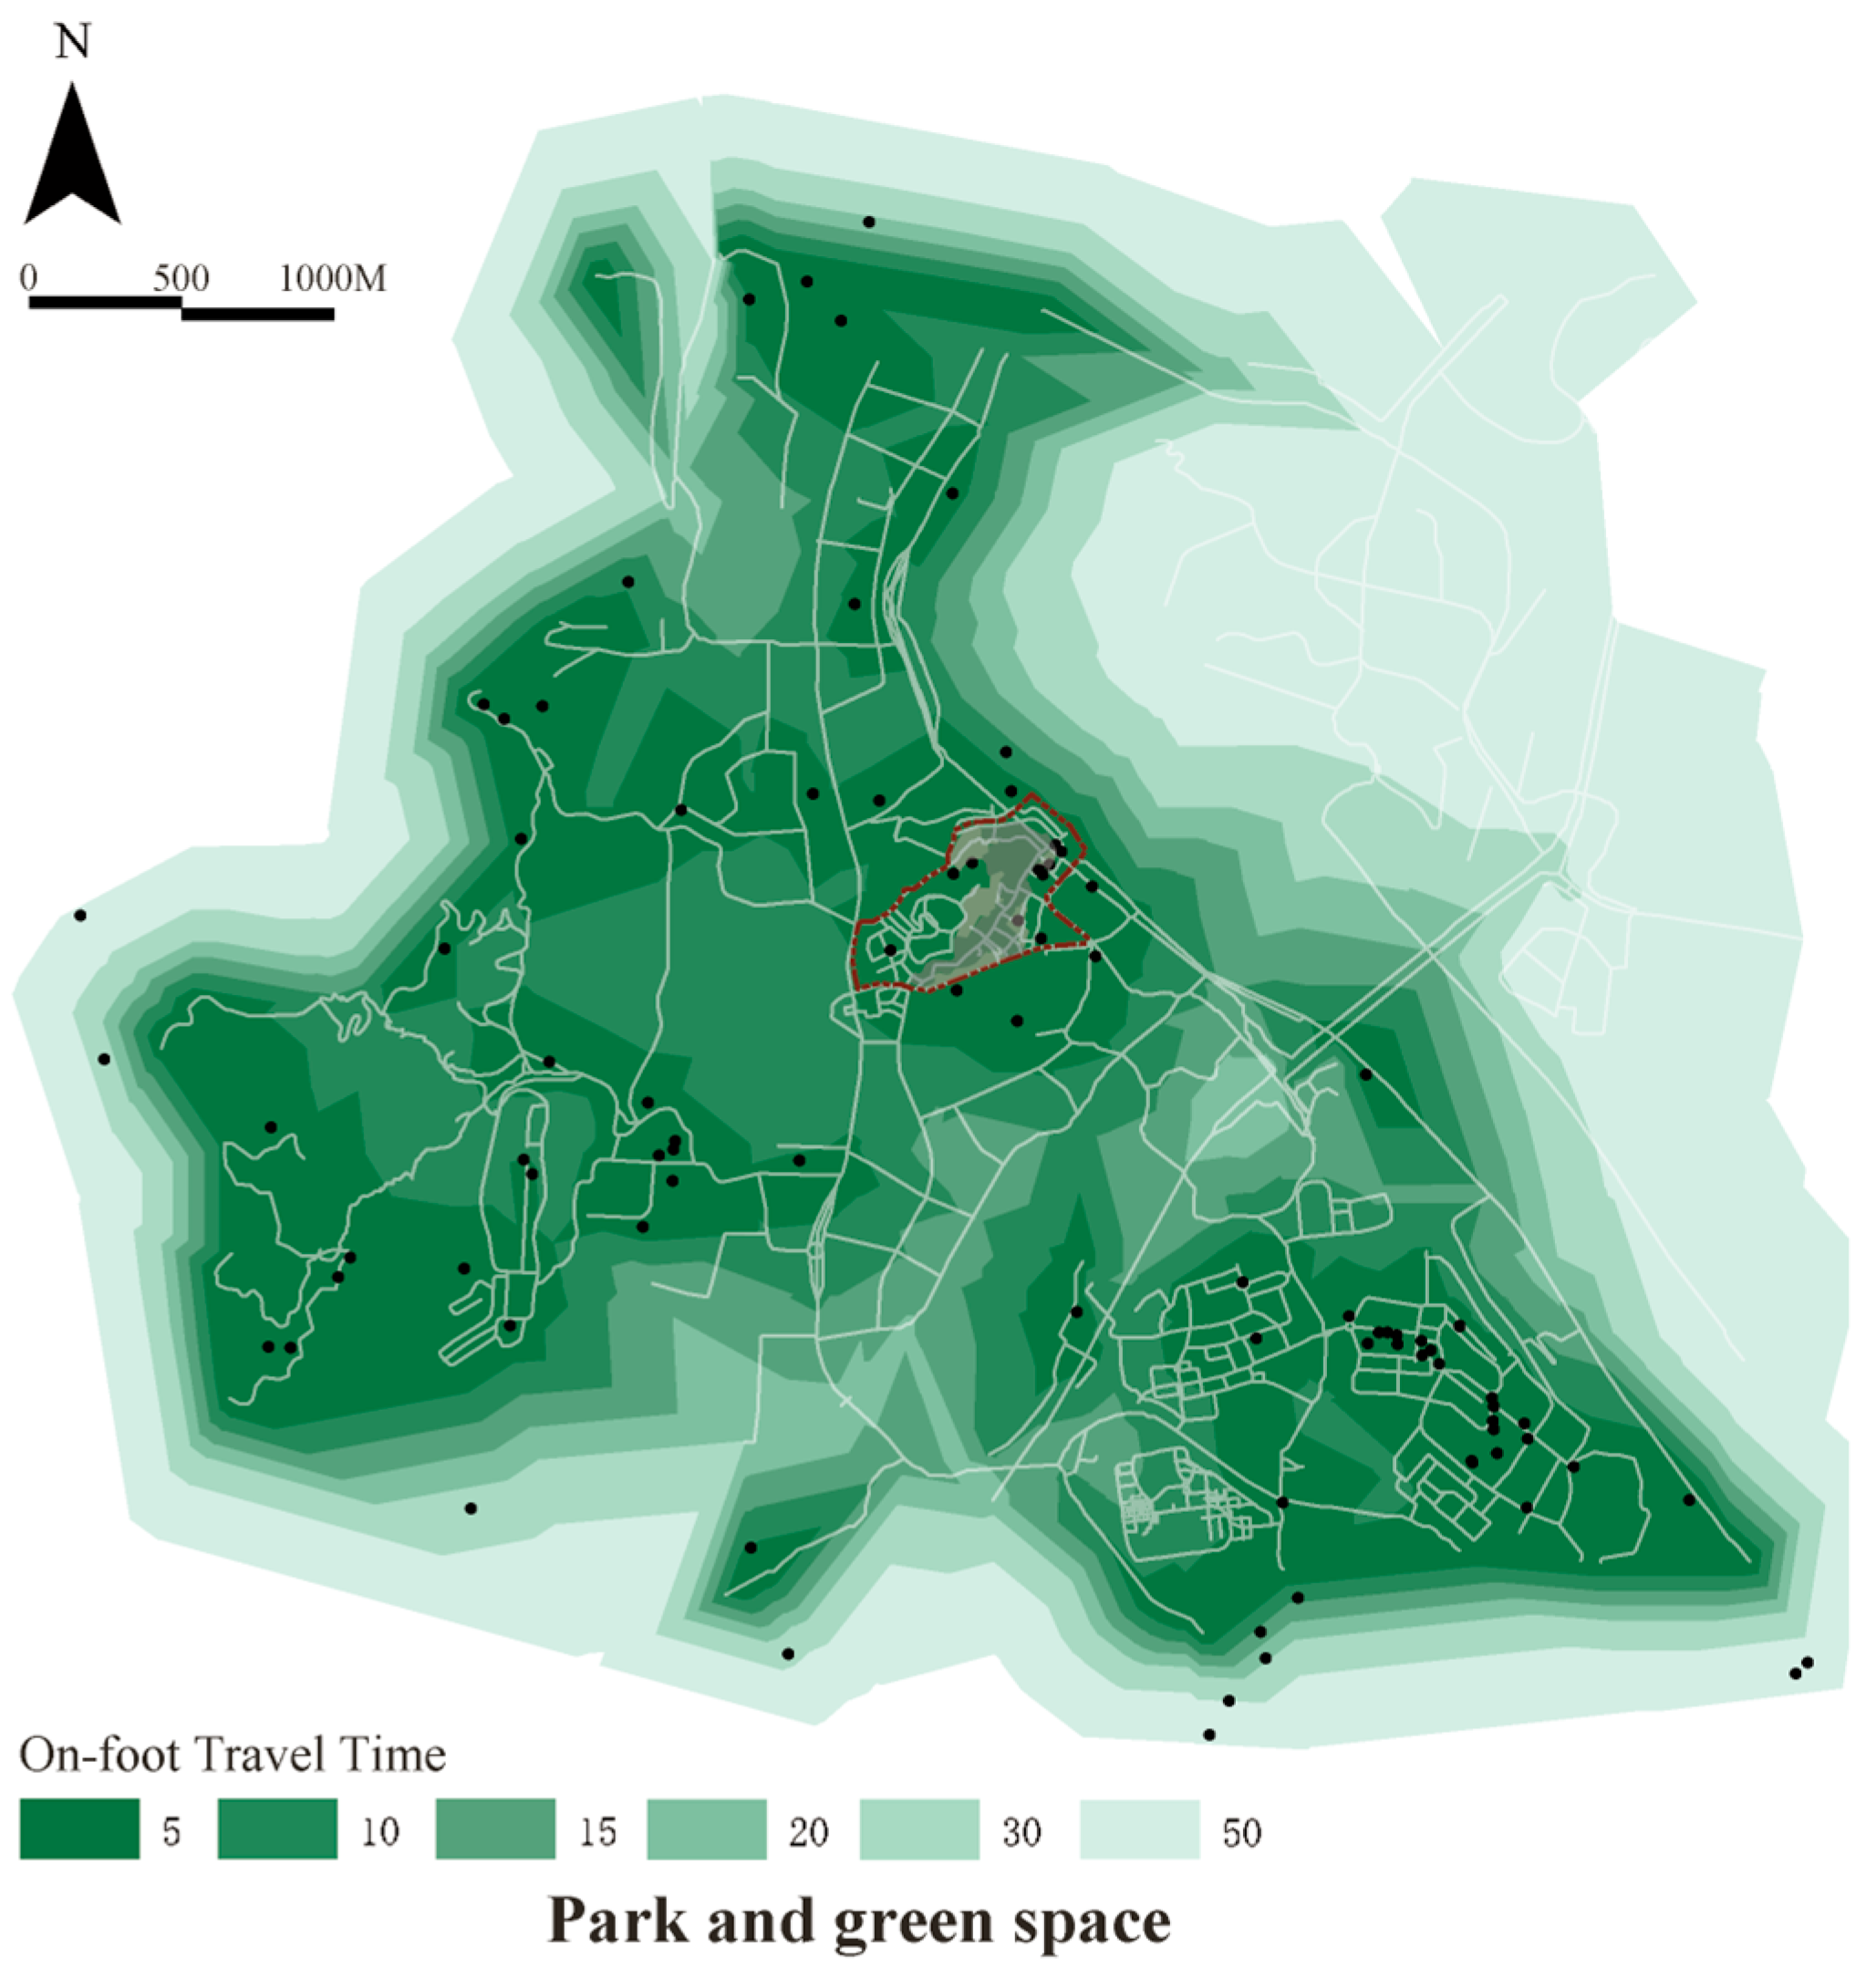
As shown in Figure 12 and Table 8, parks and green spaces demonstrate comparatively strong pedestrian accessibility among the facilities examined in this study:
Figure 12.
Accessibility of green spaces and plazas.
Table 8.
Statistics on the ratio of accessible area of parks to the ratio of accessible area of settlements.
Park and green space (5 min community life circle): At the 5 min threshold, the study-area coverage (C0) reaches 99.9% and the residential-land coverage (C1) attains 100.0%, fully covering the Ciqikou neighborhood and satisfying the 5 min community life circle benchmark. At both the 10 min and 15 min thresholds, C0 and C1 remain at 100.0%, achieving stable coverage across the entire study area.
5. Discussion
This section interprets the accessibility findings in relation to socially sustainable historic-district regeneration. The discussion first contrasts resident- and tourist-oriented service provision, then examines descriptive spatial associations between accessibility patterns, street-network configuration, and conservation zoning. It subsequently translates these findings into regeneration implications and closes by clarifying the study’s methodological limitations and the conditions under which the analytical framework may be transferable.
5.1. Resident–Tourist Differences in Public-Service Accessibility
The facility distribution and service-area analyses reveal an imbalance between resident- and tourist-oriented service functions in Ciqikou Historic District. ① In terms of facility counts (Table 1), three tourist- and consumption-oriented categories—catering services (39%), commercial shopping (29%), and scenic spots (14%)—together account for 82% of all POIs, whereas three resident-oriented basic service categories—healthcare (1%), science, education, and culture (3%), and sports and leisure (5%)—collectively account for only 9%. ② In pedestrian accessibility (Table 4, Table 5, Table 6, Table 7 and Table 8), measured by the residential-land coverage ratio (C1), only parks and green spaces and public toilets achieve complete residential-land coverage among the 13 facility categories. Tourist-oriented facilities generally show higher short-distance residential coverage, such as markets and supermarkets (96.3%), parking facilities (73.5%), and courier facilities (65.6%). In contrast, resident-oriented basic services exhibit insufficient short-distance coverage, with healthcare being the lowest (0.3%), followed by kindergartens (25.4%) and community service centers (33.8%). Overall, catering, commercial, and tourism-related facilities form continuous agglomerations along major tourist activity axes such as Ciqikou Main Street and Heng Street, whereas facilities closely tied to residents’ daily lives—healthcare, education, community services, and sports—are relatively dispersed and show varying degrees of insufficient short-distance coverage. Spatial overlay maps indicate that residential areas in the northern part of Ciqikou and near Jinbiqiao Street largely fall outside the service radii of public facilities. In sum, Ciqikou exhibits a dual imbalance characterized by “high quantity and high coverage of tourist-consumption facilities versus low quantity and low coverage of resident basic services,” demonstrating that commercial vitality does not equate to balanced accessibility of residents’ basic public services.
5.2. Spatial Associations with Street-Network Configuration and Conservation Zoning
Classical accessibility theory holds that accessibility results from the interplay of land-use opportunities and transport impedance, with the transport network structure connecting opportunities constituting a key measurement dimension [38]. In mountainous historic districts such as Ciqikou, where roads exhibit dendritic, narrow, and irregular characteristics, accessibility is jointly shaped by facility locations and street-routing structure. Spatial overlay analysis reveals a spatial correspondence between public-service accessibility patterns and street-network morphology: road density in Ciqikou is higher in the southeast and lower in the northwest, and the historic street system is generally narrow and dense, conducive to slow-moving traffic such as walking and cycling. Areas with higher service coverage tend to occur where streets are relatively continuous and facilities have direct connections to the road network, whereas areas with weak branch roads, circuitous routes, or dead-end connections are more likely to experience inadequate service-area extension.
Meanwhile, different conservation zones—the core conservation area, construction control area, and style coordination area—are also influenced by conservation requirements and land-use conditions, resulting in spatial differences in facility allocation and accessibility. Buildings within the historic town are subject to differentiated management according to their conservation zone, with strict controls over building function, structure, volume, height, color, and form under historic-district conservation regulations [47]. Overlaying accessibility results with conservation zones reveals that POI counts generally follow the pattern core conservation area < construction control area < style coordination area, with overall accessibility showing a similar gradient. Conservation zoning therefore provides an institutional context for understanding these spatial differences. The Historic Urban Landscape framework of the United Nations Educational, Scientific and Cultural Organization (UNESCO) emphasizes the integration of heritage conservation, socio-economic development, and local community values rather than isolated physical zoning controls [48]. Accordingly, public-service provision requires different types and scales of intervention under varying conservation intensities.
5.3. Implications for Historic-District Regeneration
The above findings also indicate that the future regeneration of Ciqikou should not be limited to increasing the number of facilities, but should integrate service beneficiaries, facility types, spatial blind zones, conservation constraints, and pedestrian routes into decision-making. Drawing on these findings, three levels of regeneration strategies can be formulated as follows (Table 9):
Table 9.
Planning strategies for improving public-service accessibility in Ciqikou Historic District.
These measures can form a regeneration assessment mechanism of “diagnose first, then classify, then implement small-scale interventions”: using GIS to identify facility types and service blind zones, determine whether the problem stems from insufficient facility supply, inadequate path connectivity, or spatial-use limitations under conservation constraints, and then adopt facility supplementation, adaptive reuse of buildings, or street-level micro-regeneration accordingly.
5.4. Limitations and Transferability
This study has the following limitations:
- POI data exhibit substantial class imbalance, and the overall sample is modest. As a temporal snapshot of facility distribution at the time of collection, POI data carry an inherent limitation: subsequent facility closures, relocations, or additions may reshape service areas and bias coverage estimates, particularly for under-sampled facility categories. The healthcare category, for instance, contains only three POIs (approximately 1% of all POIs), so any single change could substantially shift its coverage. More broadly, POI data source choice and longer time intervals may significantly alter 15 min-city accessibility scores and inequality assessments [53].
- Walking times are standardized network-model times, not validated against field measurements. In Chongqing’s mountainous environment, terrain slopes, stairways, and uphill/downhill speed differences may further affect actual travel times. Future research may incorporate slope information derived from a digital elevation model (DEM) into network-link impedances and calibrate walking speeds for different population groups.
- The associations among street-network configuration, conservation zoning, and accessibility are based solely on descriptive spatial comparison, without formal Pearson/Spearman correlation, spatial regression, or spatial autocorrelation analysis; all related statements are therefore exploratory rather than statistically confirmed. Future research may partition the study area into uniform grid units and conduct multivariate spatial statistics incorporating road density, network centrality, accessibility, slope, and conservation zoning.
Regarding transferability, Ciqikou’s specific coverage values and blind zones are jointly shaped by mountainous terrain, historic streets, tourism intensity, and local conservation institutions, and should not be directly extrapolated to districts on flat terrain or non-tourist districts. However, the analytical framework comprising POI identification, network-based walking service areas, residential-land coverage, facility-specific time benchmarks, and tourist/resident functional comparison has transferability value for sustainability-oriented regeneration evaluation elsewhere, provided that local facility classification, service standards, population distribution, and street-network conditions are recalibrated.
6. Conclusions
Using Ciqikou Historic District as a case study, this research integrates POI kernel density analysis, network-based walking service areas, and residential-land coverage assessment within the 5, 10, and 15 min community life circle framework to conduct a resident-oriented spatial diagnosis of 13 public service facility categories. It makes three contributions. First, it introduces pedestrian accessibility to everyday public services as a measurable spatial dimension of socially sustainable regeneration in tourism-oriented historic districts. Second, it develops an integrated diagnostic framework combining facility distribution, walking service areas, residential-land coverage, facility-specific time benchmarks, and comparisons between tourism-oriented functions and resident-oriented service provision. Third, it provides empirical evidence that tourism and consumption-oriented functions can cluster alongside gaps in residents’ basic-service coverage, highlighting the distinction between commercial vitality and everyday service provision.
Specifically, catering, retail, and scenic attractions account for 82% of the district’s 372 POIs and cluster along major tourist activity corridors, whereas healthcare, education, and community service facilities are more dispersed. Under the facility-specific walking-time benchmarks, 10 of the 13 categories do not achieve full residential-land coverage. Five-minute coverage is only 0.3% for health stations and clinics, 25.4% for kindergartens, and 33.8% for community service centers, while primary-school coverage reaches only 20.8% within 10 min. By contrast, public toilets and parks/green spaces achieve full coverage within 5 min, and secondary schools within 15 min. These differences indicate that total facility counts and commercial concentration alone are insufficient measures of residents’ everyday service provision.
Spatially, coverage gaps for some facility categories occur mainly in residential areas in northern Ciqikou and around Ciqikou Cross Street. Descriptive overlays of accessibility, street networks, and conservation zoning show that higher coverage tends to coincide with more continuous street connections and more direct links to facilities, whereas weak branch connections and circuitous routes tend to coincide with coverage gaps. Facility distribution and service coverage also vary across conservation zones. These spatial patterns suggest that resident-oriented service assessments should consider facility locations, pedestrian connectivity, and the conservation context together.
For regeneration practice, these findings support incorporating residents’ basic-service accessibility and balanced facility provision into the evaluation of tourism-oriented historic districts, alongside facility counts and tourism-related commercial vitality. Consistent with the integration of heritage conservation and community needs emphasized in the UNESCO Recommendation on the Historic Urban Landscape, interventions should prioritize underserved facility categories and residential areas. Adaptive reuse of existing buildings and improvements to pedestrian connectivity can guide efforts to improve residents’ access to everyday services while preserving the historic spatial fabric.
Finally, this study is limited by POI sample-size variation across categories, the absence of field-validated walking times, and the lack of statistical inference regarding network/conservation-zone associations. Future research may integrate fine-scale population data for population-weighted accessibility analysis, incorporate DEM-derived slope information and field-collected trajectories for network-cost calibration, and conduct spatial statistical tests within uniform spatial units. Multi-case comparative studies may further examine the external validity of the analytical framework, distinguishing case-specific features from planning mechanisms of general relevance to tourism-oriented historic districts.
Author Contributions
Conceptualization, Y.L. and Z.Z.; methodology, Y.L.; software, Y.L.; validation, Z.Z. and Y.Z.; formal analysis, Z.Z.; investigation, Y.L.; resources, Z.Z.; data curation, Y.L.; writing—original draft preparation, Y.L. and Z.Z.; writing—review and editing, Y.Z.; visualization, Y.Z.; supervision, Y.Z.; project administration, Y.Z.; funding acquisition, Y.Z. All authors have read and agreed to the published version of the manuscript.
Funding
This work is funded by the Sichuan Science and Technology Research Program (No. 25NSFSC1102) and the Chengdu Social Science Research Program (No. 2024SC081).
Institutional Review Board Statement
Not applicable.
Informed Consent Statement
Not applicable.
Data Availability Statement
The data that support the findings of this study are openly available in “4TU.Research Data” at https://doi.org/10.4121/939b6e7c-281d-4d78-b87d-460eed341be7.
Conflicts of Interest
The authors declare no conflicts of interest. The funders had no role in the design of the study; in the collection, analyses, or interpretation of data; in the writing of the manuscript; or in the decision to publish the results.
References
- Marra, G.; Barosio, M.; Eynard, E.; Marietta, C.; Tabasso, M.; Melis, G. From urban renewal to urban regeneration: Classification criteria for urban interventions. Turin 1995–2015: Evolution of planning tools and approaches. J. Urban Regen. Renew. 2016, 9, 367–380. [Google Scholar] [CrossRef] [Scilit]
- Waddell, S. Societal Learning and Change: How Governments, Business and Civil Society Are Creating Solutions to Complex Multi-Stakeholder Problems; Routledge: London, UK, 2005. [Google Scholar]
- Ghabouli, E.; Soltani, A.; Ranjbar, E. Heritage and the regeneration of urban brownfields: Insights on public perception in Tehran, Iran. Heritage 2023, 6, 4451–4471. [Google Scholar] [CrossRef] [Scilit]
- Zheng, W.; Shen, G.Q.; Wang, H.; Hong, J.; Li, Z. Decision support for sustainable urban renewal: A multi-scale model. Land Use Policy 2017, 69, 361–371. [Google Scholar] [CrossRef] [Scilit]
- Ho, D.; Yau, Y.; Poon, S.W.; Liusman, E. Achieving sustainable urban renewal in Hong Kong: Strategy for dilapidation assessment of high rises. J. Urban Plan. Dev. 2012, 138, 153–165. [Google Scholar] [CrossRef] [Scilit]
- Tanaka, R.; Kato, H.; Matsushita, D. Population decline and urban transformation by tourism gentrification in Kyoto city. Sustainability 2023, 15, 2247. [Google Scholar] [CrossRef] [Scilit]
- Zhang, S.H.; Liu, J.B.; Liu, J.W.; Xiong, J.; Wang, H.L. Exploration on Renewal and Improvement Strategies of Historic and Cultural Districts from the Perspective of Regional Coordination: A Case Study of Ciqikou, Chongqing. City Plan. Rev. 2024, 48, 101–109. [Google Scholar]
- Arsenio, E.; Martens, K.; Di Ciommo, F. Sustainable urban mobility plans: Bridging climate change and equity targets? Res. Transp. Econ. 2016, 55, 30–39. [Google Scholar] [CrossRef] [Scilit]
- Yue, L.; Xu, F.F.; Zhao, H.B.; Yue, M.Y. Multi-dimensional inequalities and determinants of neighborhood facility accessibility under the 15-minute city framework. Appl. Spat. Anal. Policy 2026, 19, 11. [Google Scholar] [CrossRef] [Scilit]
- European Commission. Guidelines for Developing and Implementing a Sustainable Urban Mobility Plan; European Commission: Brussels, Belgium, 2019. [Google Scholar]
- United Nations. Transforming Our World: The 2030 Agenda for Sustainable Development; United Nations: New York, NY, USA, 2015. [Google Scholar]
- Fisu, A.A.; Syabri, I.; Andani, I.G.A. Urban dynamics and gen-z mobility: The influence of land use diversity and density on daily trip patterns in indonesia. Sustain. Futures 2024, 8, 100388. [Google Scholar] [CrossRef] [Scilit]
- Yucesan, M.; özkan, B.; Mete, S.; Gul, M.; özceylan, E. Evaluating sustainability of urban mobility of Asian cities: An integrated approach of interval type-2 fuzzy best-worst method and multimoora. Eng. Appl. Artif. Intell. 2024, 127, 107266. [Google Scholar] [CrossRef] [Scilit]
- Delbosc, A.; Currie, G. Using lorenz curves to assess public transport equity. J. Transp. Geogr. 2011, 19, 1252–1259. [Google Scholar] [CrossRef] [Scilit]
- El-Geneidy, A.; Levinson, D.; Diab, E.; Boisjoly, G.; Verbich, D.; Loong, C. The cost of equity: Assessing transit accessibility and social disparity using total travel cost. Transp. Res. Part A Policy Pract. 2016, 91, 302–316. [Google Scholar] [CrossRef] [Scilit]
- Guzman, L.A.; Oviedo, D.; Rivera, C. Assessing equity in transport accessibility to work and study: The Bogotá region. J. Transp. Geogr. 2017, 58, 236–246. [Google Scholar] [CrossRef] [Scilit]
- Serrano-López, R.; Linares-Unamunzaga, A.; Muñoz San Emeterio, C. Urban sustainable mobility and planning policies. A Spanish mid-sized city case. Cities 2019, 95, 102356. [Google Scholar] [CrossRef] [Scilit]
- Sanchez-Sepulveda, M.V.; Navarro, J.; Fonseca-Escudero, D.; Amo-Filva, D.; Antunez-Anea, F. Exploiting urban data to address real-world challenges: Enhancing urban mobility for environmental and social well-being. Cities 2024, 153, 105275. [Google Scholar] [CrossRef] [Scilit]
- Grande-Ayala, C.E.; Navas-Gracias, L.M. Institutional features driving socially sustainable urban mobility: Contributions from the northern central American triangle. Cities 2025, 160, 105807. [Google Scholar] [CrossRef] [Scilit]
- Macioszek, E.; Jurdana, I. Bicycle traffic in the cities. Sci. J. Sil. Univ. Technol.-Ser. Transp. 2022, 117, 115–127. [Google Scholar] [CrossRef] [Scilit]
- Spierenburg, L.; van Lint, H.; van Oort, N. Synergizing cycling and transit: Strategic placement of cycling infrastructure to enhance job accessibility. J. Transp. Geogr. 2024, 116, 103861. [Google Scholar] [CrossRef] [Scilit]
- Zhao, Q.; Winters, M.; Nelson, T.; Laberee, K.; Ferster, C.; Manaugh, K. Who has access to cycling infrastructure in Canada? A social equity analysis. Comput. Environ. Urban Syst. 2024, 110, 102109. [Google Scholar] [CrossRef] [Scilit]
- Körmeçli, P.S. Analysis of walkable street networks by using the space syntax and GIS techniques: A case study of Cankiri city. ISPRS Int. J. Geo-Inf. 2023, 12, 216. [Google Scholar] [CrossRef] [Scilit]
- Pozoukidou, G.; Angelidou, M. Urban planning in the 15-minute city: Revisited under sustainable and smart city developments until 2030. Smart Cities 2022, 5, 1356–1375. [Google Scholar] [CrossRef] [Scilit]
- Wang, T.; Li, Y.; Chuang, I.; Qiao, W.; Jiang, J.; Beattie, L. Evaluating the 15-minute city paradigm across urban districts: A mobility-based approach in Hamilton, New Zealand. Cities 2024, 151, 105147. [Google Scholar] [CrossRef] [Scilit]
- Wang, R.; Wang, Y.; Li, N. Revealing disaster dynamics and disparities in urban facility accessibility using an improved utilization-based metric. Cities 2024, 144, 104636. [Google Scholar] [CrossRef] [Scilit]
- Jang, K.M.; Kim, J.; Lee, H.Y.; Cho, H.; Kim, Y. Urban green accessibility index: A measure of pedestrian-centered accessibility to every green point in an urban area. ISPRS Int. J. Geo-Inf. 2020, 9, 586. [Google Scholar] [CrossRef] [Scilit]
- Wang, X.K.; Meng, Q.Y.; Liu, X.Z.; Allam, M.; Zhang, L.L.; Hu, X.L.; Bi, Y.X.; Jancsó, T. Evaluation of fairness of urban park green space based on an improved supply model of green space: A case study of Beijing central city. Remote Sens. 2023, 15, 244. [Google Scholar] [CrossRef] [Scilit]
- Yin, C.; He, Q.; Liu, Y.; Chen, W.; Gao, Y. Inequality of public health and its role in spatial accessibility to medical facilities in china. Appl. Geogr. 2018, 92, 50–62. [Google Scholar] [CrossRef] [Scilit]
- Kompil, M.; Jacobs-Crisioni, C.; Dijkstra, L.; Lavaile, C. Mapping accessibility to generic services in Europe: A market-potential based approach. Sust. Cities Soc. 2019, 47, 101372. [Google Scholar] [CrossRef] [Scilit]
- Yan, J. Research on Spatial Accessibility Evaluation Methods of Urban Public Service Facilities. Master’s Thesis, Southeast University, Nanjing, China, 2016. [Google Scholar]
- Taleai, M.; Sliuzas, R.; Flacke, J. An integrated framework to evaluate the equity of urban public facilities using spatial multi-criteria analysis. Cities 2014, 40, 56–69. [Google Scholar] [CrossRef] [Scilit]
- Oh, K.; Jeong, S. Assessing the spatial distribution of urban parks using GIS. Landsc. Urban Plan. 2007, 82, 25–32. [Google Scholar] [CrossRef] [Scilit]
- Ford, A.C.; Barr, S.L.; Dawson, R.J.; James, P. Transport accessibility analysis using GIS: Assessing sustainable transport in London. ISPRS Int. J. Geo-Inf. 2015, 4, 124–149. [Google Scholar] [CrossRef] [Scilit]
- Huang, Y.F.; Yu, P.C.; Xie, P. Analysis and optimized location selection of comprehensive green space supply in the central urban area of Hefei based on GIS. Buildings 2023, 13, 2731. [Google Scholar] [CrossRef] [Scilit]
- Murad, A. Using GIS for determining variations in health access in Jeddah city, Saudi Arabia. ISPRS Int. J. Geo-Inf. 2018, 7, 254. [Google Scholar] [CrossRef] [Scilit]
- Cui, Y.; Wang, Q.; Zha, G.; Dang, Y.; Duan, X.; Wang, L.; Luo, M. Evaluation of the accessibility of children’s spaces at the community scale: The case study of Hangzhou. ISPRS Int. J. Geo-Inf. 2024, 13, 55. [Google Scholar] [CrossRef] [Scilit]
- Luqman, M.; Khan, S.U. Geospatial application to assess the accessibility to the health facilities in Egypt. Egypt. J. Remote Sens. Space Sci. 2021, 24, 699–705. [Google Scholar] [CrossRef] [Scilit]
- Tahmasbi, B.; Mansourianfar, M.H.; Haghshenas, H.; Kim, I. Multimodal accessibility-based equity assessment of urban public facilities distribution. Sustain. Cities Soc. 2019, 49, 101633. [Google Scholar] [CrossRef] [Scilit]
- Silverman, B.W. Density Estimation for Statistics and Data Analysis; Chapman & Hall: London, UK, 1986. [Google Scholar]
- Geurs, K.T.; van Wee, B. Accessibility evaluation of land-use and transport strategies: Review and research directions. J. Transp. Geogr. 2004, 12, 127–140. [Google Scholar] [CrossRef] [Scilit]
- China Academy of Urban Planning and Design. Code for Design of Urban Road Engineering; China Architecture & Building Press: Beijing, China, 2012. [Google Scholar]
- GB 50180-2018; Standard for Urban Residential Area Planning and Design. China Architecture & Building Press: Beijing, China, 2018.
- Gupta, K.; Roy, A.; Luthra, K.; Maithani, S.; Mahavir. GIS based analysis for assessing the accessibility at hierarchical levels of urban green spaces. Urban For. Urban Green. 2016, 18, 198–211. [Google Scholar] [CrossRef] [Scilit]
- Xiao, C.Y. Reflections on the Development and Evolution of Ciqikou Historic District—From the Perspective of Consumer Culture. J. Hum. Settl. West China 2008, 4, 6–12. [Google Scholar]
- Li, H.P.; Wang, Y.H. Research on the Conservation and Development of Historical Neighborhoods under the Measurement of Community Participation—Taking the Historical Neighborhood of Ciqikou in Chongqing Municipality as an Example. China Anc. City 2024, 38, 3–9. [Google Scholar]
- GB/T 50357-2018; Standard of Conservation Planning for Historic City. China Architecture & Building Press: Beijing, China, 2018.
- UNESCO. Recommendation on the Historic Urban Landscape; UNESCO: Paris, France, 2011. [Google Scholar]
- Ren, Z.Q.; Zhang, S.Q.; Kong, Y.; Fu, X.; Qin, X.; Zhen, F. The classification and determinants of the 15-minute city across 339 Chinese cities. npj URBAN Sustain. 2026, 6, 86. [Google Scholar] [CrossRef] [Scilit]
- Bittencourt, T.A.; Giannotti, M. Evaluating the accessibility and availability of public services to reduce inequalities in everyday mobility. Transp. Res. Part A Policy Pract. 2023, 177, 103833. [Google Scholar] [CrossRef] [Scilit]
- Zhu, Y.J.; Martínez, P.G. Heritage, values and gentrification: The redevelopment of historic areas in China. Int. J. Herit. Stud. 2022, 28, 476–494. [Google Scholar] [CrossRef] [Scilit]
- Rhoads, D.; Solé-Ribalta, A.; Borge-Holthoefer, J. The inclusive 15-minute city: Walkability analysis with sidewalk networks. Comput. Environ. Urban Syst. 2023, 100, 101936. [Google Scholar] [CrossRef] [Scilit]
- Rahman, F.; Oliver, R.; Buehler, R.; Lee, J.; Crawford, T.; Kim, J. Impacts of point of interest (poi) data selection on 15-minute city (15-mc) accessibility scores and inequality assessments. Transp. Res. Part A Policy Pract. 2025, 195, 104429. [Google Scholar] [CrossRef] [Scilit]

Disclaimer/Publisher’s Note: The statements, opinions and data contained in all publications are solely those of the individual author(s) and contributor(s) and not of MDPI and/or the editor(s). MDPI and/or the editor(s) disclaim responsibility for any injury to people or property resulting from any ideas, methods, instructions or products referred to in the content. |
© 2026 by the authors. Licensee MDPI, Basel, Switzerland. This article is an open access article distributed under the terms and conditions of the Creative Commons Attribution (CC BY) license.