


Abstract
The rising need for sustainable energy sources and less dependence on fossil fuels leads to research on alternative fuels. Motorcycles across a wide range of categories often use single-cylinder, spark-ignition, four-stroke engines. This research analyzes the performance of a single-cylinder engine with different bioethanol–gasoline blends at varying engine speeds. The present study used the numerical simulation tool AVL BOOST for one-dimensional simulation. A numerical model was developed for the single-cylinder engine in order to determine its performance, where a number of fuel mixtures were considered at different engine speeds. Parameters such as power, torque, engine efficiency, temperature, BMEP, BSFC, and fuel consumption were obtained to analyze the engine performance. The current results indicate that engines operating on lower ethanol blends achieve maximum power output at lower speeds. The E20 blend produces 12.29% more power and 4% more torque than gasoline. Additionally, E20 demonstrates a 2.89% increase in mechanical efficiency compared to gasoline. The E30 blend performs similarly to E20 and shows potential for reduced fuel consumption at lower speeds, though only E20 exhibits marginal power gains at lower speeds, achieving 52% more power than gasoline. Furthermore, the results highlight that both power and indicated efficiency increase with higher ethanol content in the blends, while the brake mean effective pressure (BMEP) slightly decreases after 2000 RPM. The brake specific fuel consumption (BSFC) ranges from 0.6 to 0.9 kg/kw.h Fuel consumption rises gradually with engine speed; however, after 2000 RPM, fuel consumption using ethanol (E0) increases significantly. Each blend recorded slightly different exhaust gas temperatures. Overall, the findings identify E20 as a promising alternative to pure gasoline for the investigated single-cylinder engine, offering improved power output, torque, and mechanical efficiency. This study provides numerical insights into the influence of ethanol–gasoline blending ratios on motorcycle engine performance and supports the potential use of bio-ethanol blends as a means of improving engine performance and reducing dependence on conventional fossil fuels.
1. Introduction
The increasing energy needs have increased researchers’ interest in exploring non-fossil or alternative automobile fuels. Due to the depletion of fossil fuels, the international community is seeking recognized alternative fuels for engines. Biofuel made from renewable resources has become a promising alternative to traditional fossil fuels [1]. Biofuels offer a prominent form of renewable energy and can be a feasible substitute. This is because the availability of fossil fuels is limited. Biofuels have gained increasing attention as renewable alternatives to conventional fossil fuels because of their potential to diversify energy resources and support the transition toward more sustainable energy systems [2]. Among the various types of biofuels, bioethanol has emerged as a promising alternative fuel for spark ignition internal combustion engines because it can be produced from renewable biomass and blended with gasoline in different proportions [3,4]. Its relatively high-octane rating and oxygen content can influence combustion characteristics and engine performance.
However, differences between ethanol and gasoline in properties such as lower heating value, latent heat of vaporization, and stoichiometric air–fuel ratio can affect power output, torque, fuel consumption, and exhaust emissions [2,3,4,5]. Therefore, evaluating different ethanol–gasoline blends under varying engine operating conditions is important for assessing their suitability as alternative fuels for spark-ignition engines. The use of ethanol dates back to ancient civilization, where it was primarily produced through the fermentation of sugar-rich fruits and other agricultural materials for alcoholic beverages. With advances in fermentation and purification technologies, ethanol production has expanded to include a wide range of biomass feedstocks, including corn and other carbohydrate-rich materials [6,7]. In recent decades, these developments have contributed to growing interest in bioethanol as a renewable transportation fuel and a potential alternative to conventional fossil fuels [8]. The same type of alcohol was used in beverages but was changed to meet the requirements of the fuel by mixing it with gasoline, making it unfit for use [9,10]. The single-cylinder spark-ignition engine is usually found in many motorcycle engines. In this research, we are concerned with the performance of the four-stroke motorcycle engine that uses ethanol and gasoline fuel. Particular attention has been devoted to investigating the effects of ethanol addition on key engine performance parameters, including power output, torque, fuel consumption, and exhaust emissions [11,12,13].
The influence of ethanol–gasoline blends on engine performance depends on the blend ratio, fuel properties, and engine operating conditions [12,14]. Low-percentage ethanol blends may improve certain performance characteristics under specific operating conditions, although the effects vary among engines and experimental conditions [11,13]. Beyond engine performance, bioethanol has attracted increasing interest as an alternative to conventional petroleum-based fuels because of its potential to reduce dependence on fossil fuels and mitigate environmental impacts, depending on its production pathway [14,15]. Therefore, understanding the effects of different bioethanol–gasoline blend ratios on engine performance and exhaust emissions is essential for assessing their suitability as alternative transportation fuels [16,17]. By examining the effects of bio-ethanol and gasoline blends, we can acquire important insights for enhancing engine design optimized for these alternative fuel mixtures. This study can lead to developing engines specifically tailored to run efficiently and effectively on bio-ethanol–gasoline mixes, potentially offering several benefits [18]. The alternative fuels, such as bioethanol, add to power modification and decrease reliance on limited fossil gasoline reserves [19,20].
The urgency of this transition extends beyond the mere scarcity of fossil fuels. The combustion of these fuels is a primary contributor to greenhouse gas emissions, driving global climate change and environmental degradation [3,20]. Furthermore, the geopolitical concentration of oil reserves creates significant energy security risks for many nations, and making the development of domestically produced, energy security risks for many nations, making the development of domestically produced, sustainable fuels a matter of national and international importance [15,17]. Consequently, the search for alternatives is not just an academic exercise but a critical global imperative.
Among the various renewable energy sources, biofuels hold a unique position. While technologies such as solar and wind power are excellent for electricity generation, the transportation sector, which is heavily reliant on liquid fuels, is more challenging to decarbonize [1,20]. Electric vehicles are gaining traction, but their widespread adoption is limited by infrastructure costs, battery technology, and charging times. In contrast, biofuels, particularly those derived from non-food biomass and algae, offer a direct solution [4,8]. They can be blended with or replace conventional diesel and gasoline, leveraging existing engine and fuel distribution infrastructure [11,13,18]. This compatibility makes them a highly practical and immediate option for reducing the carbon footprint of the transport industry. Biofuels are generally categorized into first generation from food crops, second generation from non-food biomass, and third generation from algae [14]. Each generation presents distinct advantages and challenges.
The aim of this study is the systematic numerical evaluation of a wide range of ethanol–gasoline blends (E0–E100) in a single-cylinder four-stroke motorcycle CD 70 engine using AVL BOOST over a speed range of 1000–4000 RPM. In this study, a one-dimensional numerical model of a single-cylinder, spark-ignition gasoline engine used in motorcycles was developed using AVL BOOST simulation software. The model was employed to evaluate the engine performance characteristics, which include engine power, torque, BMEP, BSFC, and efficiency outputs, under different gasoline-bioethanol fuel blends.
2. Numerical Methodology
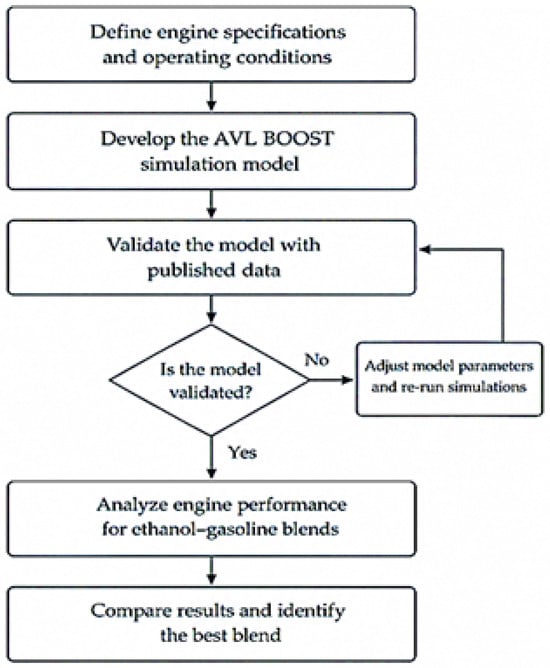
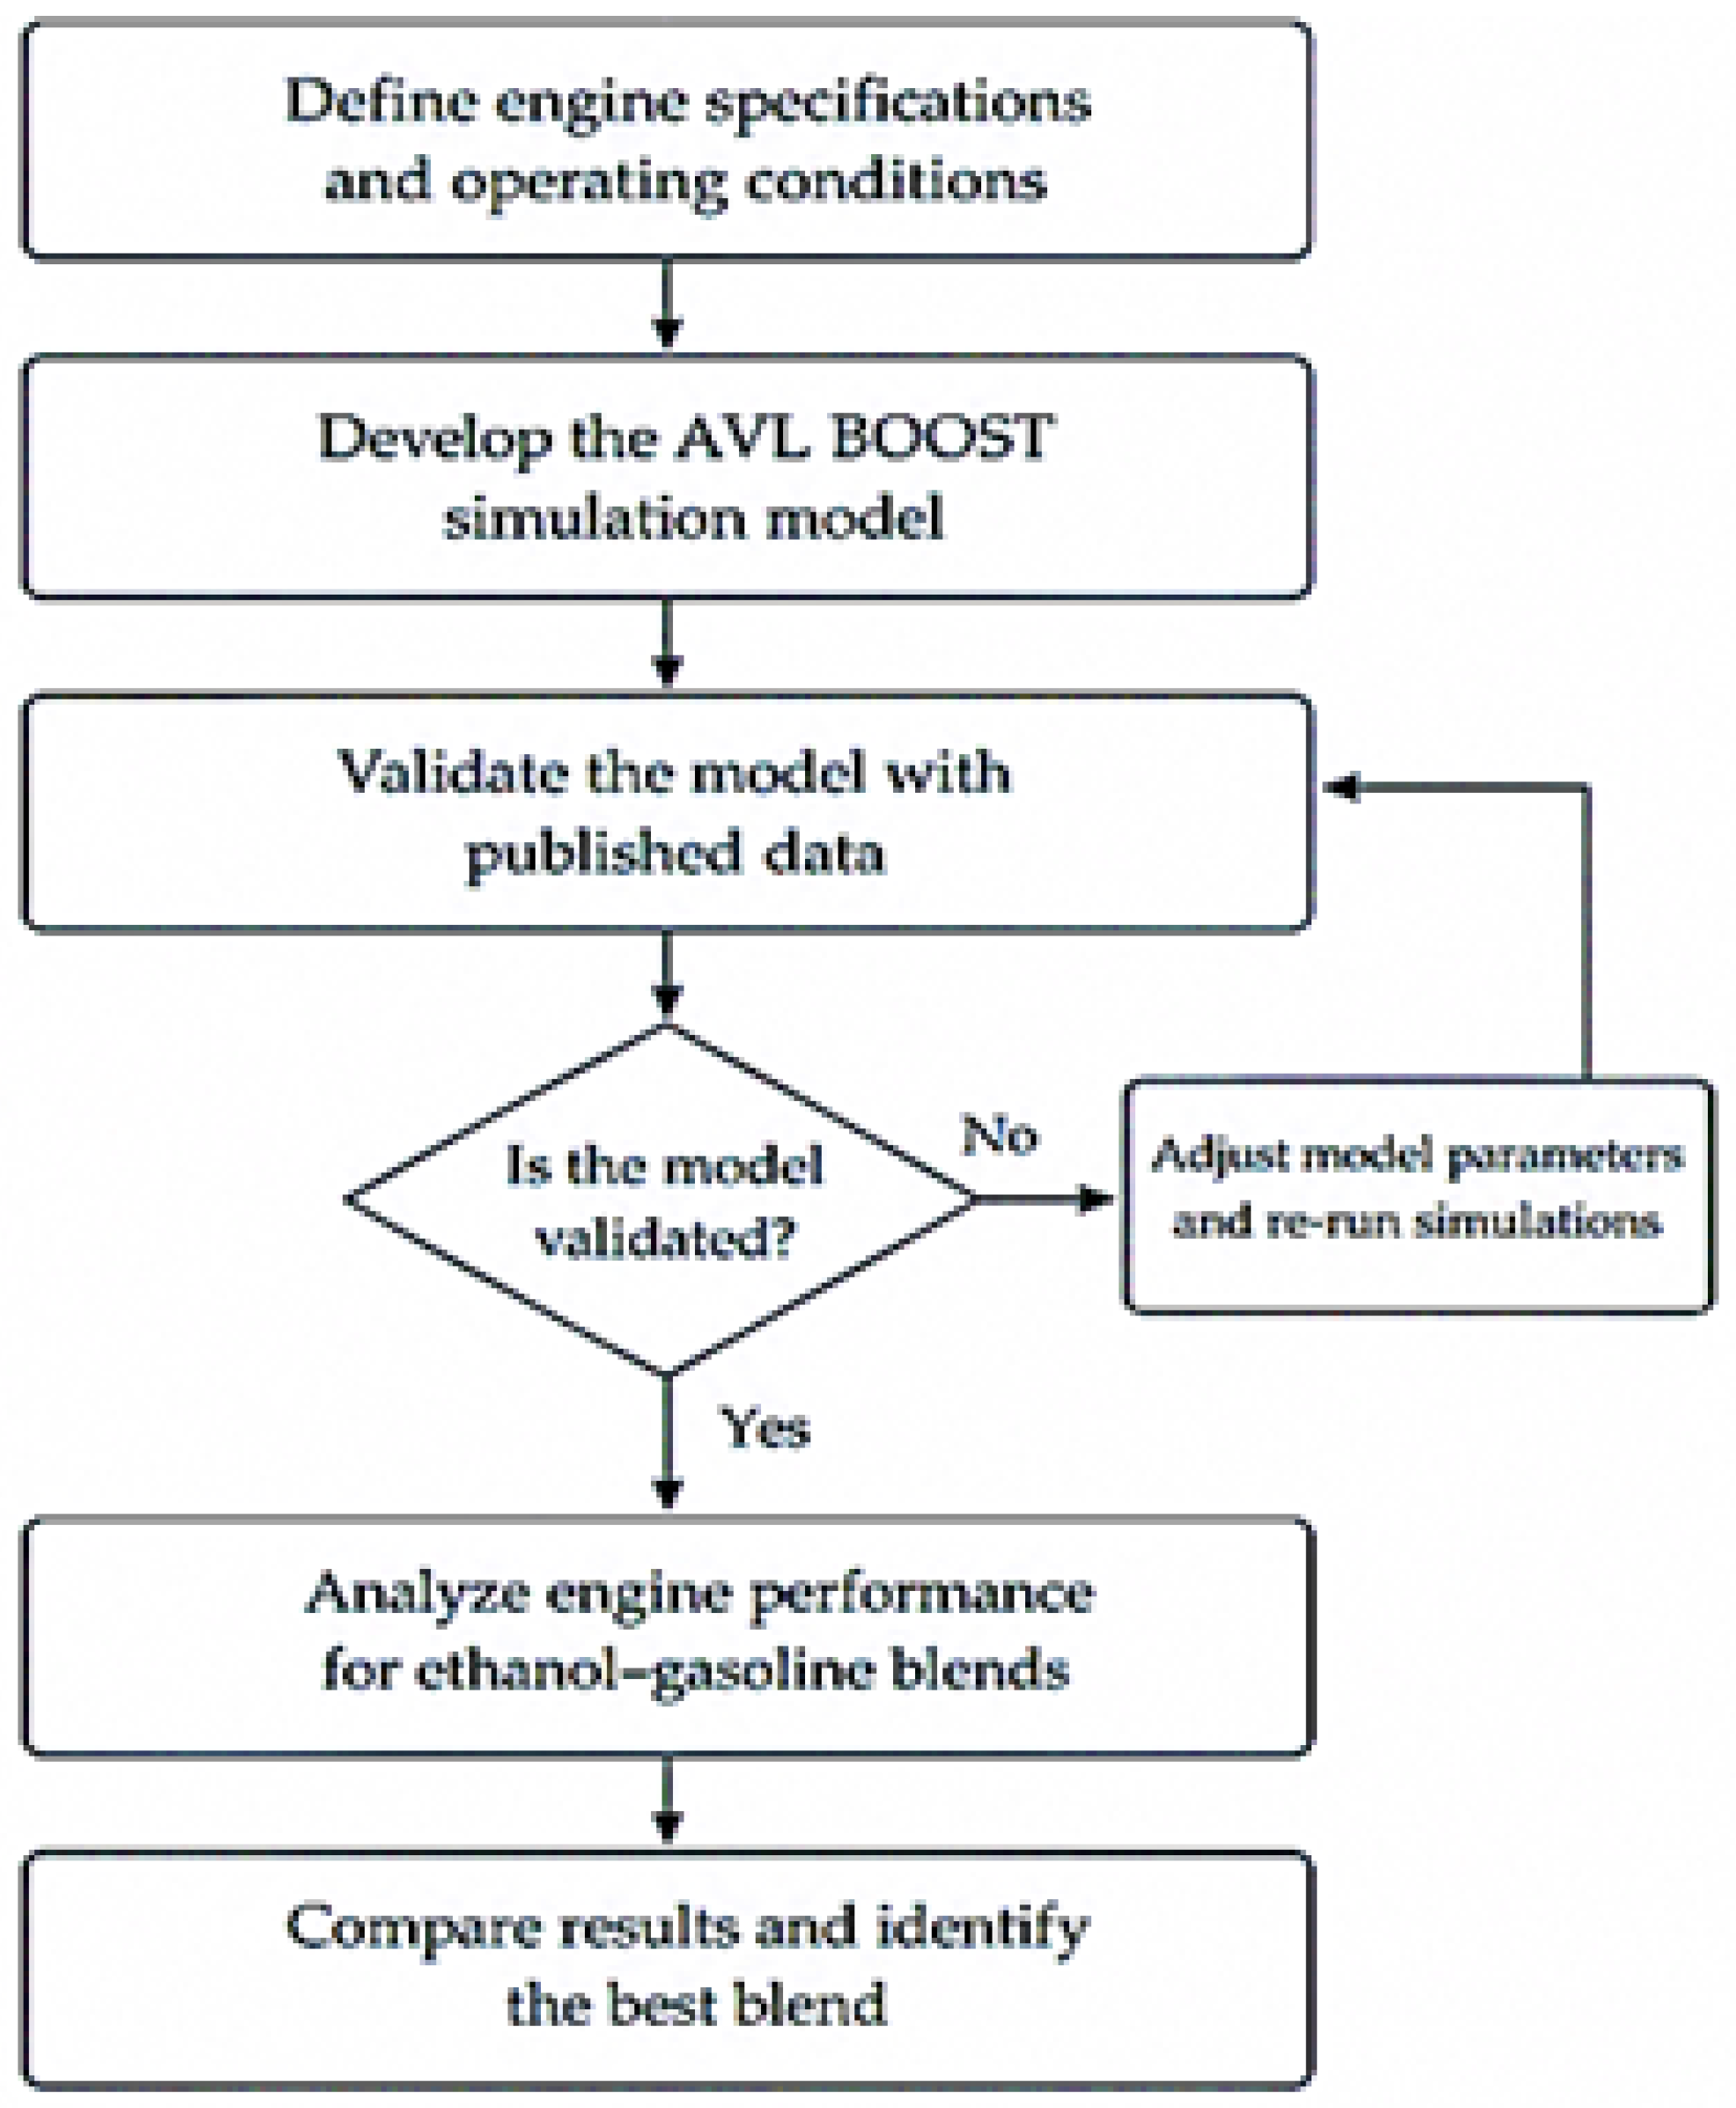
In this research, the simulation software (AVL Boost) is used to simulate the single-cylinder engine. The numerical approach adopted for the current study is shown in Figure 1.
Figure 1.
Flowchart of the methodology adopted for AVL BOOST engine modeling and performance assessment of bioethanol–gasoline blends.
The flowchart in Figure 1 presents the sequence of the numerical investigation and illustrates the iterative validation procedure adopted to establish the reliability of the simulation model before proceeding with the performance analysis. The developed simulation model was validated by comparing the predicted engine power and torque with the published experimental data reported in reference [11]. Following the validation of the results from the study, a model for a CD 70 single-cylinder spark ignition engine was developed. The developed model was used to assess the engine performance under different ethanol–gasoline blend ratios for each fuel mixture; the exhaust gas temperature for different engine speeds (1000, 2000, 3000, and 4000 RPM) was recorded.
The selection of the engine speed range was based on operating conditions of the modeled single-cylinder motorcycle engine and the validation data reported in reference [11]. This range allows the effect of engine speed on the performance of different ethanol–gasoline blends to be evaluated consistently. The fuel blends E0, E10, E20, E30, E40, E50, E60, E70, E80, E90, and E100 were selected to provide a gradual increase in ethanol content from pure gasoline to pure ethanol. This systematic selection allows the effect of increasing ethanol concentration on power, torque, efficiency, BMEP, BSFC, fuel consumption, and exhaust gas temperature to be evaluated under the same engine operating conditions. AVL Boost simulation software is designed specifically for engine simulation and facilitates the investigation and analysis of any modifications in gasoline combination, engine layout, and associated equipment. Simulation can provide highly accurate predictions of intake and output. However, researchers rely heavily on simulation information before proceeding to the experimental stage [21,22]. Simulations are highly regarded in modern engineering due to their ability to offer time and cost savings over physical experiments and their assistance in optimizing experimental designs. In Pakistan, primarily the CD 70 engine bikes are popular vehicles running on gasoline. A single-cylinder spark ignition engine is commonly used in bikes, typically using a carburetor fuel system designed to deliver precise air and fuel to the engine combustion chamber and ensure an optimal air–fuel mixture for improved performance. The engine specifications and operating conditions were defined using the manufacturer’s technical specification manual. These parameters were used to develop the AVL BOOST simulation model, and the input parameters adopted in the present study are presented in Table 1.
Table 1.
Specifications of the engine.
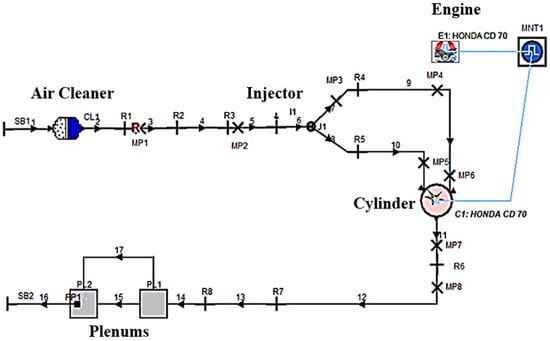
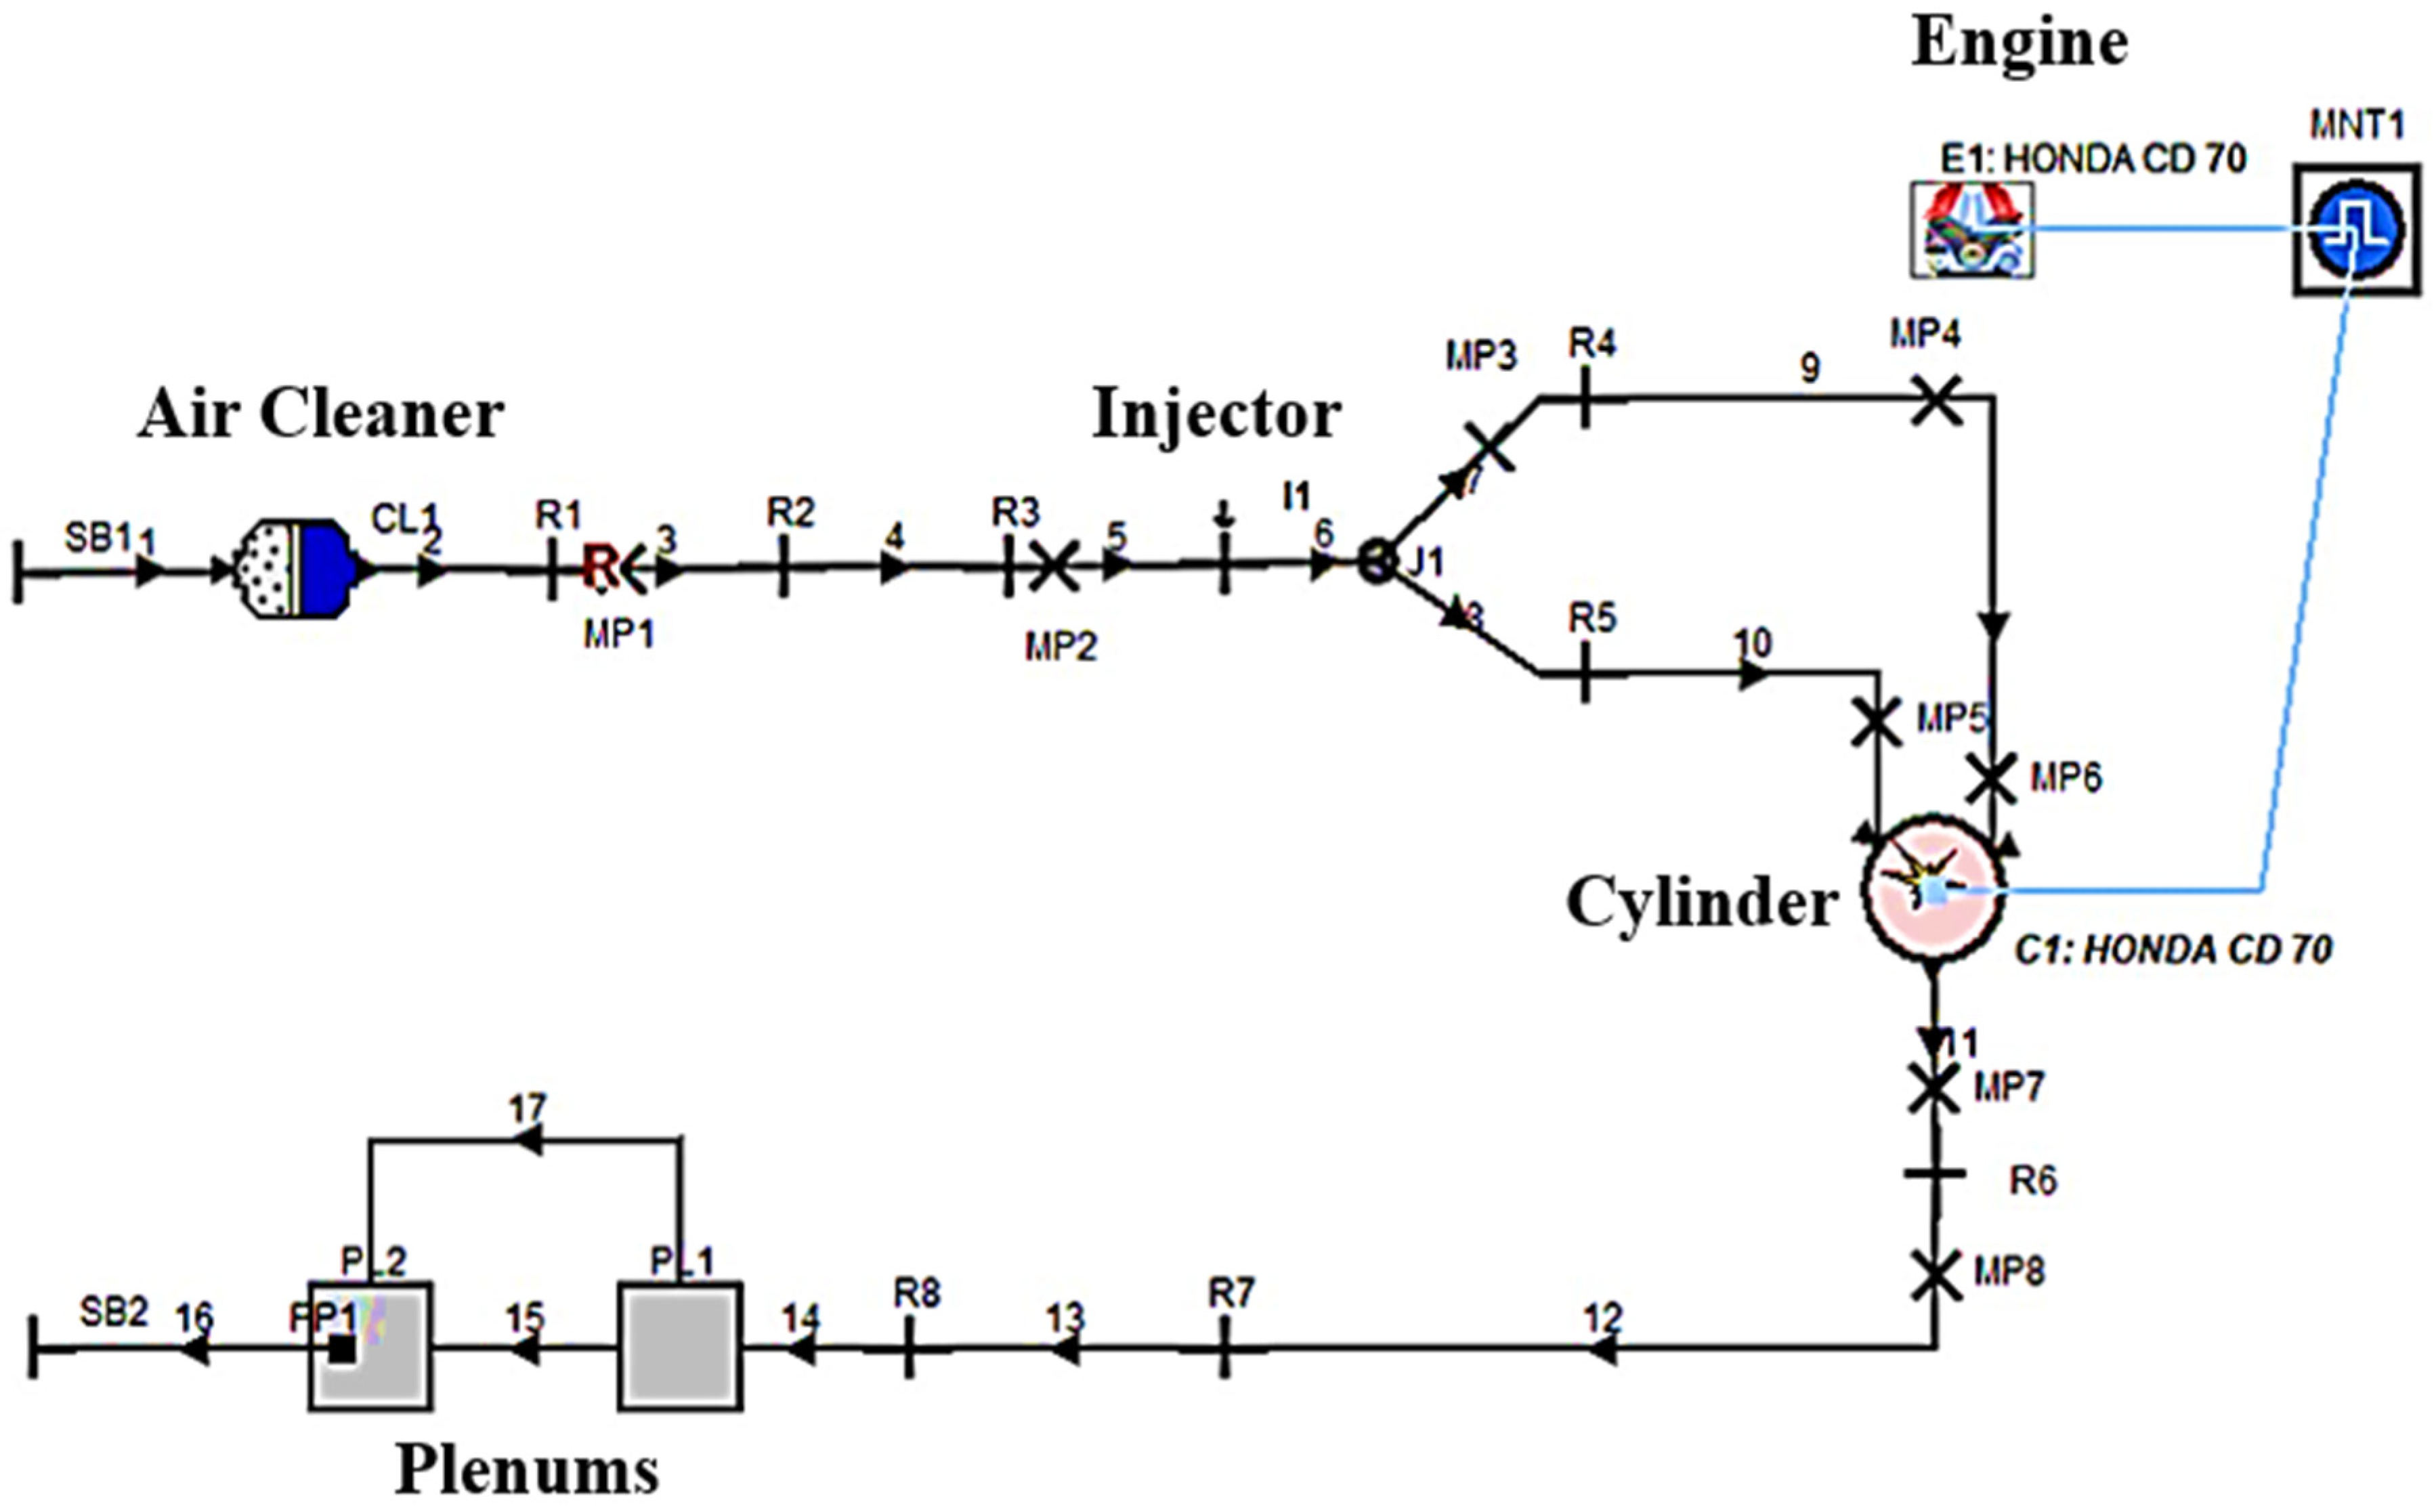
AVL Boost developed and calibrated an advanced single-cylinder spark-ignition motorcycle engine model, shown in Figure 2.
Figure 2.
Schematic of the single-cylinder engine model by AVL Boost.
The 1-D engine simulation model that has been created in AVL BOOST contains all the engine components along with the connections between them, as shown in Figure 2. The corresponding model elements and input parameters are summarized in Table 2.
Table 2.
Model design elements.
For naturally aspirated CD 70, a reasonable starting point for a steady-state simulation is required as shown in Table 3.
Table 3.
Gasoline and ethanol blending ratio.
Models using the Classic Species Setup of AVL Boost run on gasoline and ethanol. The software utilizes this setup to determine how combustion occurs and the processes that take place during combustion. This allows us to examine the performance features. Ignition and combustion times for various blends were fixed for these investigations. Examining engine characteristics and the application of bioethanol–gasoline blends entails numerous steps. The first step is to obtain relevant data and engine specifications, and then examine the blends. The fuel properties implemented in the AVL BOOST simulation model include a molar mass of 111.20875 kg/kmol for gasoline and 46.07 kg/kmol for ethanol. The corresponding stoichiometric air–fuel ratios were considered as 14.6:1 for gasoline and 9:1 for ethanol, respectively. Based on the governing equations, the indicated work produced by the engine was determined and subsequently used to calculate the engine power, as expressed by the equation presented below.
where Wi is Indicated Engine Power (KJ), Pmi is Mean Indicated Pressure (Pa), and VH is Cylinder Displacement (m3), and P is In-Cylinder Pressure (Pa), V is Cylinder Volume (m3), and Ni is Indicated Engine Power (KW), and n is Engine Speed (r/min).
The given indicated power calculates torque:
where Ni is Indicated Engine Power (KW), and n is Engine Speed (RPMs).
The simulation software AVL Boost has become essential software for research to enhance efficiency and reduce the time and expense involved in improving engine models.
Woschni-type correlation, the heat-transfer coefficient is generally expressed in the form:
where h = heat-transfer coefficient, D = cylinder bore, p = cylinder pressure, T = cylinder-gas temperature, w = characteristic gas velocity and C = model constant.
h = CD−0.2p0.8T−0.53w0.8
The friction was treated; the basic definition is as follows:
where Wf = friction work per cycle and Vd = engine displacement volume,
and:
where BMEP is brake mean effective pressure, IMEP is indicated mean effective pressure, and FMEP is friction mean effective pressure, and for CD 70 engine:
BMEP = IMEP − FMEP
Vd = 72 × 10−6 m3
There is a variety of different programs that have been developed within the field of the internal combustion engine. Although there is an emphasis on the SI and CI engines in the existing literature, in some cases, the scope of the research is wider. The program of AVL Boost allows carrying out computational calculations. The software program’s versatility in handling different types of fuels allows researchers to conduct computations, including those for alternative fuels. The various blends are set in a classic, spacious setup using the simulation tool, which allows the user to adjust the ratios of fuel blends. The AVL BOOST computes the properties of gas in each cell for every time step. The blends defined by fraction ratios using the Boost gas property modules are listed in Table 4.
Table 4.
Gasoline and ethanol blending ratio [23,24,25,26].
The Boost Gas properties tool adjusts the blend properties, in which fraction-based blending adjusts for every blend. Every blend is adjusted as defined in Table 4, based on tests on single-cylinder spark ignition engine models at 1000, 2000, 3000, and 4000 RPM. After 4000 RPM, the engine works smoothly at lower speeds after 100 simulation cycles. There is no excessive vibration. The engine runs for 500 cycles to collect accurate data.
Simulations Procedure
AVL Boost enhances the accuracy of the simulation model, ensuring that the simulation run procedure aligns perfectly with the manual. All parameters are set to simulate the calibrated engine version to analyze the engine’s overall performance while running on various bioethanol–gasoline ratios. To measure strength output, torque, petrol usage, emissions levels, and thermal efficiency under various running scenarios. The modeling results for different blend ratios are compared to see what happens to the engine when bioethanol and gasoline are used. The simulation is run for the selected case to simulate the model and create the model creation, cyclic simulation, and creation of series results. After simulating the model for all blends at varying speeds, the AVL Boost provides results in Impress, where the graphical form of results can be seen. Also, a series of results will be given to compare the results of the different simulations. The engine performance characteristics are mainly measured from these values: Torque (Nm), Power (Hp), Brake Mean Effective Pressure (BMEP) in (bar), Brake Specific Fuel Consumption (BSFC) in (Kg/Kw.h), Isovolumetric Efficiency (%), Indicated Efficiency (%) and Mechanical Efficiency (%). After evaluating and interpreting the simulation, I focus on how fuel blends, including gasoline, bioethanol, and blends of other fuels, affect engine characteristics. Contrasting simulation results with experimental data from real engine tests, which publish data, verifies the numerical data. I check to see if the model closely matches the observed engine performance characteristics.
3. Results and Discussions
3.1. Validation of the Model
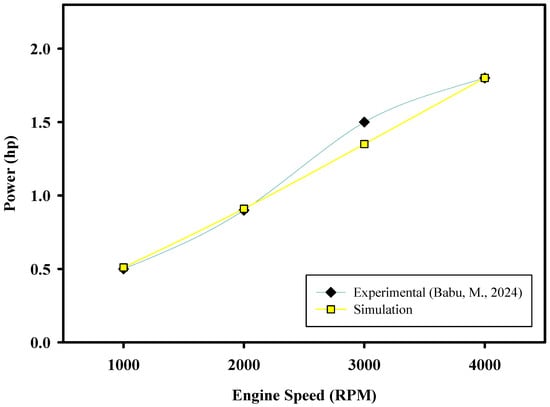
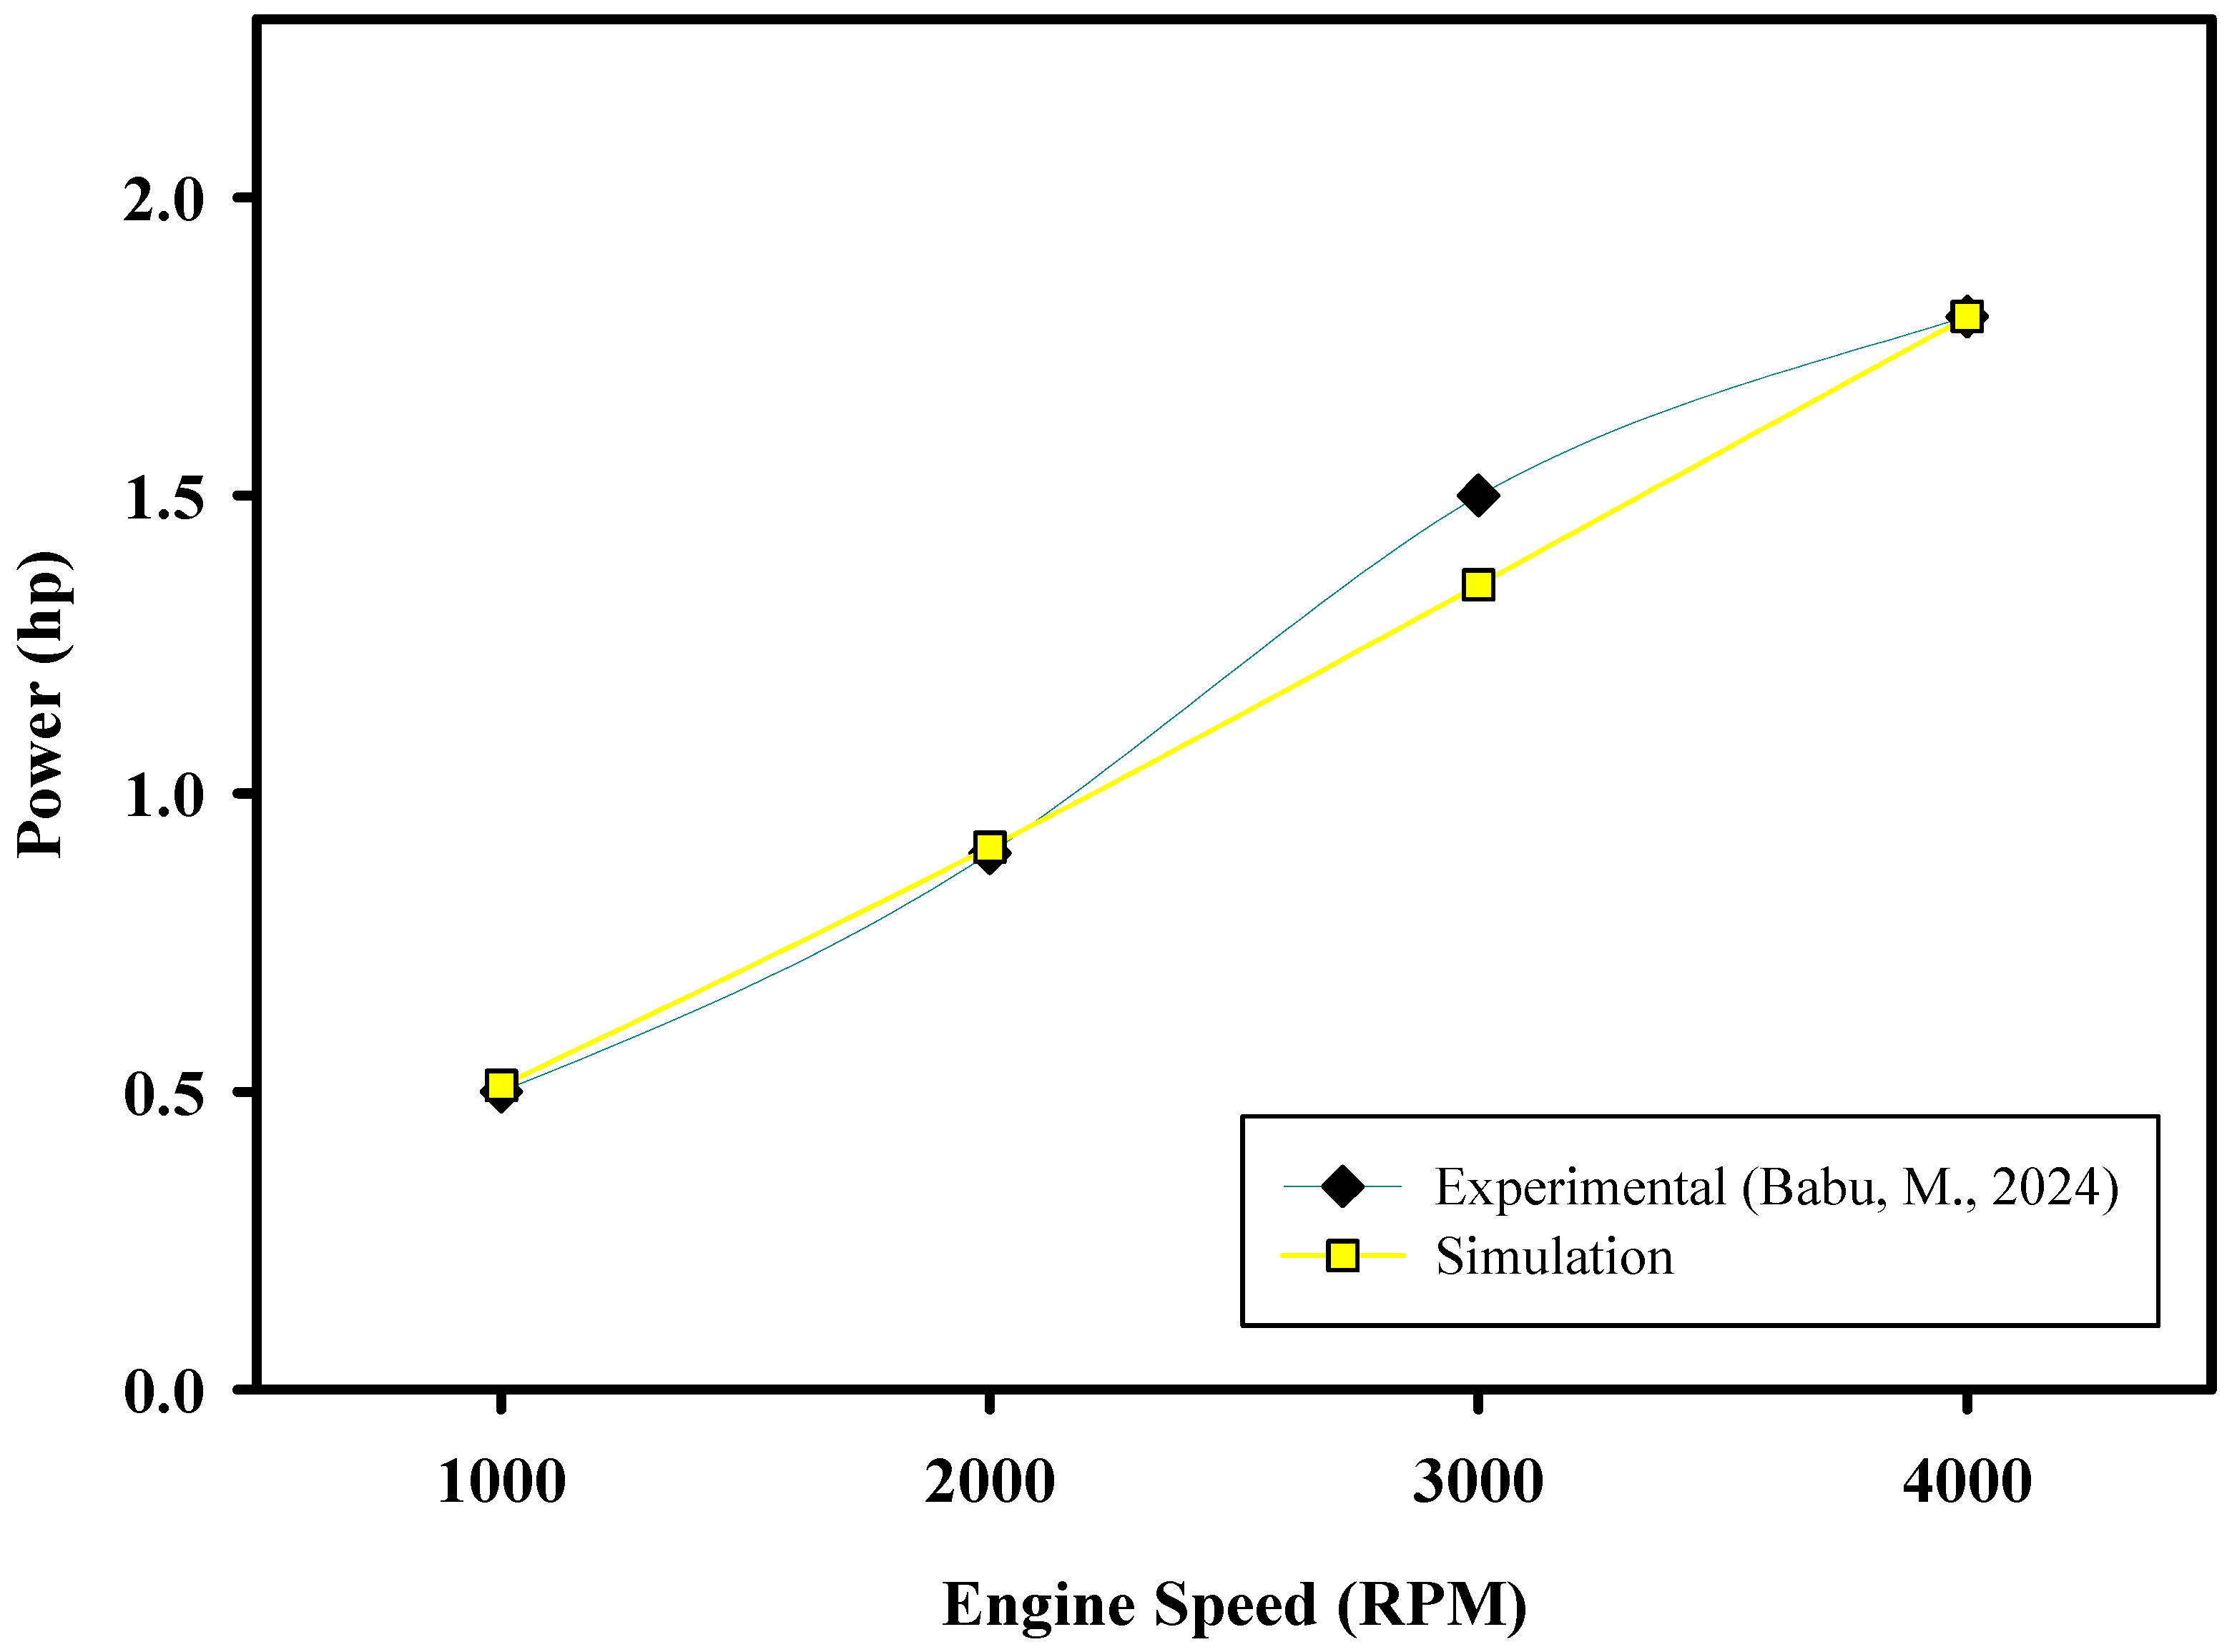
The simulation model was validated by comparing its predictions with experimental data reported in reference [11]. Figure 3 presents the comparison at four rotational speeds, along with the percentage error. The simulated power followed the same increasing trend as the experimental data. At 1000 RPM, the experimental power was 0.5, and the simulated value was 0.51, giving a percentage error of 2.00%. At 2000 RPM, the experimental and simulated values were 0.9 and 0.91, respectively, with an error of 1.11%. The closest value was observed at 4000 RPM, where both the experimental and simulated values were 1.8. The largest deviation occurred at 3000 RPM, where the experimental value was 1.5 while the simulation predicted 1.35, corresponding to a 10% error. The mean absolute percentage error across the four operating points was 3.28%. This low average error indicates that the simulation model reproduces the experimental power data with good accuracy. The model slightly overpredicted the power at 1000 and 2000 RPM and underpredicted it at 3000 RPM. These differences may be attributed to measurement uncertainty in the original experiment or nonlinear effects at intermediate speeds. Overall, the agreement shown in Figure 4 supports the validity of the simulation model for the studied RPM range when compared with experimental data from reference [11]. However, the average percentage error across all four operating points remains low at 3.28%, indicating that the model is generally reliable for the conditions examined.
Figure 3.
Power vs. Engine Speed (RPM) [11].
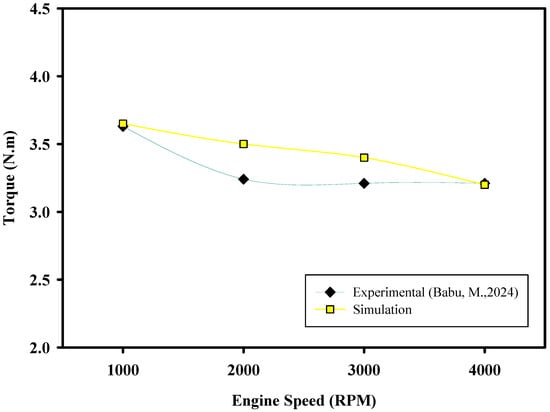
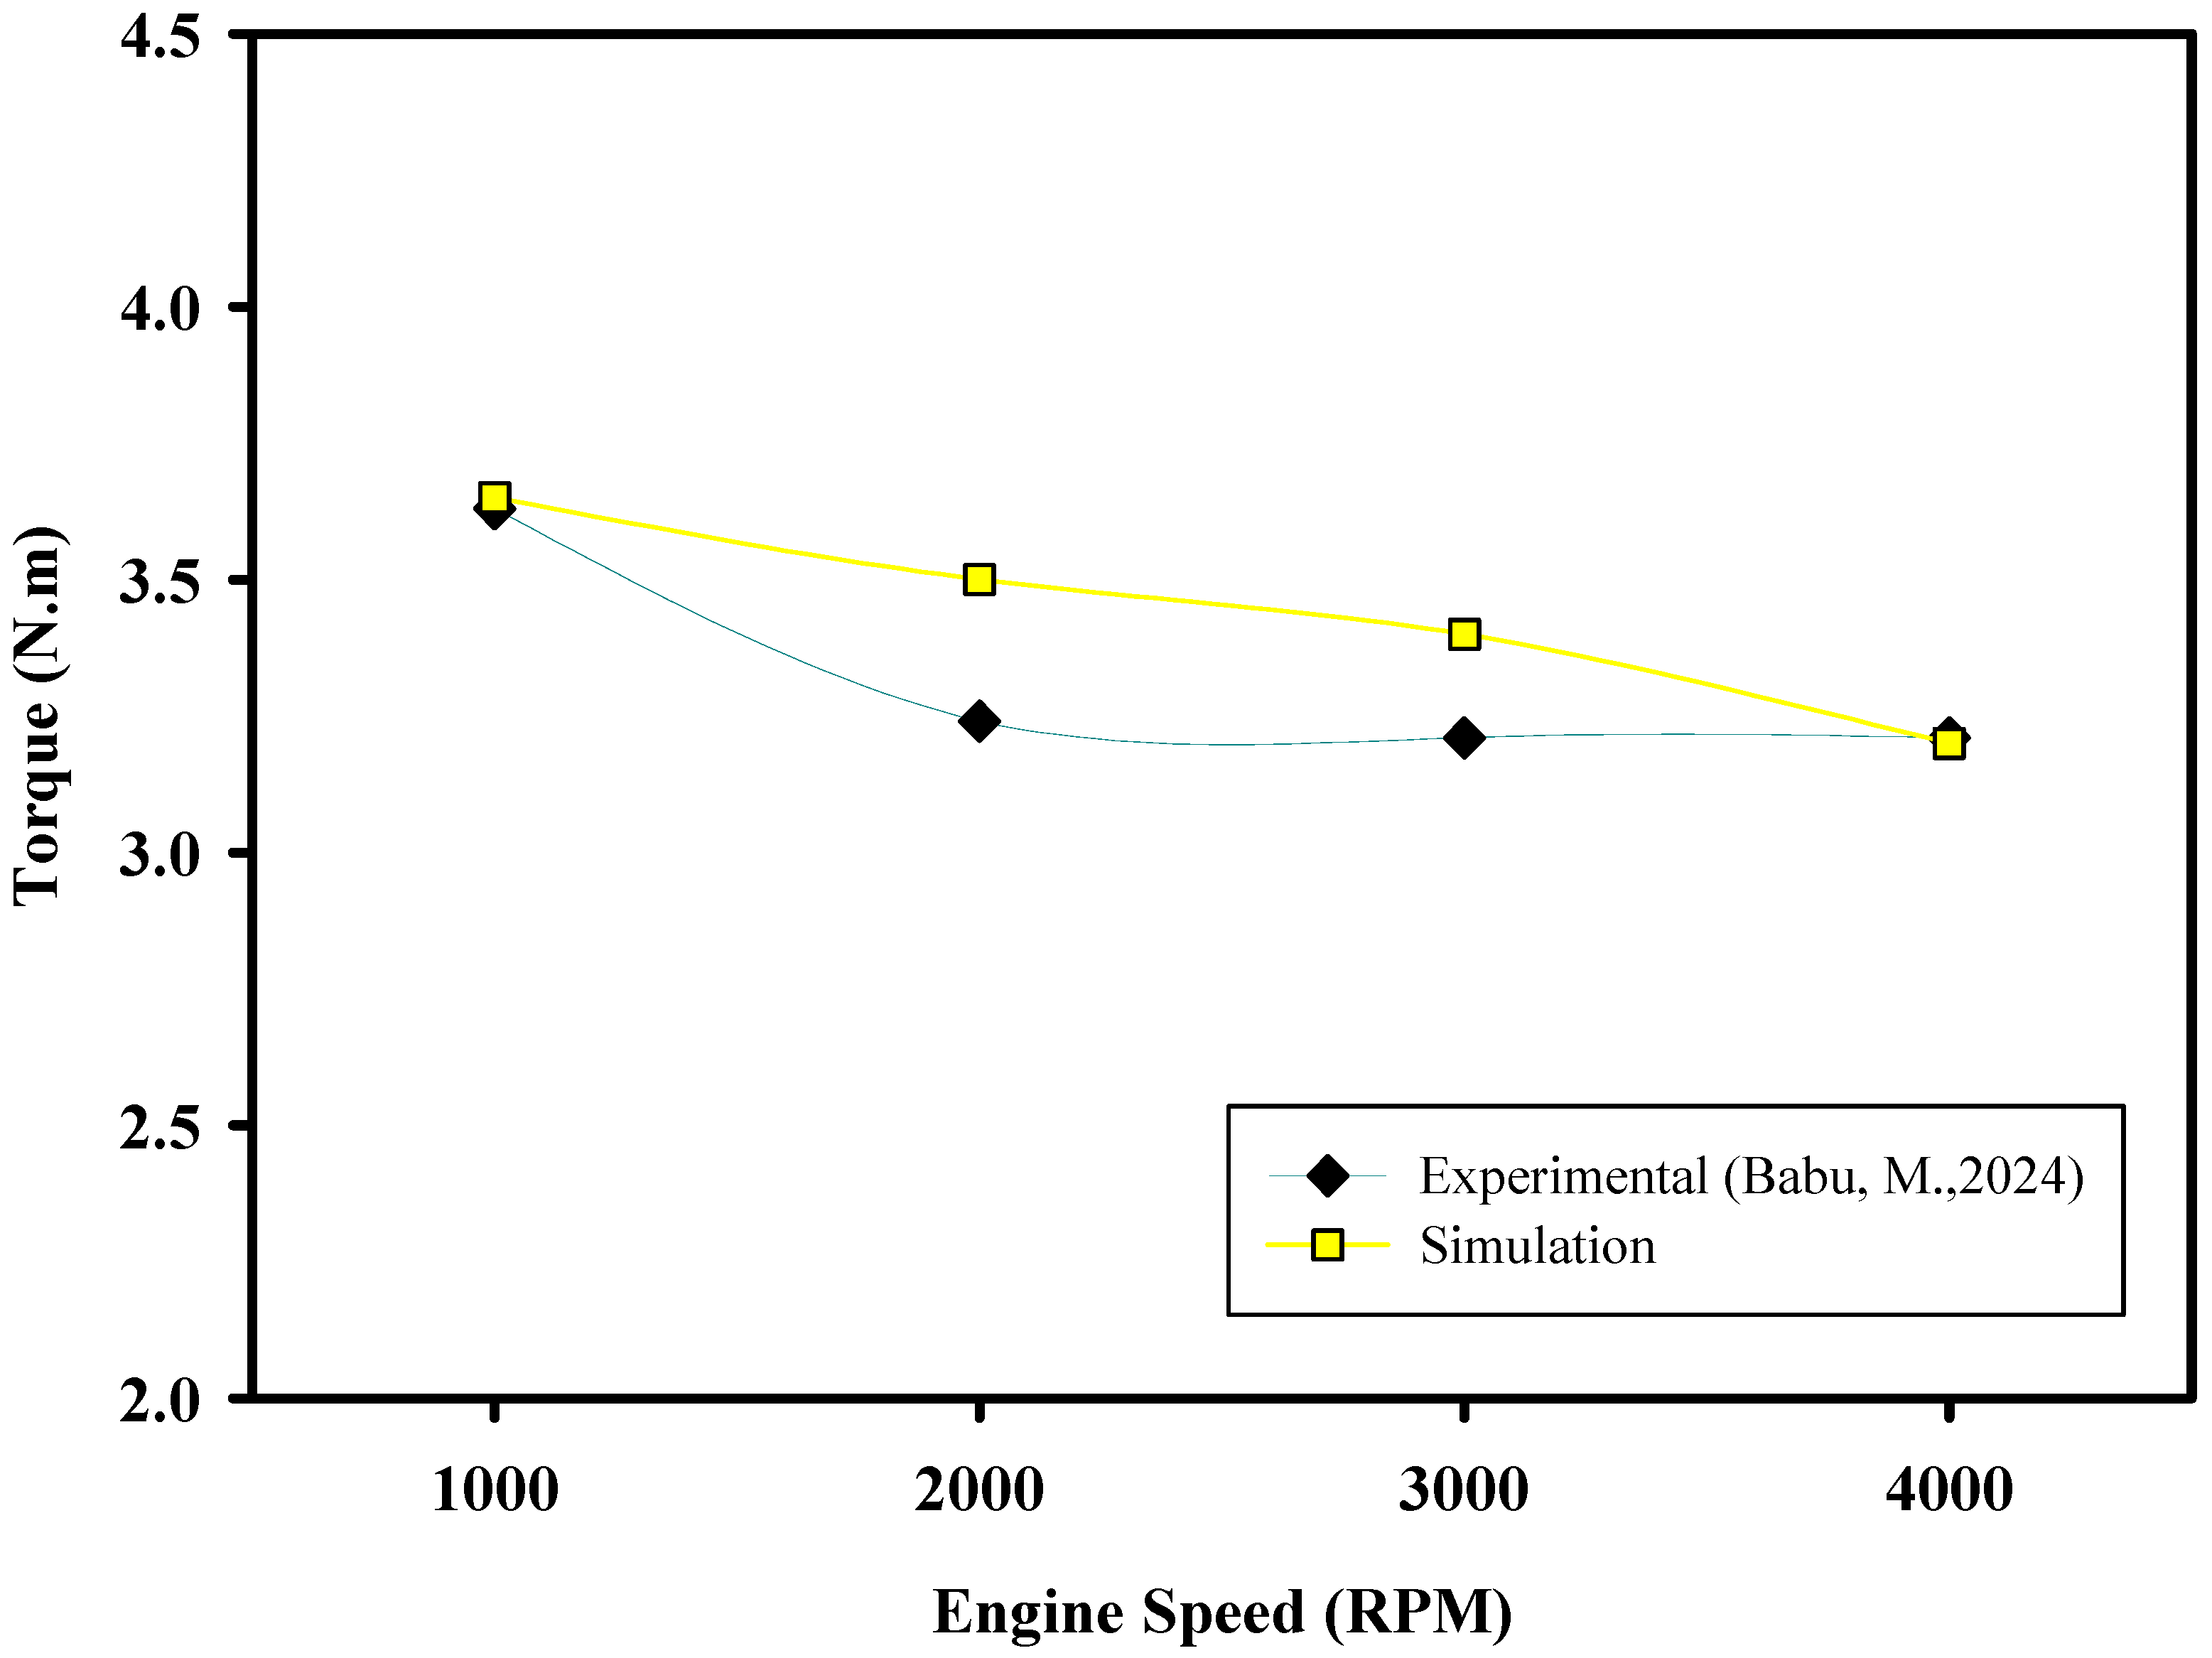
Figure 4.
Torque vs. Engine Speed (RPM) [11].
Figure 4 compares the experimental and simulated torque values. The simulated torque generally followed the experimental trend; although some deviations were observed at 1000 RPM, the experimental torque was 3.63 and the simulated value was 3.65, giving an error of 0.551% at 2000 RPM; the experimental and simulated values were 3.24 and 3.5, respectively, with an error of 8.0247% at 3000 RPM; the values were 3.21 and 3.4, corresponding to an error of 5.919%. The closest value was found at 4000 RPM, where the experimental torque was 3.21, and the simulated value was 3.2, resulting in an error of 0.3115%. The average percentage error for torque was 3.5458%.
The low average errors indicate that the simulation model reproduces both power and torque with good accuracy. For Power, the model underpredicted at 1000 and 2000 RPM and overpredicted at 3000 RPM. For torque, the model overpredicted at 2000 RPM and 3000 RPM and slightly underpredicted at 4000 RPM. Overall, the agreement shown in Figure 3 and Figure 4 supports the validity of the simulation model for the studied RPM range when compared with experimental data from reference [11]. The model exhibited a 10% error for power at 3000 RPM and an 8.024% error for power at 2000 RPM. However, the average percentage errors for power and torque remain low at 3.28% and 3.5458%, respectively, indicating that the model is generally reliable for the conditions examined.
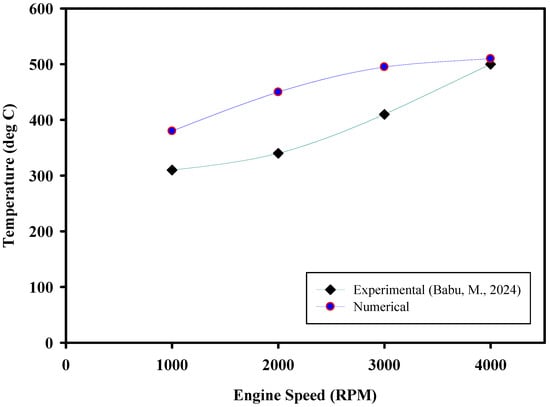
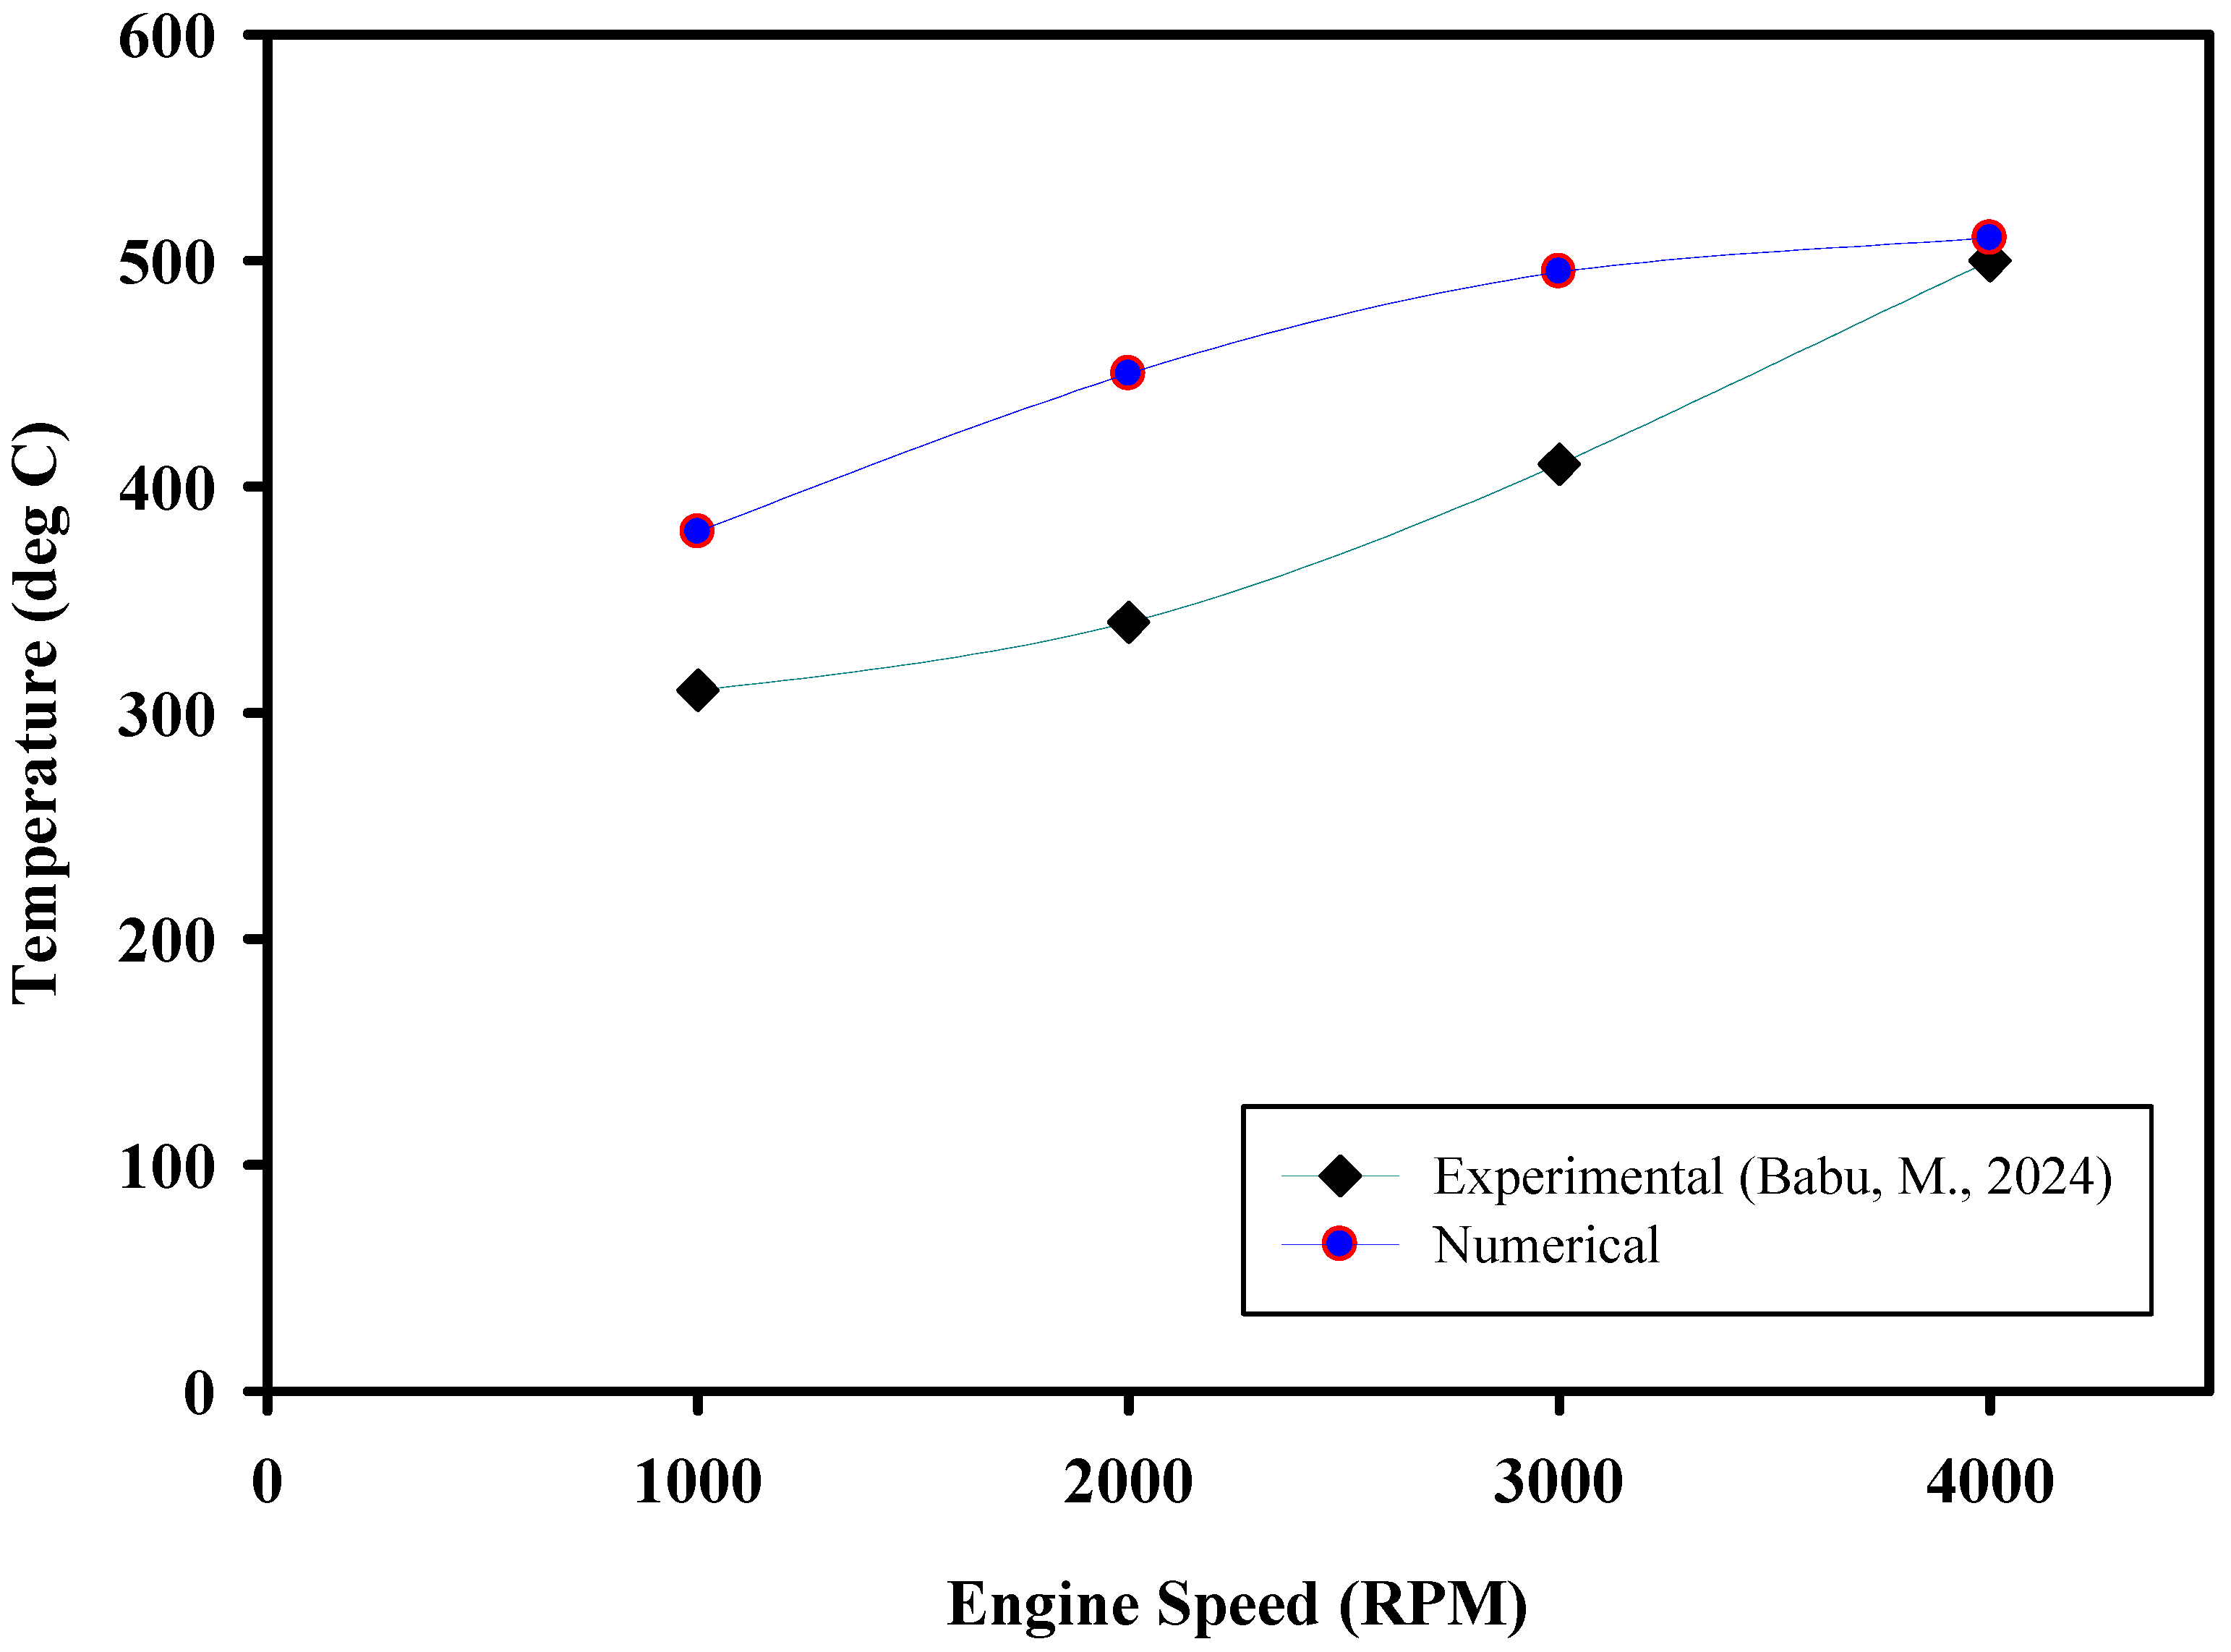
The numerical predictions were validated against experimental measurements obtained from the test engine. In particular, the exhaust gas temperature recorded during the experimental tests was compared with the corresponding numerical results to assess the accuracy of the developed model [11]. The maximum temperature was achieved at 510 °C at 4000 RPM. The error calculated in exhaust gas temperature is maximum at 1.96% at higher temperatures and 15% on average, as shown in Figure 5.
Figure 5.
Exhaust Gas Temperature vs. Engine Speed (RPM) [11].
3.2. The Effect of Bioethanol–Gasoline Blends on Engine Torque with Varying Engine Speed
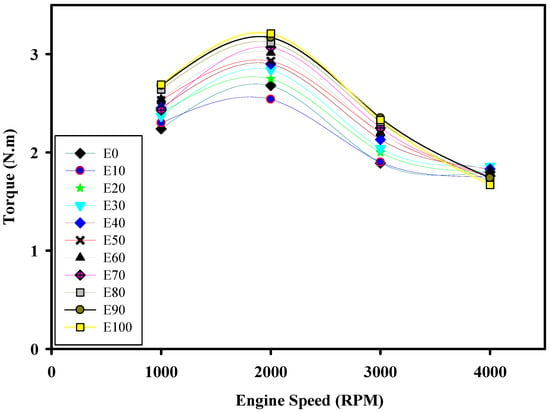
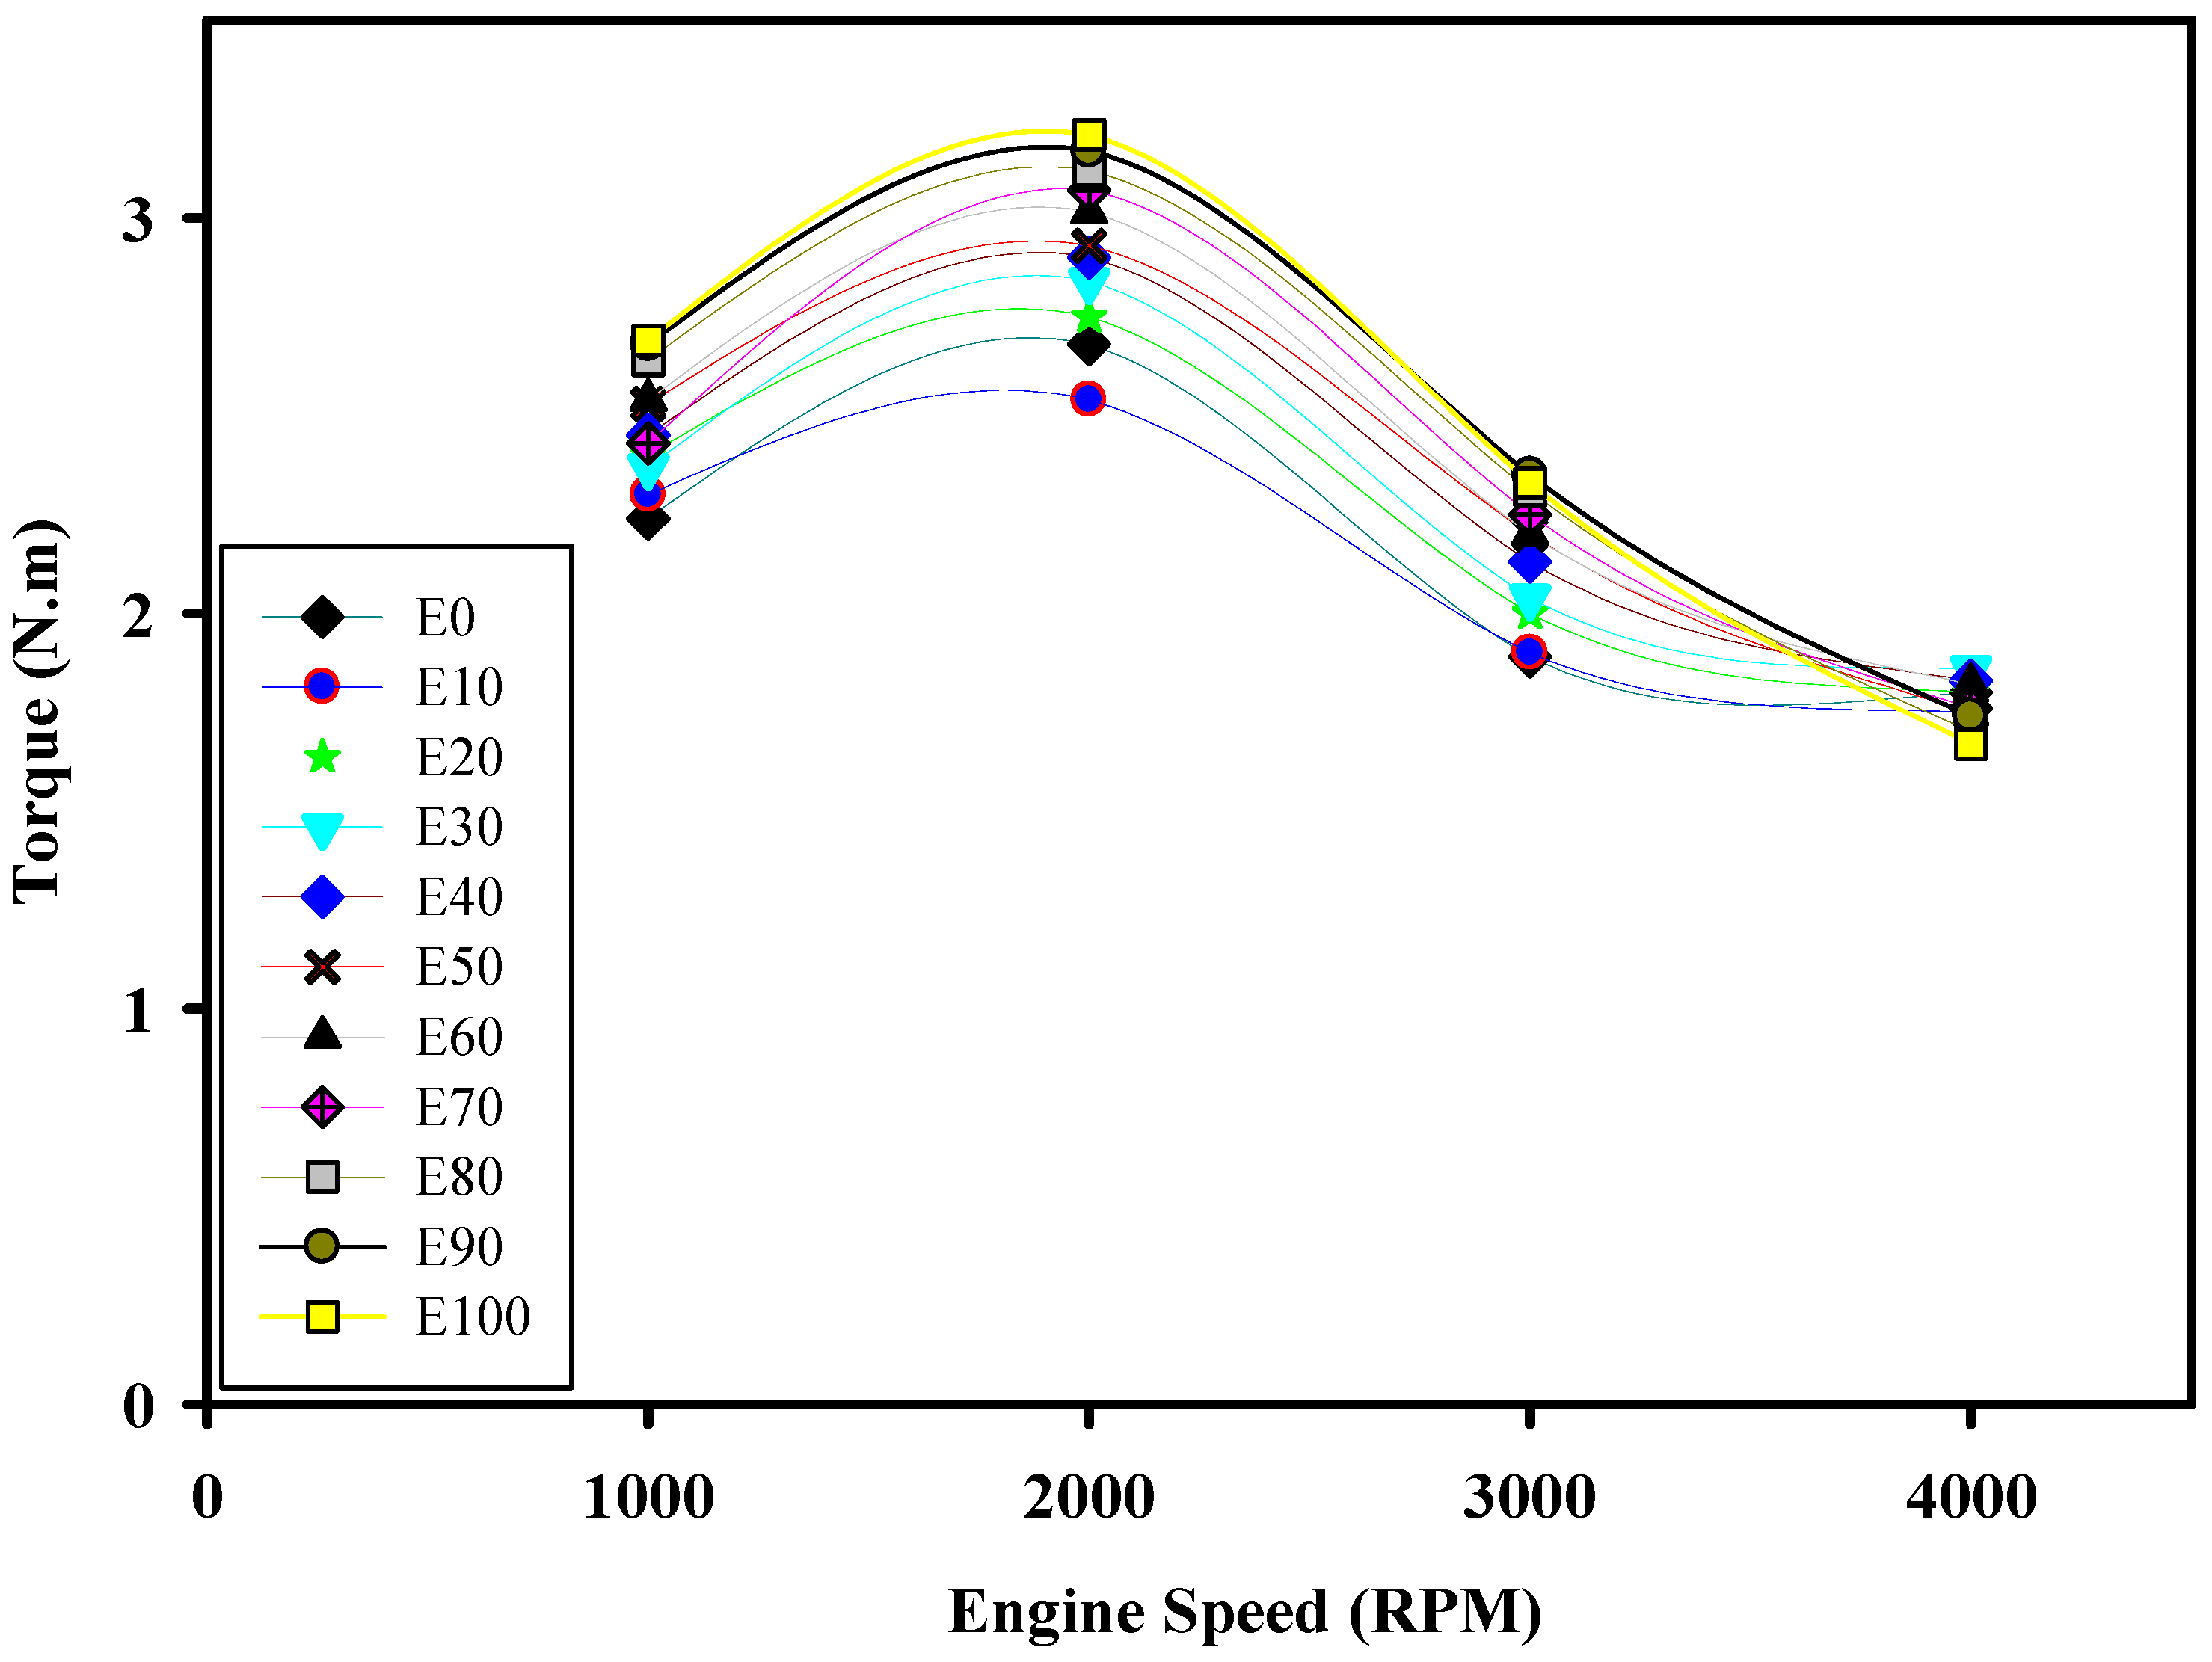
A maximum torque of 3.21 N.m was obtained at an engine speed of 2000 RPM, representing a 16.51% improvement over the torque produced when operating with pure gasoline. But at 4000 RPM. The E20 and E30 are observed to have slightly more torque than other blends, as shown in Figure 6. The blends observed the torque decrease gradually after 2000 RPM. The E30 blend showed 3.22% more torque than gasoline and 10.21% more torque than ethanol at higher speeds. Still, ethanol–gasoline blends affect the engine torque because ethanol has a high-octane rating and faster flame speed than gasoline, which can lead to increased torque at lower engine speeds due to improved combustion efficiency and decreased torque at higher engine speeds due to reduced fuel density and energy content. Single-cylinder spark ignition engines can attain more torque at higher speeds with the E30 blend, according to Figure 6, but before 3000 RPM, the blends E30 and E20 are both observed to be in the medium torque range rather than other blends. The blend of E10 and gasoline (E0) showed the lowest torque in this motorcycle engine. So, the blend E20 shows a medium range of torque at all engine speeds.
Figure 6.
Torque vs. Engine Speed.
3.3. The Effect of Bioethanol–Gasoline Blends on Engine Power with Varying Engine Speed
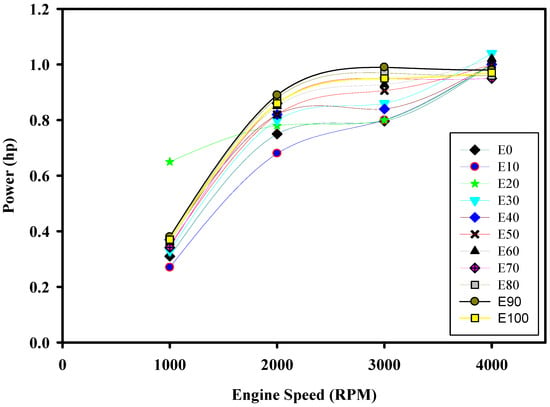
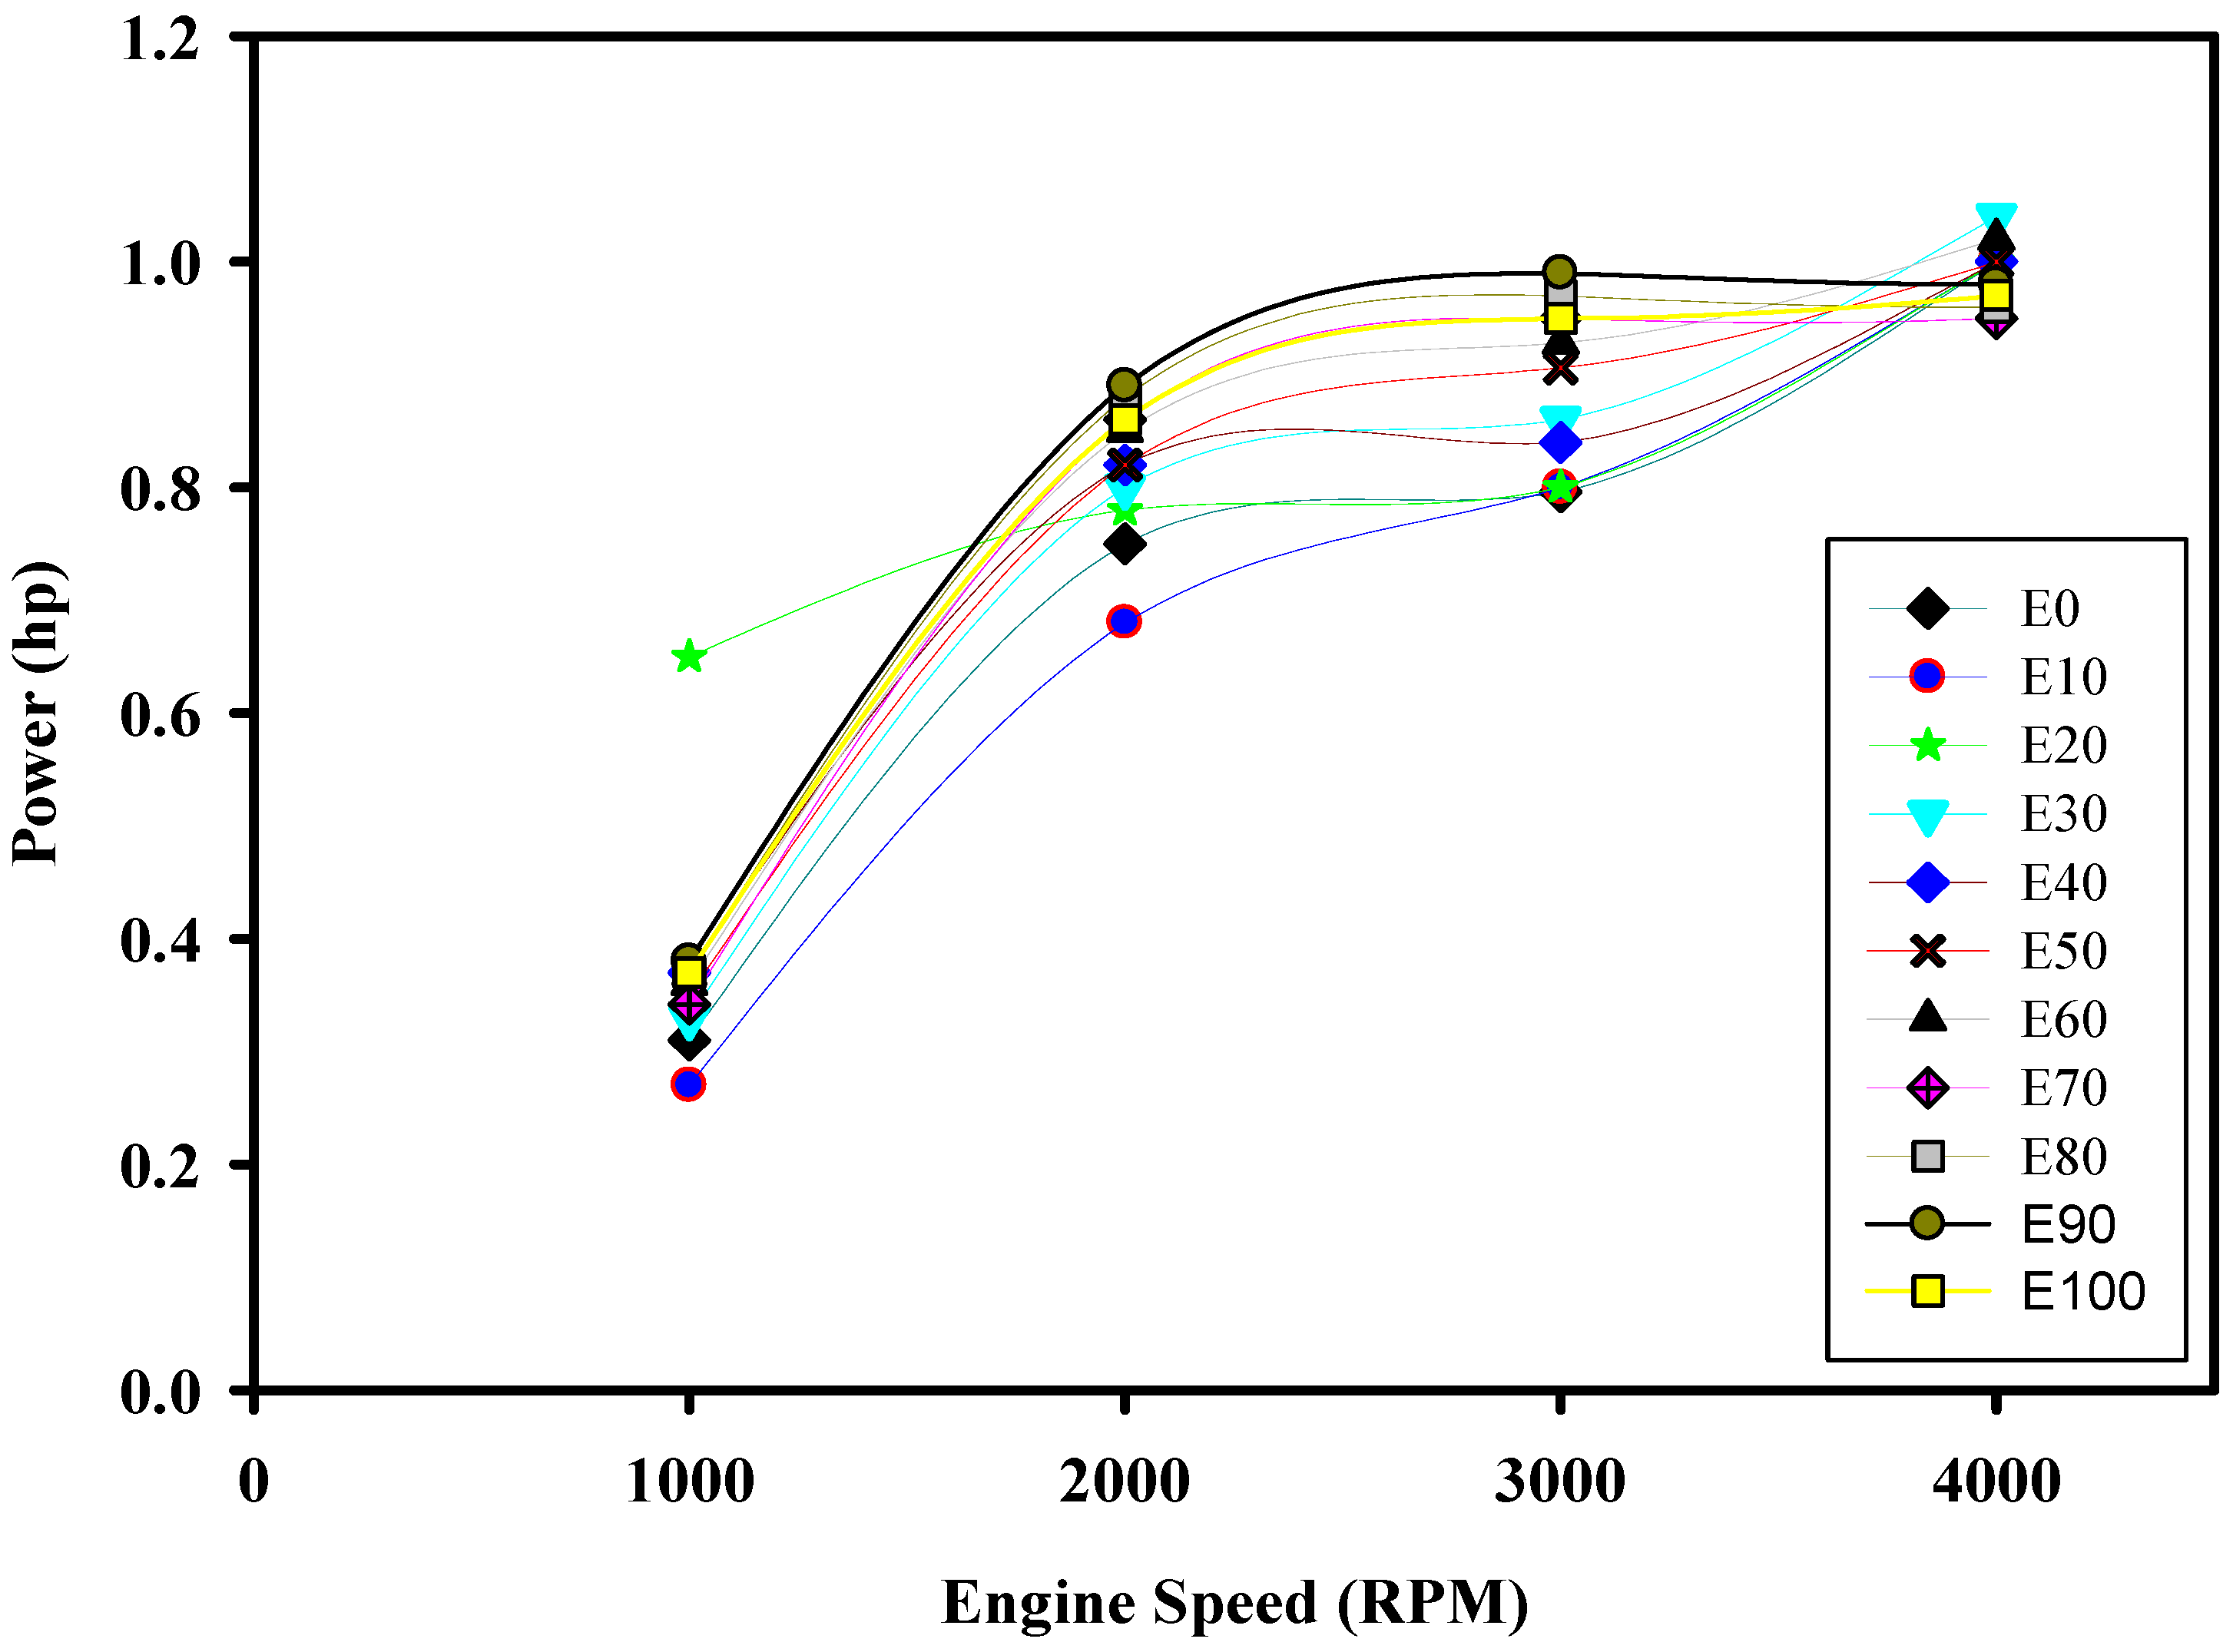
The results obtained show that the power rises progressively with increasing ethanol in the mixture of blends. However, at a low speed of 1000 RPM, the E20 mixture generates 52.31% more power than gasoline, which is a good sign for using E20. The E30 blend offers 3.84% more than gasoline and 6.73% more than pure ethanol power at 4000 RPM, but at lower engine speeds, power decreases. Because the ethanol has higher volatility, it expands more efficiently in E20 and burns efficiently to produce peak power at 1000 RPM. At lower engine speeds, the E20 has more time to combust, which produces more powerful results than other blends. The other reason E20 blends high power at lower speeds is that the best blend provides suitable volatility at this time, which causes highly efficient combustion. The observed power of the engine for gasoline and blends is shown in the chart below in Figure 7. The present results show that moderate ethanol blends improve engine power and torque. Similar trends have been reported in recent studies using ethanol–gasoline blends in spark-ignition engines [27,28].
Figure 7.
Power vs. Engine Speed.
3.4. The Effect of Bioethanol–Gasoline Blends on Engine Brake Mean Effective Pressure (BMEP) with Varying Engine Speed
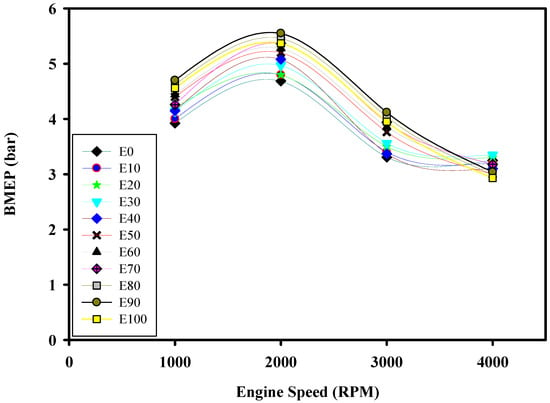
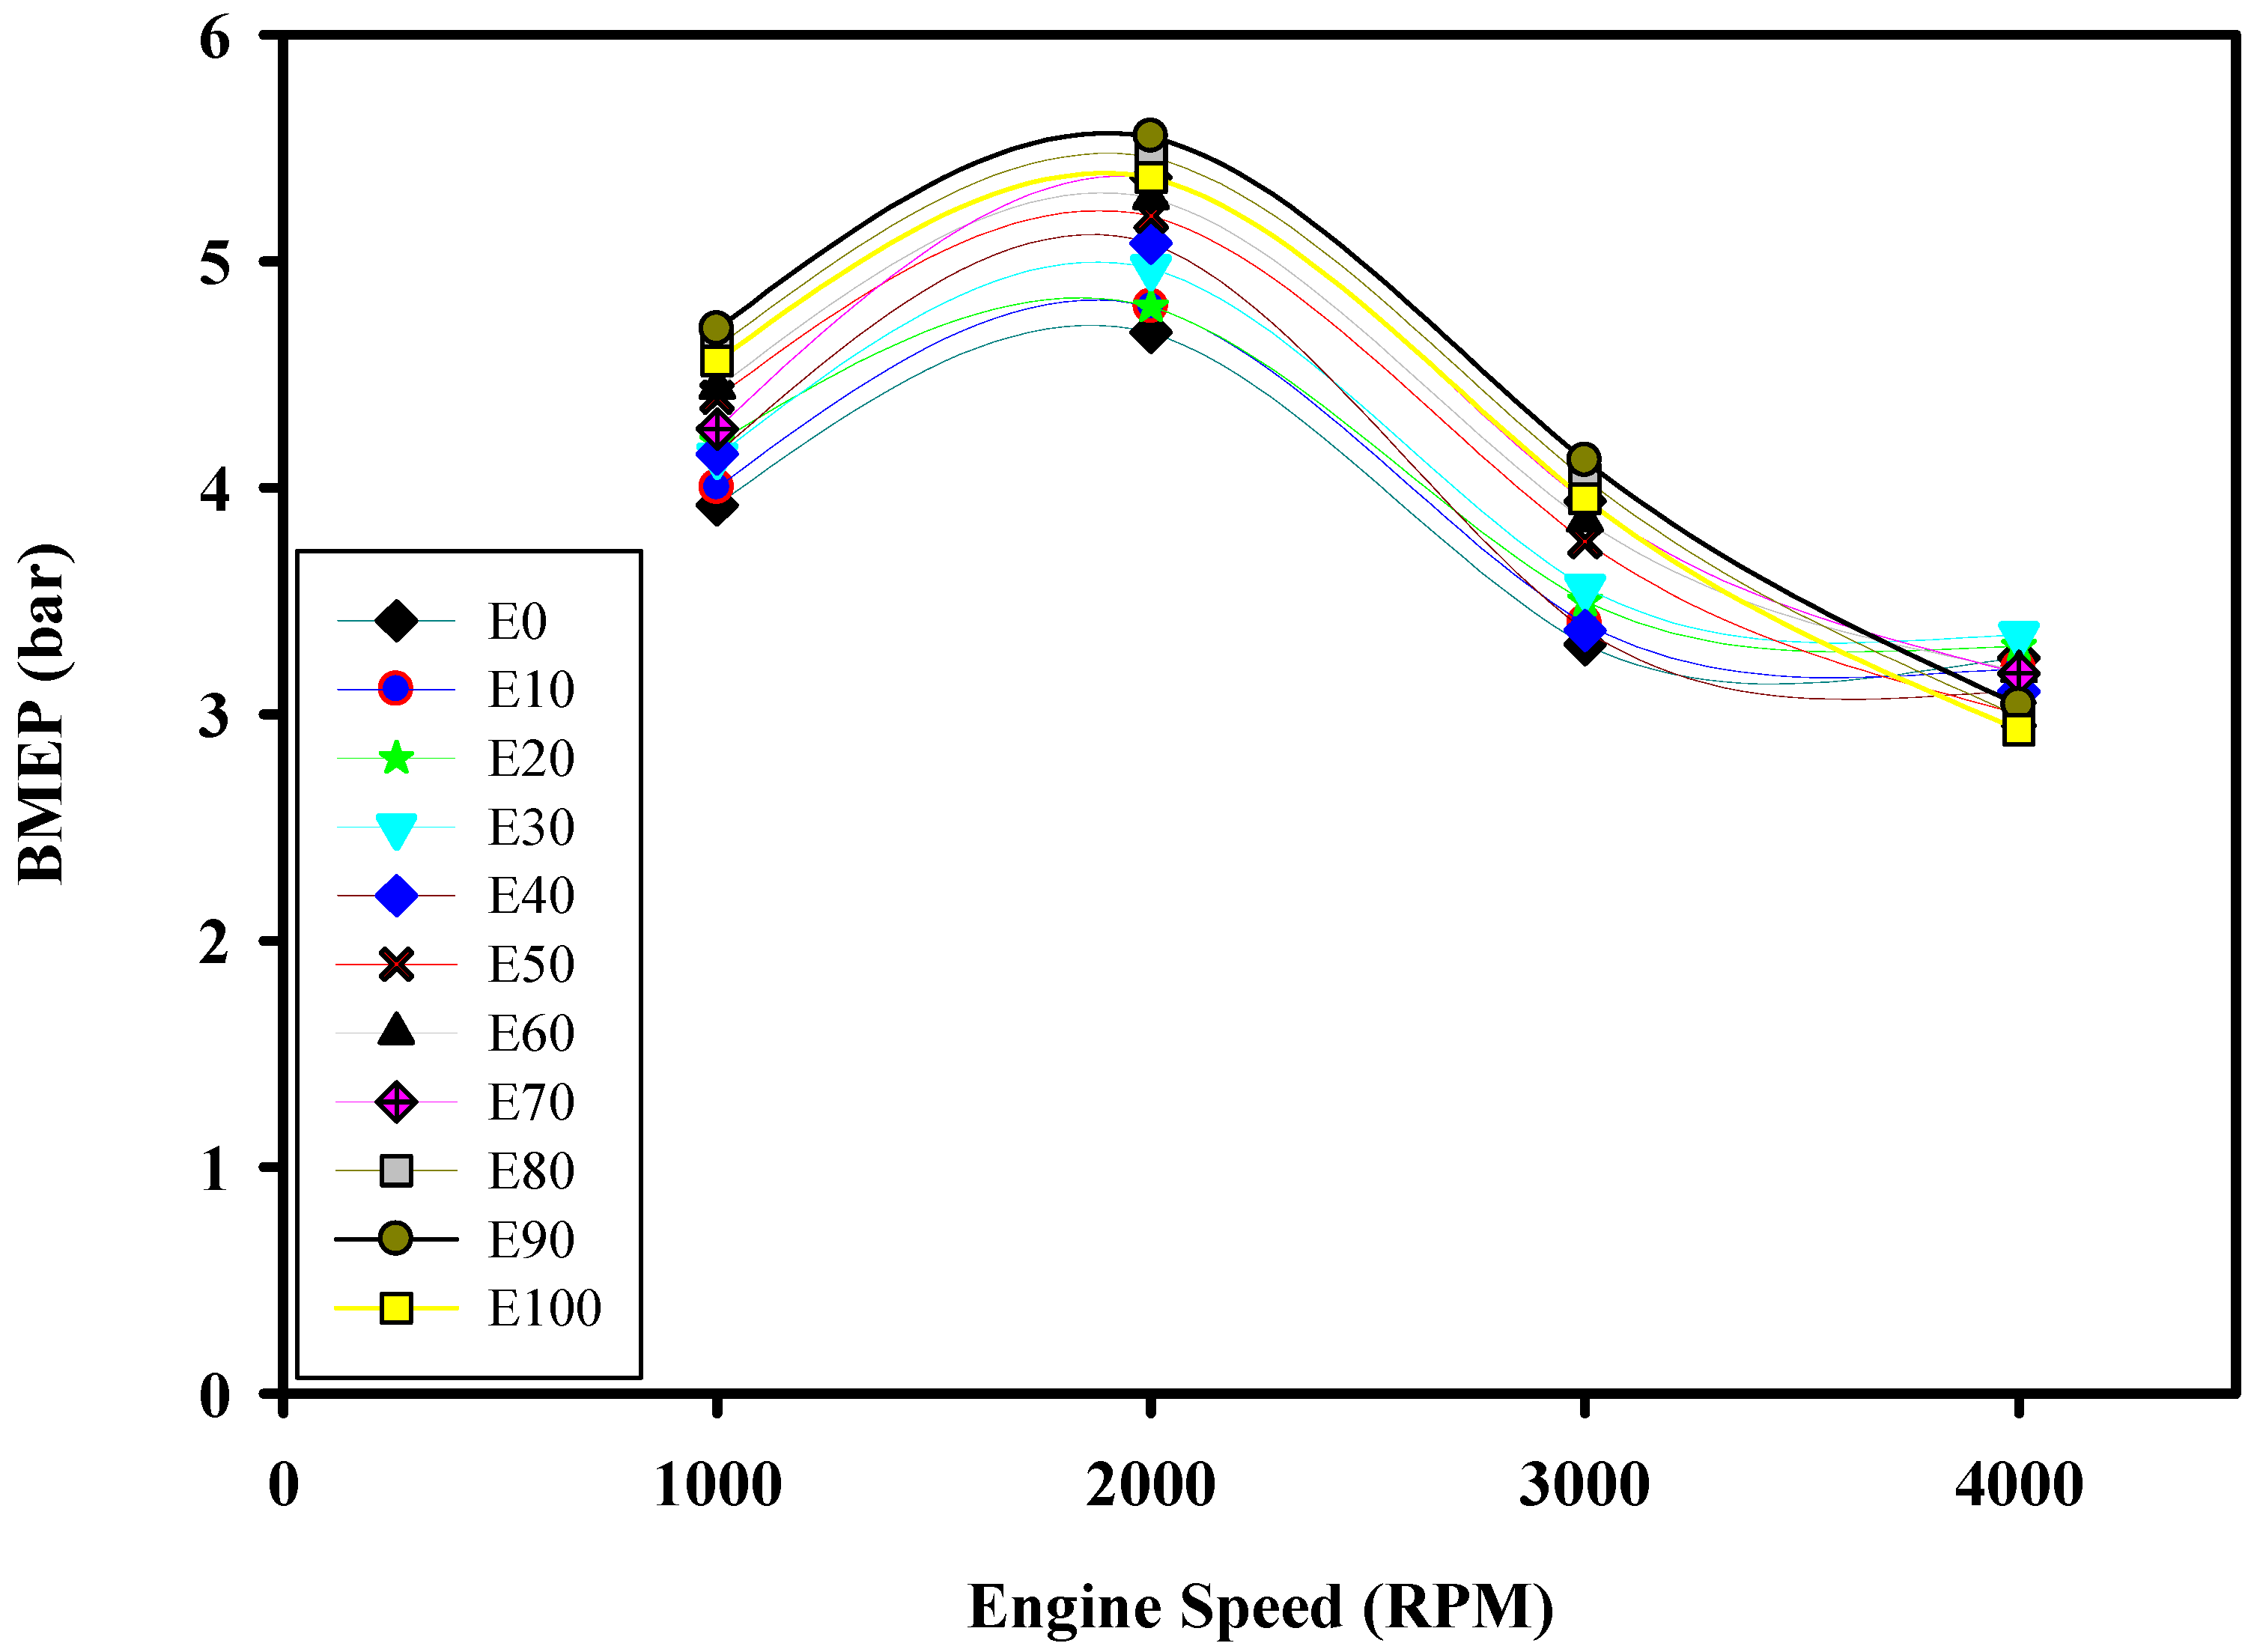
The observed results indicate that the E90 fuel blend provides a brake mean effective pressure (BMEP) that is 15.57% higher than gasoline at 2000 RPM, achieving the highest BMEP at this speed. Contrarily, the BMEP of the E30 mixture attains its peak at 4000 RPM, showing a rise of 2.98% in comparison with gasoline and 12.54% in relation to ethanol. The changes in BMEP were taken at various speeds of the engine using different fuel mixtures, as shown in Figure 8.
Figure 8.
BMEP vs. Engine Speed.
3.5. The Effect of Bioethanol–Gasoline Blends on Engine Brake Specific Fuel Consumption (BSFC) with Varying Engine Speed
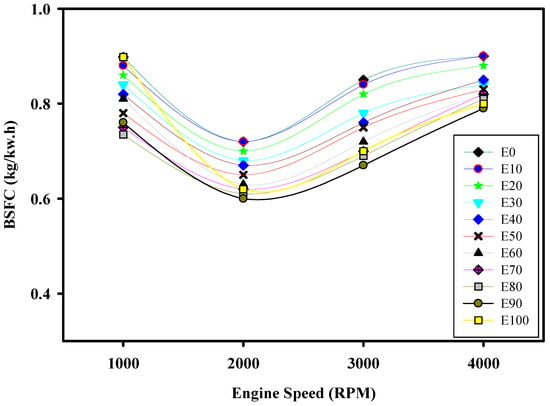
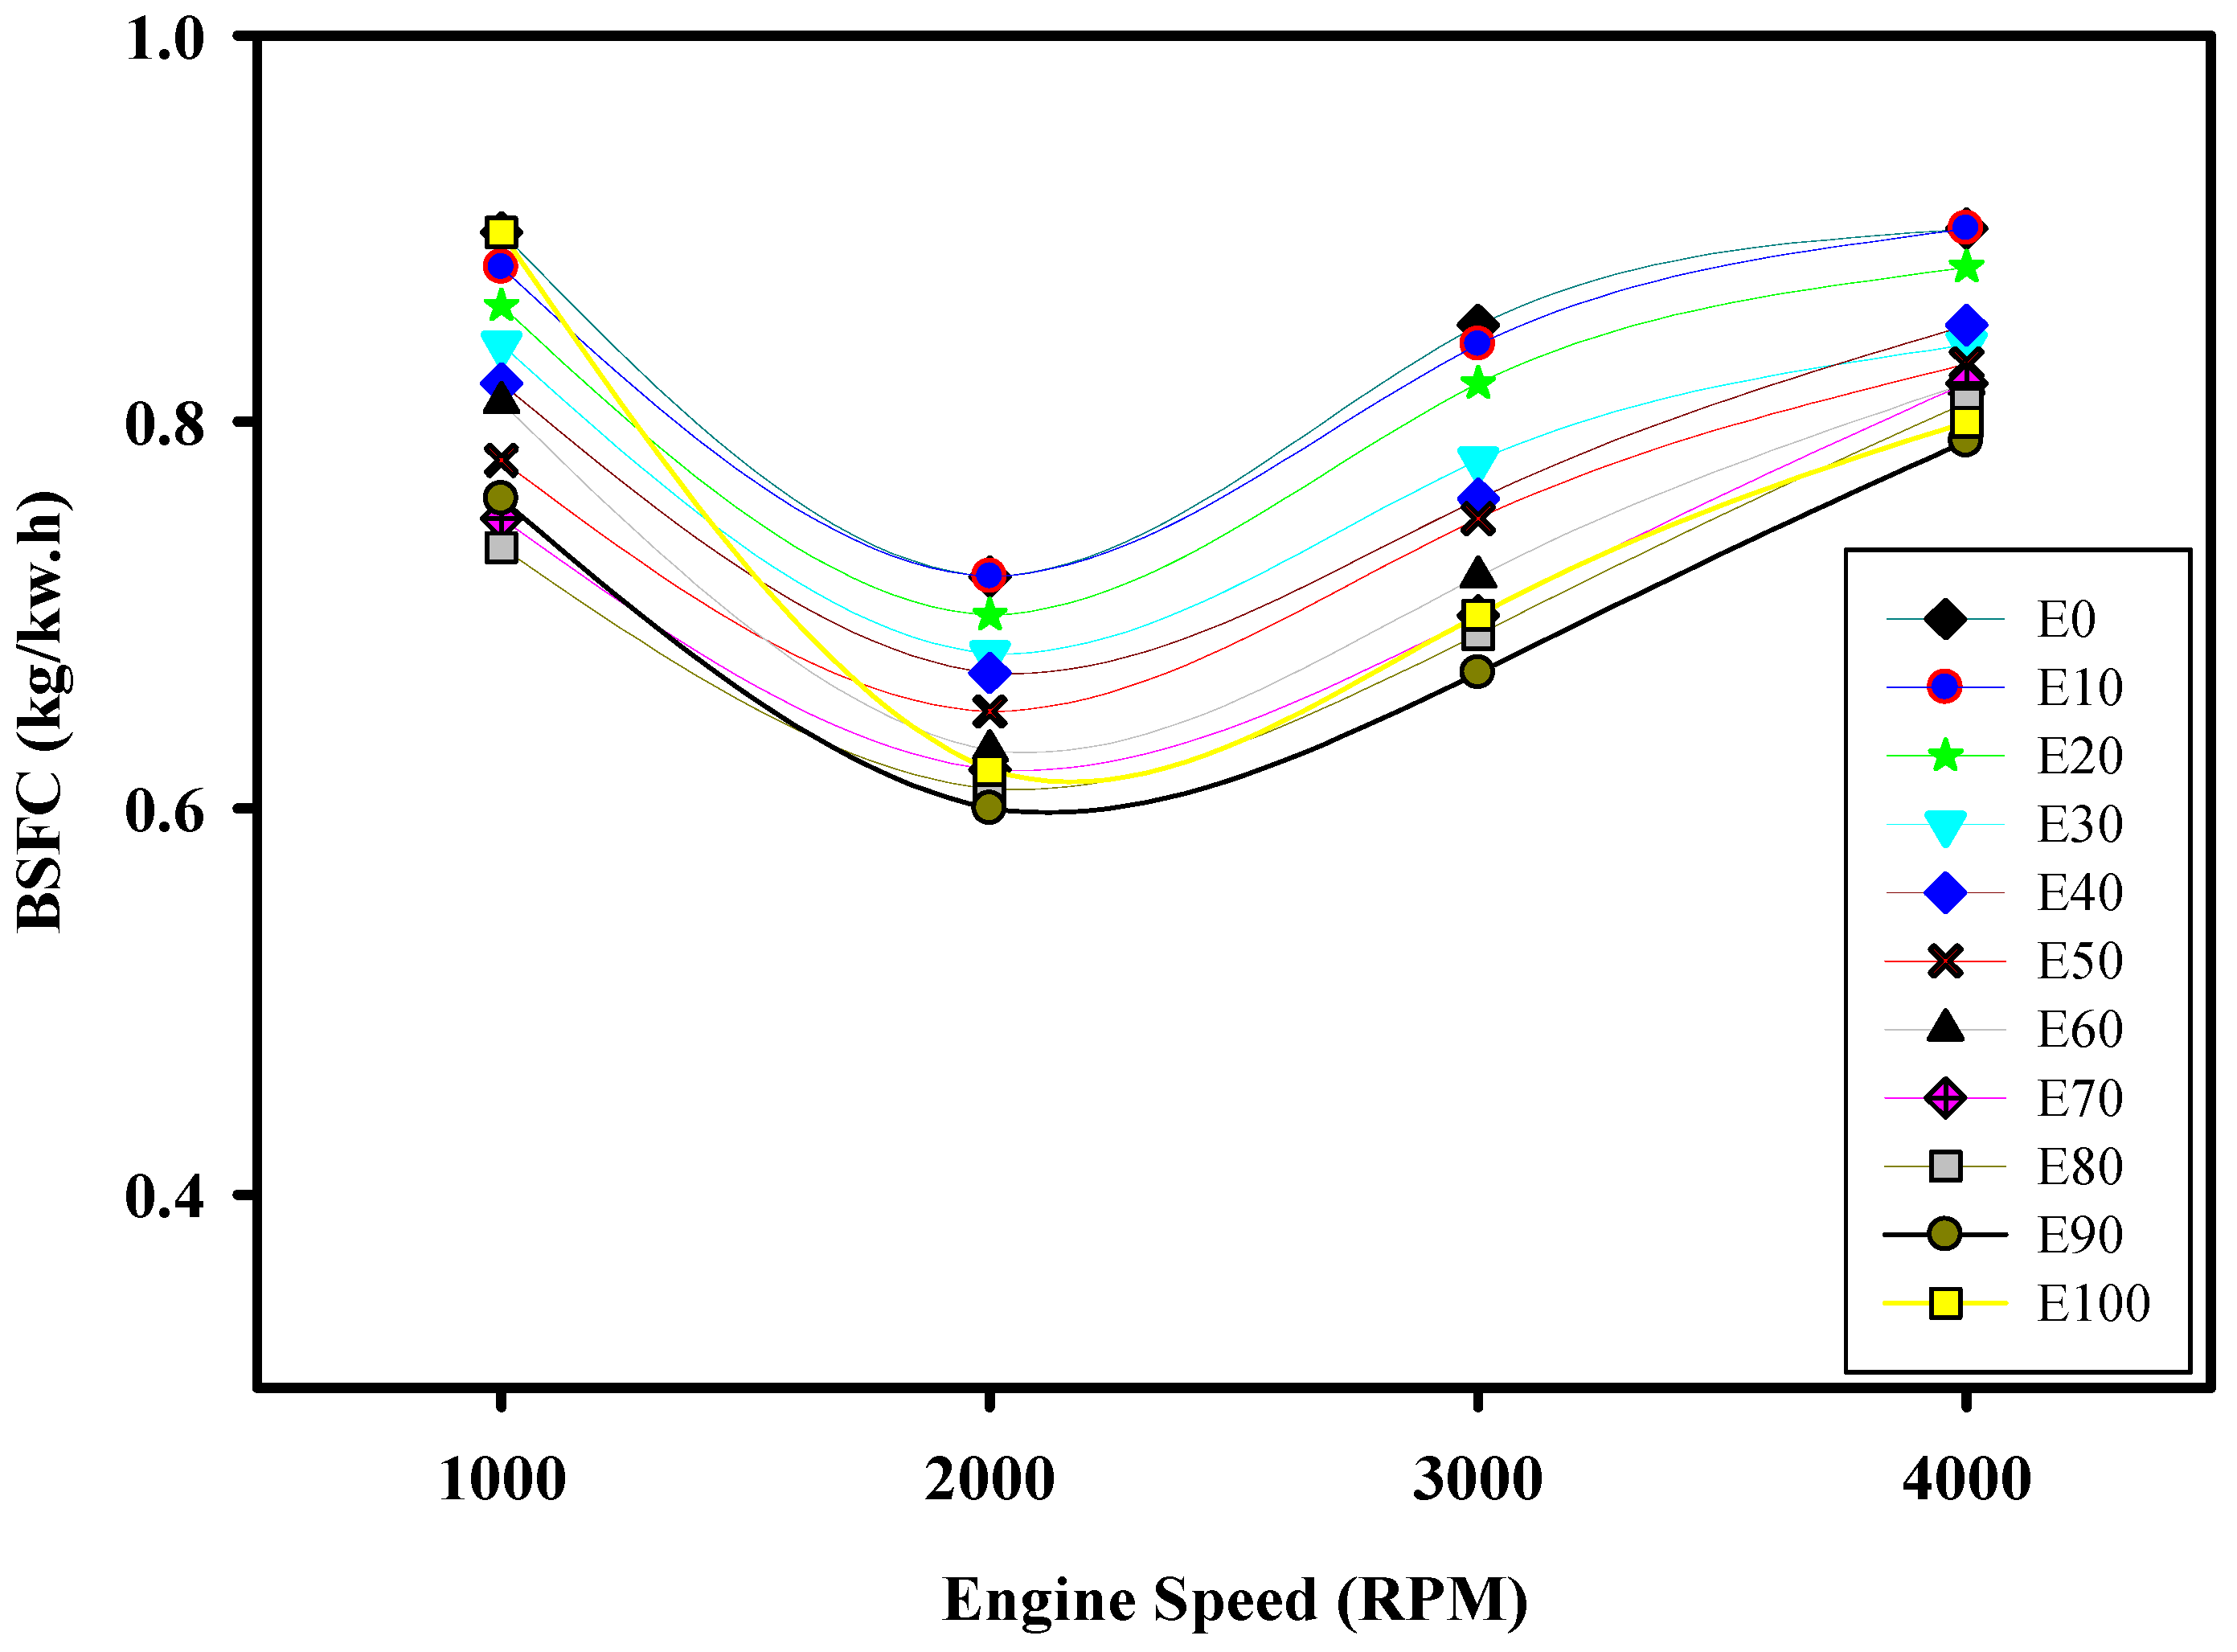
The normal BSFC values lie between 0.6 and 0.9 kg/kw.h. In cases where the speed is relatively low, such as 1000 RPM, the E100 blend has the highest value of BSFC. On the other hand, at higher speeds, for example, 4000 RPM, E10 and E40 blends have the maximum BSFC values. This is largely attributed to the fact that 100% ethanol has 33% less energy per unit volume than 100% gasoline. In addition, the amount of oxygen present in ethanol plays a big role in combustion efficiency. Lower BSFC values are desirable, and this is evident at 2000 RPM, where the E100 blend has a high BSFC. It should be noted that the BSFC of an engine depends on many things, including the size of the engine. BSFC values are shown in Figure 9.
Figure 9.
BSFC vs. Engine Speed.
3.6. The Effect of Bioethanol–Gasoline Blends on Engine Fuel Consumption (Kg/h) with Varying Engine Speed
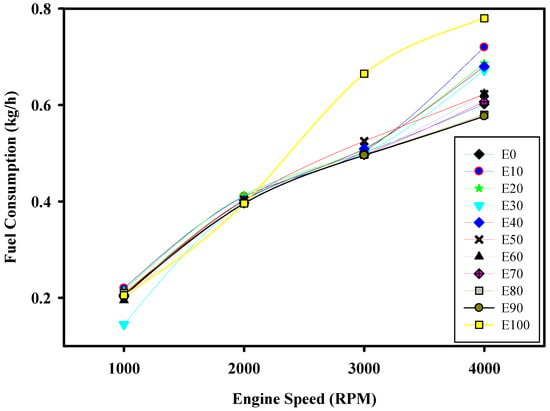
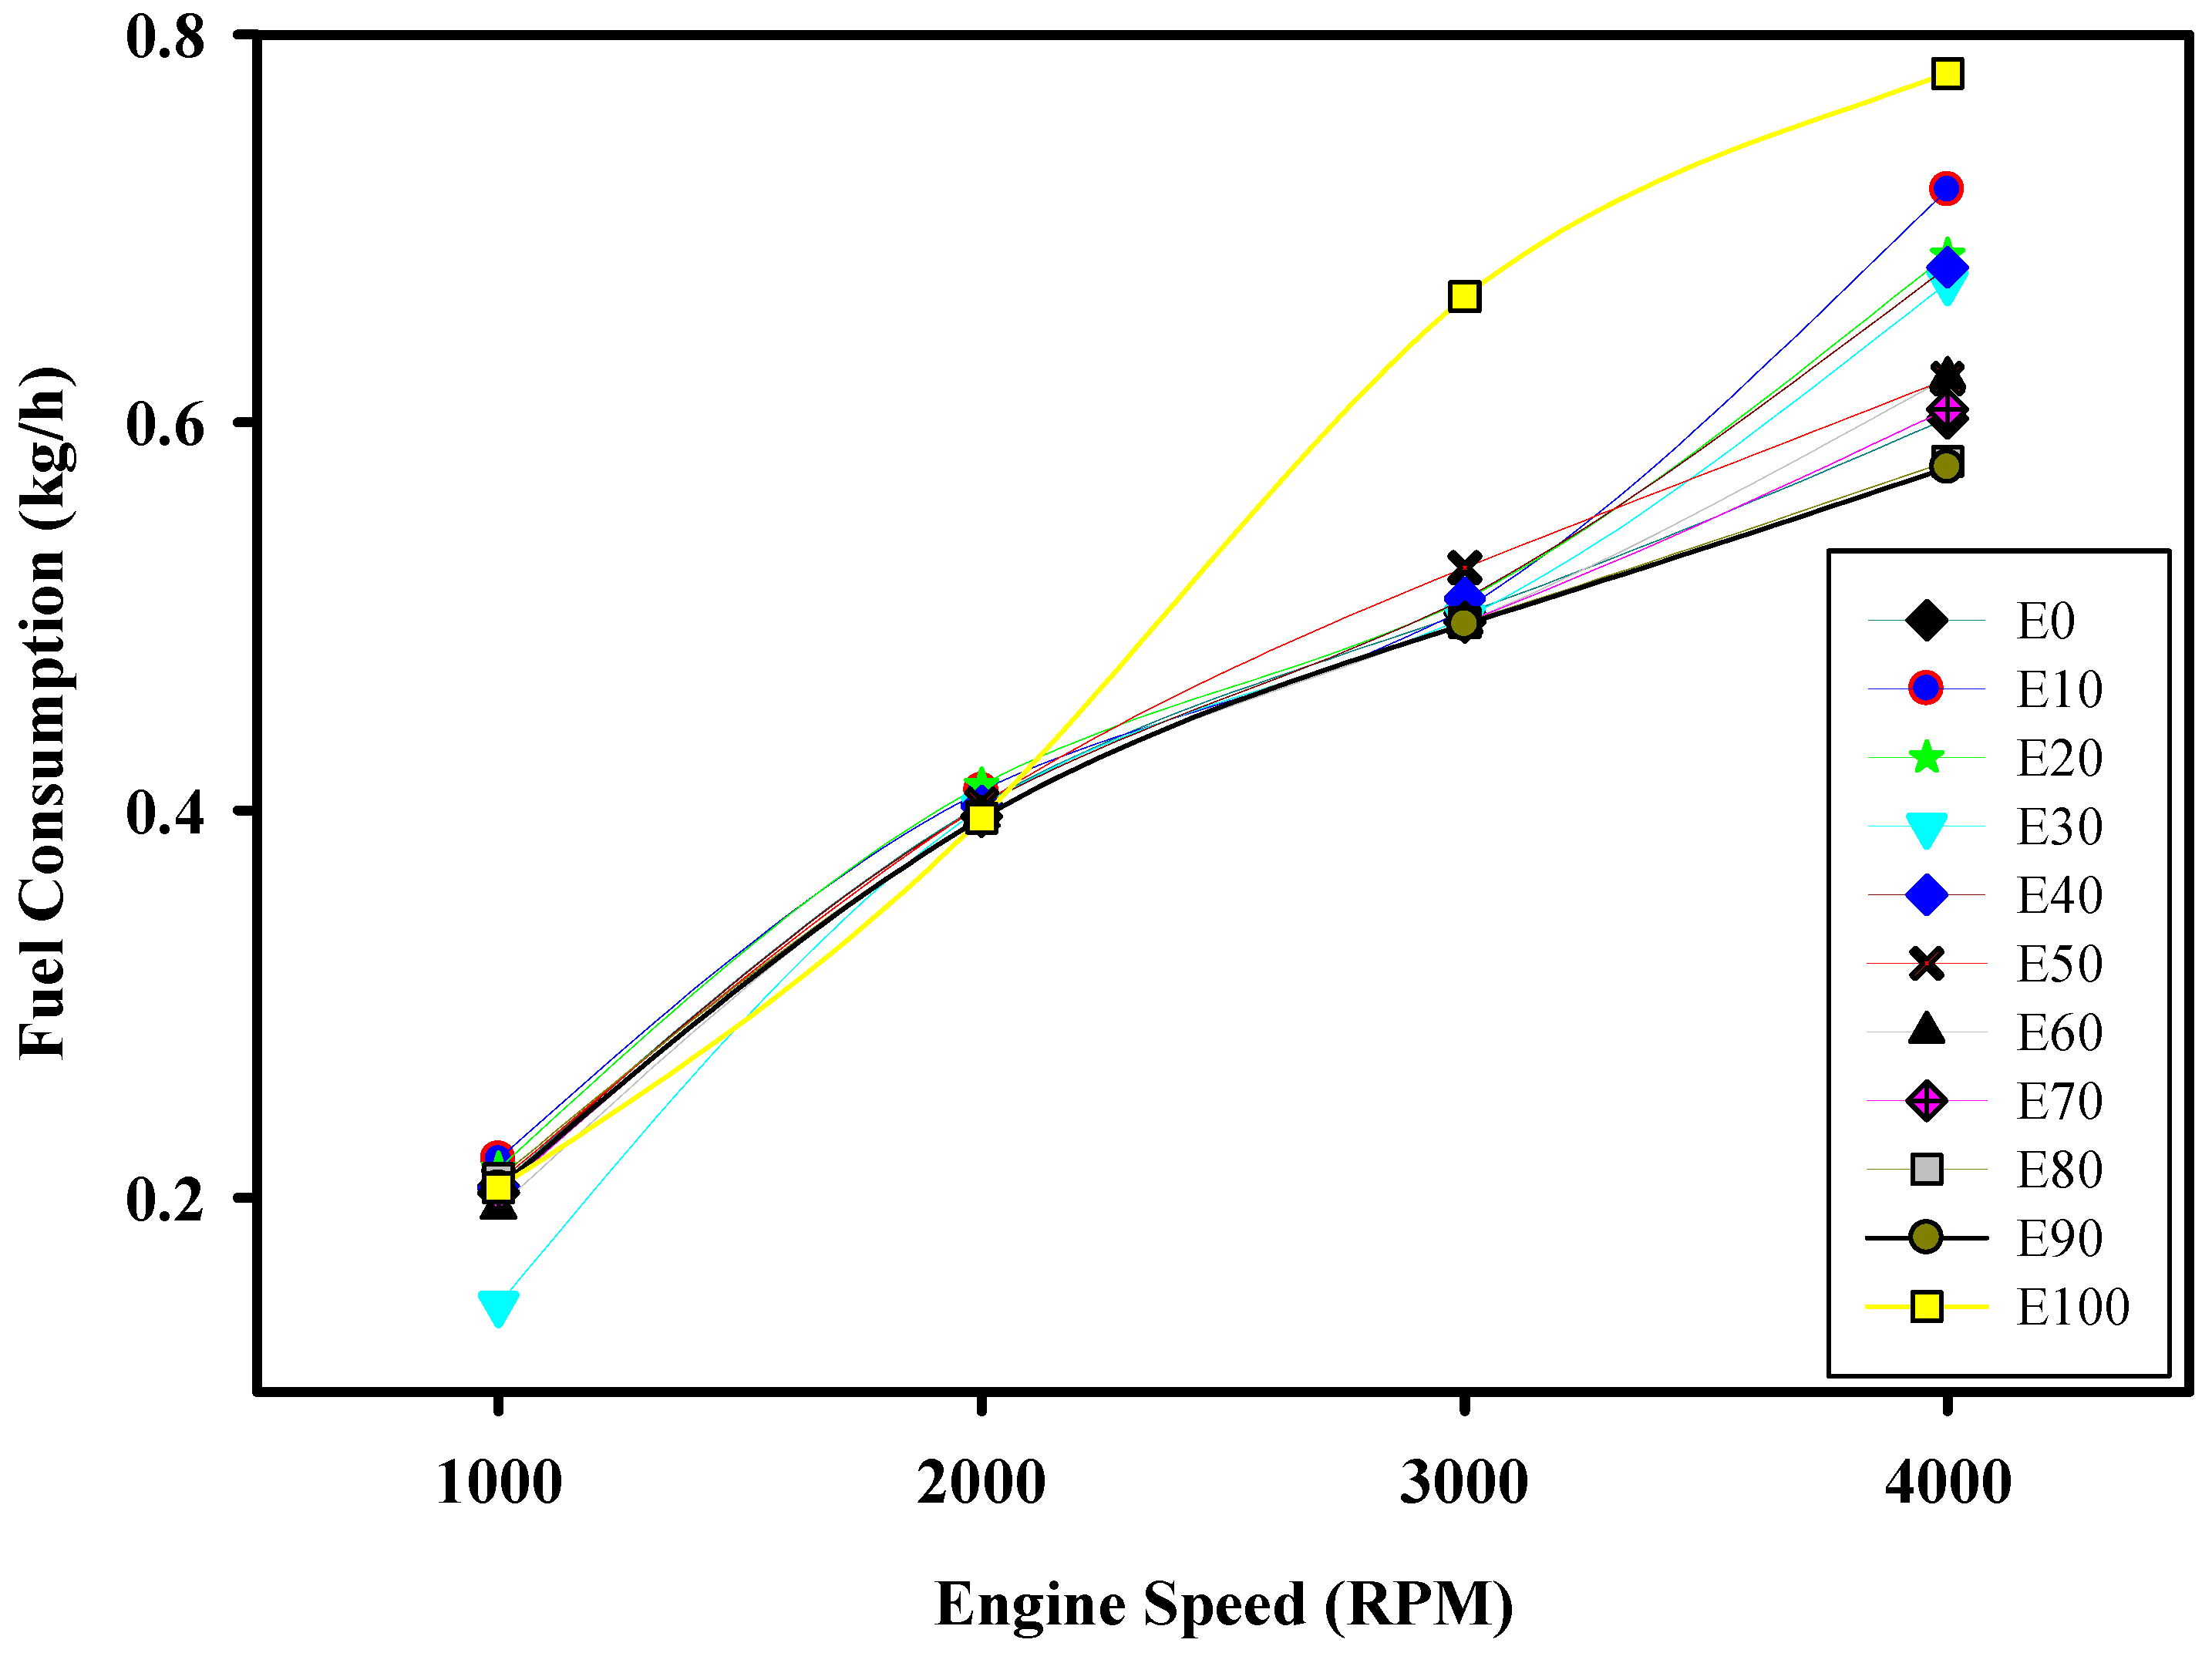
Fuel consumption, in kg/h, is the rate of usage of fuel by the engine. The usage of fuel for pure ethanol (E100) is 23.08% higher than that of pure gasoline at higher RPM. This is because of the higher heat of vaporization in ethanol. Fuel consumption in all other blends shows lower consumption at lower RPM, but E30 is the blend that consumes the minimum fuel at lower RPM. Consumption of fuel in E20 shows normal consumption, which increases beyond 3000 RPM. E90 is recommended to be used with other blends of fuel. Gasoline shows low consumption at 4000 RPM. Illustrated in Figure 10.
Figure 10.
Fuel Consumption vs. Engine Speed.
Interestingly, fuel consumption for both fuels is almost similar at 2000 RPM, but beyond 2000 RPM, fuel consumption becomes higher for ethanol. It is important to keep in mind that ethanol fuel has 33% less energy compared to pure gasoline fuel because of its higher octane level. The other thing is that ethanol evaporates faster than gasoline, which further adds to high fuel consumption. The observed variation in BSFC with increasing ethanol content is consistent with previous investigations, which have reported increased fuel consumption at higher ethanol concentrations due to the lower heating value of ethanol [27,28].
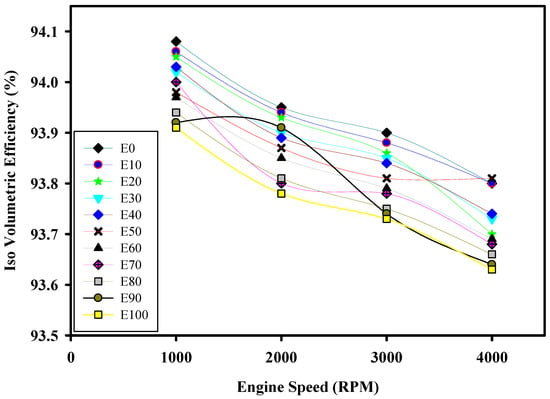
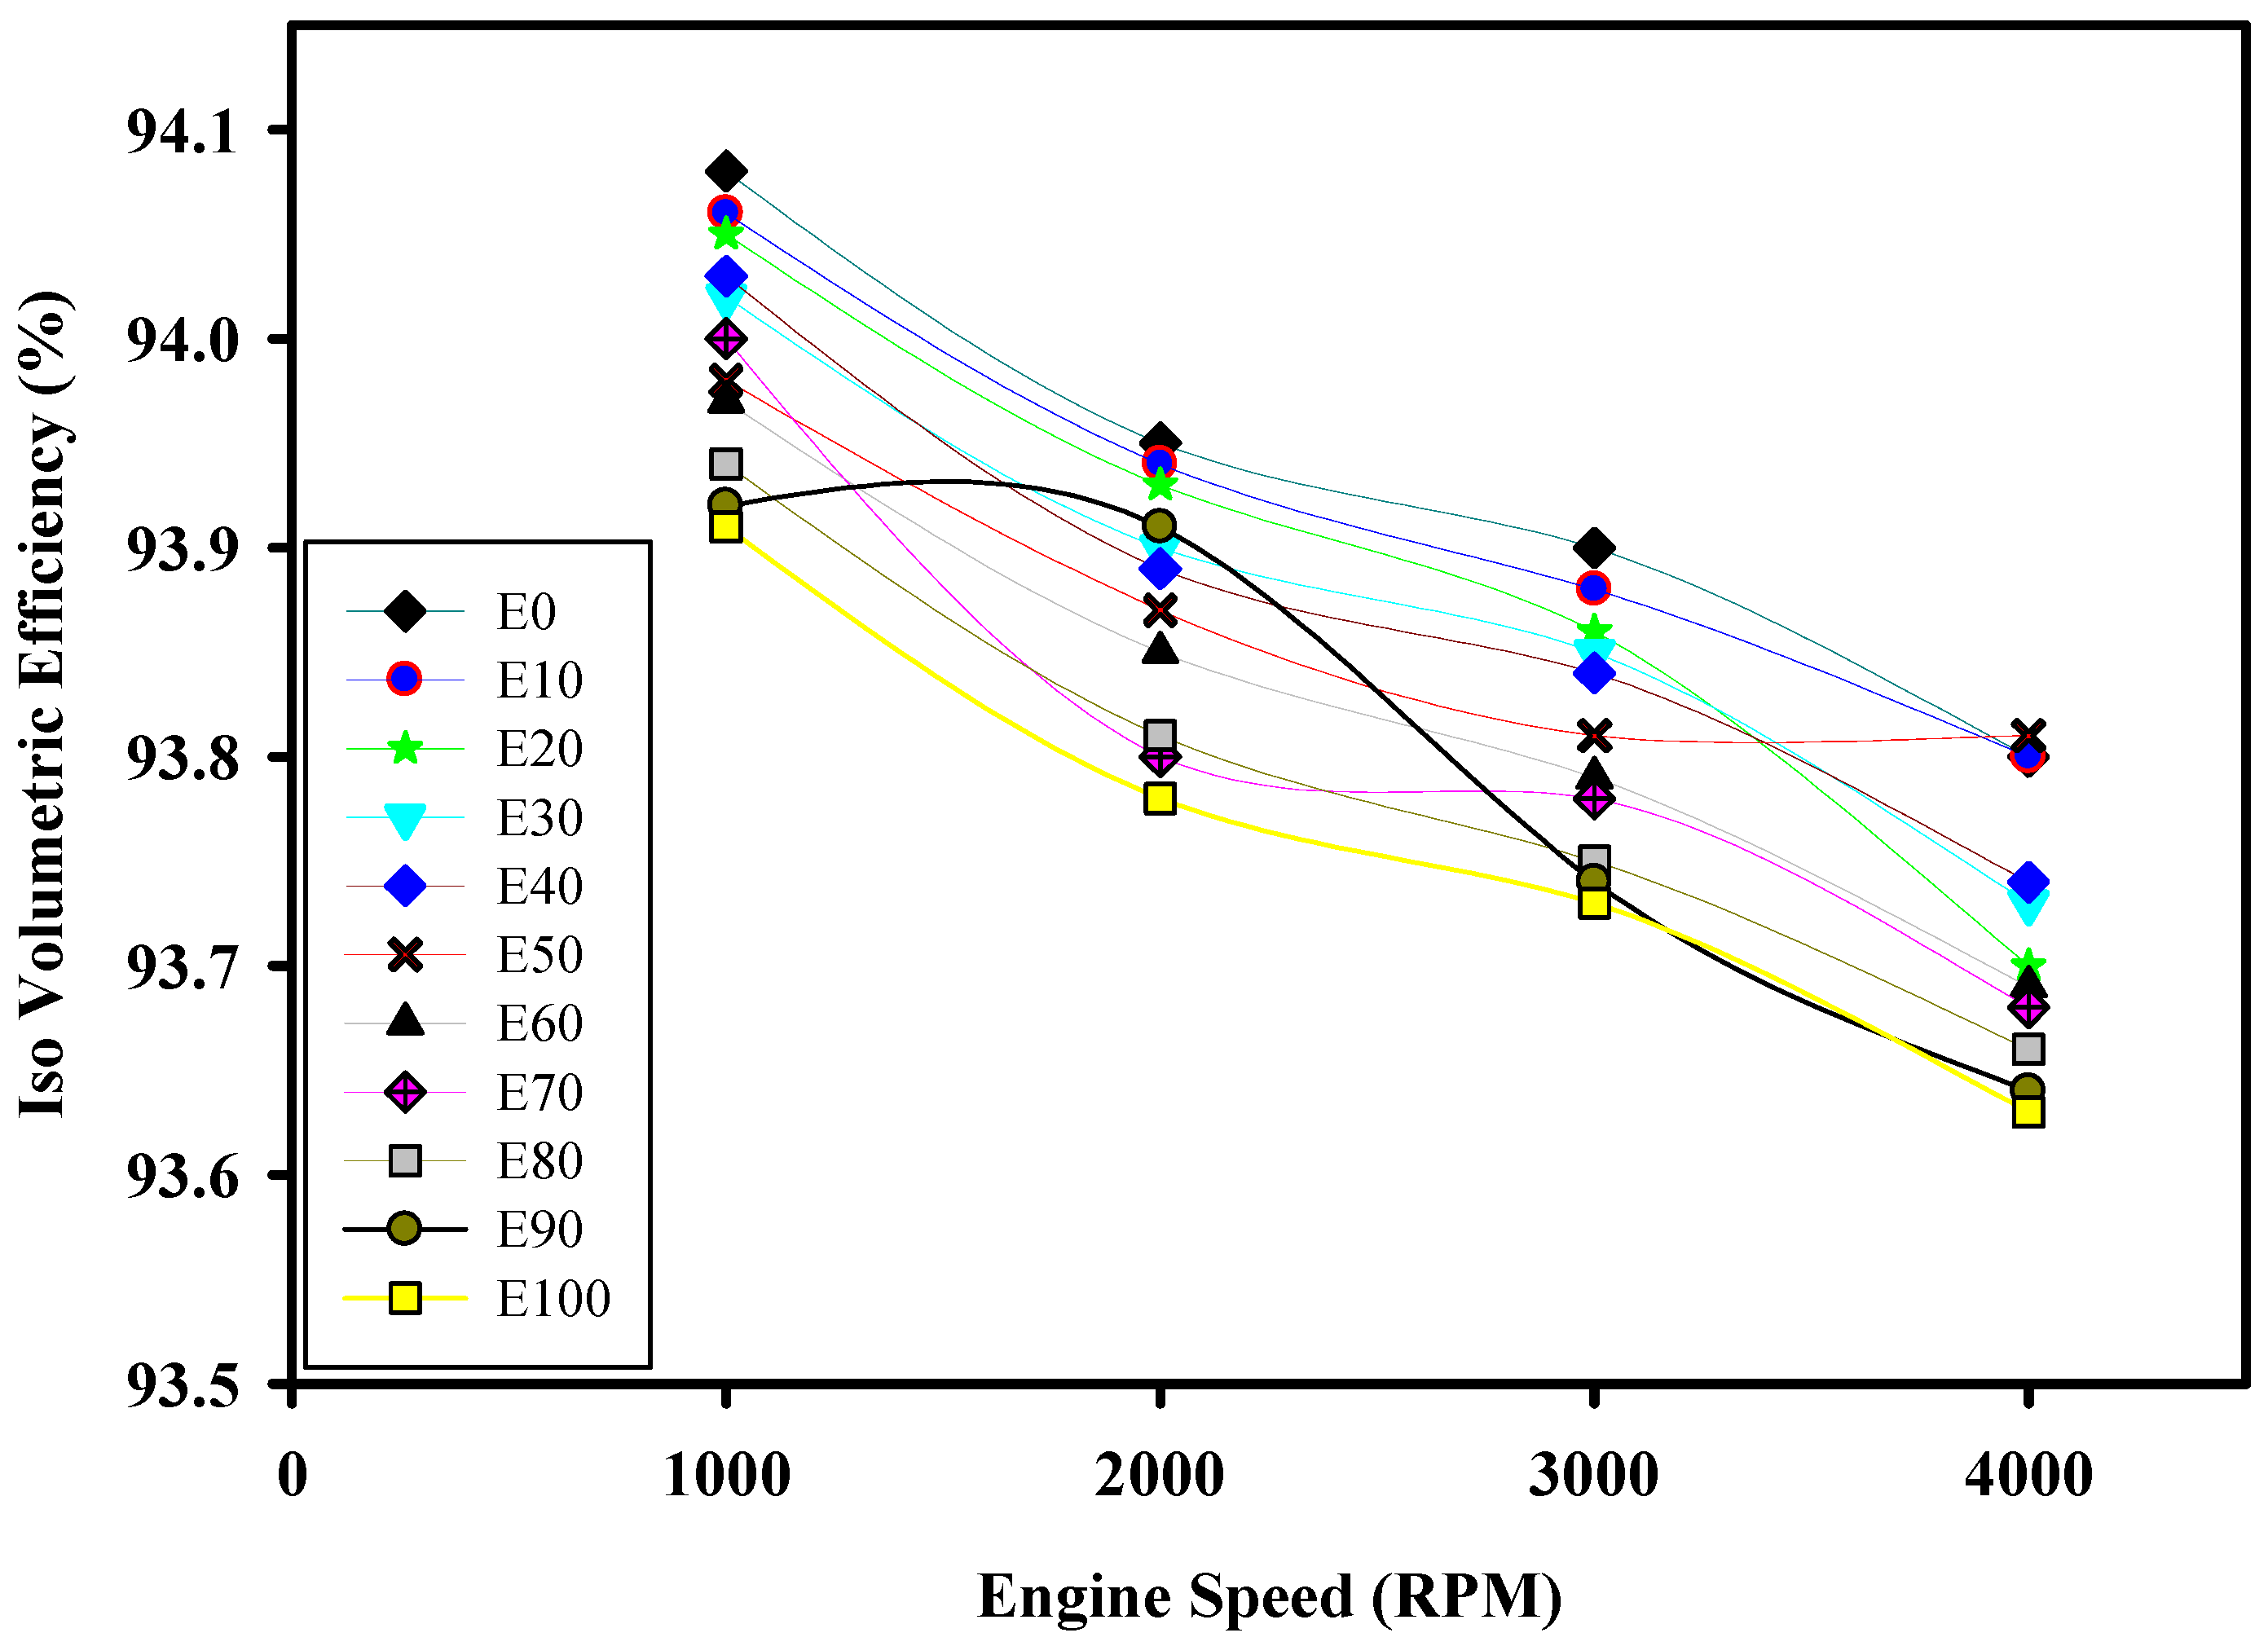
3.7. The Effect of Bioethanol–Gasoline Blends on Engine Isovolumetric Efficiency with Varying Engine Speed
Isovolumetric efficiency was observed to decrease as engine speed increased, as shown in Figure 11. This efficiency is highest at lower engine speeds when using gasoline and declines at 4000 RPM with E100. The decrease can be attributed to factors such as friction losses, reduced valve opening time, and higher engine temperatures. The higher isovolumetric efficiency at lower engine speeds can be attributed to the longer time available for intake and exhaust gas exchange, which promotes better cylinder filling. As engine speed increases, the shorter cycle duration limits the time available for gas exchange, resulting in a gradual reduction in isovolumetric efficiency.
Figure 11.
Iso Volumetric Efficiency vs. Engine Speed.
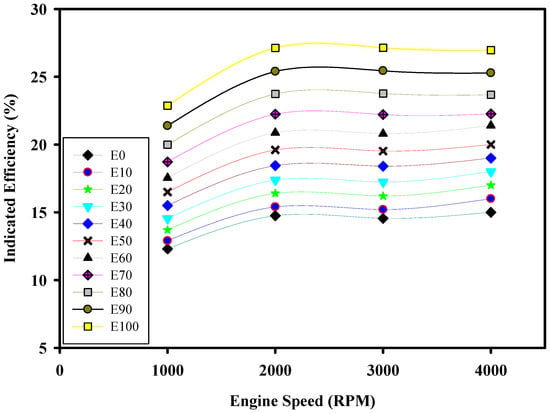
3.8. The Effect of Bioethanol–Gasoline Blends on Indicated Efficiency with Varying Engine Speed
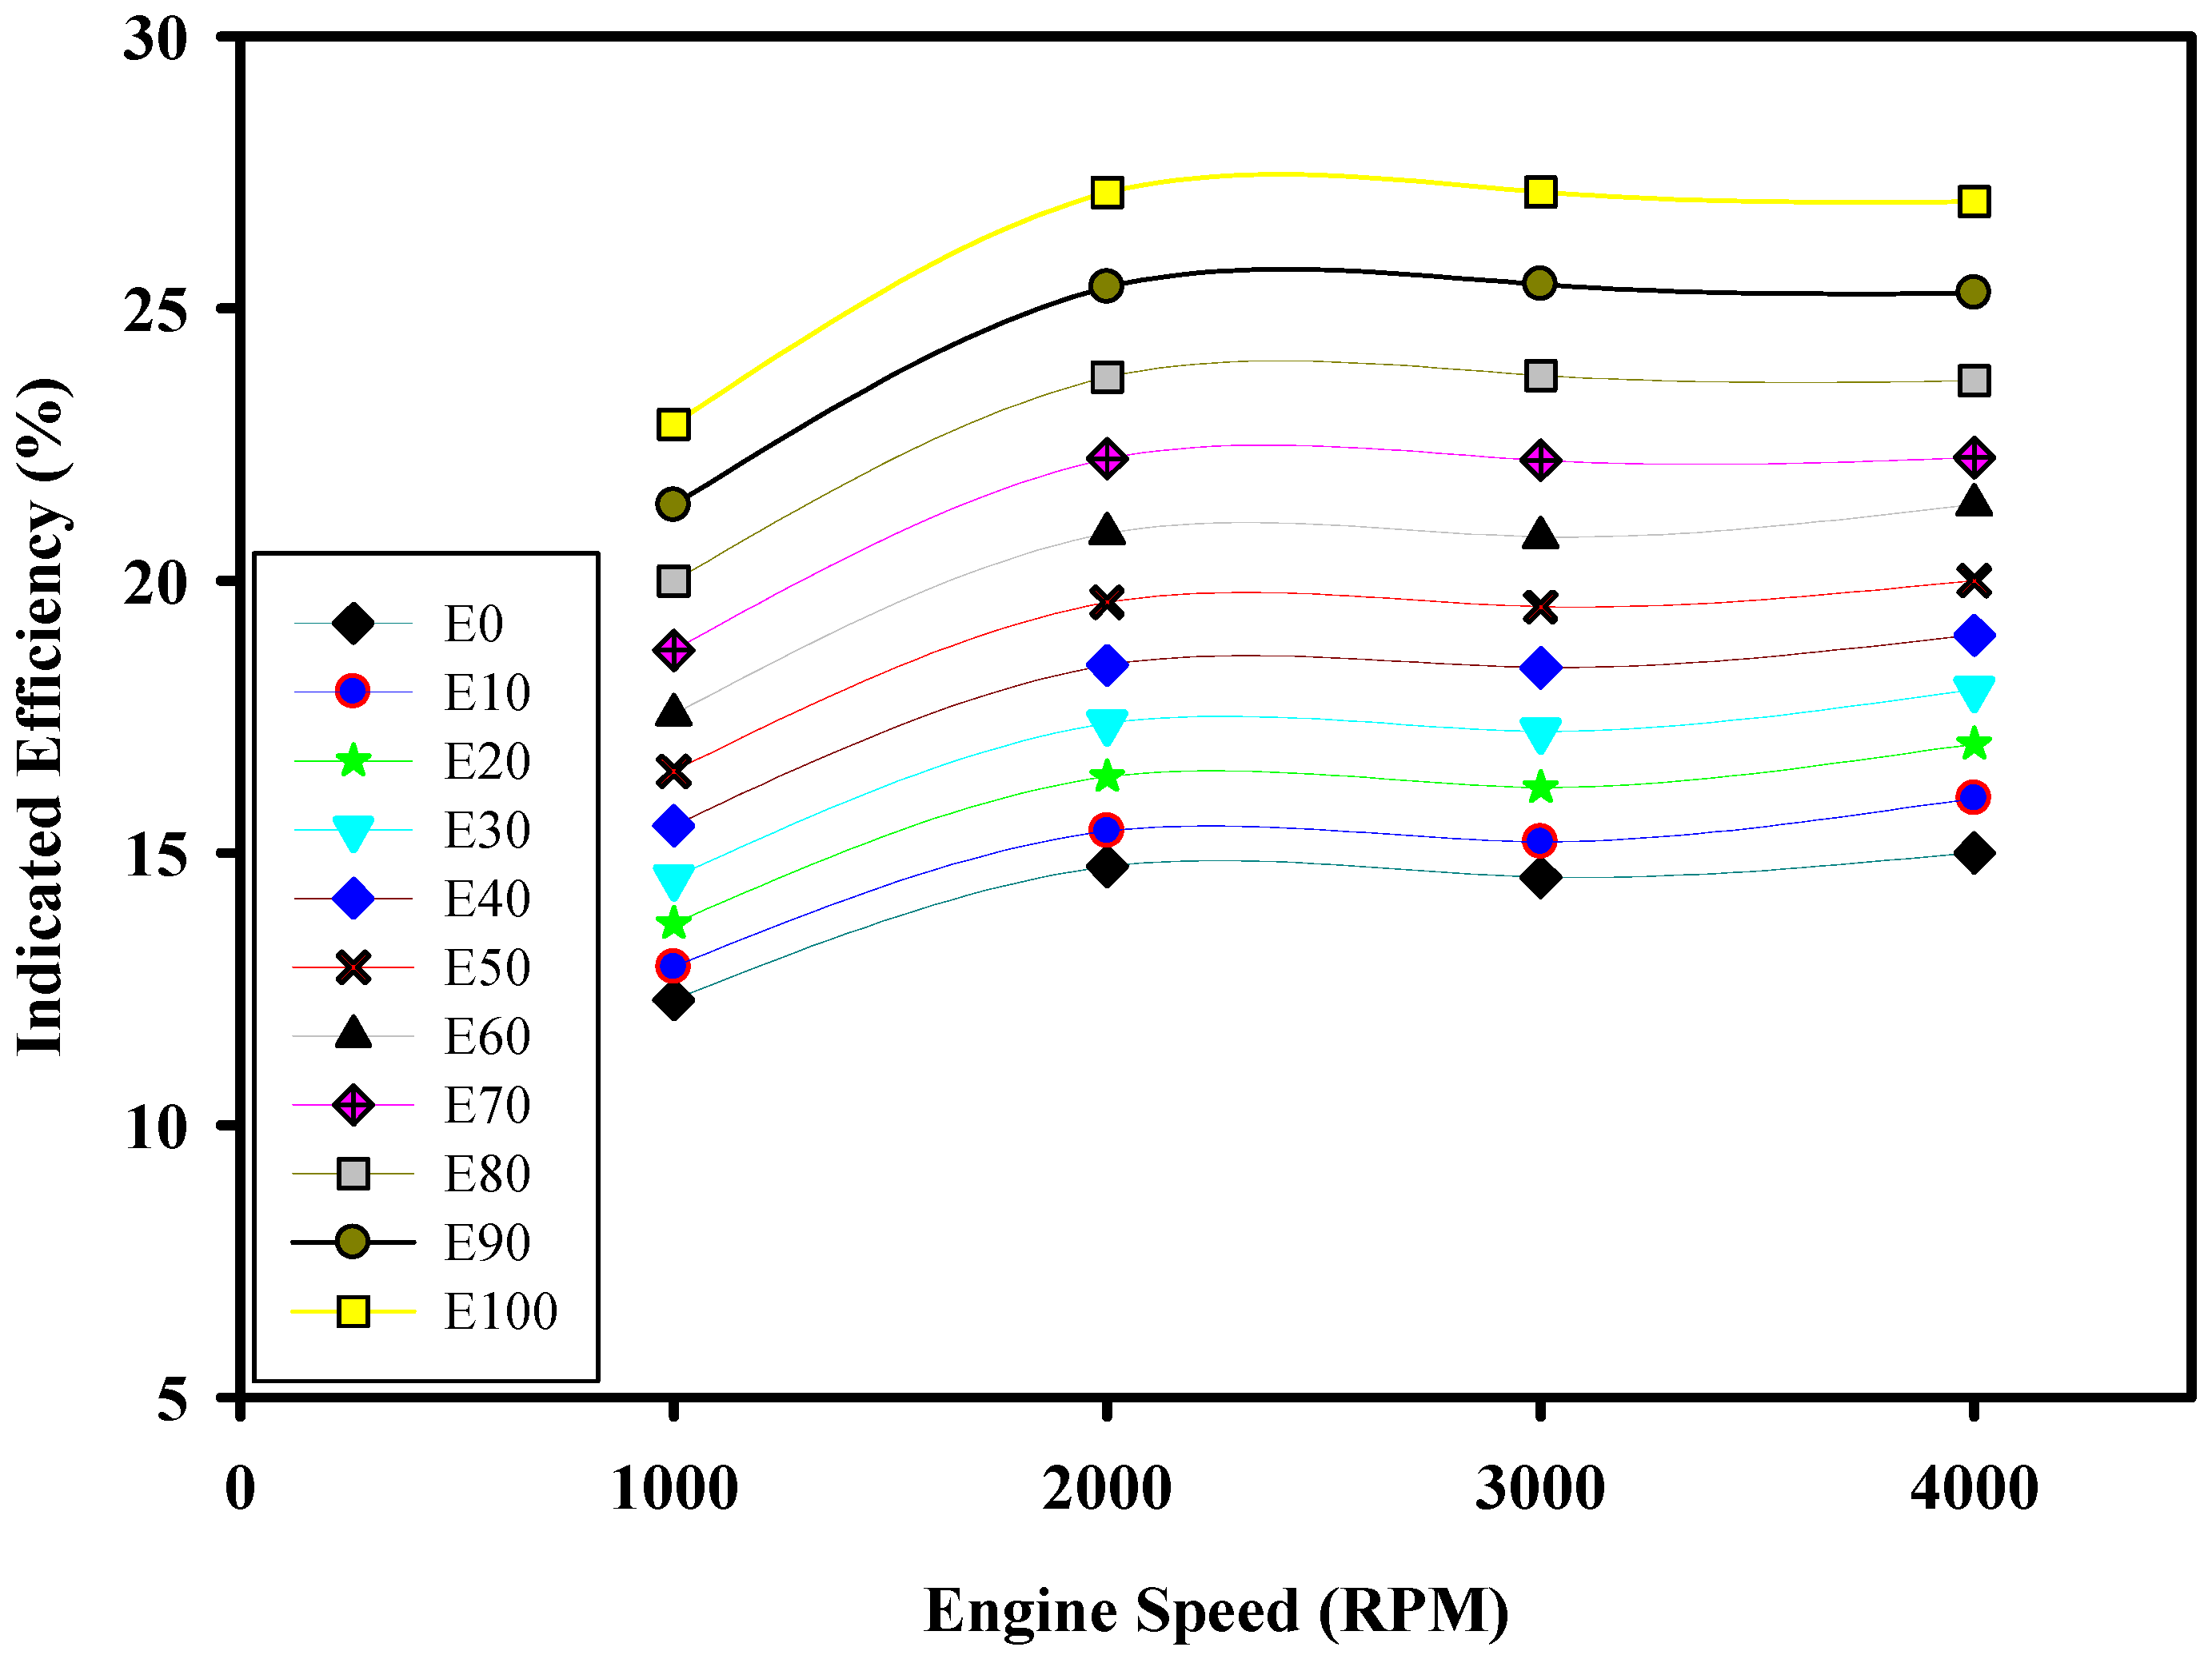
However, in small engines, whose sizes are below 100 cc, the efficiency usually falls between 25% and 35%; load and friction also affect the efficiency of the engine. In the case of E100, maximum indicated efficiency is achieved at 2000 RPM, as seen in Figure 12. Bio-ethanol increases the indicated efficiency of the engine, while gasoline has the lowest efficiency at all engine speeds. The octane number of ethanol is high; therefore, there is no engine knocking and also higher compression ratios. If the engine is run on pure gasoline, the maximum efficiency would be around 15%. However, when running on ethanol, efficiency is increased by 10% to 15% compared to gasoline.
Figure 12.
Indicated Efficiency vs. Engine Speed.
3.9. The Effect of Bioethanol–Gasoline Blends on Engine Effective Efficiency with Varying Engine Speed
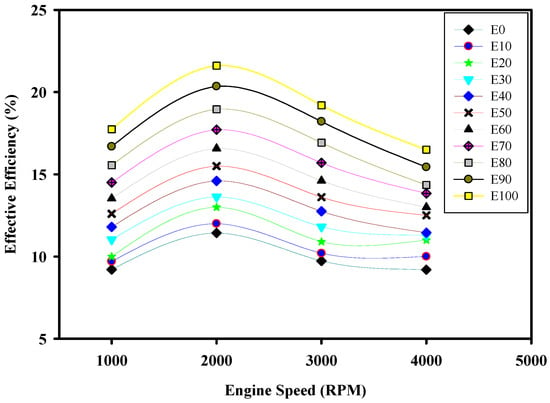
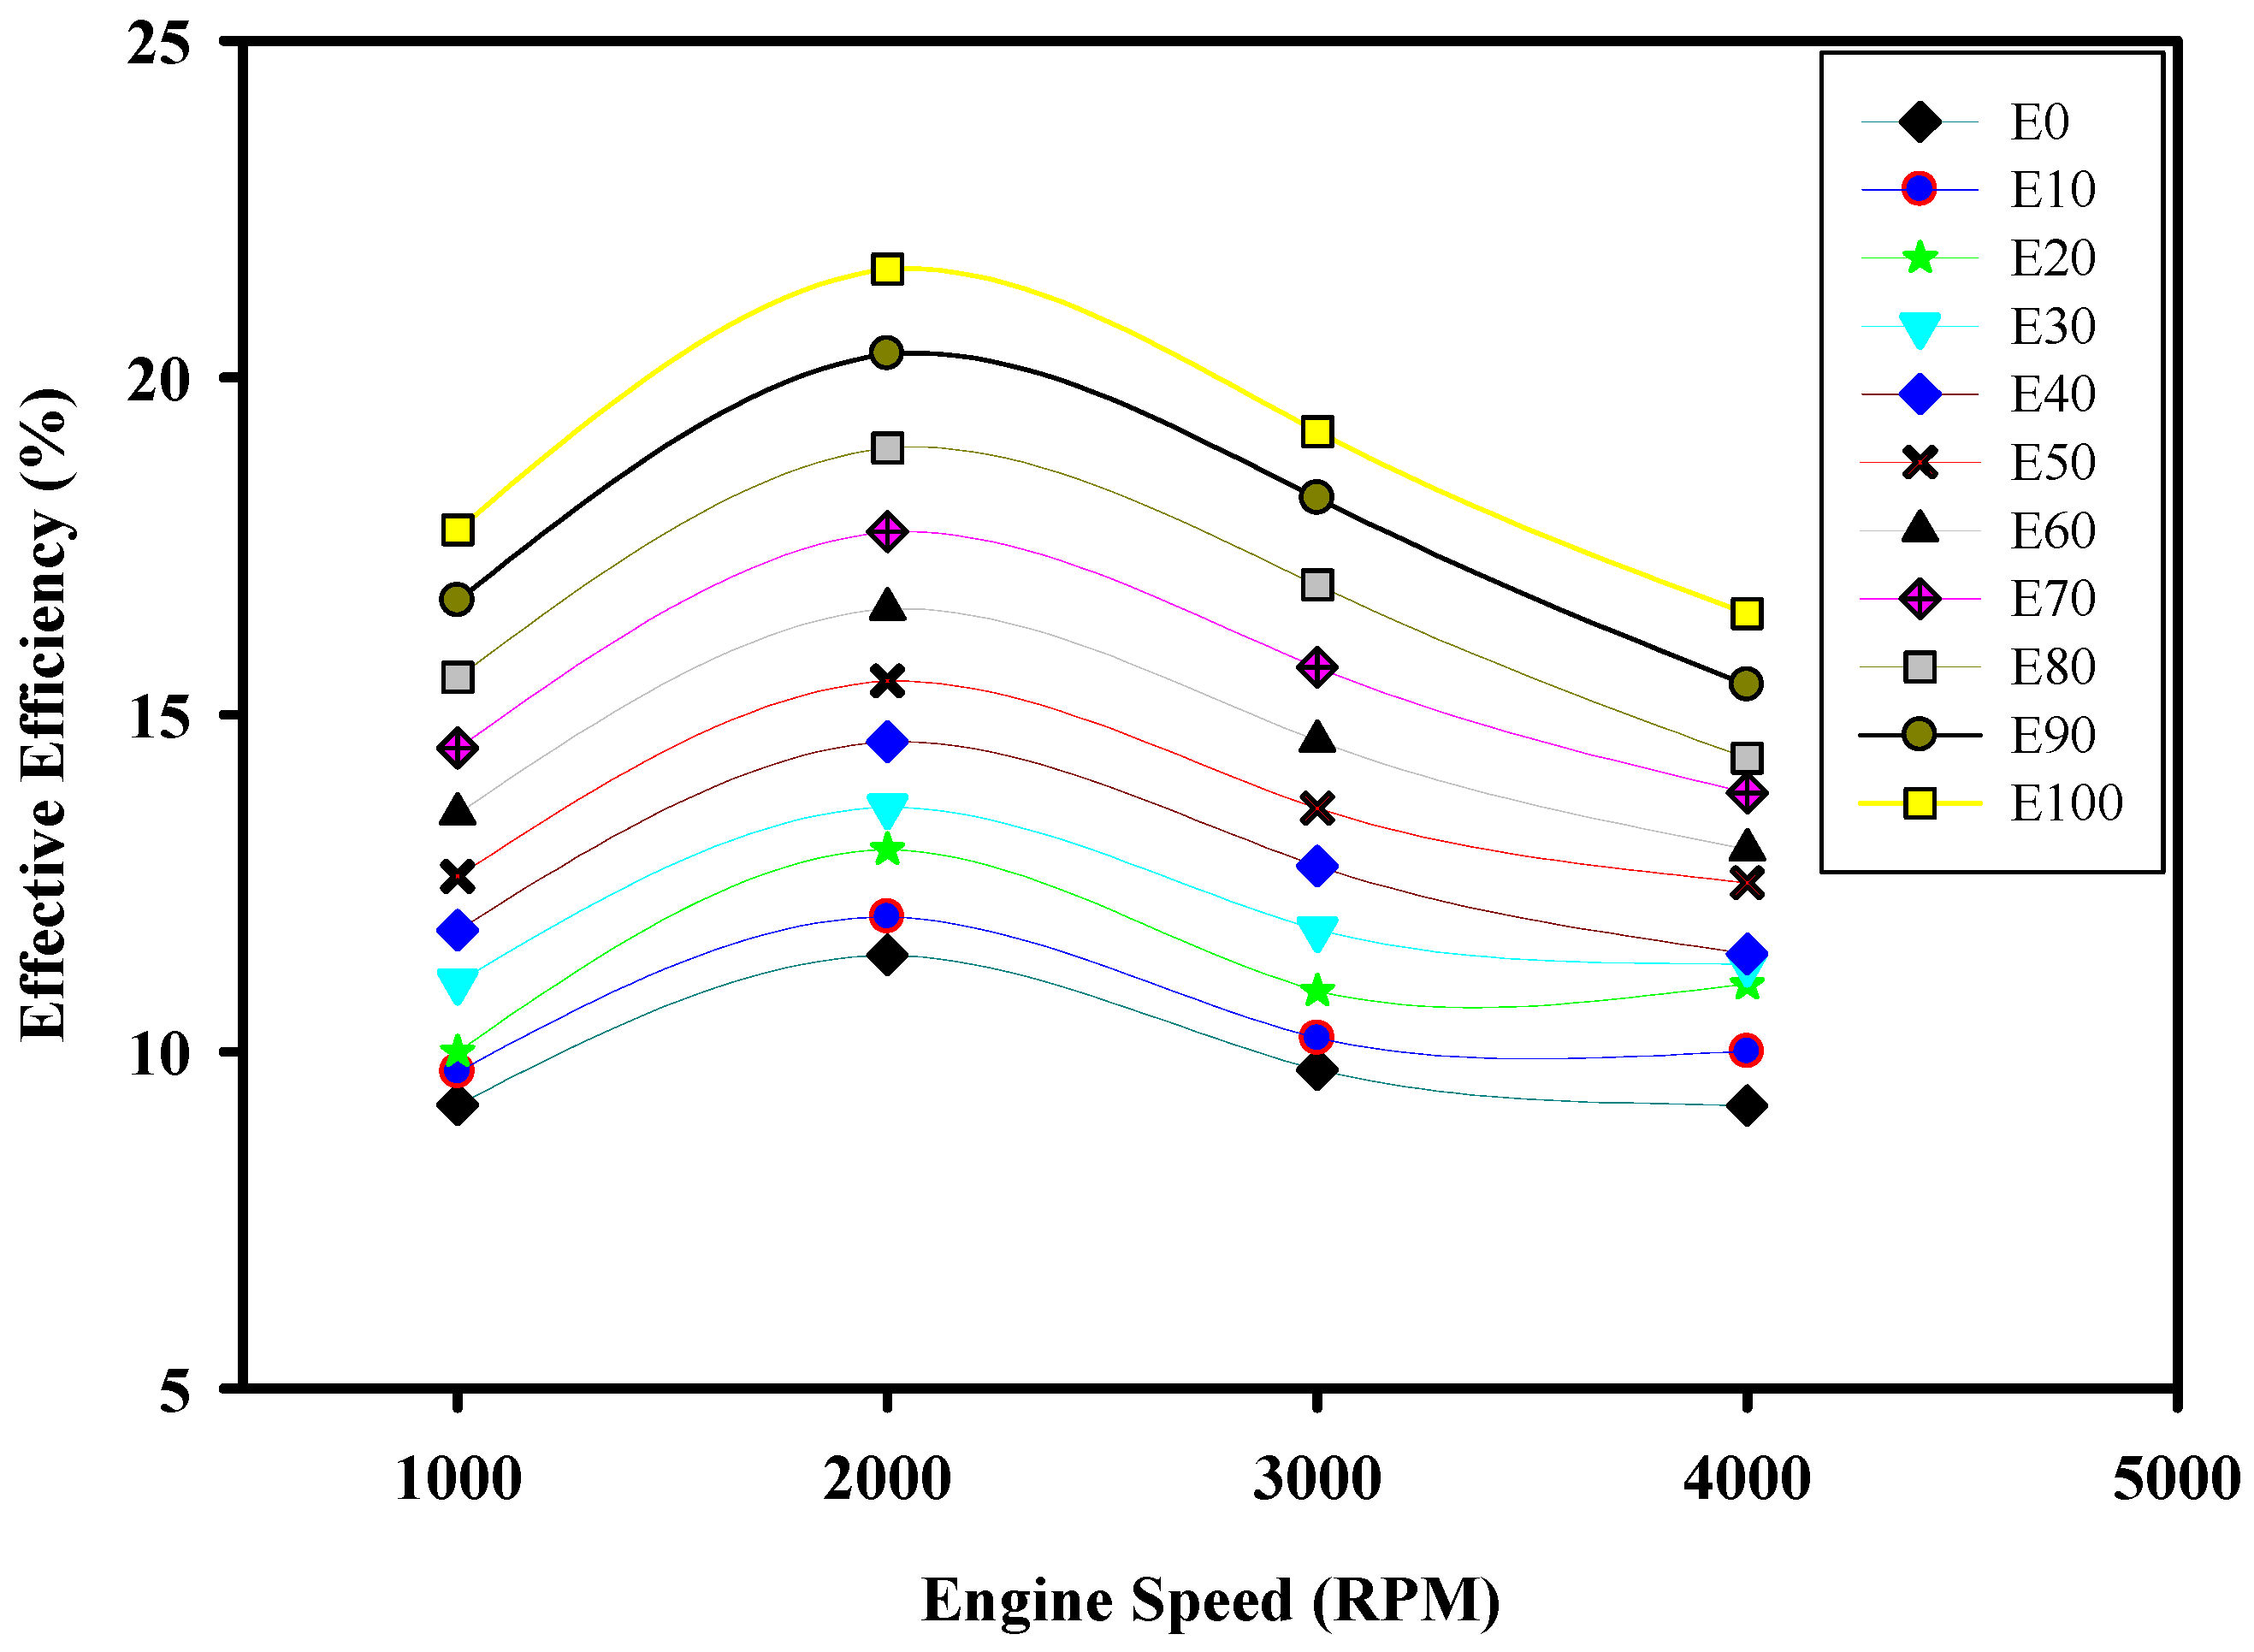
The effective efficiency starts declining when the speed of the engines increases to more than 2000 RPM, as shown in Figure 13. Fuel blends that have a higher proportion of ethanol reach maximum effective efficiency at exactly 2000 RPM. This suggests that ethanol improves effective efficiency for all the different fuel blends. Nevertheless, it should be noted that the E20 fuel blend shows a special trend in regard to effective efficiency.
Figure 13.
Effective Efficiency vs. Engine Speed.
3.10. The Effect of Bioethanol–Gasoline Blends on Engine Mechanical Efficiency with Varying Engine Speed
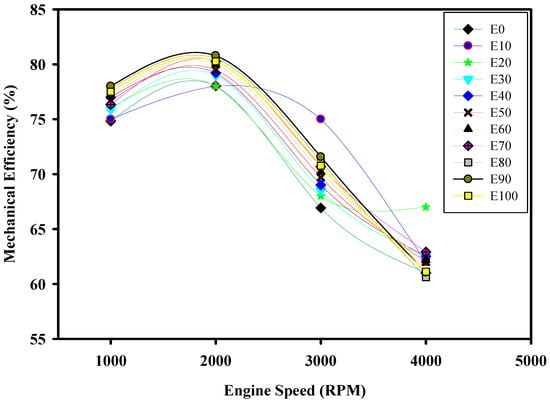
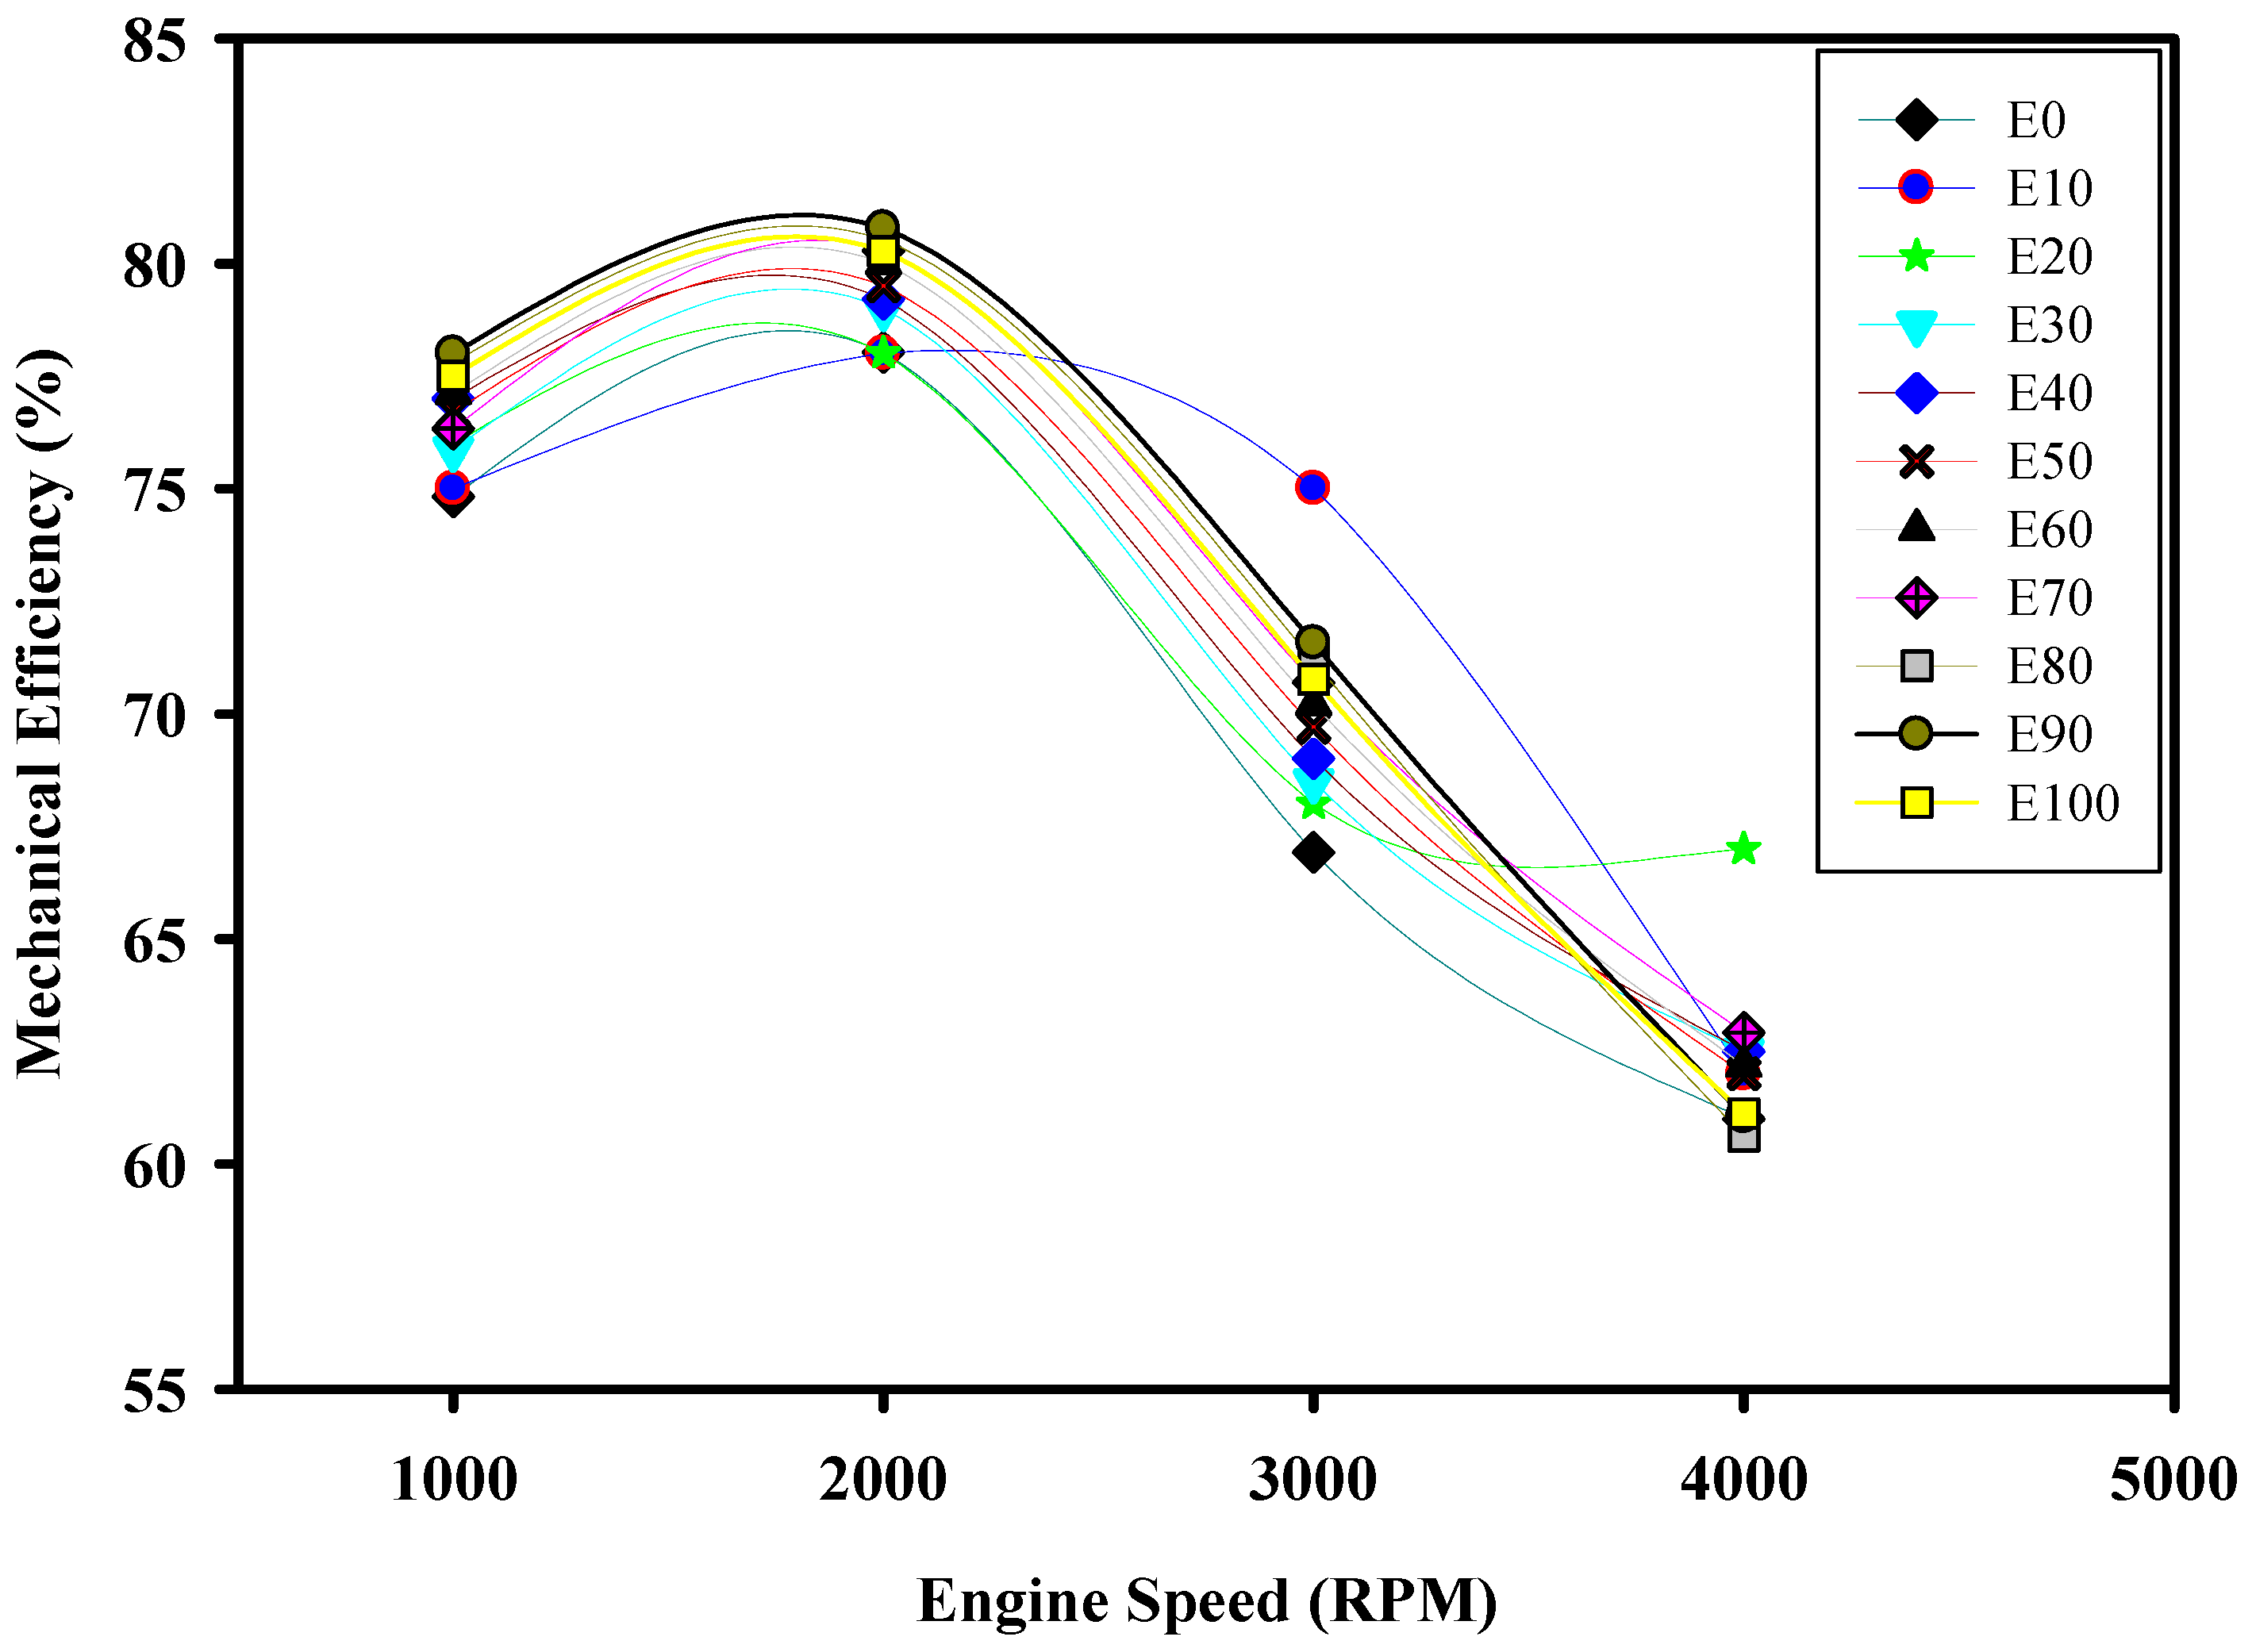
It has been found that at an engine speed of 2000 RPM, the engine reaches its maximum mechanical efficiency. On the contrary, when the engine speed exceeds 2000 RPM, the mechanical efficiency of the engine falls. It should be noted that at higher engine speeds (3000–4000 RPM), the E10 mixture works well at 3000 RPM. All the fuels show slight variations in mechanical efficiency; however, the E20 mixture shows greater variations at higher engine speed levels. Other fuels show minor variations in their efficiency. The mechanical efficiency of different fuel blends at varying engine speed levels is illustrated in Figure 14.
Figure 14.
Mechanical Efficiency vs. Engine Speed.
3.11. The Effect of Bioethanol–Gasoline Blends on Engine-Burned Air–Fuel Ratio with Varying Engine Speed
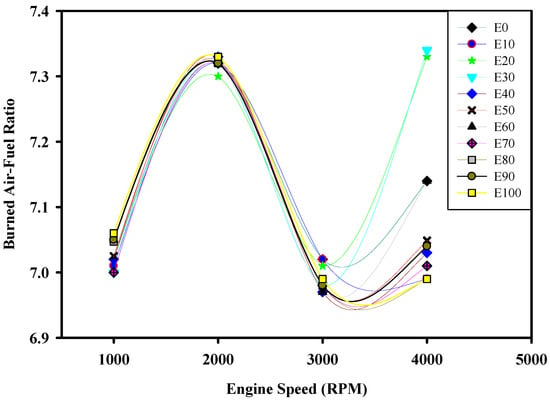
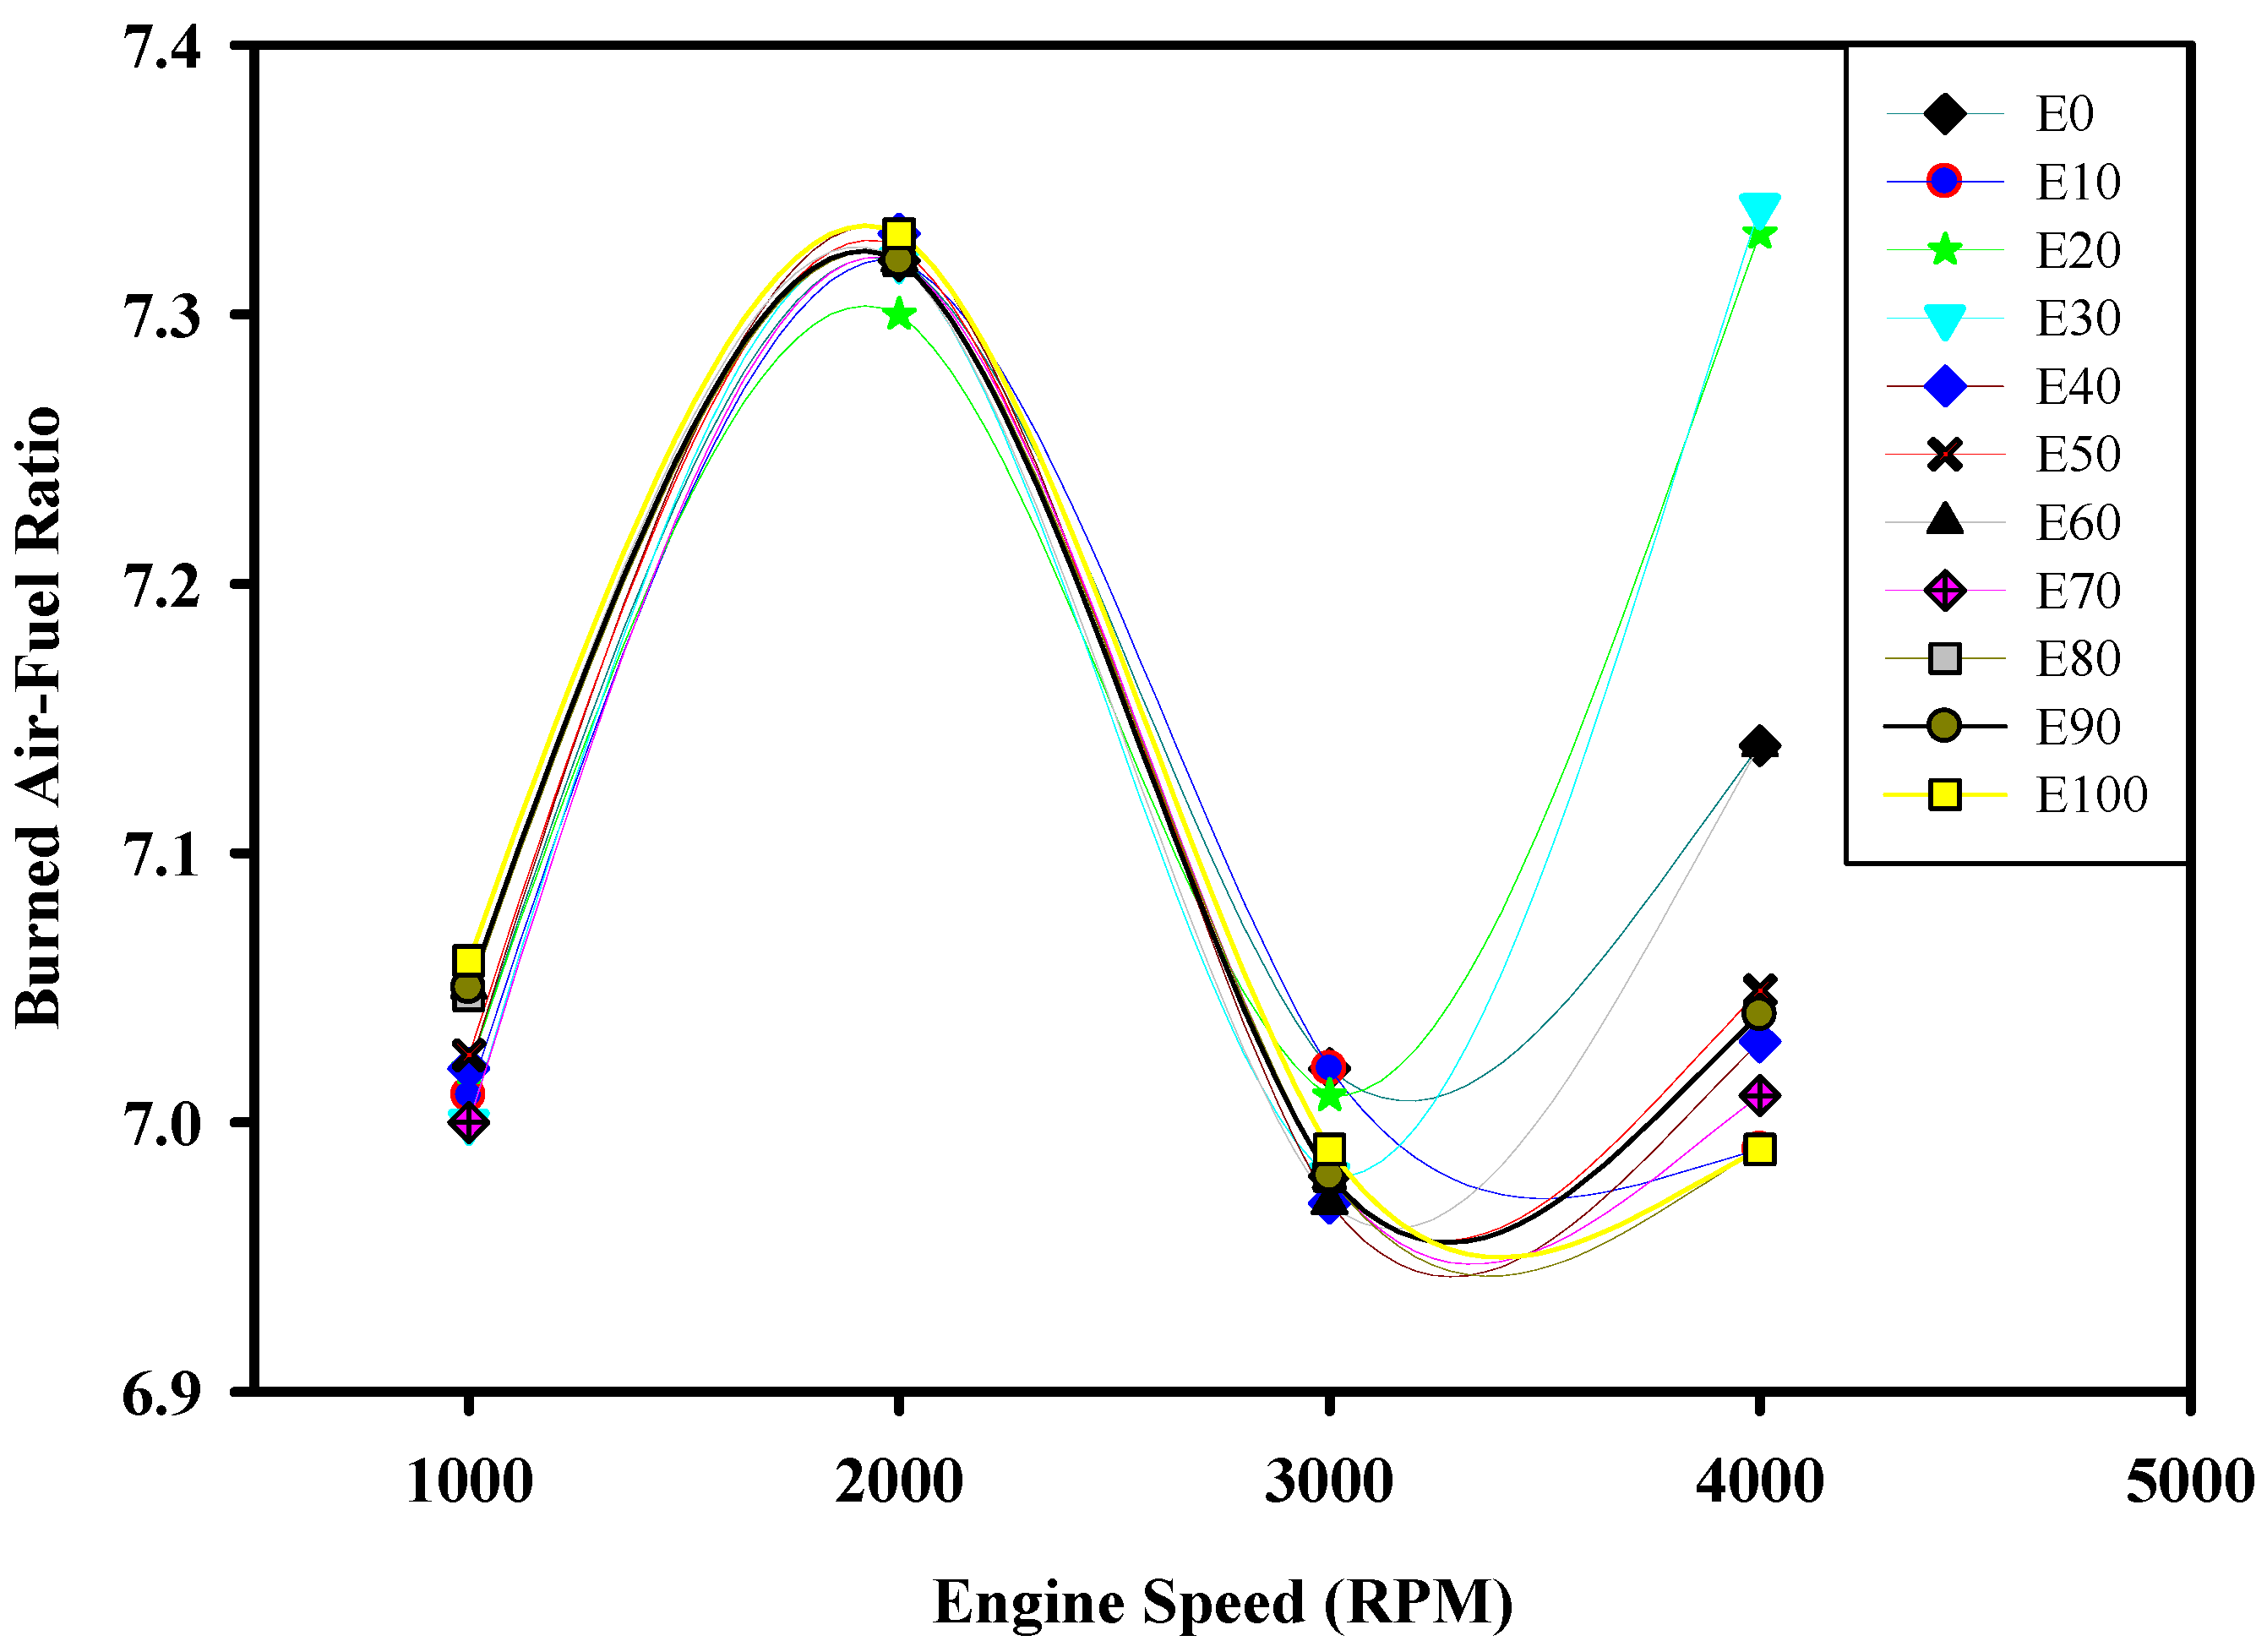
The burned air–fuel ratio (AFR) refers to the proportion of air to fuel that is combusted in the engine’s combustion chamber. This ratio has a direct impact on engine performance, efficiency, and emissions, as well as influencing the engine’s durability and reliability. The results indicate that at an engine speed of 2000 RPM, all blends and gasoline exhibit a higher burned air–fuel ratio. At 4000 RPM, only E30 and E20 demonstrate the highest burned air–fuel ratios. Additionally, E30 shows a low burned air–fuel ratio at 1000 RPM. Figure 15 illustrates the different blends of burned air–fuel ratios at various engine speeds.
Figure 15.
Burned Air–Fuel Ratio vs. Engine Speed.
3.12. Effect of Bioethanol–Gasoline Blends on Engine Exhaust Gas Temperature with Varying Engine Speed
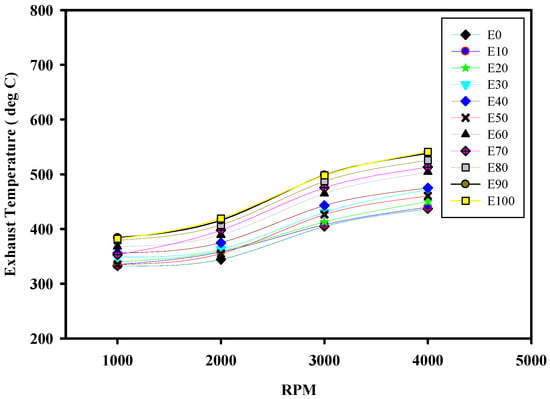
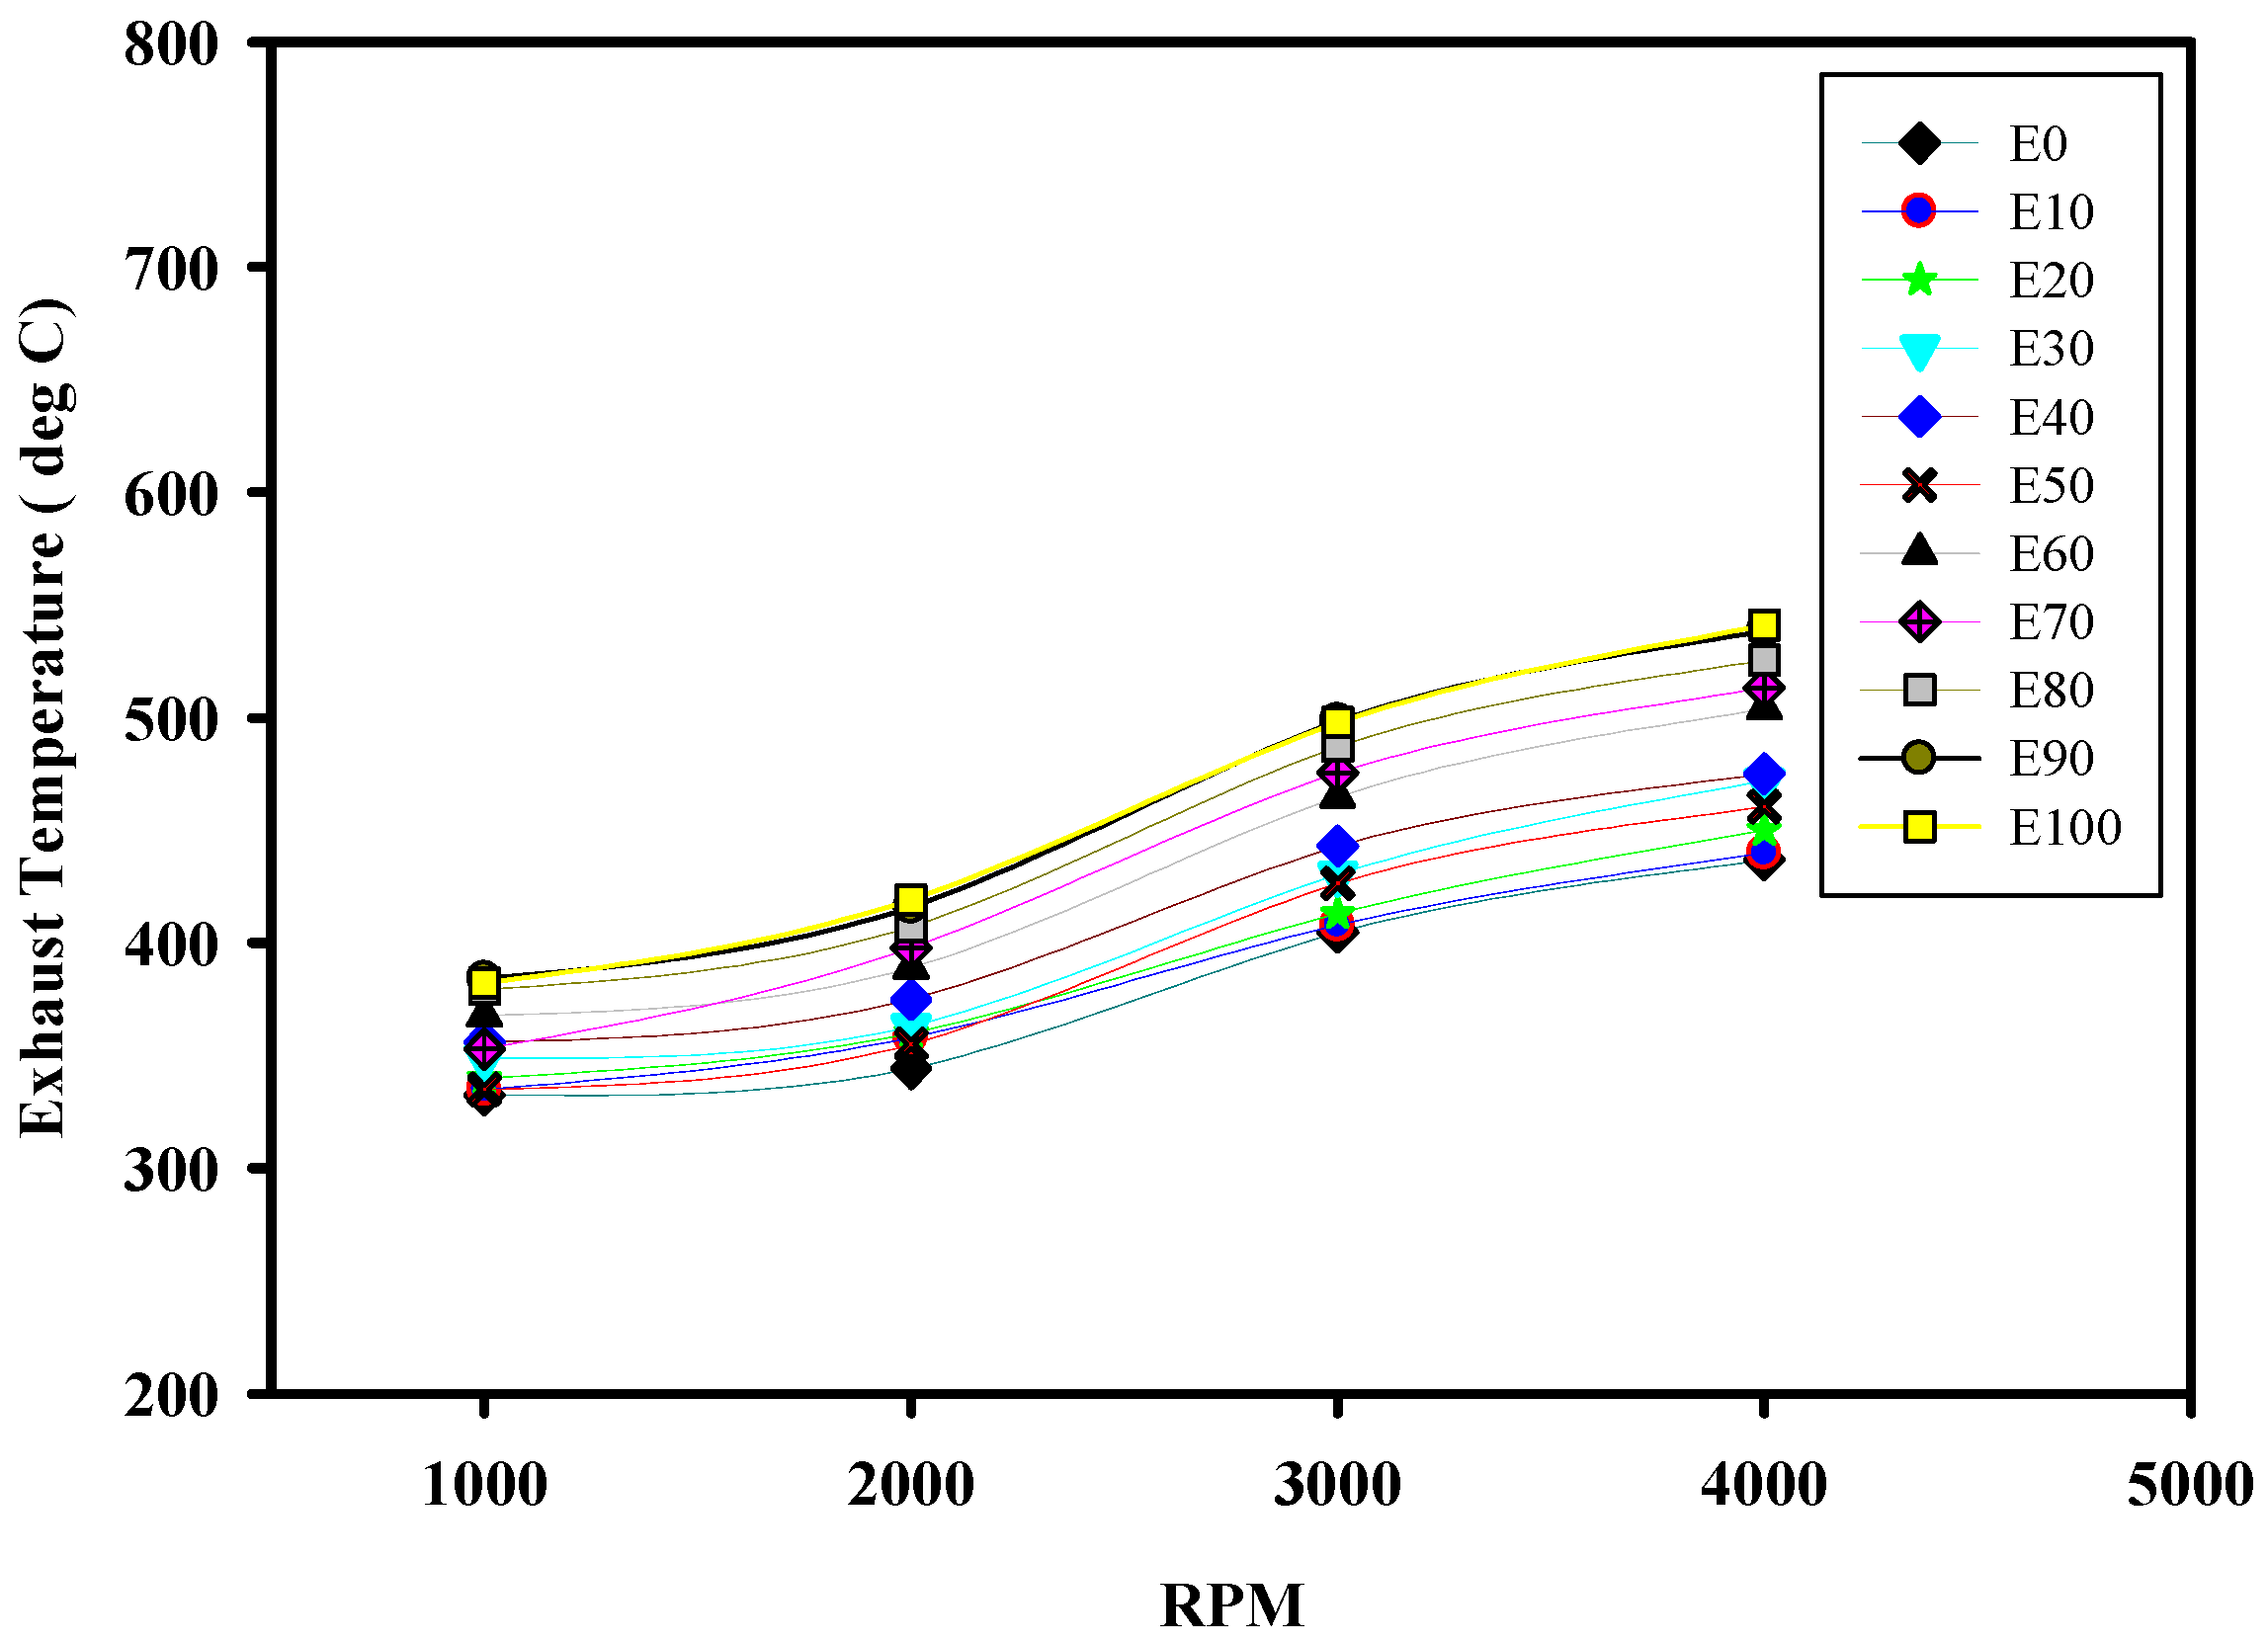
The exhaust gas temperature (°C) of the gases leaving the engine cylinder affects both engine durability and reliability. The increasing ethanol content in fuel blends results in a slight increase in exhaust gas temperature. Additionally, ethanol’s lower heat of vaporization reduces the cooling effect, contributing to the higher temperature. Figure 16 illustrates the differences in exhaust gas temperature for the various blends at different engine speeds. The exhaust gas temperature also varies with ethanol concentration. Similar variations in exhaust temperature with ethanol–gasoline blending have been reported in recent studies [27,28].
Figure 16.
Exhaust Gas Temperature vs. Engine Speed.
4. Conclusions
The engine simulation model was developed and verified in this study, focusing on varying engine speeds from 1000 to 4000 RPM. The research investigated the performance characteristics of a four-stroke motorcycle engine without any modifications. The engines were operated using lower and higher ethanol–gasoline blends. The obtained data included engine performance characteristics for different blends (E0, E10, E20, E30, E40, E50, E60, E70, E80, E90, E100). These data were compared across varying engine speeds. The reliability of the simulation model was assessed in reference by comparing its predictions with experimental power and torque data reported in reference [11] over the same engine speed range. The simulated power followed the experimental trend closely, with a mean percentage error of 3.28%, while the simulated torque showed a comparable average error of 3.5458%. The closest value for power was obtained at 4000 RPM, where the deviation was 0%, and for torque at 4000 RPM, where the deviation was 0.3115%. The largest discrepancies occurred at 3000 RPM for power (10%) and at 2000 RPM for torque (8.0247%). These deviations are within acceptable limits for one-dimensional engine simulation and may be attributed to measurement uncertainty, model simplifications, and nonlinear effects at intermediate speeds. Overall, the low average errors confirm that the AVL BOOST model is sufficiently validated to predict the performance characteristics of the CD 70 engine under the tested ethanol–gasoline blends.
The study reveals that an increase in the amount of ethanol increases the engine power moderately, particularly at higher engine speeds. In this regard, it can be stated that engines running on low ethanol blends generate peak power at lower speeds. An engine running on an E20 blend generates 12.29% more power and 4% more torque in comparison to pure gasoline. Moreover, the engine running on the E20 blend has a mechanical efficiency that is 2.89% higher in comparison to gasoline. The engine running on the E30 blend outperforms the E20 blend, but only the E20 blend gives marginal power at lower speeds, with 12.29% more power than gasoline.
In addition, the power output and efficiency of engines increase with an increase in the percentage of ethanol in the blends. The BMEP decreases slightly after 2000 RPM. The values of BSFC range from 0.6 to 0.9 kg/kw.h. For low RPMs (e.g., 1000 RPM), the blend that was selected for E100 has the highest value of BSFC. However, for high RPMs (e.g., 4000 RPM), the blends E10 and E40 have the highest values of BSFC. Fuel consumption increases steadily with the increase in the engine RPM; however, after 2000 RPM, fuel consumption with the gasoline (E0) increases sharply. All ethanol blends had slight variations in the temperature of exhaust gases. Blends E10, E20, and E30 have better performance; among them, E30 has the lowest fuel consumption at lower engine speeds but high power at high engine RPM. Blends E40, E50, and E60 have very slight differences in their performance. Blends E70 and E80 experience a significant drop in performance, and E90, along with E100, requires engine modifications. Overall, the E20 blend stands out as the most suitable fuel option for motorcycle engines.
Hence, this study, conducted to investigate the engine performance characteristics using ethanol–gasoline blends, suggests that E20 fuel improves performance. This research could assist engine designers in selecting suitable operating conditions and provide relevant material for future renewable fuel blends. It can also help policymakers and regulators promote environment-friendly blended fuel in developing countries. The main contribution of this study is the systematic numerical comparison of E0-E100 ethanol–gasoline blends in a single-cylinder four-stroke motorcycle CD 70 engine using AVL BOOST over 1000–4000 RPM. The findings provide useful guidance for identifying suitable ethanol blends and operating conditions for motorcycle engines and support future experimental investigations.
Author Contributions
Conceptualization, S.M. and Y.H.; methodology, W.A., Y.H. and S.M.; software, S.M. and Y.H.; validation, Y.H., W.A. and A.B.; formal analysis, M.I.H. and A.B.; investigation, W.A., Y.H. and S.M.; resources, S.M. and M.I.H.; writing—original draft preparation, Y.H. and A.B.; writing—review and editing, S.M., M.I.H. and A.B.; visualization, S.M., Y.H. and A.B.; supervision, S.M. and M.I.H.; project administration, S.M. and M.I.H.; funding acquisition, M.I.H. and S.M. All authors have read and agreed to the published version of the manuscript.
Funding
This research received no external funding.
Institutional Review Board Statement
Not applicable.
Informed Consent Statement
Not applicable.
Data Availability Statement
Data are already contained within this article.
Acknowledgments
The authors wish to express their gratitude to the AVL for providing the software for research/academic purposes.
Conflicts of Interest
The authors declare no conflicts of interest.
References
- Abrar, I.; Arora, T.; Khandelwal, R. Bioalcohols as an alternative fuel for transportation: Cradle to grave analysis. Fuel Process. Technol. 2023, 242, 107646. [Google Scholar] [CrossRef] [Scilit]
- Aliyu, G.; Mshelia, R.; Yusuf, R. Review of the use of bioethanol as alternative fuel for internal combustion engines. Acta Tech. Corviniensis Bull. Eng. 2021, 13, 138–144. [Google Scholar]
- Amaral, L.V.; Teixeira Malaquias, A.C.; Fraga, M.A.; Torres, R.B.; Sebastião, R.C.O.; Pujatti, F.J.P. Combustion and specific fuel consumption evaluation of a single-cylinder engine fueled with ethanol, gasoline, and a hydrogen-rich mixture. Case Stud. Therm. Eng. 2024, 57, 104316. [Google Scholar] [CrossRef] [Scilit]
- Jain, S.; Kumar, S. A comprehensive review of bioethanol production from diverse feedstocks: Current advancements and economic perspectives. Energy 2024, 296, 131130. [Google Scholar] [CrossRef] [Scilit]
- Liu, C.-G.; Li, K.; Wen, Y.; Geng, B.-Y.; Liu, Q.; Lin, Y.-H. Chapter One—Bioethanol: New opportunities for an ancient product. In Advances in Bioenergy; Li, Y., Ge, X., Eds.; Elsevier: Amsterdam, The Netherlands, 2019; Volume 4, pp. 1–34. [Google Scholar]
- Assaf, J.C.; Mortada, Z.; Rezzoug, S.-A.; Maache-Rezzoug, Z.; Debs, E.; Louka, N. Comparative Review on the Production and Purification of Bioethanol from Biomass: A Focus on Corn. Processes 2024, 12, 1001. [Google Scholar] [CrossRef] [Scilit]
- Hahn-Hägerdal, B.; Galbe, M.; Gorwa-Grauslund, M.F.; Lidén, G.; Zacchi, G. Bio-ethanol—The fuel of tomorrow from the residues of today. Trends Biotechnol. 2006, 24, 549–556. [Google Scholar] [CrossRef] [Scilit] [PubMed]
- Wang, P.; Lü, X. Chapter 1—General introduction to biofuels and bioethanol. In Advances in 2nd Generation of Bioethanol Production; Lü, X., Ed.; Woodhead Publishing: Cambridge, UK, 2021; pp. 1–7. [Google Scholar]
- Prasad, S.; Singh, A.; Joshi, H.C. Ethanol as an alternative fuel from agricultural, industrial and urban residues. Resour. Conserv. Recycl. 2007, 50, 1–39. [Google Scholar] [CrossRef] [Scilit]
- Qiao, Z.; Lü, X. Chapter 10—Industrial bioethanol production: Status and bottlenecks. In Advances in 2nd Generation of Bioethanol Production; Lü, X., Ed.; Woodhead Publishing: Cambridge, UK, 2021; pp. 213–227. [Google Scholar]
- Babu, M.; Sivaraman, M.; Jeyaseelan, T.; Ma, A. A comprehensive assessment of vehicular performance and emission characteristics during real-time test-runs using selected bio-ethanol–gasoline blends. Biofuels 2024, 15, 137–145. [Google Scholar] [CrossRef] [Scilit]
- Zhang, J.; Sun, P.; Yu, X.; Li, D. The effects of hydrogen peroxide-ethanol blend/gasoline on the combustion and emission performance of a combined injection spark ignition engine. J. Clean. Prod. 2024, 450, 141805. [Google Scholar] [CrossRef] [Scilit]
- Mohammed, M.K.; Balla, H.H.; Al-Dulaimi, Z.M.H.; Kareem, Z.S.; Al-Zuhairy, M.S. Effect of ethanol-gasoline blends on SI engine performance and emissions. Case Stud. Therm. Eng. 2021, 25, 100891. [Google Scholar] [CrossRef] [Scilit]
- Abdullah, M.; Yusop, A.; Mamat, R.; Hamidi, M.A.; Sudhakar, K.; Yusaf, T. Sustainable Biofuels from First Three Alcohol Families: A Critical Review. Energies 2023, 16, 648. [Google Scholar] [CrossRef] [Scilit]
- Azad, V.K.; De, K.; Majumder, S. Ethanol blending and its environmental impacts: A case study of India. Energy Sustain. Dev. 2024, 79, 101385. [Google Scholar] [CrossRef] [Scilit]
- Elfasakhany, A. Gasoline engine fueled with bioethanol-bio-acetone-gasoline blends: Performance and emissions exploration. Fuel 2020, 274, 117825. [Google Scholar] [CrossRef] [Scilit]
- Khattak, M.; Mukhtar, A.; Zareen, N.; Kazi, S.; Jan, M.M. Green initiatives: A review of ethanol as an alternate automobile fuel. J. Adv. Rev. Sci. Res. 2016, 21, 27–42. [Google Scholar]
- Thakur, A.K.; Kaviti, A.K.; Mehra, R.; Mer, K.K.S. Performance analysis of ethanol–gasoline blends on a spark ignition engine: A review. Biofuels 2017, 8, 91–112. [Google Scholar] [CrossRef] [Scilit]
- Sanap, P.P.; Diwan, A.G.; Mahajan, Y.S. Ethanol blending in petrol: A techno—Commercial overview. Mater. Today Proc. 2023, 102, 113–125. [Google Scholar] [CrossRef] [Scilit]
- Cherwoo, L.; Gupta, I.; Flora, G.; Verma, R.; Kapil, M.; Arya, S.K.; Ravindran, B.; Khoo, K.S.; Bhatia, S.K.; Chang, S.W.; et al. Biofuels an alternative to traditional fossil fuels: A comprehensive review. Sustain. Energy Technol. Assess. 2023, 60, 103503. [Google Scholar] [CrossRef] [Scilit]
- Beller, G.; Árpád, I.; Kiss, J.T.; Kocsis, D. AVL Boost: A powerful tool for research and education. J. Phys. Conf. Ser. 2021, 1935, 012015. [Google Scholar] [CrossRef] [Scilit]
- Qadiri, U. Numerical one-dimensional investigations on a multi-cylinder spark ignition engine using hydrogen/ethanol, hydrogen/methanol and gasoline in dual fuel mode. Environ. Sci. Atmos. 2024, 4, 233–242, Correction in Environ. Sci. Atmos. 2025, 5, 406. [Google Scholar] [CrossRef] [Scilit]
- Heywood, J.B. Internal Combustion Engine Fundamentals; McGraw-Hill Education: New York, NY, USA, 1988. [Google Scholar]
- Anderson, J.E.; Kramer, U.; Mueller, S.A.; Wallington, T.J. Octane numbers of ethanol− and methanol− gasoline blends estimated from molar concentrations. Energy Fuels 2010, 24, 6576–6585. [Google Scholar] [CrossRef] [Scilit]
- ASTM D4814; Standard Specification for Automotive Spark-Ignition Engine Fuel. ASTM International: West Conshohocken, PA, USA, 2024.
- ASTM D5798; Standard Specification for Ethanol Fuel Blends for Flexible-Fuel Automotive Spark-Ignition Engines. ASTM International: West Conshohocken, PA, USA, 2025.
- Walle, M.; Yeneneh, K.; Sufe, G. Investigation of spark ignition engine performance in ethanol–petrol blended fuels using artificial neural network. Sci. Rep. 2025, 15, 25516. [Google Scholar] [CrossRef] [Scilit] [PubMed]
- Khedr, A.M.; Ismael, M.A.; El-Adawy, M.; Elserfy, K.; Abdelhafez, A.; Habib, M.A.; Nemitallah, M.A. Effects of Ethanol-Gasoline Blending on Combustion, Performance, and Emissions of a Spark Ignition Engine: An Experimental and Detailed Chemistry-Based Numerical Study. ACS Omega 2026, 11, 22017–22030. [Google Scholar] [CrossRef] [Scilit] [PubMed]

Disclaimer/Publisher’s Note: The statements, opinions and data contained in all publications are solely those of the individual author(s) and contributor(s) and not of MDPI and/or the editor(s). MDPI and/or the editor(s) disclaim responsibility for any injury to people or property resulting from any ideas, methods, instructions or products referred to in the content. |
© 2026 by the authors. Licensee MDPI, Basel, Switzerland. This article is an open access article distributed under the terms and conditions of the Creative Commons Attribution (CC BY) license.