


Abstract
Although green finance policies are widely recognized as important instruments for promoting city green growth, how they reshape the behavioral responses of economic actors remains insufficiently understood. This study examines green innovation and entrepreneurship within a common analytical framework, with the former representing a technological response and the latter a market-entry response. Drawing on a panel of 282 Chinese prefecture-level cities over 2011–2022, this study exploits the implementation of the Pilot Zone for Green Finance Reform and Innovation (PZGFRI) policy as a quasi-natural experiment and estimates its effect on green total factor productivity using a difference-in-differences design. The baseline estimate is 0.168, implying an effect equivalent to about 15.7% of the sample mean of GTFP, and this result is broadly comparable across robustness checks. The mechanism analyses further show positive policy effects on green innovation and entrepreneurial entry, with both lagged measures positively associated with subsequent city GTFP. Heterogeneity analyses suggest that policy effects are more pronounced in peripheral cities, cities with lower government efficiency, and those with lower pollution pressure. The results imply that green finance should be more precisely targeted, stimulate both technological and market-entry responses, and be adapted to local development conditions. These insights may also be relevant to developing economies seeking to turn policy-based financial support into sustained green growth.
1. Introduction
Industrialization has generated unprecedented material prosperity, but it has also caused serious ecological damage. Like many developing countries, China has long followed an extensive growth model characterized by “grow now, clean up later”. This has led to severe resource waste and environmental pollution [1,2], making it urgent to achieve a green transition. Green finance has therefore become an important means of aligning capital allocation with environmental protection and economic growth [3,4,5], as it can redirect capital toward environmentally friendly sectors, technologies, and projects. However, a persistent mismatch remains between the financing needs and the financial system’s supply capacity in the process of green transition, especially in developing economies where green industries and projects often face significant financing constraints [6,7].
To address this mismatch, China launched the Pilot Zone for Green Finance Reform and Innovation (PZGFRI) policy in 2017. By establishing pilot zones in selected cities, the policy has transformed green finance into an operational policy instrument [8], thereby supporting the green transition of the real economy [9]. As the pilot program has expanded and moved into a deeper phase of implementation, an important question arises: can the PZGFRI policy effectively promote city green growth, and if so, how does it reshape the behavioral responses of economic actors? Addressing these issues can deepen the evaluation of China’s green finance reform and offer broader insights into the use of policy-based financial instruments for green development in other developing economies.
Existing studies generally suggest that the PZGFRI policy contributes to resource conservation and environmental protection [10,11,12,13]. However, the green transition involves more than ecological improvement. Its broader objective is to achieve green growth, that is, to realize economic growth in a manner consistent with environmental sustainability. From this perspective, evaluating the PZGFRI policy only in terms of environmental outcomes is incomplete. Although increasing attention has been paid to the green-growth effects of the policy, its influence on the behavioral responses of economic actors, particularly in terms of technological adjustment and market entry, remains only partially understood.
Studies on how green finance promotes green growth mainly emphasize channels such as technological innovation [14], resource allocation [15], and digitization [7], focusing primarily on adjustments within existing production activities. Recent research has shown that the PZGFRI policy can enhance entrepreneurial vitality when promoting inclusive green growth [16]. This evidence establishes the relevance of entrepreneurship to green finance reform, but it primarily considers entrepreneurship within a broader set of mechanisms and emphasizes its contribution to employment, income diversity, and social inclusion. Relatively limited attention has been devoted to the distinct form of economic adjustment that entrepreneurship represents. Unlike green innovation, which reflects technological upgrading within the existing production system, entrepreneurship reflects a market-entry response through new firm formation. Distinguishing these two responses may provide a different perspective on how green finance reform promotes city green growth. Conceptually, these responses broadly correspond to two margins of economic adjustment: technological upgrading within the existing production system and market entry through new firm formation. Considering these responses jointly can broaden the understanding of how green finance contributes to city green growth.
A further limitation concerns policy heterogeneity. Existing studies typically compare eastern, central, and western regions, yet their conclusions remain inconsistent. While some find stronger policy effects in more developed eastern areas [14], others report larger effects in less developed western regions [7]. These mixed findings suggest that broad regional classifications may conceal important differences among cities within the same region. Examining more specific city characteristics may therefore clarify how local development conditions shape green finance effectiveness.
Accordingly, this study examines the effect of the PZGFRI policy on city green growth using a 2011–2022 panel of 284 Chinese prefecture-level cities and a difference-in-differences (DID) design. The analysis focuses on three related questions: whether the policy promotes green growth, whether it is associated with technological and market-entry responses, and under what city conditions its effect is more pronounced. The empirical evidence indicates that the PZGFRI policy significantly increases green growth in pilot cities, and this conclusion remains stable across alternative specifications. Further analyses show that the policy is associated with greater green innovation and entrepreneurial activity, providing evidence consistent with the proposed technological and market-entry responses. The entrepreneurship result complements the conventional emphasis on technological innovation by drawing attention to potential entrepreneurs’ market-entry decisions. Heterogeneity analyses further suggest larger policy effects in peripheral cities, cities with lower government efficiency, and cities with lower pollution levels, suggesting that local development conditions shape the effectiveness of green finance reform.
This study makes three main contributions. First, this study adopts a behavioral-response perspective to examine how green finance policy promotes city green growth. Existing studies mainly focus on technological innovation, resource allocation, and digitization, while recent research has also identified entrepreneurial vitality as one of several mechanisms underlying inclusive green growth. Rather than focusing only on policy outcomes or individual transmission mechanisms, this study shifts attention to the responses of economic actors to green finance reform. This perspective extends existing explanations of how green finance policy affects city green growth.
Second, this study distinguishes behavioral responses to green finance reform into green innovation and entrepreneurship. Green innovation represents a technological response, reflecting technological upgrading within the existing production system, whereas entrepreneurship represents a market-entry response through new firm formation. This distinction separates two different forms of economic adjustment and extends the conventional emphasis on changes within existing production activities to include market entry by new firms, thereby clarifying the distinct roles of technological upgrading and new firm formation.
Third, this study moves beyond conventional comparisons among eastern, central, and western regions by examining policy heterogeneity across three city-specific dimensions: administrative status, government efficiency, and pollution levels. This approach provides more precise evidence on the city conditions under which green finance reform generates stronger green-growth effects and offers implications for differentiated and adaptive policy implementation.
The paper is structured as follows. Section 2 reviews the literature and develops the hypotheses. Section 3 introduces the data and methods. Section 4 reports the empirical results, robustness checks, mechanism analysis, and heterogeneity analysis. Section 5 presents the conclusions and policy implications.
2. Literature Review and Research Hypotheses
2.1. Literature Review
Green growth describes a development pattern that combines economic expansion with ecological protection [17]. Accordingly, assessing green growth requires economic performance to be evaluated together with resource use and environmental emissions. Green total factor productivity (GTFP) is widely used for this purpose [18]. GTFP is typically measured using data envelopment analysis (DEA), with common specifications including the SBM, super-efficient SBM, and SBM–DDF models [19]. In addition, some studies construct multi-indicator systems that integrate resource, environmental, and economic dimensions [20].
Beyond measurement, increasing attention has been given to the policy drivers of green growth, particularly government intervention. Because economic agents may not fully bear the environmental costs of resource depletion and pollution, policy intervention is often needed to correct these externalities and support green development [21,22,23]. One strand of research focuses on regional development policies. Various pilot programs in China, such as smart-city construction [19], free-trade zones [24], and e-commerce initiatives [25], have been found to promote green growth, although their effects may vary across regions and over time.
Another strand of research centers on environmental regulation. In line with the Porter hypothesis, appropriately designed environmental policies may generate both environmental and economic benefits. Empirical evidence further shows that command-and-control, market-based, and voluntary instruments produce different effects on green growth [26,27]. Against this background, green finance has developed into a distinct policy tool that combines market-based incentives [7] with regulatory discipline [15], attracting increasing attention for its role in supporting green development. Existing research on green finance and green growth has largely focused on provincial-level evidence [28,29,30].
With the rollout of China’s PZGFRI policy, growing attention has been paid to its environmental and economic effects at the city level. Existing research generally finds that the policy contributes to resource conservation and environmental protection, including reducing air pollution [10], lowering carbon intensity [11], decreasing industrial energy consumption [12], and promoting ecological sustainability [13]. However, ecological improvement alone does not fully capture the objective of green transformation, which also requires balancing economic growth with environmental sustainability.
Accordingly, recent studies have increasingly explored the PZGFRI policy’s effects on green growth. Most studies document a positive effect and attribute this effect to mechanisms such as digitization [7], technological innovation [14], and resource allocation [15]. These explanations focus primarily on how green finance improves existing production activities. Recent evidence further suggests that the PZGFRI policy supports inclusive green growth partly through stronger urban entrepreneurial vitality [16]. However, how market-entry responses complement technological responses in explaining city green growth measured by GTFP remains insufficiently understood. By creating new business opportunities and improving the resource and institutional conditions for market entry, green finance policies may stimulate entrepreneurial activity.
Green innovation and entrepreneurship should not be viewed as isolated responses [31,32]. Green innovation and entrepreneurship capture two distinct behavioral responses to green finance reform: a technological response and a market-entry response. Conceptually, these responses broadly correspond to two margins of economic adjustment: technological upgrading within the existing production system and market entry through new firm formation. More specifically, green innovation reflects efforts to develop and apply environmentally friendly technologies [33], whereas entrepreneurship is commonly reflected in new firm formation and market entry [34]. Both have been recognized as important drivers of green growth [35]. Incorporating them into a common analytical framework can therefore further clarify how green finance contributes to city green growth.
The existing literature also provides mixed evidence on policy heterogeneity. Some studies find stronger effects in eastern regions, where capital, talent, and infrastructure are more abundant [14], whereas others report larger effects in western regions because of their lower starting levels of development and greater room for improvement [7]. These inconsistent findings suggest that broad regional classifications may obscure substantial differences among cities within the same region. More specific characteristics, such as administrative status, government efficiency, and pollution levels, may provide a clearer understanding of how local development conditions shape green-finance policy outcomes.
Despite these advances, two gaps remain. First, although recent studies have begun to consider entrepreneurial vitality alongside technological innovation, the distinction between technological and market-entry responses remains insufficiently developed in research on city green growth. This limits the understanding of how green finance policy reshapes different behavioral decisions of economic actors. Second, existing heterogeneity analyses rely mainly on broad regional comparisons and therefore provide limited evidence on how local development conditions shape policy effectiveness. Addressing these gaps can deepen the understanding of how green finance policy contributes to city green growth and offer more precise evidence for differentiated policy implementation.
2.2. Research Hypotheses
Based on the preceding discussion, this study constructs a common analytical framework linking the PZGFRI policy to city green growth through two behavioral responses: green innovation as a technological response and entrepreneurship as a market-entry response (see Figure 1).
Figure 1.
The theoretical framework for the PZGFRI policy’s impact on city green growth.
The PZGFRI policy emphasizes building a green finance system, encouraging green credit, establishing markets for environmental rights trading, creating priority government service channels for green activities, and improving risk prevention mechanisms [36]. Accordingly, green finance policies are expected to promote green growth by reallocating resources from brown sectors to greener activities.
On the one hand, measures such as credit restrictions, disclosure requirements, and quota management raise the financing [37,38,39] and compliance costs [40,41] of pollution-intensive sectors, thereby discouraging environmentally harmful production. On the other hand, instruments including interest subsidies, guarantees, and green service channels reduce the financing [42,43,44] and institutional [45] costs of green projects, facilitating the expansion of low-emission and high-efficiency activities. Through this dual process of “restricting brown” and “promoting green,” resources are reallocated toward more sustainable uses, thereby enhancing city green growth. Accordingly, the following hypothesis is proposed:
H1.
The PZGFRI policy promotes green growth in pilot cities.
To further understand how green finance policy promotes city green growth, this study considers two distinct behavioral responses of economic actors. Green innovation and entrepreneurship capture two distinct behavioral responses to green finance reform: a technological response and a market-entry response. The former concerns developing and applying environmentally sustainable technologies, whereas the latter concerns potential entrepreneurs’ decisions to establish new firms and enter the market. Although these responses involve different types of economic decisions, both may contribute to city green growth. Examining them within a common analytical framework can therefore provide a more complete explanation of the policy’s effects.
Green finance can promote city green growth by reinforcing the technological response represented by green innovation. Green innovation improves production technologies and enhances the environmental efficiency of economic activities. As China moves from high-speed expansion to high-quality development, green finance plays an important role in enhancing cities’ green innovation capacity [46]. Innovation-driven growth theory suggests that green innovation, through advances in technologies, production processes, and materials, improves the efficiency of resource and energy use and thereby supports environmentally sustainable economic growth [33]. Empirical evidence at the national, provincial, and city levels also documents the positive effect of green innovation, especially frontier-shifting technological change, on green growth [47,48,49].
In theory, the PZGFRI policy can foster green innovation through three pathways: expanding green R&D investment, reducing innovation risks, and facilitating green technology spillovers. First, by deploying a diversified set of financial instruments to provide targeted financing for green activities, the policy improves access to funding for green R&D and encourages greater innovation investment [50,51]. Given the substantial initial investment and lengthy return periods associated with green innovation, together with constraints in traditional financing channels [52], policy-oriented funding improves the feasibility of such investments. Second, because green innovation often involves considerable technological risk and market uncertainty [53], the PZGFRI policy can mitigate these risks through risk-sharing mechanisms such as guarantees and insurance [54], thereby strengthening incentives to engage in R&D. Third, by prioritizing green industries and projects, the policy directs financial resources toward activities with greater green innovation potential. The resulting concentration of innovative resources may generate technological spillovers and network externalities that support the dissemination and adoption of green technologies [54,55]. Accordingly, the following hypothesis is proposed:
H2.
The PZGFRI policy promotes city green growth by fostering green innovation.
Green finance can also contribute to city green growth by stimulating the market-entry response represented by entrepreneurship. As a process through which financial resources and market opportunities are transformed into new economic activity, entrepreneurship helps shape the structure and dynamics of economic growth. During the green transition, new firm formation can support market renewal and facilitate the reallocation of resources toward emerging economic activities. While green innovation reflects a technological response, entrepreneurship reflects potential entrepreneurs’ decisions to establish new firms and enter the market. By facilitating new firm formation and strengthening market dynamism, entrepreneurship may contribute to the adjustment and renewal of city economies. Green finance provides an important policy environment for this process. Existing evidence also suggests that entrepreneurship has a positive effect on city green growth [35].
In theory, the PZGFRI policy can stimulate entrepreneurship through three pathways: creating business opportunities by guiding investment toward green industries, strengthening the local human capital base, and improving the business environment. Together, these pathways expand entrepreneurial opportunities, improve access to key resources, and reduce market-entry frictions.
First, by directing financial resources toward green industries and supporting their development [14], the policy creates new market demand and business opportunities [55], thereby encouraging potential entrepreneurs to establish new firms and enter the market. Second, by improving environmental quality [13] and increasing cities’ attractiveness to skilled workers, the policy can strengthen the local human capital base, facilitate entrepreneurial team building, and improve the viability of new ventures [56,57]. Third, through specialized financial services, priority government service channels, improved information disclosure, and market-based screening mechanisms [58], the policy improves the business environment and reduces institutional and transaction frictions associated with market entry, thereby encouraging entrepreneurial activity. Accordingly, the following hypothesis is proposed:
H3.
The PZGFRI policy promotes city green growth by stimulating entrepreneurship.
3. Data and Methodology
3.1. Sample Selection and Data Sources
In June 2017, the State Council of China approved eight PZGFRI pilot areas across five provinces (autonomous regions), including Huzhou and Quzhou in Zhejiang Province, Ganjiang New Area in Jiangxi Province, Guangzhou in Guangdong Province, Gui’an New Area in Guizhou Province, and the cities of Hami, Changji, and Karamay in Xinjiang Uygur Autonomous Region. Subsequently, Lanzhou New Area in Gansu Province and Chongqing were added to the PZGFRI program in 2019 and 2022, respectively.
Given that Lanzhou New Area and Chongqing entered the program relatively recently, their effects on city green transformation may not yet be fully observable. Therefore, both are dropped from the sample. Additionally, cities with extensive missing data, such as Hami and Changji, are also excluded. Then, the city-level data primarily comes from the annual China Urban Construction Statistical Yearbook and the China City Statistical Yearbook. Missing values are supplemented by referring to each city’s respective statistical yearbook and annual statistical bulletins by using linear interpolation techniques. Because Gui’an and Ganjiang New Areas are below the prefecture-city level, we use their host cities as proxy treatment units. Gui’an is represented by Guiyang and Anshun, while Ganjiang is represented by Nanchang and Jiujiang. Together with Huzhou, Quzhou, Guangzhou, and Karamay, these constitute the eight treated cities.
3.2. Model Specification
Building on approaches used in prior studies on the PZGFRI policy [59], a DID model is specified to estimate its effect on city green growth.
where i indexes cities and t indexes years. The GGit denotes the city-level green growth for city i in year t. And didit = treati × postit represents the policy dummy variable, where treati equals 1 if city i is a PZGFRI in year t, and 0 otherwise. The postit represents whether city i is impacted by the policy in year t, where postit equals 1 if the city is affected by the policy, and 0 otherwise. And Zit represents a series of control variables. Finally, μi denotes the city fixed effects, λt represents the time fixed effects, and εit is the random error term. All econometric analyses were conducted using Stata 18.0.
3.3. Variable Description
3.3.1. Dependent Variable
City green growth (GG). Drawing on previous studies [19,60], GTFP is used to measure city green growth. The measurement indicators are divided into inputs and outputs, with outputs further categorized into expected and unexpected outputs, as shown in Table 1.
Table 1.
Measurement indicators for the dependent variable.
Based on these measurement indicators, further referencing the study of Tone [60], a SBM model is constructed to measure GTFP, which includes undesirable outputs.
We treat each city-year observation as a decision-making unit (DMU). The input vector includes capital, labor, and electricity consumption; other energy inputs were not included because comparable city-level data were unavailable; GDP and green coverage area are specified as the desirable output; and industrial wastewater, industrial dust, sulfur dioxide emissions, and carbon dioxide emissions are treated as undesirable outputs. We measure environmentally adjusted productivity using the Slack-Based Measure–Global Malmquist-Luenberger (SBM-GML) approach. The SBM component directly accounts for input excesses, desirable-output shortfalls, and undesirable-output excesses through slack variables. The production technology is constructed from the observations across the study period to form a global reference set, under the constant-returns-to-scale assumption. This common global technology permits productivity comparisons across adjacent years and avoids the infeasibility that may arise when conventional Malmquist-Luenberger indices compare observations against different period-specific technologies.
Let xit, yit and bit denote, respectively, the input, desirable-output, and undesirable-output vectors for city i in year t. Using the SBM-based global directional distance function , the GML index between years t and t + 1 is calculated as:
A GML index greater than one indicates an improvement in green total factor productivity between the two years; an index equal to one indicates no change, and an index below one indicates a decline. To obtain a GTFP level index, following Wang and Guo [62], we normalize the 2010 value to one and compound the adjacent-year GML indices:
The resulting GTFP level index is used as the dependent variable in the regression analysis. It represents the cumulative change in productivity relative to the base year, whereas the annual GML index measures the productivity change between two adjacent years.
To measure urban green and low-carbon productivity, we define the production technology with capital, labor, and electricity consumption as inputs; GDP and built-up-area green coverage as desirable outputs; and wastewater, waste gas, industrial SO2 emissions, and city-level CO2 emissions from the EDGAR database as undesirable outputs. GDP captures economic production, while green coverage serves as a proxy for ecological benefits associated with urban green space. Urban green spaces provide ecosystem services such as air filtration, microclimate regulation, stormwater management, and recreational and cultural benefits [63,64]. Related city-level studies have also used green area or built-up-area green coverage as an indicator of environmental benefits or desirable ecological output [65]. Green coverage is therefore not treated as land itself or as a conventional market output. Area alone does not capture green-space quality, accessibility, or the opportunity cost of land allocated to green space, and interpreting it as a proxy for ecological output. To assess the sensitivity of the results to this measurement choice, we also construct an alternative GTFP measure excluding green coverage and city-level CO2 emissions. The estimated DID coefficients remain positive and statistically significant under both SBM-GML and SSBM-GML (Appendix A Table A1).
3.3.2. Explanatory Variable
PZGFRI policy (didit = treati × postit). For cities designated as PZGFRI, treat = 1; otherwise, treat = 0. Given that the PZGFRI policy was launched in June 2017, the indicator is defined such that pilot cities take post = 1 in 2017 and thereafter, and post = 0 otherwise. The sample comprises 284 prefecture-level cities over 2011–2022. Hence, the treatment group consists of the eight cities across five provinces (autonomous regions) designated in the first batch in June 2017 (Specifically including: Huzhou, Quzhou, Karamay, Anshun, Guiyang, Guangzhou, Nanchang and Jiujiang), and the remaining cities constitute the control group.
3.3.3. Control Variables
To reduce potential omitted-variable bias, the model includes five controls: Urbanization rate (urb), infrastructure level (road), consumer market size (cons), government intervention (gov), and human capital (human). Road area per capita varies substantially across cities. Taking its natural logarithm reduces the influence of high values and captures proportional differences in road provision. The specific indicators for these controls are reported in Table 2.
Table 2.
Measurement indicators for control variables.
Descriptive statistics for all variables are presented in Table 3.
Table 3.
Variable descriptive statistics.
4. Empirical Results and Analysis
4.1. Baseline Regression Results
Table 4 reports two-way fixed-effects estimates with standard errors clustered at the city level in all columns. After excluding Lanzhou New Area and Chongqing, the baseline estimation sample consists of 282 cities and 3384 city-year observations, down from 284 cities and 3408 observations in the full sample. Because only eight cities were initially treated, conventional city-clustered inference may be imprecise despite the large number of city clusters. We therefore report city-clustered standard errors and conventional p-values alongside wild cluster bootstrap-t (WCB) p-values [69,70,71,72]. Column (1) includes no controls; Column (2) includes the baseline controls except government intervention; and Column (3) includes all five baseline controls. The estimated policy coefficients are 0.169, 0.174, and 0.168, respectively. Their wild cluster bootstrap-t p-values are 0.015, 0.010, and 0.025, while the conventional city-clustered p-values are 0.0018, 0.0018, and 0.0022. The full-control estimate is 0.1685. Relative to the full-sample mean of 1.072, this coefficient is about 15.7%; relative to the treated cities’ pre-policy mean of 1.090, it is about 15.5%.
Table 4.
Baseline regression results.
Because GTFP is constructed using a common DEA frontier, disturbances may be correlated across cities as well as over time. To assess whether the baseline inference is sensitive to such dependence, we retain the baseline specification and estimate its covariance matrix using Driscoll–Kraay standard errors [73] with a two-period lag. The estimated policy coefficient remains 0.1685, with a standard error of 0.0182 and a 95% confidence interval of [0.1283, 0.2086] (p < 0.001); we report this as a supplementary estimate.
4.2. Parallel Trends Test
The DID design requires the treatment and control groups to follow comparable trends before policy implementation. To assess this condition, an event-study model is estimated with 2016, the year before implementation, as the reference period; the periods from 6 to 3 years before implementation and from 3 to 5 years after implementation are grouped, respectively. Because the dependent variable is a GTFP level index constructed by chaining annual GML indices, each event-study coefficient represents a difference in the index level relative to the 2016 reference period.
As shown in Figure 2, the estimation results for the aggregated event periods prior to policy implementation do not reach statistical significance. In this pooled specification, the joint pre-policy test has a conventional p-value of 0.612 and a wild cluster bootstrap-t p-value of 0.707. This provides no evidence of differential pre-policy trends between the treatment and control groups and supports the parallel trends assumption. Following implementation, the estimated coefficients for the policy year and all subsequent aggregated event periods are positive and statistically significant, indicating a significant improvement in green growth among pilot cities. Appendix A reports the event-study estimates for each unpooled lead and lag.
Figure 2.
Parallel trends test results.
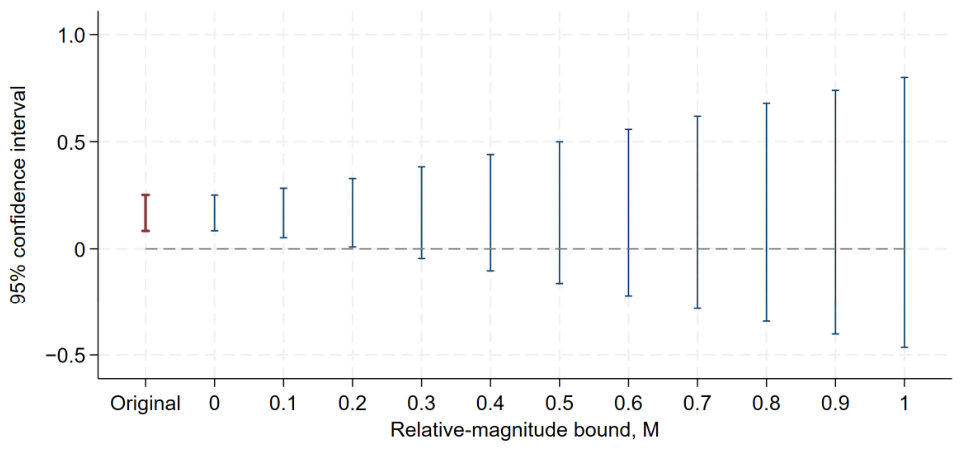
To assess sensitivity to departures from parallel trends, we apply the Rambachan–Roth HonestDiD procedure [74] to the unpooled event-study specification, focusing on the average treatment effect over event times 0 to +5. Under the relative-magnitude (RM) restriction, we evaluate M from 0 to 1 in increments of 0.1. The 95% robust confidence interval excludes zero at M = 0.2 ([0.009, 0.328]) but includes zero at M = 0.3 ([−0.045, 0.383]); thus, M = 0.3 is the first tested value at which the interval includes zero. This indicates that inference on the average effect is sensitive to allowing post-treatment trend violations to reach approximately 30% of the largest pre-treatment violation. This article reports the test results of HonestDiD as shown in Figure A2.
4.3. Placebo Tests
A placebo test is conducted to assess whether the baseline estimate could result from random treatment assignment. We conduct a joint city-and-timing placebo test [75,76]. In each of 500 valid permutations, eight pseudo-treated cities are selected and assigned a common pseudo-policy year drawn from 2014–2019, with at least three pre-policy and three post-policy years retained. The distribution of the resulting placebo estimates is shown in Figure 3. Using the updated baseline coefficient of 0.1685 as the reference value, 44 of the 500 placebo estimates have an absolute value at least as large as the observed estimate. The finite-simulation-corrected two-sided p-value is 0.090. The randomization-inference result (two-sided p = 0.090) provides modest support for the baseline finding.
Figure 3.
Placebo test results.
4.4. Robustness Tests
The baseline estimates show a positive effect of the PZGFRI policy on city green growth. The stability of this finding is examined under alternative specifications and sample treatments. These checks include controls for concurrent policy interventions, an alternative measure of city-level green growth, exclusion of the COVID-19 period, winsorization of continuous variables, retention of all pilot zones, and propensity score matching combined with DID. Together, these analyses assess the stability of the baseline finding under different empirical settings.
- (1)
- Controlling for other policy interventions.
To reduce concerns that the estimated effect reflects concurrent policy interventions, this study additionally controls for several policies that may affect city green growth. The low-carbon city pilot policy, smart-city initiative, carbon emissions trading pilot, and innovative industrial cluster program are separately added to the baseline specification. As reported in Columns (1) to (4) of Table 5, the coefficient on the PZGFRI indicator remains positive and statistically significant in each specification. These results indicate that the baseline finding is not sensitive to separately controlling for these concurrent policies.
Table 5.
Robustness test results (1).
- (2)
- Alternative measure of the dependent variable.
Following Qiu et al. [77], the standard SBM model is used as an alternative approach to measuring city green growth. As reported in Column (1) of Table 6, the PZGFRI coefficient remains positive and significant at the 5% level. The result is therefore insensitive to the alternative measure of the dependent variable.
Table 6.
Robustness test results (2).
The relative magnitude of the estimated effect depends on the GTFP measure used. The 15.5% figure applies to the main GTFP measure; for the alternative measure in Column (1) of Table 6, the coefficient of 0.159 is approximately 7.1% of the reference level of 2.252. These percentages are therefore measure-specific and should not be compared directly across different GTFP measures.
- (3)
- Excluding COVID-19 years.
The COVID-19 pandemic caused disruptions to production, employment, and resource allocation, potentially affecting the measurement of city green growth. Accordingly, observations from 2020 and 2021 are removed before re-estimating the baseline model. Column (2) of Table 6 shows that the estimated coefficient remains positive and statistically significant. This result suggests that the baseline finding is not driven by observations during the main COVID-19 period.
- (4)
- Winsorization.
To limit the influence of extreme values, the dependent variable and all continuous control variables are winsorized at the 1% level. The baseline model is then re-estimated. Column (3) of Table 6 shows that the PZGFRI coefficient remains positive and significant at the 1% level, suggesting that the result is insensitive to the treatment of extreme values.
- (5)
- Retaining all pilot zones.
The baseline sample excludes Lanzhou New Area and Chongqing because their relatively recent designation leaves only a short post-policy observation period. As a robustness check, all later-designated pilot areas are retained in the sample, and the policy effect is re-estimated. The full-pilot specification contains 284 cities and 3408 observations and assigns treatment timing to the 2017, 2019, and 2022 adoption cohorts.
To assess whether the baseline TWFE estimate is sensitive to staggered policy adoption and its implicit comparison weights, we apply the doubly robust Callaway–Sant’Anna difference-in-differences estimator (C-S) [78], which estimates treatment effects by cohort and year. The overall ATT is 0.104 (asymptotic SE = 0.055, p = 0.061; 95% wild-bootstrap CI [−0.005, 0.212]), about 41% below the full-pilot TWFE estimate of 0.176; the C-S aggregation is driven mainly by the 2017 cohort, whose ATT is 0.107 and whose cohort-time cells account for 90.6% of the aggregate weight. The cohort sizes (8, 1, and 1 cities) place some limits on cohort-specific inference, particularly for the latter two cohorts, so we report the wild-bootstrap confidence interval alongside the asymptotic results.
- (6)
- PSM model.
Pilot-city selection may reflect observable differences between treated and untreated cities. To reduce the resulting selection concern, this study combines propensity score matching with the DID approach. Kernel matching and radius matching are employed; matching is conducted at the city level using 2011–2016 averages of industrial structure, FDI, human capital, population density, environmental regulation, and R&D intensity. Columns (5) and (6) of Table 6 show that the PZGFRI coefficient remains positive and statistically significant under both matching methods. The common-support sample contains 218 cities, or 2616 city-year observations. The kernel and radius estimates are 0.167 (SE 0.055; wild cluster bootstrap-t p = 0.071) and 0.158 (SE 0.055; p = 0.056), respectively. The balance diagnostics presented in Figure 4 further indicate that covariate balance improves after matching. These results provide additional evidence that the baseline conclusion is robust to selection based on observable characteristics.
Figure 4.
Covariate balance under kernel and radius matching.
- (7)
- SDID model.
To further examine the robustness of the baseline two-way fixed-effects estimates, this study employs the synthetic difference-in-differences method (SDID) [79]. SDID simultaneously constructs unit weights and time weights. The unit weights are used to form a synthetic control group for the treated cities, while the time weights capture the relative importance of different pre-treatment periods in constructing the counterfactual. Specifically, the model assigns nonnegative unit weights to the 274 donor cities, with the weights summing to one. It then estimates the time weights based on the pre-treatment fit and calculates the average treatment effect by subtracting the weighted pre-treatment gap from the weighted post-treatment gap between the treated group and the synthetic control group.
Column (7) of Table 6 reports an SDID average treatment effect of 0.164, with the standard error and inferential statistics based on the leave-one-treated-city-out jackknife procedure. The jackknife standard error is 0.069, with a two-sided p-value of 0.018 and a 95% confidence interval of [0.029, 0.300]. We also estimated the variance using the placebo-based procedure. This yields a standard error of 0.109, a p-value of 0.131, and a 95% confidence interval of [−0.049, 0.378]. The point estimate remains positive and close in magnitude to the baseline DID estimate of 0.168; the placebo-based estimate is less precise, so the statistical inference is sensitive to the variance estimation procedure. Given that the treatment group contains only eight cities, we report both results side by side without designating either as the sole basis for inference.
Figure 5 presents the SDID-weighted trends for the treated group and the synthetic control group. The synthetic control group is constructed from the 274 donor cities using the estimated unit and time weights, and the vertical dashed line indicates the policy implementation year, 2017. Before policy implementation, the two groups exhibit broadly similar upward trends, with a relatively stable difference in GTFP. After 2017, the treated-group curve generally lies above the synthetic-control curve, and the gap remains positive through the end of the sample. These patterns are consistent with the positive SDID point estimate reported in Table 6.
Figure 5.
SDID-weighted trends in GTFP (2010 = 1) (GTFP index for treated cities and the SDID-weighted comparison group, 2011–2022 (2010 = 1). Values indicate GTFP relative to the 2011 level; the dashed line marks policy implementation in 2017).
- (8)
- Excluding cities associated with the new areas.
Given that the Guian New Area and Ganjiang New Area are below the prefecture-city level, the corresponding prefecture-level cities may not be appropriate as controls when they are partially exposed to the pilot policy. We therefore conduct a treatment-scope robustness check by excluding Guiyang, Anshun, Nanchang, and Jiujiang entirely from the sample. This exclusion leaves 3336 observations. As reported in Column (1) of Table 7, the estimated policy coefficient is 0.192, with a city-clustered standard error of 0.056 and a wild cluster bootstrap-t p-value of 0.033. The positive estimate remains statistically significant under the small-cluster inference.
Table 7.
Robustness test results (3).
- (9)
- Retaining one prefecture-level city per new area.
To avoid representing each new-area pilot with multiple prefecture-level cities, we retain Guiyang as the treated city representing the Guian New Area and Nanchang as the treated city representing the Ganjiang New Area. Anshun and Jiujiang are excluded from the sample entirely. This specification contains 3360 observations. Column (2) of Table 7 reports a policy coefficient of 0.168, with a city-clustered standard error of 0.054 and a wild cluster bootstrap-t p-value of 0.023. The estimated effect remains positive and statistically significant.
Column (2) of Table 7 shows that the policy coefficient remains significant at the 5% level, indicating that the positive effect on GTFP persists when only one representative prefecture-level city is retained for each new area.
- (10)
- Excluding geographically adjacent control cities.
Because policy demonstration, factor flows, or coordinated environmental governance may generate spillovers to nearby control cities, we conduct an additional robustness check that excludes non-pilot cities sharing an administrative boundary with a pilot city. We remove 26 adjacent control cities, corresponding to 312 city-year observations. The resulting sample contains 3072 observations from 256 cities. As shown in Column (3) of Table 7, the estimated policy coefficient is 0.156, with a city-clustered standard error of 0.055 and a wild cluster bootstrap-t p-value of 0.025. The positive estimate remains statistically significant after the adjacent control cities are excluded.
- (11)
- Excluding Guangzhou.
The Guangdong pilot zone was centered in Huadu District. Because treatment is identified at the prefecture-level city, Guangzhou is partially treated in our city-level sample, similar to cities hosting the selected new areas. We therefore re-estimate the baseline model after excluding Guangzhou. The estimated policy effect remains positive at 0.146, with a WCB p-value of 0.040, consistent with the baseline finding.
- (12)
- Excluding the 2016–2017 Transition Period.
Because the policy was initiated in 2017 and the outcome exhibits a marked change around the policy’s introduction, we conduct a targeted timing-sensitivity check by excluding 2016, the immediately preceding year, and 2017, the initial implementation year. The DID coefficient is 0.169 (SE = 0.065), close to the baseline estimate of 0.168. It remains statistically significant under both conventional city-clustered inference (p = 0.009) and the Webb-weight wild cluster bootstrap-t test (p = 0.029). This suggests that the baseline result is not driven by observations from the immediate policy-implementation window.
4.5. Mechanism Analysis
Section 2 suggests that green innovation and entrepreneurship contribute to city green growth, a relationship also supported by existing studies. To examine the mediating roles of green innovation and entrepreneurial entry capabilities, a three-step procedure is adopted to analyze the underlying mechanisms. First, the baseline specification is used to estimate the overall effect of the PZGFRI policy on city GTFP:
GTFPit = c0 + c1didit + c2Xit + μi + λt + εit
Next, we examine the impact of the PZGFRI policy on the mechanism variables:
Mit = a0 + a1didit + a2Xit + μi + λt + εit, t ∈ {2011, …,2021}
Equation (5) is estimated using observations from 2011 to 2021. Among them, Mit represents the green technology structure, the share of green invention patent applications, and the entrepreneurial entry rate, respectively. Finally, the mechanism variable lagged by one period is incorporated into the regression model with GTFP as the dependent variable:
here, Mi,t−1 represents the lagged mechanism variable, b captures its effect on city GTFP, while c′ represents the direct policy effect after controlling for the mechanism variable. didit denotes the PZGFRI policy variable, and Xit represents the control variables. The outcome equation includes mechanism variables lagged by one year. Green innovation takes time to progress from R&D and patent applications to practical use, while newly registered firms need time to establish operations before affecting city-level GTFP. Using lagged mediators also helps reduce contemporaneous feedback between the mediators and GTFP.
GTFPit = b0 + c′didit + b1Mi,t−1 + b2Xit + μi + λt + εit, t ∈ {2012, …,2022}
To align the policy indicator and mediator in path a, we regress the contemporaneous mediator Mit on the contemporaneous policy indicator didit. The outcome equation uses current GTFP as the dependent variable and includes didit and the one-year lagged mediator Mi,t−1. Both equations include the relevant controls and city and year fixed effects, with standard errors clustered by city. Regressions are estimated for 2012–2022; the 2011 mediator values are used only to construct the lagged variable for 2012. We report the product of the estimated path coefficients, with confidence intervals obtained from 500 city-clustered bootstrap replications.
Interpreting the product of these coefficients as a causal mediation effect requires sequential ignorability, including the absence of unobserved factors that jointly affect the mediator and GTFP. Pre-policy trend tests, fixed effects, and observed controls strengthen the design, while the lagged mediator reduces concerns about contemporaneous simultaneity. Time-varying unobserved confounding may nevertheless remain.
- (1)
- Green innovation (Innova).
Green innovation represents the technological response to green finance reform. To examine whether the PZGFRI policy promotes green innovation, prefecture-level annual green patent applications are collected from the China National Intellectual Property Administration. Green patents primarily encompass green invention patents and green utility model patents. While both represent outputs of green technological innovation, they differ in terms of technical content, degree of innovation, and examination requirements. Invention patents generally involve greater technical complexity and more stringent substantive examination than utility model patents. Because green invention patents and green utility model patents differ in technical content and examination requirements, we focus on the composition of green patent applications by patent type. Green technology structure is used as the primary indicator, while the share of green invention patent applications provides an alternative measure of the same dimension. The green technology structure indicator is defined as follows:
when both green invention and green utility model patent applications are zero, the green technology structure measure remains defined and equals zero, so these observations are retained. The invention-application share is undefined when total green patent applications are zero. Two such city-year observations are therefore excluded only from the share-based mediation model, yielding 3102 observations for the technology-structure model and 3100 for the invention-share model.
As a robustness check, we use green invention patent applications as a share of total green patent applications. This indicator captures the relative prominence of invention patents in the composition of green patent applications.
Columns (1)–(4) examine the two innovation-related mechanisms. Columns (1) and (3) estimate path a, relating the policy indicator to the contemporaneous mediator over 2011–2021. Columns (2) and (4) estimate the GTFP equation over 2012–2022, including the one-period-lagged mediator, alongside the contemporaneous policy indicator. All specifications include the control variables, city fixed effects, and year fixed effects, with standard errors clustered at the city level. In column (1), the policy coefficient for green technology structure is 0.095 (SE = 0.041, p < 0.05), suggesting that the policy is associated with an increase in this measure. In column (2), the coefficient on lagged green technology structure is 0.071 (SE = 0.025, p < 0.01), while the policy coefficient remains positive and significant at 0.157 (SE = 0.054, p < 0.01). The results using the green invention patent share show a similar pattern, although the estimated policy–mediator association is weaker: the coefficient in column (3) is 0.051 (SE = 0.027, p < 0.10). In column (4), the lagged patent-share coefficient is 0.107 (SE = 0.047, p < 0.05), and the policy coefficient remains positive and significant at 0.158 (SE = 0.054, p < 0.01). The city-cluster bootstrap estimates of the indirect effects are 0.00561 for green technology structure and 0.00452 for the green invention patent share. Their bias-corrected 95% confidence intervals are [0.00079, 0.01557] and [0.00012, 0.01490], respectively, both excluding zero. As a supplementary inference check, Webb-weighted wild cluster bootstrap-t p-values for the path-a coefficients are 0.068 for green technology structure and 0.117 for patent share. The corresponding p-values for the policy coefficients in the outcome equations are 0.017 and 0.016. Thus, the outcome-equation results remain significant under this check, while the path-a evidence is stronger for green technology structure than for patent share.
These findings are consistent with Hypothesis H2. Green finance reform is associated with city-level green innovation, as measured by green patent applications, and the lagged innovation measures are positively associated with the city’s GTFP. From a policy perspective, this highlights the importance of strengthening financial support for green technological innovation and facilitating the application and diffusion of green technologies. The regression estimates for the green-innovation mechanisms and the entrepreneurial-entry channel are reported in Table 8.
Table 8.
Mechanism analysis results.
- (2)
- Entrepreneurship (Power)
Entrepreneurship represents potential entrepreneurs’ market-entry response to green finance policy. By facilitating new firm formation and strengthening market dynamism, entrepreneurship can contribute to the adjustment and renewal of city economies. Prior research argues that a city’s capacity to generate new firms captures its level of entrepreneurship [80]. Accordingly, the number of newly registered firms in each city is used to measure entrepreneurial activity. Following Jiang et al. [81], the registered population is used as the normalization base, and entrepreneurship is defined as the number of new firms per 100 residents. Annual new-firm registrations are drawn from the Qichacha database and aggregated at the city-year level. Year-end registered population is used as the denominator. Because consistent industry classification is unavailable in the registration data, the measure does not distinguish the sectoral orientation of new entrants. This limitation is considered when interpreting the entrepreneurship channel.
Columns (5) and (6) examine entrepreneurial entry as a potential market-entry mechanism. Column (5) estimates path a over 2011–2021, while column (6) relates GTFP over 2012–2022 to the one-period-lagged entrepreneurial-entry rate and the contemporaneous policy indicator. The specifications include the control variables, city fixed effects, and year fixed effects, and report standard errors clustered at the city level. In column (5), the policy coefficient for entrepreneurial entry is 0.113 (SE = 0.058, p < 0.10), indicating a positive association at the 10% significance level. In column (6), the coefficient on lagged entrepreneurial entry is 0.148 (SE = 0.049, p < 0.01). The policy coefficient remains positive at 0.146 (SE = 0.057, p < 0.05) after controlling for the lagged mediator. The estimated indirect effect is 0.01404, with a bias-corrected 95% city-cluster bootstrap confidence interval of [0.00086, 0.03957], which excludes zero. In the supplementary Webb-weighted wild cluster bootstrap-t results, the p-value for path a is 0.126, whereas the p-value for the policy coefficient in the outcome equation is 0.031. These results are consistent with entrepreneurial entry as a potential mechanism, although the path-a evidence is less robust to the wild cluster bootstrap check. The city-cluster bootstrap estimates of the indirect effects for the three channels, together with their bias-corrected 95% confidence intervals, are summarized in Table 9.
Table 9.
Bootstrap mediation effect summary (500 repetitions).
The joint roles of green innovation and entrepreneurial entry are further examined using the parallel mediation regressions reported in Columns (1) and (2) of Table 10. Column (1) includes the one-period lagged green technology structure and entrepreneurial entry rate simultaneously, while Column (2) replaces green technology structure with the share of green invention patent applications. Both mediator coefficients are positive and statistically significant in the respective specifications, while the policy coefficient remains positive and statistically significant at the 10% level. To quantify the indirect contributions and their relative shares, we use a city-cluster pairs bootstrap and report bias-corrected confidence intervals in Table 11. In Column (1), the joint indirect effect is 0.01922 (BC 95% CI: [0.00148, 0.04624]), corresponding to 11.89% of the total effect; the estimated contribution shares are 3.35% for green technology structure and 8.54% for entrepreneurial entry. In Column (2), the joint indirect effect is 0.01796 (BC 95% CI: [0.00036, 0.04831]), or 11.11% of the total effect; the estimated contribution shares are 2.58% for the green invention application share and 8.53% for entrepreneurial entry. These estimates provide a quantitative summary of the indirect contributions in the two parallel mediation specifications.
Table 10.
Parallel mechanism analysis results.
Table 11.
Bootstrap summary of parallel mediation effects.
In the parallel mediation model in Column (2) of Table 11, the specific indirect effect through entrepreneurial entry is positive (0.01379), but its BC 95% confidence interval includes zero ([−0.00002, 0.03854]). The specific indirect effect through the green invention patent application share also has a BC 95% confidence interval that includes zero (0.00417; [−0.00049, 0.01440]). By contrast, the joint indirect effect through the two mediators is 0.01796, and its BC 95% confidence interval excludes zero ([0.00036, 0.04831]). Thus, the results support a statistically significant joint indirect effect, while neither mediator-specific indirect effect is individually distinguishable from zero. Furthermore, all 500 replications were valid for each single-mediator model and parallel Model (2); parallel Model (1) had 499 valid replications, with one omitted because a required statistic was not estimable. No permutations were conducted.
Overall, the results indicate that the PZGFRI policy affects both green innovation and entrepreneurial activity, while the lagged mediator measures are positively associated with city GTFP. Taken together, this pattern is consistent with technological and market-entry responses to green finance reform.
4.6. Heterogeneity Analysis
- (1)
- Administrative status.
To explore potential heterogeneity in the policy effect between central and peripheral cities, we conduct an exploratory subgroup analysis. Following the policy orientation of the National New-type Urbanization Plan (2014–2020), we classify provincial capitals, sub-provincial cities, and municipalities directly under the central government as central cities, and the remaining cities as peripheral cities. The classification is based on each city’s status in 2016, before policy implementation, and is held fixed throughout the sample period. The central-city group comprises 33 cities, including 3 treated cities, and 396 observations; the peripheral-city group comprises 249 cities, including 5 treated cities, and 2988 observations. All regressions include the baseline controls and city and year fixed effects, with standard errors clustered at the city level. The estimated policy coefficient is 0.015 for central cities (SE = 0.126; WCB p = 0.929) and 0.172 for peripheral cities (SE = 0.059; WCB p = 0.034). These exploratory subgroup estimates show a positive and statistically significant coefficient for peripheral cities, while the estimate for central cities is not statistically significant. The exploratory DID estimates for central and peripheral cities are reported in Table 12.
Table 12.
Heterogeneity analysis results (1).
One possible explanation for the larger point estimate among peripheral cities is that they may have fewer established financing channels and less-developed green-finance services. In such settings, the policy may provide additional support by easing financing constraints and improving the allocation of funds to green projects. Central cities, by contrast, may already have more mature financial markets, stronger public-service capacity, and a larger existing base of green investment, leaving less room for incremental improvement from the policy.
- (2)
- Government efficiency.
Local governments’ administrative capacity and fiscal resources may affect how effectively green finance policies are implemented and how well policy support translates into improvements in green total factor productivity. To examine heterogeneity along this dimension, we use cities listed among the top 100 in the China Local Government Efficiency Research Report as the initial indicator of governance capacity, and combine this with pre-policy fiscal self-sufficiency to capture local fiscal capacity. Fiscal self-sufficiency is measured as general budget revenue divided by general budget expenditure, averaged over 2011–2016 for each city. Under Classification Method 1, a city is assigned to the higher-efficiency group if it is listed among the top 100 and its pre-policy fiscal self-sufficiency exceeds the sample mean. Under Method 2, the same top-100 criterion is used, but the fiscal self-sufficiency threshold is the sample median. Cities that do not meet both conditions are assigned to the lower-efficiency group. Defining the groups using pre-policy fiscal data avoids allowing post-policy fiscal changes to determine group membership, while using both the mean and median thresholds assesses the sensitivity of the results to the choice of cutoff.
Under Classification Method 1, the higher-efficiency group contains 72 cities, including 4 treated cities, with 864 observations; the lower-efficiency group contains 210 cities, including 4 treated cities, with 2520 observations. The estimated policy coefficient is 0.114 for the higher-efficiency group (WCB p = 0.332) and 0.202 for the lower-efficiency group (WCB p = 0.039), which is significant at the 5% level. Under Method 2, the higher- and lower-efficiency groups contain 76 and 206 cities, respectively; each includes 4 treated cities, and the groups have 912 and 2472 observations. The estimated coefficients are 0.123 for the higher-efficiency group (WCB p = 0.292) and 0.201 for the lower-efficiency group (WCB p = 0.052), again significant at the 10% level for the lower-efficiency group. Inference is based on WCB p-values.
This pattern is consistent with a possible institutional compensation effect. In lower-efficiency cities, the standardized procedures, greater information transparency, and cross-departmental coordination introduced by the PZGFRI policy may partly compensate for weaknesses in existing governance and improve the matching of financial resources with green projects. By contrast, higher-efficiency cities already possess relatively strong governance capacity and policy support, leaving less scope for additional institutional improvement. The exploratory estimates under both government-efficiency classification methods are reported in Table 13.
Table 13.
Heterogeneity analysis results (2).
- (3)
- Environmental pollution.
Environmental conditions may affect both the urgency of green investment and the potential for marginal improvement. To examine heterogeneity across pollution levels, this study follows Fu [82] and, given that the pressure of urban pollution is reflected not only in pollution emission intensity but is also closely linked to industrial structure characteristics, this paper classifies cities by comprehensively utilizing sulfur dioxide emission intensity and the share of the secondary industry. Specifically, for each city, we calculate the averages of the log of industrial sulfur dioxide emissions per unit of GDP and the secondary-industry share over 2011–2016. Using pre-policy measures ensures that group assignment is not affected by post-policy changes. Under Classification Method 1, a city is classified as higher-polluting if both measures are at or above their respective sample means. Under Classification Method 2, the same joint criterion is applied using the respective sample medians. Cities that do not meet both criteria are assigned to the other group. This joint classification captures both pollution intensity and the industrial structure associated with pollution, while the two cutoff rules allow us to assess whether the results are sensitive to the choice of threshold.
Table 14 reports the subgroup estimates, controlling for the baseline covariates and including city and year fixed effects. Under Classification Method 1, the higher-polluting group contains three treated cities and 1020 observations. Its estimated policy coefficient is 0.102, with a WCB p-value of 0.473. The other group contains five treated cities and 2364 observations; its coefficient is 0.199, with a WCB p-value of 0.054, significant at the 10% level. Under Classification Method 2, the higher-polluting group contains three treated cities and 948 observations, with a coefficient of 0.073 and a WCB p-value of 0.705. The other group contains five treated cities and 2436 observations; its coefficient is 0.197, with a WCB p-value of 0.067, also significant at the 10% level. The within-group inference thus displays a consistent pattern across the two classification methods.
Table 14.
Heterogeneity analysis results (3).
This pattern suggests that a higher initial pollution burden does not necessarily translate into a larger short-run productivity response to green finance policy. One possible explanation is that, although high-pollution cities face stronger environmental pressure, their pollution-intensive production systems may be more difficult and costly to transform. As a result, green finance may take longer to generate measurable improvements in green total factor productivity in these cities. By contrast, lower-pollution cities may be able to translate additional green financing into cleaner technologies and more efficient production more quickly, making the productivity gains more apparent within the study period. This interpretation is consistent with the subgroup estimates, under which the policy coefficient is statistically significant for the lower-pollution group but not for the higher-pollution group.
5. Conclusions and Policy Implications
Based on panel data for 282 Chinese prefecture-level cities over 2011–2022, the PZGFRI policy is evaluated as a quasi-natural experiment using a DID framework to assess its effect on city green growth. The baseline regression results indicate that green finance reform increased the GTFP of pilot cities by approximately 0.168, equivalent to 15.7% of the sample mean, and this finding remains robust across alternative specifications. The mechanism analyses provide evidence consistent with green innovation and entrepreneurial entry as potential technological and market-entry responses associated with improvements in city GTFP, with the former representing a technological response and the latter a market-entry response. By examining these two responses within a common analytical framework, this study provides a more comprehensive explanation of how green finance reform influences the real economy. Heterogeneity analyses further suggest larger policy effects in peripheral cities, cities with lower government efficiency, and less polluted cities, suggesting that the effects of green finance reform vary with local conditions.
The baseline estimate corresponds to approximately 15.5% of the treated cities’ pre-policy mean GTFP, indicating an economically meaningful improvement in green productivity. This conclusion is broadly consistent with the positive effects reported in related studies. For example, Liu et al. [7] report short- and long-run local direct effects of 18.9% and 12.2%, respectively, while Lin and Zhong [14] obtain a positive baseline estimate of 0.0251, equivalent to approximately 2.8% of the pre-policy mean GTFP in pilot areas. Meng et al. [15] likewise document an increasing post-policy GTFP gap between actual and synthetic Guangzhou. Xu et al. [16] further show that green finance promotes both green technology innovation and urban entrepreneurial vitality, although their outcome is the broader concept of inclusive green growth. These studies provide important evidence on individual policy effects and mechanisms. Building on this literature, the present study places technological adjustment and entrepreneurial entry within the same framework and further quantifies their joint contribution, which accounts for 11.89% and 11.11% of the corresponding total effects under the two alternative specifications.
First, the additionality and targeting of green finance policies should be strengthened. The weaker policy effect observed in central cities suggests that further policy expansion should focus not only on increasing the scale of financial support but also on generating net incremental investment. Local governments and financial institutions should improve green classification standards, information disclosure, project screening, and post-investment evaluation to reduce information asymmetry and the risk of greenwashing. Fiscal subsidies, credit instruments, guarantees, and other policy tools should also be better coordinated to direct resources toward projects that generate verifiable environmental and productivity benefits. At the same time, policy design should account for implementation costs and potential risks. Excessive policy intervention may lead to resource misallocation or crowd out market-based financing, particularly when subsidized capital is directed toward projects with weak additionality. Transparent eligibility criteria, periodic performance evaluation, and appropriate exit mechanisms are therefore needed to ensure that policy support complements rather than substitutes for market-based finance. In supporting entrepreneurial activity, financing eligibility and performance evaluation should be linked to clearly defined green-transition objectives so that new firm formation contributes more effectively to city green growth.
Second, green finance policies should activate both technological and market-entry responses. On the technological side, long-term financing instruments, credit guarantees, insurance, and stronger risk-sharing arrangements are needed to support green R&D and reduce the risks associated with technological development. Priority service channels should also be established for qualified green industries and projects to facilitate the transformation of green technologies from R&D and testing to application and diffusion. On the market-entry side, policy implementation should create business opportunities by supporting the development of green industries, strengthen the local human capital base through talent attraction and entrepreneurial services, and improve the business environment by simplifying firm registration, credit access, and exit procedures. These measures can reduce market-entry frictions and encourage entrepreneurial activity that is consistent with green-transition objectives.
Third, policy implementation should reflect differences in local development conditions. In peripheral cities, greater attention should be paid to strengthening local green-finance service capacity, developing a pipeline of investable green projects, and improving access to technology and skilled personnel. In cities with lower government efficiency, administrative procedures should be further standardized. This can be achieved by establishing unified criteria for green-project financing eligibility, standardizing evaluation procedures, clarifying departmental responsibilities, and strengthening interdepartmental information sharing. In higher-pollution cities, green finance should prioritize cleaner production transformation, including source reduction, process upgrading, cleaner technology adoption, and improved resource and energy efficiency, rather than relying excessively on end-of-pipe treatment. By contrast, central cities, cities with higher government efficiency, and cities with lower pollution levels should place greater emphasis on policy additionality, frontier green technologies, long-term decarbonization, and the cross-regional circulation of green-finance resources and expertise. Such differentiated strategies can improve the alignment between policy instruments and the dominant constraints faced by individual cities.
More broadly, the findings also provide implications for other developing countries seeking to use green finance to support green growth. Although institutional settings differ across countries, the results suggest that policy-driven green finance should not be viewed simply as an expansion of financial support. Its effectiveness depends on whether financial instruments induce meaningful behavioral responses among economic actors and are adapted to local development, institutional, and environmental conditions. For developing economies facing financing constraints, uneven governance capacity, and substantial environmental pressures, green-finance policies may therefore be more effective when financial incentives are combined with transparent project selection, support for technological upgrading and market entry, and differentiated implementation according to local constraints. At the same time, safeguards against resource misallocation, crowding out, and weak policy additionality are important for ensuring that public intervention complements rather than replaces market-based financial mechanisms.
Several issues warrant further investigation. First, because the sample period ends in 2022, the analysis mainly captures the short-term and medium-term effects of the PZGFRI policy. Future studies can use longer panels and dynamic tracking methods to examine whether the estimated effects persist, strengthen, or weaken over time. Second, the entrepreneurship measure is based on total newly registered firms and does not distinguish between green and non-green sectors. Therefore, the analysis cannot determine whether the increase in entrepreneurial activity associated with the PZGFRI policy is concentrated specifically in green industries. Future research could use more detailed firm-level industry information to distinguish green entrepreneurial entry. Third, this study adopts a city-level perspective and therefore cannot fully reveal the micro-level behavioral adjustments underlying the estimated policy effects. Future research could use firm-level and entrepreneur-level data to examine how green finance reform affects corporate investment, technological development, and market-entry decisions. Further attention could also be paid to how financial institutions and local governments adjust their financing, incentive, and regulatory practices during policy implementation. Such analyses would provide more detailed evidence on the micro-level foundations of the technological and market-entry responses identified in this study.
Author Contributions
Conceptualization, S.Z. and Y.L.; methodology, S.Z.; software, L.Z.; validation, S.Z., L.Z. and Y.L.; formal analysis, Y.L.; data curation, L.Z.; writing—original draft preparation, S.Z. and Y.L.; writing—review and editing, S.Z. and Y.L.; visualization, L.Z.; supervision, Y.L.; funding acquisition, Y.L. All authors have read and agreed to the published version of the manuscript.
Funding
This research was funded by the Scientific Research Fund of the Zhejiang Provincial Education Department (Y202557442) and Shaoxing University (XN2023044).
Institutional Review Board Statement
Not applicable.
Informed Consent Statement
Not applicable.
Data Availability Statement
The raw data supporting the conclusions of this article will be made available by the authors on request.
Conflicts of Interest
The authors declare no conflicts of interest.
Appendix A
Table A1.
Regression results using GTFP measures excluding green coverage and city-level CO2 emissions.
Table A2.
Bootstrap mediation effect summary (green technology structure).
Table A3.
Bootstrap mediation effect summary (share of green invention patents).
Table A4.
Bootstrap mediation effect summary (entrepreneurship).
Figure A1.
Unpooled event-study estimates.
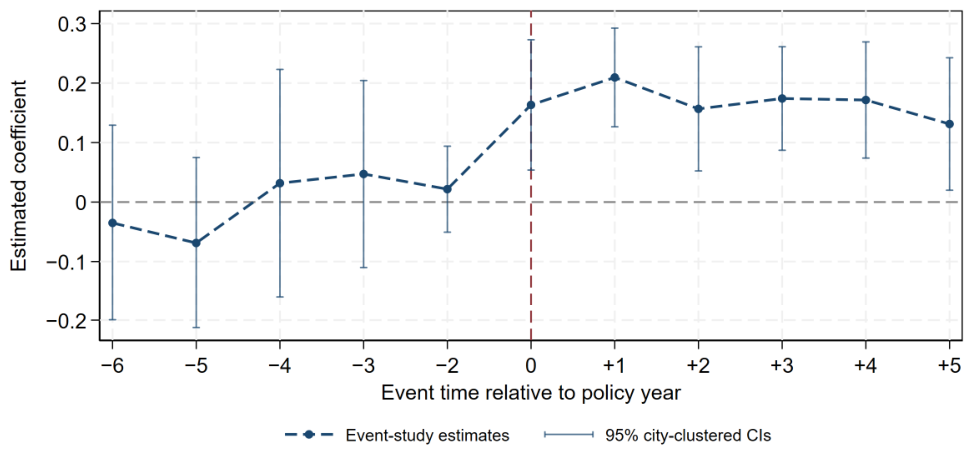
Figure A2.
HonestDiD sensitivity analysis under the relative magnitude (RM) restriction.
References
- Lee, C.C.; Lee, C.C. How does green finance affect green total factor productivity? Evidence from China. Energy Econ. 2022, 107, 105863. [Google Scholar] [CrossRef] [Scilit]
- Jia, J.; He, X.; Zhu, T.; Zhang, E. Does green finance reform promote corporate green innovation? Evidence from China. Pac.-Basin Finance J. 2023, 82, 102165. [Google Scholar] [CrossRef] [Scilit]
- Khan, M.A.; Riaz, H.; Ahmed, M.; Saeed, A. Does green finance really deliver what is expected? An empirical perspective. Borsa Istanb. Rev. 2022, 22, 586–593. [Google Scholar] [CrossRef] [Scilit]
- Wang, K.H.; Zhao, Y.X.; Jiang, C.F.; Li, Z.Z. Does green finance inspire sustainable development? Evidence from a global perspective. Econ. Anal. Policy 2022, 75, 412–426. [Google Scholar] [CrossRef] [Scilit]
- Hua, M.; Li, Z.; Zhang, Y.; Wei, X. Does green finance promote green transformation of the real economy? Res. Int. Bus. Finance 2024, 67, 102090. [Google Scholar] [CrossRef] [Scilit]
- Shao, J.; Huang, P. The policy mix of green finance in China: An evolutionary and multilevel perspective. Clim. Policy 2023, 23, 689–703. [Google Scholar] [CrossRef] [Scilit]
- Liu, Y.; Peng, Y.; Wang, W.; Liu, S.; Yin, Q. Does the pilot zone for green finance reform and innovation policy improve urban green total factor productivity? The role of digitization and technological innovation. J. Clean. Prod. 2024, 471, 143365. [Google Scholar] [CrossRef] [Scilit]
- Wang, W.; Xu, F.; Peng, S.T.; Ouyang, Y. How does green finance policy affect the environmental performance of manufacturing companies? J. Environ. Manag. 2025, 393, 126929. [Google Scholar] [CrossRef] [Scilit] [PubMed]
- Xie, Y.; Jiang, J.; Wang, D. Green finance policy and labor demand: Evidence from China. Pac.-Basin Finance J. 2024, 86, 102434. [Google Scholar] [CrossRef] [Scilit]
- Muganyi, T.; Yan, L.; Sun, H. Green finance, fintech and environmental protection: Evidence from China. Environ. Sci. Ecotechnol. 2021, 7, 100107. [Google Scholar] [CrossRef] [Scilit] [PubMed]
- Zhang, Y.; Feng, N.; Wang, X. Can the green finance pilot policy promote the low-carbon transformation of the economy? Int. Rev. Econ. Finance 2024, 93, 1074–1086. [Google Scholar] [CrossRef] [Scilit]
- Zhang, Z.; Wang, J.; Feng, C.; Chen, X. Do pilot zones for green finance reform and innovation promote energy savings? Evidence from China. Energy Econ. 2023, 124, 106763. [Google Scholar] [CrossRef] [Scilit]
- Shen, M.; Ma, N.; Chen, Q. Has green finance policy promoted ecologically sustainable development under the constraints of government environmental attention? J. Clean. Prod. 2024, 450, 141854. [Google Scholar] [CrossRef] [Scilit]
- Lin, Y.; Zhong, Q. Does green finance policy promote green total factor productivity? Evidence from a quasi-natural experiment in the green finance pilot zone. Clean Technol. Environ. Policy 2024, 26, 2661–2685. [Google Scholar] [CrossRef] [Scilit]
- Meng, Y.; Yu, J.; Yu, Y.; Ren, Y. Impact of green finance on green total factor productivity: New evidence from improved synthetic control methods. J. Environ. Manag. 2024, 372, 123394. [Google Scholar] [CrossRef] [Scilit] [PubMed]
- Xu, A.; Dai, Y.; Hu, Z.; Qiu, K. Can green finance policy promote inclusive green growth? Based on the quasi-natural experiment of China’s green finance reform and innovation pilot zone. Int. Rev. Econ. Finance 2025, 100, 104090. [Google Scholar] [CrossRef] [Scilit]
- Lin, B.; Zhou, Y. Measuring the green economic growth in China: Influencing factors and policy perspectives. Energy 2022, 241, 122518. [Google Scholar] [CrossRef] [Scilit]
- He, K.; Jia, C.; Yang, L.; Yao, F.; Xu, Y. The impact of digital intelligence on corporate green total factor productivity: Empirical evidence from Chinese A-share listed companies. Sustainability 2026, 18, 8625. [Google Scholar] [CrossRef] [Scilit]
- Wang, L.; Li, F.; Li, X.; Zhou, S. Assessing smart cities policy on urban green growth in China: The mediating effect of urban resilience. Sustain. Cities Soc. 2025, 106471. [Google Scholar] [CrossRef] [Scilit]
- Guo, L.; Qu, Y.; Wu, C.; Gui, S. Evaluating green growth practices: Empirical evidence from China. Sustain. Dev. 2018, 26, 302–319. [Google Scholar] [CrossRef] [Scilit]
- Song, M.; Du, J.; Tan, K.H. Impact of fiscal decentralization on green total factor productivity. Int. J. Prod. Econ. 2018, 205, 359–367. [Google Scholar] [CrossRef] [Scilit]
- Cheng, Z.; Kong, S. The effect of environmental regulation on green total-factor productivity in China’s industry. Environ. Impact Assess. Rev. 2022, 94, 106757. [Google Scholar] [CrossRef] [Scilit]
- Chen, L.; Lu, Y.; Meng, Y. The impact of environmental regulation on green total factor productivity: Evidence from China’s provincial level. Process Saf. Environ. Prot. 2025, 198, 107106. [Google Scholar] [CrossRef] [Scilit]
- Jiang, Y.; Wang, H.; Liu, Z. The impact of the free trade zone on green total factor productivity—Evidence from the Shanghai Pilot Free Trade Zone. Energy Policy 2021, 148, 112000. [Google Scholar] [CrossRef] [Scilit]
- Cao, X.; Deng, M.; Li, H. How does e-commerce city pilot improve green total factor productivity? Evidence from 230 cities in China. J. Environ. Manag. 2021, 289, 112520. [Google Scholar] [CrossRef] [Scilit] [PubMed]
- Xie, R.; Yuan, Y.; Huang, J. Different types of environmental regulations and heterogeneous influence on “green” productivity: Evidence from China. Ecol. Econ. 2017, 132, 104–112. [Google Scholar] [CrossRef] [Scilit]
- Tian, Y.; Feng, C. The internal-structural effects of different types of environmental regulations on China’s green total-factor productivity. Energy Econ. 2022, 113, 106246. [Google Scholar] [CrossRef] [Scilit]
- Tong, L.; Jabbour, C.J.C.; Belgacem, S.B.; Najam, H.; Abbas, J. Role of environmental regulations, green finance, and investment in green technologies in green total factor productivity: Empirical evidence from Asian region. J. Clean. Prod. 2022, 380, 134930. [Google Scholar] [CrossRef] [Scilit]
- Chen, J.; Abbas, J.; Najam, H.; Liu, J.; Abbas, J. Green technological innovation, green finance, and financial development and their role in green total factor productivity: Empirical insights from China. J. Clean. Prod. 2023, 382, 135131. [Google Scholar] [CrossRef] [Scilit]
- Feng, C.; Zhong, S.; Wang, M. How can green finance promote the transformation of China’s economic growth momentum? A perspective from internal structures of green total-factor productivity. Res. Int. Bus. Finance 2024, 70, 102356. [Google Scholar] [CrossRef] [Scilit]
- Qian, H. Knowledge-based regional economic development: A synthetic review of knowledge spillovers, entrepreneurship, and entrepreneurial ecosystems. Econ. Dev. Q. 2018, 32, 163–176. [Google Scholar] [CrossRef] [Scilit]
- Kraus, S.; McDowell, W.; Ribeiro-Soriano, D.E.; Rodríguez-García, M. The role of innovation and knowledge for entrepreneurship and regional development. Entrep. Reg. Dev. 2021, 33, 175–184. [Google Scholar] [CrossRef] [Scilit]
- Hunjra, A.I.; Zhao, S.; Tan, Y.; Bouri, E.; Liu, X. How do green innovations promote regional green total factor productivity? Multidimensional analysis of heterogeneity, spatiality and nonlinearity. J. Clean. Prod. 2024, 467, 142935. [Google Scholar] [CrossRef] [Scilit]
- Fritsch, M.; Storey, D.J. Entrepreneurship in a regional context: Historical roots, recent developments and future challenges. Reg. Stud. 2014, 48, 939–954. [Google Scholar] [CrossRef] [Scilit]
- Cheng, Y.; Lv, K.; Zhu, S. How does digital financial inclusion promote green total factor productivity in China? An empirical analysis from the perspectives of innovation and entrepreneurship. Process Saf. Environ. Prot. 2023, 174, 403–413. [Google Scholar] [CrossRef] [Scilit]
- Luo, C.; Lyu, H.; Wen, T.; Qiang, W.W.; Lee, H.F. Green finance and grey air: Assessing the impact of green finance pilot zones on company-level pollution in China. Environ. Res. Lett. 2024, 19, 094010. [Google Scholar] [CrossRef] [Scilit]
- Fan, H.; Peng, Y.; Wang, H.; Xu, Z. Greening through finance? J. Dev. Econ. 2021, 152, 102683. [Google Scholar] [CrossRef] [Scilit]
- Chai, S.; Zhang, K.; Wei, W.; Ma, W.; Abedin, M.Z. The impact of green credit policy on enterprises’ financing behavior: Evidence from Chinese heavily-polluting listed companies. J. Clean. Prod. 2022, 363, 132458. [Google Scholar] [CrossRef] [Scilit]
- Zhang, M.; Zhang, X.; Song, Y.; Zhu, J. Exploring the impact of green credit policies on corporate financing costs based on the data of Chinese A-share listed companies from 2008 to 2019. J. Clean. Prod. 2022, 375, 134012. [Google Scholar] [CrossRef] [Scilit]
- Wang, Y.; Shen, N. Environmental regulation and environmental productivity: The case of China. Renew. Sustain. Energy Rev. 2016, 62, 758–766. [Google Scholar] [CrossRef] [Scilit]
- Li, C.; Qi, Y.; Liu, S.; Wang, X. Do carbon ETS pilots improve cities’ green total factor productivity? Evidence from a quasi-natural experiment in China. Energy Econ. 2022, 108, 105931. [Google Scholar] [CrossRef] [Scilit]
- Zhang, R.; Li, Y.; Liu, Y. Green bond issuance and corporate cost of capital. Pac.-Basin Finance J. 2021, 69, 101626. [Google Scholar] [CrossRef] [Scilit]
- Jin, W.; Ding, W.; Yang, J. Impact of financial incentives on green manufacturing: Loan guarantee vs. interest subsidy. Eur. J. Oper. Res. 2022, 300, 1067–1080. [Google Scholar] [CrossRef] [Scilit]
- Zhou, X.; Dai, M.; Liu, L. Green credit, carbon emission trading and corporate green innovation: Evidence from China. Pac.-Basin Finance J. 2024, 86, 102445. [Google Scholar] [CrossRef] [Scilit]
- Wang, S.; Wang, Z.; Li, B. Government green procurement and corporate ESG performance. J. Clean. Prod. 2024, 478, 143945. [Google Scholar] [CrossRef] [Scilit]
- Zhang, G.; Wang, Y.; Zhang, Z.; Su, B. Can green finance policy promote green innovation in cities? Evidence from pilot zones for green finance reform and innovation in China. J. Environ. Manag. 2024, 370, 122816. [Google Scholar] [CrossRef] [Scilit] [PubMed]
- Du, K.; Li, J. Towards a green world: How do green technology innovations affect total-factor carbon productivity. Energy Policy 2019, 131, 240–250. [Google Scholar] [CrossRef] [Scilit]
- Wang, H.; Cui, H.; Zhao, Q. Effect of green technology innovation on green total factor productivity in China: Evidence from spatial Durbin model analysis. J. Clean. Prod. 2021, 288, 125624. [Google Scholar] [CrossRef] [Scilit]
- Zhao, X.; Nakonieczny, J.; Jabeen, F.; Shahzad, U.; Jia, W. Does green innovation induce green total factor productivity? Novel findings from Chinese city level data. Technol. Forecast. Soc. Change 2022, 185, 122021. [Google Scholar] [CrossRef] [Scilit]
- Irfan, M.; Razzaq, A.; Sharif, A.; Yang, X. Influence mechanism between green finance and green innovation: Exploring regional policy intervention effects in China. Technol. Forecast. Soc. Change 2022, 182, 121882. [Google Scholar] [CrossRef] [Scilit]
- Gao, Y.; Gao, H.; Yu, Y.; Xu, X.; Chan, C.K. Green finance reform and enterprise green technology innovation—Based on the perspective of spatial spillover effect. Int. Rev. Econ. Finance 2025, 101, 104247. [Google Scholar] [CrossRef] [Scilit]
- Nepal, R.; Liu, Y.; Wang, J.; Xu, X.; Chan, C.K. How does green finance promote renewable energy technology innovation? A quasi-natural experiment perspective. Energy Econ. 2024, 134, 107576. [Google Scholar] [CrossRef] [Scilit]
- Xiang, X.; Liu, C.; Yang, M. Who is financing corporate green innovation? Int. Rev. Econ. Finance 2022, 78, 321–337. [Google Scholar] [CrossRef] [Scilit]
- Huang, Y.; Chen, C.; Lei, L.; Zhang, Y. Impacts of green finance on green innovation: A spatial and nonlinear perspective. J. Clean. Prod. 2022, 365, 132548. [Google Scholar] [CrossRef] [Scilit]
- Zhao, S.; Liu, J.; Jiang, G. The mechanisms of green finance reform and digital transformation on regional industrial innovation and entrepreneurship: Evidence from a quasi-natural experiment. Finance Res. Lett. 2025, 85, 107933. [Google Scholar] [CrossRef] [Scilit]
- Wang, Y.; Wei, S.; He, X.; Gu, H. Environmental regulation and entrepreneurial activity: Evidence from the low-carbon city pilot policy in China. Sustain. Cities Soc. 2023, 98, 104829. [Google Scholar] [CrossRef] [Scilit]
- Huang, Q.; Su, Z.; Yu, J. How low-carbon transition affects entrepreneurship: Evidence from China’s low-carbon city pilot policy. J. Environ. Manag. 2025, 381, 125247. [Google Scholar] [CrossRef] [Scilit] [PubMed]
- Xin, B.; Gao, F. Can green credit trigger net-zero entrepreneurship? Sustain. Prod. Consum. 2023, 40, 488–502. [Google Scholar] [CrossRef] [Scilit]
- Fu, B.; Zhang, Y.; Maani, S.; Wen, L. Green finance and job creation: Analyzing employment effects in China’s manufacturing industry within green finance innovation and reform pilot zones. Energy Econ. 2025, 141, 108090. [Google Scholar] [CrossRef] [Scilit]
- Tone, K. A slacks-based measure of efficiency in data envelopment analysis. Eur. J. Oper. Res. 2001, 130, 498–509. [Google Scholar] [CrossRef] [Scilit]
- Gu, B.; Liu, J.; Ji, Q. The effect of social sphere digitalization on green total factor productivity in China: Evidence from a dynamic spatial Durbin model. J. Environ. Manag. 2022, 320, 115946. [Google Scholar] [CrossRef] [Scilit] [PubMed]
- Wang, J.; Guo, D. Siphon and radiation effects of ICT agglomeration on green total factor productivity: Evidence from a spatial Durbin model. Energy Econ. 2023, 126, 106953. [Google Scholar] [CrossRef] [Scilit]
- Bolund, P.; Hunhammar, S. Ecosystem services in urban areas. Ecol. Econ. 1999, 29, 293–301. [Google Scholar] [CrossRef] [Scilit]
- Keeler, B.L.; Hamel, P.; McPhearson, T.; Hamann, M.H.; Donahue, M.L.; Meza Prado, K.A.; Arkema, K.K.; Bratman, G.N.; Brauman, K.A.; Finlay, J.C.; et al. Social-ecological and technological factors moderate the value of urban nature. Nat. Sustain. 2019, 2, 29–38. [Google Scholar] [CrossRef] [Scilit]
- Sun, J.; Tang, D.; Kong, H.; Boamah, V. Impact of industrial structure upgrading on green total factor productivity in the Yangtze River Economic Belt. Int. J. Environ. Res. Public Health 2022, 19, 3718. [Google Scholar] [CrossRef] [Scilit] [PubMed]
- Duan, L.; Song, L.; Wang, W.; Jian, X.; Heijungs, R.; Chen, W.-Q. Urbanization inequality: Evidence from vehicle ownership in Chinese cities. Humanit. Soc. Sci. Commun. 2024, 11, 703. [Google Scholar] [CrossRef] [Scilit]
- Liu, J.; Tian, G.; Sun, Y. How does fintech affect corporate ESG behavior: The role of government efficiency. Finance Res. Lett. 2025, 86, 108488. [Google Scholar] [CrossRef] [Scilit]
- Xie, R.; Yao, S.; Han, F.; Zhang, Q. Does misallocation of land resources reduce urban green total factor productivity? An analysis of city-level panel data in China. Land Use Policy 2022, 122, 106353. [Google Scholar] [CrossRef] [Scilit]
- Cameron, A.C.; Gelbach, J.B.; Miller, D.L. Bootstrap-based improvements for inference with clustered errors. Rev. Econ. Stat. 2008, 90, 414–427. [Google Scholar] [CrossRef] [Scilit]
- Roodman, D.; MacKinnon, J.G.; Nielsen, M.Ø.; Webb, M.D. Fast and wild: Bootstrap inference in Stata using boottest. Stata J. 2019, 19, 4–60. [Google Scholar] [CrossRef] [Scilit]
- Webb, M.D. Reworking Wild Bootstrap Based Inference for Clustered Errors; Queen’s Economics Department Working Paper No. 1315; Queen’s University: Kingston, ON, Canada, 2014. [Google Scholar]
- MacKinnon, J.G.; Webb, M.D. The wild bootstrap for few (treated) clusters. Econom. J. 2018, 21, 114–135. [Google Scholar] [CrossRef] [Scilit]
- Driscoll, J.C.; Kraay, A.C. Consistent covariance matrix estimation with spatially dependent panel data. Rev. Econ. Stat. 1998, 80, 549–560. [Google Scholar] [CrossRef] [Scilit]
- Rambachan, A.; Roth, J. A more credible approach to parallel trends. Rev. Econ. Stud. 2023, 90, 2555–2591. [Google Scholar] [CrossRef] [Scilit]
- Conley, T.G.; Taber, C.R. Inference with “Difference in Differences” with a small number of policy changes. Rev. Econ. Stat. 2011, 93, 113–125. [Google Scholar] [CrossRef] [Scilit]
- MacKinnon, J.G.; Webb, M.D. Randomization inference for difference-in-differences with few treated clusters. J. Econom. 2020, 218, 435–450. [Google Scholar] [CrossRef] [Scilit]
- Qiu, S.; Wang, Z.; Liu, S. The policy outcomes of low-carbon city construction on urban green development: Evidence from a quasi-natural experiment conducted in China. Sustain. Cities Soc. 2021, 66, 102699. [Google Scholar] [CrossRef] [Scilit]
- Callaway, B.; Sant’Anna, P.H.C. Difference-in-differences with multiple time periods. J. Econom. 2021, 225, 200–230. [Google Scholar] [CrossRef] [Scilit]
- Arkhangelsky, D.; Athey, S.; Hirshberg, D.A.; Imbens, G.W.; Wager, S. Synthetic difference-in-differences. Am. Econ. Rev. 2021, 111, 4088–4118. [Google Scholar] [CrossRef] [Scilit]
- Shane, S.; Venkataraman, S. The promise of entrepreneurship as a field of research. Acad. Manag. Rev. 2000, 25, 217–226. [Google Scholar] [CrossRef] [Scilit]
- Jiang, W.; Jiang, N.; Wang, K.L. The local effects and neighborhood effects of high-speed railway on urban entrepreneurial vitality: Evidence from China. Socio-Econ. Plan. Sci. 2025, 98, 102172. [Google Scholar] [CrossRef] [Scilit]
- Fu, X. Impacts of the pilot policy for carbon emissions trading on pollution reduction in China. J. Clean. Prod. 2024, 468, 142878. [Google Scholar] [CrossRef] [Scilit]
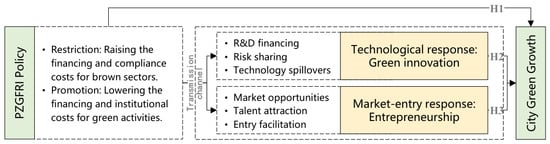
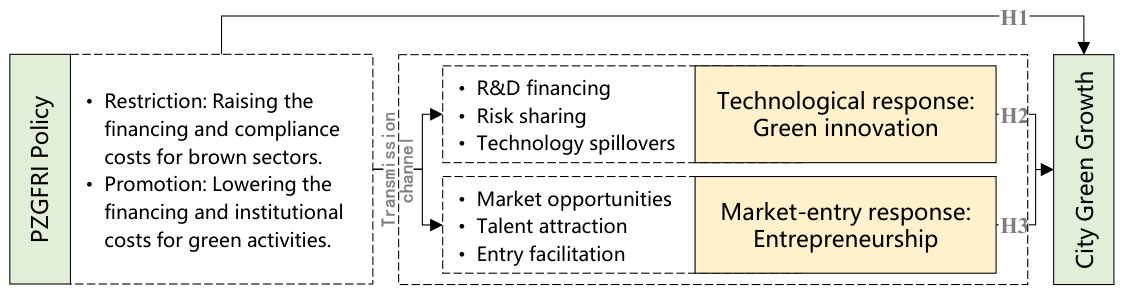
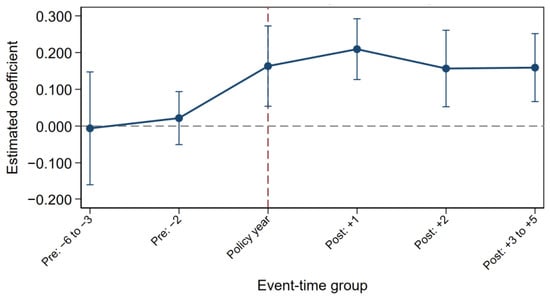
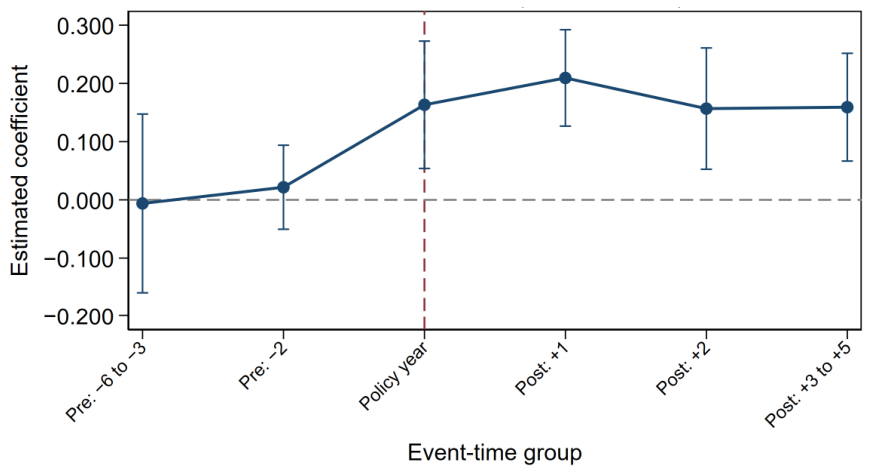
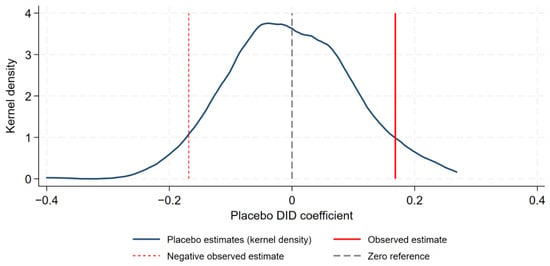
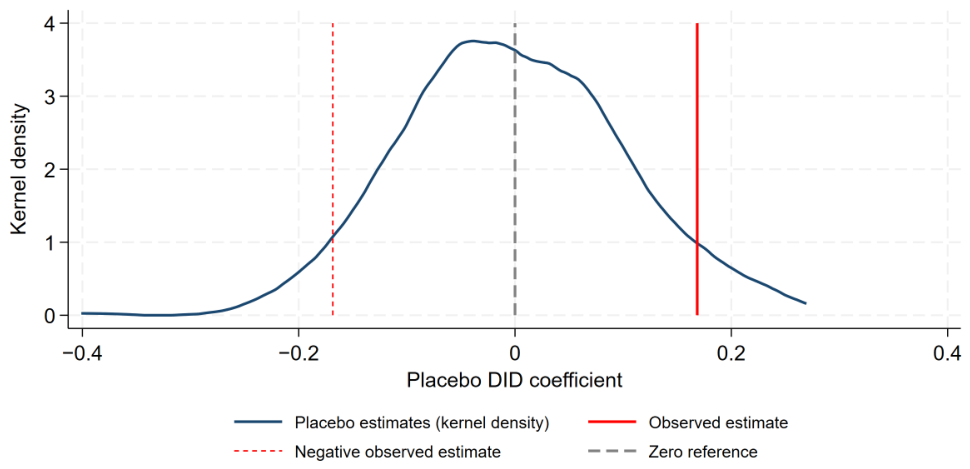
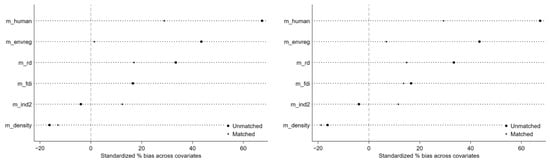
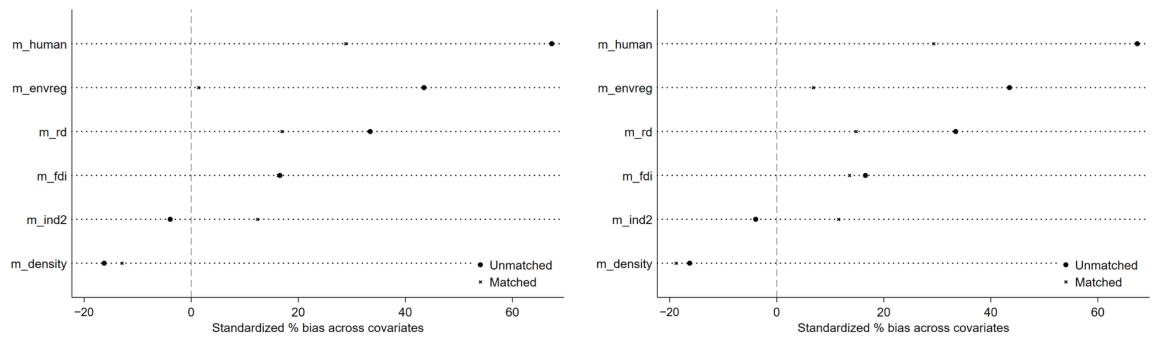
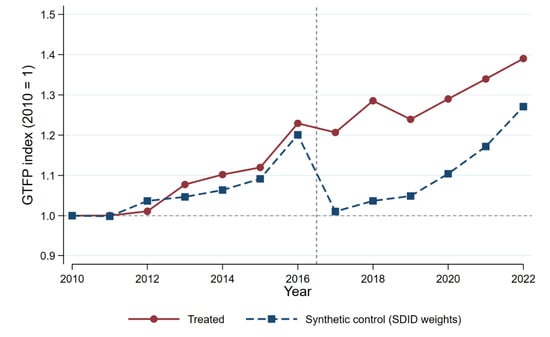
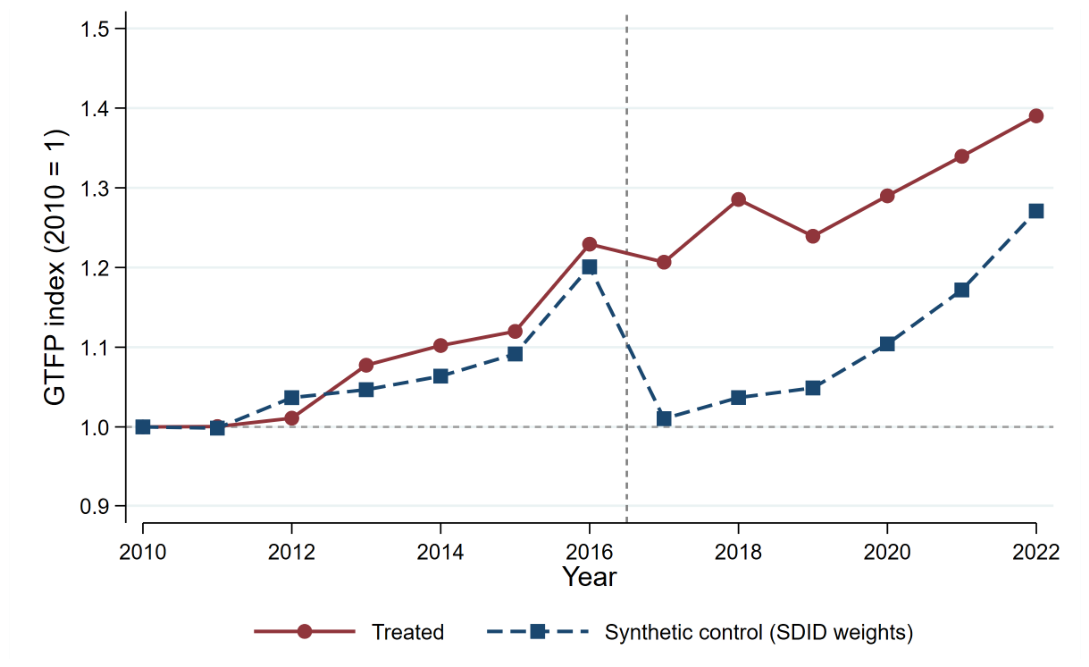

Disclaimer/Publisher’s Note: The statements, opinions and data contained in all publications are solely those of the individual author(s) and contributor(s) and not of MDPI and/or the editor(s). MDPI and/or the editor(s) disclaim responsibility for any injury to people or property resulting from any ideas, methods, instructions or products referred to in the content. |
© 2026 by the authors. Licensee MDPI, Basel, Switzerland. This article is an open access article distributed under the terms and conditions of the Creative Commons Attribution (CC BY) license.