


Abstract
Under the combined influence of global climate change and intensified human activities, quantifying ecological compensation (EC) amounts between regions and formulating scientifically sound and rational policies have become critical strategies for addressing the imbalance between economic development and ecological conservation. This study focuses on the Yangtze River Economic Belt (YREB) as the research subject, assesses ecosystem service supply and demand (ESSD) in the years 2000, 2010, and 2020 from the perspective of the water-energy-food nexus (WEF-Nexus), identifies ecosystem service flows (ESF) between supply and demand areas, develops an integrated EC model incorporating ecological, economic, and social dimensions to estimate EC amounts, and ultimately employs the XGBoost-SHAP model to analyze the underlying driving mechanisms. The results indicate the following: (1) From 2000 to 2020, the spatio-temporal variations in the three ESSDs in the YREB were substantial. Additionally, imbalances in ESSDs were observed, predominantly in economically advanced regions. (2) A total of 183 ESFs were identified among cities within the YREB, reflecting relatively active exchanges of ecosystem services (ESs). (3) Over the past two decades, the average annual total EC of the YREB amounted to 46,866.35 million yuan, with EC capital flows occurring in 117 cities. The proportion of water area in each city constitutes the primary driver of the EC amount. The EC model based on the “water-energy-food” ecosystem service flow (WEF-ESF) proposed in this study provides a valuable reference and scientific basis for formulating EC policies among YREB cities.
1. Introduction
The ecosystem serves as the fundamental cornerstone for sustaining the development of human society [1]. Scholars have defined the functions and processes of ecosystems that directly or indirectly benefit humanity as ecosystem services (ESs) [2]. Among these, the water yield (WY), carbon storage (CS), and food supply (FS) services provide essential resources that are indispensable for human survival and development [3]. These services are interdependent and interconnected, forming a complex water-energy-food nexus (WEF-Nexus) [4,5]. However, the intensification of human activities and rapid economic growth have significantly increased the demand for these resources [6]. Additionally, the rapid expansion of urban areas has led to the occupation of ecological land, thereby weakening the supply of these three resources [7]. This imbalance results in the phenomenon of ecosystem service supply–demand mismatch and the emergence of ecosystem service flows (ESF) [8,9]. Currently, formulating rational ecological compensation (EC) policies based on ESF represents an effective approach to alleviate ecosystem service supply and demand (ESSD) mismatches and remains a focal point for both government and society [10].
Based on the differences in supply and demand of ecosystem services in different regions, a dynamic process of material propagation and transfer is formed between regions, which is called ESF [11]. This process has received extensive attention in many important river basins and economic belts both at home and abroad. Some scholars have attempted to conduct in-depth research and analysis on the ESF of relevant regions using various methods [12,13]. The above research reveals that there may be surplus in the supply of ecosystem services after meeting the regional demand, which will be transferred and compensated among different regions due to natural and human factors [14]. Therefore, the research and analysis of ecosystem service flows can not only clarify the supply capacity of natural ecosystems and the demand capacity of socio—economic systems, but also identify the paths and key locations of the transfer of ecological products and services between “nature and society”, thus providing a new research approach for solving the problem of spatial mismatch in ESSD [15,16]. Nevertheless, the majority of current investigations into ESF remain at a conceptual stage, and studies integrating ESF with EC are still relatively limited.
Ecological compensation mechanisms represent a strategic approach that leverages economic instruments to address the spillover effects of ESs. This strategy involves adjusting the costs and benefits associated with specific behaviors by imposing charges or offering compensation for actions that either harm or protect natural resources and the environment, thereby achieving the internalization of externalities [17]. Since the 1980s, numerous countries and regions have extensively implemented ecological compensation initiatives [18,19]. Many scholars have also conducted research on ecological compensation in river basins or economic belts [20,21]. In China, projects with ecological compensation characteristics, such as “converting farmland to forest,” “restoring grazing land to grassland,” and “protecting natural forests,” have also been actively carried out. To further consolidate the effectiveness of the ecological protection compensation mechanism, China officially promulgated the “Regulations on Ecological Protection Compensation” in April 2024. The aim is to strengthen and standardize ecological protection compensation efforts, thereby addressing the conflict between environmental conservation and economic development [22]. Extensive research has explored the connotations, policies, standards, and compensation methods associated with EC [10]. These compensation approaches can generally be categorized into three types: the opportunity cost method, the willingness-to-pay method, and the ecosystem service value method [23,24]. However, the opportunity cost method involves significant uncertainties, the willingness-to-pay method is prone to subjective influences, and the ecosystem service value method tends to overestimate values, making it unsuitable as a practical EC standard [25]. For large-scale ecosystem services, material quality assessment holds more significance than value quantification [26]. Therefore, constructing a scientifically sound EC model based on the quantitative assessment of ESs and identifying the underlying driving mechanisms of EC have become critical research objectives in the current context.
As the “golden axis” driving China’s economic development, achieving sustainable development of the “water-energy-food” nexus in the Yangtze River Economic Belt (YREB) has become a focal point in contemporary research. With the rapid progression of industrialization and urbanization, the resource contradiction between the upstream ecological conservation zone and the downstream economic hub of the YREB, particularly concerning water, energy, and food, has grown increasingly pronounced [27]. Although the Yangtze River Protection Law and the Regulations on Ecological Protection Compensation have facilitated certain compensation practices, such as the “Xinan River-Qiandao Lake” ecological compensation pilot zone, the existing mechanism still exhibits significant limitations. First, the scope of compensation is overly narrow, with isolated accounting focused solely on water resources or carbon sinks, thereby neglecting the synergistic interactions within the WEF-Nexus. Second, the ecological protection compensation standard system remains underdeveloped, lacking a unified and comprehensive accounting framework. Third, the implementation scope is restricted, necessitating the marketization and socialization of ecological compensation mechanisms. These challenges underscore the difficulties in adapting traditional EC models to the complex human-land systems within river basins.
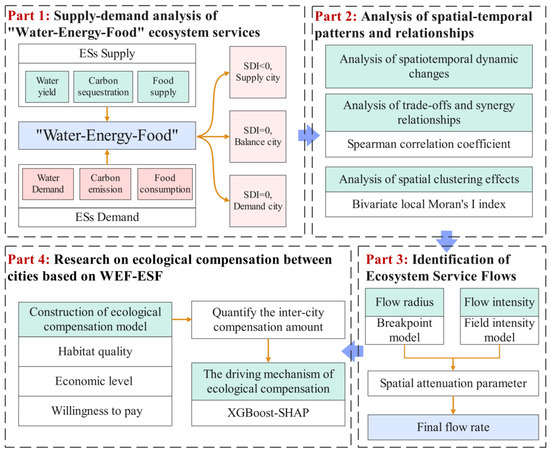
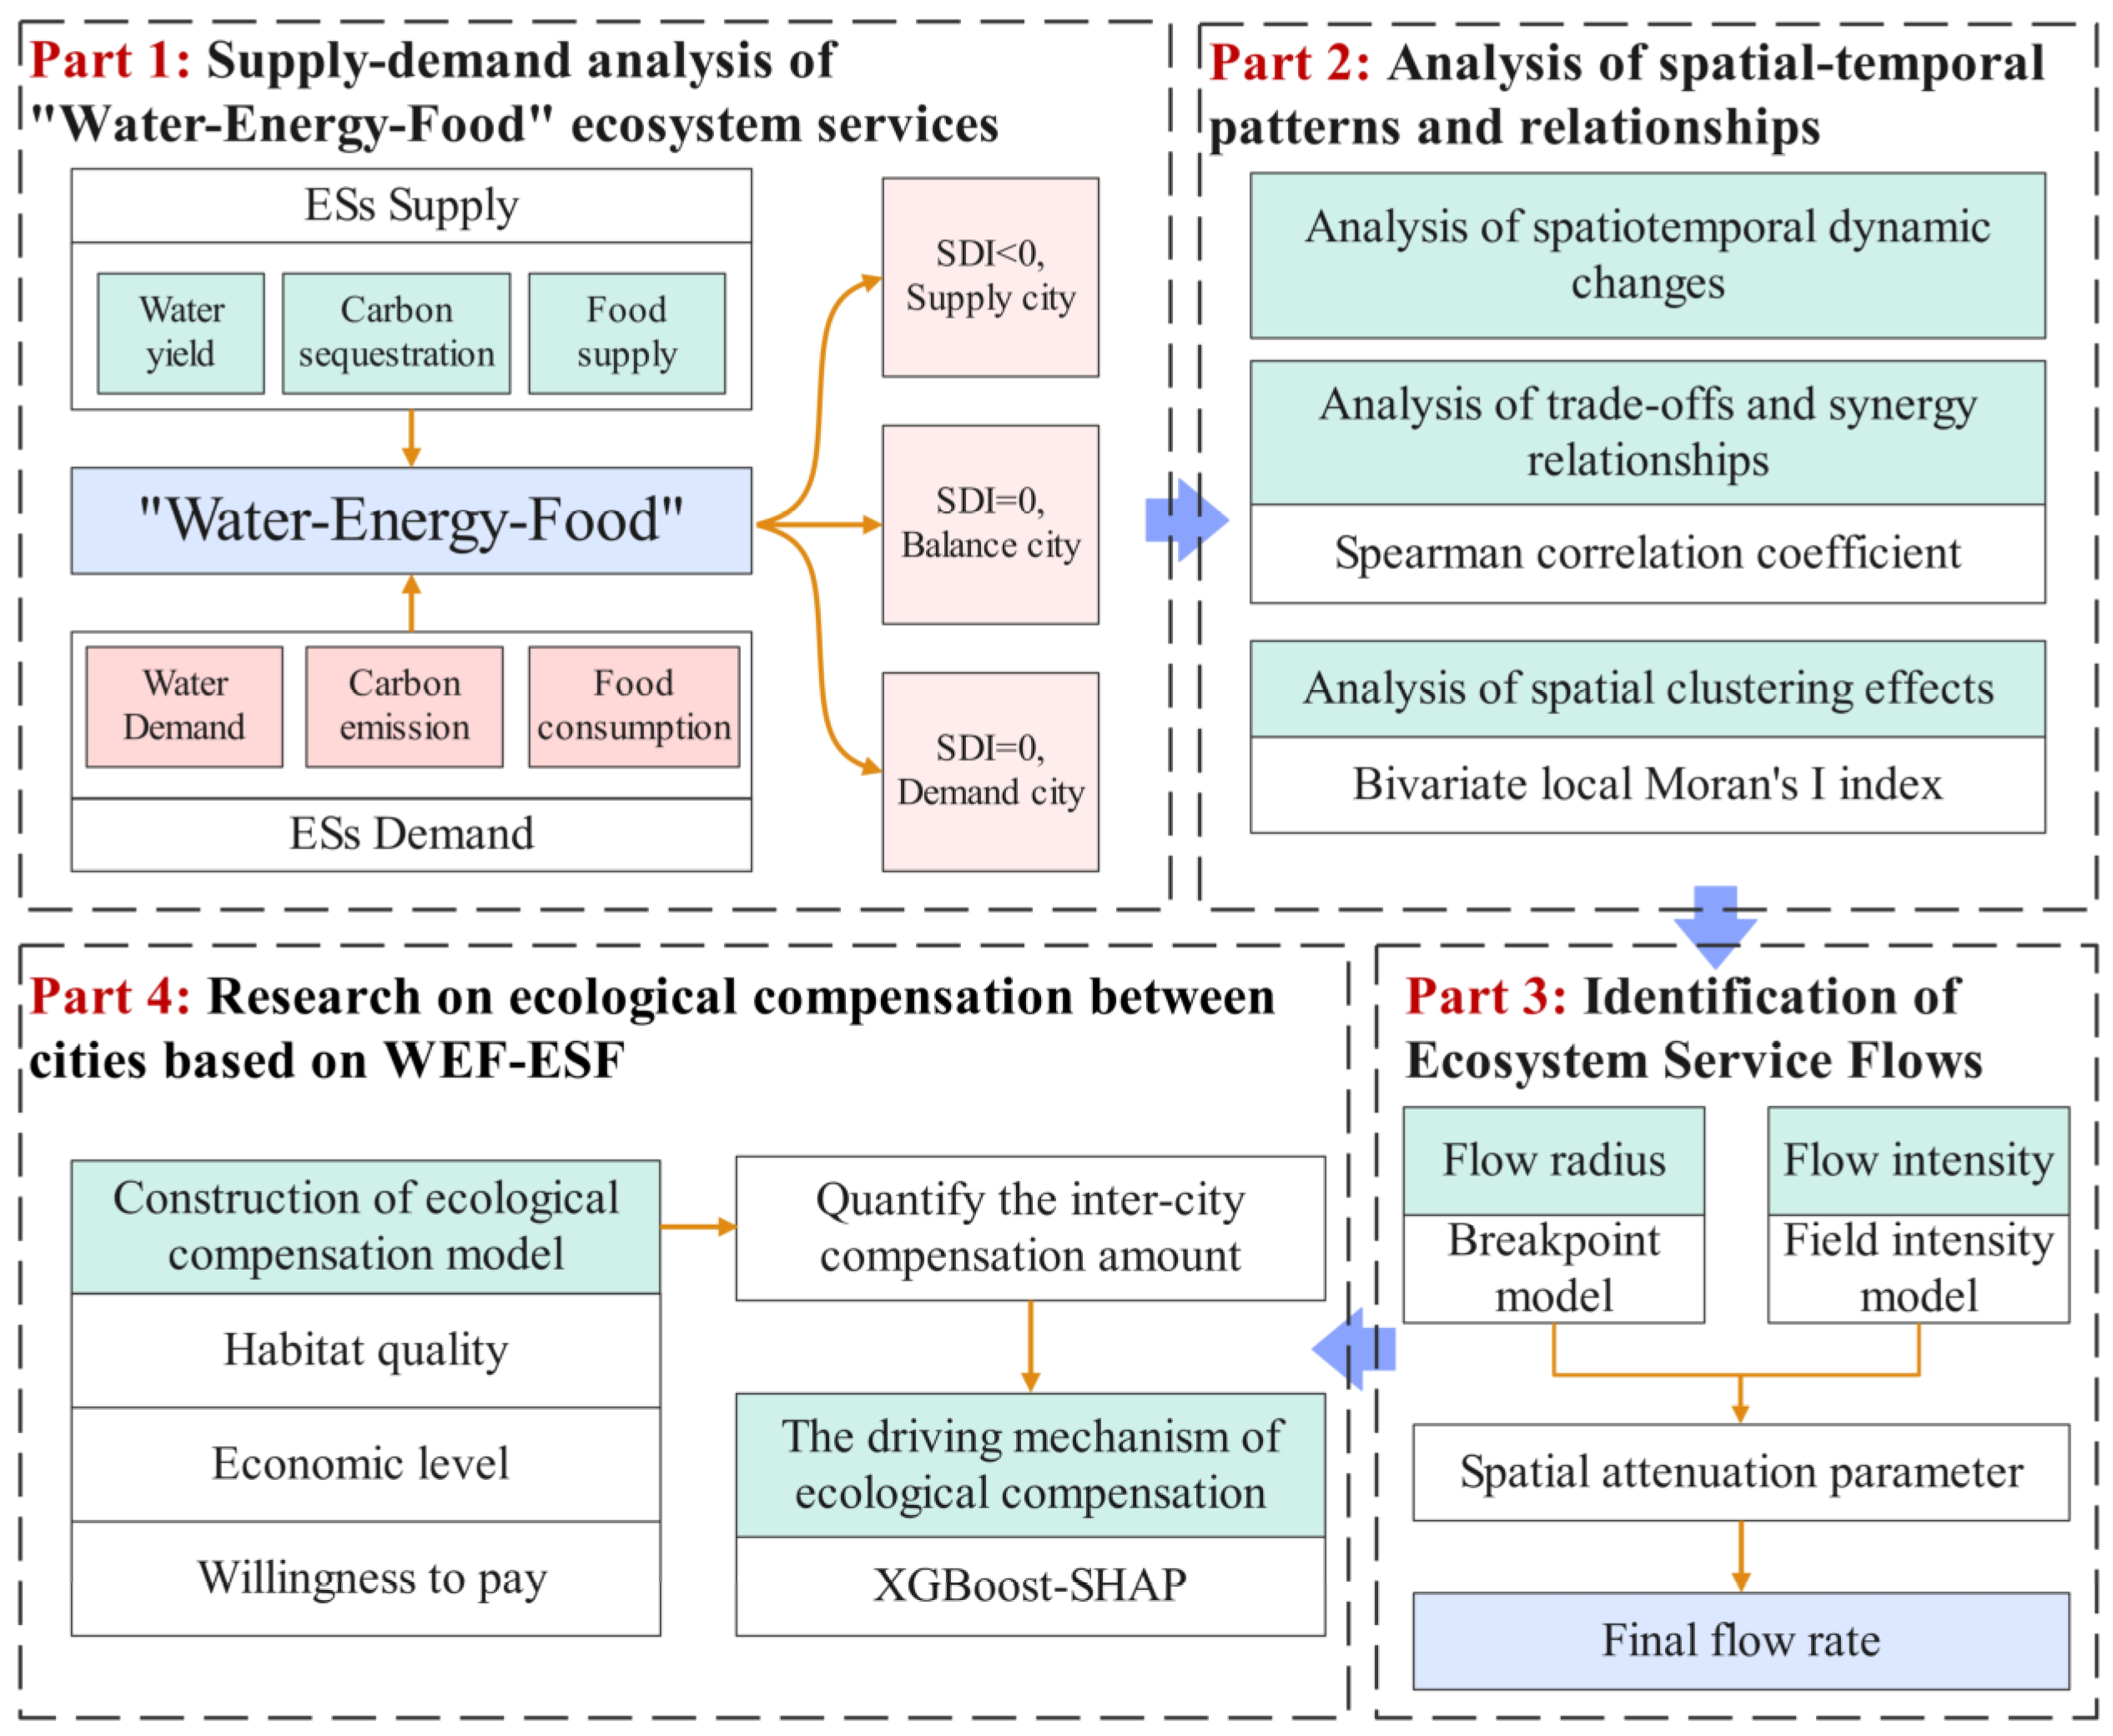
In light of the aforementioned issues, this study focuses on the YREB and proposes the following research framework (Figure 1): (1) Examine the spatiotemporal patterns of supply and demand for water-energy-food ecosystem services in the YREB from 2000 to 2020, analyze their gradient characteristics, and identify distinct zones of ecological service supply and demand; (2) Apply the gravity-based potential model to assess the spatial extent and directional flows of ecosystem services; (3) Integrate actual market values with region-specific ecological, economic, and social conditions to develop a multidimensional EC accounting framework for quantifying intercity compensation amounts, and employ the XGBoost-SHAP model to investigate the underlying driving mechanisms. Compared with previous studies, this study transcended the paradigm of single-service compensation and, based on the material quality of ESs, developed a pioneering multi-dimensional ecological compensation accounting model centered on “water-energy-food” services to achieve precise quantification of regional compensation fluxes. By analyzing the supply–demand gap, this study conducted a large-scale ESF analysis across the entire YREB, using cities as research units, and elucidated the inter-provincial and even inter-basin ecological service flow mechanisms. This study can provide a scientific foundation for the establishment of a sustainable ecological compensation and protection mechanism in the YREB, and holds significant strategic value in promoting the formation of a new pattern of regionally coordinated development and facilitating high-quality growth.
Figure 1.
Research framework.
2. Materials and Methods
2.1. Overview of the Study Area
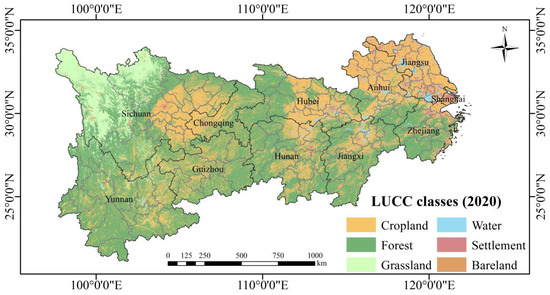
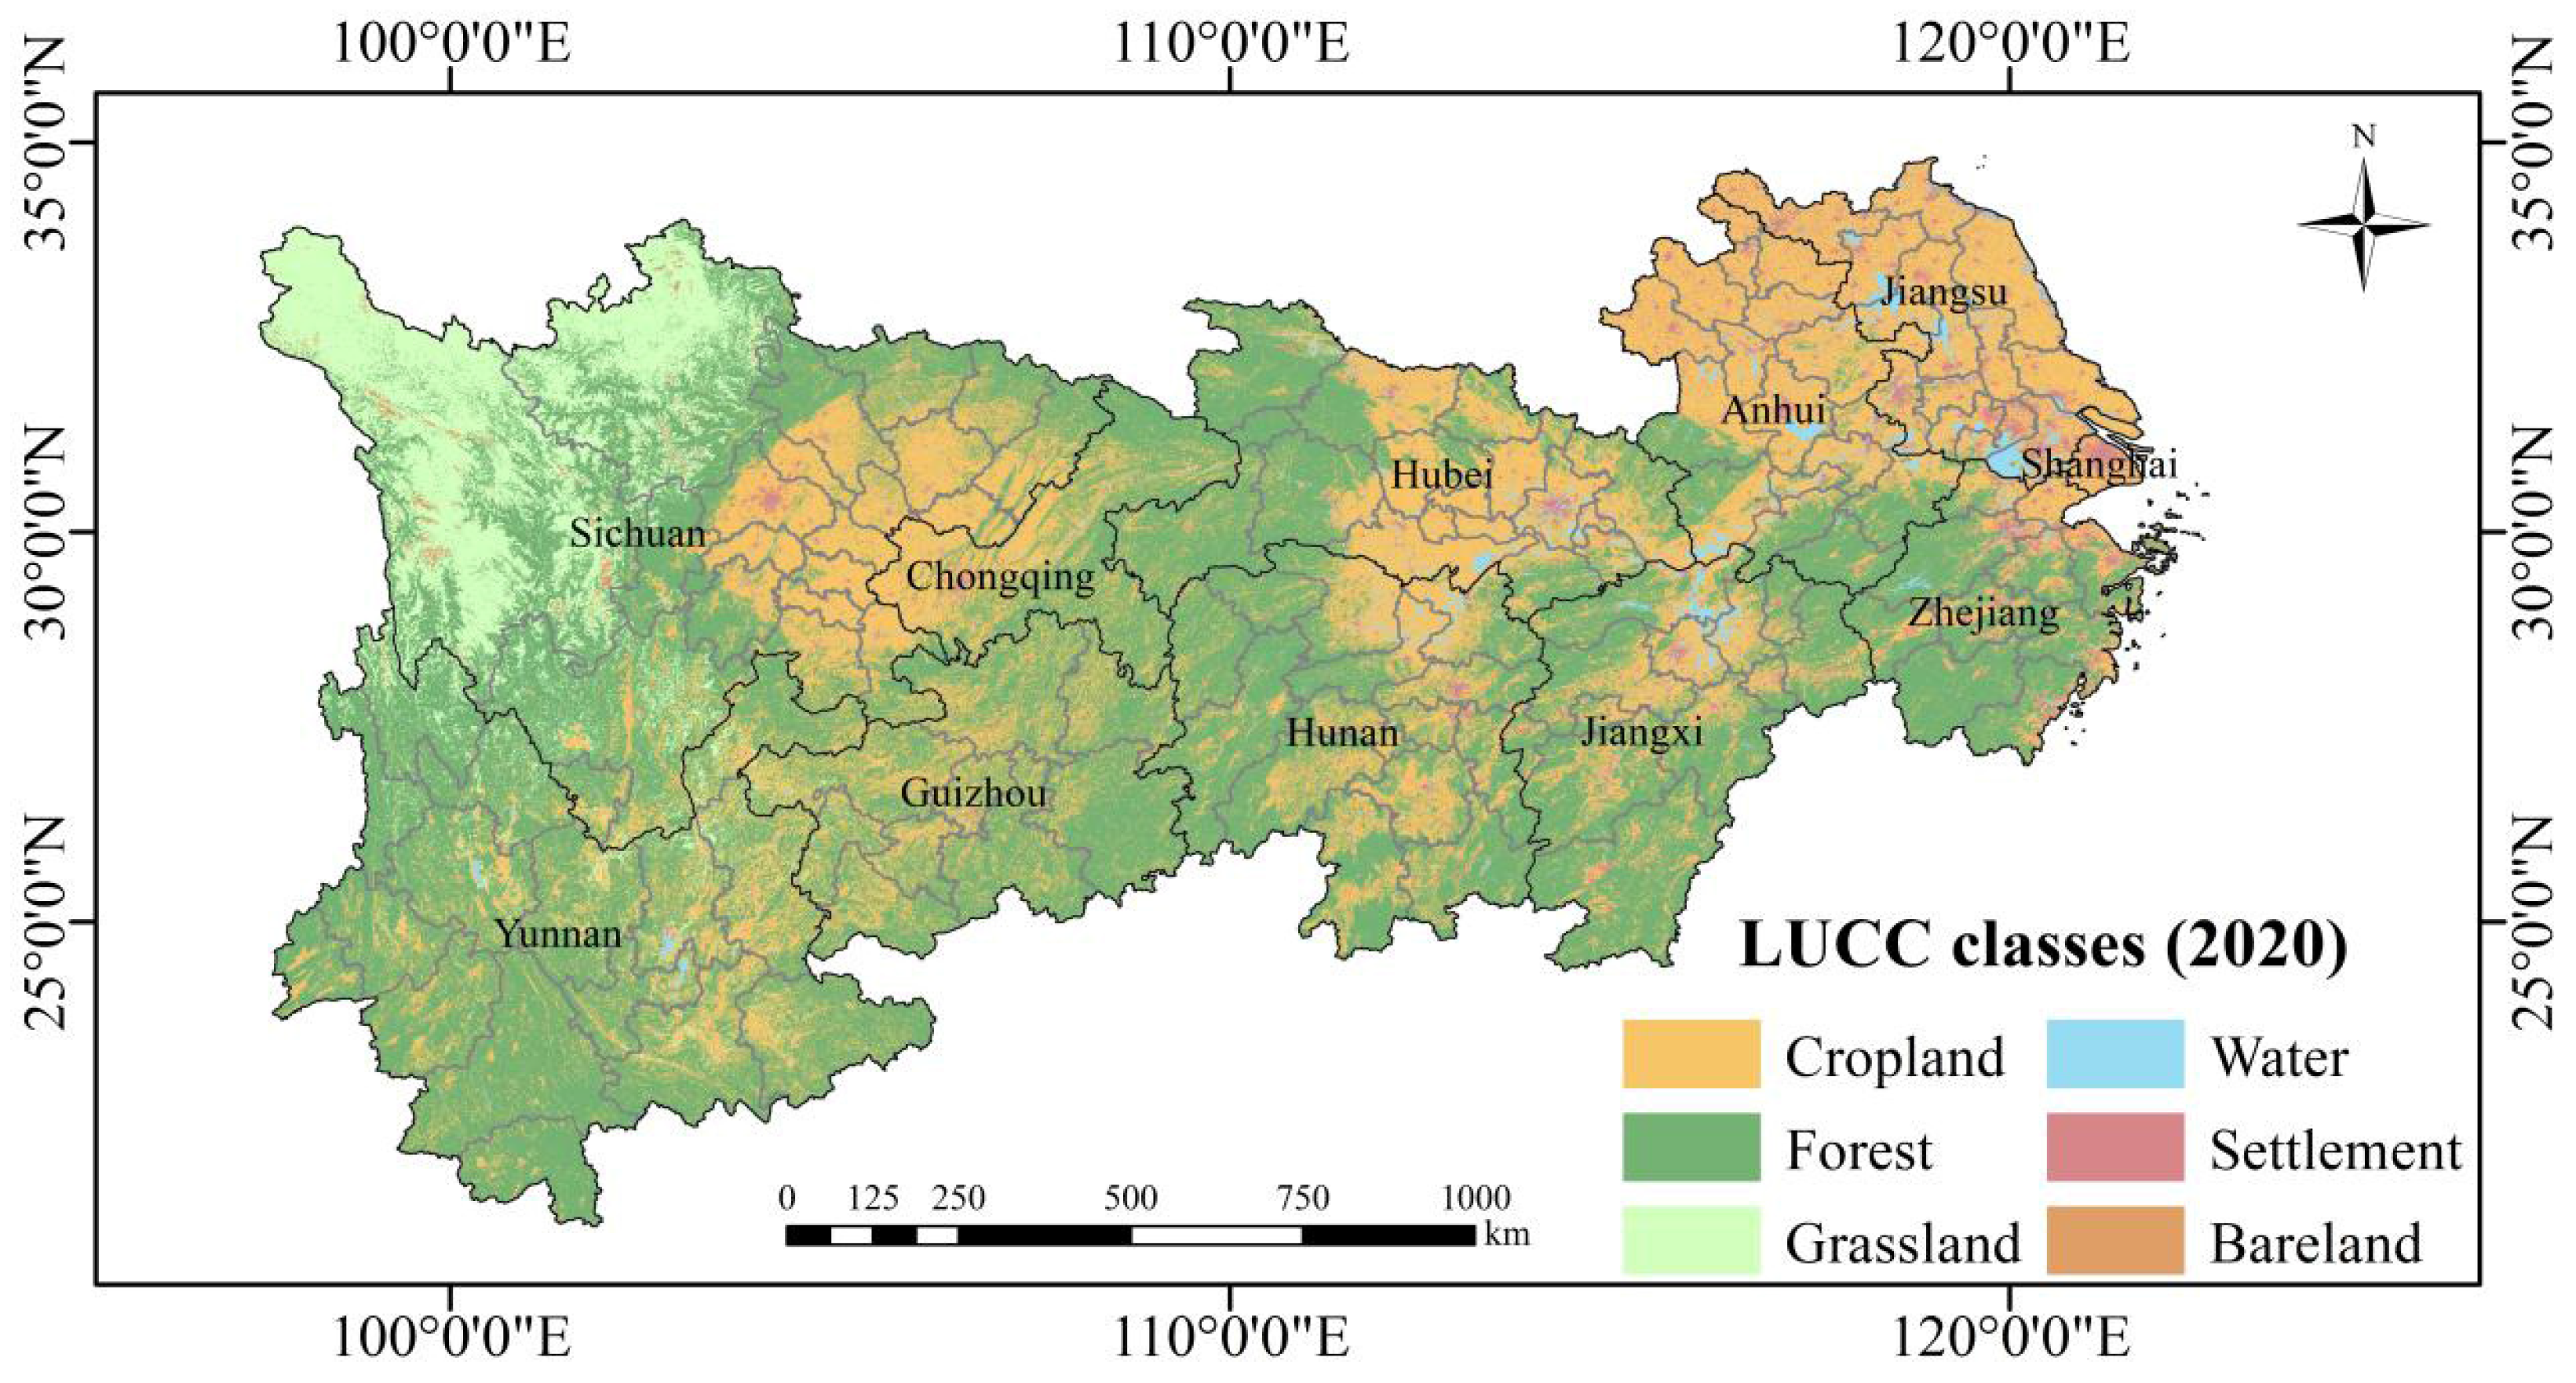
The Yangtze River Economic Belt comprises eleven provincial-level regions in China, covering eastern, central, and western areas (Figure 2). Geographically, it spans from 97°21′–122°50′ E longitude and 21°8′–35°7′ N latitude, stretching from the Qinghai–Tibet Plateau to the East China Sea coastline. With a total land area of 2.05 million km2, it accounts for 21.4% of China’s territory [28]. As the world’s largest river-based economic corridor, the YREB relies on the Yangtze River as its critical artery, linking three major economic hubs: the Yangtze River Delta megalopolis, the Mid-Yangtze urban agglomeration, and the Chengdu-Chongqing dual-core economic zone. Demographically, the YREB was home to approximately 605 million residents in 2022, representing 42.8% of China’s population. Its aggregate GDP amounted to 55.8 trillion yuan, contributing 46.1% to the national economy [29]. A pronounced spatial economic gradient exists within the region, with significant disparities between downstream and upstream areas. The lower reaches (Shanghai, Jiangsu, Zhejiang) produce over half of the regional GDP, while the upper reaches (Yunnan, Guizhou, Sichuan, Chongqing), despite their rich ecological resources, exhibit relatively lower economic output density. This study will take 130 cities in the YREB as the research units to analyze the relationship between ESF and EC among these cities.
Figure 2.
The land use types of the study area [30].
2.2. Data Sources
Detailed information and sources of the data used in this study are shown in Table 1.
Table 1.
Data source and description.
2.3. Research Methods
2.3.1. ESs Supply and Demand Quantification
Two essential services, namely water and energy, were assessed using the Water Yield and Carbon Storage modules of the InVEST3.14.2 model. This model is widely utilized for evaluating ESs and supporting ecosystem management and decision-making processes [33]. The calculations within each module were adjusted by calibrating relevant parameters to align with the geographical characteristics of the study area, as outlined in the InVEST User Guide [34]. A significant linear relationship has been established between the Normalized Difference Vegetation Index (NDVI) and food supply [35]. Consequently, this study employed land use/land cover maps to estimate food supply at a pixel-level resolution [36]. The demand for these three services was quantified based on per capita consumption rates and rasterized population density data (Table 2) [37].
Table 2.
Methods for calculating ESs supply and demand.
2.3.2. Research on the Relationship of ESs
- (1)
- Relationship identification between ESs
In this study, the “corrplot” package in R4.4.3 was employed to perform Spearman correlation coefficient analysis on ESs for each year. This analysis aimed to elucidate the trade-off and synergy relationships among different ecosystem services [42]. A positive correlation coefficient signifies synergistic relationships among ESs, whereas a negative coefficient indicates trade-offs. Additionally, the bivariate local Moran’s I index in GeoDa1.16.0.16 software was utilized to detect spatial clustering patterns of three ecosystem services at the county level within the YREB [35]. The findings were subsequently visualized to illustrate the trade-off and synergy relationships among the ecosystem services.
- (2)
- ESs supply and demand relationship assessment
To further investigate the degree of matching between the supply and demand of regional ecosystem services, this study employs the Supply–Demand Index (SDI) to characterize the spatiotemporal patterns and regional features of ecosystems [43,44]. Specifically, the total supply and demand for the three ESs in each city within the YREB were first calculated. Subsequently, the SDI values for different ESs in each city were determined using the following formula.
where SDIij denotes the SDI value of different ESs across various regions, ESs,ij and ESd,ij denote the supply and demand of the j-th ESs in region i, respectively. When SDIij > 0, supply exceeds demand, indicating a surplus in related services. When SDIij < 0, demand exceeds supply, signifying a deficit in related services. When SDIij = 0, supply is perfectly balanced with demand.
2.3.3. Computation of ESF
With the increase in spatial distance, the transfer magnitude of ecological service functions exhibits a trend of attenuation. To describe this spatial attenuation phenomenon, a model incorporating break points and field intensity is introduced, thereby elucidating the inter-regional role of ecological service functions [45]. The break point formula is conventionally employed to assess relationships between urban regions; however, in this study, it is utilized to quantify the radiation range of ecological service functions within the output region. The break point formula is as follows:
where dj represents the flow radius of ESs; Dij denotes the distance between the centroid of ESs supply zone i and demand zone j; mj indicates the demand for ESs in demand region j; mi refers to the quantity of ESs supplied by supply region i. A buffer zone, defined as a circular area with the centroid of supply region i as its origin and dj as its radius, is generated. This buffer zone is then overlaid with the demand region to determine the radiation range of the supply region [46].
The field intensity model serves as an effective tool for determining the impact intensity of ecological service functions [47]. The calculation formula is as follows:
where Fij represents the intensity of ESs transfer from output region i to input region j. Ultimately, the final flow rate is determined based on the radiation range and flow intensity of ESs.
where Eij is the flow of ESs transferred from output zone i to input zone j; At is the radiation range of supply zone i; a is the spatial value transfer parameter, representing the loss of ecosystem services during the transmission process. Drawing on relevant studies and considering the transport medium for water-energy-food, the values of a for WY, CS, and FS were set as 0.8, 0.6, and 0.998, respectively, in this study [12,48,49]. Their values, respectively, reflect the evaporation and infiltration losses of water flow during the transportation process, the biological and physical attenuation of carbon sinks during spatial diffusion, and the loss of grain during efficient transportation through modern logistics systems.
2.3.4. Construction of EC Model
To more precisely determine the amount of EC, this study takes into account the disparities in ecological environment, economic level, and social development across cities within the YREB [10]. Specifically, it evaluates habitat quality, economic level coefficients, and willingness-to-pay coefficients from these three dimensions. A judgment matrix is constructed by reviewing the relevant literature and integrating expert opinions through the analytic hierarchy process (AHP). The EC model is then established by assigning differential weights to the three aforementioned coefficients [50]. The specific formula is as follows:
where Mij refers to the amount of EC paid by demand area j to supply area i. In WY service calculation, Pγ represents the trading price of water rights in the YREB, as recorded by the China Water Rights Exchange; in CS service, it denotes the market price of the national carbon emission rights trading pilot market; in FS service, it corresponds to the annual price of agricultural products in the Yearbook of China Agricultural Products Price Survey. Qj signifies the habitat quality of demand area j; Tj indicates the economic level coefficient of demand region j; Kj reflects the willingness-to-pay coefficient in the demand area. ε, φ, and τ represent the weights of these three coefficients, respectively, with values calculated using the Analytic Hierarchy Process (AHP) method as 0.62, 0.24, and 0.14.
- (1)
- Habitat Quality
Habitat quality serves as a critical indicator of ecosystem service functionality and ecosystem health. When designing ecological compensation strategies, the regional disparities in habitat quality must be taken into account. The following equation is utilized for its calculation:
where Qxj represents the habitat quality value of grid unit x in land use type j, ranging from 0 to 1.
- (2)
- Economic Level Coefficient
The economic level coefficient serves as an indicator of regional economic development, incorporating a comprehensive evaluation of per capita GDP and government fiscal expenditure levels. A higher economic level coefficient signifies a stronger capacity for ecological compensation payments [51]. The formula is as follows:
where Tj represents the economic development coefficient of demand zone j, ranging in value from 0 to 1. A higher value indicates a more advanced level of economic development and stronger financial capacity. GDPj denotes the dimensionless standardization result of per capita GDP in region j. CGEj refers to the dimensionless standardization result of government financial expenditure in region j, with the standardization method being Min-Max normalization. Assuming that per capita GDP and government expenditure are equally significant, the weights are set as a = b = 0.5.
- (3)
- Willingness to Pay Coefficient
The varying levels of social and economic development across regions result in differences in individuals’ environmental awareness and capacity for ecological protection. This cognitive progression and associated payment capacity align more closely with the S-shaped Peel growth curve [52]. Consequently, the calculation formula for the willingness to pay coefficient is as follows:
where Kj represents the willingness-to-pay coefficient of demand zone j, En1 and En2 denote the Engel coefficients of urban and rural areas in demand zone j, respectively. These coefficients can be used to measure the ability to pay.
2.3.5. The XGBoost Model Integrated with the SHAP Explanation Method
In this study, the ecological compensation amount for each city in the YREB was designated as the dependent variable, while 15 driving factors were selected as independent variables. The average values of both dependent and independent variables across the 130 cities within the study area were computed and subsequently used to form the sample dataset. An Extreme Gradient Boosting (XGBoost) model was developed and integrated with the SHAP interpretation method to investigate the driving mechanisms underlying ecological compensation. To ensure the reliability of the model, ten-fold cross-validation was adopted to evaluate the model performance in the study. The results showed that the R2 of the model on the test set was 0.94, indicating that the model had good fitting ability and generalization performance. By computing the contribution of each feature across all possible subsets, SHAP quantifies the influence of individual variables on the model’s final output [53]. The calculation formula is as follows:
In the formula, xpq denotes the q-th eigenvalue of the p-th feature, y represents the ecological compensation amount, φ0 denotes the average value of the ecological compensation amount, and SHAP refers to the contribution of feature variable q to y. The absolute value of SHAP indicates the magnitude of influence exerted by the feature variable on the target variable: a larger absolute value corresponds to a stronger influence. When SHAP(xpq) > 0, an increase in the feature variable’s value tends to increase the ecological compensation amount; conversely, when SHAP(xpq) < 0, an increase in the feature variable leads to a reduction in the ecological compensation amount.
3. Results
3.1. Quantification of ESs Supply and Demand
The spatiotemporal variations in WY, CS, and FS in the YREB from 2000 to 2020 were substantial and statistically significant.
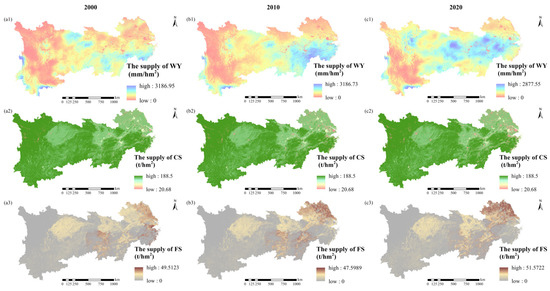
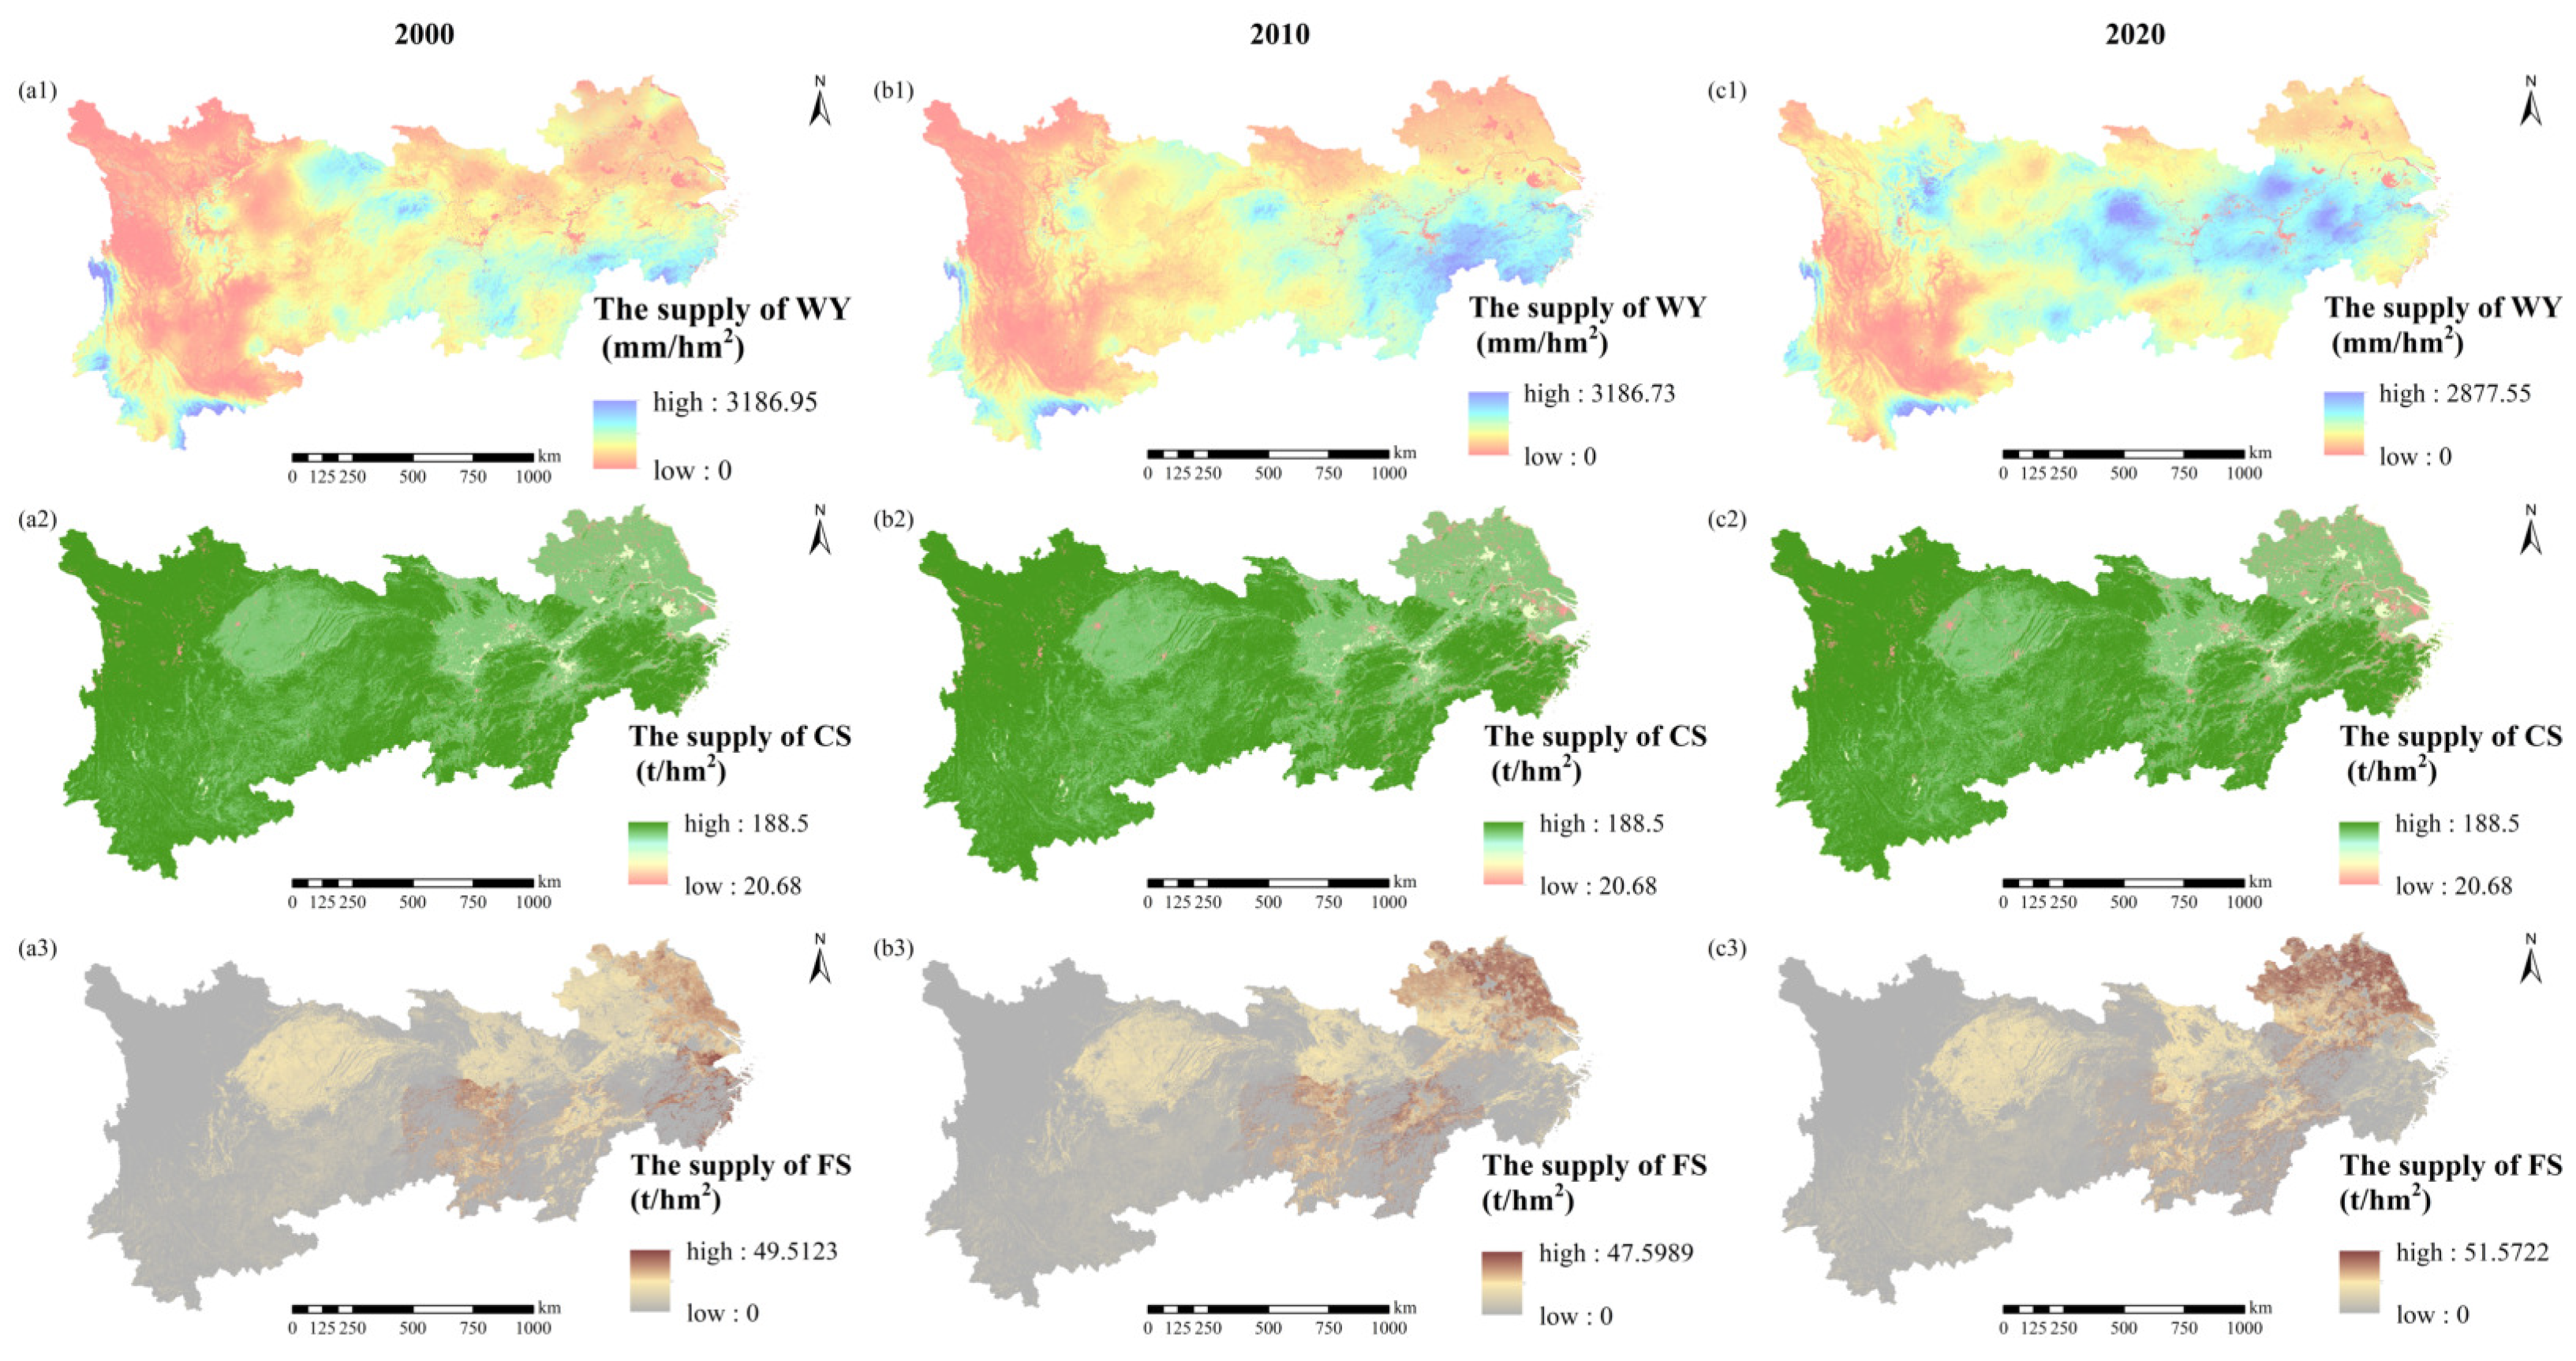
In terms of ES supply (Figure 3), The total supply of WY and FS in the YREB region exhibited an upward trend from 2000 to 2020, with average annual increments of 1778.12 mm/hm2 and 1,617,384.71 t/hm2, respectively. In contrast, the total supply of CS demonstrated a downward trend, with an average annual decrease of 9,413,517.96 t/hm2. From the perspective of spatial distribution, the areas with high WY values are mainly located in the central part of the YREB and the Sichuan Basin, where plentiful rainfall and substantial opaque water surfaces hinder precipitation from infiltrating. In contrast, the low-value regions are mainly located in the southwestern and northeastern parts of the YREB. The southwestern region exhibits lush vegetation due to its high elevation and steep slopes, while the northeastern region is predominantly agricultural with dense crop coverage. These characteristics result in strong evapotranspiration in these areas. High-value regions for CS are predominantly found in mountainous and hilly areas where human activity is minimal and forest and grass resources are abundant. The high-value regions for FS are concentrated in the northeastern plains as well as the plains of Hunan, Hubei, and Sichuan provinces, which are flat and rich in water resources, making them highly suitable for crop growth.
Figure 3.
The spatial distribution of WY, CS and FS supply. (a1) WY in 2000; (a2) CS in 2000; (a3) FS in 2000; (b1) WY in 2010; (b2) CS in 2010; (b3) FS in 2010; (c1) WY in 2020; (c2) CS in 2020; (c3) FS in 2020.
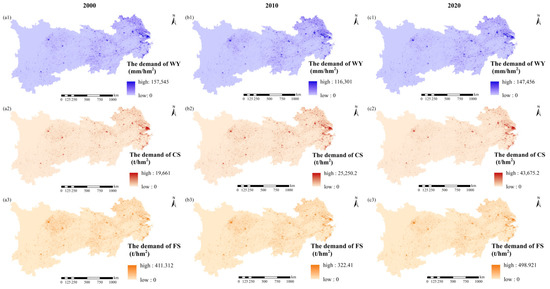
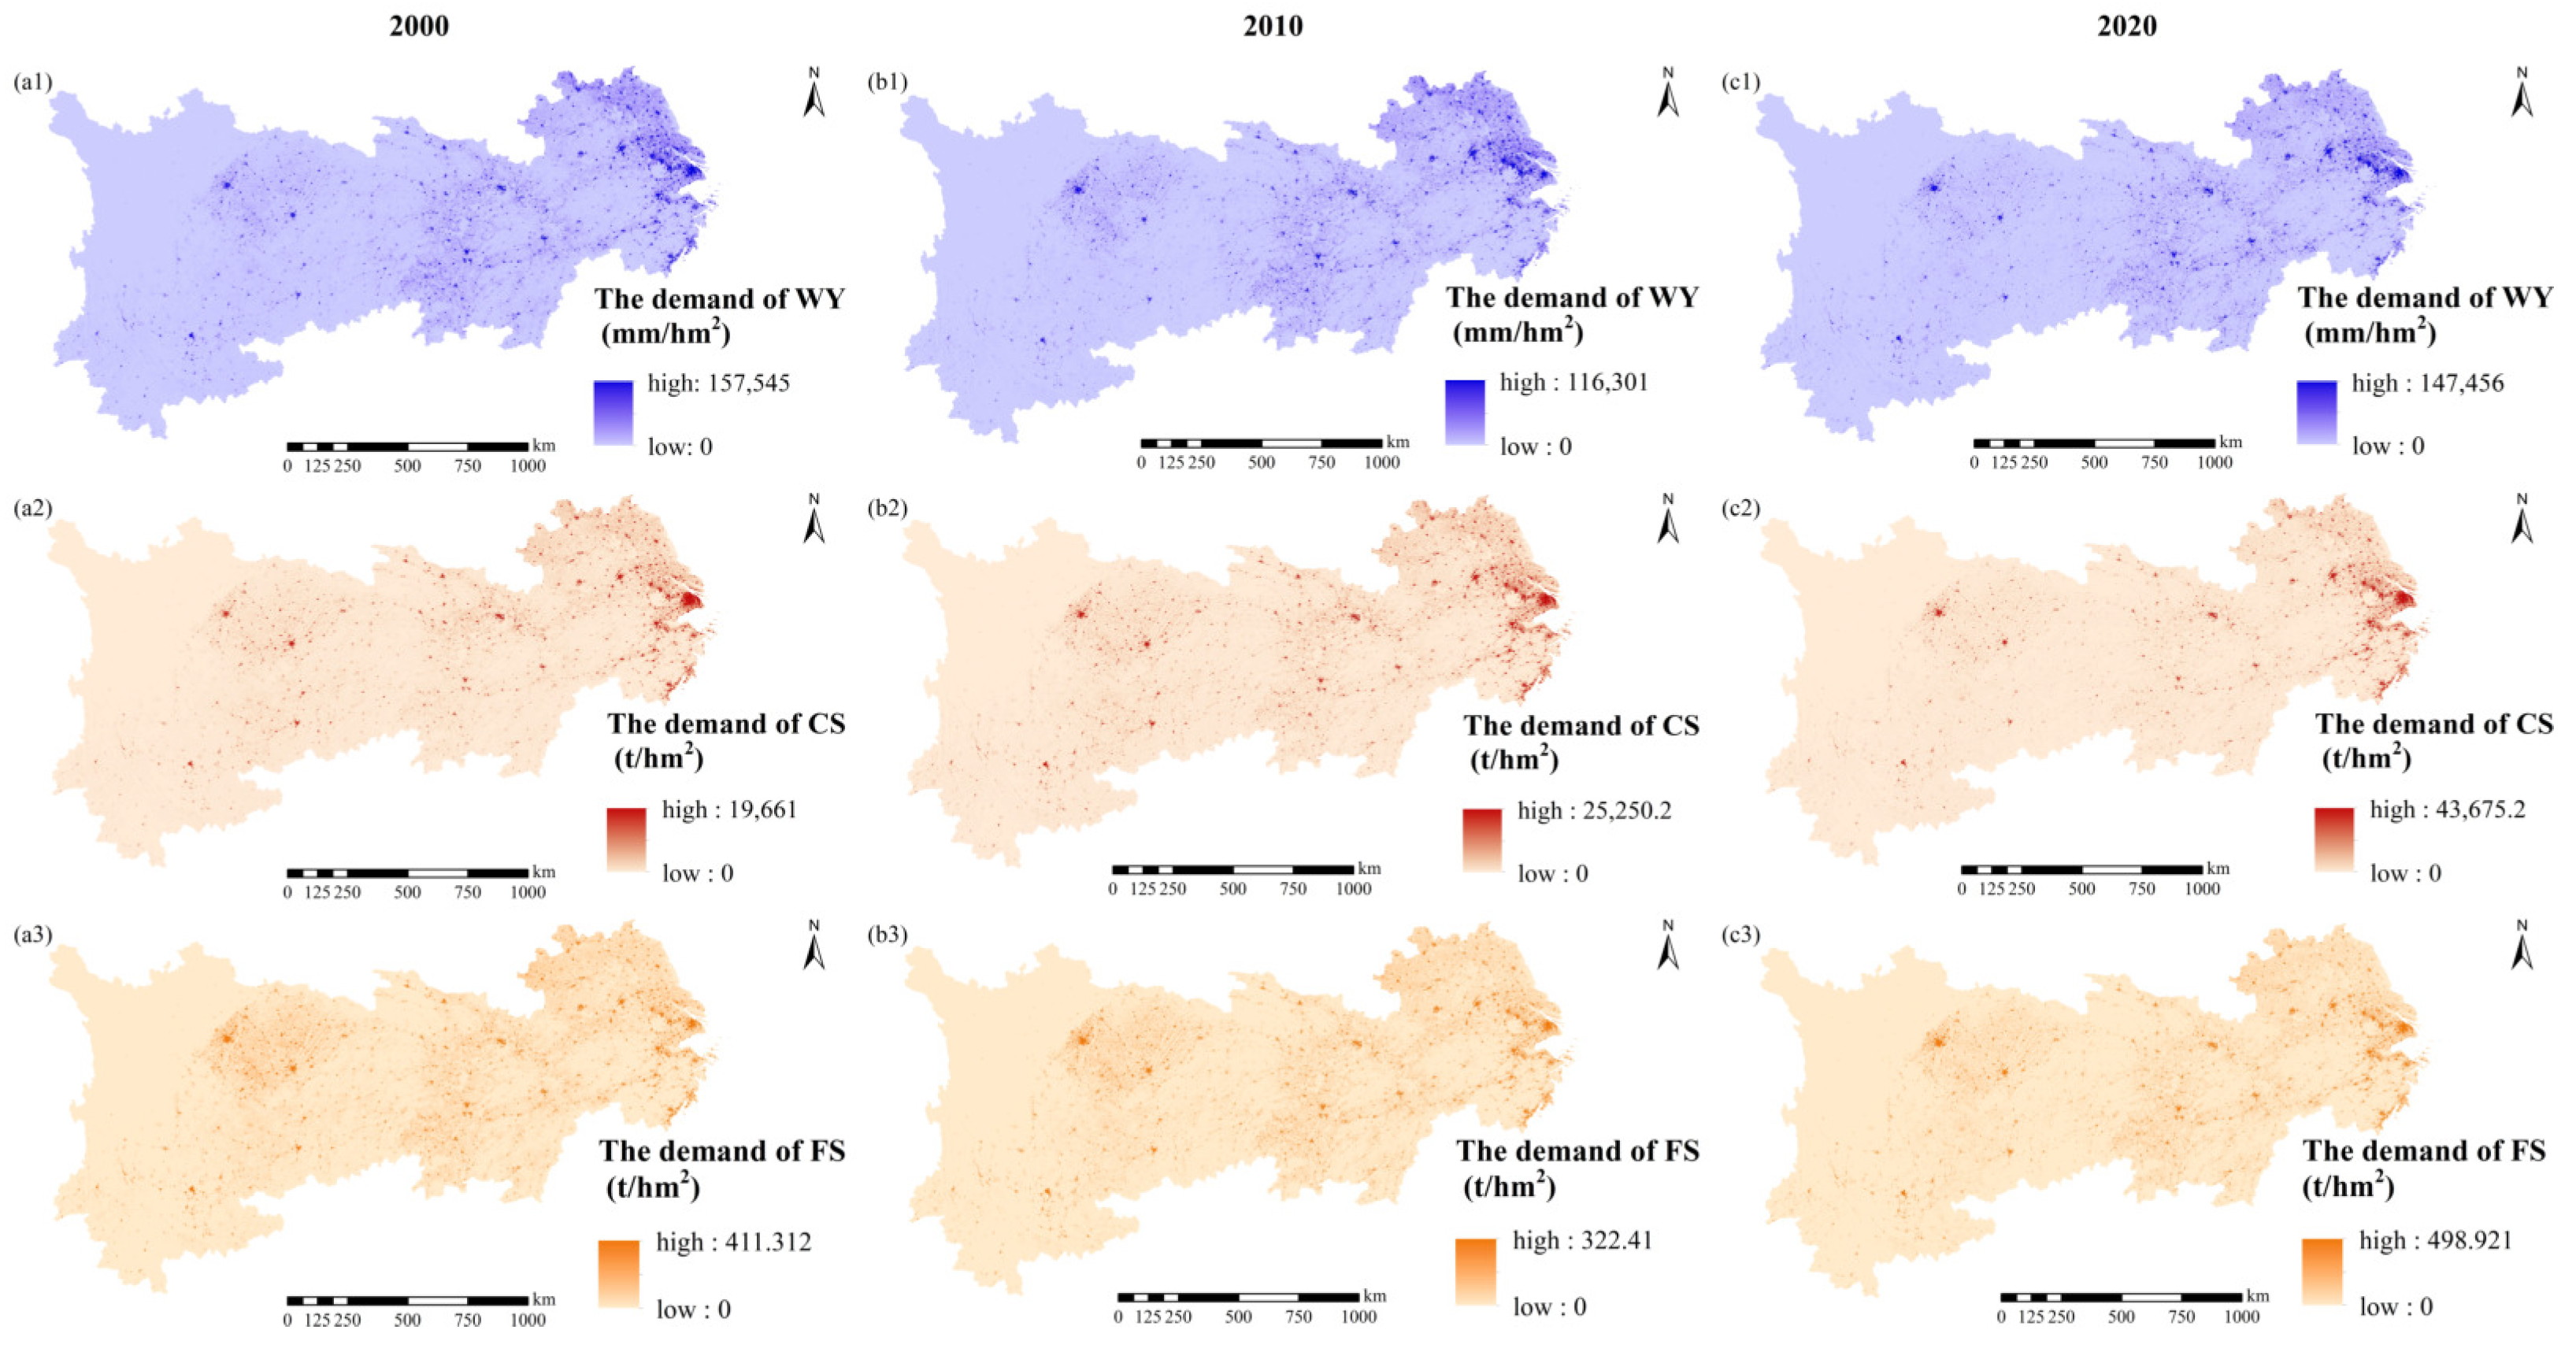
In terms of ES demand (Figure 4), The total demand for WY, CS, and FS in the YREB region exhibited an upward trend. From 2000 to 2020, the average annual increments were 64.58 mm/hm2, 12,256,675.27 t/hm2, and 198,218.79 t/hm2, respectively. Given that the population is predominantly concentrated in urban areas, the spatial distribution pattern of ES demand closely mirrors that of population density.
Figure 4.
The spatial distribution of WY, CS and FS demand. (a1) WY in 2000; (a2) CS in 2000; (a3) FS in 2000. (b1) WY in 2010; (b2) CS in 2010; (b3) FS in 2010. (c1) WY in 2020; (c2) CS in 2020; (c3) FS in 2020.
3.2. Investigation into the Relationship of ESs
3.2.1. Trade-Offs and Synergies Among ESs
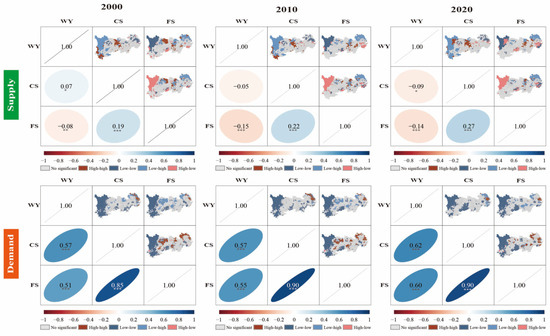
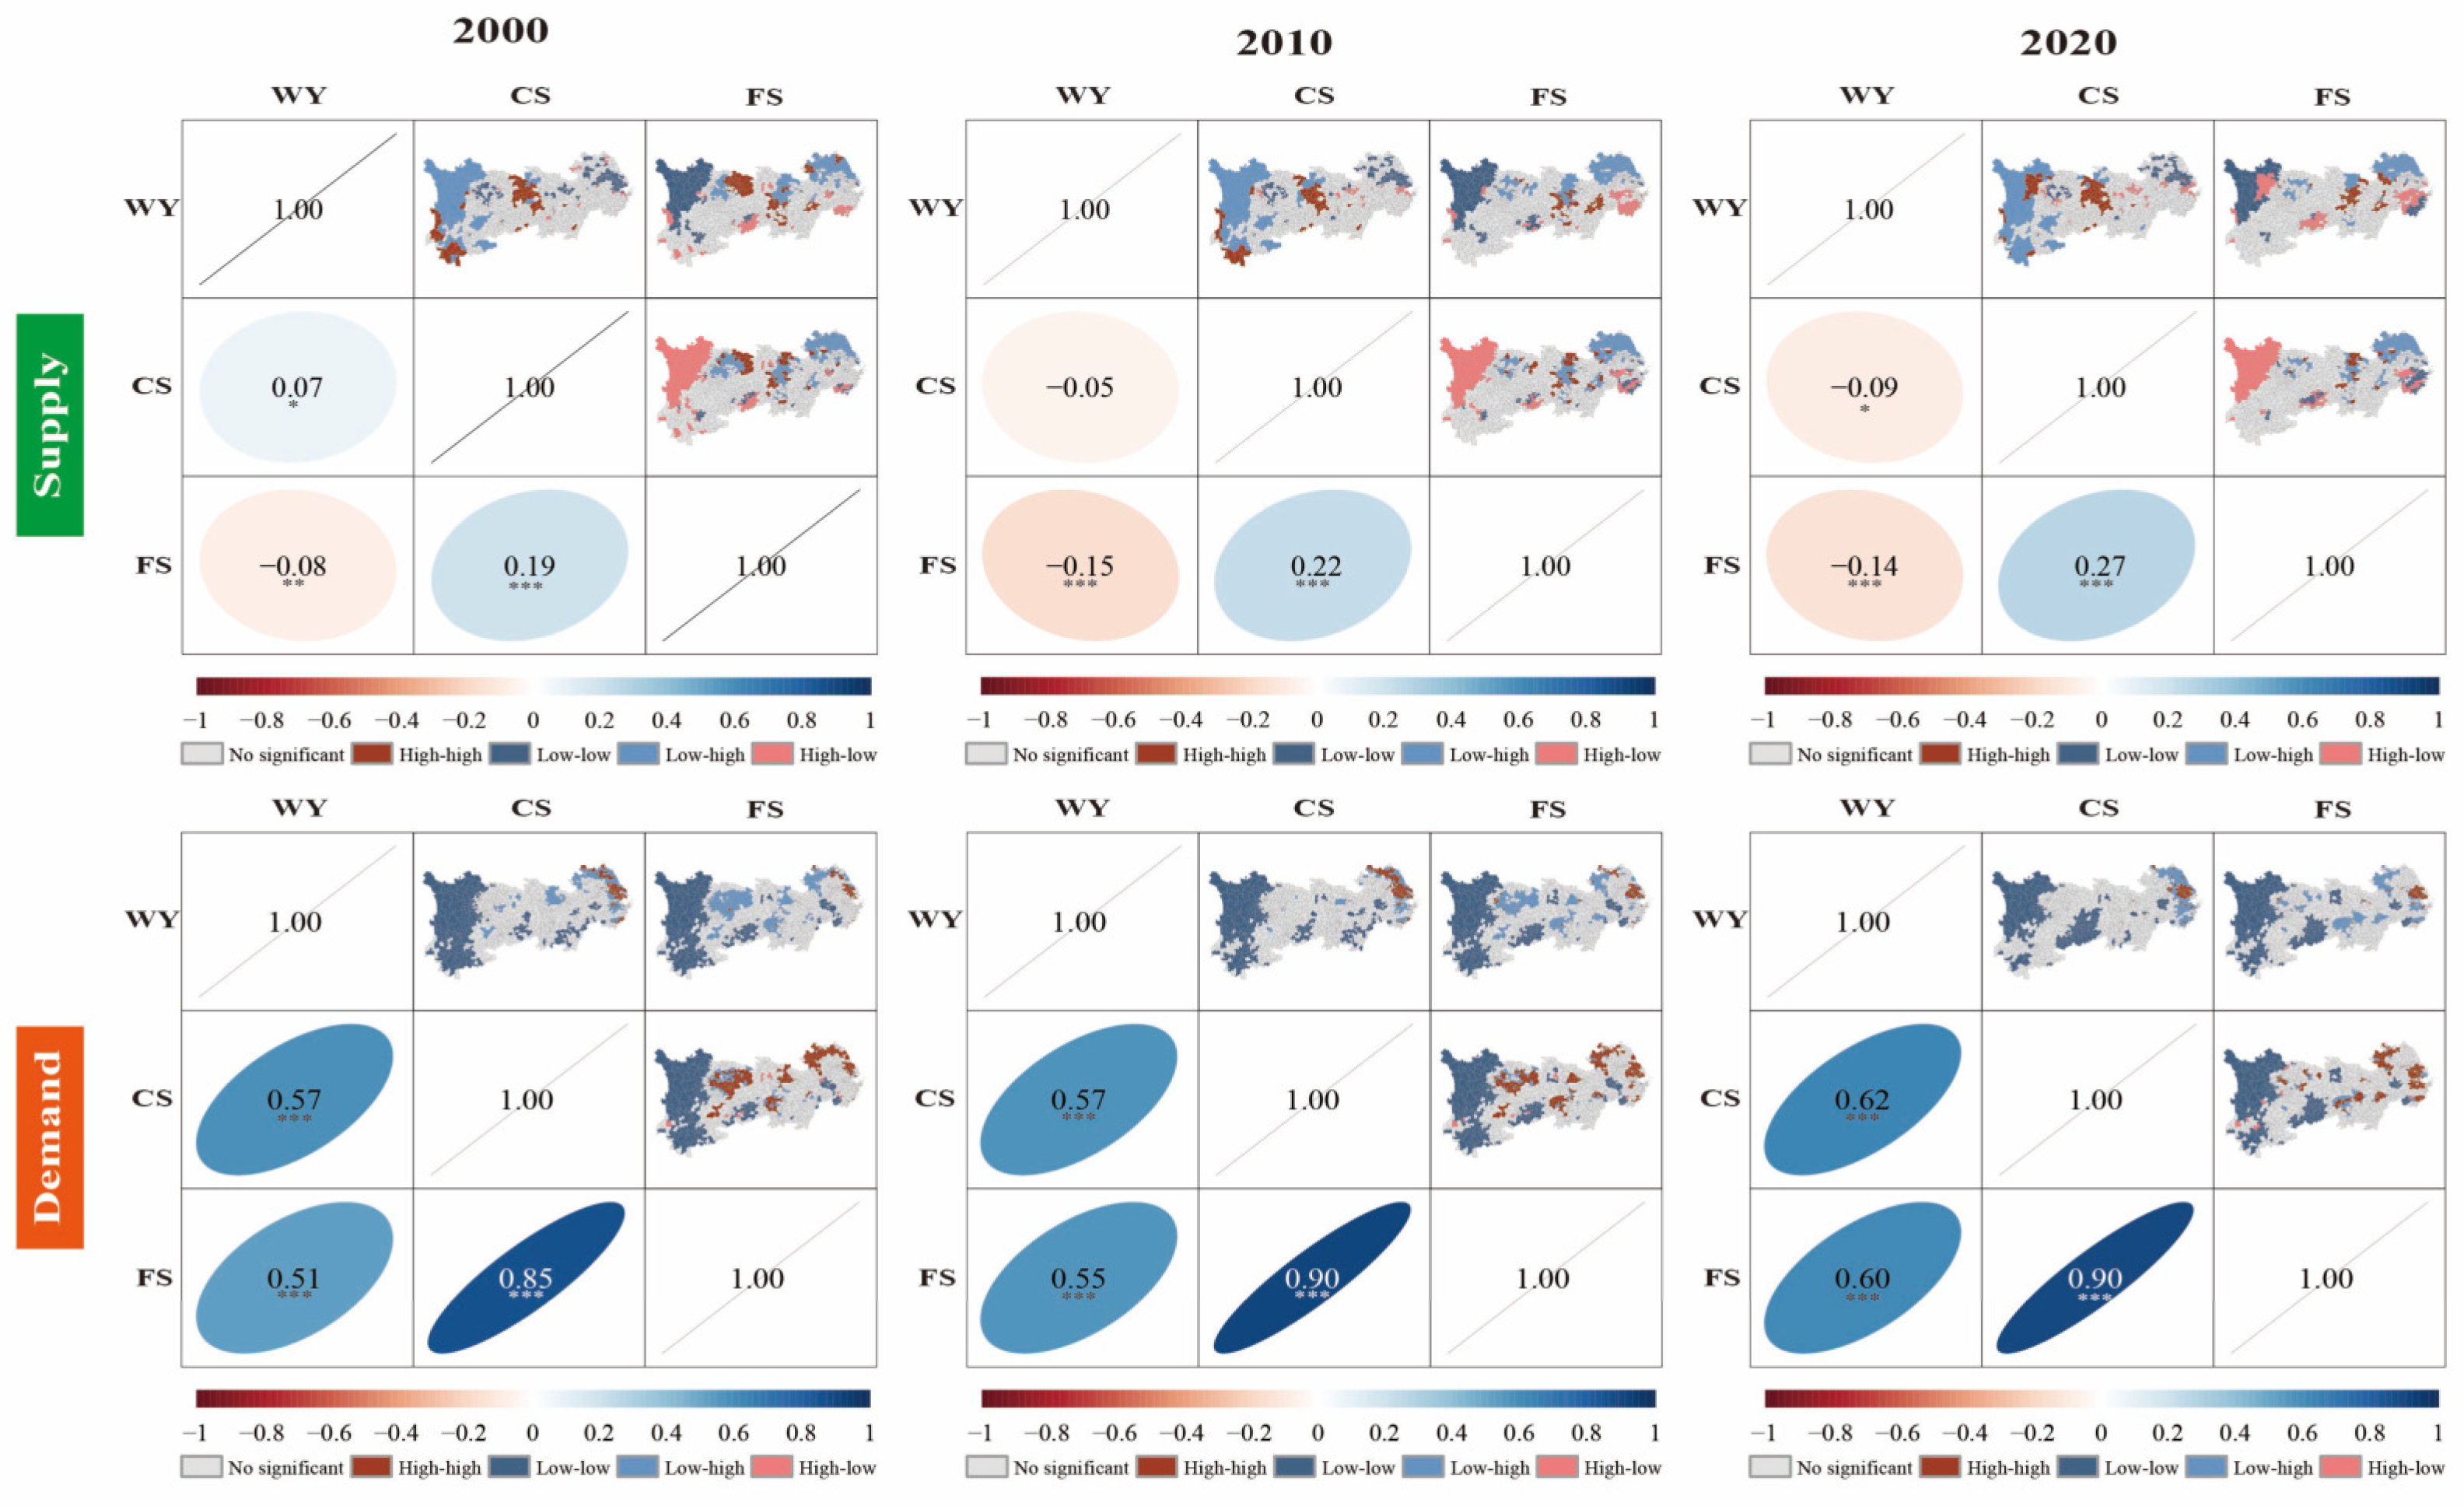
From 2000 to 2020, there were notable variations in the trade-off and synergy dynamics between the supply and demand pairs of ESs within the YREB (Figure 5). On the supply side, the relationship between CS and WY transitioned from a trade-off to a synergistic interaction; however, this relationship remains weak and statistically insignificant. A relatively minor trade-off exists between WY and FS, with high-low trade-off zones predominantly concentrated in the southeastern region as well as certain districts and counties in Sichuan and Guizhou provinces. Conversely, low–high trade-off areas are primarily located in the northeastern part and the central plain regions. There is a certain degree of synergy between CS and FS, where high-synergy zones are sporadically distributed in the central area, while low-synergy zones are mainly concentrated in the southeastern region. From the demand perspective, significant synergy effects are observed among the three ESs, with low-low synergy areas predominantly distributed in the upstream and midstream regions, whereas high-high synergy areas are largely situated in the downstream Yangtze River Delta region.
Figure 5.
Trade-off synergy of ESs (* p ≤ 0.05, ** p ≤ 0.01, *** p ≤ 0.001).
3.2.2. The Supply–Demand Relationship of ESs
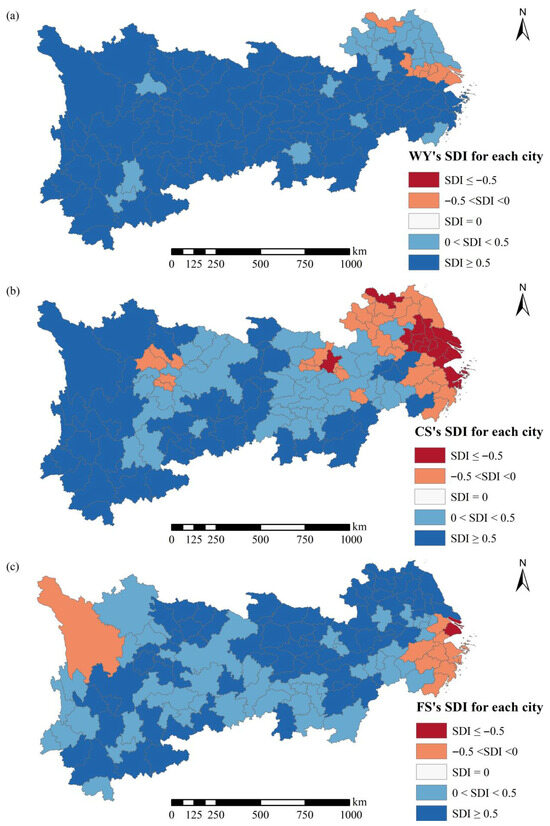
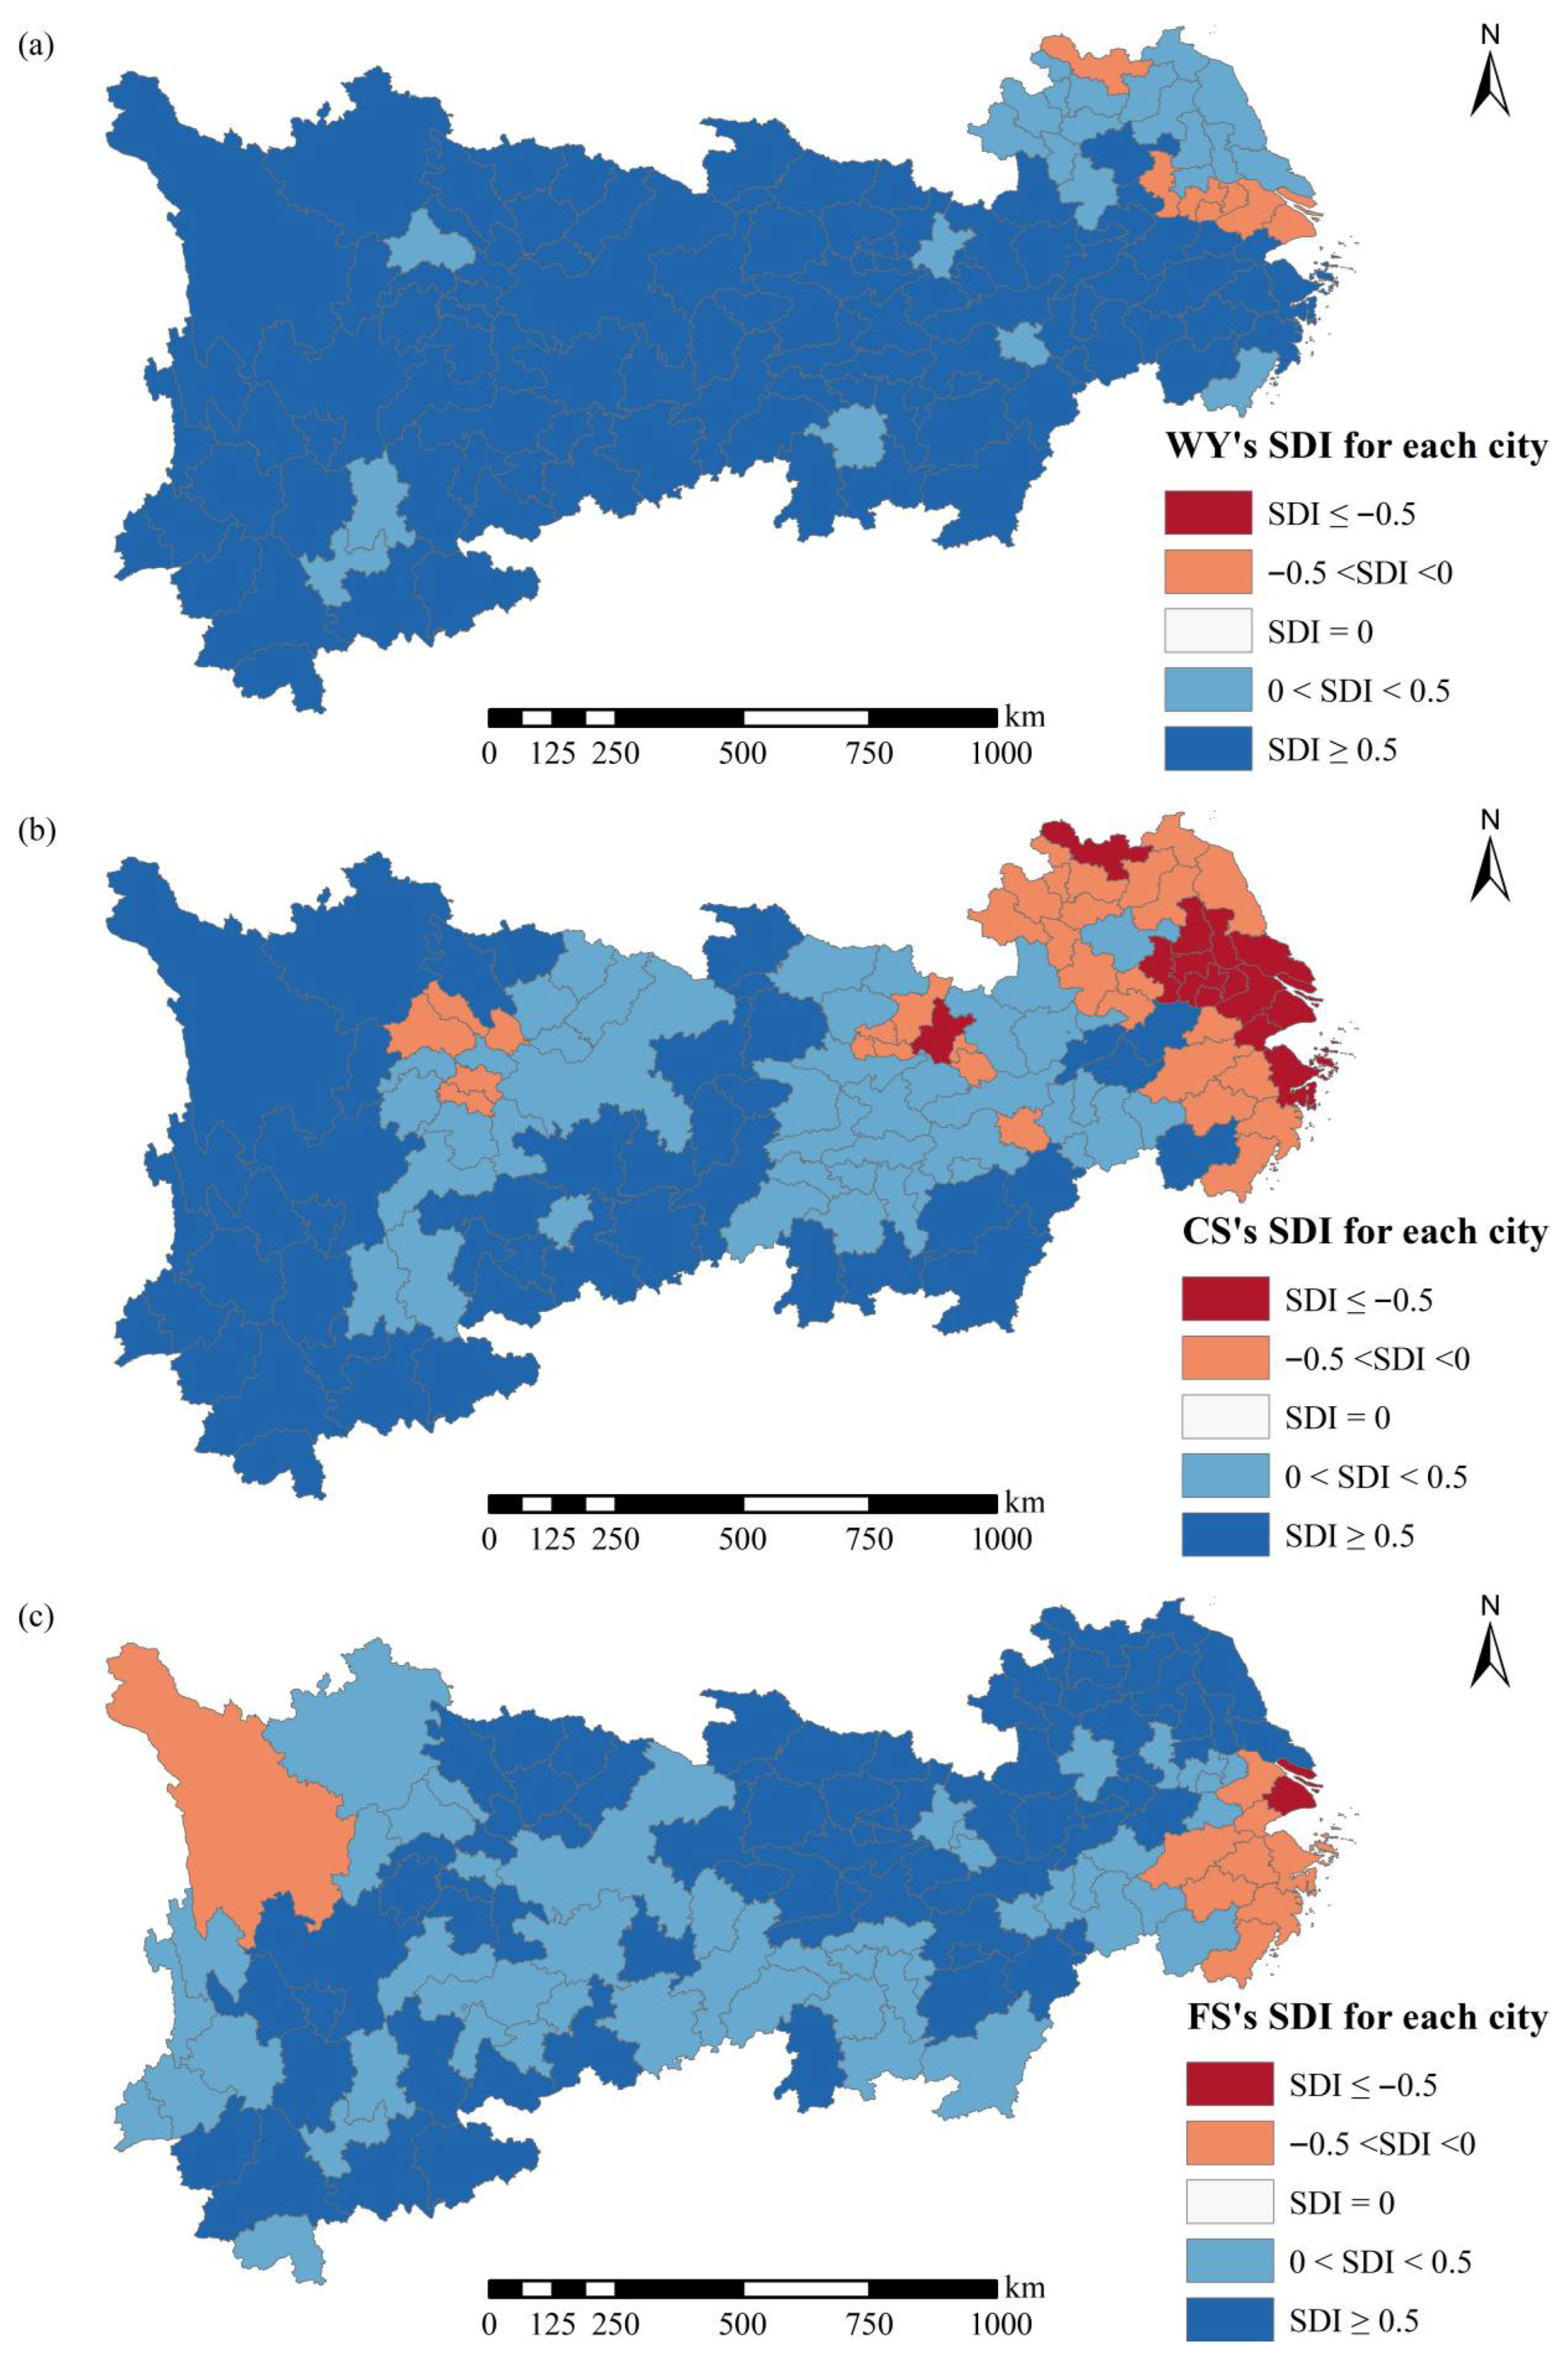
This study quantified the average SDI from 2000 to 2020 by analyzing the supply and demand of three types of ESs derived from statistical data across cities in the YREB region. The findings indicate that over the two-decade period, deficits were observed in all three types of ESs within the YREB (Figure 6).
Figure 6.
The SDI of WY, CS and FS for each city within the YREB. (a) WY’s SDI for each city; (b) CS’s SDI for each city; (c) FS’s SDI for each city.
According to the calculations, the SDI of WY is negative in only five cities within Jiangsu Province and Shanghai. These cities commonly face challenges such as high population density, significant industrial water consumption, or inadequate water resource allocation. Notably, Shanghai exhibits the lowest SDI value at −0.296. There are 45 cities with a CS deficit, predominantly located in the Yangtze River Delta region. Cities with severe SDI deficits (SDI < −0.5) are primarily concentrated in economically advanced areas, including Shanghai, Suzhou, Nanjing, and Wuhan. Other deficit cities are distributed across urban clusters centered around economically developed provincial capitals, such as Wuhan and Chengdu, which experience intensive industrial activities and high carbon emissions due to energy consumption. The city with the lowest SDI is Shanghai, where the SDI reaches −0.955. Eleven cities exhibit FS SDI values below zero, mainly situated in the southeastern part of the Yangtze River Delta. This region is characterized by high levels of industrialization and urbanization, with predominantly mountainous and hilly terrain and limited arable land. Among these cities, Shanghai has the lowest FS SDI at −0.593. Garze Prefecture experiences low FS due to its high altitude and unsuitable topography and climate for crop growth, resulting in an FS deficit with an SDI of −0.288.
In general, the majority of cities within the YREB that provide “water-energy-food” services exhibit surpluses. However, certain cities face significant deficits. For instance, Shanghai and Suzhou experience deficits in all three dimensions of “water-energy-food,” with Shanghai recording the lowest SDI among YREB regions for these three services. Twelve cities, including Hangzhou, Ningbo, and Nanjing, are categorized as “double deficit” cities, relying heavily on external inputs and necessitating enhanced regional ecological protection to sustain ecological balance. Beyond cities already experiencing deficits, attention should also be directed toward smaller cities with positive but marginal SDI values. For example, Zhenjiang’s WY SDI is 0.007, Jingzhou and Tongling’s CS SDI values are 0.022 and 0.024, respectively, while Wuxi and Chengdu’s FS SDI values are 0.012 and 0.02, respectively. These cities, under pressure from population growth and economic development, must prioritize sustainable development alongside economic construction to prevent the emergence of related ecological service deficits.
3.3. Identification of the “Water-Energy-Food” Service Flow
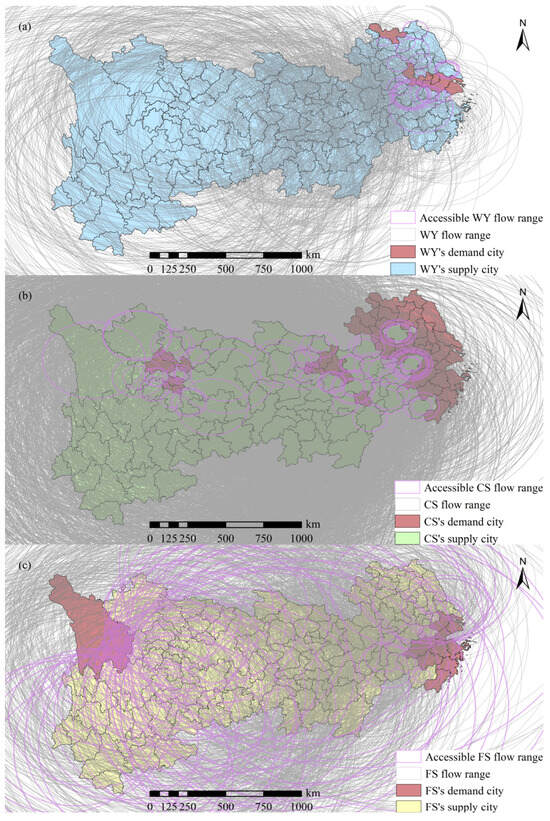
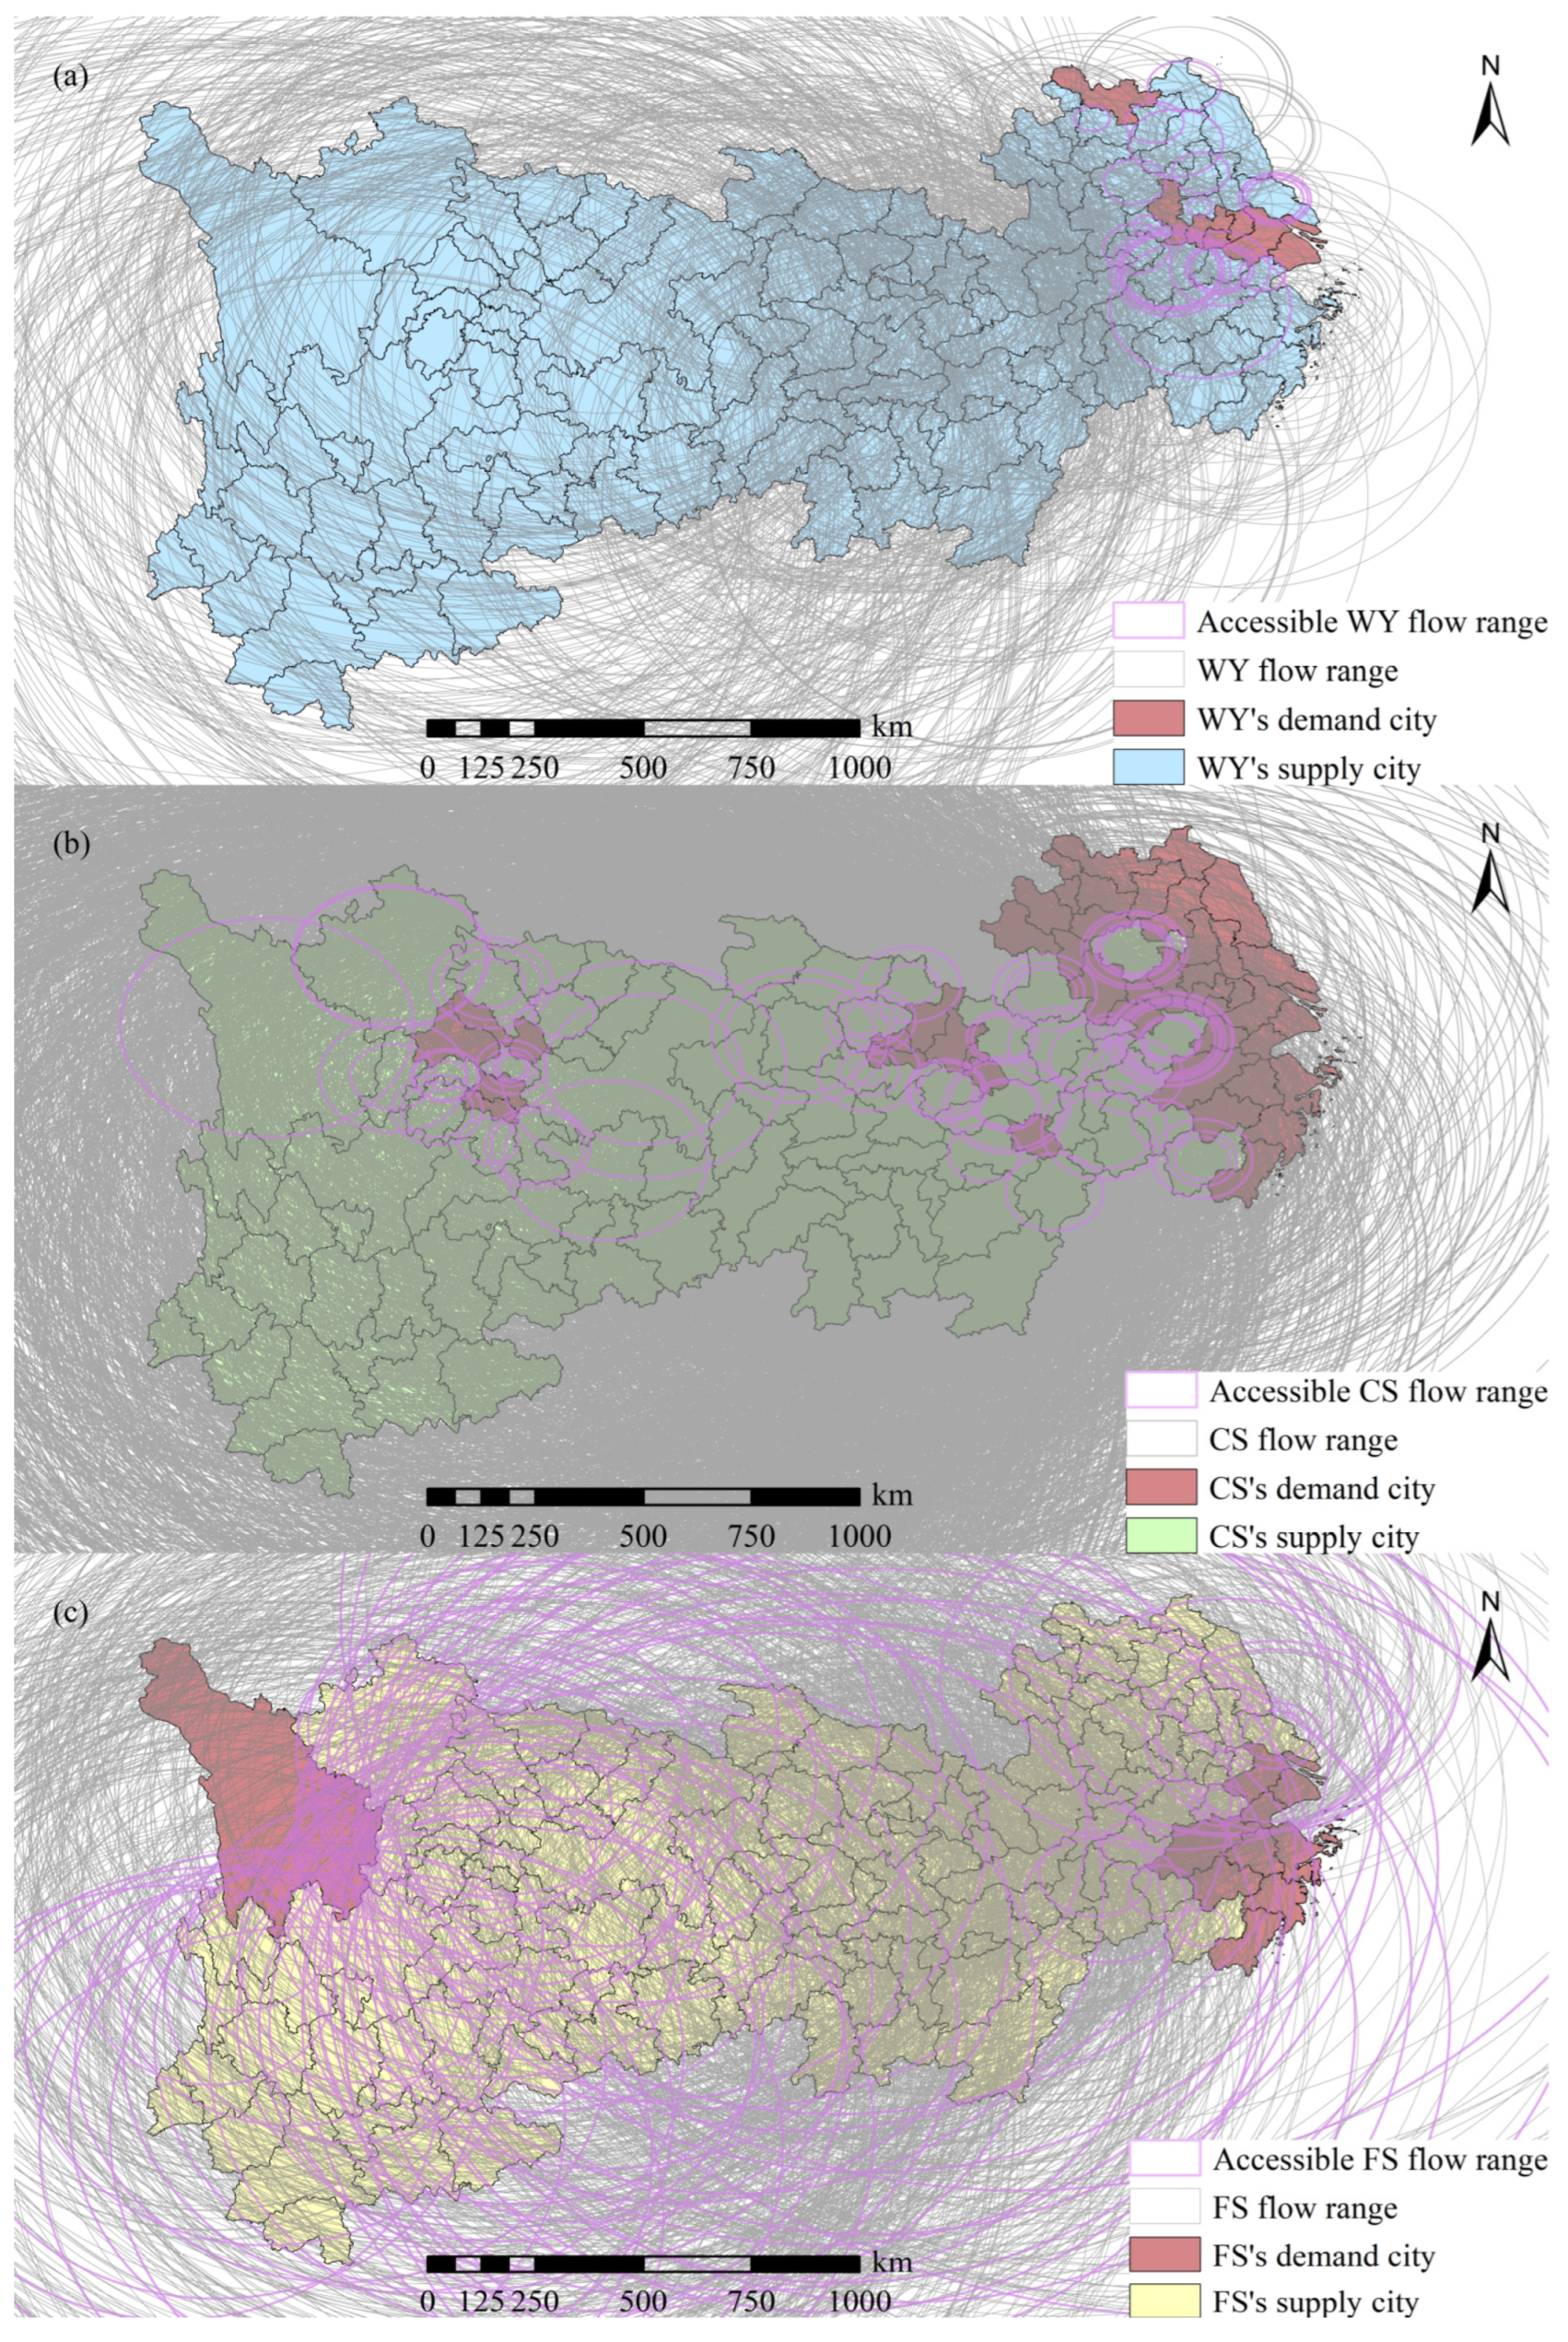
In this study, the breakpoint formula and field strength model were employed to estimate the flow range of each supply city. The intersecting flow range with the corresponding demand city was selected as the accessible service flow range (Figure 7). Owing to the effects of distance and inherent supply capacity, the service flow range generated within a supply city may fail to reach the designated demand city, thereby resulting in an unmet ESF. The findings indicate that: Among WY services, 23 flow ranges successfully reach their corresponding demand cities, ensuring service provision and input for each demand city. For CS services, 78 flow ranges can reach their respective demand cities, yet among the 45 CS-demand cities, 13 cities exhibit no CS inflow. These cities are evenly distributed across the Yangtze River Delta region, with Shanghai and Jiaxing experiencing significant CS deficits. In the case of FS services, 82 flow ranges can reach their corresponding demand cities; however, among the 11 FS-demand cities, 5 cities lack FS inflow, all of which are located in Zhejiang Province.
Figure 7.
Flow range of WY, CS and FS in each supply city. (a) WY’s flow range; (b) CS’s flow range; (c) FS’s flow range.
The radiation area, radiation intensity, and total radiation volume for each service were quantified (Tables S1–S3). The findings indicate that the total radiation volume is determined by both the radiation range and radiation intensity, while the distance between supply and demand intervals and the service output of supply and demand cities are the primary factors influencing the radiation range and radiation intensity.
3.4. Investigation into EC Mechanisms
3.4.1. Quantification of Ecological Compensation
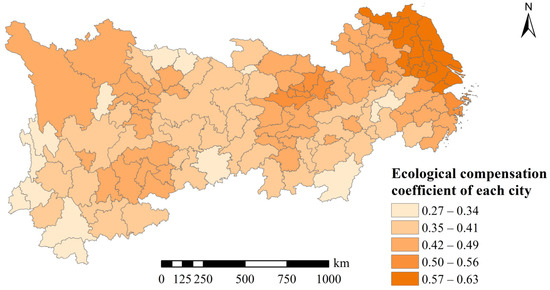
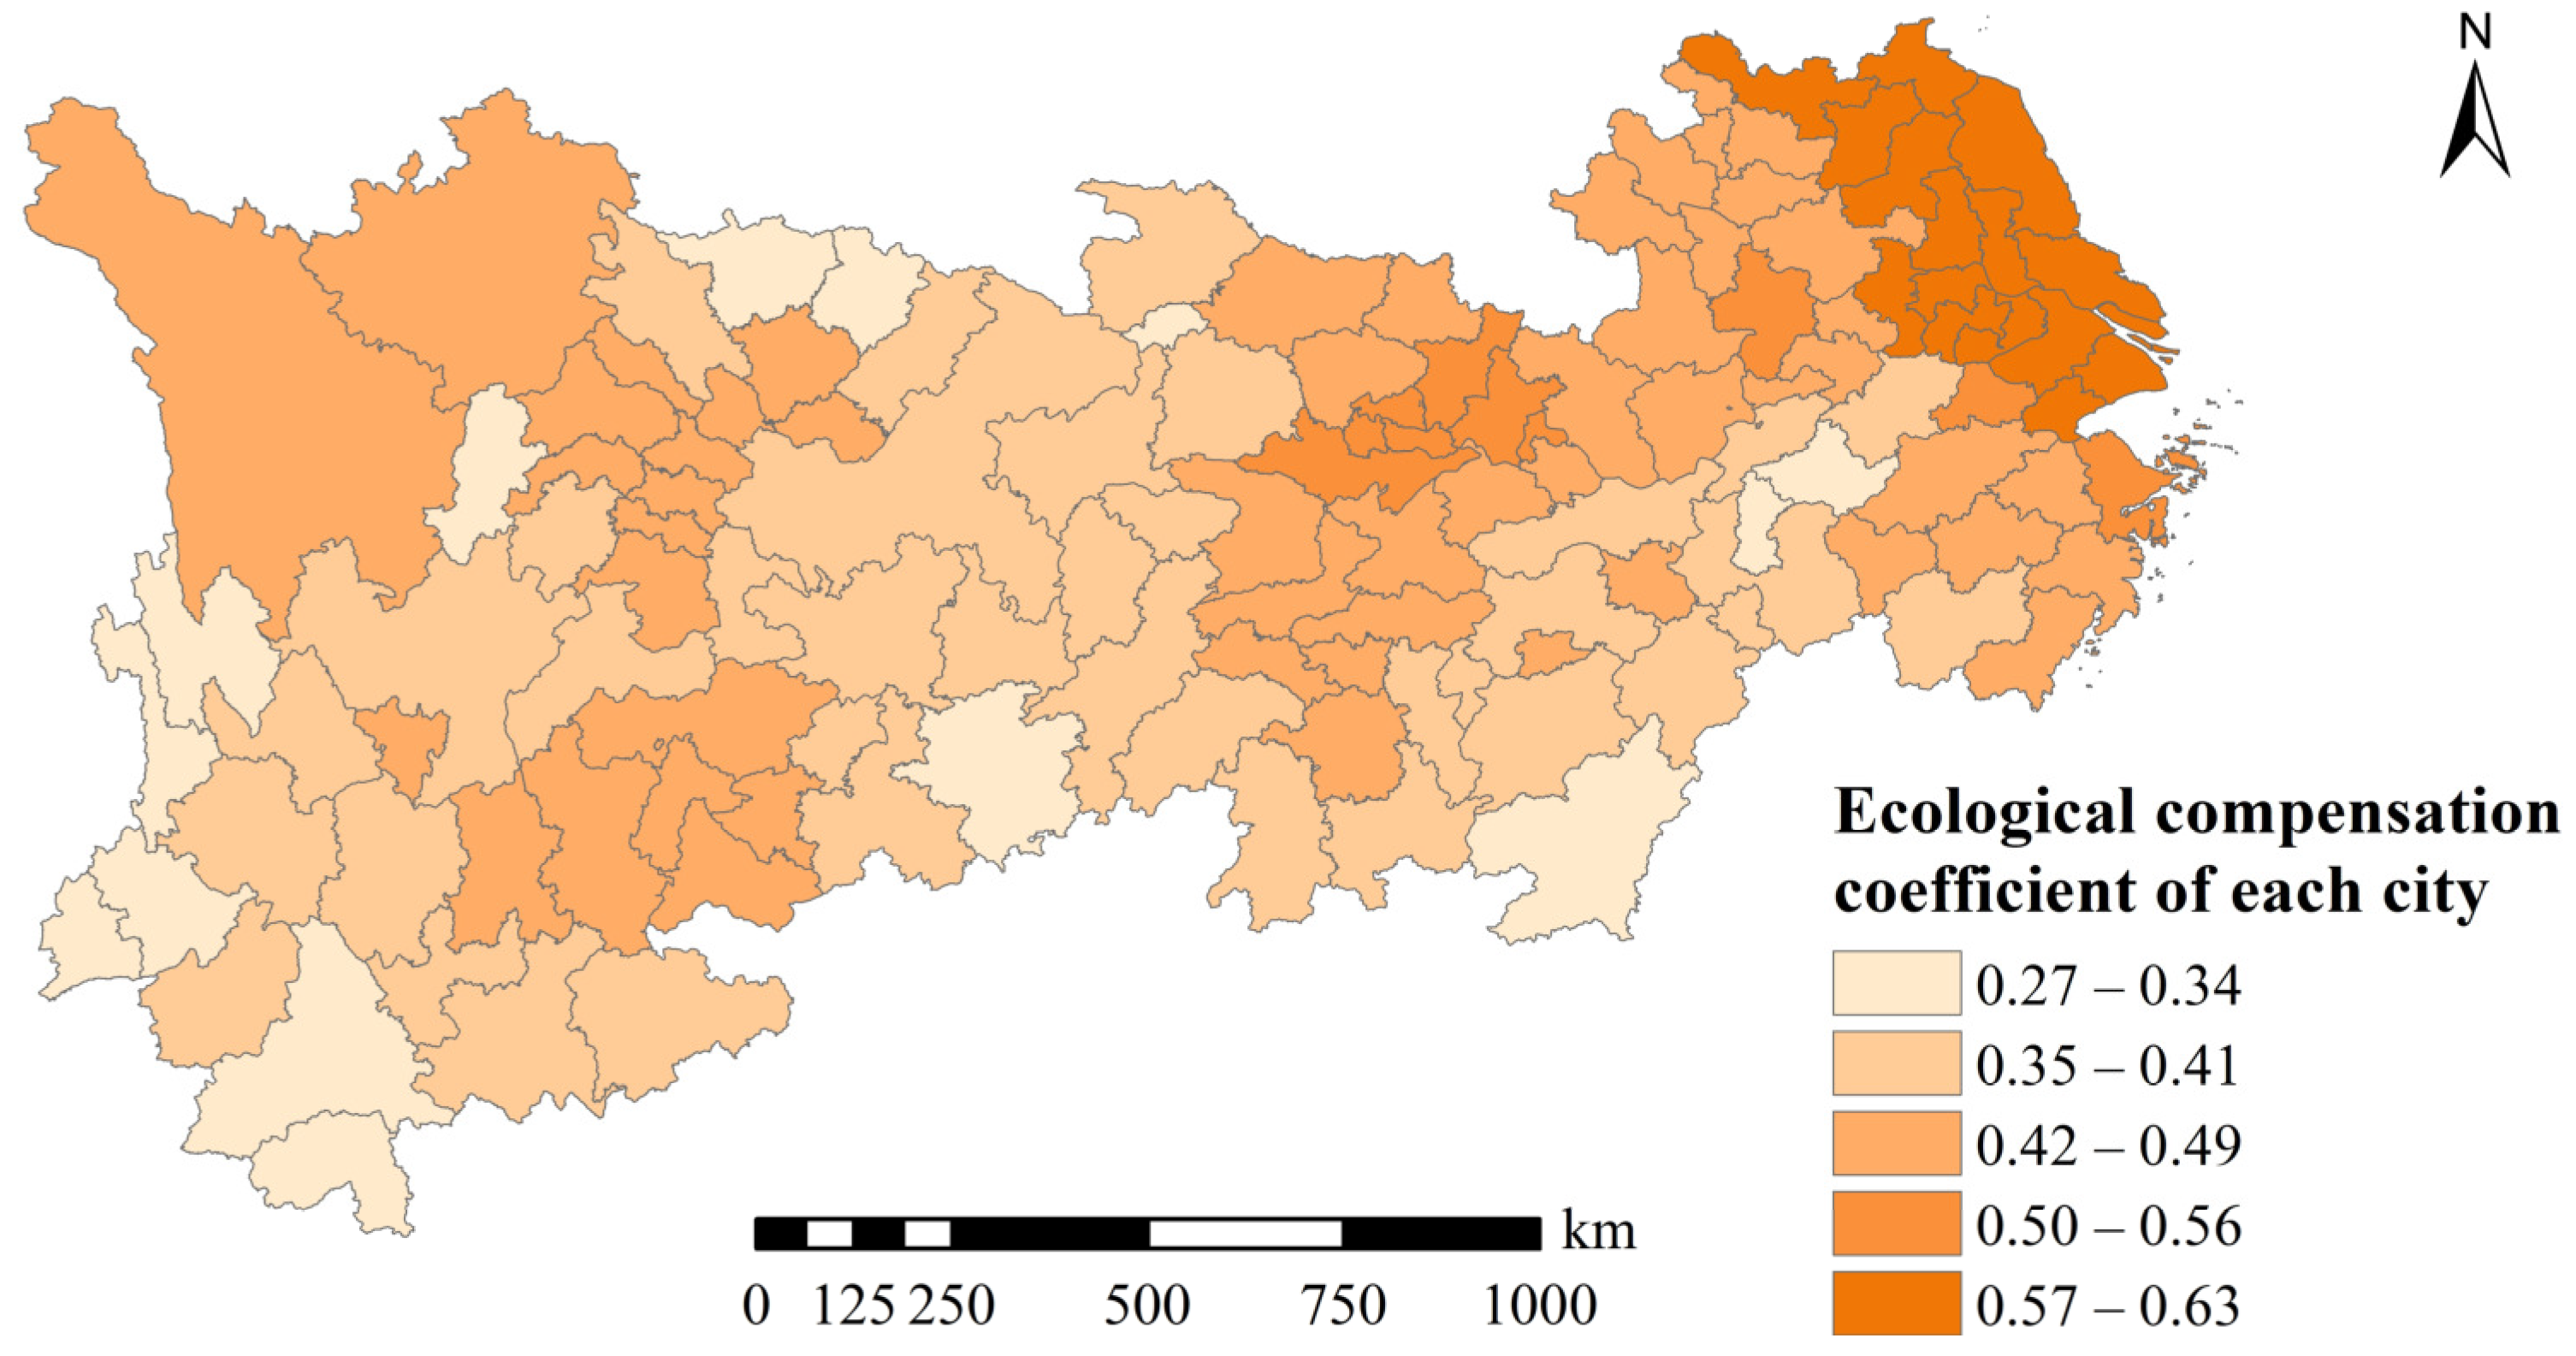
In this study, by referring to the statistical yearbooks of each province from 2000 to 2020, we calculated the average economic level coefficient and willingness-to-pay coefficient for each province during the same period. In conjunction with the InVEST model, the habitat quality of the YREB from 2000 to 2020 was assessed. By applying weights derived from the Analytic Hierarchy Process (AHP) at the city level, we further weighted and calculated the aforementioned coefficients to determine the ecological compensation coefficients for each city within the YREB (Figure 8). Areas with relatively high ecological compensation coefficients are predominantly concentrated in Jiangsu Province and Shanghai. Under the assumption of service flow existence, each service input area will compensate the corresponding service output area based on the ecological compensation coefficient.
Figure 8.
Ecological compensation coefficient of each city.
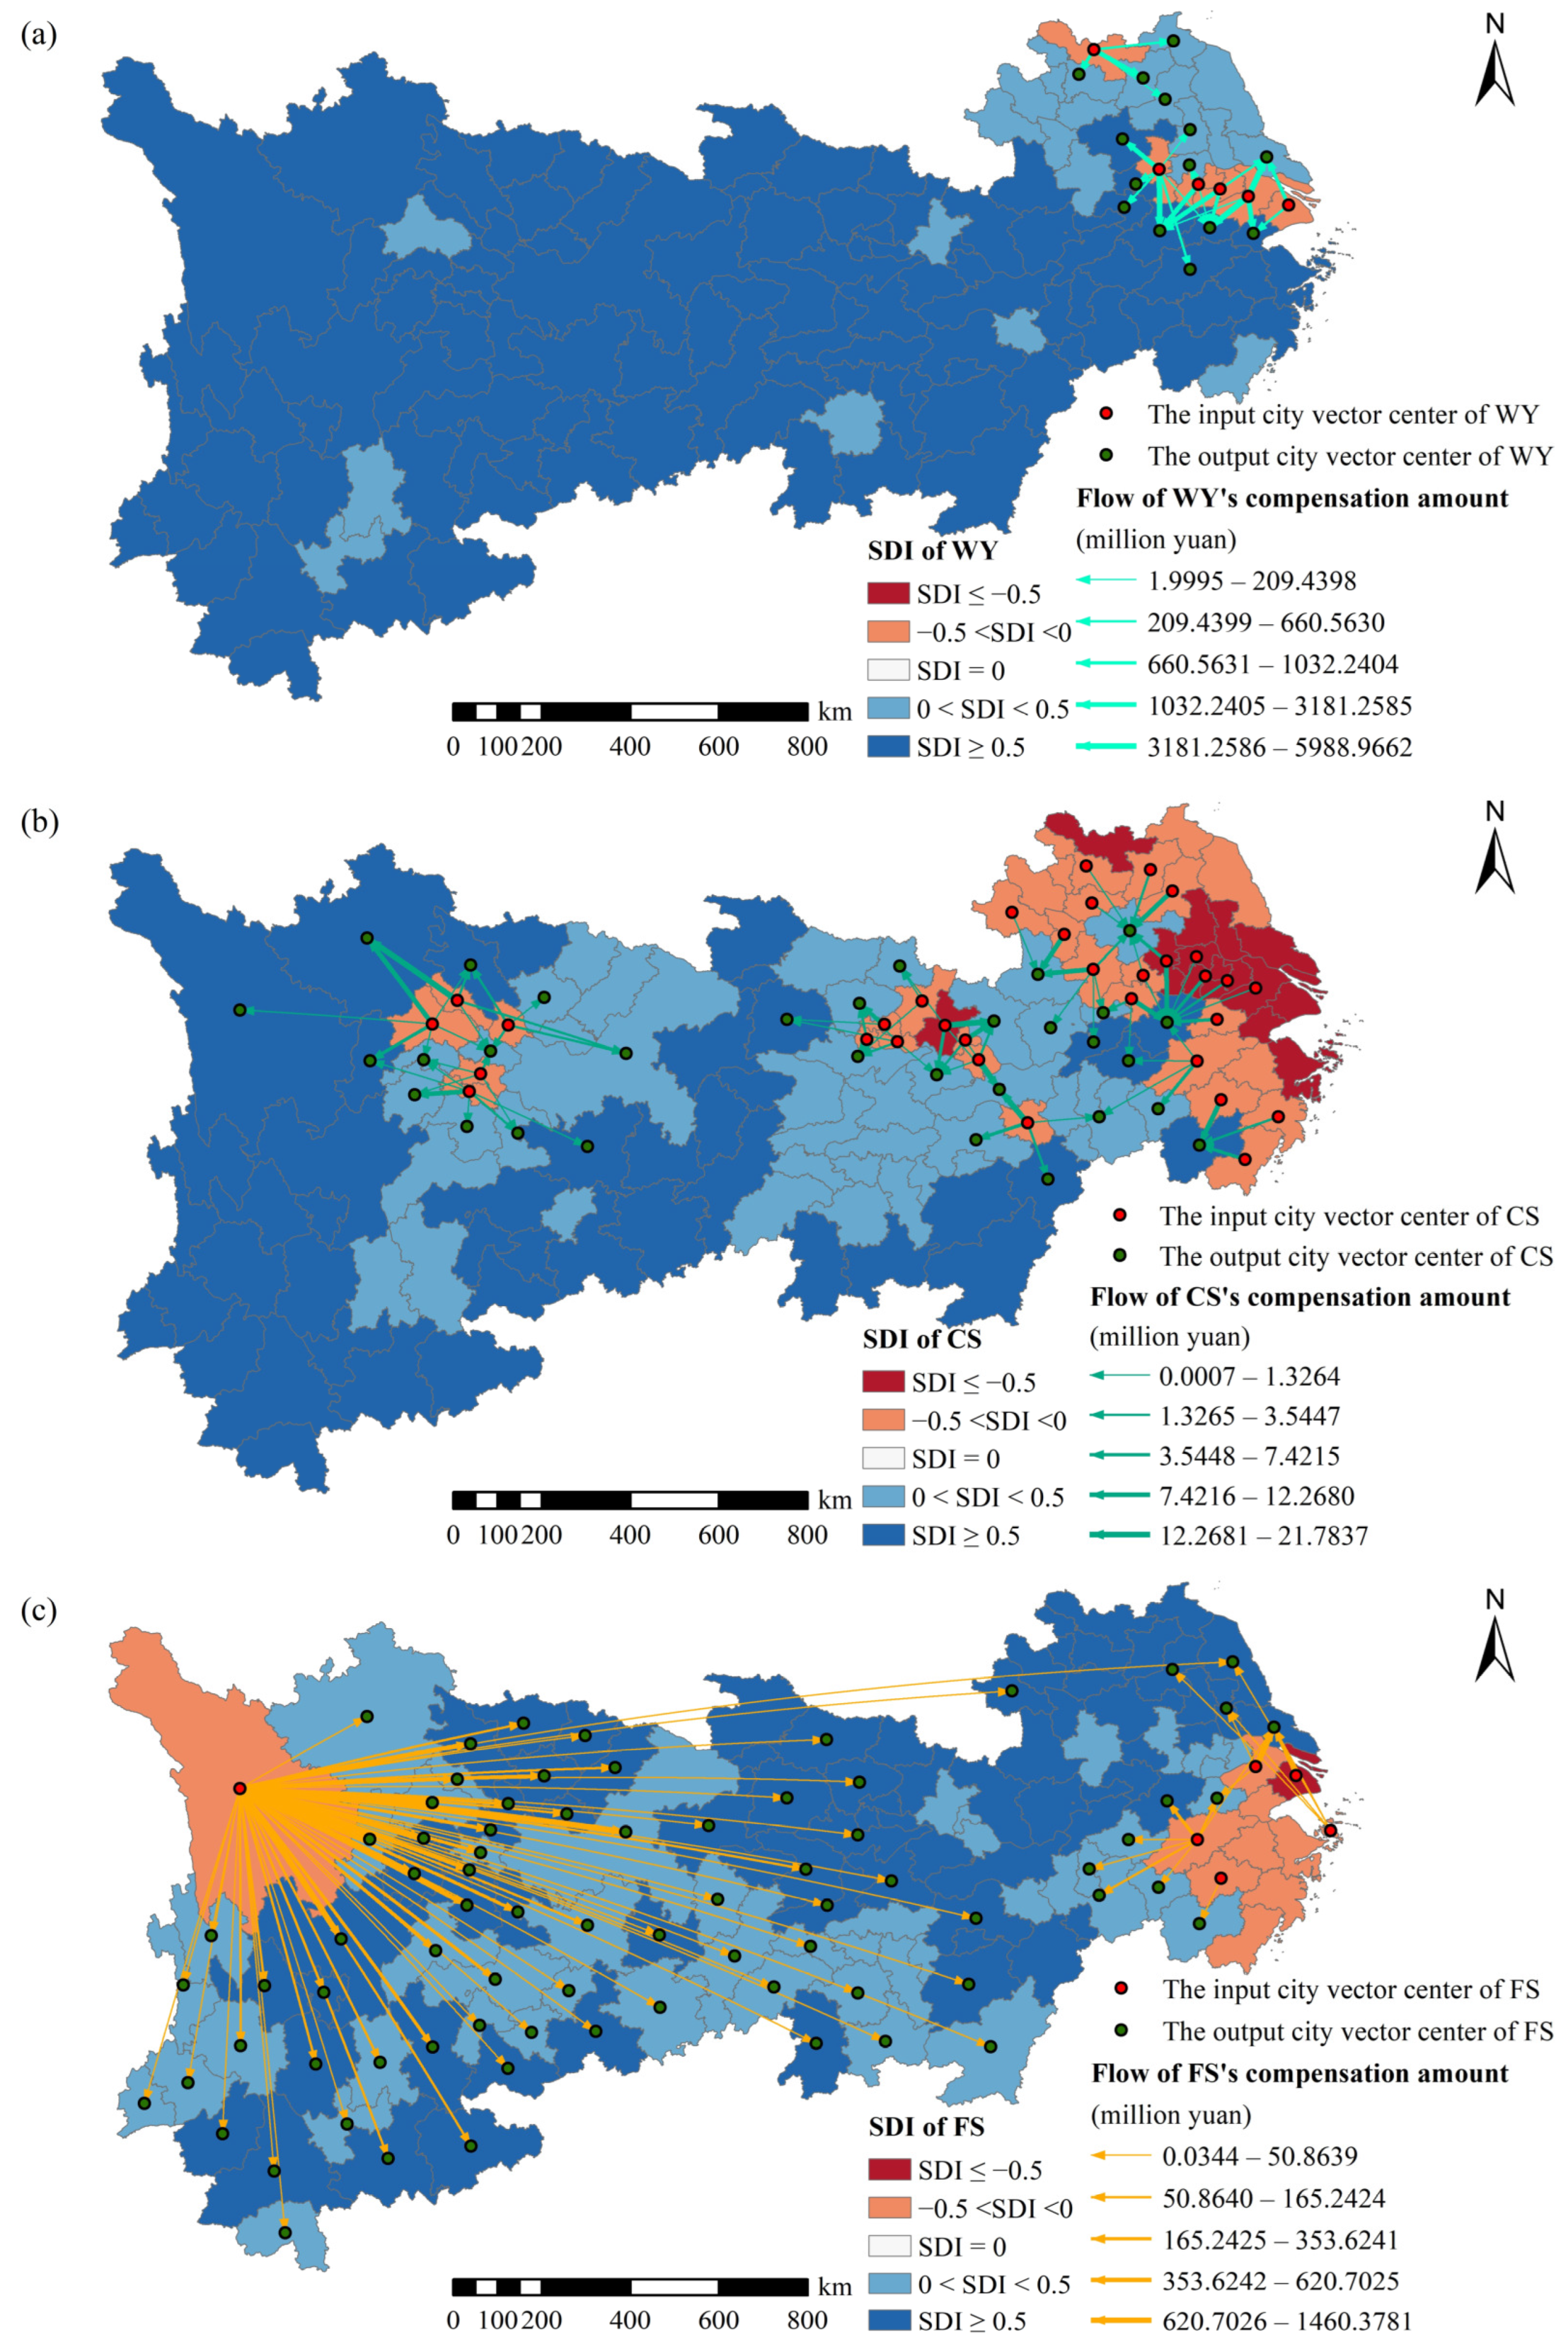
Through systematic investigation, it was found that the average price of water rights trading in the YREB from 2000 to 2020 was 19.81 yuan/m3, the trading price of carbon emission rights was 27.42 yuan/t, and the trading price in the grain market was 2742.58 yuan/t. Based on the “water-energy-food” service flow (WEF-ESF) framework, this study employed the constructed EC model to calculate the payment and acceptance amounts for the three services in each city, conducted statistical analysis, and obtained the EC paths and corresponding amounts between cities (Figure 9). According to the statistical results, the total transaction volumes for WY, CS, and FS services in the YREB region were 34,089.12 million yuan, 300.00 million yuan, and 12,477.23 million yuan, respectively, accounting for 72.74%, 0.64%, and 26.62% of the total ecological compensation transaction volume. The downstream cities mainly conduct ecological compensation transactions based on WY services, while the middle-stream cities mainly focus on CS as the primary ecological compensation transaction project. The upstream cities, on the other hand, mainly rely on FS as their primary ecological compensation transaction project.
Figure 9.
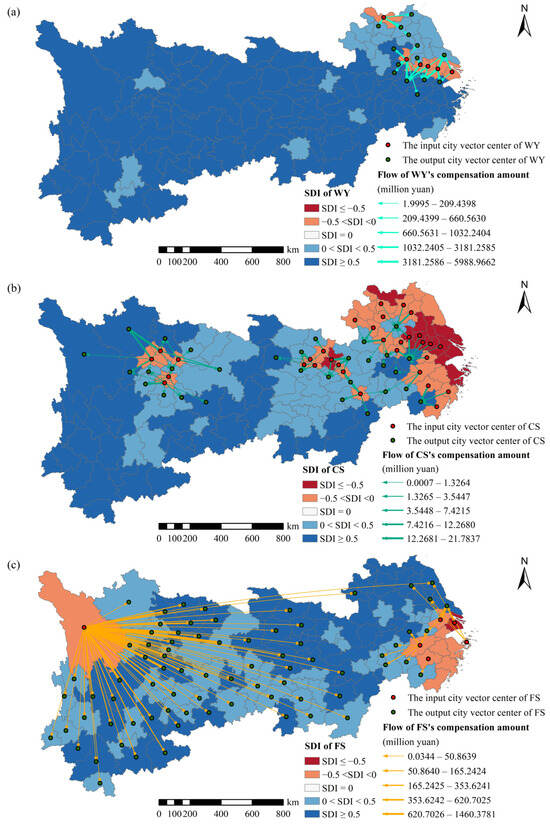
The transfer amount of WY, CS and FS ecological compensation in YREB. (a) The transfer amount of WY ecological compensation; (b) The transfer amount of CS ecological compensation; (c) The transfer amount of FS ecological compensation.
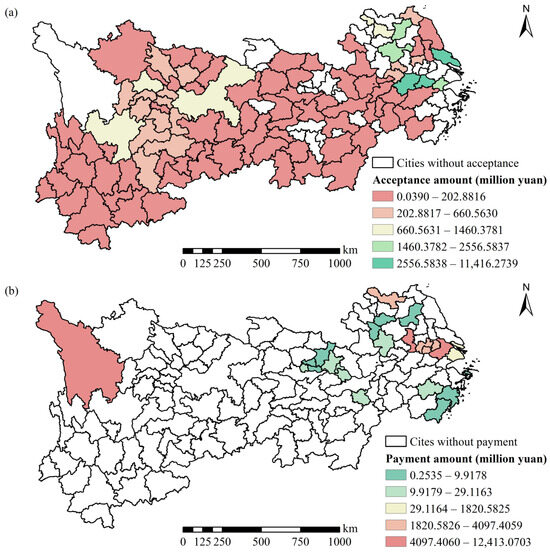
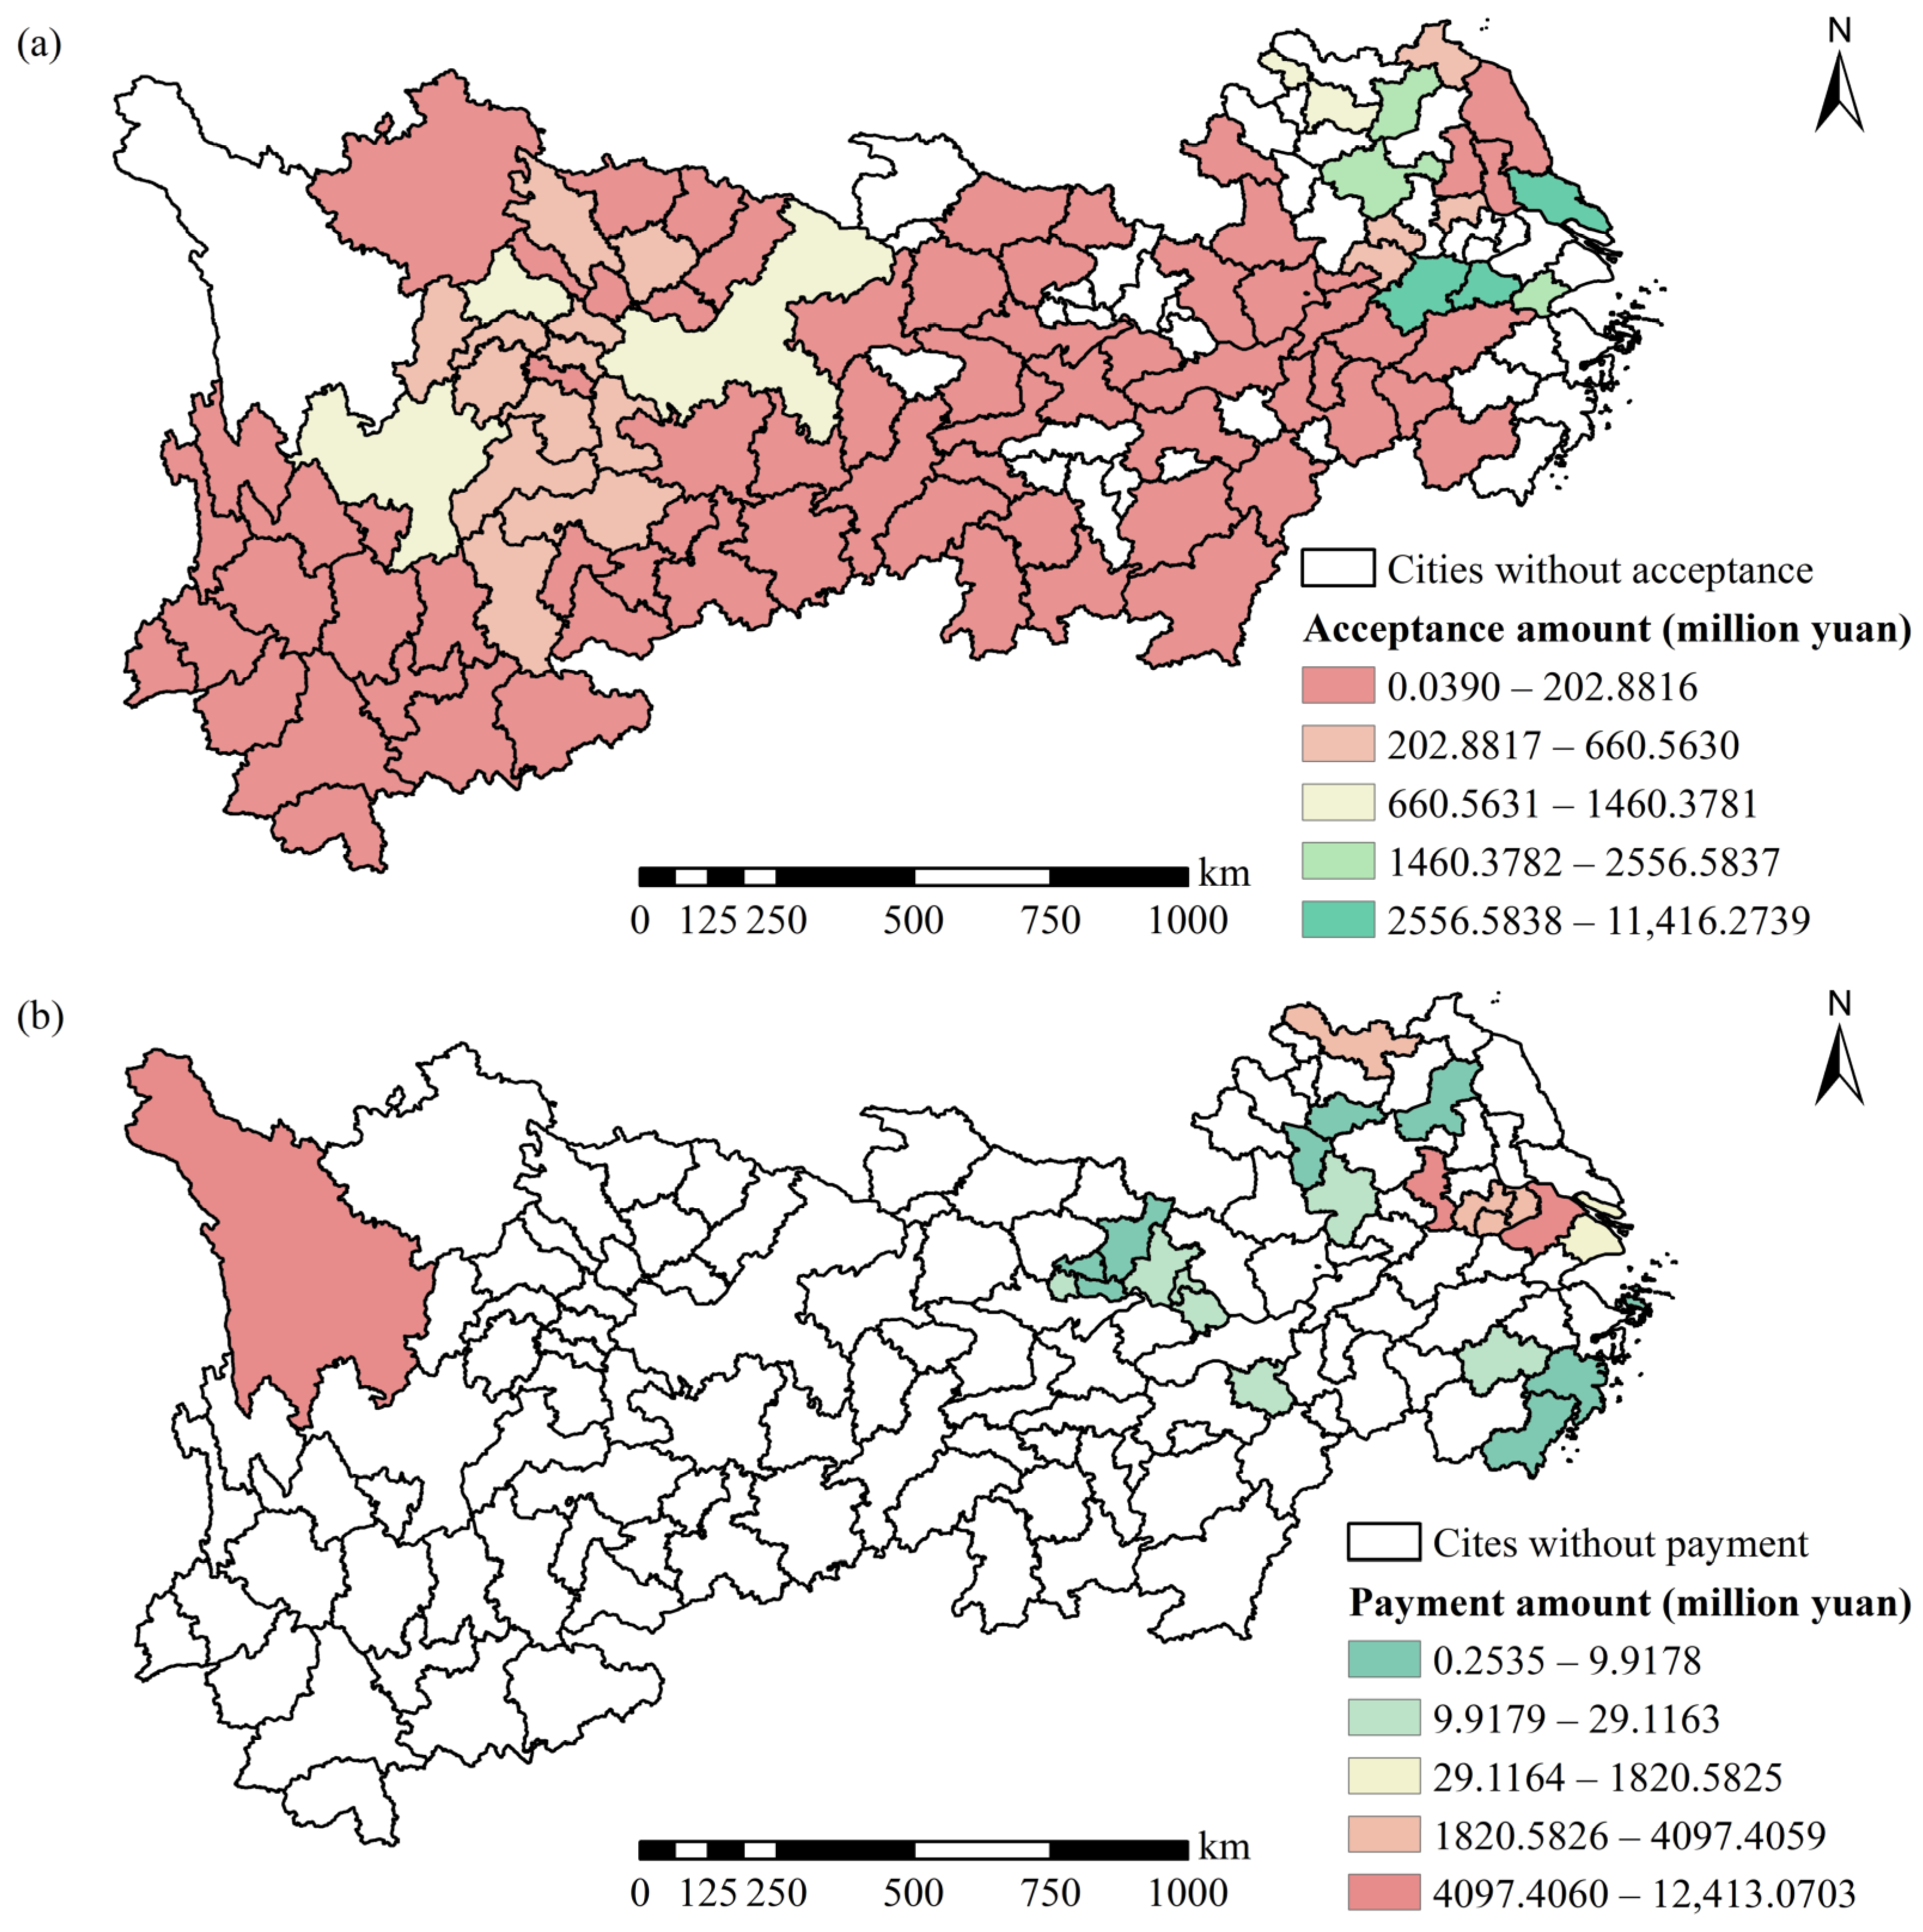
In this study, cities with ecological compensation surpluses were categorized by province. The inter-city transfer volume of EC was quantified (Figures S1–S9), and the total EC volume for each city was calculated (Figure 10). The results indicated that the total transaction volume of YREB ecological compensation amounted to 46,866.35 million yuan. Most cities can export their surplus “water-energy-food” products to deficit cities in exchange for ecological compensation. The distribution pattern of major profitable cities is predominantly clustered around key consumption cities. According to the analysis, Suzhou is the city required to pay the highest amount of ecological compensation, totaling 12,413.07 million yuan. Xuancheng City received the largest amount of ecological compensation, reaching 11,416.27 million yuan.
Figure 10.
The acceptance amount of ecological compensation for each city in the YREB (a). The payment amount of ecological compensation for each city in the YREB (b).
3.4.2. Research on the Driving Mechanism of Ecological Compensation
A total of 15 driving factors were selected for this study. All were statistically analyzed as independent variables based on the ratios of each driving factor between the profit-making cities and deficit cities corresponding to each ecological compensation route. These factors include Precipitation (PRE), Evapotranspiration (ET), Temperature (TEMP), Relative humidity (RH), Nighttime lights (NTL), Elevation (ELEV), Slope (SLP), Population density (PD), Proportion of cultivated land (CROP), Proportion of Urban Construction Land (URB), GDP, NDVI, Proportion of water area (WATER), Proportion of forest area (FORE), and the distance between profit-making cities and deficit cities (DISTANCE).
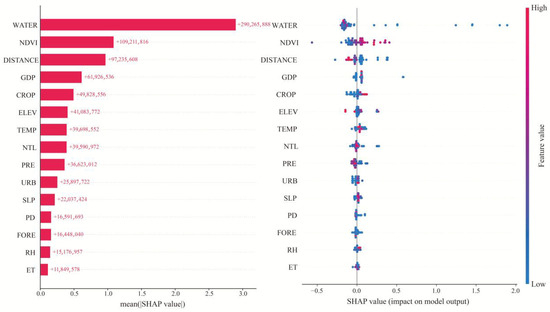
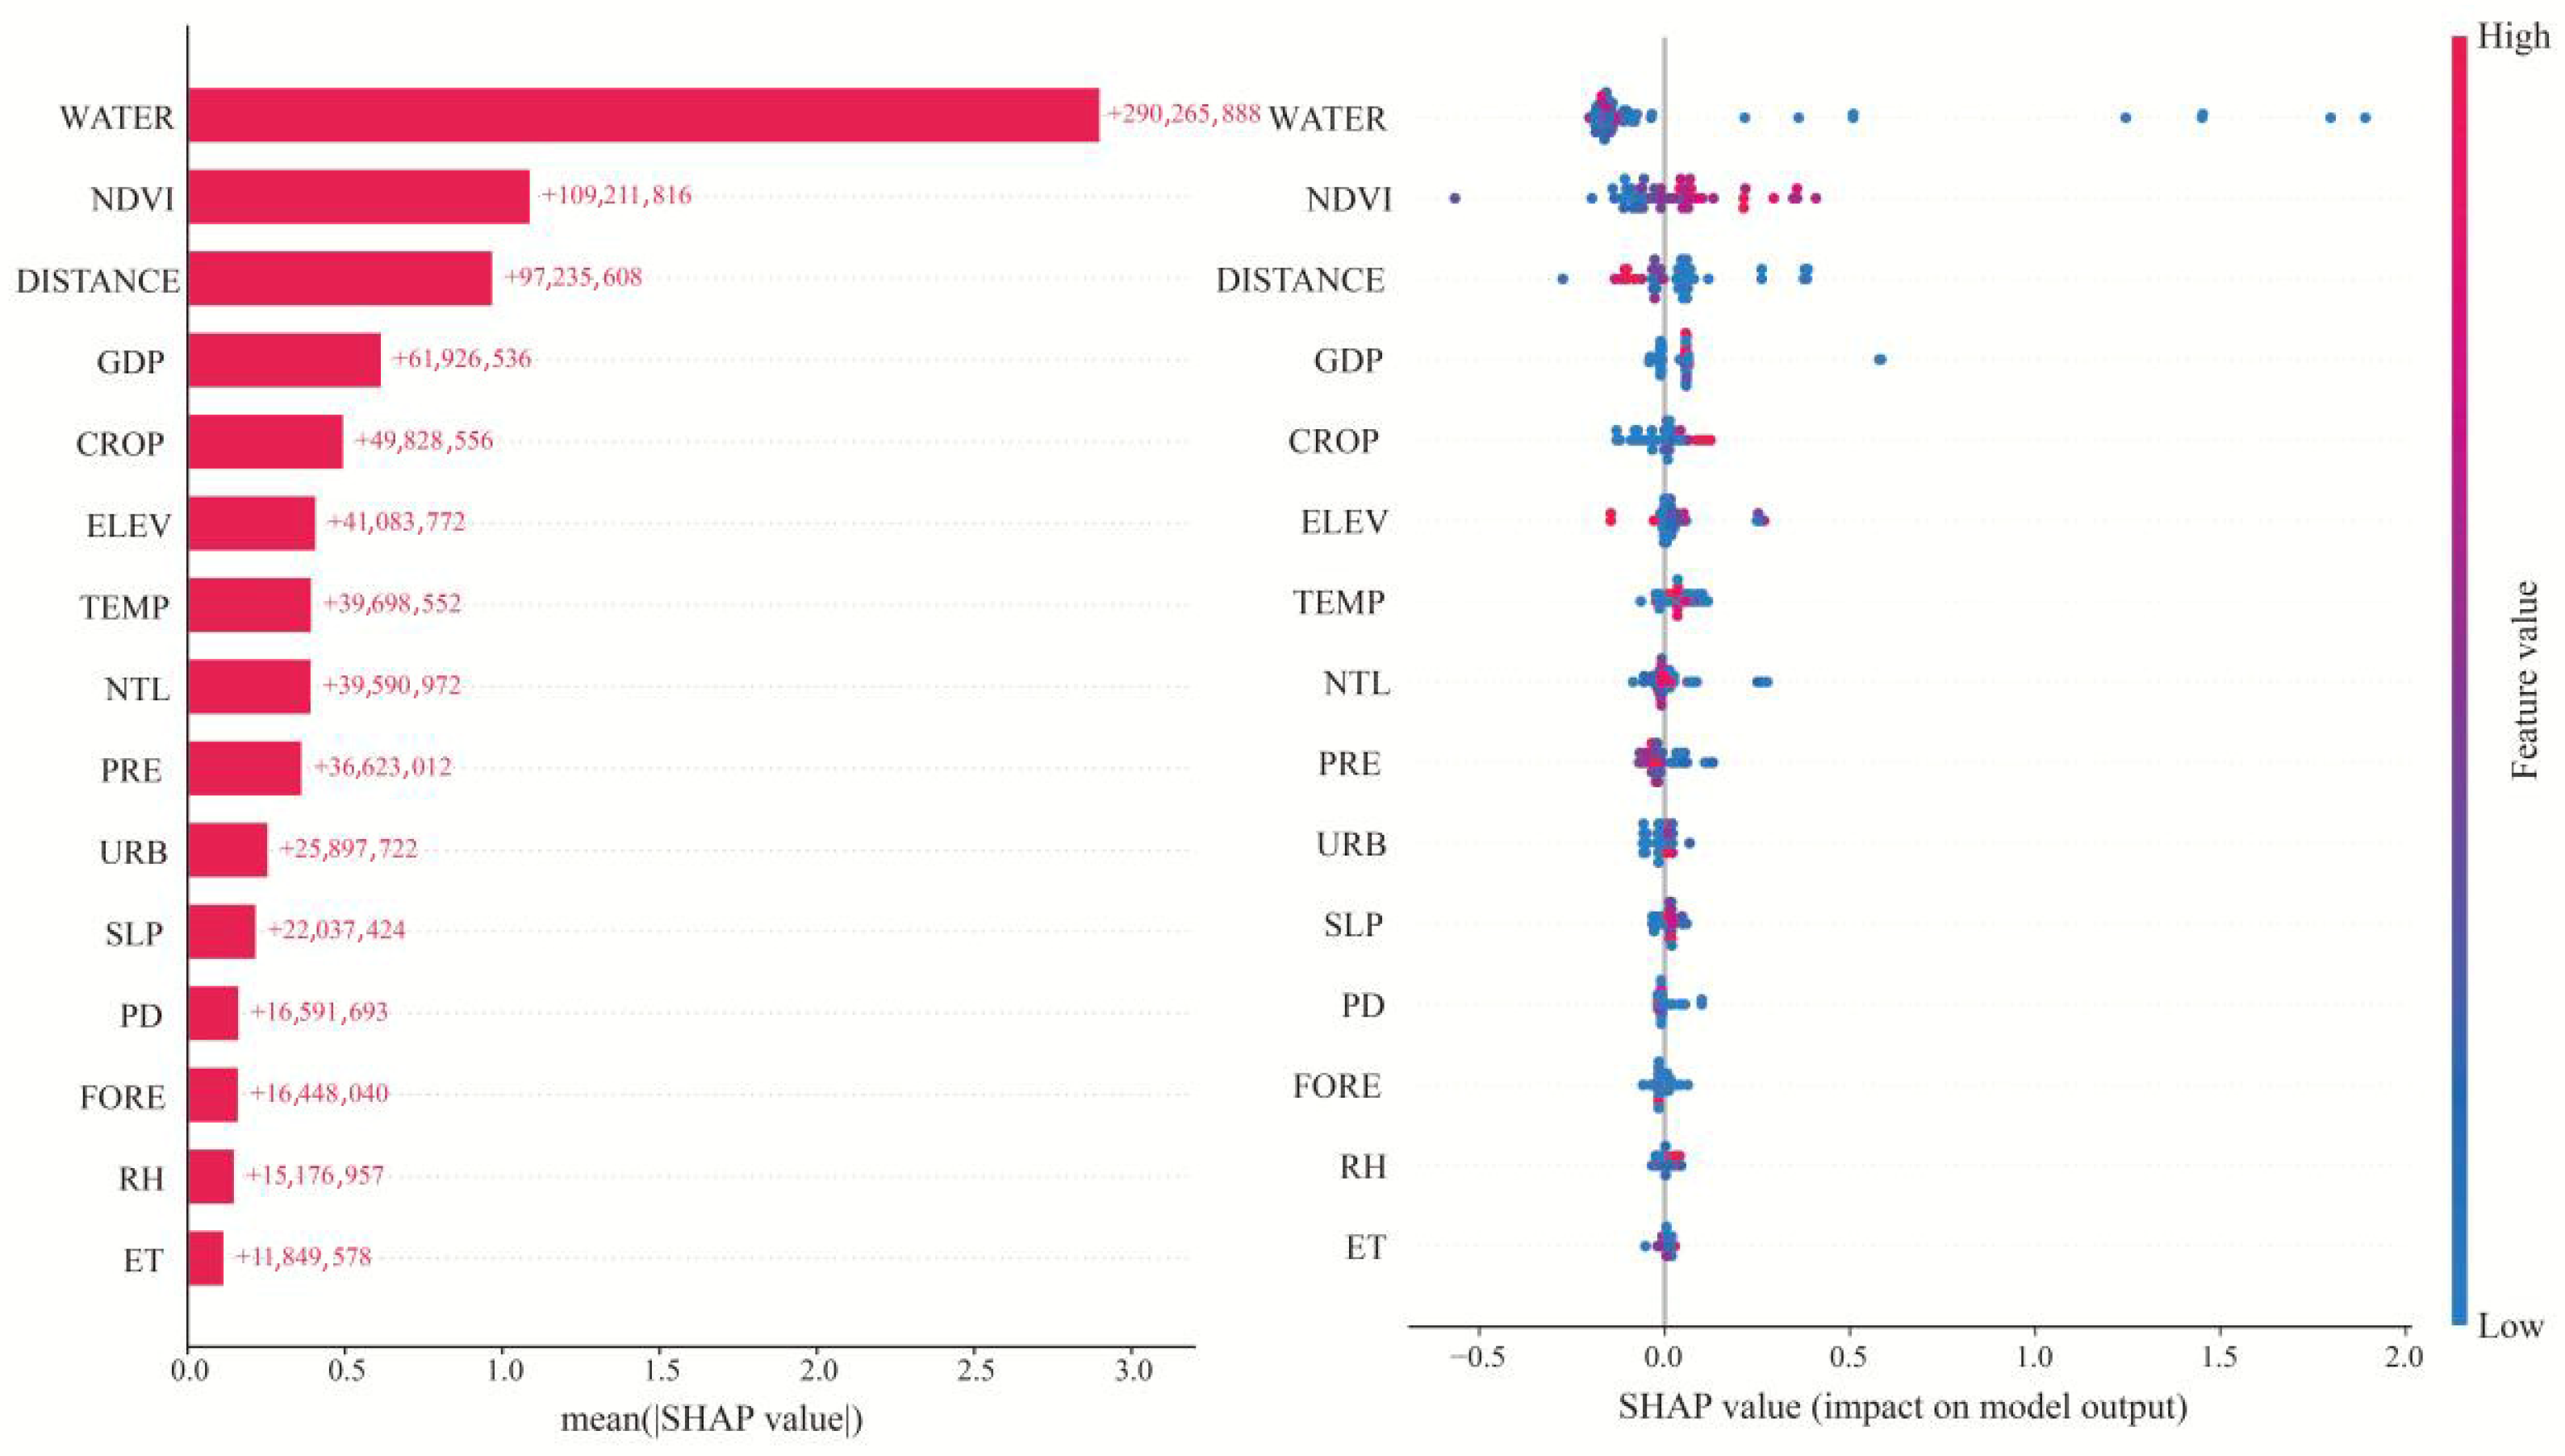
This study assessed the relative importance of each driving factor using the SHAP model (Figure 11). The results indicate that WATER was the most influential variable in determining ecological compensation, followed by NDVI and DISTANCE, respectively. The summary chart illustrates the distribution of the influence of each driving factor on various ESs. The results demonstrate that the ecological compensation pattern is jointly influenced by natural geographical, socioeconomic, and spatial location factors. Among these, WATER directly determines the spatial distribution of water provisioning services. Its high SHAP value underscores the foundational role of water resources in ecological compensation. Aquatic ecosystems not only provide direct water supply but also maintain regional water balance through functions such as runoff regulation and water quality maintenance, thereby establishing water resources as the dominant factor in the calculation of ecological compensation for water provisioning services. NDVI and CROP collectively reflect the fundamental characteristics of grain production. NDVI influences grain output by indicating crop growth conditions, whereas the proportion of cultivated land directly represents the spatial extent of grain production. The synergistic effect of these two factors contributes to the stability of grain supply services, thereby influencing the allocation of ecological compensation based on grain production performance. The significant negative impact of DISTANCE underscores a spatial decay effect, indicating that geographically proximate cities are more likely to establish ecological compensation arrangements.
Figure 11.
The SHAP results of driving factors of ecological compensation.
4. Discussion
4.1. Discussion on the ESSD Matching Mechanism and ESF Response Framework from a WEF-Nexus Perspective
In this study, the SDI was employed to assess the supply–demand interactions of ESs. Overall, the analysis of the WEF-nexus within the YREB revealed that supply–demand mismatches were more pronounced in the downstream region compared to the midstream and upstream regions. This is primarily because the downstream area of the YREB represents one of the most economically developed and dynamic zones in China. Characterized by a dense population and industrial concentration, this region exhibits a high demand for various ESs. However, the advanced level of urbanization has resulted in a reduction in ecological land area, thereby causing a decline in the supply of ecosystem services [54]. From the perspective of natural conditions, factors such as terrain, climate, and geographical location significantly influence the intensity of human activities, including economic development and agricultural cultivation, across different cities [55]. For instance, the downstream region of the YREB features plains in the north and mountains in the south, leading to a pronounced disparity in food supply between the northern and southern areas [56]. Consequently, under the synergistic effects of the natural environment and anthropogenic activities, a general spatial mismatch exists between the supply and demand of ESs [57,58]. It is the mismatching relationship of ESSD that facilitates the generation of ESF. ESF can reduce the degree of mismatch in ESSD and enhance material flow and economic exchange between regions. Consequently, elucidating the scope and flow of ESF from output areas to input areas will contribute to a clearer understanding of the circulation relationships of ecosystem services among regions and assist decision-makers in formulating appropriate management strategies.
To alleviate the pressure caused by ESSD mismatches, it is essential to implement measures on both the supply and demand sides. On the supply side, priority should be given to enhancing service delivery capacities via the establishment of green ecological corridors along rivers. Such an objective can be achieved by promoting soil and water conservation measures in the YREB, as well as implementing programs designed to restore farmland to forest and grassland. Leveraging the YREB’s abundant hydropower, wind, and solar energy resources, clean energy projects will be strategically deployed in the Sichuan–Yunnan hydropower base and the coastal areas of the Yangtze River Delta. These efforts are designed to lessen dependence on fossil fuels, encourage the use of clean energy for vessels traveling along the “golden waterway” of the Yangtze River, lower shipping-related carbon emissions, and support the green transition of the energy structure. In the plains of the middle and lower reaches of the Yangtze River, emphasis will be placed on constructing high-standard farmland, safeguarding permanent basic farmland, and fostering ecological agriculture, all of which contribute to improving cultivated land quality and enhancing food supply efficiency. On the demand side, it is essential to guide the efficient use of resources, strictly adhere to the “three zones and three lines” framework, protect arable land in grain-producing regions, and accelerate the green transition of high-water-consumption and energy-intensive industries in the Chengdu-Chongqing Economic Zone, the urban agglomeration of the middle Yangtze River, and the Yangtze River Delta. Overall, only by integrating the YREB “water-energy-food” ecosystem services into the dynamic regulation of the “nature-economy” complex system can the flow resistance be minimized, its positive impacts be enhanced, and ultimately support the sustainable development of the region.
4.2. Research on Regional EC Driving Mechanism and Policies
Ecological and environmental collaborative governance represents the central challenge for achieving sustainable development in urban agglomerations within the YREB, necessitating the breakthrough of resource flow barriers related to “water-energy-food” through enhanced trans-regional cooperation [59]. Presently, the imbalance between economic growth and ecological conservation poses a significant threat to the ecological security of the YREB. In this context, EC has emerged as a pivotal instrument for reconciling the supply–demand contradictions of “water-energy-food” and fostering green co-governance [60]. At the policy level, China has initially established a three-tier policy framework at the national, provincial and municipal levels: The national level has laid the legal foundation with the “Yangtze River Protection Law” and the “Regulations on Ecological Protection Compensation”; provincial-level cooperation, such as the Yangtze River Delta Eco-Green Integrated Development Demonstration Zone and the cross-regional compensation agreement in the Chishui River Basin, has explored cross-regional coordination mechanisms; and municipal-level practices, such as the pilot project in the Xin’anjiang River Basin, have formed models such as fiscal transfer and water quality assessment. The WEF-EFS-oriented EC model proposed in this paper offers a novel approach for ecological co-construction and sharing within the YREB by quantifying service flows and cross-regional responsibilities. This study elucidates the precise amounts of EC payments and compensations for each province and city, which holds significant implications for overcoming the “East-West gradient development trap” and achieving collaborative governance of the basin. Empirical findings indicate that the regional EC mechanism based on service flow can directly enhance the ecological environment, promote the supply of clean energy, secure food production capacity, and ultimately contribute to regional human well-being [61,62]. This study identified key driving factors such as the proportion of water area, vegetation coverage, distance between cities, GDP, and the proportion of cultivated land. Based on these findings, it is suggested that future policies could be optimized in multiple directions in a coordinated manner: incorporate the ecological contribution of water area into the implementation rules of the Yangtze River Protection Law, and establish a differentiated “water resource compensation coefficient”; at the same time, based on the collaborative driving mechanism of carbon sink services, add a “carbon sink increment compensation” module to the provincial carbon sink trading system; in response to the attenuation effect of spatial distance, provide targeted fiscal incentives for ecological compensation projects between neighboring cities within a straight-line distance of 200 km to reduce geographical resistance; in economically developed areas, implement an “ecological compensation performance evaluation” mechanism to further leverage the positive driving effect of GDP levels; in addition, given the critical impact of the proportion of cultivated land on food supply services, raise the ecological compensation standards in major grain-producing areas, and the related funds can come from a special compensation fund established by major grain-consuming areas downstream, thereby establishing a multi-level, differentiated, and operational policy system for ecological compensation in the basin. Meanwhile, it is suggested that a “Yangtze River Economic Belt Ecological Compensation Committee” be established to integrate the WEF-ESF model and build a unified accounting platform. Through these policy innovations, it is expected that the “water-energy-food” service flows can be transformed into systematic economic incentives, ultimately achieving a new pattern of good governance in the basin where “protectors benefit and beneficiaries compensate”.
4.3. Research Limitations and Prospects
The ESFs in this study are realized without considering the influence of carrier, supply mode, or transportation conditions. They only determine the material exchange and ecological compensation amounts between the supply and demand sides under ideal conditions, without fully accounting for the impact of environmental factors such as terrain, wind direction, water flow, and land use on the ES flow path. Consequently, the spatial value transfer parameters selected for flow calculation are subjective and empirical in nature. Moreover, the remote sensing and statistical data relied on in this study have differences in spatial resolution and statistical caliber, which may affect the accuracy of ESF calculation. In addition, the EC system developed in this study primarily focused on ecological quality, economic conditions, and residents’ willingness to pay in the demand city, but did not comprehensively account for the management approaches and attitudes toward surplus ecological products in the supply city. Therefore, future research should further integrate high-resolution remote sensing data, high-precision environmental data and social survey data to build an integrated service flow observation and verification system, improve the spatio-temporal accuracy of flow estimation, and conduct in-depth discussions from multiple dimensions such as the flow path, flow volume, gain and loss of ecosystem service flows, as well as the interaction between different types of ecosystem service flows, in order to reveal the transfer laws of ecosystem service flows among regions. When investigating the ecological compensation mechanism, future studies could incorporate multifaceted considerations from both supply and demand sides and design appropriate compensation frameworks tailored to specific transactional objects. Furthermore, compensation mechanisms should not be confined to government involvement but should also actively encourage participation from social capital and explore diversified compensation strategies. Through the above-mentioned deepening work, it is expected to form a more scientific, more operational and more inclusive basin ecological governance plan, providing systematic decision-making support for the sustainable development of the Yangtze River Economic Belt and other basins around the world.
5. Conclusions
This study develops an EC model by considering the material quality of ESs from the perspective of the WEF-ESF. This model provides a scientific foundation for formulating ecological compensation policies among cities within the YREB. Below are the primary findings of this study:
- (1)
- From the year 2000 to 2020, the “water-energy-food” nexus within the YREB exhibited significant spatio-temporal variations in supply and demand dynamics, as well as notable trade-offs and synergies among the services. On the supply side, WY and FS demonstrated an increasing trend, whereas CS exhibited a decreasing trend. A synergistic relationship was observed between WY-CS and WY-FS, while a trade-off effect was identified between CS-FS. In terms of demand, all three services showed an upward trajectory, with a clear synergy among them.
- (2)
- From the year 2000 to 2020, the “water-energy-food” ESSD in the YREB exhibited a significant mismatch. From a spatial distribution perspective, this phenomenon was particularly pronounced in the Yangtze River Delta region and urban agglomerations centered around certain provincial capitals. These areas are characterized by high levels of urbanization and population density, where intensive economic development has resulted in the degradation of ecological functions. The imbalance in ESSD has consequently given rise to ESFs. Specifically, the three services—WY, CS, and FS—generated 23, 78, and 82 ESFs, respectively, covering a total of 117 cities. However, 13 cities with CS demand and 5 cities with FS demand were not adequately compensated by corresponding services from other supplying cities.
- (3)
- From the year 2000 to 2020, The average annual ecological compensation transaction volume in the YREB is approximately 46,866.35 million yuan. Specifically, WY, CS, and FS services constituted 72.74%, 0.64%, and 26.62% of the total transaction volume for ecological compensation, respectively. Most cities were able to export their surplus “water-energy-food” products to cities with deficits, thereby obtaining ecological compensation. The most significant driver of ecological compensation is the proportion of water area, followed by NDVI and the distance between cities with surplus and deficit ecological resources.
Future research can be deepened in the following aspects: First, refine the spatial transfer parameters and attenuation coefficients, and conduct localized calibration in combination with different service types and the properties of the flowing medium; second, incorporate the preferences and willingness to pay off stakeholders, and construct a differentiated compensation weighting scheme that reflects social weights; third, extend this framework to different climate scenarios and development paths, and evaluate the adaptability and robustness of the ecological compensation mechanism in a changing environment.
Supplementary Materials
The following supporting information can be downloaded at https://www.mdpi.com/article/10.3390/su18020839/s1. Table S1. WY radiation range, radiation intensity and transfer amount between cities. Table S2. CS radiation range, radiation intensity and transfer amount between cities. Table S3. FS radiation range, radiation intensity and transfer amount between cities. Figure S1. Amount of EC imported into Profit cities in Anhui Province. Figure S2. Amount of EC imported into Profit cities in Hubei Province. Figure S3. Amount of EC imported into Profit cities in Hunan Province. Figure S4. Amount of EC imported into Profit cities in Jiangsu Province. Figure S5. Amount of EC imported into Profit cities in Jiangxi Province. Figure S6. Amount of EC imported into Profit cities in Sichuan Province. Figure S7. Amount of EC imported into Profit cities in Yunnan Province. Figure S8. Amount of EC imported into Profit cities in Zhejiang Province. Figure S9. Amount of EC imported into Profit cities in Guizhou Province.
Author Contributions
Conceptualization, H.W. and B.D.; Methodology, H.W., J.Q., W.Z., P.Z., R.Z., Y.H., Y.C. and B.D.; Investigation, H.W.; Data curation, H.W., J.Q., W.Z., P.Z., R.Z., Y.H. and Y.C.; Writing—original draft, H.W.; Writing—review & editing, J.Q., W.Z., P.Z., R.Z., Y.H., Y.C. and B.D.; Visualization, H.W.; Project administration, H.W. and B.D.; Funding acquisition, B.D. All authors have read and agreed to the published version of the manuscript.
Funding
This research was funded by [National Natural Science Foundation of China] grant number [32071600] and [41571101]. The APC was funded by [41571101].
Institutional Review Board Statement
Not applicable.
Informed Consent Statement
Not applicable.
Data Availability Statement
The original contributions presented in this study are included in the article/Supplementary Materials. Further inquiries can be directed to the corresponding author.
Conflicts of Interest
The authors declare no conflicts of interest.
Abbreviations
| ESs | Ecosystem services |
| WY | Water yield |
| CS | Carbon storage |
| FS | Food supply |
| WEF-Nexus | Water-energy-food nexus |
| ESF | Ecosystem service flows |
| EC | Ecological compensation |
| ESSD | Ecosystem service supply and demand |
| YREB | Yangtze River Economic Belt |
| SDI | Supply-Demand Index |
| WEF-ESF | “water-energy-food” ecosystem service flow |
References
- Srivathsa, A.; Vasudev, D.; Nair, T.; Chakrabarti, S.; Chanchani, P.; DeFries, R.; Deomurari, A.; Dutta, S.; Ghose, D.; Goswami, V.R. Prioritizing India’s landscapes for biodiversity, ecosystem services and human well-being. Nat. Sustain. 2023, 6, 568–577. [Google Scholar] [CrossRef] [Scilit]
- Costanza, R.; De Groot, R.; Braat, L.; Kubiszewski, I.; Fioramonti, L.; Sutton, P.; Farber, S.; Grasso, M. Twenty years of ecosystem services: How far have we come and how far do we still need to go? Ecosyst. Serv. 2017, 28, 1–16. [Google Scholar] [CrossRef] [Scilit]
- Ding, T.; Chen, J.; Fang, L.; Ji, J.; Fang, Z. Urban ecosystem services supply-demand assessment from the perspective of the water-energy-food nexus. Sustain. Cities Soc. 2023, 90, 104401. [Google Scholar] [CrossRef] [Scilit]
- Han, D.; Yu, D.; Cao, Q. Assessment on the features of coupling interaction of the food-energy-water nexus in China. J. Clean. Prod. 2020, 249, 119379. [Google Scholar] [CrossRef] [Scilit]
- Li, S.; Xiao, W.; Zhao, Y.; Lv, X. Incorporating ecological risk index in the multi-process MCRE model to optimize the ecological security pattern in a semi-arid area with intensive coal mining: A case study in northern China. J. Clean. Prod. 2020, 247, 119143. [Google Scholar] [CrossRef] [Scilit]
- Ouyang, X.; Tang, L.; Wei, X.; Li, Y. Spatial interaction between urbanization and ecosystem services in Chinese urban agglomerations. Land Use Policy 2021, 109, 105587. [Google Scholar] [CrossRef] [Scilit]
- Tye, M.R.; Wilhelmi, O.V.; Pierce, A.L.; Sharma, S.; Nichersu, I.; Wróblewski, M.; Goszczyński, W.; Wendel, J.; Laborgne, P.; Heyder, M. The food water energy nexus in an urban context: Connecting theory and practice for nexus governance. Earth Syst. Gov. 2022, 12, 100143. [Google Scholar] [CrossRef] [Scilit]
- Hou, W.; Hu, T.; Yang, L.; Liu, X.; Zheng, X.; Pan, H.; Zhang, X.; Xiao, S.; Deng, S. Matching ecosystem services supply and demand in China’s urban agglomerations for multiple-scale management. J. Clean. Prod. 2023, 420, 138351. [Google Scholar] [CrossRef] [Scilit]
- Wu, C.; Lu, R.; Zhang, P.; Dai, E. Multilevel ecological compensation policy design based on ecosystem service flow: A case study of carbon sequestration services in the Qinghai-Tibet Plateau. Sci. Total Environ. 2024, 921, 171093. [Google Scholar] [CrossRef] [Scilit]
- Du, H.; Zhao, L.; Zhang, P.; Li, J.; Yu, S. Ecological compensation in the Beijing-Tianjin-Hebei region based on ecosystem services flow. J. Environ. Manag. 2023, 331, 117230. [Google Scholar] [CrossRef] [Scilit]
- Schirpke, U.; Candiago, S.; Vigl, L.E.; Jäger, H.; Labadini, A.; Marsoner, T.; Meisch, C.; Tasser, E.; Tappeiner, U. Integrating supply, flow and demand to enhance the understanding of interactions among multiple ecosystem services. Sci. Total Environ. 2019, 651, 928–941. [Google Scholar] [CrossRef] [Scilit] [PubMed]
- Wang, C.; Li, W.; Sun, M.; Wang, Y.; Wang, S. Exploring the formulation of ecological management policies by quantifying interregional primary ecosystem service flows in Yangtze River Delta region, China. J. Environ. Manag. 2021, 284, 112042. [Google Scholar] [CrossRef] [Scilit] [PubMed]
- Zhang, J.; He, C.; Huang, Q.; Li, L. Understanding ecosystem service flows through the metacoupling framework. Ecol. Indic. 2023, 151, 110303. [Google Scholar] [CrossRef] [Scilit]
- Xu, Q.; Yang, R.; Zhuang, D.; Lu, Z. Spatial gradient differences of ecosystem services supply and demand in the Pearl River Delta region. J. Clean. Prod. 2021, 279, 123849. [Google Scholar] [CrossRef] [Scilit]
- Dang, H.; Li, J. Supply-demand relationship and spatial flow of urban cultural ecosystem services: The case of Shenzhen, China. J. Clean. Prod. 2023, 423, 138765. [Google Scholar] [CrossRef] [Scilit]
- Zhai, T.; Wang, J.; Fang, Y.; Huang, L.; Liu, J.; Zhao, C. Integrating ecosystem services supply, demand and flow in ecological compensation: A case study of carbon sequestration services. Sustainability 2021, 13, 1668. [Google Scholar] [CrossRef] [Scilit]
- Wunder, S. Revisiting the concept of payments for environmental services. Ecol. Econ. 2015, 117, 234–243. [Google Scholar] [CrossRef] [Scilit]
- Claassen, R.; Cattaneo, A.; Johansson, R. Cost-effective design of agri-environmental payment programs: US experience in theory and practice. Ecol. Econ. 2008, 65, 737–752. [Google Scholar] [CrossRef] [Scilit]
- Yin, X.; Liu, Y.; Yang, Z.; Zhao, Y.; Cai, Y.; Sun, T.; Yang, W. Eco-compensation standards for sustaining high flow events below hydropower plants. J. Clean. Prod. 2018, 182, 1–7. [Google Scholar] [CrossRef] [Scilit]
- Tracy, E.F.; Shvarts, E.; Simonov, E.; Babenko, M. China’s new Eurasian ambitions: The environmental risks of the Silk Road Economic Belt. Eurasian Geogr. Econ. 2017, 58, 56–88. [Google Scholar] [CrossRef] [Scilit]
- Xu, H.; Tao, X.; Lu, Y.; Wang, Y.; Li, H.; Ye, Z. Spatial variation of land use carbon budget and zoning for carbon compensation in the Huai River Eco-economic Belt, China. Sci. Rep. 2025, 15, 3266. [Google Scholar] [CrossRef] [Scilit] [PubMed]
- Lu, H.; Zhao, X. Investigating the horizontal carbon ecological compensation mechanism in the Yellow River Basin: Construction, validation, and policy impact. Front. Environ. Sci. 2025, 13, 1511882. [Google Scholar] [CrossRef] [Scilit]
- Farley, J.; Costanza, R. Payments for ecosystem services: From local to global. Ecol. Econ. 2010, 69, 2060–2068. [Google Scholar] [CrossRef] [Scilit]
- Pascual, U.; Phelps, J.; Garmendia, E.; Brown, K.; Corbera, E.; Martin, A.; Gomez-Baggethun, E.; Muradian, R. Social equity matters in payments for ecosystem services. Bioscience 2014, 64, 1027–1036. [Google Scholar] [CrossRef] [Scilit]
- Garau, E.; Pueyo-Ros, J.; Palom, A.R.; Vila-Subiros, J. Follow the flow: Analysis of relationships between water ecosystem service supply units and beneficiaries. Appl. Geogr. 2021, 133, 102491. [Google Scholar] [CrossRef] [Scilit]
- Zhao, X.Y.; Ma, P.Y.; Li, W.Q.; Du, Y.X. Spatiotemporal changes of supply and demand relationships of ecosystem services in the Loess Plateau. Acta Geogr. Sin. 2021, 76, 2780–2796. [Google Scholar] [CrossRef]
- Jiang, Y.; Guan, D.; He, X.; Yin, B.; Zhou, L.; Sun, L.; Huang, D.; Li, Z.; Zhang, Y. Quantification of the coupling relationship between ecological compensation and ecosystem services in the Yangtze River Economic Belt, China. Land Use Policy 2022, 114, 105995. [Google Scholar] [CrossRef] [Scilit]
- Bian, H.; Zhao, Y.; Gao, J.; Wen, S.; Sun, J. Sustainability under policy transitions in the Yangtze River Economic Belt, China: Historical and the shared socio-economic pathways. Habitat Int. 2024, 148, 103091. [Google Scholar] [CrossRef] [Scilit]
- Pan, Y.; Teng, T.; Wang, S.; Wang, T. Impact and mechanism of urbanization on urban green development in the Yangtze River Economic Belt. Ecol. Indic. 2024, 158, 111612. [Google Scholar] [CrossRef] [Scilit]
- Xu, X.; Liu, J.; Zhang, Y. China Multi Period Land Use and Land Cover Remote Sensing Monitoring Data Set (CNLUCC); Resource and Environment Data Center: Beijing, China, 2018. [Google Scholar] [CrossRef]
- Xu, X. China’s GDP Spatial Distribution Kilometer Grid Dataset; Resources and Environmental Science and Data Center: Beijing, China, 2017. [Google Scholar] [CrossRef]
- Xu, X. China’s Annual NDVI and EVI 250 m Dataset; Resources and Environmental Science and Data Center: Beijing, China, 2024. [Google Scholar] [CrossRef]
- Yuan, Y.; Bai, Z.; Zhang, J.; Huang, Y. Investigating the trade-offs between the supply and demand for ecosystem services for regional spatial management. J. Environ. Manag. 2023, 325, 116591. [Google Scholar] [CrossRef] [Scilit]
- Sharp, R.; Tallis, H.T.; Ricketts, T.; Guerry, A.D.; Wood, S.A.; Chaplin-Kramer, R.; Nelson, E.; Ennaanay, D.; Wolny, S.; Olwero, N. InVEST User’s Guide; The Natural Capital Project; The Natural Capital: Stanford, CA, USA, 2014. [Google Scholar] [CrossRef]
- Xiang, H.; Zhang, J.; Mao, D.; Wang, Z.; Qiu, Z.; Yan, H. Identifying spatial similarities and mismatches between supply and demand of ecosystem services for sustainable Northeast China. Ecol. Indic. 2022, 134, 108501. [Google Scholar] [CrossRef] [Scilit]
- Chen, Y.; Qiao, X.; Yang, Y.; Zheng, J.; Dai, Y.; Zhang, J. Identifying the spatial relationships and drivers of ecosystem service supply–demand matching: A case of Yiluo River Basin. Ecol. Indic. 2024, 163, 112122. [Google Scholar] [CrossRef] [Scilit]
- Cui, F.; Tang, H.; Zhang, Q.; Wang, B.; Dai, L. Integrating ecosystem services supply and demand into optimized management at different scales: A case study in Hulunbuir, China. Ecosyst. Serv. 2019, 39, 100984. [Google Scholar] [CrossRef] [Scilit]
- Li, K.; Hou, Y.; Andersen, P.S.; Xin, R.; Rong, Y.; Skov-Petersen, H. An ecological perspective for understanding regional integration based on ecosystem service budgets, bundles, and flows: A case study of the Jinan metropolitan area in China. J. Environ. Manag. 2022, 305, 114371. [Google Scholar] [CrossRef] [Scilit] [PubMed]
- Zhang, P.; Zhang, L.; Chang, Y.; Xu, M.; Hao, Y.; Liang, S.; Liu, G.; Yang, Z.; Wang, C. Food-energy-water (FEW) nexus for urban sustainability: A comprehensive review. Resour. Conserv. Recycl. 2019, 142, 215–224. [Google Scholar] [CrossRef] [Scilit]
- Wu, J.; Fan, X.; Li, K.; Wu, Y. Assessment of ecosystem service flow and optimization of spatial pattern of supply and demand matching in Pearl River Delta, China. Ecol. Indic. 2023, 153, 110452. [Google Scholar] [CrossRef] [Scilit]
- Liu, W.; Zhan, J.; Zhao, F.; Zhang, F.; Teng, Y.; Wang, C.; Chu, X.; Kumi, M.A. The tradeoffs between food supply and demand from the perspective of ecosystem service flows: A case study in the Pearl River Delta, China. J. Environ. Manag. 2022, 301, 113814. [Google Scholar] [CrossRef] [Scilit]
- Li, J.; Bai, Y.; Alatalo, J.M. Impacts of rural tourism-driven land use change on ecosystems services provision in Erhai Lake Basin, China. Ecosyst. Serv. 2020, 42, 101081. [Google Scholar] [CrossRef] [Scilit]
- Boithias, L.; Acuña, V.; Vergoñós, L.; Ziv, G.; Marcé, R.; Sabater, S. Assessment of the water supply:demand ratios in a Mediterranean basin under different global change scenarios and mitigation alternatives. Sci. Total Environ. 2014, 470–471, 567–577. [Google Scholar] [CrossRef] [Scilit]
- Yang, S.; Bai, Y.; Alatalo, J.M.; Wang, H.; Jiang, B.; Liu, G.; Chen, J. Spatio-temporal changes in water-related ecosystem services provision and trade-offs with food production. J. Clean. Prod. 2021, 286, 125316. [Google Scholar] [CrossRef] [Scilit]
- Wu, J.; Feng, Z.; Zhang, X.; Xu, Y.; Peng, J. Delineating urban hinterland boundaries in the Pearl River Delta: An approach integrating toponym co-occurrence with field strength model. Cities 2020, 96, 102457. [Google Scholar] [CrossRef] [Scilit]
- Tan, F.; Lu, Z. Regional sustainability system as ecosystem: Case study of China’s two leading economic circles from a keystone perspective. Environ. Dev. Sustain. 2019, 21, 961–983. [Google Scholar] [CrossRef] [Scilit]
- Wu, J.; Huang, Y.; Jiang, W. Spatial matching and value transfer assessment of ecosystem services supply and demand in urban agglomerations: A case study of the Guangdong-Hong Kong-Macao Greater Bay area in China. J. Clean. Prod. 2022, 375, 134081. [Google Scholar] [CrossRef] [Scilit]
- Liu, M.; Fan, J.; Wang, Y.; Hu, C. Study on ecosystem service value (ESV) spatial transfer in the central plains urban agglomeration in the Yellow River Basin, China. Int. J. Environ. Res. Public Health 2021, 18, 9751. [Google Scholar] [CrossRef] [Scilit] [PubMed]
- Chen, X.; Wu, L.; Shan, L.; Zang, Q. Main factors affecting post-harvest grain loss during the sales process: A survey in nine provinces of China. Sustainability 2018, 10, 661. [Google Scholar] [CrossRef] [Scilit]
- Zhang, J.; Zou, J.; Zhang, K. A comprehensive model of basin ecological compensation funds—A case study of the Yellow River Basin in China. Front. Environ. Sci. 2023, 11, 1119576. [Google Scholar] [CrossRef] [Scilit]
- Yu, Y.; Li, J.; Han, L.; Zhang, S. Research on ecological compensation based on the supply and demand of ecosystem services in the Qinling-Daba Mountains. Ecol. Indic. 2023, 154, 110687. [Google Scholar] [CrossRef] [Scilit]
- Xing, L.; Xue, M.; Wang, X. Spatial correction of ecosystem service value and the evaluation of eco-efficiency: A case for China’s provincial level. Ecol. Indic. 2018, 95, 841–850. [Google Scholar] [CrossRef] [Scilit]
- Liu, S.; Long, Z.; Liu, H.; Zhang, J.; Zhang, G.; Liang, J. Machine learning predict the degradation efficiency of aqueous refractory organic pollutants by ultrasound-based advanced oxidation processes. J. Water Process Eng. 2024, 66, 106022. [Google Scholar] [CrossRef] [Scilit]
- Li, Z.Z.; Hu, B.; Qin, Y.; Cheng, X. Drivers of spatiotemporal disparities in the supply-demand budget of ecosystem services: A case study in the Beijing-Tianjin-Hebei urban agglomeration, China. Front. Environ. Sci. 2022, 10, 955876. [Google Scholar] [CrossRef] [Scilit]
- Deng, C.; Zhu, D.; Nie, X.; Liu, C.; Zhang, G.; Liu, Y.; Li, Z.; Wang, S.; Ma, Y. Precipitation and urban expansion caused jointly the spatiotemporal dislocation between supply and demand of water provision service. J. Environ. Manag. 2021, 299, 113660. [Google Scholar] [CrossRef] [Scilit]
- Guo, S.; Wu, C.; Wang, Y.; Qiu, G.; Zhu, D.; Niu, Q.; Qin, L. Threshold effect of ecosystem services in response to climate change, human activity and landscape pattern in the upper and middle Yellow River of China. Ecol. Indic. 2022, 136, 108603. [Google Scholar] [CrossRef] [Scilit]
- Yin, D.; Yu, H.; Shi, Y.; Zhao, M.; Zhang, J.; Li, X. Matching supply and demand for ecosystem services in the Yellow River Basin, China: A perspective of the water-energy-food nexus. J. Clean. Prod. 2023, 384, 135469. [Google Scholar] [CrossRef] [Scilit]
- Meng, S.; Huang, Q.; Zhang, L.; He, C.; Inostroza, L.; Bai, Y.; Yin, D. Matches and mismatches between the supply of and demand for cultural ecosystem services in rapidly urbanizing watersheds: A case study in the Guanting Reservoir basin, China. Ecosyst. Serv. 2020, 45, 101156. [Google Scholar] [CrossRef] [Scilit]
- Newton, P.; Nichols, E.S.; Endo, W.; Peres, C.A. Consequences of actor level livelihood heterogeneity for additionality in a tropical forest payment for environmental services programme with an undifferentiated reward structure. Glob. Environ. Change 2012, 22, 127–136. [Google Scholar] [CrossRef] [Scilit]
- Wang, X.; Liu, P.; Wei, C.; Xu, N.; Zhao, P.; Wen, D. Research on ecological compensation based on ecosystem service flow: A case study in Guangdong province, China. J. Clean. Prod. 2024, 480, 144090. [Google Scholar] [CrossRef] [Scilit]
- Wei, W.; Nan, S.; Xie, B.; Liu, C.; Zhou, J.; Liu, C. The spatial-temporal changes of supply-demand of ecosystem services and ecological compensation: A case study of Hexi Corridor, Northwest China. Ecol. Eng. 2023, 187, 106861. [Google Scholar] [CrossRef] [Scilit]
- Ding, W.; Jimoh, S.O.; Hou, X.; Shu, X.; Dong, H.; Bolormaa, D.; Wang, D. Grassland ecological subsidy policy and livestock reduction behavior: A case study of herdsmen in northern China. Rangel. Ecol. Manag. 2022, 81, 78–85. [Google Scholar] [CrossRef] [Scilit]

Disclaimer/Publisher’s Note: The statements, opinions and data contained in all publications are solely those of the individual author(s) and contributor(s) and not of MDPI and/or the editor(s). MDPI and/or the editor(s) disclaim responsibility for any injury to people or property resulting from any ideas, methods, instructions or products referred to in the content. |
© 2026 by the authors. Licensee MDPI, Basel, Switzerland. This article is an open access article distributed under the terms and conditions of the Creative Commons Attribution (CC BY) license.