


Abstract
Establishing reliable hydrochemical reference conditions is essential for water quality assessment and for the implementation of the European Union Water Framework Directive, particularly in regions where biological and hydromorphological data remain limited. This study aims to evaluate hydrochemical reference conditions in selected river headwaters of Western Ukraine and to examine the consistency between international and national water quality assessment approaches. Water samples were collected from four headwater and confluence sites and analysed for key physicochemical parameters, including nutrients, organic matter indicators, and major ions. Water quality was assessed using the Water Quality Index (WQI) and the Ukrainian Ecological Quality Index (IE), supported by correlation analysis and principal component analysis to identify dominant drivers of spatial variability. Most parameters complied with international and national standards, although elevated concentrations of ammonium, phosphates, biochemical oxygen demand, and nitrites were observed at specific sites. WQI differentiated headwaters with good and moderate water quality, whereas IE classified all sites as good, indicating methodological differences in sensitivity. Multivariate analysis showed that water quality variability was primarily controlled by biogenic and organic loading, while mineralization parameters reflected background geochemical conditions. The results demonstrate that hydrochemical indices can support the preliminary identification of reference conditions but also highlight systematic differences between assessment frameworks. These findings provide a methodological basis for harmonizing national water quality assessments with international standards and for improving reference site selection in data-limited regions.
Keywords:
hydrochemistry; headwaters; rivers; water; nutrients; indices; assessment; Ukraine; Styr river; Ikva river; Western Bug river 1. Introduction
In today’s environment, globalisation creates both new opportunities and challenges for natural resource management [1]. Local river systems, particularly headwaters, are indirectly affected by global processes: climate change, intensification of trade, transnational agricultural activities and increasing anthropogenic pressure [2]. These factors undermine local and national sustainability, as well as regional environmental stability [3]. In this context, sustainability and the achievement of the Sustainable Development Goals (SDGs) become a key framework for integrating water management policy with global approaches [4]. First-order headwaters contribute approximately 70% of the mean-annual water volume and 65% of the nitrogen flux in second-order streams [5]. Their contributions to mean water volume and nitrogen flux decline only marginally to about 55% and 40% in fourth- and higher-order rivers [6]. This underscores the profound influence that headwater areas have on shaping downstream water quantity and water quality [7]. Agricultural headwater streams are significantly modified and polluted, but at the same time, so are the critical linkages among land, air, and water ecosystems. They exhibit the largest variation in streamflow, water quality, and greenhouse gas emission with cascading effects on the entire stream networks, yet they are underrepresented in monitoring, remediation, and restoration [8]. Headwaters, however, are frequently neglected as they are not usually recognised [9]. This poses limitations for the management of river catchments. River headwaters occupy a particularly vulnerable position in the structure of the water basin: this is where the main hydrochemical and ecological parameters of watercourses are formed.
According to the EU Water Framework Directive (WFD 2000/60/EC) [10], reference conditions are a set of hydromorphological, hydrochemical and biological conditions of a water body that would correspond to its natural state in the absence of or with insignificant anthropogenic pressure [11]. Such areas should be located in sparsely populated or unoccupied territories, preserve the natural structure of the riverbed, banks, flow dynamics and connection with the floodplain, and demonstrate a background hydrochemical composition that reflects only natural geochemical processes [12]. An important condition is high biological quality, with the diversity and composition of hydrobionts corresponding to the natural state for a given type of water body, which, in turn, must be representative of a specific ecoregion and class [13]. In addition, reference conditions must be stable over time, which is manifested in low spatial and temporal variability of indicators [14]. In the context of Ukrainian practice, the assessment of reference conditions is often limited to hydrochemical data due to the lack of systematic biomonitoring and hydromorphological diagnostics, which complicates the complete reproduction of reference conditions in accordance with the requirements of the WFD 2000/60/EC. However, in the initial stages, this approach is sufficient for selecting potential reference sites, forming a basic monitoring network, and further integrating national data into European standards. Moreover, comparing water quality parameters with reference hydrochemical conditions allows assessing the effectiveness of implementing smart, circular and decentralised solutions in the field of water resources. Headwaters are often used as reference hydrochemical conditions, but their condition can vary due to local natural and anthropogenic factors, so it is important to study headwaters and assess their degree of compliance [15,16]. Reliable identification of hydrochemical reference conditions in such systems is therefore fundamental for environmental monitoring, ecological status assessment, and water management planning. This task is especially relevant in regions undergoing land-use change and climatic variability, where baseline conditions are often poorly constrained, and long-term monitoring data remain limited. Discrepancies between international and national classification schemes, as well as uncertainty in distinguishing natural background variability from early-stage anthropogenic influence, remain unresolved issues, especially in Eastern European river basins where integrated datasets are scarce.
In connection with the implementation of the WFD 2000/60/EC in Ukraine, there is a need to harmonise national approaches to water quality assessment with international standards [17]. Therefore, the use of integrated indices such as the water quality index (WQI) and the Ukrainian ecological quality index (IE) makes it possible to compare local results with international standards and contributes to the formation of a common strategy for the sustainable management of aquatic ecosystems and their harmonisation with the requirements of the WFD. Moreover, establishing reference hydrochemical conditions for rivers is an important tool not only for environmental monitoring but also for enhancing water security, ensuring adaptability to global changes, and supporting long-term environmental balance [18,19]. Thus, combining local observations with sustainability concepts strengthens the link between scientific results and water management practices in the context of globalisation. The aim of the study is to establish reference hydrochemical conditions at river headwaters and assess their importance for ensuring sustainable water management in the context of globalisation and achieving the SDGs. The study aims to compare local water quality parameters with international standards (WFD 2000/60/EC, US EPA) and national standards, integrate WQI and IE indices, and identify factors that shape the sustainability of water ecosystems. The objectives of the study were: (1) to assess the concentrations of key water quality parameters, including concentrations of ammonium nitrogen (N–NH4), biochemical oxygen demand (BOD5), nitrates (N–NO3), nitrites (N–NO2), sulphates (SO42−), total dissolved solids (TDSs), phosphates (P–PO4), chlorides (Cl−), chemical oxygen demand (COD) in accordance with international and Ukrainian standards for the sources of the Styr, Ikva and Western Bug rivers; (2) to calculate and compare the integral WQI and IE indices to determine the ecological status; (3) identify the dominant factors determining the spatial variability of water quality using correlation analysis and principal component analysis (PCA); (4) provide justification for the use of selected sections of the headwaters as reference points for further monitoring of changes in the hydrochemical status of river systems.
The significance of this research lies in its contribution to methodological harmonization between water quality assessment frameworks and its relevance for regions with limited biological monitoring capacity. The results offer practical guidance for preliminary reference site selection, support the interpretation of hydrochemical indices in headwater environments, and provide a scientific basis for improving water management decisions. More broadly, the study contributes to the refinement of reference condition concepts in data-limited river basins and supports the development of comparable assessment practices across national and international contexts.
2. Materials and Methods
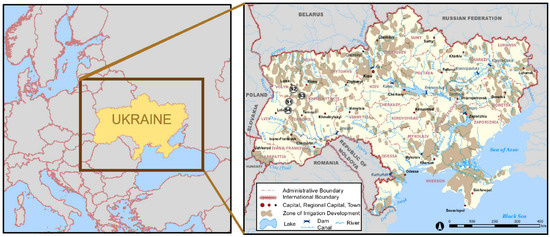
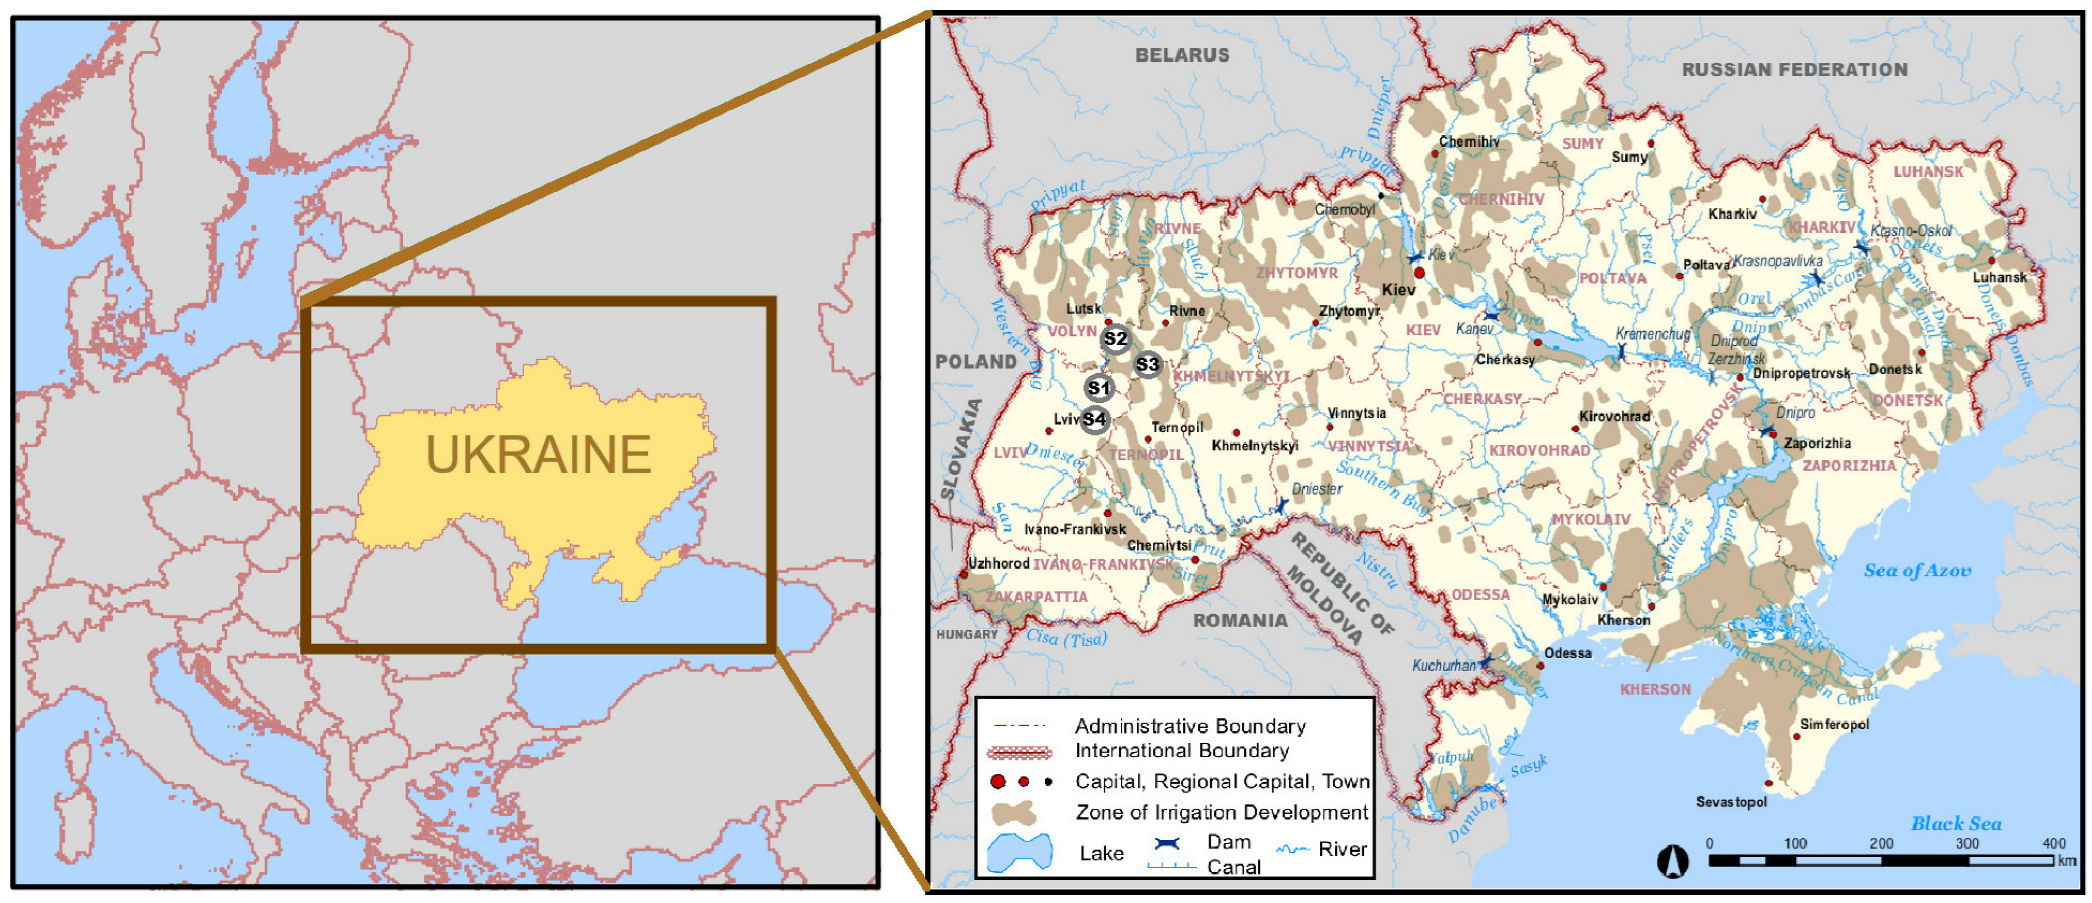
The methodological basis of the study was to compare integral water quality indicators according to international (WQI) and Ukrainian (IE) classification approaches, which allows establishing the compliance of local results with global environmental assessment criteria. The subject of the study was the headwaters of the Styr, Ikva and Western Bug rivers, which were considered as reference hydrochemical conditions (Figure 1).
Figure 1.
Study area and sampling locations.
2.1. Sample Selection and Preparation, Laboratory Analytical Methods
Water samples were collected at four control points (S1–S4) representing the headwaters of the Styr, Ikva and Western Bug river systems (Figure 1) during June 2025. The Styr River is a right tributary of the Pripyat, flows through Ukraine (starting in the Lviv region, then through the Rivne and Volyn regions) and enters Belarus; it is approximately 494 km long, with a basin area of 13,100 km2 [20]. The cities of Lutsk, Staryi Chortoryisk and Varash are located on the Styr River, which is important for the regional hydrology of Volyn and is subject to local environmental pressure [21]. The Ikva River is a right tributary of the Styr, flowing through the Lviv, Ternopil, and Rivne regions of Ukraine. It is 155 km long and has a basin area of 2250 km2. It has a cascade of small tributaries and several reservoirs, and the city of Dubno is located on the Ikva [22]. It is used for local water supply, economic needs and fishing [23]. The Western Bug is a Central European river that flows through Ukraine, Poland and Belarus; its total length is 774 km, and its basin area is 38,712 km2 [24].
Sampling was carried out in accordance with current Ukrainian guidelines [25], observing the rules of representativeness, conservation and transportation to the laboratory. Water quality was assessed using a set of water quality parameters: ammonium nitrogen (N–NH4), biochemical oxygen demand (BOD5), nitrates (N–NO3), nitrites (N–NO2), sulphates (SO42−), total dissolved solids (TDSs), phosphates (P–PO4), chlorides (Cl−), chemical oxygen demand (COD). Certified methods were employed for analysis, including photocolorimetric reactions (Hessler’s reagent, molybdenum blue, and sulfonic reagent), spectrophotometry (Griss reagent), turbidimetry, argentometry, gravimetric determination, and the oximetry method for BOD5. The results obtained were compared with the maximum permissible concentration (MPC) standards [26,27], US EPA water quality criteria (WQC) [28,29] and WFD 2000/60/EC [30] (Table 1). All chemical reagents used in the analytical procedures were of certified analytical quality and fully complied with the requirements of the approved Ukrainian measurement methods specified in Table 1. The reagents met purity grades not lower than chemically pure for analysis (p.a., ch.d.a.) and were obtained from either domestic or international suppliers. Only reagents with valid expiration dates and accompanying quality certificates were used.
Table 1.
WQC, MPC for water quality parameters (WQPs) and measurement methods.
2.2. Water Quality Index (WQI) and Ukrainian Water Quality Category (IE) Classification
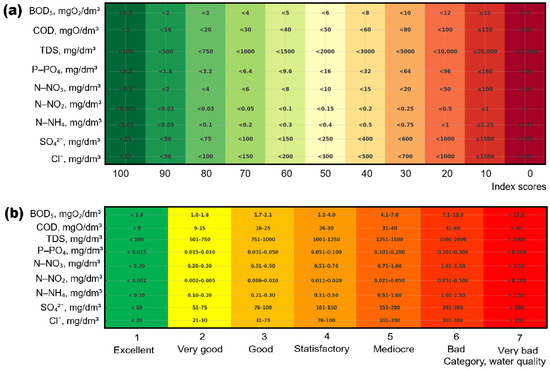
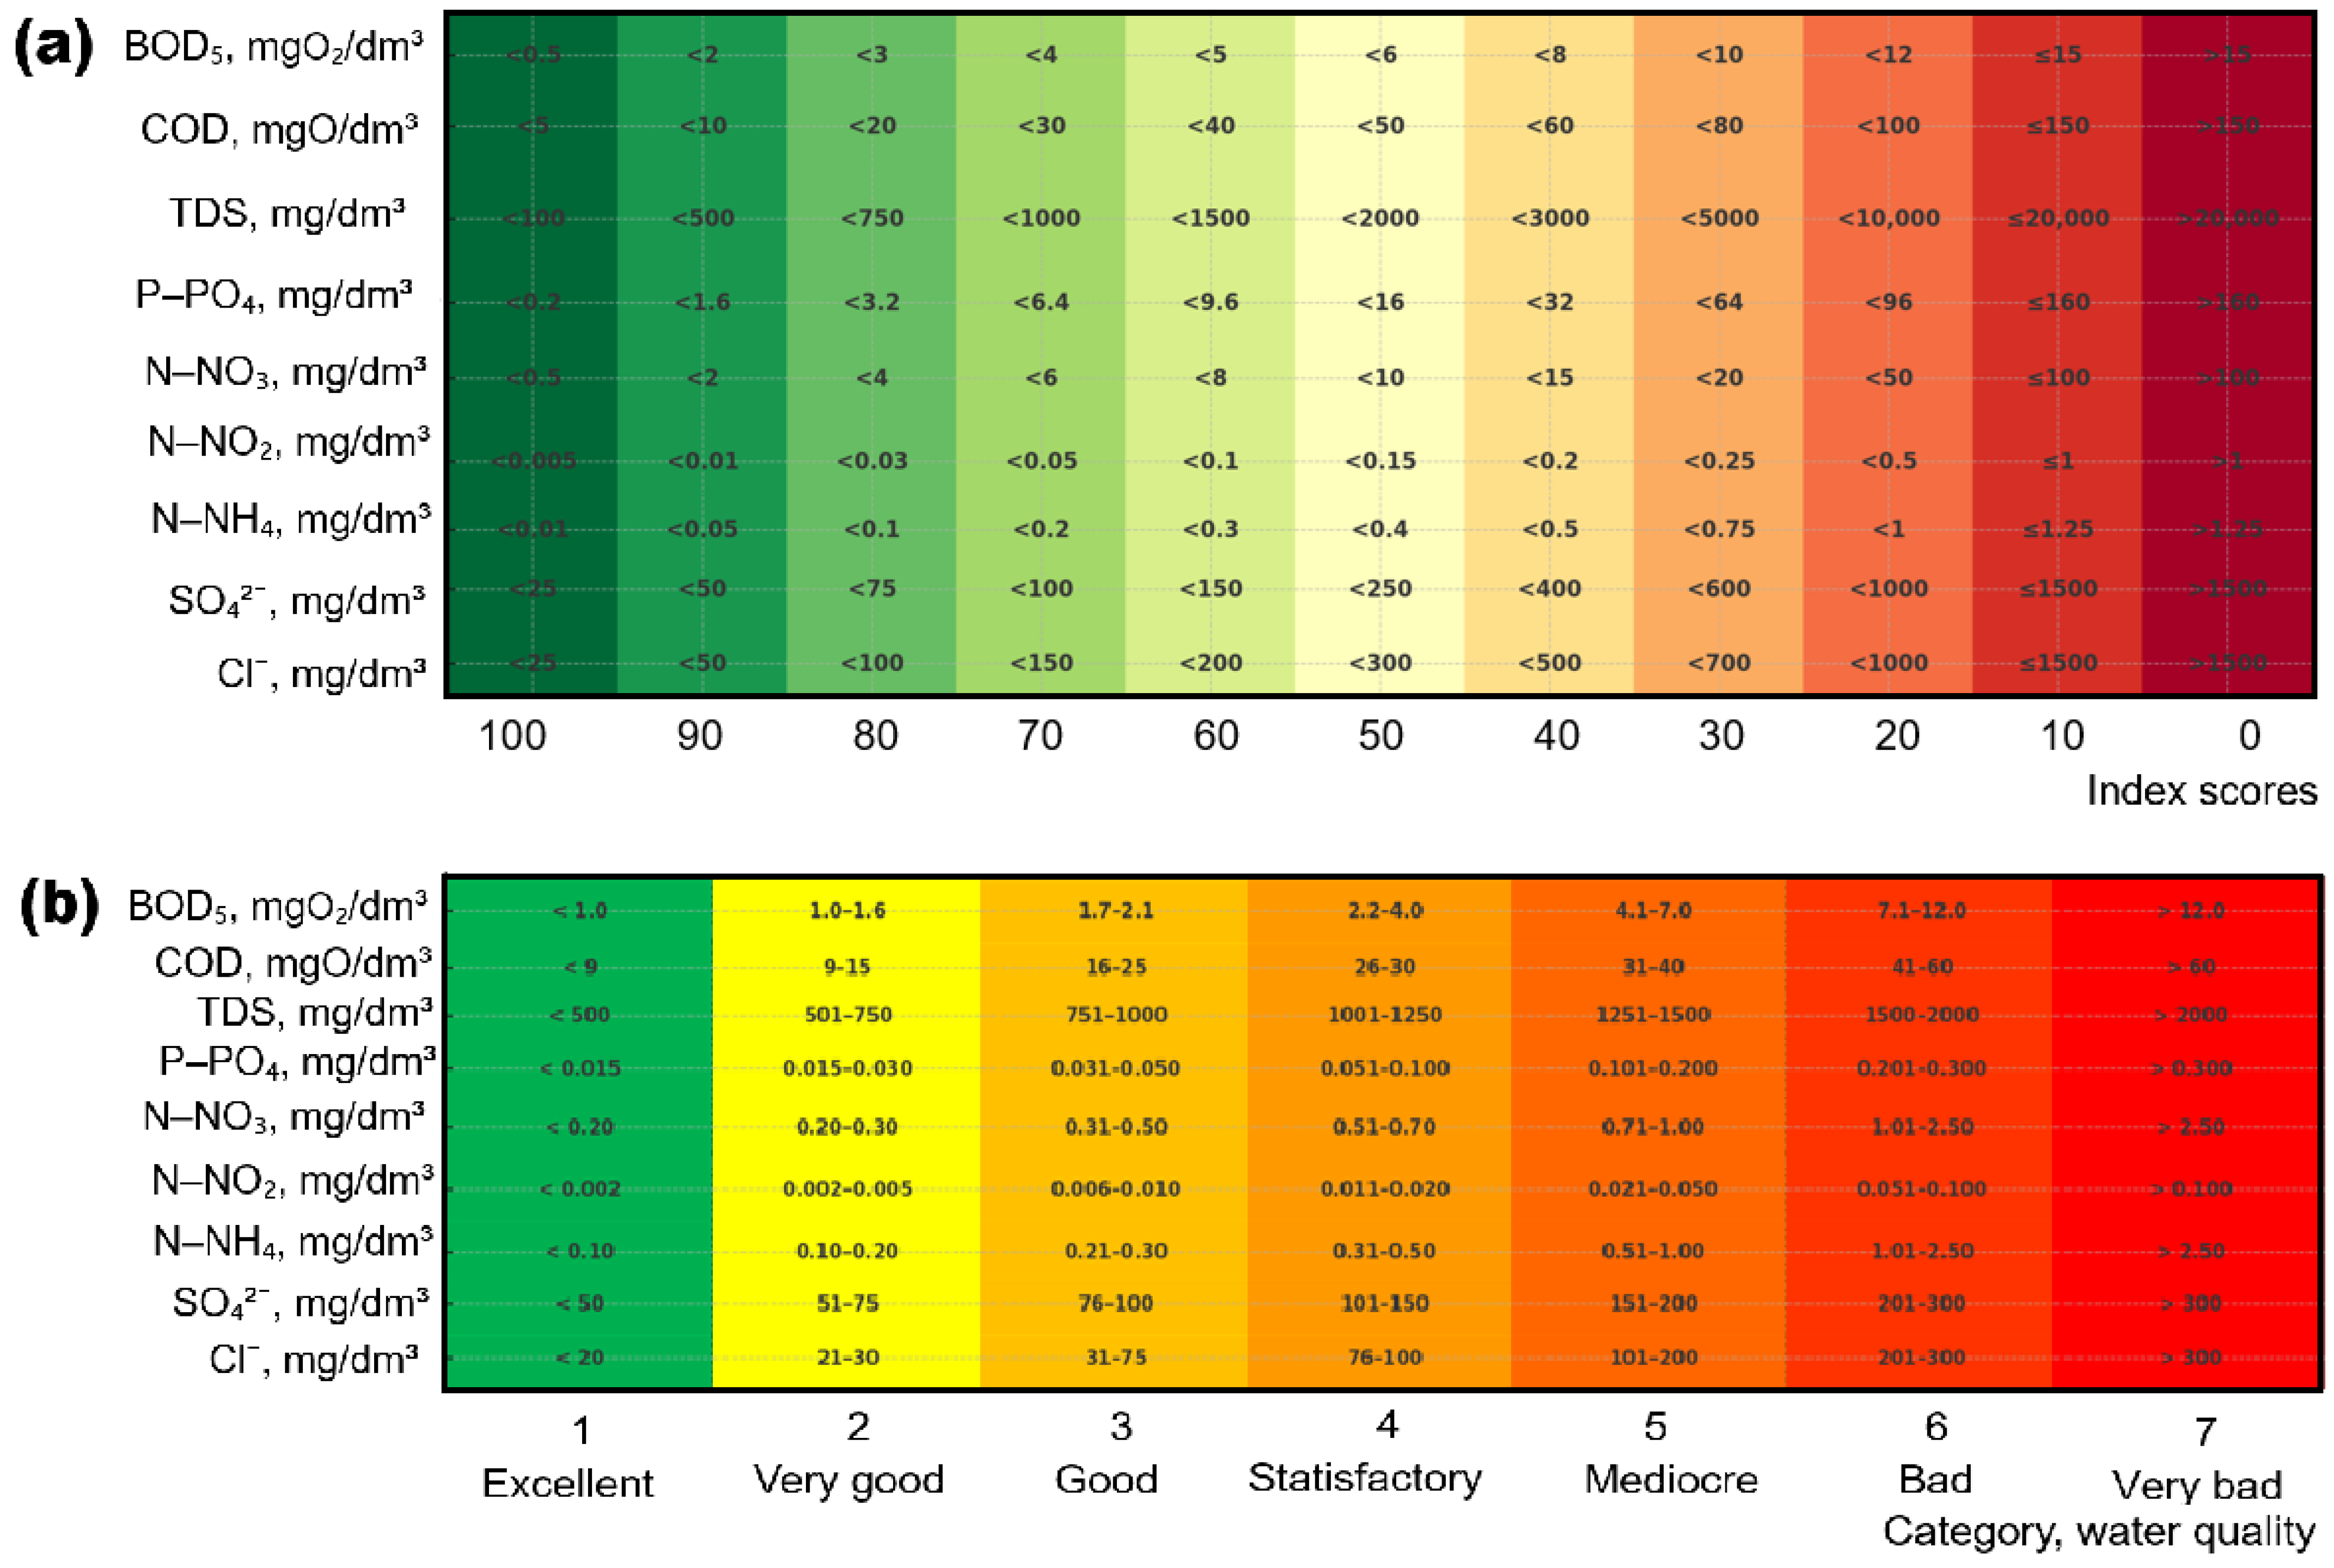
For an integrated assessment of water status, the WQI was used, which was calculated based on the standardisation of individual indicators, the assignment of weighting coefficients and aggregation into an overall score (Figure 2a) according to [40]. In accordance with the accepted classification, five quality categories were identified: grading the water quality to five classes based on index scores: excellent (91–100), good (71–90), medium (51–70), bad (26–50) and very bad (0–25). This approach allows for a generalised assessment and comparison of the state of waters in different basins at the international level. The national assessment was carried out using the IE, which was calculated using seven categories, according to the actual concentration of water quality parameters (Figure 2b) according to [41]. The calculated values allow water to be classified according to its ecological status and degree of purity in accordance with Ukrainian standards. Taking the IE into account ensures that the specifics of the national approach, focused on assessing the purity of aquatic ecosystems, are reflected. The combination of WQI and IE not only lets us check out the current state of river headwaters and reference hydrochemical conditions, but also figures out how different classification systems line up, which is super helpful for bringing Ukrainian data into international monitoring programmes. Thus, the chosen methodology provided an opportunity for a comprehensive assessment of the hydrochemical status of rivers at the level of reference sites and a comparison of international and national classification systems, which meets the current requirements for environmental monitoring and harmonisation of Ukrainian and international approaches.
Figure 2.
International water quality index WQI (a) and Ukrainian water quality category IE (b) classification water quality approaches.
2.3. Data Processing and Statistical Analysis
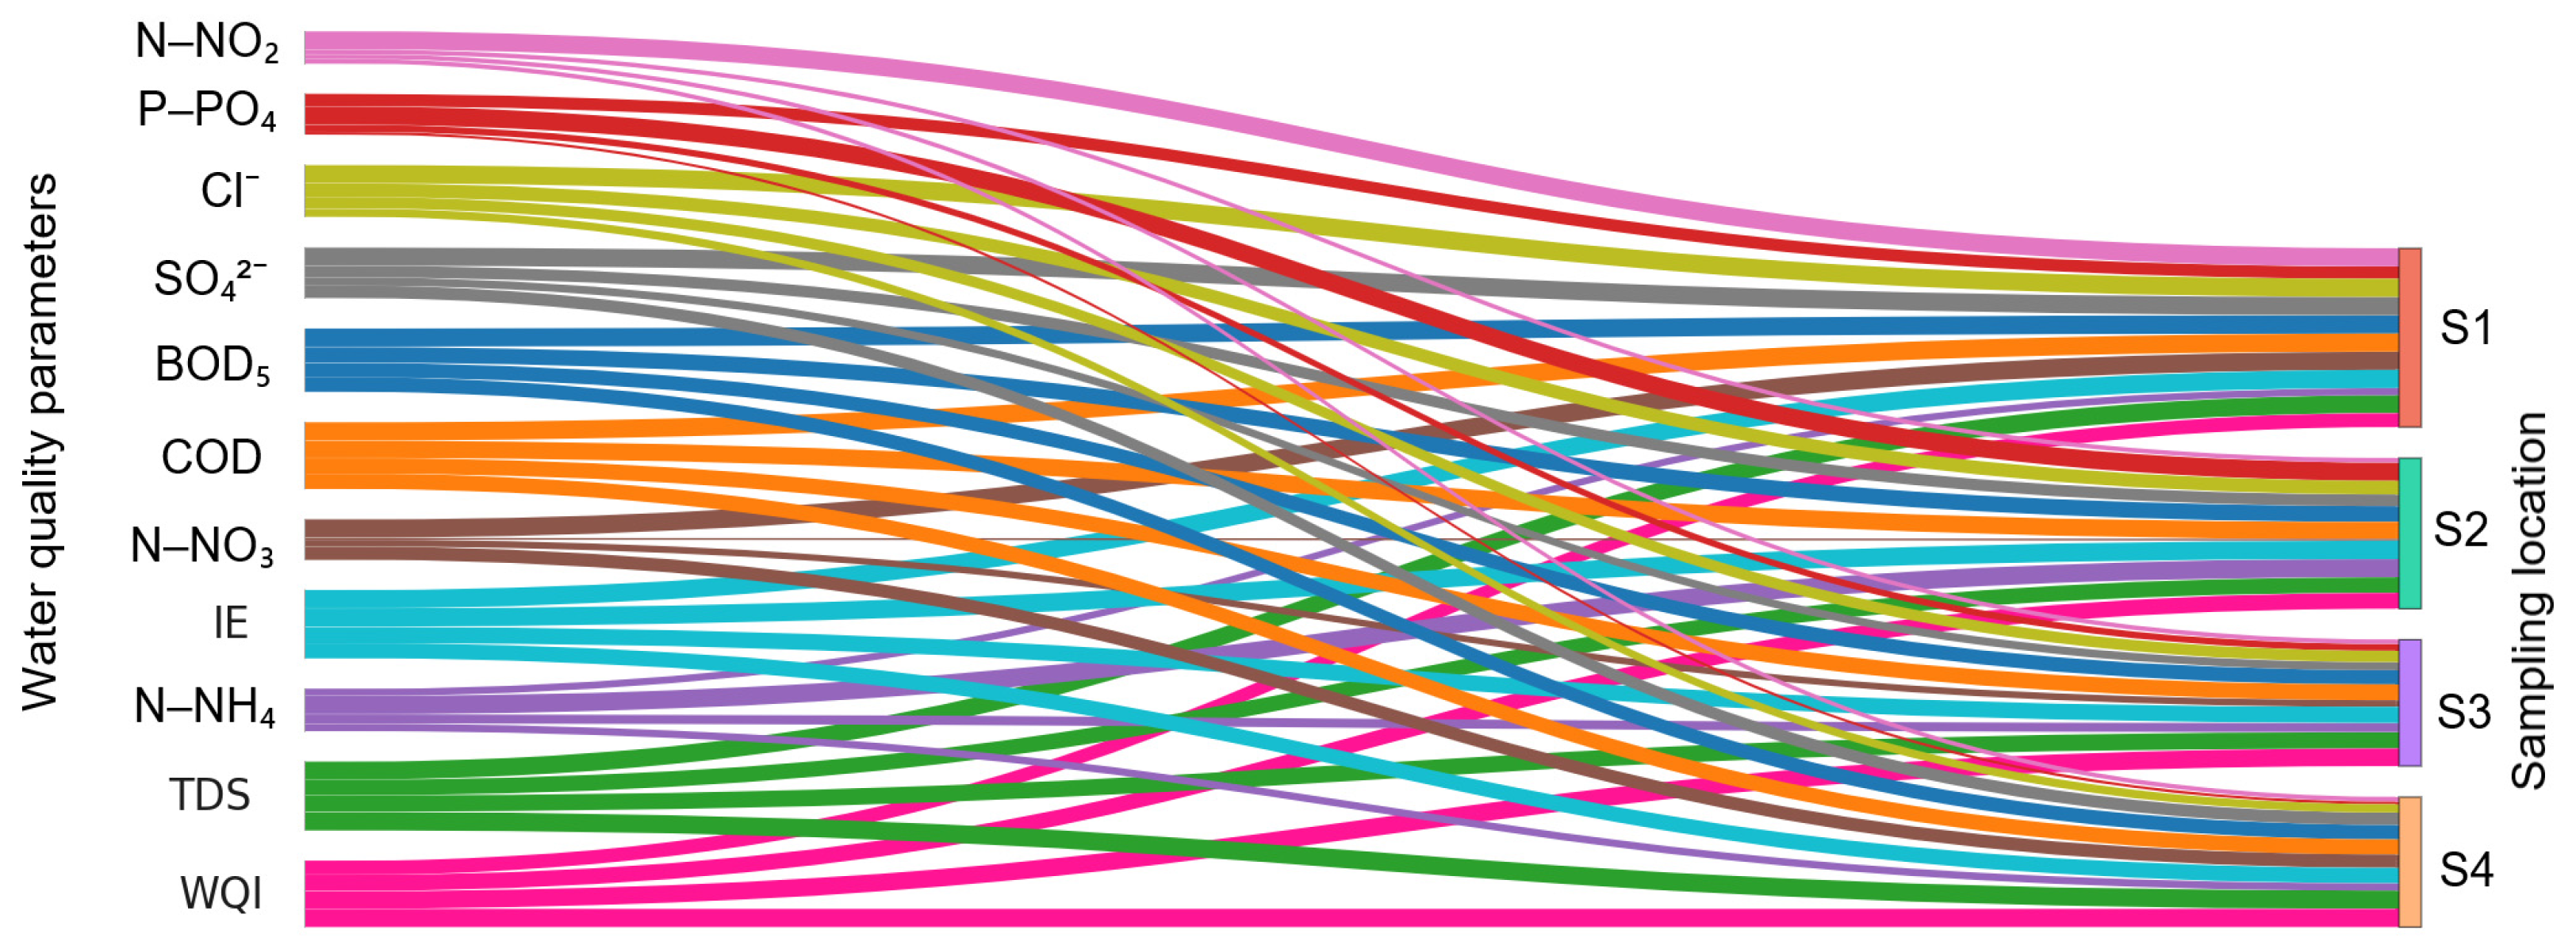
Statistical processing of measurement results included the determination of minimum and maximum (min–max), arithmetic mean (M), and absolute error (±Δ). In addition, a correlation analysis was performed with the calculation of Pearson’s rank correlation coefficients and principal component analysis (PCA) from the calculations of the load on the principal components (PCs) to identify factor loads, determine the leading parameters that form integral indices, and ordination of sampling points in the PC space. Correlation, cluster analyses, and PCA were performed in accordance with [42,43]. The factor loadings were calculated for the first three principal components (PC1, PC2, PC3); loadings > 0.6 were considered statistically significant and were used to identify dominant parameters. The strength of the linear relationship between two variables was determined by Pearson’s rank correlation coefficient (r), with the following gradation: in the range 0.1 ≤ r ≤ 0.1—the relationship between the variables is very weak or absent; r in the range from 0.3 to 0.5 or from −0.3 to −0.5—moderate positive or negative correlation, respectively; r in the range from 0.5 to 0.7 or from −0.5 to −0.7—moderate positive or negative correlation, respectively; r in the range from 0.7 to 1.0 or from −0.7 to −1.0—strong positive or negative correlation, respectively. To assess the relationship between the WQI and IE indices, a linear regression method was used to calculate the coefficient of determination (R2), which reflects the degree of statistical agreement between the two integrated water quality assessment systems. A value of R2 > 0.8 indicates a close functional relationship between the parameters studied, despite the different logic of their standardisation and interpretation. To summarise the relationships between water quality parameters, indices (WQI, IE) and spatial sampling points (S1–S4), a Sankey diagram was used, implemented in Python (Plotly version 5.19.0). To ensure comparability between parameters expressed in different units of measurement and ranges of values, all data were normalised relative to the maximum value. Each parameter was assigned a unique colour, and the thickness of the line between the parameter and the site corresponded to the normalised load (Lnorm). The following gradation of Lnorm load contribution was used: <0.3—low (background participation); 0.3–0.60—moderate; 0.6–0.8—high; >0.8—very high (dominant contribution). This approach made it possible to quantitatively determine the proportional contribution of each indicator to the formation of the total hydrochemical load for each sampling point. Statistical processing, correlation, cluster and regression analyses, and PCA were performed using the JASP software package (version v.0.14.3).
3. Results and Discussion
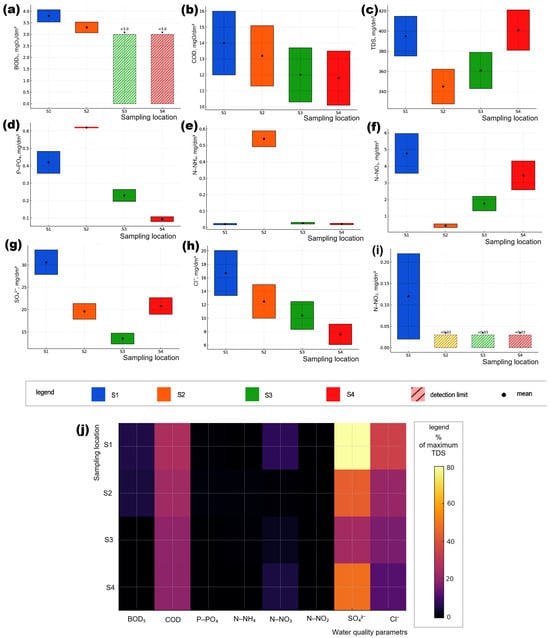
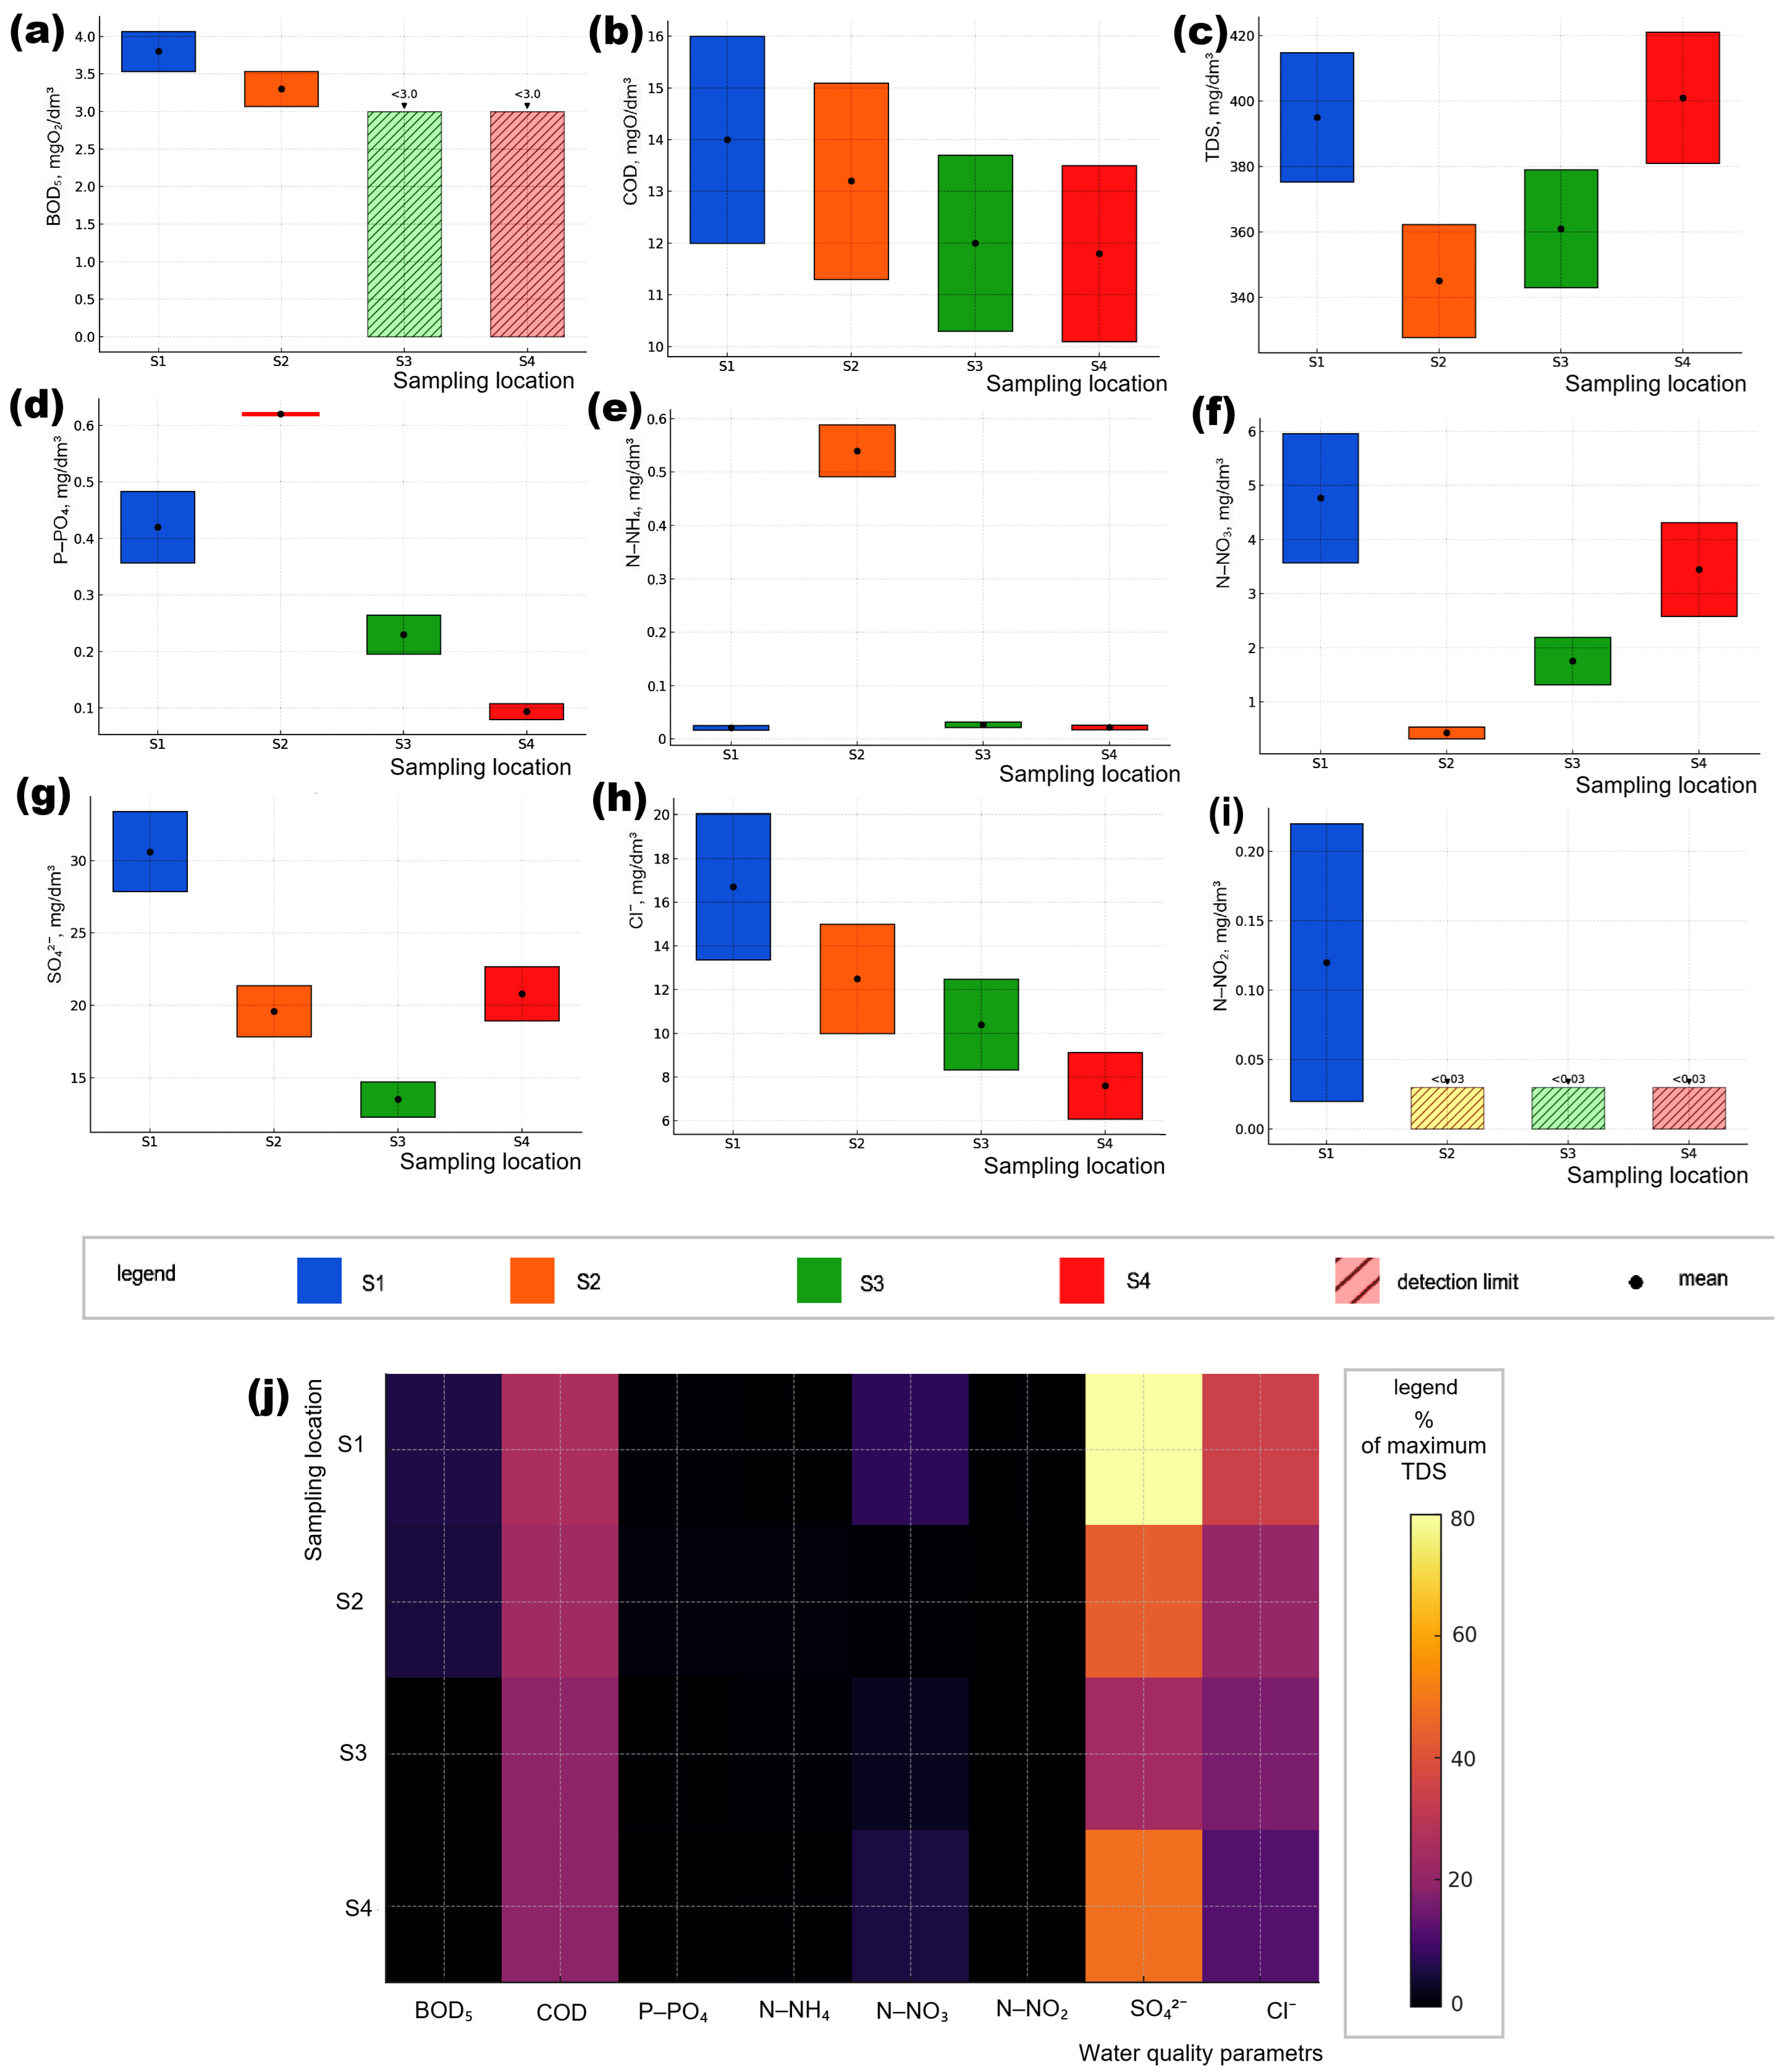
Analysis of concentration changes in water quality parameters (Figure 3a–i) revealed significant spatial variability, which made it possible to identify both natural differences in water formation conditions at the sources of the Styr (S1), Ikva (S3), and Western Bug (S4) rivers, as well as the cumulative effect after the confluence of the Styr and Ikva (S2) rivers. At the headwaters of the rivers (S1, S3, S4), the minimum values of N–NH4 concentration (M ± Δ) were recorded in S1 at 0.21 ± 0.04 mg/dm3 (Styr River), while in S3 at 3.27 ± 0.05 mg/dm3 (Ikva River), higher values were observed. At the sources of the Ikva and Western Bug rivers (S3, S4), BOD5 concentrations were below 3.0 mgO2/dm3, indicating high water purity and no excess organic load, while in the Styr River (S1), the average BOD5 concentration was 3.8 ± 0.27 mgO2/dm3 (min–max = 3.5–4.1 mgO2/dm3), and after the confluence of the Ikva and Styr rivers (S2), it decreased to 3.3 ± 0.23 mgO2/dm3 (3.1–3.5 mgO2/dm3). At all points, COD concentrations remained relatively low, with the highest value in the Styr River (S1) at 14.0 ± 2.0 mgO/dm3, while in the Western Bug River (S4) the minimum concentration was recorded at 11.8 ± 1.7 mgO2/dm3. After the confluence at S2 Styr and Ikva (S2), COD concentrations decreased compared to the source of the Styr River (S1) to 13.2 ± 1.9 mgO2/dm3. The highest TDS levels were observed in the Western Bug River (S4) at 401 ± 20 mg/dm3, while in the Styr River (S1), TDS was 395 ± 20 mg/dm3, and in the Ikva River (S3), 361 ± 18 mg/dm3. The maximum concentrations of P–PO4 were observed after the confluence of the Ikva and Styr rivers (S2) at 0.62 mg/dm3, while at the sources, they were significantly lower, which may indicate the accumulation of biogenic elements in the confluence area, potentially increasing the risk of eutrophication. In the Styr River (S1), N–NO2 concentrations were 0.12 ± 0.01 mg/dm3. After the confluence at S2, the concentration of N–NO2 did not exceed 0.03 mg/dm3, indicating their rapid transformation in nitrification–denitrification processes. At the source of the Styr River (S1), N–NO3 concentrations were highest at 4.77 ± 1.19 mg/dm3, with significantly lower values recorded at the confluence of the S2 (0.43 ± 0.11 mg/dm3) and Ikva S3 (1.76 ± 0.44 mg/dm3) rivers, reflecting the contrast in nitrogen nutrition between different basins and its reduction after confluence. Ikva River confluence (1.76 ± 0.44 mg/dm3), reflecting the contrast in nitrogen nutrition of different basins and its reduction after confluence. The values of SO42− concentration decreased in the following order: S1 (30.6 ± 2.8 mg/dm3) > S4 (20.8 ± 1.9 mg/dm3) > S2 (19.6 mg/dm3) > S3 (13.5 mg/dm3). The maximum Cl− concentrations were recorded in the Styr River (S1) at 16.7 ± 3.3 mg/dm3, while the minimum Cl− concentrations were recorded in the Western Bug River (S4) at 7.6 ± 1.5 mg/dm3.
Figure 3.
Results (a–i) and heatmap (j) showing the concentrations of water quality parameters in the studied river sites (S1–S4).
A general analysis of variations (Figure 3a–i) in the concentrations of water quality parameters showed that the sources (S1, S3, S4) can be defined as reference hydrochemical conditions due to relatively stable concentrations for most water quality parameters. At the same time, the Styr River (S1) is characterised by the lowest concentrations for most indicators, which indicates the lowest anthropogenic load. The Ikva River (S3) is distinguished by higher concentrations of biogenic elements (N–NH4, P–PO4), while the Western Bug River (S4) shows a wider range of variations in N–NO2 and TDS (Figure 3j). At point S2, which reflects the headwaters confluence zone, there is an increase in concentrations for most water quality parameters. This indicates the effect of accumulation and mixing of flows, which creates a more complex hydrochemical structure of water compared to individual headwaters [44,45].
Comparison of the results obtained (Figure 3) with the criteria of international standards (US EPA, WFD 2000/60/EC) and national standards of Ukraine (MPC) showed varying degrees of compliance for individual water quality parameters. In the headwaters of rivers (S1, S3, S4), N–NH4 concentrations complied with both international (≤0.57 mg/dm3) and MPC standards (≤0.5 mg/dm3), while at point S2 (0.54 ± 0.05 mg/dm3) the value exceeded the MPC but remained within international standards. For the Ikva River (S3) and the Western Bug River (S4), the BOD5 concentrations did not exceed the MPC (≤3.0 mgO2/dm3), and in the water at the source of the Styr River (S1: 3.8 mgO2/dm3), after confluence (S2: 3.3 mgO2/dm3), the values were higher than the MPC, but complied with international environmental standards. At all sampling sites, COD concentrations (11.8–14.0 mgO/dm3) were below the national standard (≤30 mgO/dm3); international standards do not regulate a direct limit value for COD. Also, in all cases, TDS concentrations were significantly lower than the national MPC standard (≤1000 mg/dm3). At points S1 and S2, P–PO4 concentrations (0.42 mg/dm3 and 0.62 mg/dm3, respectively) exceeded both the international standard (≤0.2 mg/dm3) and the national MPC (≤0.2 mg/dm3). In the Ikva River (S3 0.23 mg/dm3), the value also exceeded the MPC, while in the Western Bug River (S4: 0.094 mg/dm3), P–PO4 concentrations complied with both standards. At all sampling sites, N–NO3 concentrations (0.43–4.77 mg/dm3) remained within both the international standard (≤10 mg/dm3) and the national MPC (≤40 mg/dm3). In the Styr River (S1), the N–NO2 concentration (0.12 ± 0.01 mg/dm3) exceeded the national MPC (≤0.02 mg/dm3) but complied with the international MPC (≤0.06 mg/dm3). At points S2–S4, the values were below the lower measurement limit (0.03 mg/dm3). At all control points, the concentrations of SO42− and Cl− complied with both international and national standards. Most parameters (COD, TDS, SO42−, Cl−, N–NO3) fully comply with both international and national standards. The largest discrepancies are observed for BOD5, N–NH4, N–NO2 and P–PO4. National standards were found to be low for BOD5 and N–NO2 concentrations, but both assessments recorded excessive P–PO4 concentrations at sampling sites S1–S3.
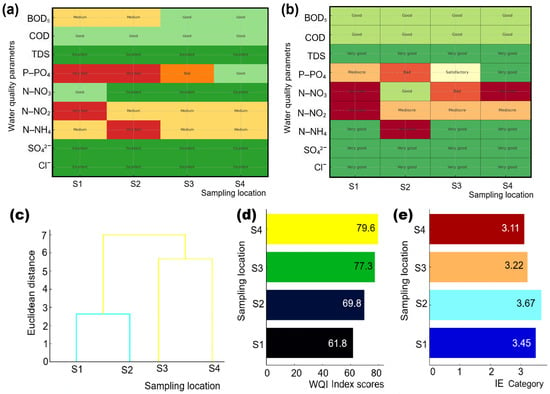
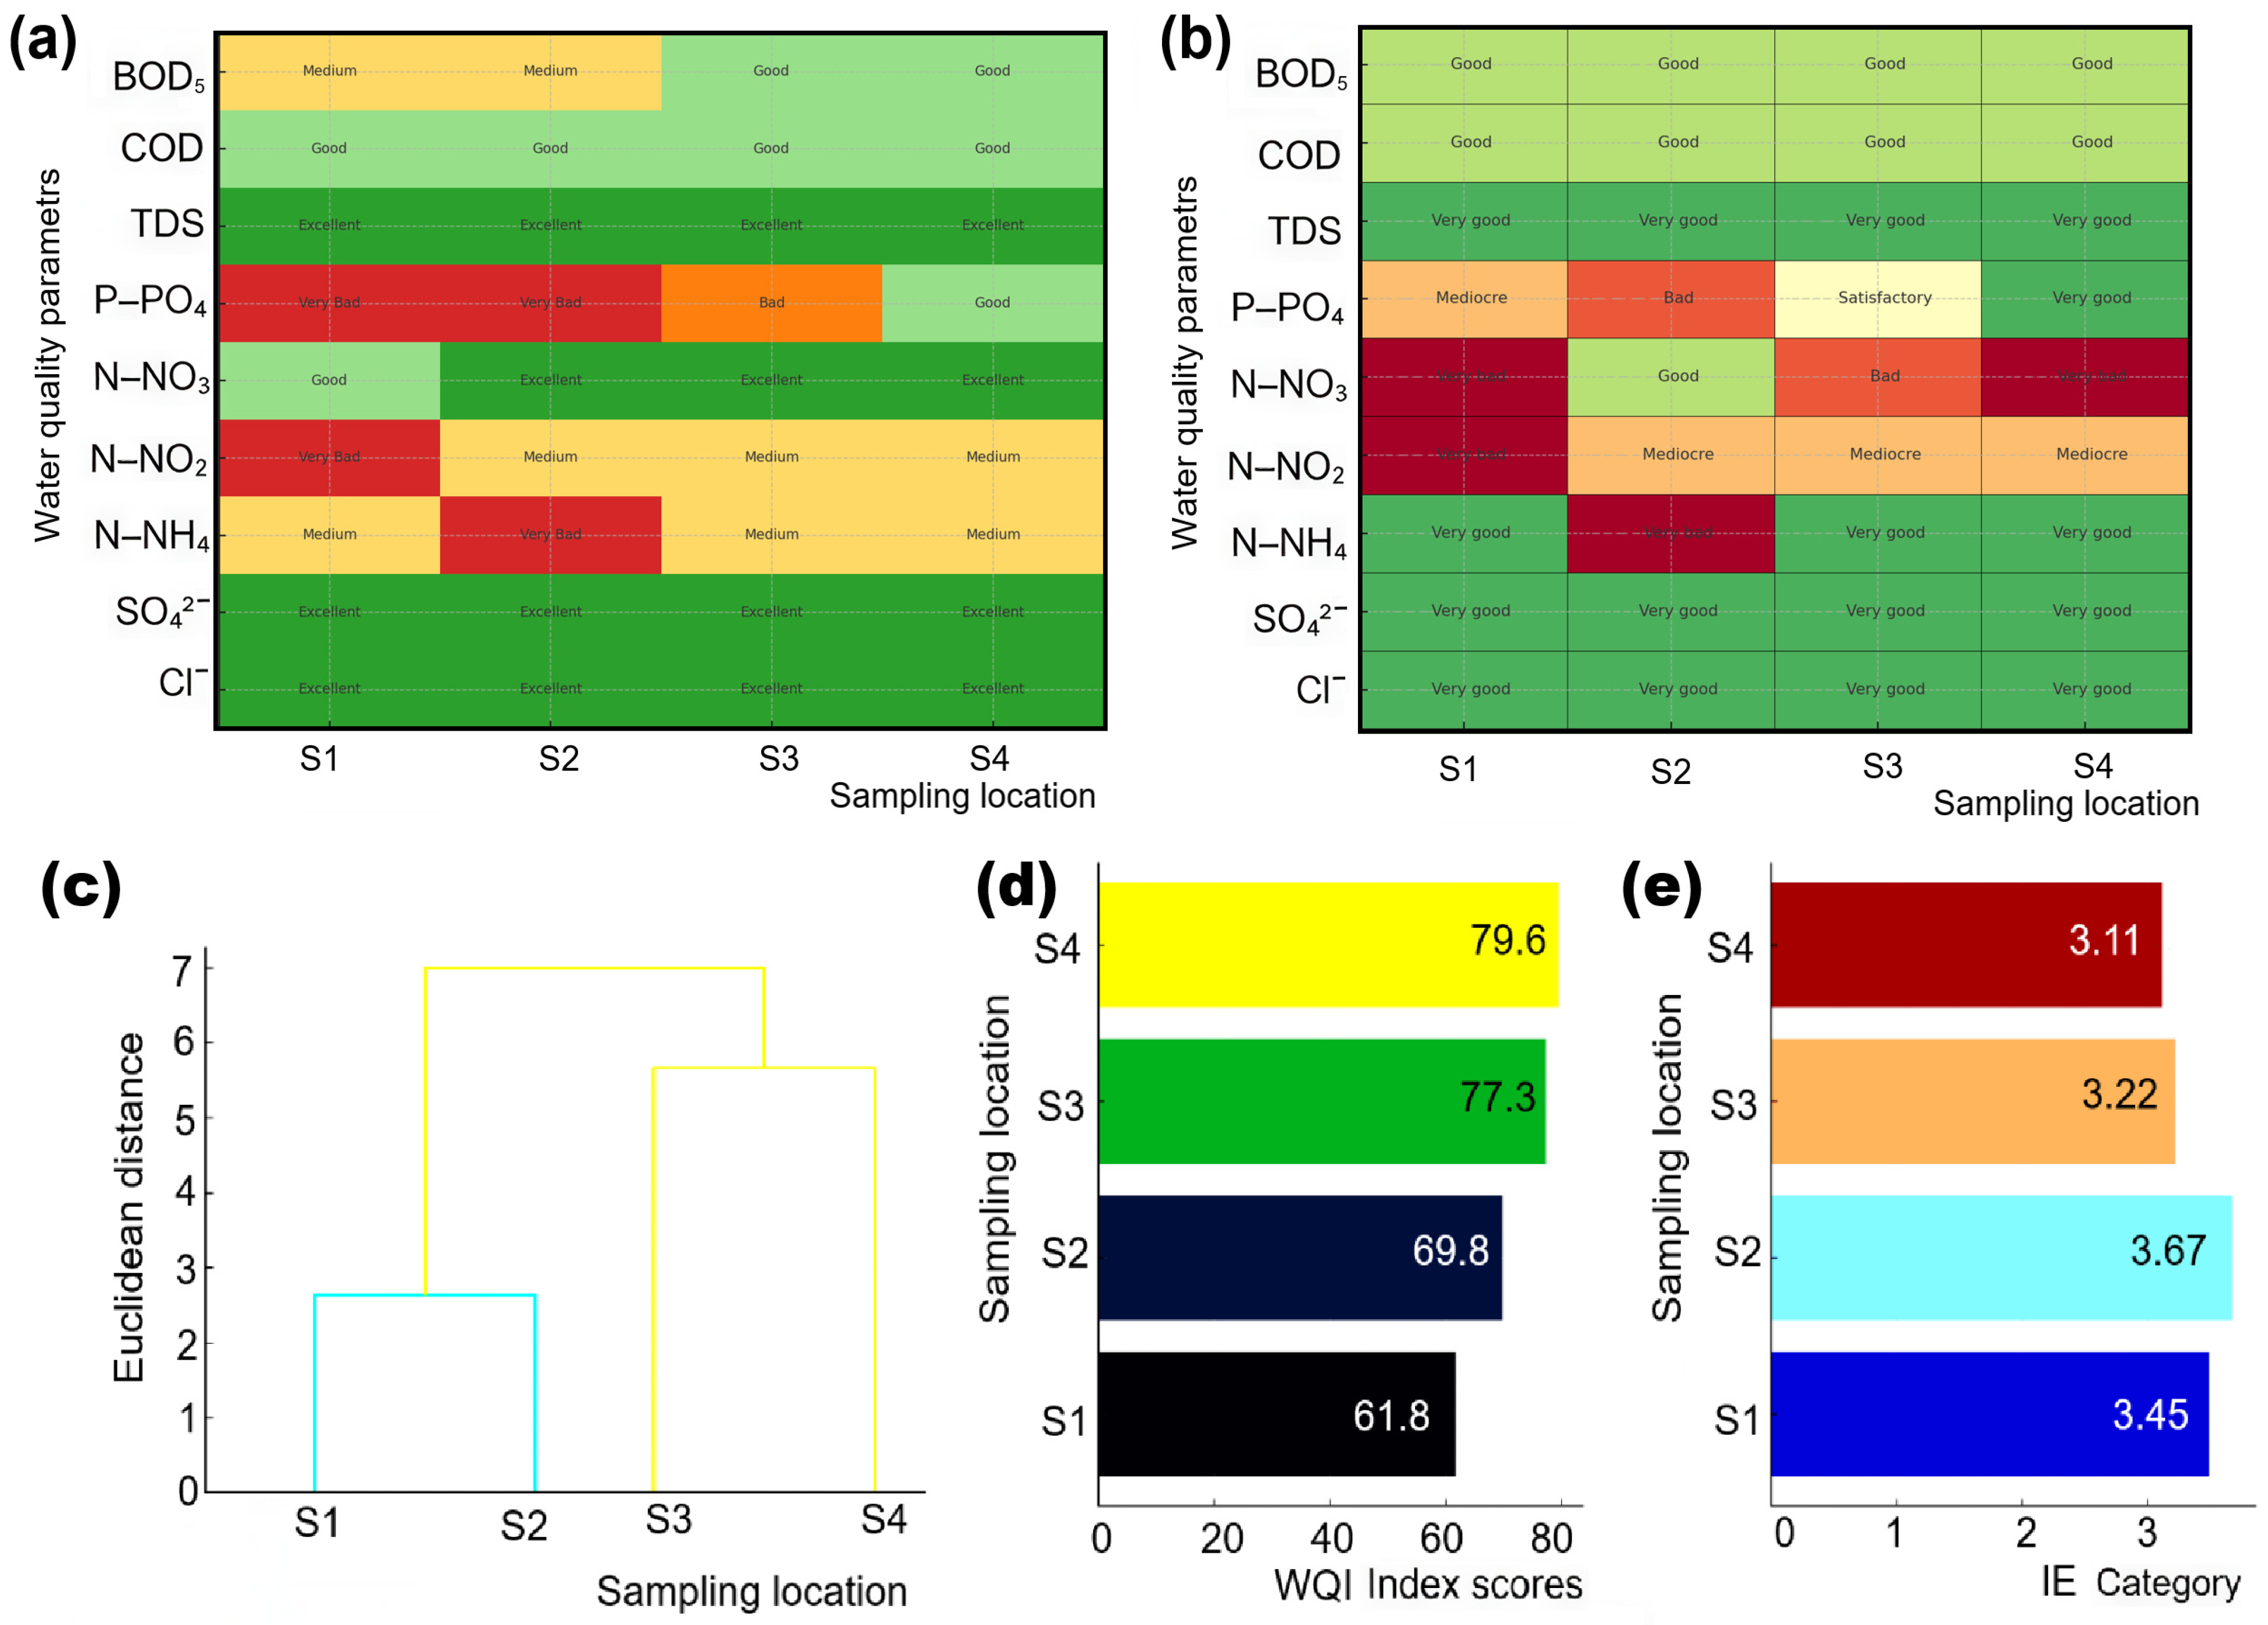
The calculated WQI values for the studied sites (Figure 4a) showed clear spatial differences in water status between the headwaters (S1, S3, S4) and the river confluence zone (S2). For the water of the Styr River (S1), the WQI was within the good range (71–90%), indicating a favourable water condition, although certain deviations were associated with elevated concentrations of BOD5 and N–NO2. For the water of the Ikva River (S3), the WQI corresponded to the medium category (51–70), which is due to the influence of biogenic compounds (N–NH4, P–PO4). In the Western Bug River (S4), the WQI values corresponded to the good category (71–90%). For water at point S2, the confluence of the Styr and Ikva rivers, the WQI was medium (51–70%), where the dominant influence in the formation of values was played by excesses of N–NH4 and P–PO4. The IE analysis for the studied points (Figure 4b) showed discrepancies between the river sources and their confluence zone. For the water of the Styr River (S1), the IE value corresponded to the category of good water quality with moderate deviations due to elevated levels of BOD5, N–NO3 and N–NO2. For the water of the Ikva River (S3), the IE also belonged to the category of good water quality with moderate deviations due to elevated levels of N–NH4, N–NO2 and P–PO4. In both cases, this reflects local biogenic loading. For the water of the Western Bug River (S4) and at point S2 after the confluence of the Ikva and Styr rivers, the IE value corresponded to the category of good water quality, with a slightly elevated concentration of N–NO3.
Figure 4.
The water quality index (WQI) (a), water quality category (IE) (b) and clustering of sampling sitess by similarity of water quality parameters (c), comparison of WQI (d) and IE values (e) at different sites (S1–S4).
The clustering results (Figure 4c) showed that the studied river sections are grouped according to the similarity of water quality parameters, confirming the differences between headwaters and river confluence zones. In the first group of water quality parameters, the Ikva River (S3) and the confluence zone (S2) are distinguished, indicating their similarity in terms of biogenic elements (N–NH4, P–PO4) and organic load (BOD5). This similarity is due to the fact that the Ikva River is the main source of elevated concentrations of these compounds, which remain even after the waters mix in S2. The second group of water quality parameters can be separated: the Styr River (S1) and the Western Bug River (S4), which are characterised by lower concentrations of biogenic elements and more stable mineralisation indicators (TDS, SO42−, Cl−). Although the Styr River (S1) sampling site showed exceedances for BOD5 and N–NO2; overall, this branch is similar to the Western Bug in terms of water quality indicators. Thus, cluster analysis confirmed that water quality formation in the confluence zone (S2) is largely determined by the chemical composition of the Ikva River (S3). At the same time, the headwaters of the Styr River (S1) and the Western Bug River (S4) function as a separate group with relatively cleaner and more stable water conditions. Thus, according to the WQI classification, the headwaters of the Ikva (S3) and Western Bug (S4) rivers are characterised by good water quality, while the headwaters of the Styr (S1) and the confluence zone (S2) are classified as medium (Figure 4d). However, according to the IE, all control points can be classified as category 3, which is characterised as good water quality (Figure 4e).
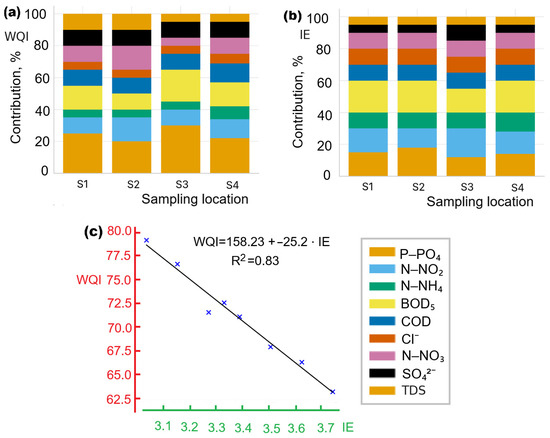
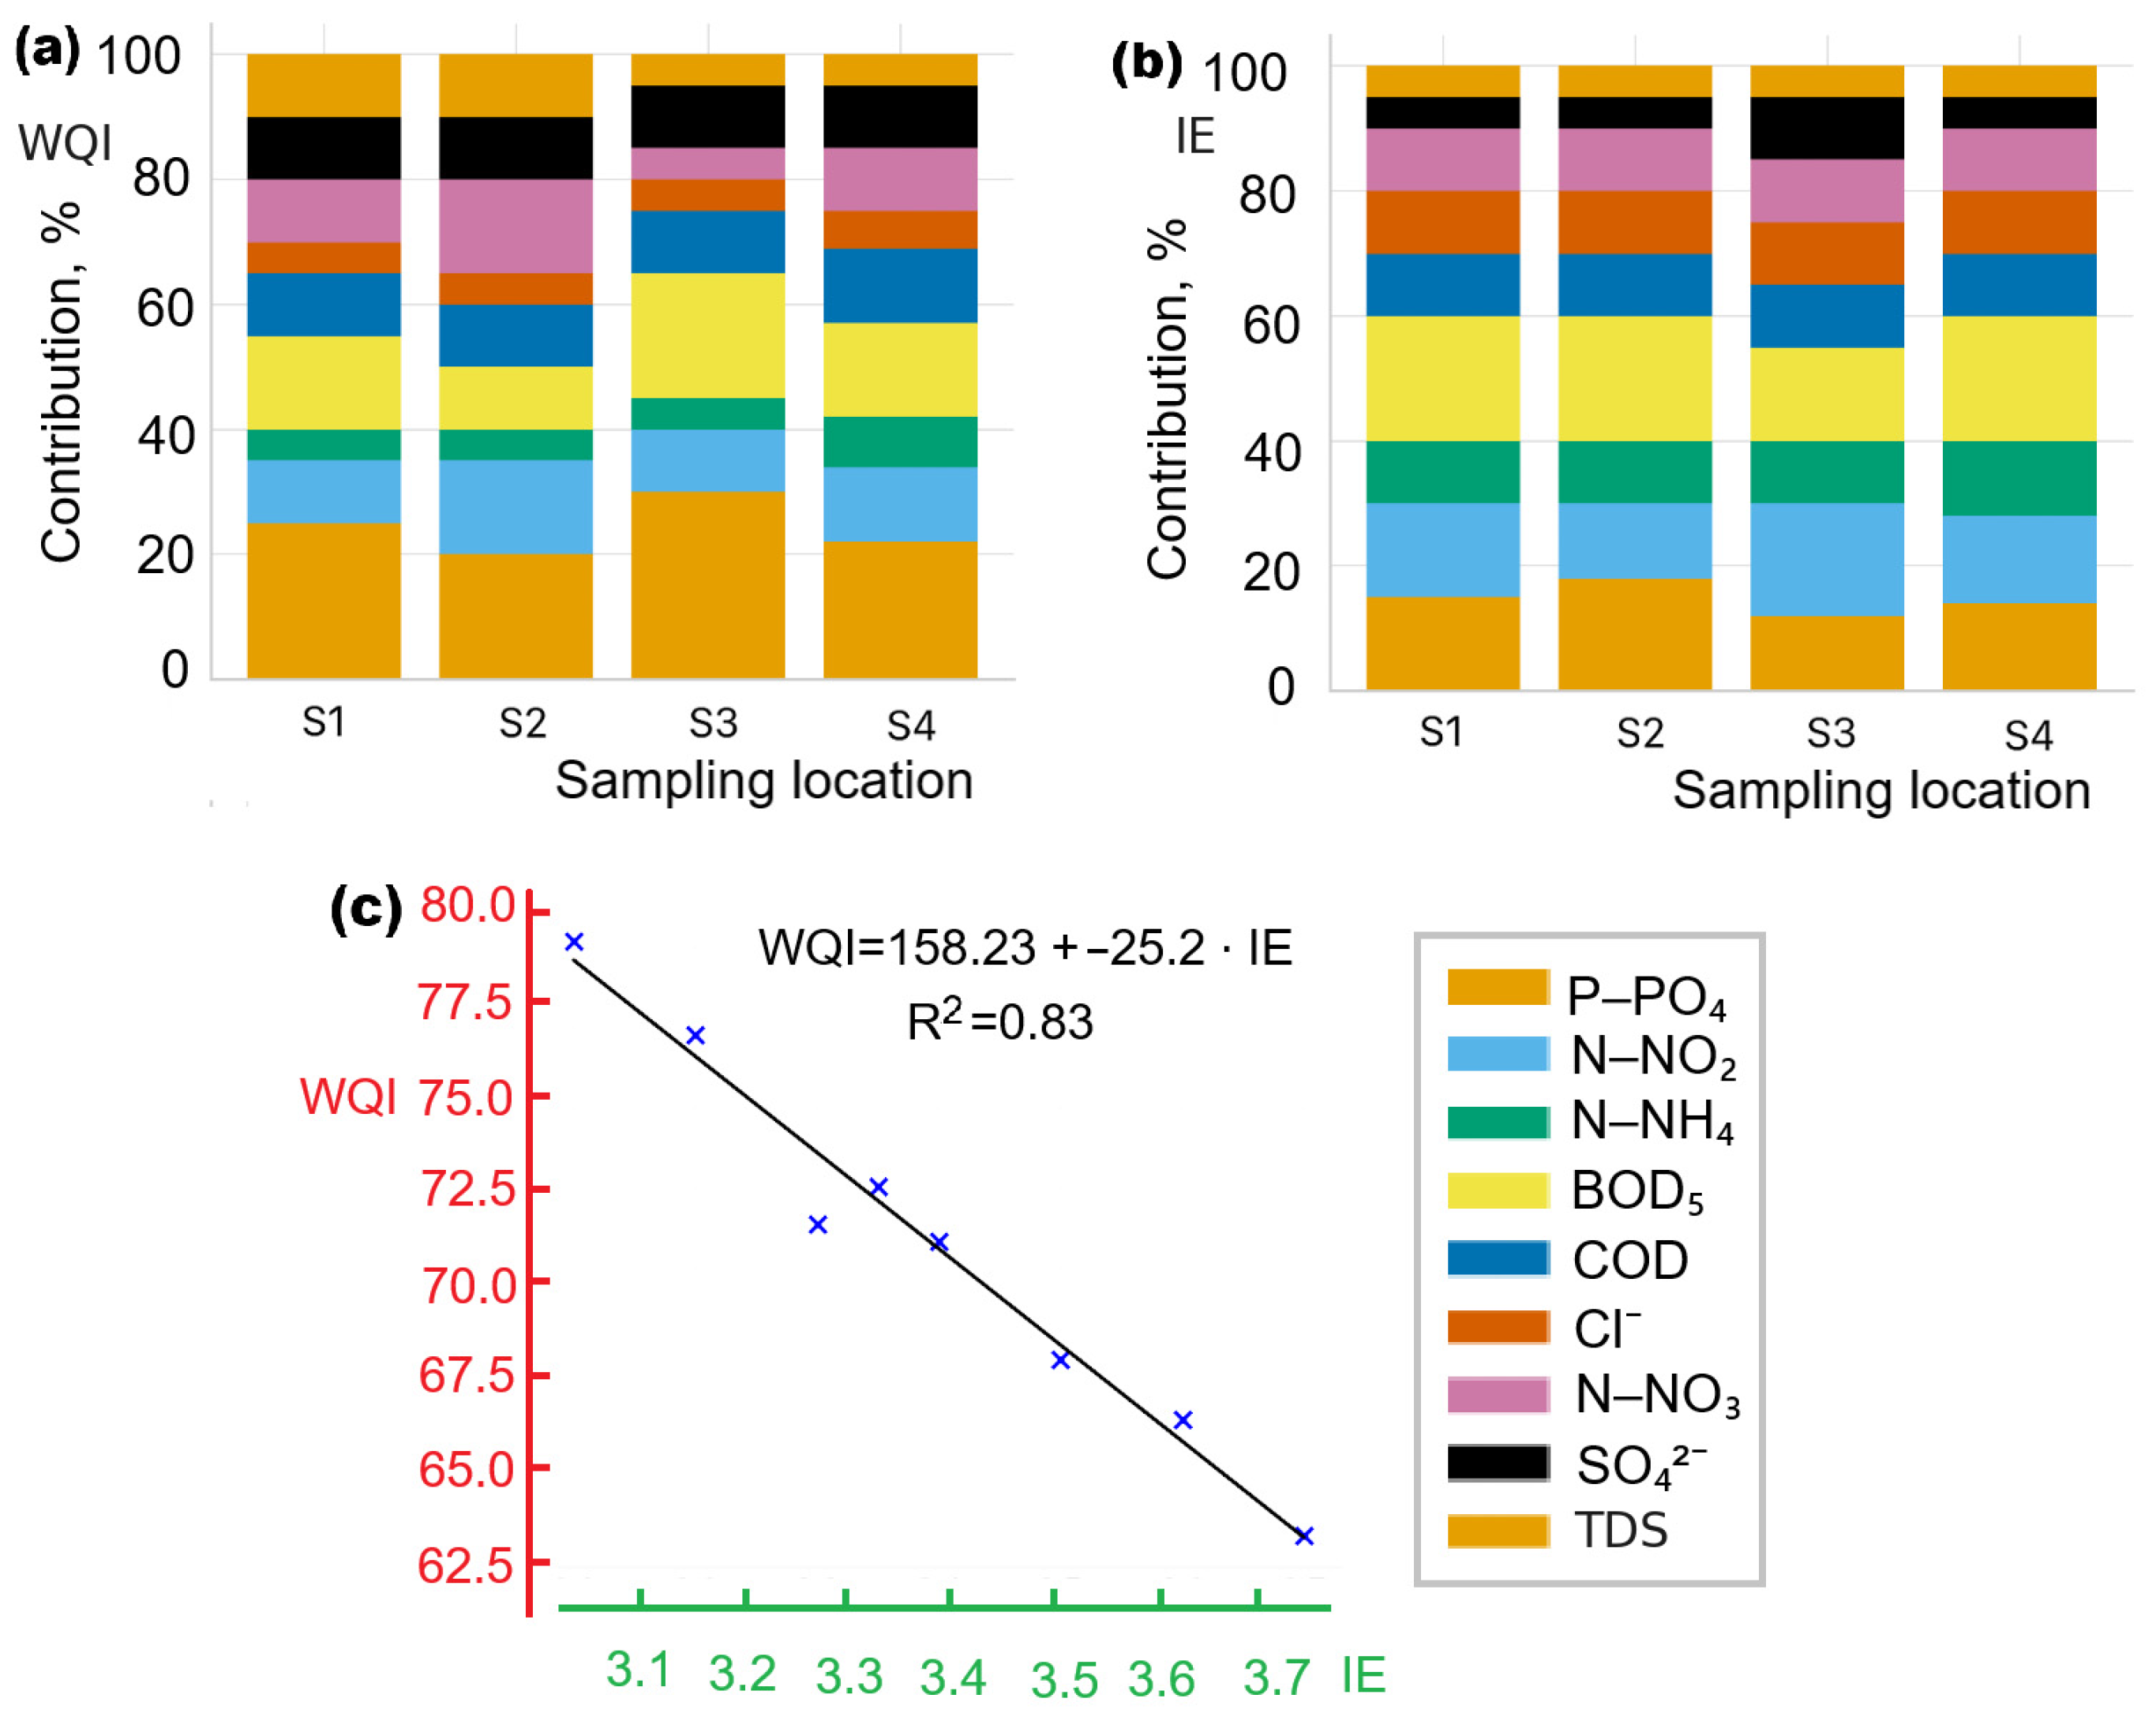
The results of the integrated water quality assessment (Figure 4d,e) show spatial differentiation between international (WQI) and national (IE) classifications. According to WQI levels, at the source of the Styr River (S1), the index was 68.4%, which corresponds to the medium category; at the confluence of the Styr and Ikva rivers (S2) it was 66.1% (medium); at the source of the Ikva River (S3) it was 72.5% (good); at the source of the Western Bug River (S4) it was 74.3% (good). In terms of IE levels, all four control points were classified as category 3 (good water quality): S1—3.1, S2—3.2, S3—3.0, S4—3.1. This indicates that, despite local exceedances of individual water quality parameters, the national assessment system shows consistent stability in quality indicators. Analysis of the contribution of water quality parameter concentrations (Figure 5a,b) showed that the formation of WQI is largely determined by the concentrations of P–PO4 and N–NH4, as well as BOD5, which reflects organic and biogenic loads. For IE, the factors that influence the classification are the concentrations of P–PO4, N–NH4 and N–NO2, which emphasises the dominant contribution of the national classification of biogenic elements. The differences between these classification systems are explained by the methodology of their formation: WQI is based on multi-parameter indexing with weighting coefficients and a five-point scale (from excellent to very bad), which allows even moderate deviations to be recorded [46]. In contrast, IE uses a seven-point scale based on the compliance of actual concentrations with MPC standards [47]. Thus, the international approach better reflects the spatial variability of the condition of sources and confluence zones, while Ukraine’s national approach provides an assessment of water quality compliance with current Ukrainian environmental standards.
Figure 5.
Contribution of water quality parameters to the values of water quality index (WQI) (a), water quality category (IE) (b) and relationship between WQI and IE (c).
Analysis of the relationship between WQI and IE (Figure 5c) revealed an inverse relationship, which is due to the different methodological logic of these approaches. For WQI, an increase in the index value corresponds to an improvement in water quality, while in the IE system, an increase in the category reflects a deterioration in the ecological status. Accordingly, as water pollution increases, there is a decrease in WQI and a simultaneous increase in IE, which forms a negative correlation. The coefficient of determination (R2), which characterises the relationship between WQI and IE, is high (R2 = 0.83), indicating that a significant proportion of the variations in WQI can be statistically explained by the dynamics of IE, despite the difference in scales and standardisation principles. Both indicators consistently reflect the influence of biogenic and organic components on water quality formation, but differ in their sensitivity to spatial variations in parameters. It has been established that under conditions of elevated concentrations of N–NH4 and P–PO4, WQI values show a more pronounced downward trend, while IE at the same points remains stable within the range of good water quality.
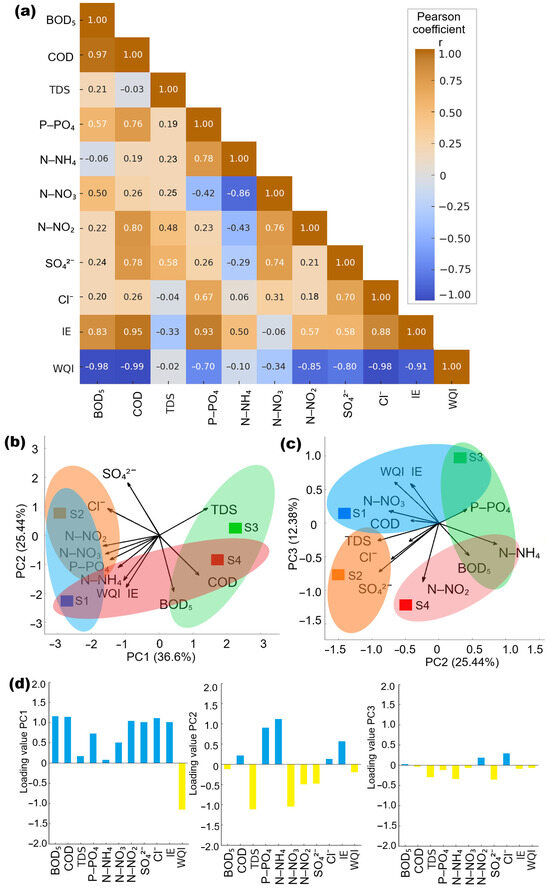
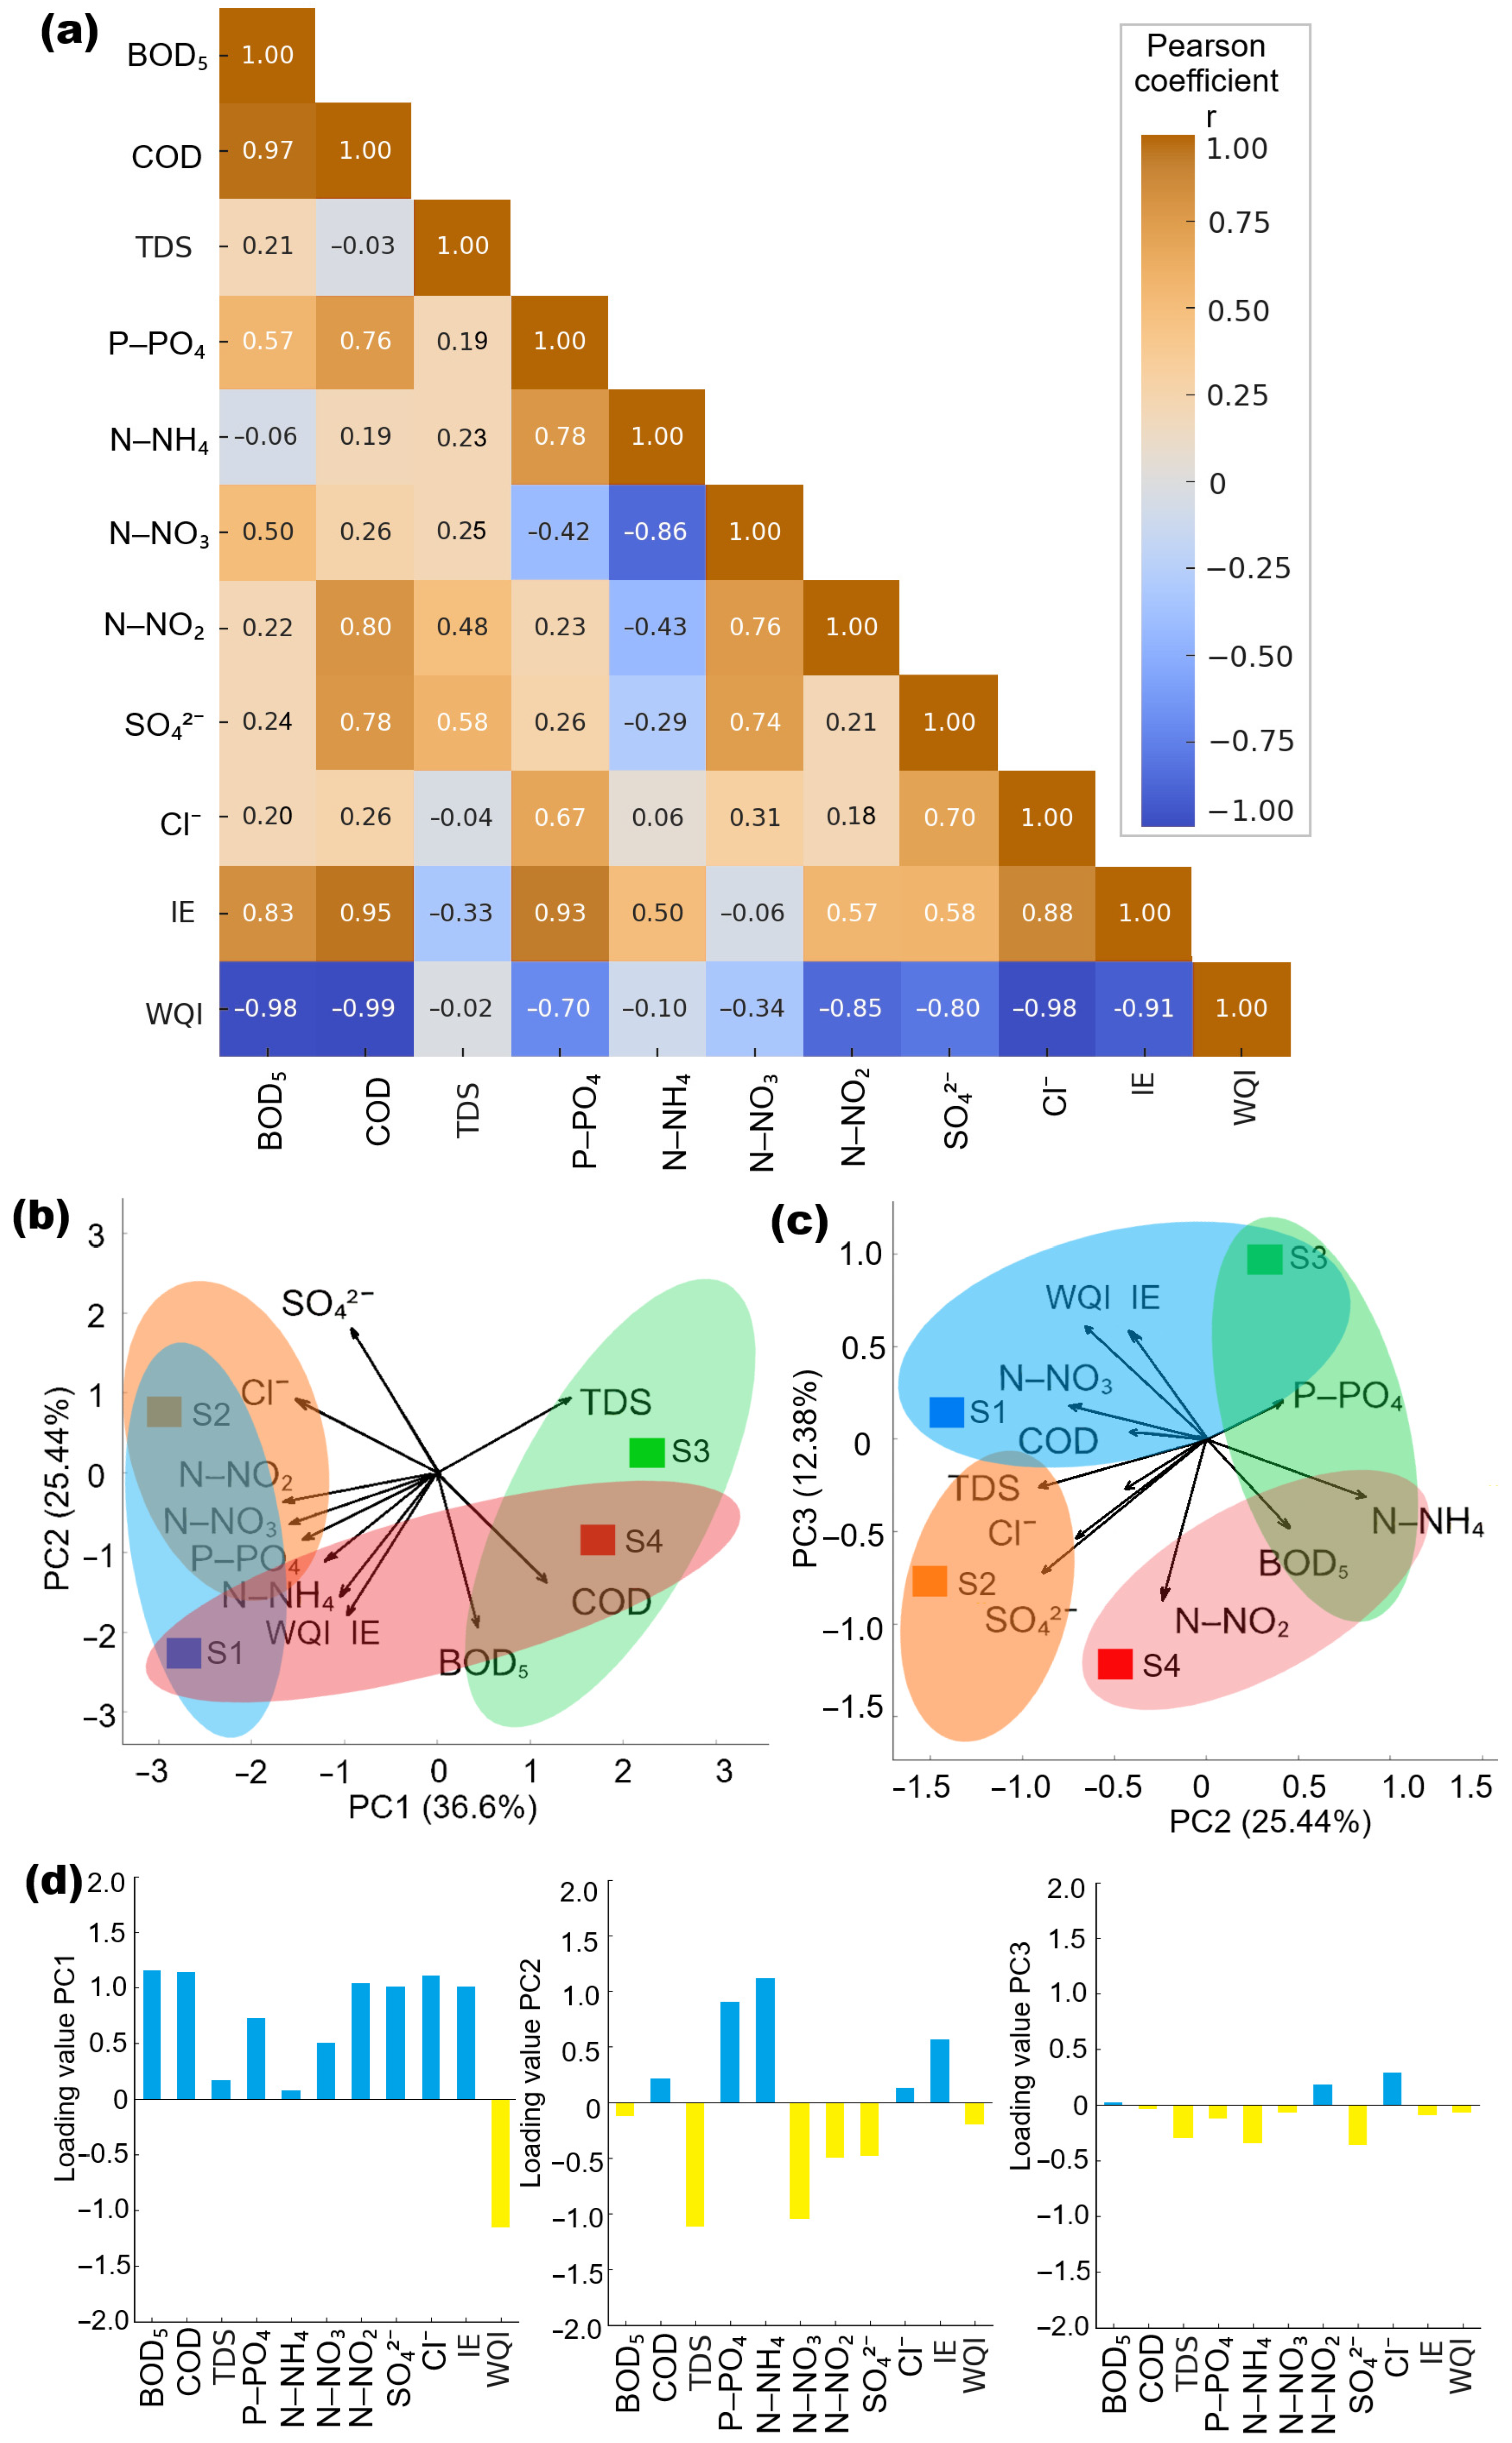
Analysis of Pearson’s rank correlation matrix revealed clearly defined groups of relationships between water quality parameters, reflecting the main determinants of water quality formation in the studied areas (Figure 6a). The highest positive correlations were observed between BOD5 and COD (r = 0.82), which corresponds to a strong positive correlation, confirming the commonality of organic load sources [48,49]. Strong correlations were also found between N–NH4 and P–PO4 (r = 0.76) and between COD and N–NH4 (r = 0.71), indicating a common influx of biogenic substances and organic impurities [50]. Moderate positive correlations were recorded between BOD5 and P–PO4 (r = 0.65) and between COD and P–PO4 (r = 0.59). At the same time, mineralisation parameters (TDS, SO42−, Cl−) show moderate to average correlations (r = 0.42–0.56), reflecting their common geochemical origin. A negative correlation was observed between N–NO3 and N–NH4 (r = −0.48), which is a sign of opposite transformation processes in the nitrogen cycle. Other correlations are weak or absent (r < 0.3).
Figure 6.
Pearson’s rank correlation matrix for water quality parameters (a), principal component analysis of water quality parameters: ordination of sampling sites along PC1, PC2 (b) and PC3 (c) and factor loadings (d) of water quality parameters on the PC1–PC3 contributing to water quality index (WQI) and water quality category (IE) formation.
Analysis of the correlation between water quality parameters and WQI and IE showed that WQI has strong negative correlations with concentrations of P–PO4 (r = −0.79), N–NH4 (r = −0.74) and BOD5 (r = −0.71), which corresponds to a strong correlation. This is consistent with the WQI methodology, as an increase in water quality parameters reduces the integral water quality index. Moderate negative correlations are observed between WQI and COD (r = −0.63) and N–NO2 (r = −0.58). For TDS, SO42−, Cl−, only weak or moderate relationships (r from −0.25 to −0.45) were found, indicating their lesser role in determining WQI values. In the case of IE, a similar set of relationships was found, but with the opposite direction: P–PO4 (r = 0.81), N–NH4 (r = 0.77), BOD5 (r = 0.74) and N–NO2 (r = 0.66) had strong positive correlations, confirming that these parameters increase the environmental assessment category and reflect the deterioration of water quality. COD showed a moderate positive correlation with IE (r = 0.61). At the same time, TDS, SO42− and Cl− showed only moderate or weak positive correlations with IE (r = 0.32–0.44). It is also worth noting the strong negative correlation between WQI and IE (r = −0.91), which is explained by the opposite logic of their calculation: an increase in WQI reflects an improvement in water quality, while an increase in IE causes a deterioration in the national scale. The high level of consistency, confirmed by the value of R2 = 0.83 (Figure 5c), indicates that both WQI and IE describe the same processes, but in different coordinate systems.
Thus, the correlation matrix (Figure 6a) in combination with the contributions (Figure 5a,b) demonstrates that WQI and IE primarily record biogenic and organic loads as the main factor, while mineralisation parameters perform a background function. The PCA results (Figure 6b–d) showed that the first three principal components (PC1, PC2, PC3) describe most of the data dispersion, which allows them to be interpreted as the main axes of water quality formation. PC1 (36.6%) is characterised by high positive loads of N–NH4, P–PO4, BOD5 and COD concentrations, i.e., it reflects biogenic and organic loads. PC2 (25.44%) is associated with mineralisation concentration indicators (TDS, SO42−, Cl−) and, to some extent, N–NO3 concentrations, which correspond to the background geochemical conditions and mineral composition of rivers. PC3 (12.38%) describes to a greater extent the variability of nitrogen forms, in particular N–NO2 and N–NO3, reflecting the peculiarities of the nitrogen cycle and their transformation processes. In Figure 6b, two groups of water quality parameters can be distinguished. The first group corresponds to water quality parameters at the sampling site: the Ikva River (S3) and the river confluence zone (S2), located in the direction of high PC1 loads, indicating a significant influence of biogenic elements and organic matter. This confirms that the Ikva is the main source of elevated concentrations of NH4+ and PO43−, and their contribution remains after the confluence of the Styr and Ikva rivers at point S2. The second group: the Styr River (S1) and the Western Bug River (S4), characterised by a lower PC1 value and a shift along PC2, reflecting the predominance of the mineralisation component (TDS, SO42−, Cl−) at a lower biogenic load. Figure 6c shows an additional distinction between S1 and S4: the Styr River (S1) shows higher concentrations of N–NO3, while in the Western Bug River (S4) they are lower, confirming the differences in nitrogen sources in the studied rivers.
The factor loadings of parameters on the main components (Figure 6d) provide additional information about water quality formation. PC1 has high positive loadings from BOD5, COD, N–NH4 and P–PO4 concentrations (0.72–0.84), indicating the integrated impact of organic load and biogenic elements. This combination clearly reflects the anthropogenic footprint characteristic of the Ikva River basin and explains the grouping of S3 and S2 in this direction. PC2 is formed due to high loads of TDS, SO42− and Cl− (0.61–0.79), which reflects the mineralisation component and geochemical formation of river waters. PC3 is determined primarily by N–NO2 and N–NO3 loads (0.58–0.74), reflecting the peculiarities of the transformation and formation of nitrogen forms at the studied sites. The high contribution of N–NO3 concentrations to PC3 explains the differences between the Styr River (S1), where elevated N–NO3 concentrations were observed, and the Western Bug River (S4), where they were minimal. The formation of the hydrochemical profile of the studied sites S1–S4 is determined by two main axes: (1) biogenic and organic load (PC1), (2) mineralisation and ionic composition (PC2), and PC3 reflects the specifics of the nitrogen cycle. The correlation of these factor loads with the results of the assessment of the contribution of water quality parameters WQI and IE (Figure 5a,b) confirms that it is the biogenic and organic indicators (NH4+, PO43−, BOD5, COD) that are key in the formation of the integral assessments of WQI and IE, while mineral ions play a background role. Thus, PCA allows us to distinguish between two groups of influencing factors: (1) anthropogenic-biogenic load (S3, S2), the source of which is the inflow of biogenic and organic indicators from agricultural and domestic runoff in the basin of the Ikva River Ikva River basin, and (2) background mineralisation load (S1, S4), which reflects natural geochemical processes. Moreover, the PCA groups identified are fully consistent with the clustering results (Figure 4c), where the concentrations of water quality parameters at sites S3 and S2 formed a group with increased biogenic load. In contrast, the concentrations of water quality parameters at sites S1 and S4 are more stable in terms of hydrochemical composition. This also corresponds to the correlation analysis (Figure 6a), which showed a strong correlation between BOD5, COD, NH4+ and PO43− and confirmed their dominant role in the formation of WQI and IE values (Figure 5a,b). Sankey diagram of relationships (Figure 7) summarises the structure of interrelationships established in the study, combining dominant biogenic and organic indicators (N–NH4, P–PO4, BOD5, COD) with the spatial characteristics of sampling points (S1–S4) and their reflection in the values of the WQI and IE indices. At the source of the Styr River (S1), organic indicators corresponding to high and moderate Lnorm levels dominate, together accounting for about 45% of Lnorm, while biogenic elements have a moderate contribution of 15% of Lnorm. The highest total flow intensity is observed at the confluence of the rivers (S2), where P–PO4 and N–NH4 account for more than half of the hydrochemical load (Lnorm = 55%), which is consistent with the lowest WQI value and the highest IE, indicating water quality degradation at the point of flow mixing. At the source of the Ikva River (S3), biogenic elements and organic substances together account for about 60% of Lnorm. In contrast, the Western Bug River (S4) is characterised by minimal flows of biogenic elements N–NH4 (Lnorm = 0.21), P–PO4 (Lnorm = 0.09), which is a low level of Lnorm and a predominance of mineralisation indicators: TDS (Lnorm = 0.98) (very high load), SO42− (Lnorm = 0.68) (high) and Cl− (Lnorm = 0.46) (moderate), which form about 65% of Lnorm. Flows of the Ikva River (S3) and confluence zone (S2) are the most intense, reflecting the accumulation of N–NH4 and P–PO4, identified in PCA as the main component PC1. In contrast, the Styr River (S1) and theWestern Bug River (S4) have weaker links with biogenic elements, but are associated with mineralisation indicators (TDS, SO42−, Cl−), which form the second component PC2.
Figure 7.
Sankey diagram the relationships between water quality parameters, indices (WQI, IE) and sampling locations (S1–S4).
Therefore, it is advisable to use certain sections of the headwaters of the Styr (S1), Ikva (S3) and Western Bug (S4) as reference conditions for further monitoring of the hydrochemical conditions of river systems is appropriate, since it is at these points that the minimum impact of anthropogenic sources of pollution is observed, which meets the reference criteria for chemical components defined by the WFD. The analysis of spatial variations showed that the headwaters of the Styr River (S1) and the Western Bug River (S4) are characterised by low concentrations of biogenic substances (N–NH4, P–PO4) and organic load (BOD5, COD), as well as stable values of mineralisation parameters (TDS, SO42−, Cl−). In contrast, the headwater of the Ikva River (S3) showed elevated levels of N–NH4 and P–PO4, indicating local anthropogenic loading, probably related to agricultural activities. This allows S3 to be considered not as an ideal background, but as a reference site with moderate local influence, which expands the possibilities for monitoring. Site S2, located at the confluence of the Styr and Ikva rivers, does not meet the classic criteria for referentiality due to the cumulative effect of mixing flows and increased concentrations of biogenic elements. However, this site is valuable for tracking the transformation of water from its source to the middle reaches and assessing the contribution of individual tributaries to the overall hydrochemical profile. Although pH and TSS were not directly measured in this study, their importance for the hydrochemical status of headwaters and their interaction with other parameters can be determined from comparable regional data [51], where fluctuations in TSS content are closely related to diffuse runoff and resuspension of fine sediments, leading to local increases in turbidity and potential transport of micropollutants. Similarly, recent studies [52] have shown that moderate changes in pH affect the mobility of nutrients, especially under conditions of seasonal decomposition of organic matter. Moreover, the combined effect of anthropogenic inputs and physicochemical gradients, including pH and TSS, significantly determines the spatial distribution of water quality parameters. Therefore, even without direct measurements, the interaction between pH stability and TSS content can be considered a secondary regulator of hydrochemical conditions, affecting both the bioavailability of metals [53] and the self-purification capacity of water systems under moderate anthropogenic load [54].
In the present study, sampling was conducted during a stable hydrological period to minimize short-term variability and to provide an initial, standardized characterization of headwater conditions. However, long-term and seasonal averaging would allow better discrimination between natural background variability and episodic or climate-driven fluctuations. Future research will therefore focus on extending the monitoring framework to include repeated sampling across different hydrological seasons and years, which will strengthen the validity of reference condition designation in accordance with the principles of the WFD.
In addition, all sites studied meet the category of good water quality according to the Ukrainian IE, and according to the international WQI, sites S3 and S4 are classified as good quality, and sites S1 and S2 as medium. However, this study is based solely on hydrochemical data and therefore does not cover the full range of WFD requirements for reference conditions; in particular, there is no biological assessment, hydromorphological analysis, or long-term observations. Nevertheless, the results obtained are sufficient for the initial selection of potential reference condition sites, but insufficient for their official approval as reference conditions under the WFD without further expansion of monitoring. Biomonitoring, hydromorphological assessment, and long-term observations of water quality parameters are the subject of further research. Moreover, the results obtained from a scientifically sound network of reference conditions sites, which provides a basis for long-term monitoring, assessment of the effectiveness of environmental protection measures, and harmonisation of national approaches to water resource management with international standards [55,56].
In the context of globalization, where transboundary water exchanges, agricultural intensification, and climate variability increasingly shape local ecosystems, such differentiation becomes critical for building adaptive and resilient water governance systems [57,58,59]. From the perspective of the SDGs, particularly Goal 6 (Clean Water and Sanitation) and Goal 15 (Life on Land), these findings demonstrate that preserving the ecological integrity of headwaters is not only a regional task but also a contribution to global sustainability agendas. By integrating water quality indices (WQI, IE) with sustainability-driven policies, Ukraine can strengthen its capacity to harmonize local practices with international frameworks, ensuring that headwater ecosystems serve as reliable baselines for monitoring, management, and long-term resilience. Recent interdisciplinary research highlights that local hydrochemical conditions of river systems are increasingly shaped by global-scale drivers operating across environmental, economic, technological, and social dimensions. Climate-driven alterations of river hydraulics, including shifts in flow regimes, increased hydrological variability, and changes in transport and dilution processes, have been identified as key factors influencing nutrient dynamics and ecological functioning of riverine systems worldwide [2]. At the same time, global economic instability and structural barriers to achieving the SDGs constrain the implementation of long-term, science-based environmental management strategies, particularly in regions with limited institutional capacity [1]. Emerging technological approaches, including the application of artificial intelligence to environmental monitoring and ecosystem management, present new opportunities to enhance the interpretation of complex hydrochemical datasets and support adaptive, data-driven decision-making at regional scales [3]. Importantly, social factors and governance frameworks that aim to promote health, well-being, and environmental equity play a crucial role in ensuring that improvements in water quality translate into tangible societal benefits [4]. Within this broader context, the identification and assessment of hydrochemical reference conditions in river headwaters represent not only a technical task but also a strategic element of sustainable water governance under conditions of climatic uncertainty and global transformation.
4. Conclusions
Research on the headwaters of the Styr (S1), Ikva (S3) and Western Bug (S4) rivers, as well as the confluence of the Styr and Ikva rivers (S2), was aimed at solving four key tasks: determining the hydrochemical status of water according to international and national criteria, comparative assessment of water quality according to WQI and IE indices, identification of dominant factors that form spatial variability of water quality, and justification of the use of sites as reference conditions for further monitoring. Analysis of water quality parameters concentrations showed that headwaters are characterised by good water quality, but with local deviations. In the Styr River (S1), exceedances of environmental standards for BOD5 and N–NO2 were recorded, in the Ikva River (S3)—exceedances for N–NH4, and in the confluence zone (S2)—P–PO4. Moreover, the best indicators were recorded in the Western Bug River (S4), where all parameters complied with both international and national standards. Correlation analysis and PCA revealed that water quality is determined by two main factors. PC1 (36.6%) reflects biogenic and organic loads (N–NH4 = 0.84; P–PO4 = 0.81; BOD5 = 0.78; COD = 0.72), characteristic of sites S3 and S2. PC2 (25.4%) represents mineralisation (TDS = 0.79; SO42− = 0.73; Cl− = 0.61), dominant at sites S1 and S4. A strong negative correlation between WQI and IE confirms the methodological complementarity of the approaches: both indices are sensitive to the same parameters (P–PO4, N–NH4, BOD5), but interpret them on opposite scales. The results confirmed that spatial differences in water quality are determined by the ratio of biogenic and organic components, the magnitude of which is quantitatively described by the normalised load Lnorm. An increase in Lnorm for N–NH4, P–PO4, BOD5, and COD corresponds to a decrease in WQI and an increase in IE, showing that higher biogenic load directly worsens ecological status. Based on the data obtained, the use of sites S1 and S4 as reference hydrochemical conditions with minimal anthropogenic impact is justified, while site S3 is justified as a reference hydrochemical condition with moderate local pollution. Site S2, on the other hand, is recommended as a site for monitoring cumulative effects after mixing headwater flows. The results obtained provide a scientific basis for harmonising Ukrainian approaches to water quality assessment with international standards and for organising long-term environmental monitoring of river systems in Western Ukraine. Integrating water quality indices with sustainability-oriented policies contributes to achieving the SDGs (particularly Goal 6 and Goal 13). Thus, reference hydrochemical conditions in river headwaters should be recognised as essential indicators for sustainable water governance, enabling Ukraine to strengthen its environmental security, enhance resilience, and harmonise local practices with global strategies for sustainable development.
Author Contributions
Conceptualization, O.B. and P.K.; methodology, P.K.; software, P.K.; validation, O.B. and O.T.; formal analysis, O.B.; investigation, O.B., O.T., M.B. and O.K.; resources, O.T.; data curation, O.B.; writing—original draft preparation, P.K. and O.B.; writing—review and editing, O.T., M.B. and O.K.; visualization, P.K.; supervision, O.B.; project administration, O.T. All authors have read and agreed to the published version of the manuscript.
Funding
This research received no external funding.
Institutional Review Board Statement
Not applicable.
Informed Consent Statement
Not applicable.
Data Availability Statement
The data presented in this study are available on request from the corresponding author.
Conflicts of Interest
The authors declare no conflicts of interest.
References
- Stavytskyy, A.; Dligach, A. The Global Economic Model in Crisis: An Analysis of the Obstacles to the Sustainable Development Goals. Sustainability 2025, 17, 8537. [Google Scholar] [CrossRef] [Scilit]
- Nile, B.K.; Al-Saadi, R.J.M.; Abdulameer, L.; Al Maimuri, N.M.L.; Al-Dujaili, A.N. Climate Change Impacts on River Hydraulics: A Global Synthesis of Hydrological Shifts, Ecological Consequences, and Adaptive Strategies. Water Conserv. Sci. Eng. 2025, 10, 48. [Google Scholar] [CrossRef] [Scilit]
- Pimenow, S.; Pimenowa, O.; Prus, P.; Niklas, A. The Impact of Artificial Intelligence on the Sustainability of Regional Ecosystems: Current Challenges and Future Prospects. Sustainability 2025, 17, 4795. [Google Scholar] [CrossRef] [Scilit]
- Lakioti, E.; Pagonis, N.; Flegkas, D.; Itziou, A.; Moustakas, K.; Karayannis, V. Social Factors and Policies Promoting Good Health and Well-Being as a Sustainable Development Goal: Current Achievements and Future Pathways. Sustainability 2025, 17, 5063. [Google Scholar] [CrossRef] [Scilit]
- Cantonati, M.; Poikane, S.; Pringle, C.M.; Stevens, L.E.; Turak, E.; Heino, J.; Richardson, J.S.; Bolpagni, R.; Borrini, A.; Cid, N.; et al. Characteristics, Main Impacts, and Stewardship of Natural and Artificial Freshwater Environments: Consequences for Biodiversity Conservation. Water 2020, 12, 260. [Google Scholar] [CrossRef] [Scilit]
- Tillman, F.D.; Day, N.K.; Miller, M.P.; Miller, O.L.; Rumsey, C.A.; Wise, D.R.; Longley, P.C.; McDonnell, M.C. A Review of Current Capabilities and Science Gaps in Water Supply Data, Modeling, and Trends for Water Availability Assessments in the Upper Colorado River Basin. Water 2022, 14, 3813. [Google Scholar] [CrossRef] [Scilit]
- Alexander, R.B.; Boyer, E.W.; Smith, R.A.; Schwarz, G.E.; Moore, R.B. The role of headwater streams in downstream water quality. J. Am. Water Resour. Assoc. 2007, 43, 41–59. [Google Scholar] [CrossRef] [Scilit]
- Bieroza, M.; Hallberg, L.; Livsey, J.; Prischl, L.A.; Wynants, M. Recognizing agricultural headwaters as critical ecosystems. Environ. Sci. Technol. 2024, 58, 4852–4858. [Google Scholar] [CrossRef] [Scilit] [PubMed]
- Lassaletta, L.; García-Gómez, H.; Gimeno, B.S.; Rovira, J.V. Headwater streams: Neglected ecosystems in the EU Water Framework Directive. Implications for nitrogen pollution control. Environ. Sci. Policy 2010, 13, 423–433. [Google Scholar] [CrossRef] [Scilit]
- Water Framework Directive (WFD). 2000/60/EC: Directive 2000/60/EC of the European Parliament and of the Council of 23 October 2000 Establishing a Framework for Community Action in the Field of Water Policy. Available online: https://www.eea.europa.eu/policy-documents/water-framework-directive-wfd-2000 (accessed on 2 January 2026).
- Salikova, N.S.; Rodrigo-Ilarri, J.; Alimova, K.K.; Rodrigo-Clavero, M.-E. Analysis of the Water Quality of the Ishim River within the Akmola Region (Kazakhstan) Using Hydrochemical Indicators. Water 2021, 13, 1243. [Google Scholar] [CrossRef] [Scilit]
- Puczko, K.; Jekatierynczuk-Rudczyk, E. Extreme Hydro-Meteorological Events Influence to Water Quality of Small Rivers in Urban Area: A Case Study in Northeast Poland. Sci. Rep. 2020, 10, 10255. [Google Scholar] [CrossRef] [Scilit]
- Jiang, Y.; Gui, H.; Yu, H.; Wang, M.; Fang, H.; Wang, C.; Chen, C.; Zhang, Y.; Huang, Y. Hydrochemical Characteristics and Water Quality Evaluation of Rivers in Different Regions of Cities: A Case Study of Suzhou City in Northern Anhui Province, China. Water 2020, 12, 950. [Google Scholar] [CrossRef] [Scilit]
- Setia, R.; Lamba, S.; Chander, S.; Kumar, V.; Singh, R.; Litoria, P.K.; Pateriya, B. Spatio-temporal variations in water quality, hydrochemistry and its controlling factors in a perennial river in India. Appl. Water Sci. 2021, 11, 169. [Google Scholar] [CrossRef] [Scilit]
- Mentzafou, A.; Katsafados, P.; Papadopoulos, A.; Dimitriou, E. Hydrological Regime Alteration Assessment in the Context of WFD 2000/60: A European and Global Review. Sustainability 2023, 15, 15704. [Google Scholar] [CrossRef] [Scilit]
- Lopes Simedo, M.B.; Pissarra, T.C.T.; Mello Martins, A.L.; Lopes, M.C.; Araújo Costa, R.C.; Zanata, M.; Pacheco, F.A.L.; Fernandes, L.F.S. The Assessment of Hydrological Availability and the Payment for Ecosystem Services: A Pilot Study in a Brazilian Headwater Catchment. Water 2020, 12, 2726. [Google Scholar] [CrossRef] [Scilit]
- Biedunkova, O.; Kuznietsov, P.; Korbutiak, V.; Petruk, A.; Gabrielyan, B.; Andreji, J.; Grokhovska, Y.; Konontsev, S. Dominant Meristic Traits of Fish and Their Association with Habitat Water Quality Parameters: A Case Study. Fishes 2025, 10, 561. [Google Scholar] [CrossRef] [Scilit]
- Mishra, B.K.; Kumar, P.; Saraswat, C.; Chakraborty, S.; Gautam, A. Water Security in a Changing Environment: Concept, Challenges and Solutions. Water 2021, 13, 490. [Google Scholar] [CrossRef] [Scilit]
- Popa, V.-I.; Rusu, E.; Chirosca, A.-M.; Arseni, M. Danube River: Hydrological Features and Risk Assessment with a Focus on Navigation and Monitoring Frameworks. Earth 2025, 6, 70. [Google Scholar] [CrossRef] [Scilit]
- Biedunkova, O.; Kuznietsov, P.; Mandryk, O. Study of the dominant modes of formation and variability of potentially toxic element concentrations and their impact on environmental quality. Chemosphere 2025, 388, 144688. [Google Scholar] [CrossRef] [Scilit]
- Gorbachova, L.; Afteniuk, O. Duration of Ice Phenomena and Their Probabilistic Characteristics in the Pripyat River Basin within Ukraine. In Proceedings of the 17th International Conference Monitoring of Geological Processes and Ecological Condition of the Environment, Kyiv, Ukraine, 7–10 November 2023; Volume 1, pp. 1–5. [Google Scholar] [CrossRef] [Scilit]
- Bytsyura, L.; Szczepanik-Scislo, N.; Desyatnyuk, O.; Shakhovska, N.; Scislo, L.; Sachenko, A.; Lototska, O.; Shevchuk, I.; Sofinska, O. Research on Surface Water State for Rivers in Western Ukraine Using Time Series Forecasting Methods. Water 2025, 17, 3148. [Google Scholar] [CrossRef] [Scilit]
- Nekos, A.; Boiaryn, M.; Tsos, O.; Netrobchuk, I.; Voloshyn, V. Determination of the macrophyte index MIR as an indicator of water quality in the Pripet River. Visnyk V. N. Karazin Kharkiv Natl. Univ. Ser. Geol. Geogr. Ecol. 2023, 58, 360–370. [Google Scholar] [CrossRef] [Scilit]
- Tockner, K.; Tonolla, D.; Bremerich, V.; Jähnig, S.C.; Robinson, C.T.; Zarfl, C. Introduction to European rivers. In Rivers of Europe; Elsevier: Amsterdam, The Netherlands, 2022; pp. 1–26. [Google Scholar] [CrossRef] [Scilit]
- DSTU ISO 5667-6:2009; Water Quality. Sampling. Part 6. Guidelines for Sampling from Rivers and Streams (ISO 5667-6:2005, IDT). International Organization for Standardization: Geneva, Switzerland, 2009. (In Ukrainian)
- DSTU 2284:2010; Live Fish. General Technical Requirements. Order of 11.10.2010 No. 456 On Approval of National Standards of Ukraine, Amendments to National Standards and Cancellation of Regulatory Documents. DSTU: Kyiv, Ukraine, 2010. (In Ukrainian)
- SOU 05.01-37-385:2006; Water of Fishing Enterprises. General Requirements and Standards. Ministry of Agrarian Policy of Ukraine: Kyiv, Ukraine, 2006. (In Ukrainian)
- Fujioka, R.S.; Solo-Gabriele, H.M.; Byappanahalli, M.N.; Kirs, M.U.S. Recreational Water Quality Criteria: A Vision for the Future. Int. J. Environ. Res. Public Health 2015, 12, 7752–7776. [Google Scholar] [CrossRef] [Scilit] [PubMed]
- Environmental Protection Agency (USEPA). State-Specific Water Quality Standards Effective Under the Clean Water Act (CWA). 2024. Available online: https://www.epa.gov/wqs-tech/state-specific-water-quality-standards-effective-under-clean-water-act-cwa#tb0 (accessed on 2 January 2026).
- Principato, G.; Viggiani, G. Hydrologic alteration assessment in Mediterranean rivers: Perspective from a South Italy case study. Int. J. River Basin Manag. 2009, 7, 365–377. [Google Scholar] [CrossRef] [Scilit]
- MVV No. 081/12-0106-03; Surface, Underground and Return Waters. Methodology for Measuring the Mass Concentration of Ammonium Ions by the Photocolorimetric Method with Nessler’s Reagent. Ministry of Ecology and Natural Resources of Ukraine: Kyiv, Ukraine, 2003.
- MVV No. 081/12-0310-06; Surface, Groundwater and Return Waters. Methodology for Determining Biochemical Oxygen Demand after n Days (BOD) Using an Oximeter. Ministry of Ecology and Natural Resources of Ukraine: Kyiv, Ukraine, 2006.
- MVV No. 081/12-0651-09; Return, Surface, Underground Waters. Methodology for Measuring the Mass Concentration of Nitrate Ions by the Photocolorimetric Method. Ministry of Ecology and Natural Resources of Ukraine: Kyiv, Ukraine, 2009.
- KND 211.1.4.023-95; Methodology of Photometric Determination of Nitrite Ions with Griess Reagent in Surface and Treated Wastewater. Ministry of Ecology and Natural Resources of Ukraine: Kyiv, Ukraine, 1995.
- MVV No. 081/12-0177-05; Surface, Groundwater and Return Waters. Methodology for Measuring the Mass Concentration of Sulfates by the Titrimetric Method. Ministry of Ecology and Natural Resources of Ukraine: Kyiv, Ukraine, 2005.
- MVV No. 081/12-0109-03; Surface, Underground and Return Waters. Methodology for Determining the Mass Concentration of Dry Residue (Dissolved Substances) by the Gravimetric Method. Ministry of Ecology and Natural Resources of Ukraine: Kyiv, Ukraine, 2003.
- MVV No. 081/12-0005-01; Surface and Treated Wastewater. Methodology for Measuring the Mass Concentration of Dissolved Orthophosphates by the Photometric Method. Ministry of Ecology and Natural Resources of Ukraine: Kyiv, Ukraine, 2002.
- MVV No. 081/12-0004-01; Surface and Treated Wastewater. Methodology for Measuring the Mass Concentration of Chlorides by Argentometric Titration. Ministry of Ecology and Natural Resources of Ukraine: Kyiv, Ukraine, 2002.
- MVV No. 081/12-0647-09; Methodology for Measuring the Mass Concentration of COD in Return, Surface and Groundwater by the Photocolorimetric Method. Ministry of Ecology and Natural Resources of Ukraine: Kyiv, Ukraine, 2010.
- Kocer, M.A.T.; Sevgili, H. Parameters selection for water quality index in the assessment of the environmental impacts of land-based trout farms. Ecol. Indic. 2014, 36, 672–681. [Google Scholar] [CrossRef] [Scilit]
- Gritsenko, A.V.; Vasenko, O.G.; Vernichenko, G.A.; Kovalenko, M.S.; Poddashkin, O.V.; Vernichenko-Tsvetkov, D.Y.; Melnikova, N.V.; Miroshnichenko, O.P. Methods of Environmental Assessment of Surface Water Quality for the Respective Categories; Ukrainian Research Institute of Environmental Problems: Kharkiv, Ukraine, 2012; Available online: http://www.niiep.kharkov.ua/sites/default/files/metodika_2012_14_0.doc (accessed on 2 January 2026). (In Ukrainian)
- Hammoumi, D.; Al-Aizari, H.S.; Alaraidh, I.A.; Okla, M.K.; Assal, M.E.; Al-Aizari, A.R.; Moshab, M.S.; Chakiri, S.; Bejjaji, Z. Seasonal Variations and Assessment of Surface Water Quality Using Water Quality Index (WQI) and Principal Component Analysis (PCA): A Case Study. Sustainability 2024, 16, 5644. [Google Scholar] [CrossRef] [Scilit]
- Benkov, I.; Varbanov, M.; Venelinov, T.; Tsakovski, S. Principal Component Analysis and the Water Quality Index—A Powerful Tool for Surface Water Quality Assessment: A Case Study on Struma River Catchment, Bulgaria. Water 2023, 15, 1961. [Google Scholar] [CrossRef] [Scilit]
- Liu, K.; Yan, H.; Wang, W.; Wang, S.; Wang, Z.; Xiao, Y.; Guo, B.; Wang, J.; Zhang, S.; Zhang, G.; et al. Hydrogeochemical signatures, quality and driving forces of phreatic groundwater in a typical headwater region of the Yellow River watershed. Appl. Water Sci. 2025, 15, 111. [Google Scholar] [CrossRef] [Scilit]
- Gavrilaș, S.; Burescu, F.-L.; Chereji, B.-D.; Munteanu, F.-D. The Impact of Anthropogenic Activities on the Catchment’s Water Quality Parameters. Water 2025, 17, 1791. [Google Scholar] [CrossRef] [Scilit]
- Akhtar, N.; Ishak, M.I.S.; Ahmad, M.I.; Umar, K.; Md Yusuff, M.S.; Anees, M.T.; Qadir, A.; Ali Almanasir, Y.K. Modification of the Water Quality Index (WQI) Process for Simple Calculation Using the Multi-Criteria Decision-Making (MCDM) Method: A Review. Water 2021, 13, 905. [Google Scholar] [CrossRef] [Scilit]
- Biedunkova, O.; Kuznietsov, P.; Grokhovska, Y.; Konontcev, S. Influence of Technological and Environmental Factors on the Major Ion Composition in Cooling Water Discharges of a Nuclear Power Plant. Energy Sci. Eng. 2026, 0, 1–17. [Google Scholar] [CrossRef] [Scilit]
- Du, J.; Yang, X.; Xu, P.; Wan, X.; Wang, P.; Wang, D.; Yang, Q.; Wang, Q.; Razzaq, A. Linking Water Quality Indicators in Stable Reservoir Ecosystems: Correlation Analysis and Ecohydrological Implications. Water 2024, 16, 3600. [Google Scholar] [CrossRef] [Scilit]
- Gad, M.; El Hamed, R.A.; El Fadaly, E.A.; Mousa, I.E.; Gaagai, A.; Aouissi, H.A.; Eid, M.H.; Abukhadra, M.R.; Alqhtani, H.A.; Allam, A.A.; et al. New approach to predict wastewater quality for irrigation utilizing integrated indexical approaches and hyperspectral reflectance measurements supported with multivariate analysis. Sci. Rep. 2025, 15, 16395. [Google Scholar] [CrossRef] [Scilit]
- Alshammari, M.S.; Mohamed, A.H.; Mohamed, S.A.; Ahmed, H.M. An innovative synthesis approach for Na A. Zeolite: A new pathway for enhanced performance, wastewater treatment, and antibacterial applications. PLoS ONE 2025, 20, e0332132. [Google Scholar] [CrossRef] [Scilit] [PubMed]
- Nouayti, N.; Cherif, E.K.; Algarra, M.; Pola, M.L.; Fernández, S.; Nouayti, A.; Esteves da Silva, J.C.G.; Driss, K.; Samlani, N.; Mohamed, H.; et al. Determination of Physicochemical Water Quality of the Ghis-Nekor Aquifer (Al Hoceima, Morocco) Using Hydrochemistry, Multiple Isotopic Tracers, and the Geographical Information System (GIS). Water 2022, 14, 606. [Google Scholar] [CrossRef] [Scilit]
- Mamun, M.; Kim, J.Y.; Kim, J.-E.; An, K.-G. Longitudinal Chemical Gradients and the Functional Responses of Nutrients, Organic Matter, and Other Parameters to the Land Use Pattern and Monsoon Intensity. Water 2022, 14, 237. [Google Scholar] [CrossRef] [Scilit]
- Biedunkova, O.; Kuznietsov, P. Dataset on heavy metal pollution assessment in freshwater ecosystems. Sci. Data 2024, 11, 1241. [Google Scholar] [CrossRef] [Scilit]
- Xiao, C.; Chai, Z.; Chen, D.; Luo, Z.; Li, Y.; Ou, Q.; Zhang, Y. Research on the Influence of River Morphological Changes on Water Self-Purification Capacity: A Case Study of the Shiwuli River in Chaohu Basin. Water 2025, 17, 1694. [Google Scholar] [CrossRef] [Scilit]
- Korbutiak, V.M.; Stefanyshyn, D.V.; Khodnevych, Y.V.; Lahodniuk, O.A.; Martyniuk, V.O. Analysis of current trends in water runoff of the Sluch River in terms of extraterritorial impacts of hydrotechnical construction. In Proceedings of the 5th International Conference on Sustainable Futures: Environmental, Technological, Social and Economic Matters, Kryvyi Rih, Ukraine, 21–24 May 2024; IOP Conference Series: Earth and Environmental Science: Bristol, UK; Volume 1415, p. 012102. [Google Scholar] [CrossRef] [Scilit]
- Biedunkova, O.; Kuznietsov, P. Integration of water management in the assessment of the impact of heavy metals discharge from the power plant with mitigation strategies. Ecol. Indic. 2025, 175, 113618. [Google Scholar] [CrossRef] [Scilit]
- Granata, F.; Di Nunno, F. Pathways for Hydrological Resilience: Strategies for Adaptation in a Changing Climate. Earth Syst. Environ. 2025, 1, 1–29. [Google Scholar] [CrossRef] [Scilit]
- Maldonado Benitez, V.M.; Morales Matamoros, O.; Moreno Escobar, J.J. Towards Resilient Cities: Systematic Review of the Literature on the Use of AI to Optimize Water Harvesting and Mitigate Scarcity. Water 2025, 17, 1978. [Google Scholar] [CrossRef] [Scilit]
- Gopchak, I.; Basiuk, T.; Bialyk, I.; Pinchuk, O.; Gerasimov, I. Dynamics of changes in surface water quality indicators of the Western Bug River basin within Ukraine using GIS technologies. J. Water Land Dev. 2019, 42, 67–75. [Google Scholar] [CrossRef] [Scilit]

Disclaimer/Publisher’s Note: The statements, opinions and data contained in all publications are solely those of the individual author(s) and contributor(s) and not of MDPI and/or the editor(s). MDPI and/or the editor(s) disclaim responsibility for any injury to people or property resulting from any ideas, methods, instructions or products referred to in the content. |
© 2026 by the authors. Licensee MDPI, Basel, Switzerland. This article is an open access article distributed under the terms and conditions of the Creative Commons Attribution (CC BY) license.