


Abstract
The construction sector is central to achieving the objectives of the European Green Deal (EGD). While existing research on transition risks predominantly focuses on project- or firm-level challenges, less is known about the transition risks implied by high-level EU policy documents. This study addresses this gap by systematically analysing 101 EGD-related policy and guidance documents published between 2019 and February 2025. A mixed human–AI content analysis approach was applied, combining human expert manual coding with automated validation using large language models (Kimi K2 and GLM 4.6). The final dataset contains 2752 coded risk references organised into eight main categories and twenty-six subcategories. Results show that transition risks are most frequently associated with environmental, economic, and legislative domains, with Climate Change Impact, Cost of Transition, Pollution, Investment Risks, and Implementation Variability emerging as the most prominent risks across the corpus. Technological and social risks appear less frequently but highlight important systemic and contextual vulnerabilities. Overall, analysis of the EGD policy texts reveals the green transition as being constrained not only by environmental pressures but also by financial feasibility and execution capacity. The study provides a structured, policy-level risk profile of the EGD and demonstrates the value of hybrid human–LLM analysis for large-scale policy content analysis and interpretation. These insights support policymakers and industry stakeholders to anticipate structural uncertainties that may affect the construction sector’s transition toward a low-carbon, circular economy.
1. Introduction
1.1. Context
The construction industry stands at the core of Europe’s climate-mitigation and resource-efficiency agenda. Buildings and infrastructure account for around 40% of final energy demand and related greenhouse-gas (GHG) emissions, absorb roughly half of all raw materials extracted in the EU, and generate nearly a third of the total waste stream through construction and demolition activities [1]. Policymakers have therefore framed the transformation of the sector as a shift from a linear “take–make–dispose” model to a circular and regenerative model that maximizes material value, reduces embodied carbon, and safeguards natural capital across the life cycle of built assets [2]. At the international level, the Paris Agreement (2015) commits almost 200 countries to limiting global warming to well below 2 °C, with efforts to pursue 1.5 °C [3]. Similarly, the 2030 Agenda for Sustainable Development emphasizes sustainable consumption and production (SDG-12) and resilient infrastructure (SDG-9) [4]. Within the EU, these ambitions are embedded in a dense policy framework. The European Green Deal [5] aims for climate neutrality by 2050, with a binding intermediate target of at least a 55% reduction in GHG emissions by 2030 from 1990 levels under the Fit-for-55 package [6]. The revised Circular Economy Action Plan [7] identifies construction as one of seven resource-intensive value chains where EU action is most urgent. Complementary instruments such as the EU Taxonomy and the Level(s) framework provide shared metrics for circularity and life-cycle performance [8]. Most recently, the recast of the Construction Products Regulation [9] has strengthened requirements for durability, repairability, recycled content, and digital product passports, underscoring a regulatory shift toward circular business models within the construction ecosystem [10].
Despite this strong policy architecture, the transition of the construction sector remains gradual and uneven. Empirical studies repeatedly highlight a range of risks that slow down progress, including economic risks (e.g., high upfront costs, uncertain returns), technical risks (e.g., performance of secondary materials), regulatory risks (e.g., fragmented standards), and market risks (e.g., volatile demand), which collectively undermine investor and industry confidence [11,12]. Recent reviews confirm that technical constraints, weak regulation, and low market maturity continue to hinder circular construction adoption at scale [13,14]. These risks intersect with broader systemic uncertainties such as global supply chain disruptions, trade dependencies, and evolving social expectations, all of which complicate the pathway to circular and climate-neutral construction [15].
Against this backdrop, this paper provides a comprehensive assessment of the transition risks alluded to in recent EU policy documents and industry guidance under the European Green Deal (EGD). Although the EGD spans many sectors, construction is one of its most heavily regulated and directly affected domains. It is designated as a priority value chain in the Circular Economy Action Plan and faces multiple cross-cutting requirements on carbon, materials, waste, and energy performance. For this reason, focusing on construction is intentional and analytically appropriate for examining transition risks in depth. Many transition-related risks identified in broad EGD documents such as investment uncertainty, regulatory change, supply chain dependencies, and technological readiness cascade into construction because the sector depends on these wider policy settings. Accordingly, this study analyses risk signals within the full EGD corpus and interprets their implications for the construction sector, rather than limiting the analysis only to documents explicitly labelled as “construction policy”. The study maps the typologies of risks, evaluates their prevalence across documents, and discusses their potential implications for construction sector actors. By presenting this evidence, the paper seeks to contribute to ongoing discussions on risk management in the transition toward a low-carbon, circular economy.
The novelty of this study lies in shifting the analysis of transition risks from project- and firm-level assessments to the level of EU policy discourse. While prior studies primarily examine operational, organisational or technological risks, this work systematically analyses how such risks are implied within the EGD corpus. By combining manual qualitative coding with LLM-based validation, the study also offers a new methodological contribution and a policy-level perspective that has not been addressed in previous research.
Building on the above, this study is guided by the following research question:
How are transition-related risks implied and framed within the EGD policy corpus, and what do these patterns reveal about the risk landscape affecting the construction sector?
1.2. The Construction Sector and the Circular Economy
Construction is highly material intensive—it uses more than half of all the steel produced in the world and over 3 billion tons of raw materials annually [16]. Due to the continuously growing demand, the built environment has become a significant repository of the virgin resources extracted from the ground [17,18]. The further reliance on non-renewable inputs will lead to future scarcity, essentially making the current buildings and infrastructure the temporary warehouse of the material provision of the future [19]. Waste generation is a reflection of resource consumption. The world has approximately 2.01 billion tons of solid-waste arisings, and this is expected to grow to 3.4 billion tons by the year 2050 [20]. Of this amount, 40% is estimated to be due to construction and demolition activities [21]. The common Construction and Demolition Waste (CDW) streams, such as concrete, asphalt, glass, plastics, and asbestos, generate landfill pressures, land and mineral resource depletion, and increase ecosystem degradation by means of high CO2 emissions and air–soil–water pollution [22].
Although the effects of such economic, social and environmental changes are deep, the studies on the ways to incorporate circular economy (CE) concepts in construction are still scarce [23]. The industry continues to work in a linear take-make-use-dispose paradigm that promotes high resource flows and low recovery [24]. CE, by contrast, provides a regenerative system based on the 3R hierarchy, reduce, reuse, recycle, which is meant to close the material loops and to maximize residual value and resource efficiency [25]. The rising interest in the availability of raw materials and environmental externalities has thus placed the concept of circular construction on the policy and research agendas in all parts of the world [26,27].
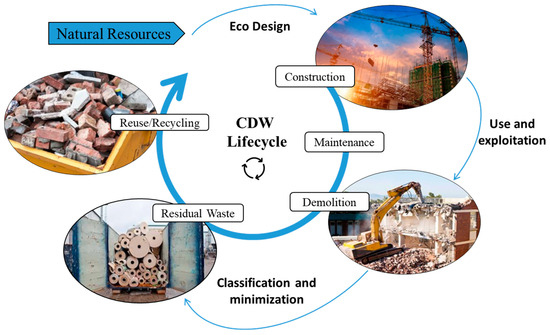
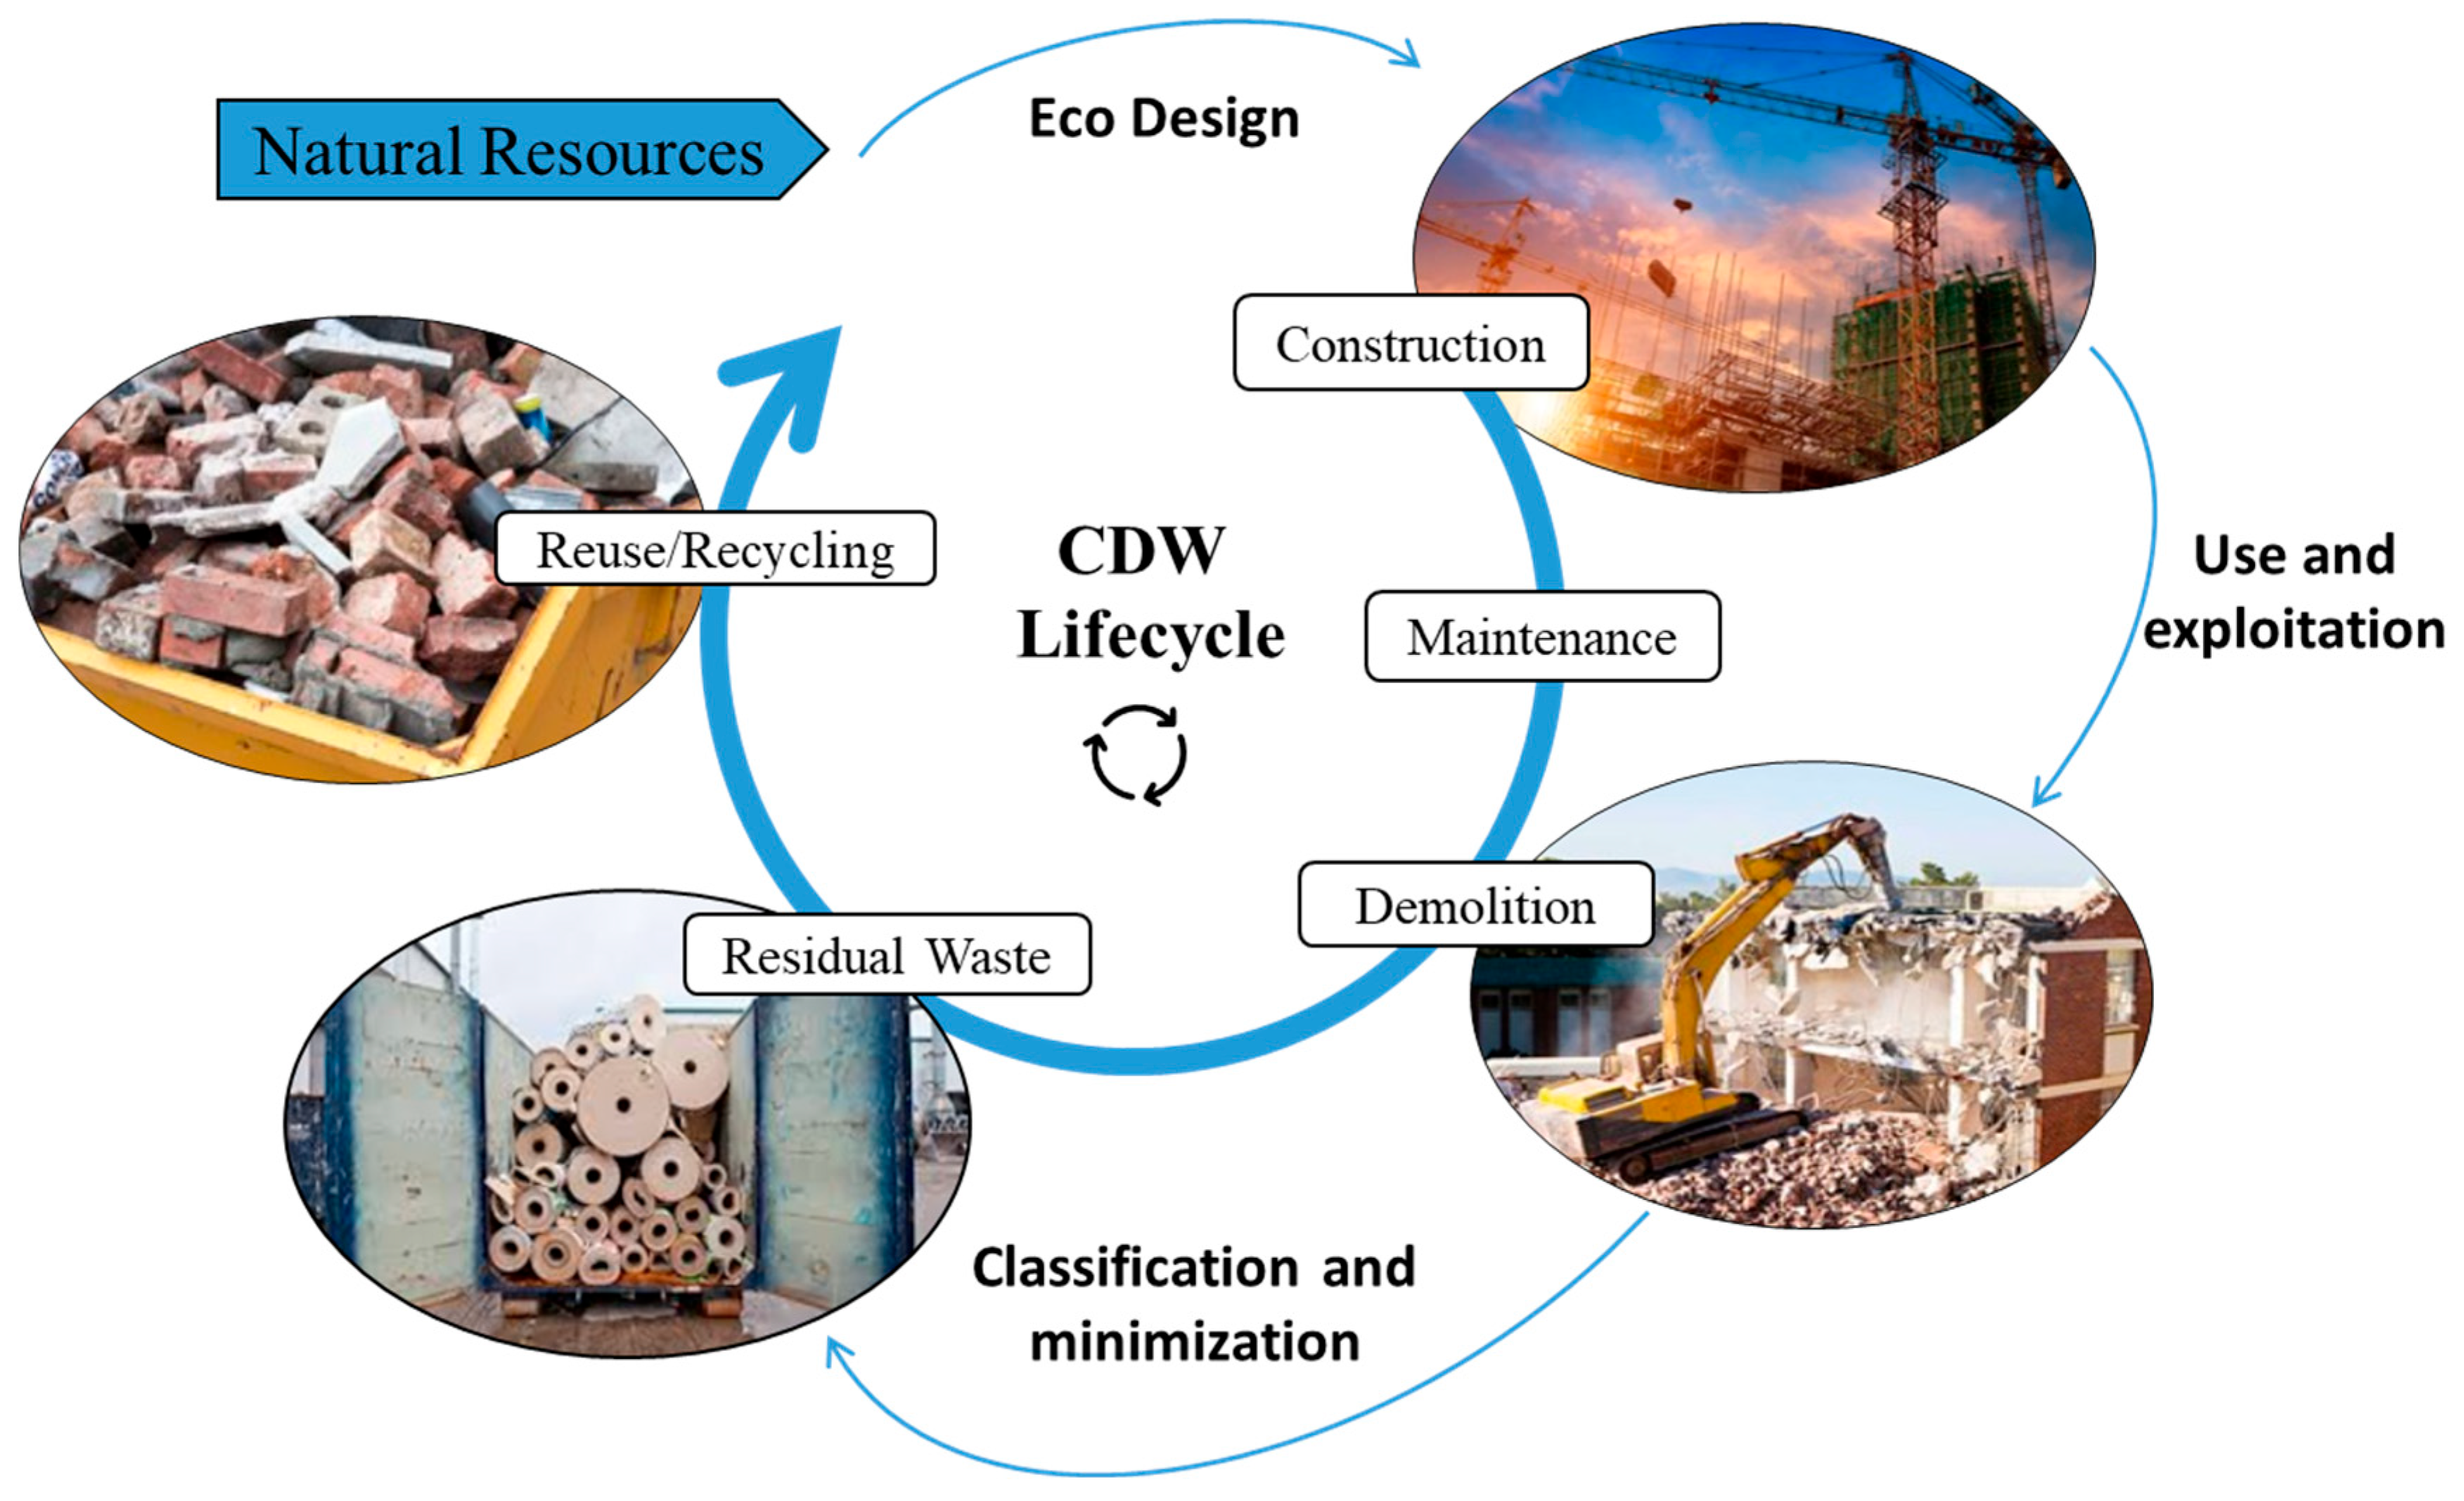
Figure 1 emphasizes the importance of embedding CE principles across all major stages of the building lifecycle to minimize waste generation and enhance the efficient use of resources. As shown in the figure, circular construction refers to an infrastructure system that is conceived, designed, built, maintained, operated, and eventually deconstructed in alignment with the regenerative, closed-loop philosophy of the CE framework [26]. Moreover, integrating CE strategies during the early design stages and performing a Life Cycle Assessment (LCA) of the project can effectively demonstrate the advantages of material reuse and the reduction in raw resource consumption, thereby mitigating negative environmental impacts [28]. Although the circular model aims to minimize resource inputs, most construction value chains still require a share of external virgin material; current studies indicate that circular construction loops typically achieve recovery rates well below 100%, necessitating supplementary resource inflows.
Figure 1.
Circular economy in construction sector: Adapted from [28].
1.3. Defining Risk
The concept of risk has been interpreted in multiple ways across disciplines. Traditionally, risk has been associated with the possibility of loss, harm, or exposure to uncertainty [29] (p. 21), [30]. Financial considerations of risk often refer to the correlation between risk and return, extending this understanding to include potential gains, and emphasizing that risk represents both opportunity and threat. In the international risk management standard ISO 31000:2018 [31], risk is defined as “the effect of uncertainty on objectives,” highlighting its dual nature and the role of incomplete knowledge in shaping outcomes. Over time, the perception of risk has evolved from being viewed as an external hazard to something that can be anticipated, measured, and managed. As [32] suggests, the notion of risk reflects humanity’s growing aspiration to control the future rather than submit to fate. In the context of modern complex systems, this aspiration has become increasingly challenging. Reference [33] describes today’s interconnected global networks such as energy, finance, and infrastructure as prone to cascading or “hyper-risks,” where small disruptions can trigger widespread consequences.
In the sustainability and climate transition literature, “transition risks” refer to the potential negative impacts arising from structural and policy changes aimed at decarbonization [34,35]. These include shifts in regulation, market preferences, technology, and social expectations. For the construction industry, such risks are particularly salient due to its dependence on complex supply chains, long asset lifecycles, and sensitivity to evolving environmental standards [36,37]. Understanding how these transition risks are framed and interpreted in policy documents is therefore essential for navigating the shift toward a low-carbon, circular economy.
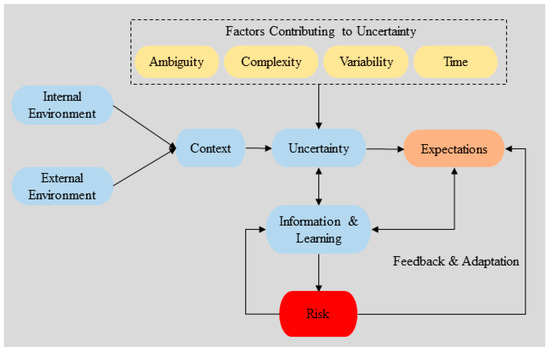
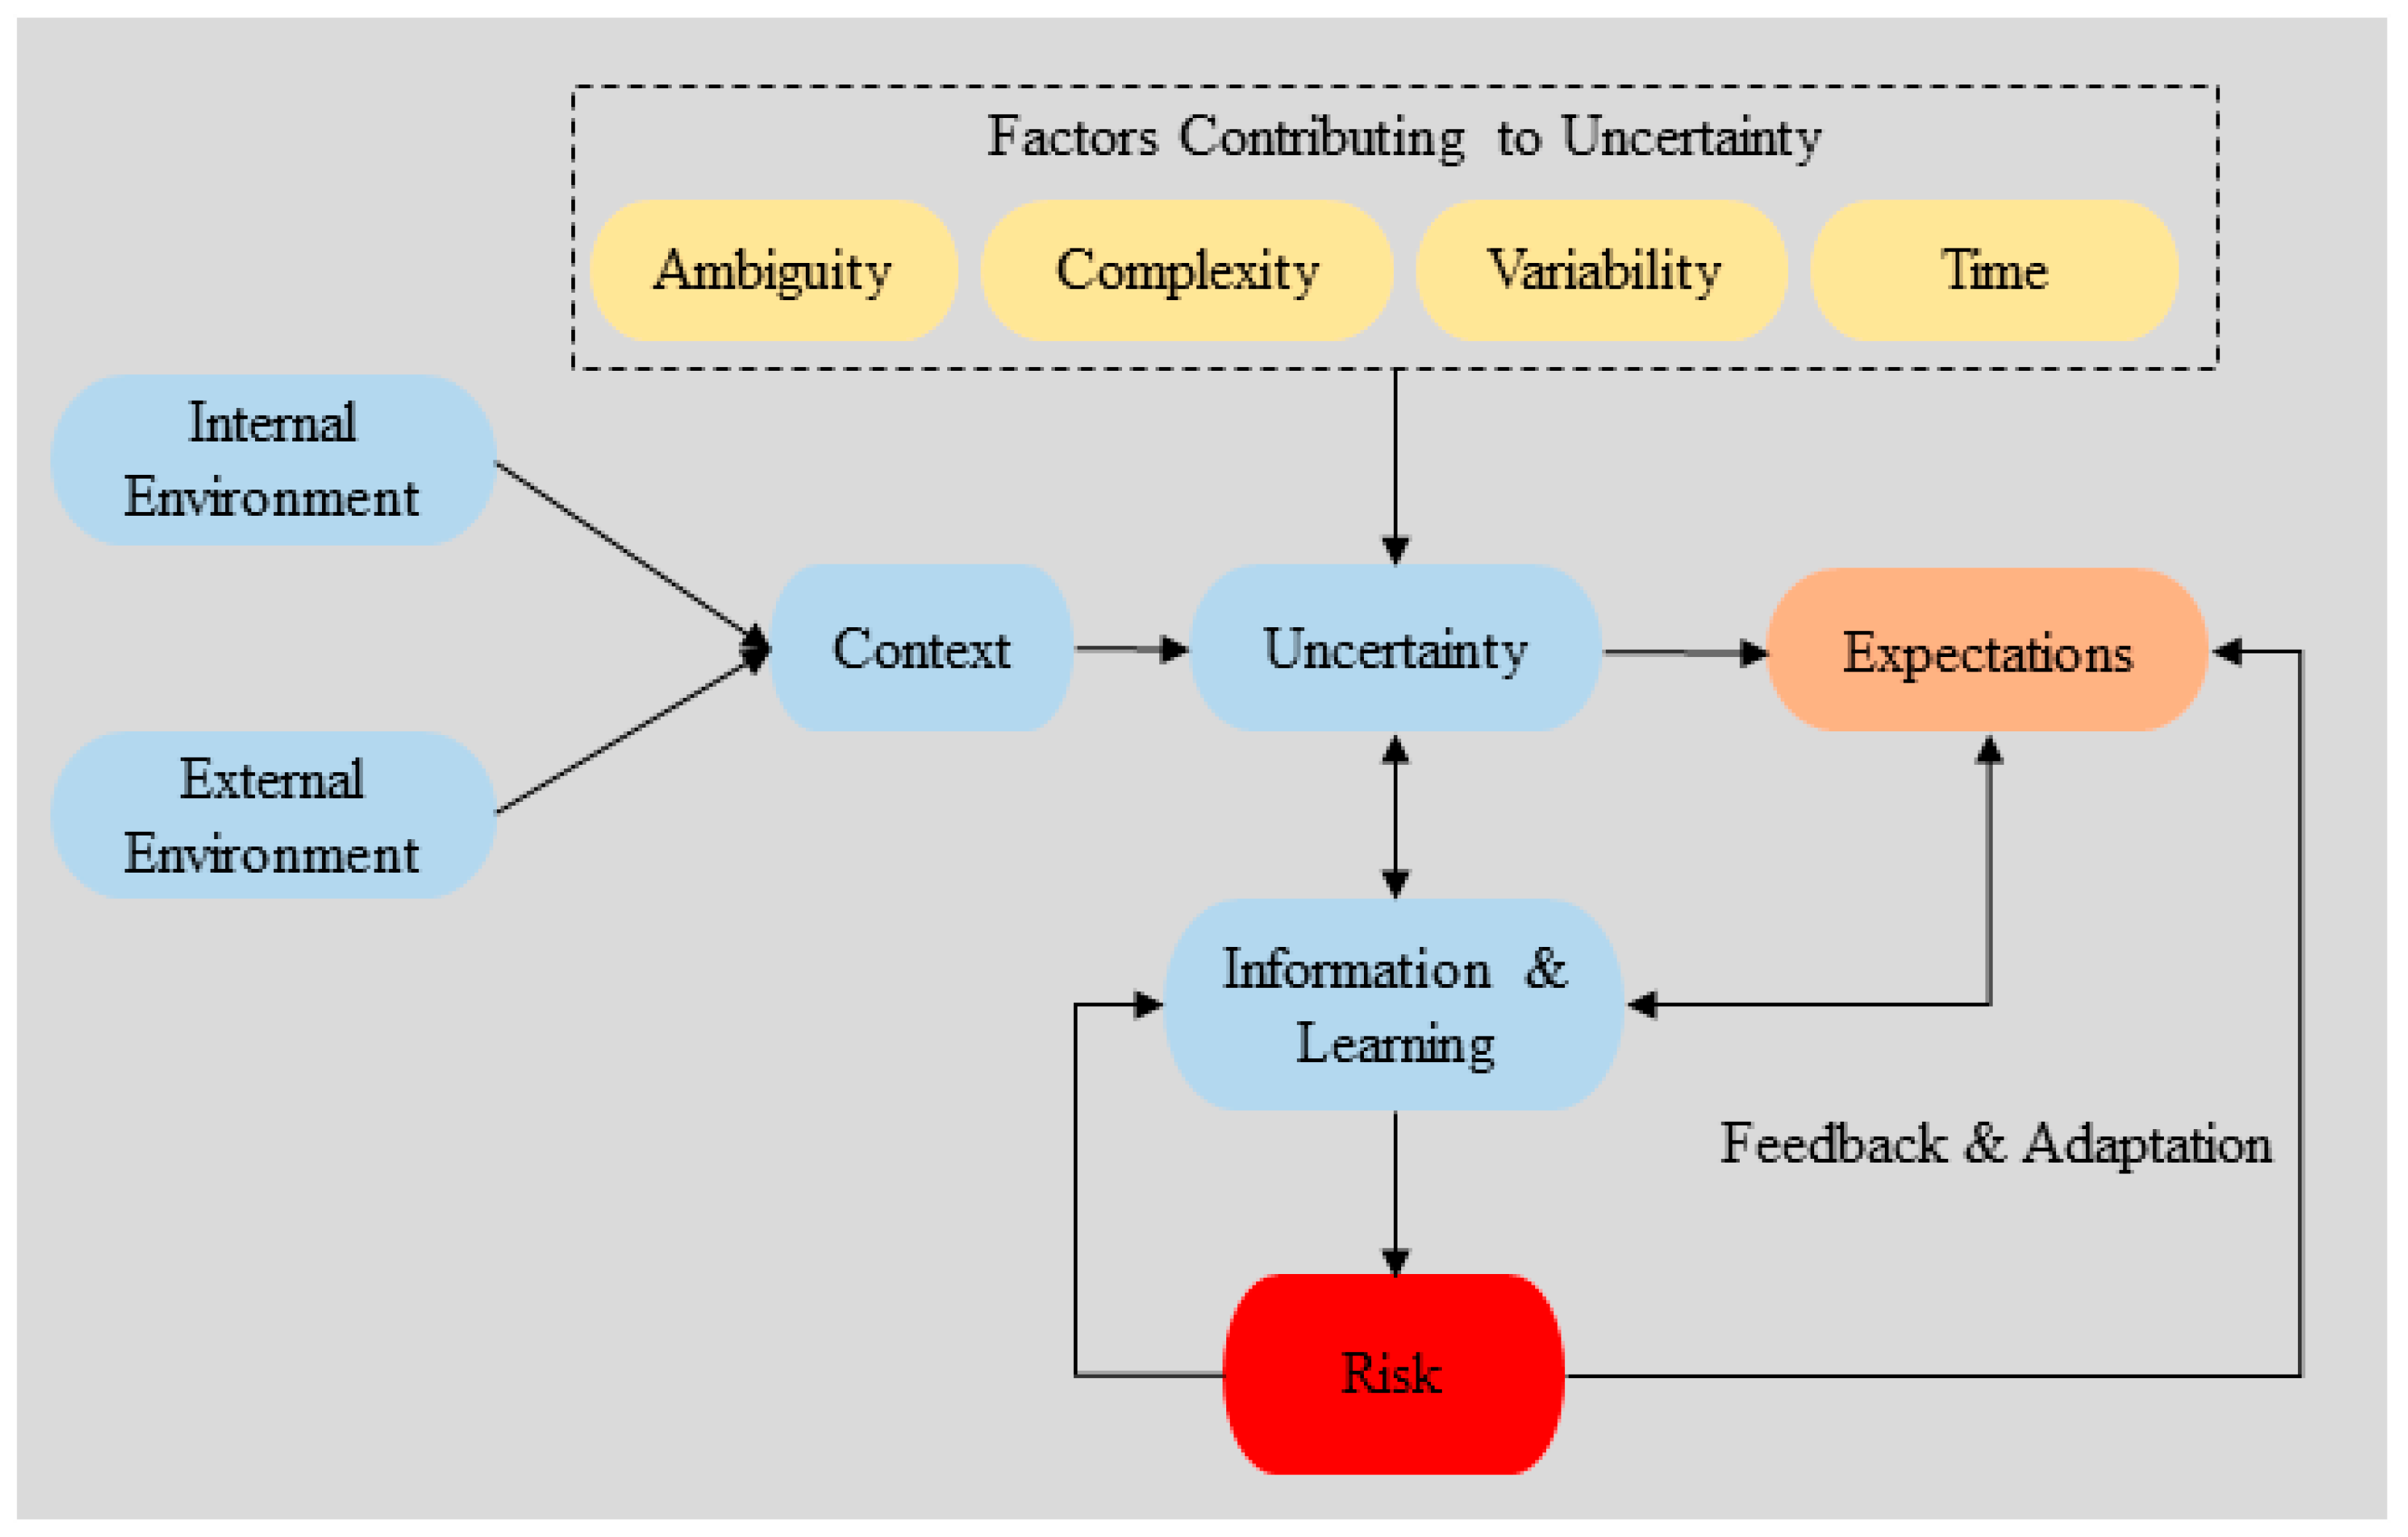
Figure 2 presents an integrated conceptualisation of risk that traces the progression from contextual conditions to uncertainty, expectations, and ultimately the manifestation of risk. The model aligns with ISO 31000:2018 and contemporary risk scholarship, emphasising that uncertainty emerges from dynamic interactions among multiple environmental factors rather than from any single source. In this model, context is formed through the combined influence of the internal environment (such as organisational structures, resources, culture, and capabilities) and the external environment (including regulatory requirements, market conditions, and socio-political forces). This contextual foundation shapes how information is interpreted and how learning processes develop over time. As organisations gather new information and enhance their understanding, knowledge accumulates and feeds back into the evolving context. Uncertainty arises within this context and is shaped by several key characteristic’s ambiguity, complexity, variability, and time. These characteristics collectively influence the extent to which future events, conditions, or outcomes can be anticipated with confidence. Rather than functioning independently, they interact and compound one another, thereby amplifying or moderating the level of uncertainty in decision-making situations. Uncertainty then influences stakeholder expectations, which may relate to safety, schedule, cost, performance, carbon targets, or regulatory compliance. The interaction between uncertain conditions and these expectations gives rise to risk, understood here as the potential for deviation from expected outcomes, encompassing both potential losses and potential opportunities.
Figure 2.
Conception of Risk: inspired by [33].
The model also highlights the essential role of feedback and adaptation. Outcomes associated with risk trigger two reinforcing feedback loops: one recalibrates expectations in light of new experiences, while the other feeds into information and learning, enabling organisations to refine their knowledge base and reduce uncertainty over time. Through these iterative loops, risk management becomes a continuous, adaptive process that evolves alongside changing internal and external conditions.
2. Literature Review and Research Gaps
The transition to a CE in the construction industry is fraught with various risks and challenges that can impede progress. Key issues identified include negative returns on investments, income loss, and legal uncertainties, particularly in emerging economies where digital transformation is still nascent [38]. Additionally, the construction sector faces significant socio-economic and technical barriers, such as the need for flexible business models, collaboration among stakeholders, and a shift in mindset towards sustainability [39,40]. The industry’s reliance on non-reusable and non-recyclable materials further complicates the transition, as it contradicts circular economy principles [41]. Moreover, challenges in managing CDW, exacerbated by increasing demand for building stock, highlight the urgency for effective waste management strategies [42]. Addressing these multifaceted issues is crucial for achieving a sustainable and resilient construction sector.
2.1. Transition Risks in the Construction Sector
The Construction industry plays a pivotal role in achieving Europe’s sustainability and climate objectives. As one of the most resource- and emission-intensive sectors, it stands at the heart of both the challenges and opportunities of the low-carbon, circular transition [43,44]. Recent EU policy frameworks including the European Green Deal, the Circular Economy Action Plan, and the Fit-for-55 package have positioned construction among the key value chains targeted for decarbonization and circular transformation. These initiatives indicate a systemic shift toward regenerative, resource-efficient business models. However, progress across Member States remains uneven, constrained by technological, financial, and regulatory uncertainties [45]. Within this policy-driven transformation, transition risks have gained increasing attention. In sustainability transitions, these risks arise from structural changes in regulations, technologies, and markets [46]. In construction, they manifest economically (e.g., high capital costs, uncertain returns), technically (e.g., material performance issues), and institutionally (e.g., evolving compliance requirements), while also extending to systemic or cascading risks linked to interdependent energy and infrastructure systems [33]. Despite growing recognition of these uncertainties, much of the existing literature still frames circular construction risks from a project- or organizational-level perspective. While some recent studies also highlight broader systemic and policy-level challenges, such as those discussed by [47], the majority of empirical research continues to focus on operational and firm-level barriers, e.g., [48]. This indicates a gap in understanding how transition risks emerge and interact at the higher policy and institutional levels.
2.2. Empirical Studies on Circular Construction Risks
Recent research has begun to classify and analyze the multifaceted risks confronting circular construction, offering valuable insights but also revealing key knowledge gaps. Ref. [48] conducted a comprehensive assessment of 68 critical risk factors grouped into nine domains: materials, organization, supply chain, technology, finance, design, health and safety, regulations, and stakeholders. Their hierarchical modeling approach demonstrated how risks interact and cascade across these domains, underscoring the systemic complexity of circular construction projects. Similarly, ref. [28] identified 25 critical risks in the context of Pakistan’s construction industry, highlighting challenges such as lack of political support, weak incentive mechanisms, scarcity of circular construction expertise, and uncertainty in profit margins. These findings emphasize that institutional and market immaturity remain major barriers to circularity in developing contexts.
At a technological level, ref. [49] identified 31 critical risk factors affecting volumetric modular construction (VMC), spanning project stages from design to on-site assembly. Their study proposed a digital technology enabled mitigation framework to promote circularity and resilience in modular construction, aligning with broader efforts to integrate Industry 4.0 tools into circular transitions. Complementing these perspectives, ref. [50] described transition risks as the “negative side effects” of circular construction an interpretation that aligns with policy implementation theory’s notion of unintended consequences. Moreover, the integration of digital technologies to support circularity (e.g., traceability, material tracking) remains challenged by low uptake, institutional inertia, and data governance risks in construction contexts [51]. Prior studies demonstrate that circular economy implementation in the construction and demolition sector faces not only economic and technical obstacles, but also significant environmental trade-offs and institutional barriers [52]. An appropriate framing of policy implementation is provided by [53], who argued that well-intended sustainability and regulatory interventions often generate new layers of administrative burden, uncertainty, and compliance challenges a mechanism consistent with transition risk formation. Expanding the empirical evidence further, ref. [54] examined the socioeconomic and sociotechnical risks associated with circular construction transitions in European contexts. Their study identified critical risks linked to labor market readiness, social acceptance of secondary materials, institutional coordination failures, and dependencies between digital infrastructure and circular supply chains. These findings demonstrate that circular construction risks extend beyond technical and organizational domains to encompass broader sociotechnical systems, highlighting the need for integrated policy and governance responses.
Additional recent studies also reinforce these insights. For example, ref. [55] examined governance and regulatory barriers that hinder circular economy implementation, emphasizing how fragmented policy frameworks, inconsistent enforcement, and unclear institutional responsibilities disrupt circular material flows in the construction sector. Likewise, ref. [56] analysed market and behavioural risks linked to recycled construction materials, highlighting persistent issues such as uncertain demand, limited stakeholder trust, and high price volatility. Together, these findings demonstrate that structural, socioeconomic, and institutional obstacles continue to shape transition risks and slow the adoption of circular practices in the construction industry.
2.3. The Role of Risk Identification and Analysis in Circular Construction Transitions
Research on CE in construction increasingly emphasizes six key technical domains: material reuse, circular built-environment strategies, CE business-model innovation, dynamic material stocks, material passports, and life-cycle assessment. Each introduces technological, financial, and organizational uncertainties that may jeopardize project performance if unrecognized or poorly managed [57]. Beyond technological challenges, pre-implementation barriers such as the selection of certifiably sustainable materials, adoption of design-for-disassembly methods, and creation of viable circular business models frequently generate ambiguity and hesitation among industry stakeholders [58]. To address such uncertainties, the ISO 31000:2018 framework provides a foundation for understanding the iterative nature of risk management, particularly emphasizing the stages of risk identification and risk analysis. These stages are essential in sustainability transitions, as they enable decision-makers to systematically recognize sources of uncertainty and interpret their potential implications before formulating treatment strategies. Within the context of circular construction, this means identifying not only technical or economic risks but also broader transition risks such as those stemming from regulatory, market, and policy transformations. This study draws conceptually on these early stages of the ISO 31000 process, focusing on the identification and analysis of transition risks as they appear in EU policy and industry documents. Rather than applying quantitative assessment techniques, the research adopts a qualitative approach to capture risk-related themes. This approach aligns with the ISO 31000 principle of continuous learning and contextual adaptation, while contributing new insights into how risks are framed, communicated, and prioritized within the EGD policy framework.
Beyond circular construction research, recent studies have shown that automated and machine-learning–based text analysis can effectively examine policy and regulatory documents by identifying policy positions, thematic patterns, or risk signals within large corpora [59,60]. Similar computational approaches have been used to trace climate and environmental discourse in EU legislation, revealing how regulatory narratives and risk framings evolve across policy cycles [61,62]. However, these methods have not yet been applied to the EGD corpus, nor to transition-risk analysis in the construction sector. This study therefore extends existing methodological work by combining expert qualitative coding with LLM-supported validation to produce the first systematic, policy-level mapping of transition risks relevant to circular construction.
2.4. Synthesis of Literature and Research Gap
The reviewed literature collectively highlights that while the transition to a CE in construction is widely recognized as essential, it is subject to multifaceted risks across economic, technical, regulatory, systemic and other dimensions. These studies provide valuable categorizations and mitigation frameworks but largely adopt a project-level or organizational lens. As a result, there remains limited understanding of the extent to which existing policy frameworks identify, reference, or imply these risks. This is an important omission, since policies shape institutional priorities and determine how uncertainty is addressed through regulatory and strategic action. Scholars such as [48,50] have begun to emphasize the interdependence and cascading nature of circular construction risks, yet it remains unclear what specific risks are implied by existing policy frameworks or how these policies indirectly shape risk conditions. Since the policies tend not to explicitly discuss such risks, this represents a key knowledge gap that requires a systematic identification of the risks associated (even implicitly or indirectly) with policies. Understanding this framing is crucial, as it influences how risks are perceived, prioritized, and operationalized within industry and governance practices. Furthermore, recent research on digital transformation in circular construction [38,63] reveals another layer of transition risk stemming from rapid technological shifts, data governance challenges, and cybersecurity concerns which also affects a discussion of green transition risks.
Despite extensive literature on circular construction risks, most studies analyse risks at the project, organisational, or supply chain levels. What remains insufficiently understood is how transition-related risks are framed, implied, or indirectly referenced within official EU policy documents such as the EGD. Since these policies shape institutional expectations, regulatory direction, and market behaviour, the absence of a systematic policy-level risk analysis represents a clear gap that this study addresses.
To address these gaps, the present study advances beyond project-level analyses to examine how transition risks are represented in the EGD and related EU policy and industry documents. This research involves a qualitative content analysis (using NVivo 14) carried out by a human analyst and validated with the assistance of large language models (LLMs). It provides a systematic and replicable approach to identifying the risks that are predominantly implied rather than explicitly stated in policies, and mapping how these risks appear across different policy documents. The findings clarify how the European construction sector’s green transition is framed in terms of risk thereby contributing to practical policy and industry discourse and academic understanding. Furthermore, many existing studies rely on single-analyst qualitative interpretation, which limits reproducibility and scalability when working with large policy corpora. To respond to this methodological limitation, the present study applies a mixed human–LLM approach: expert manual coding ensures contextual depth, while LLM-based classification provides consistency and scale. This integrated design directly addresses weaknesses identified in earlier work and enables a systematic, corpus-wide examination of policy-level risk signals.
3. Methodology
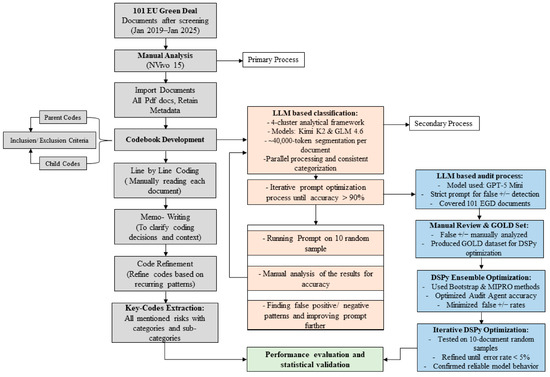
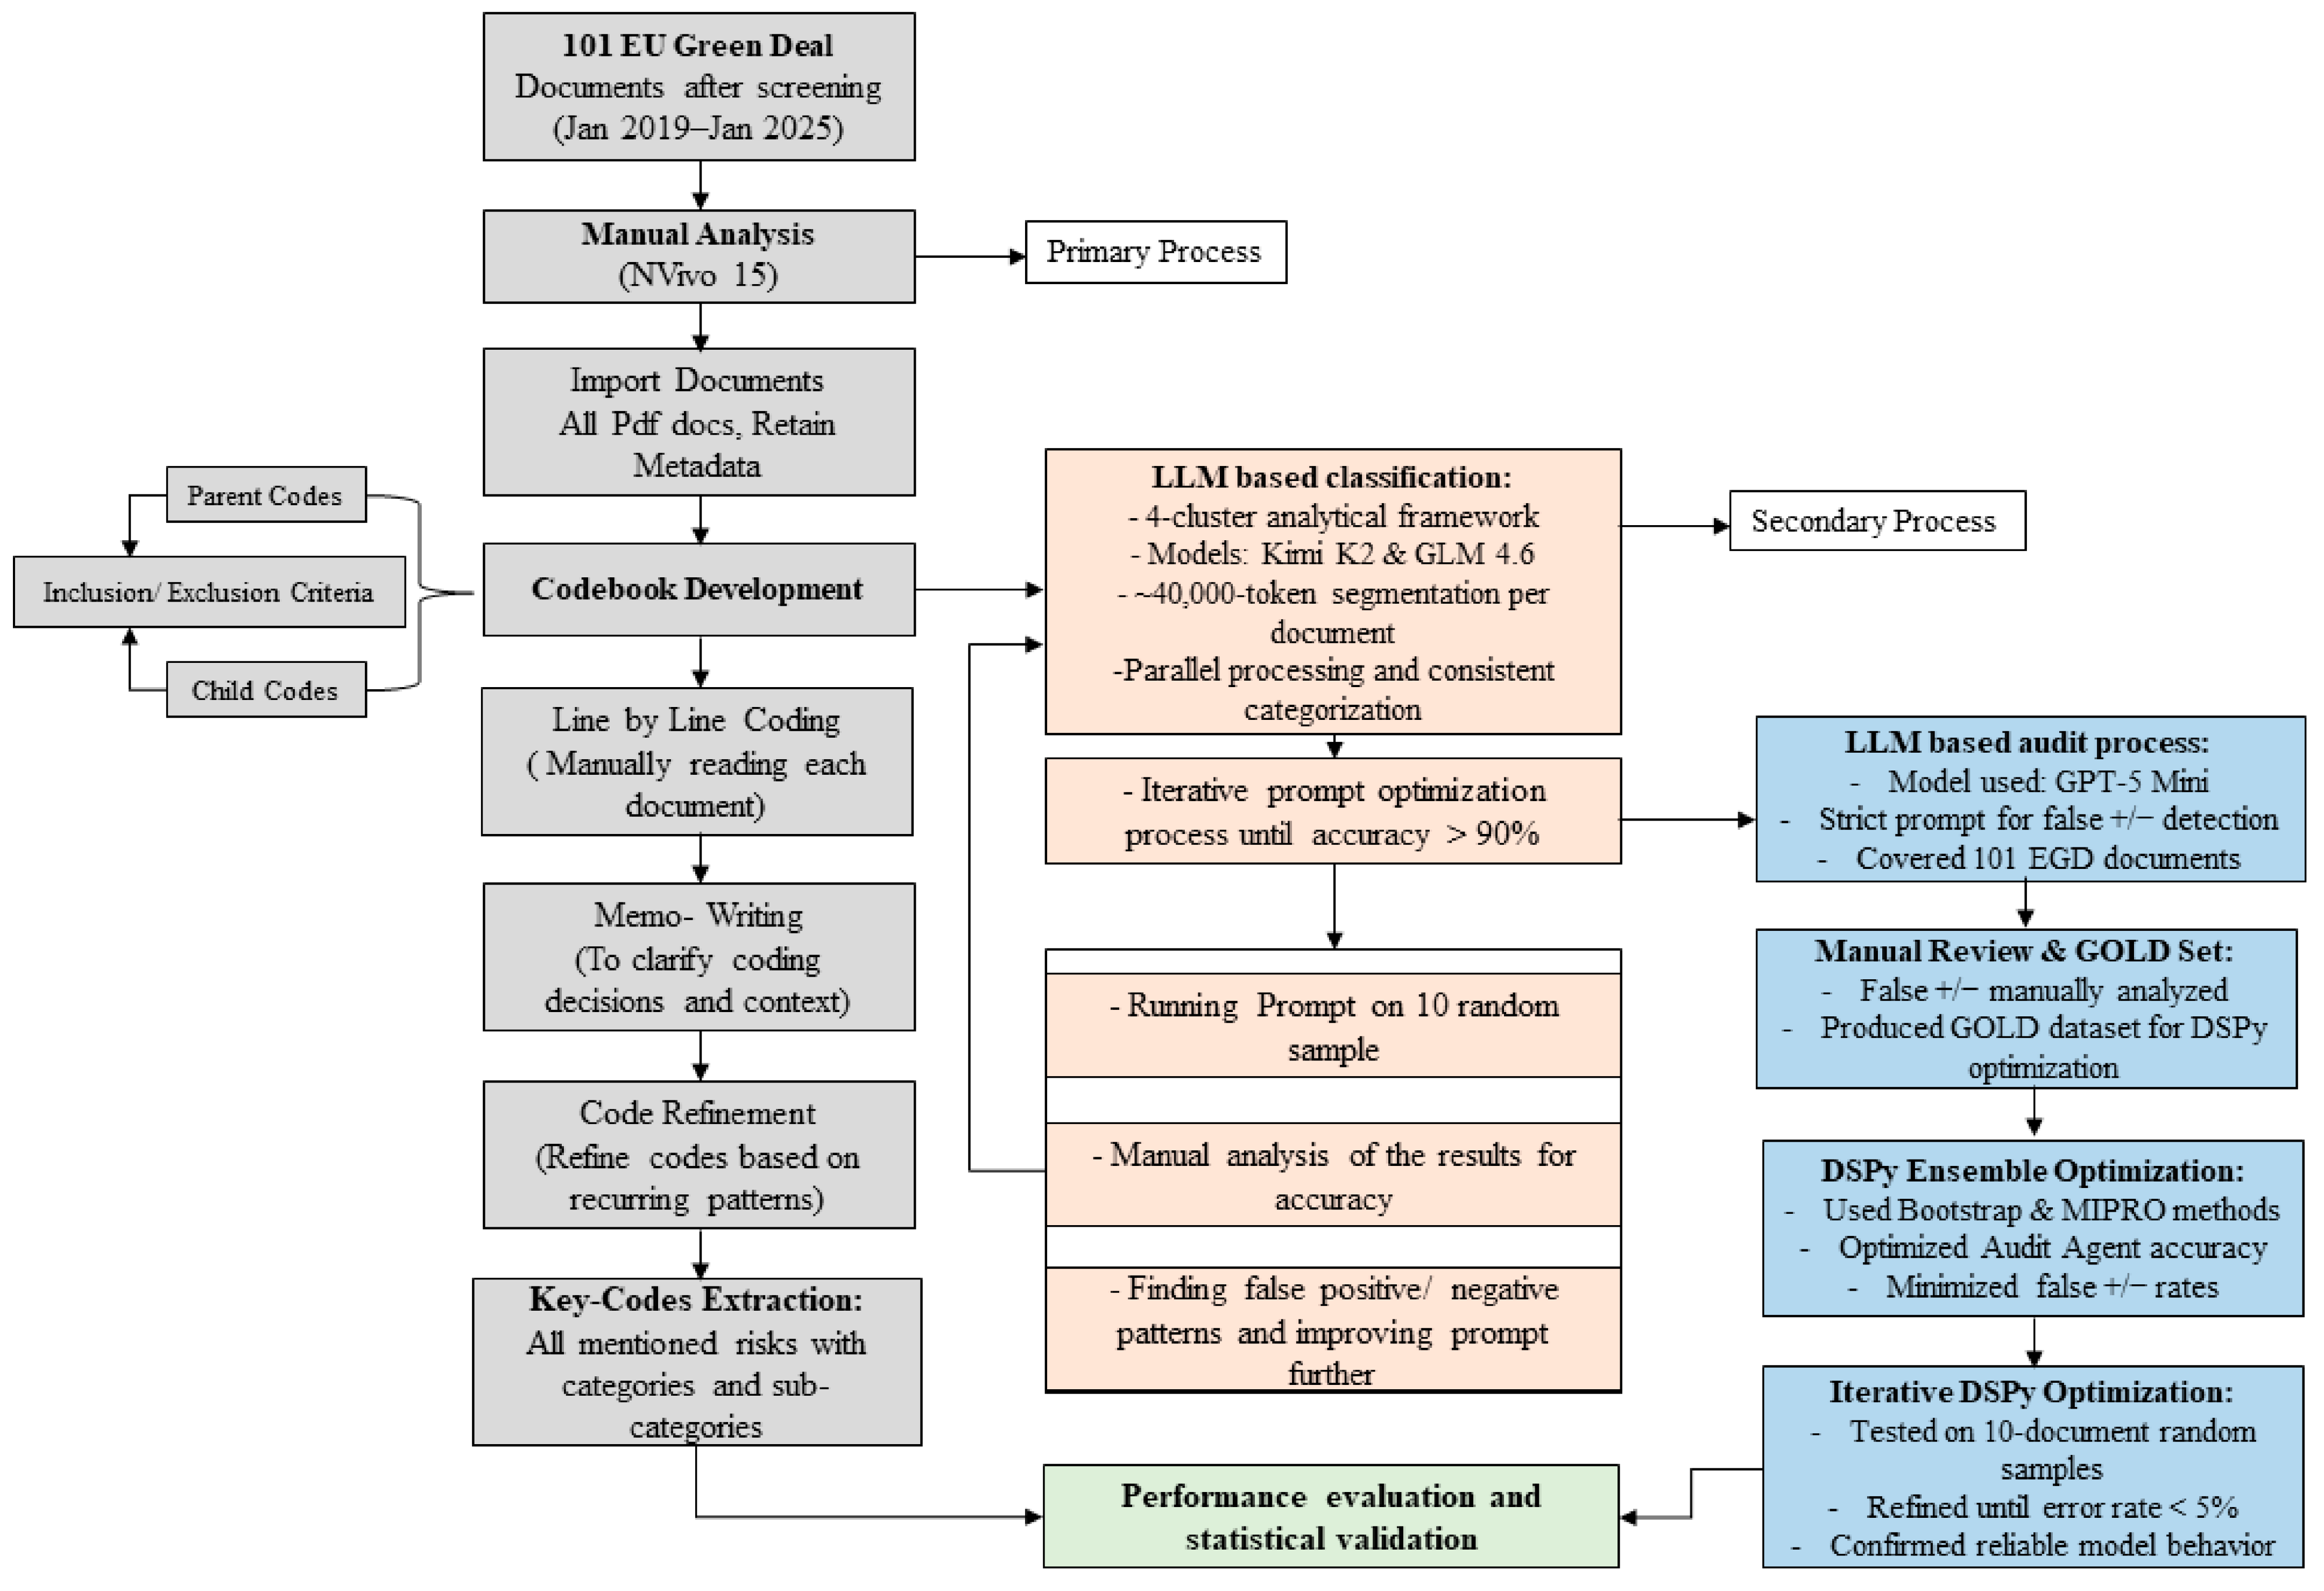
All official European Green Deal documents were retrieved from the European Commission’s online repository. These included strategy papers, legislative proposals, action plans, and communications issued between 2019 and February 2025. Only documents explicitly referencing the Green Deal were included, ensuring relevance to the green transition framework. In total, 101 documents were collected in PDF format and prepared for analysis. The details of all analyzed documents can be found in Appendix A. These documents were analyzed manually by a human analyst to identify risks and then a similar process was carried out using LLMs to validate the human risk identification findings. The use of LLMs as post hoc analytical tools enables validation and enrichment of traditional manual coding. Through quantifying and confirming identified themes, LLMs can improve reliability, highlight additional or overlooked traits, and offer supplementary data that enhance or refine the researcher’s original findings. This approach allows an independent and efficient verification of coding outcomes without requiring multiple human raters of equivalent expertise [64]. A detailed illustration of the process is shown in Figure 3.
Figure 3.
Method Flowchart.
3.1. Manual Coding and Risk Identification (Primary Process)
The analysis followed a qualitative content analysis approach using NVivo software. Each document was imported into NVivo and examined systematically through iterative reading by single coder. Text segments referring to risks were identified as meaning units and coded accordingly. The coding process combined inductive and deductive elements. While inductive (open) coding was used to allow additional or nuanced risk concepts to emerge directly from the data, this was complemented by a set of pre-defined categories informed by the transition-risk literature. As the analysis progressed, these emergent codes were refined, merged, or positioned within the broader theoretical categories (e.g., economic, technical, regulatory, systemic) through a deductive (axial) coding stage. This hybrid strategy ensured that the coding captured both theory-driven categories and context-specific insights from the documents.
An iterative coding process was then conducted:
- Initial (Open) Coding: Potential risk expressions were identified and given provisional labels based on textual context.
- Codebook Development (Axial Coding): Through repeated analysis, provisional codes were refined, merged, or reorganized into a structured codebook of risk categories and subcategories.
- Final (Selective) Coding: The entire dataset was re-examined to ensure consistent application of codes and confirm conceptual saturation across documents.
This process resulted in a structured risk taxonomy comprising eight main categories and twenty-six subcategories, each with associated frequency counts (references per code). The procedure followed established practices for qualitative data analysis [65,66] ensuring reliability and transparency.
3.2. LLM-Based Validation and Scaling Pipeline (Secondary Process)
The consistency of the manual coding and the scale of the classification in the entire corpus were to be systematically justified and then scaled using an LLM-assisted framework. It was divided into two steps (A) Automated Classification and Prompt Optimization, and (B) Quality Assurance through Audit Agent.
- A.
- Intelligent Grouping and efficient Optimization
Automated classification was performed using the Kimi K2 and GLM 4.6 models, which were selected for their large context windows, strong performance in large-scale classification, and recognition as among the top-performing open-source LLMs according to ArtificialAnalysis. AI: Kimi K2 and GLM 4.6 are transformer-based LLMs optimized for high-accuracy classification and long-context reasoning, suitable for analysing extended policy texts. Both models are optimized for processing extended documents, making them suitable for analysing policy texts that contain dense regulatory language and dispersed risk signals. Their multilingual capability and stable performance in structured extraction tasks further support their use in validating manually coded material.
- Risk Taxonomy and Cluster Architecture: The 26 risk subcategories were sorted into a 4-Cluster Parallel Classification Architecture to maximize model reasoning and reduce category interference. The processing of every segment of the document was done simultaneously on specialized prompts specific to each cluster:
- Cluster 1: Economic, Legislative, and Technological Risks.
- Cluster 2: Environmental and Health Risks.
- Cluster 3: Social and Societal Risks.
- Cluster 4: Geopolitical Risks.
- Iterative Prompt Optimization: Prompting was optimized iteratively with a stratified random sample of 10 documents. Early prompt design focused on establishing clear category definitions and output schema requirements. Subsequent cycles involved:
- Manual Analysis: Checking the initial model output to detect systematic errors, that is, false positive/negative patterns and category overlap.
- Refinement: Addition of few-shot exemplars and explicit inclusion/exclusion criteria to the prompts to deal with the failure modes detected.
- Objective: The optimization was repeated until the classification accuracy on further random 10-document samples consistently exceeded 90 percent.
- B.
- Quality Control through Audit Agent
- To verify the validity of the LLM’s findings, an Audit Agent, an instance of the GPT-5 Mini model, was employed as a secondary quality control mechanism to reduce residual false positives. In this workflow, the LLMs do not introduce new risk codes autonomously; any additional model-flagged instances were accepted only when explicitly confirmed by the human analyst. Thus, LLMs serve primarily as validation and scaling tools rather than independent contributors of new categories. GOLD Set Production: To establish a reliable benchmark, we generated a “GOLD Set,” defined here as a manually validated ground-truth dataset comprising both correct classifications (true positives) and errors (false positives/negatives). This dataset was curated by human experts who reviewed initial LLM outputs to verify accuracy and correct misclassifications. Specifically, a strict prompt was employed to flag potential errors, after which 300 samples were randomly selected to isolate specific few-shot examples of both valid and invalid classifications. This expert-verified data provided the necessary ground truth for the subsequent optimization of the Audit Agent.
- DSPy Ensemble Optimization: The Audit Agent was optimized using the DSPy (Declarative Self-improving Python 2.6.27) framework. Distinct from traditional “prompt engineering,” which typically relies on manual, heuristic string manipulation, DSPy employs a “prompt programming” paradigm. This approach treats language model prompts as modular programs where parameters are subject to algorithmic optimization rather than manual tuning. We utilized a DSPy Ensemble incorporating two specific optimization strategies:
- Bootstrap Few-Shot Learning: This module algorithmically curated the prompt context by iteratively scanning the GOLD Set to identify accurate reasoning traces (the intermediate logical steps or chain-of-thought the model generates to justify its final classification). The system selected only those few-shot examples that mathematically maximized the probability of correct output, thereby automating the selection of high-fidelity demonstrations.
- MIPRO (Multi-step Instruction Proposal and Refinement Optimization): This optimizer was employed to refine the instruction set. MIPRO systematically generates and evaluates a broad search space of instruction variations and prompt combinations. By scoring these variations against the GOLD Set, the system converges on an optimal prompt structure through quantitative evaluation, covering a search space significantly broader than is feasible through manual iteration.
- The Audit Agent, tuned to a low error rate (< 5% on 10-document random samples), was deployed to audit the classification outputs of the full corpus (101 documents). The agent utilized strict, reflection-based prompts to verify that extracted textual quotes accurately substantiated the assigned risk, ensuring reliable model behavior across the dataset.
3.3. Performance Appraisal and Statistical Justification
The final, audit-verified LLM classifications were compared with the manual code set to assess the consistency and robustness of the mixed human–AI coding process. Rather than focusing on fine-grained classifier metrics, the appraisal concentrated on whether the automated system reproduced the overall risk profile generated by expert coding.
- Distributional Agreement: The first step examined how closely the LLM-based coding reproduced the human coder’s distribution of coded files and total references across the main risk themes. This comparison provided a baseline check that the automated system was not systematically omitting or over-representing specific categories in the corpus.
- Structural Consistency and Relative Priorities: Second, a radar-chart comparison of normalized frequencies across categories was used to evaluate the structural alignment between human and LLM coding. This analysis focused on whether both approaches assigned similar relative importance to the different risk domains, even if absolute counts varied.
- Third, a correlation-based comparison of category-level risk counts was conducted using scatter plots with fitted regression lines. This approach was used to compare patterns in category-level counts between human and LLM-supported coding.
It is important to note that the human-coded dataset formed the primary and authoritative classification. The LLMs served exclusively as validation tools and did not introduce new codes or expand the coding set. Any discrepancies where the LLM appeared to identify additional instances were treated purely as validation signals and were not incorporated unless they matched an already human-coded segment.
4. Results
101 European Green Deal policy documents were identified, and upon analysis these were found to imply a wide array of risks. These risks were classified in eight broad categories namely economic, environmental, geopolitical, health, legislative, social, societal and technological. The use of this classification in both manual and LLM-supported analyses showed great internal consistency, which means that the existing framework can be used consistently in various policy texts. Instead of being an independent discovery exercise, the LLM analysis was a replication and reliability test, to ensure that the manually developed codebook could be interpreted and operationalized by an automated system with a small amount of deviation.
The subsequent sections display the results of this analysis in greater detail, such as the breakdown of coded references according to categories, the recognition of the most salient risk areas, and trends that can be observed based on the categorization. These results give a clear picture of the risks of the green transition and which areas should be given special consideration.
4.1. Distribution of Risk Codes (Primary Process: Human Analysis)
The manual qualitative coding process led to the systematic mapping of the risks related to the Green Deal and their classification into eight major categories and twenty-six subcategories. Overall, the human analyst identified 2752 coded references, which indicates the degree to which risks are implied/referred to in the policy documents. Each of the main categories reflects a specific type of risk and the subcategories show specific manifestations of these types.
Environmental Risks was the most significant category with the highest number of coded references, then Economic Risks and Legislative Risks. The environmental risks included biodiversity issues, pollution, waste management, and influence of climate change. The subcategories of economic risks were cost of transition, investment challenges and sectoral economic risks. The legislative risks indicated the issues related to regulatory compliance, policy coherence, and administrative burden. Other categories Geopolitical, Health, Social, Societal, and Technological Risks, had relatively fewer references, but still provided helpful insights into the uncertainties of the emerging system. Moreover, not all risks were coded under the existing categories since they could not fit in well but were specifically highlighted in the documents. Table 1 is the complete distribution of the coded references in the major categories and subcategories. The table does not only indicate the total number of references under each of the main categories but also the weight of the subcategories. The breakdown demonstrates the complexity of the data and creates a basis of what risks are most evident in the policy document. Moreover, some codes overlap and can be counted more than once across categories; therefore, aggregated totals (as in Figures) cannot be derived directly from Table 1.
Table 1.
Distribution of risk codes across main and subcategories.
4.2. Top Categories of Risks
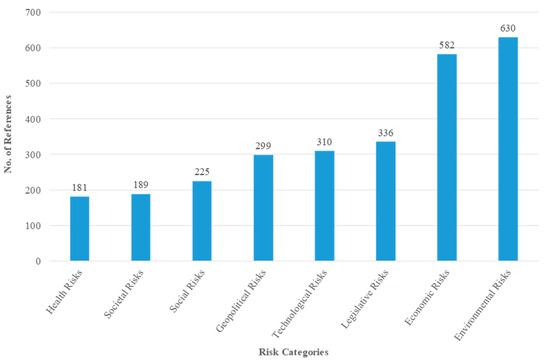
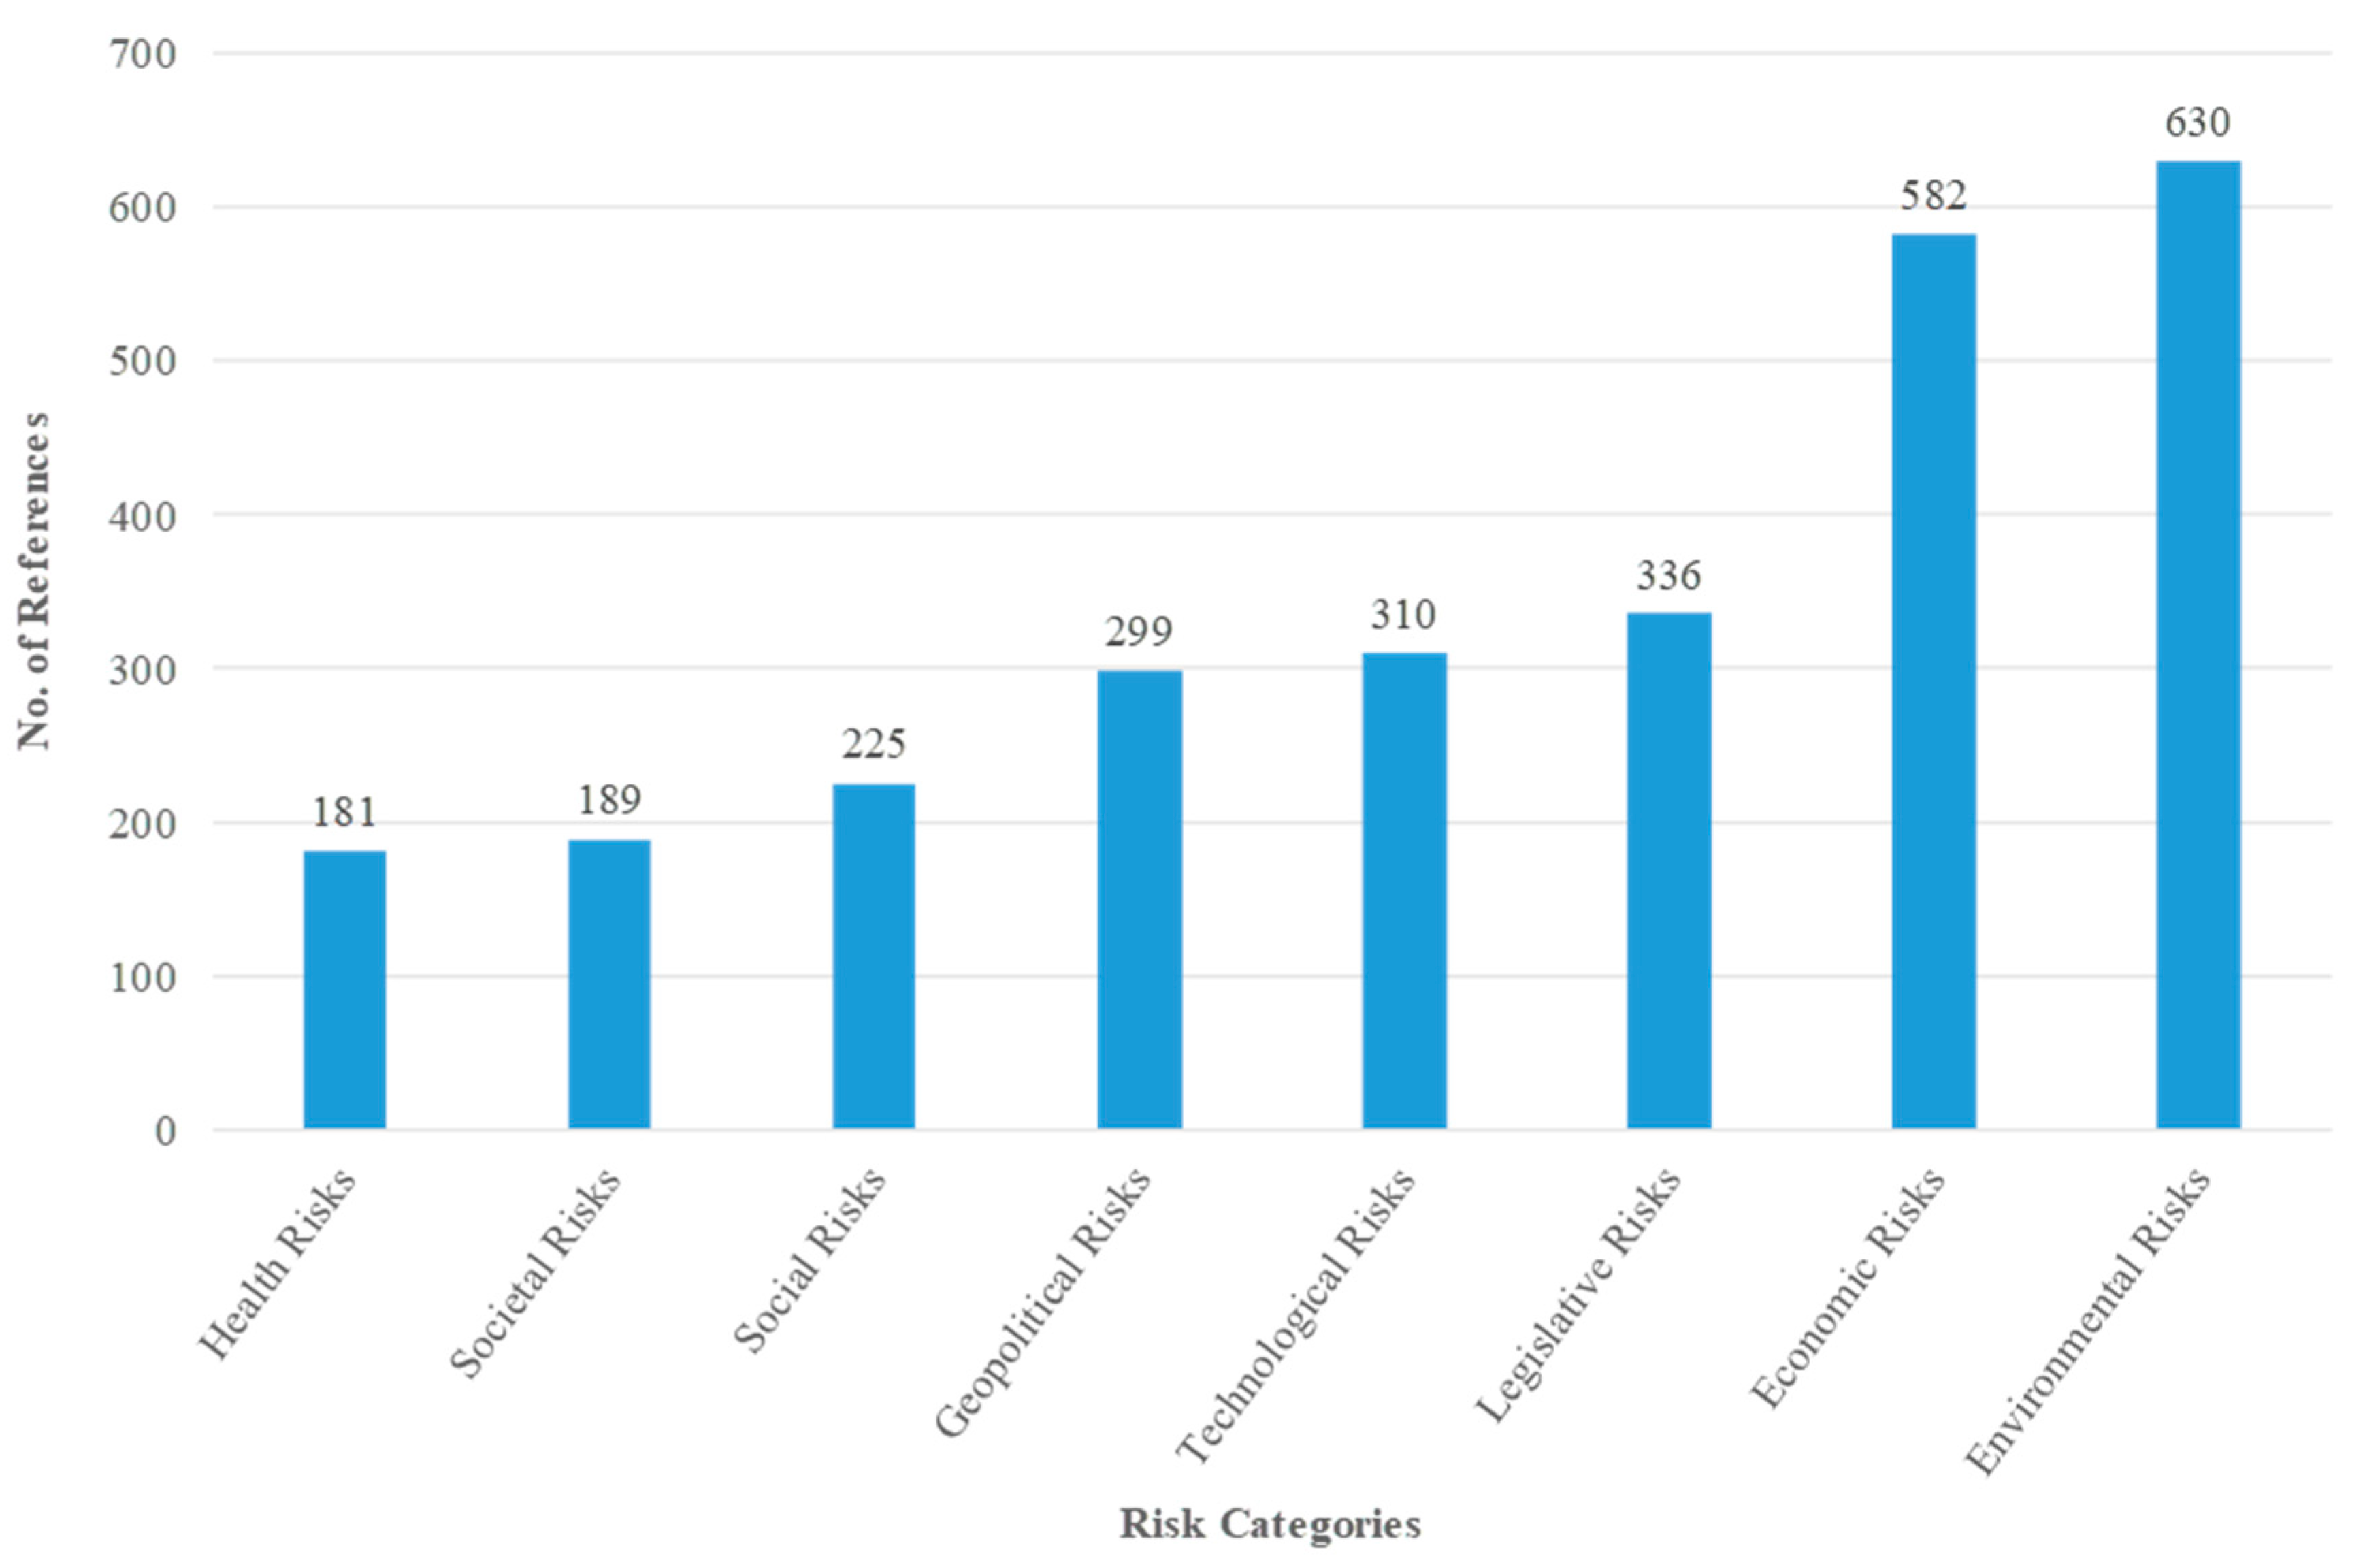
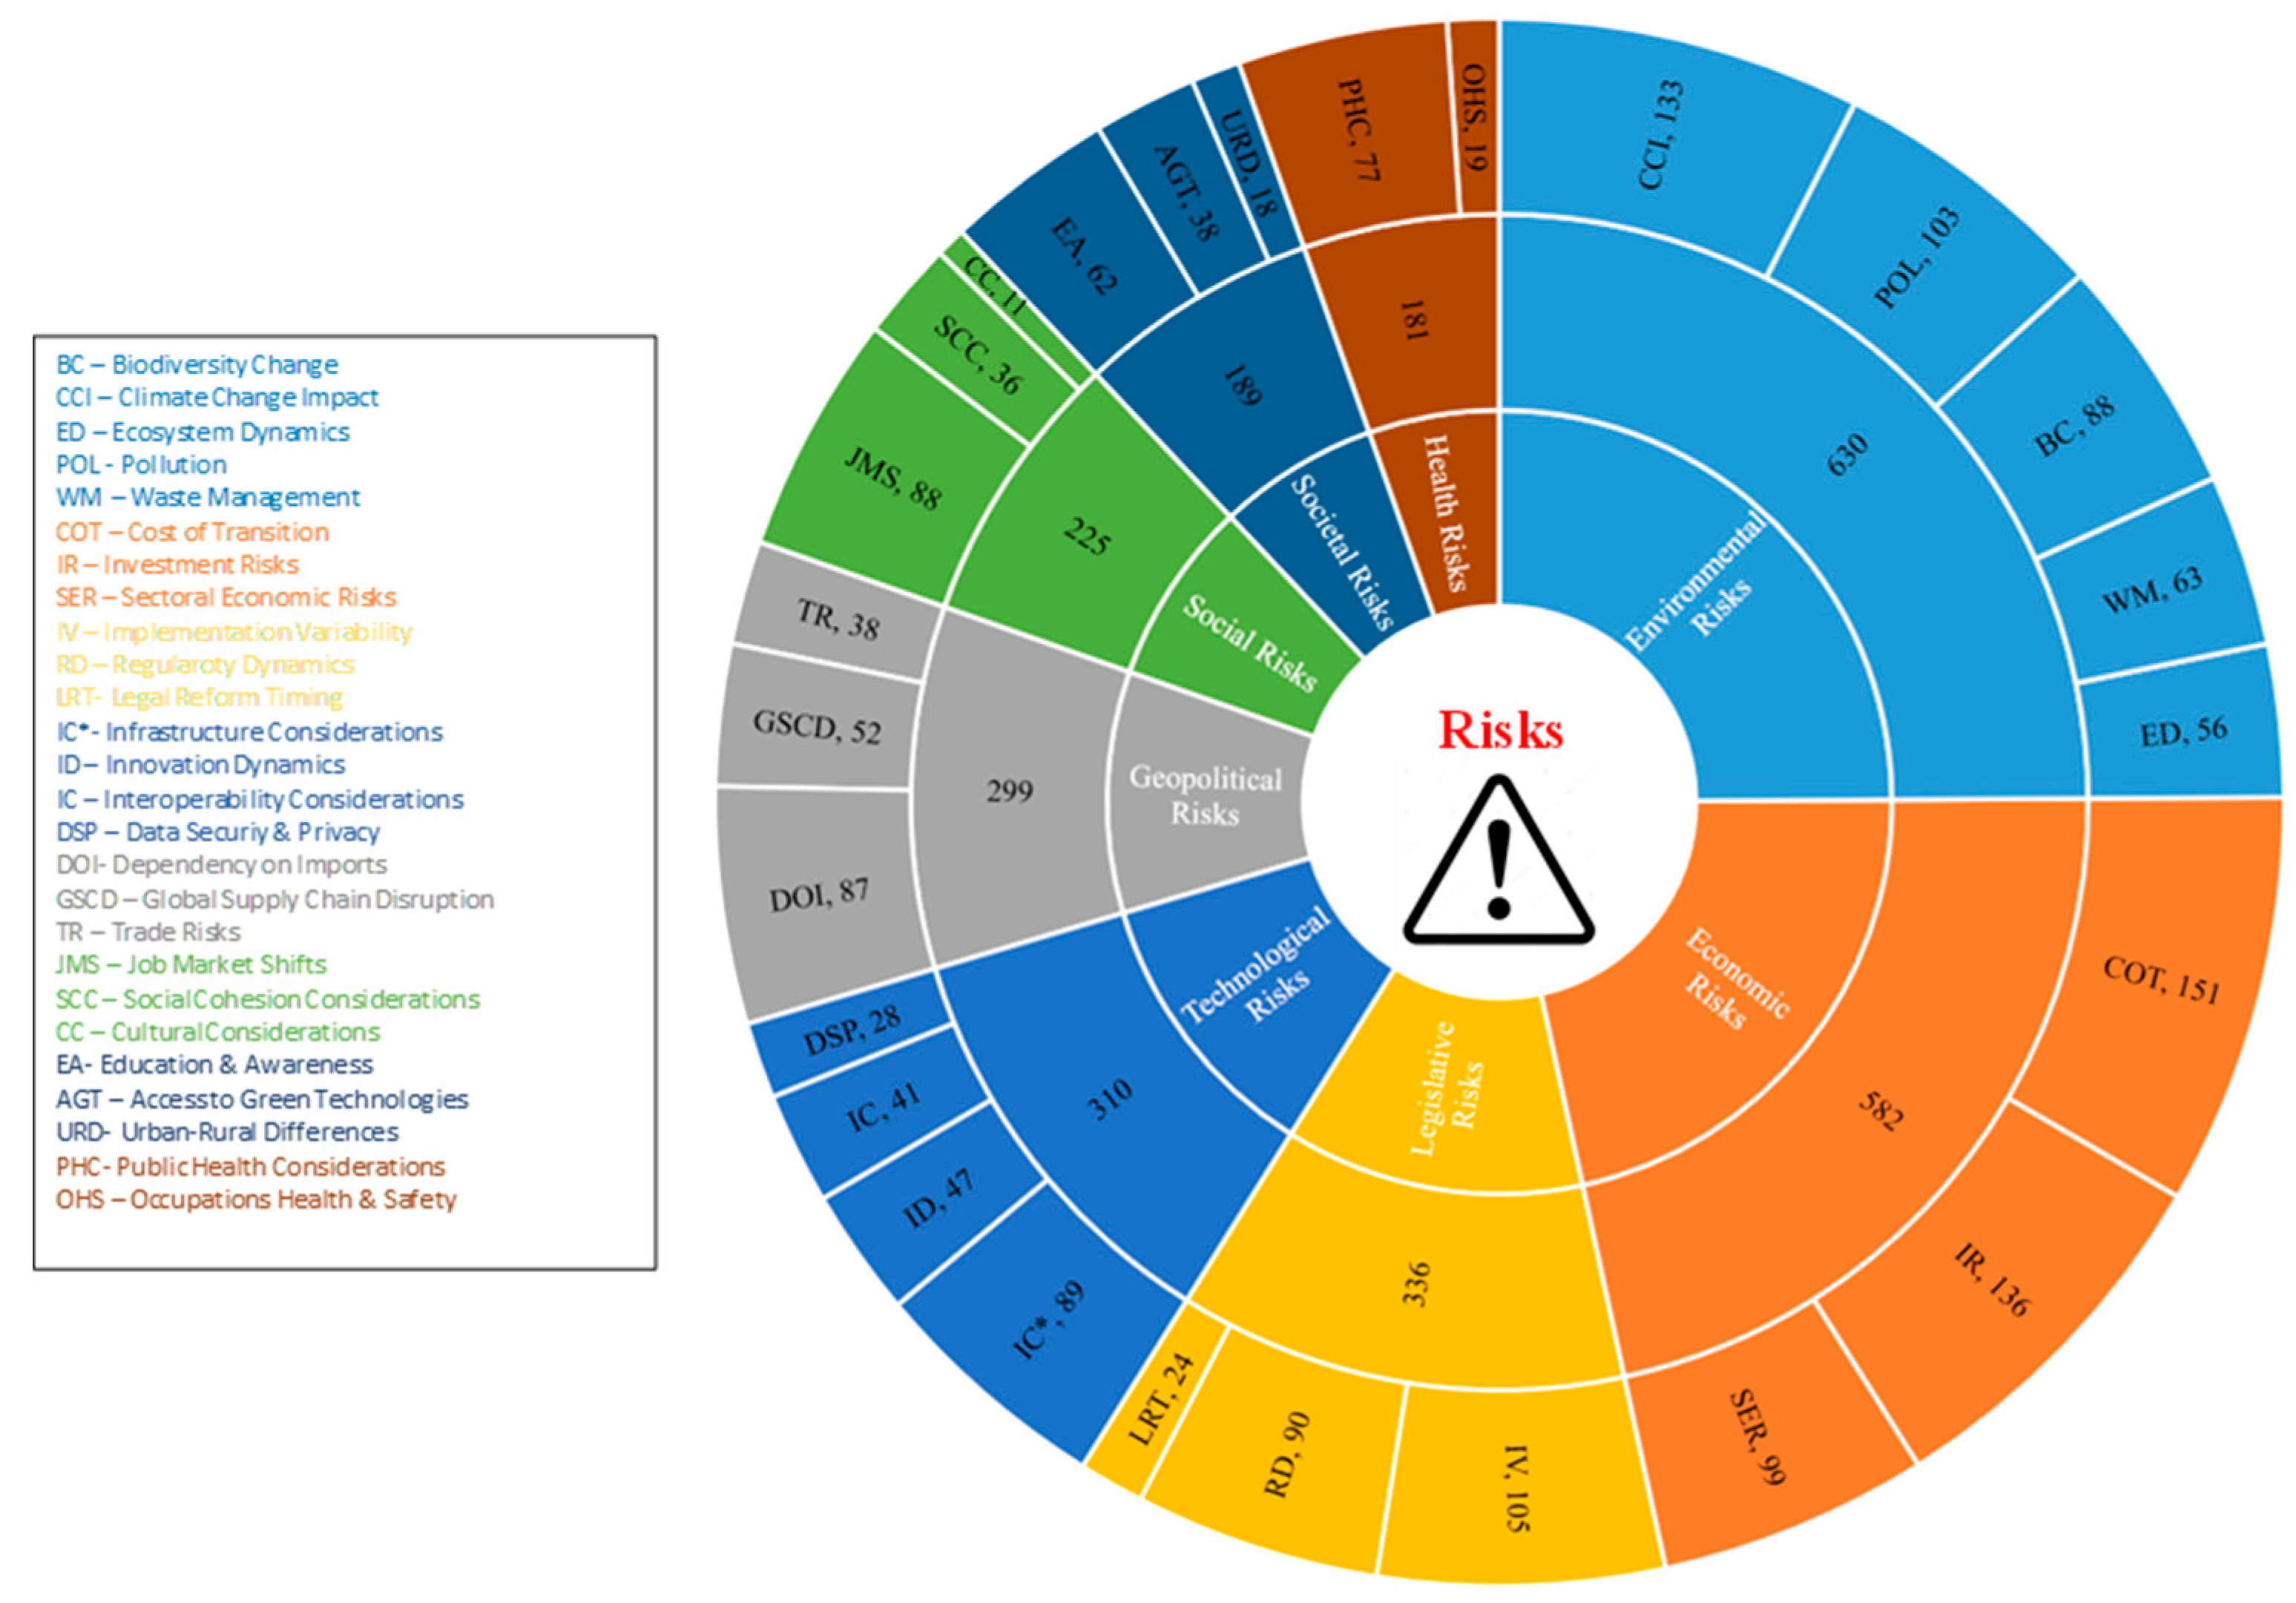
The coding results indicate that certain domains are emphasized more frequently in the Green Deal documents. As shown in Figure 4, Environmental Risks (630 references), Economic Risks (582 references), and Legislative Risks (336 references) are the most frequently mentioned categories, followed by Technological Risks (310 references).
Figure 4.
Frequency of Risk Codes across main Categories.
In the Environmental Risks section, the most relevant subcategories are climate change impact (133 references), pollution (103) and biodiversity change (88) as they show the broad range of ecological vulnerabilities that are found in the documents. The subcategories of Economic Risks were well represented with cost of transition (151), investment risks (136) and sectoral economic risks (99) representing the concerns about the financial viability of the transition. Infrastructure considerations (89 references) and innovation dynamics (47) dominated Technological Risks and implementation variability (105), and regulatory dynamics (90) dominated Legislative Risks.
Note that the frequencies shown in Figure 4 cannot be derived directly from Table 1 because Table 1 reports only the counts of individual sub-categories, whereas Figure 4 presents the aggregated totals for each main category. In this aggregation, all sub-category codes are summed, and any codes that were mapped simultaneously to both a main category and a sub-category during qualitative coding are counted within the main category as well. This reflects standard qualitative coding practice, where coding may legitimately overlap.
4.3. Patterns and Relationships
The review shows that there are a number of cross-cutting patterns to the identified risks. First, the environmental and economic risks are the most prevalent, and they form over a third of all the coded references. The fact that they are prominent implies that the ecological and economic vulnerabilities are constantly highlighted in Green Deal documents. Notably, these categories are frequently related to each other, with economic aspects like cost of transition and risks of investments being strictly linked to environmental needs, such as climate change mitigation and pollution control. Second, legislative risks often appear in close connection with economic and environmental risks. The prominence of themes such as implementation variability (105 references) and regulatory dynamics (90 references) indicates that institutional and legal uncertainties frequently intersect with financial and environmental concerns, amplifying the challenges associated with the transition. This interdependence implies that the vulnerabilities within regulatory frameworks can increase the uncertainties in the various types of risks. Third, health and social risks are not as common, but they are critical contextual vulnerabilities. To illustrate, the effects that the transition might have on communities and labor forces are represented by such topics as public health considerations (77 references) and job market shifts (88 references). In addition, the subcategories of occupational health and safety (19) and cultural considerations (11) are of limited frequency, but they do reveal rather important but critical issues that may be a problem to the effectiveness of Green Deal policies in case they are not addressed.
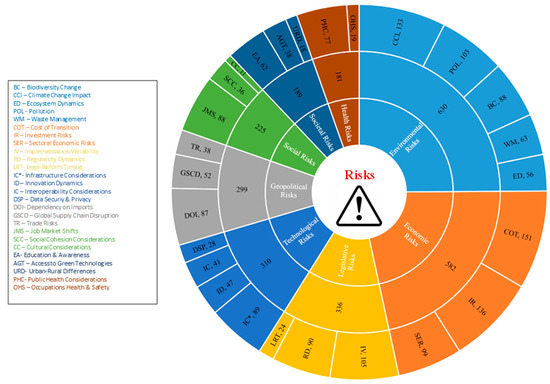
Figure 5 demonstrates how the major subcategories are distributed in the chosen risk domains, with the reference’s distribution being uneven, and the risks concentration around some themes. This visualization helps understand that although the frequency of some risks (e.g., impact of climate change, cost of transition, implementation variability) can be high (meaning that they are present in documents in high frequency), the rest of them are marginal but still contextually important.
Figure 5.
Distribution of major categories into sub-categories with numbers. Note: An asterisk (*) is used to distinguish subcategories that share the same abbreviation.
4.4. Validation by LLM
To ensure the methodological robustness of the risk taxonomy, the manual coding results were validated with a similar analysis carried out by two Large Language Models (Kimi and GLM). This multi-rater approach serves a dual purpose: first, to assess the structural consistency of the risk categories across the entire corpus, and second, to quantify interpretive divergences between human expert judgment and automated pattern recognition.
4.4.1. Distribution of Coded Files and References
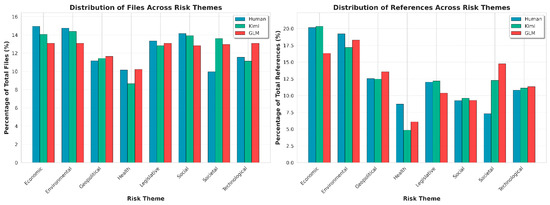
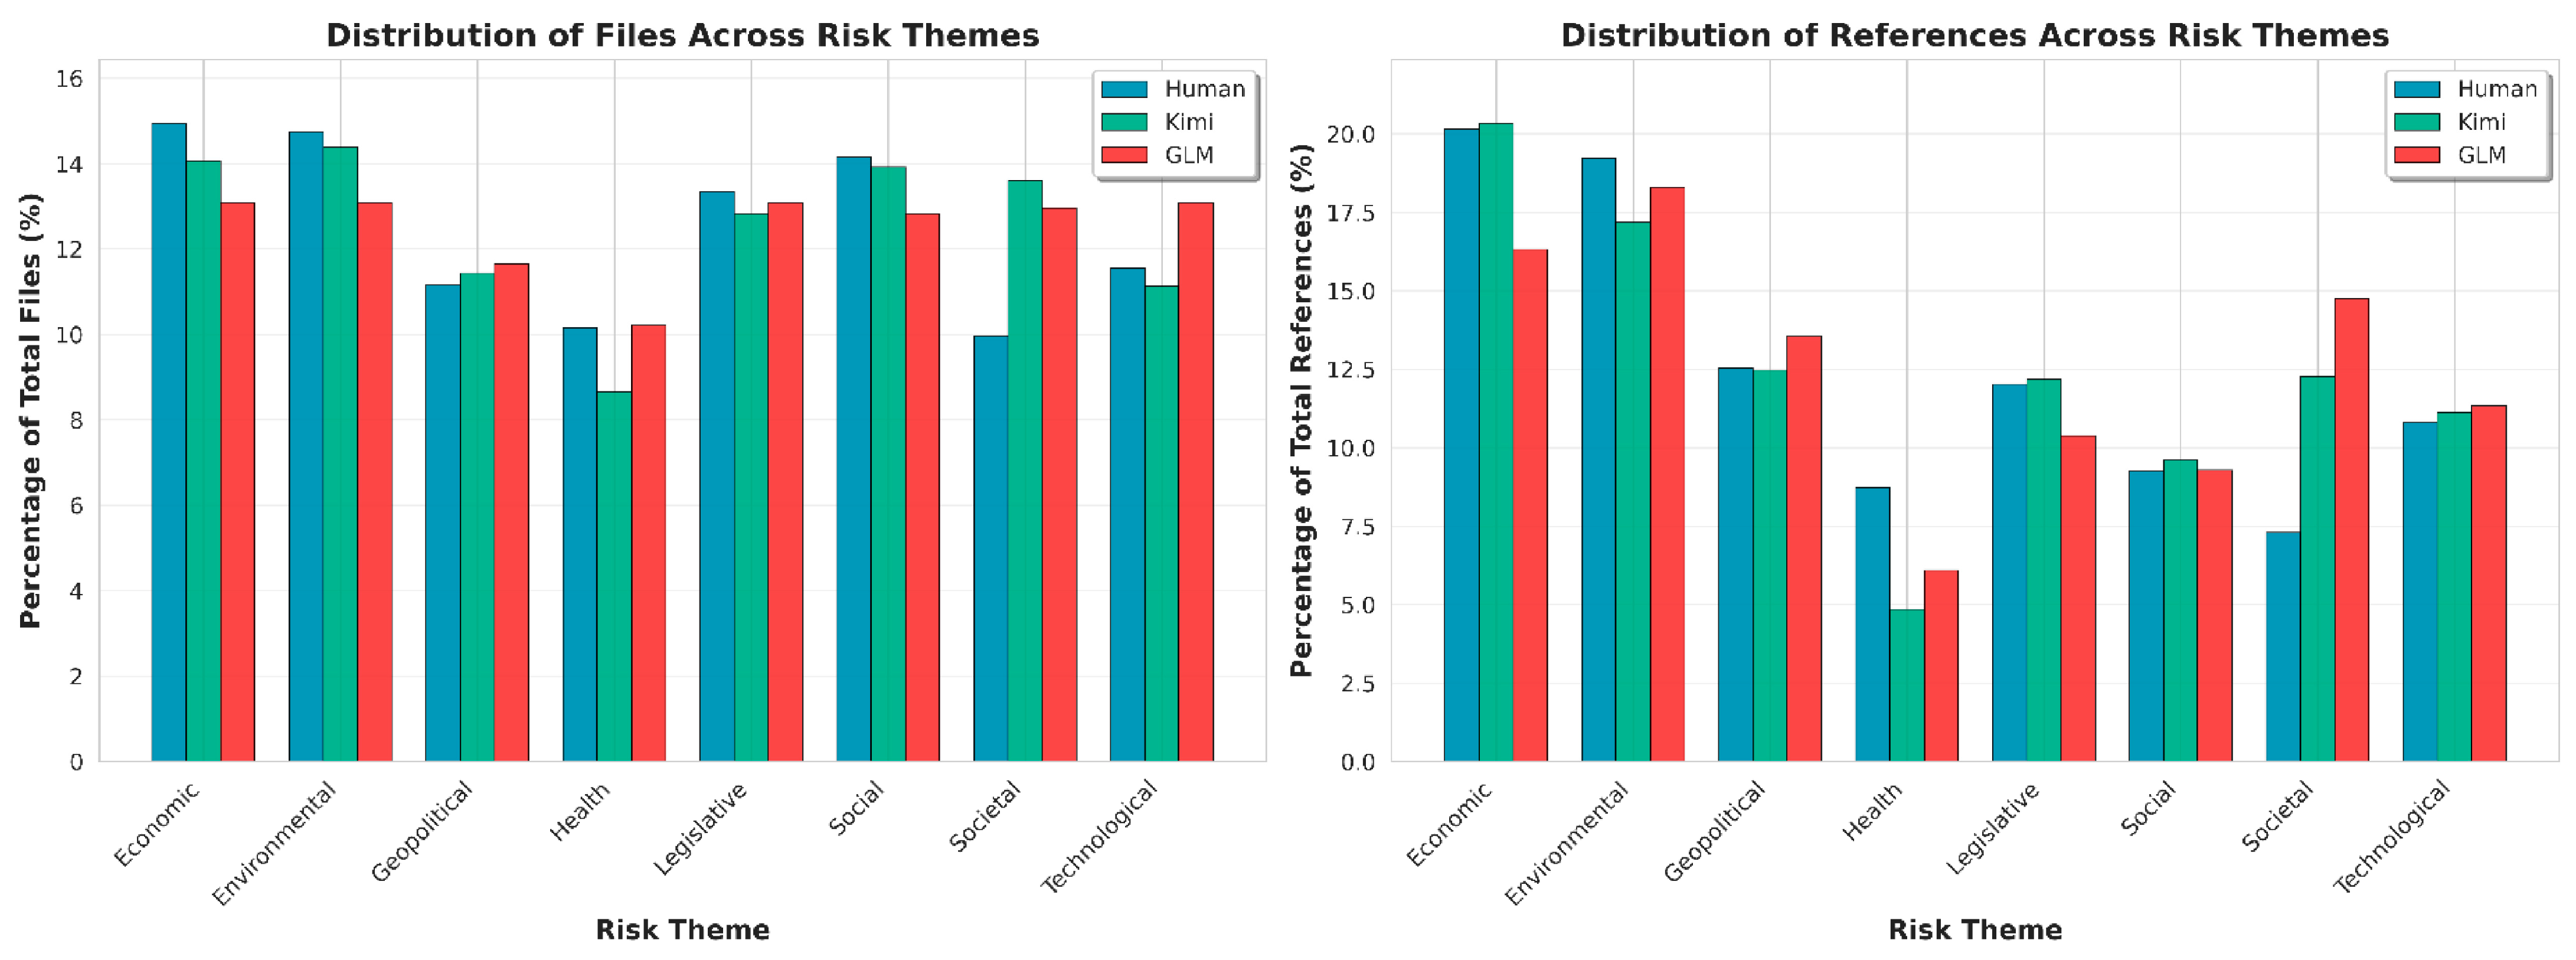
Figure 6 presents a comparative analysis of the coding distribution across the eight primary risk themes. The figure is divided into two panels: the distribution of coded files (breadth of discussion) and the distribution of total references (depth of discussion).
Figure 6.
Percentage Distribution of Coded Files and References Across Risk Themes, Human and LLMs.
Analysis of File Distribution
The file distribution data demonstrates a strong baseline alignment between the Human coder and the LLMs. As illustrated in the left panel of Figure 6, all three raters exhibit a consistent hierarchical pattern. Economic and Environmental risks are identified as the most pervasive themes, appearing in the highest percentage of documents (Human: ~15%; LLMs: ~13–14%). This consensus confirms that financial viability and ecological impact are the central pillars of the EGD discourse, regardless of the rater’s interpretive logic.
Analysis of Reference Density
The reference distribution (right panel) reveals minor but distinct variations in coding density. While the Human coder maintained a high reference count for Environmental and Economic risks (approximately 20% of total references), the LLM raters particularly GLM attributed a notably higher proportion of references to the Societal category. This divergence suggests that the AI models possess a higher sensitivity to contextually related mentions of social equity and inclusivity, whereas the human expert likely sub summed these references under broader legislative or economic frameworks. Despite these variations in the secondary categories, the overall distributional profile remains stable, confirming the applicability of the thematic framework at scale.
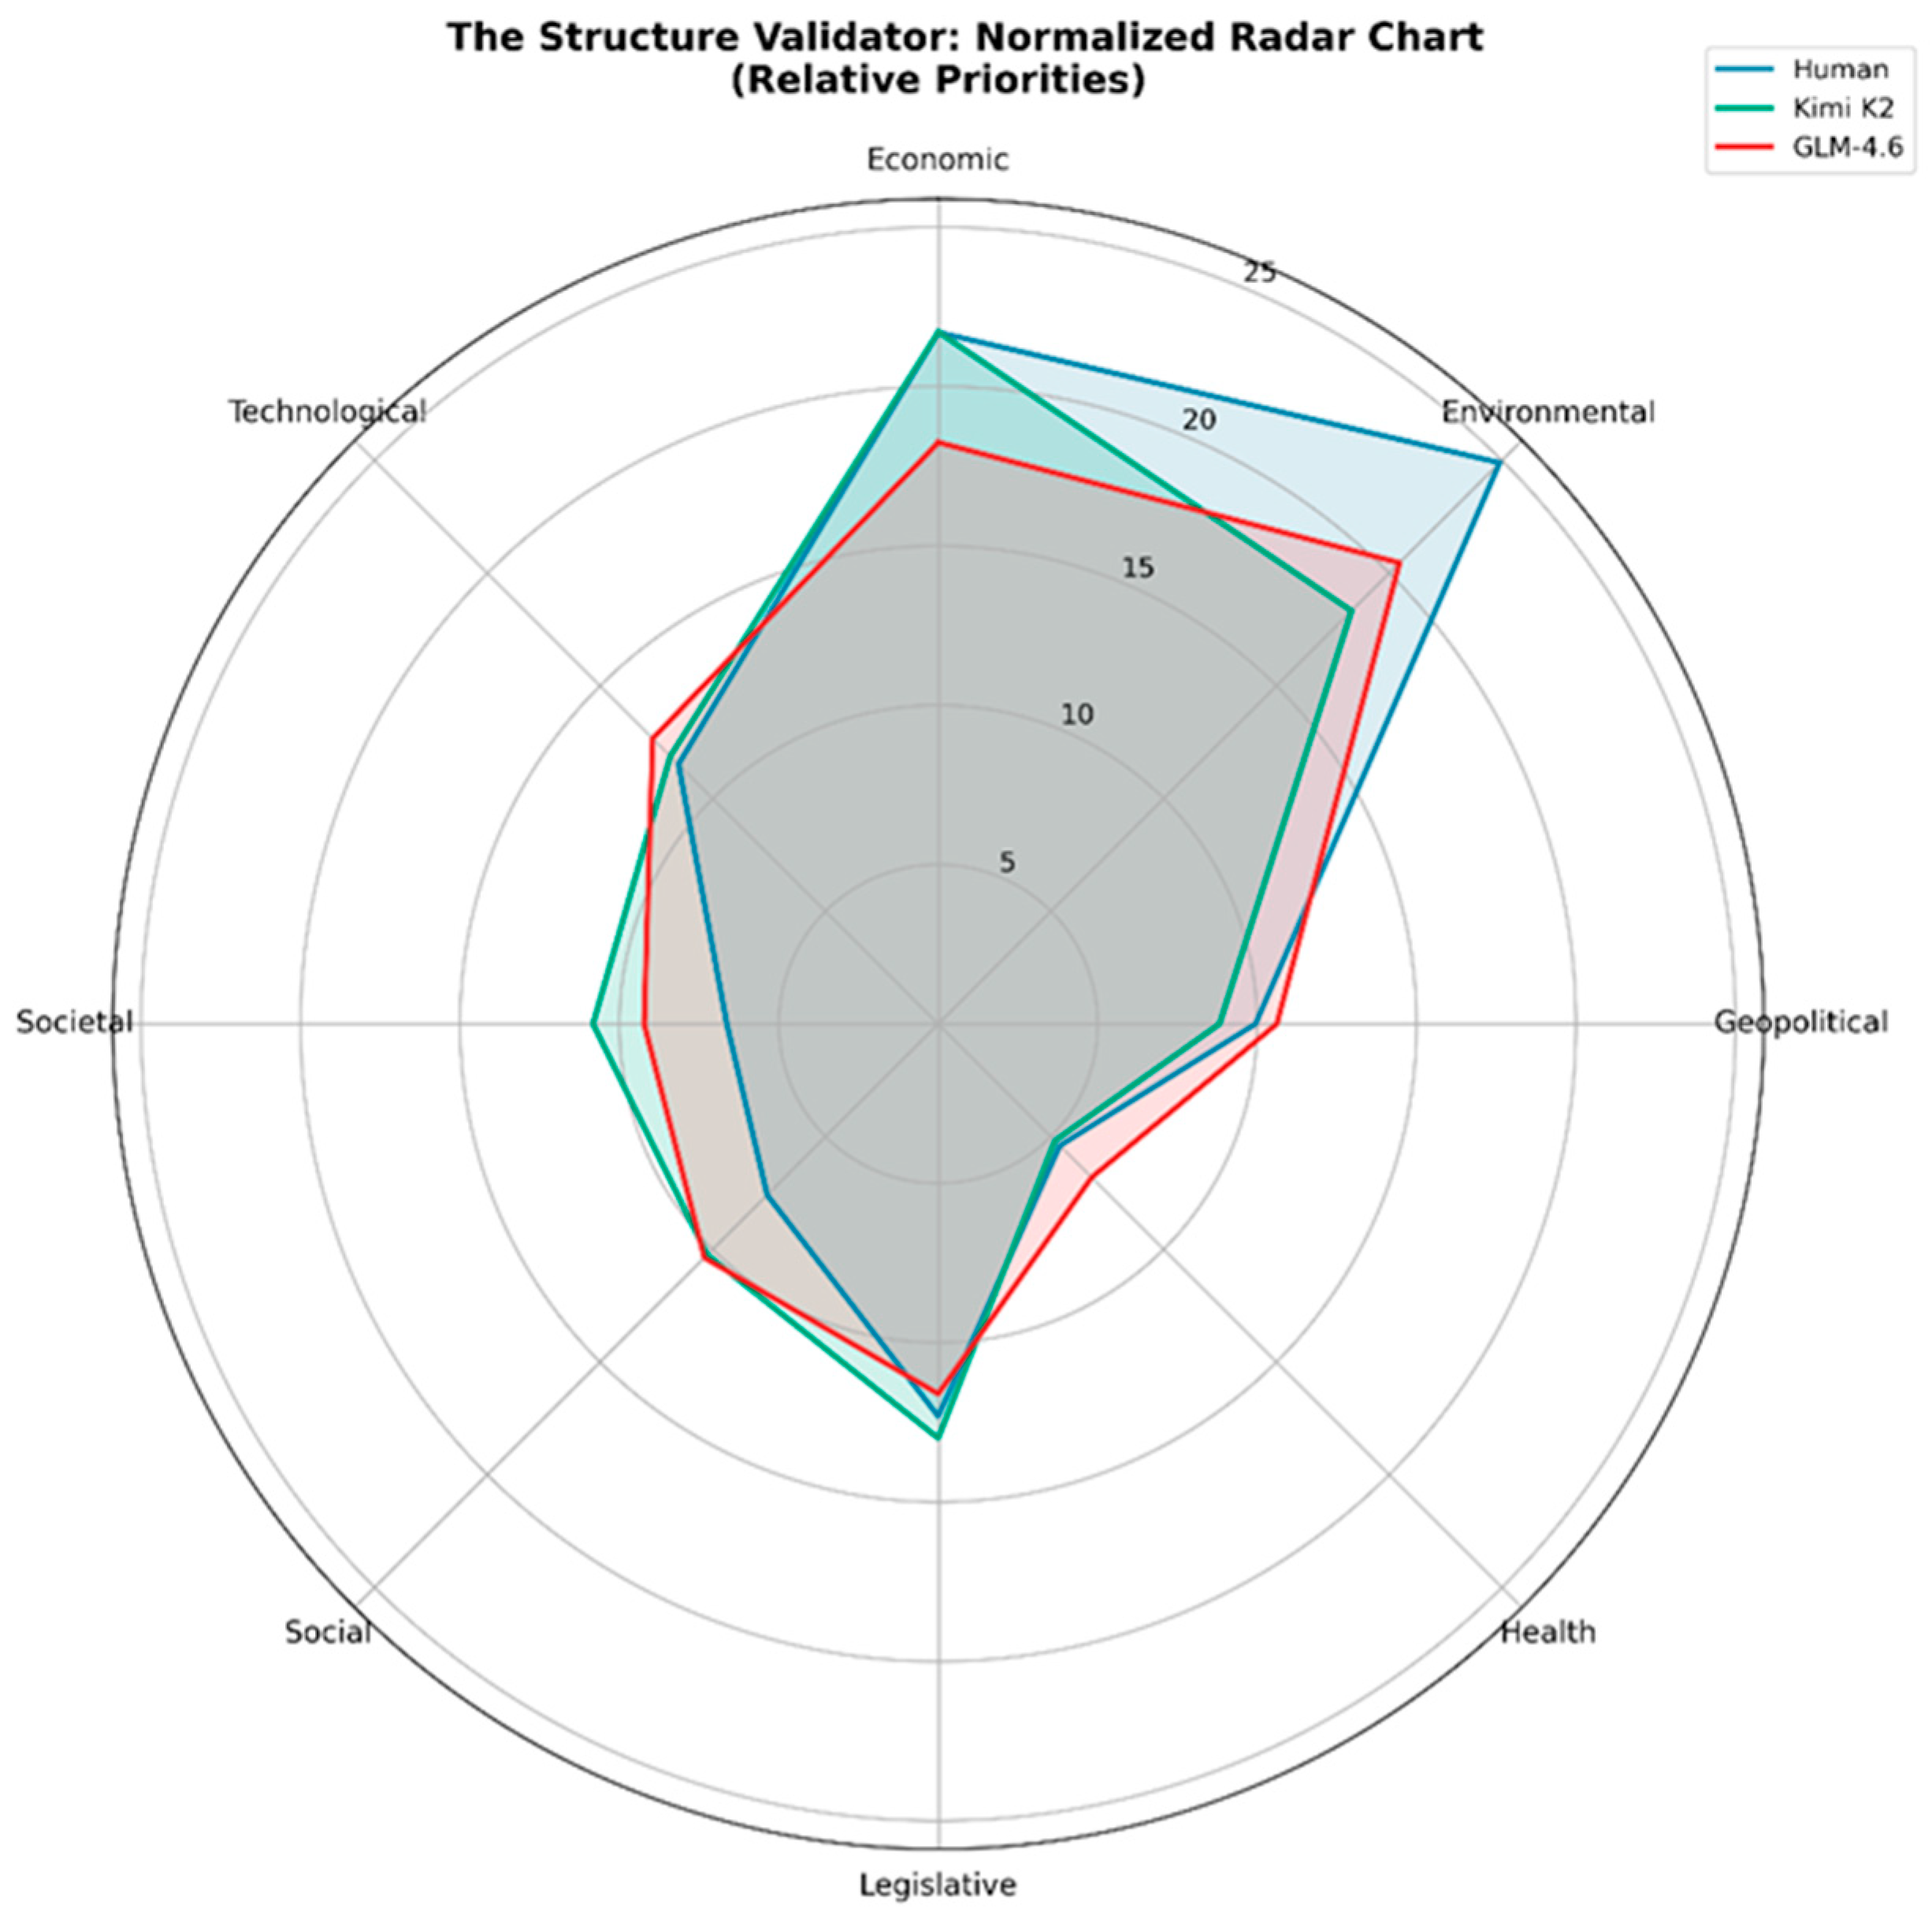
4.4.2. Structural Consistency and Relative Priorities
To evaluate whether the AI models prioritize risk categories similarly to the human expert independent of the absolute volume of codes a Normalized Radar Chart was employed (Figure 7). This visualization maps the multidimensional “risk profile” of the Green Deal policies, allowing for a direct comparison of the relative importance assigned to each risk category.
Figure 7.
Radar chart for structure validation.
Visual Analysis of Structural Alignment
The radar chart displays the normalized frequency of findings along eight radial axes, representing the risk categories. The superposition of the Human (blue line), Kimi (green line), and GLM (red line) data series reveals a high degree of structural consistency. The trajectories overlap significantly along the Economic, Technological, and Environmental axes, indicating that all three raters interpret the relative weight of these domains similarly.
Interpretation of Divergence
The primary structural deviation is observed along the Societal and Social axes. Here, the polygons representing the AI models expand outward beyond the human baseline. This radial expansion corroborates the finding from the distribution analysis: the models systematically over-index on social policy rhetoric compared to the human expert. However, the tight convergence on the dominant axes (Economic and Legislative) validates that the core “Transition Architecture” of the Green Deal is preserved across both human and automated analyses. This confirms that while the models may display higher sensitivity to specific social keywords, their fundamental interpretation of the policy’s risk hierarchy aligns with human expert judgment.
4.4.3. Pattern Recognition and Systematic Bias
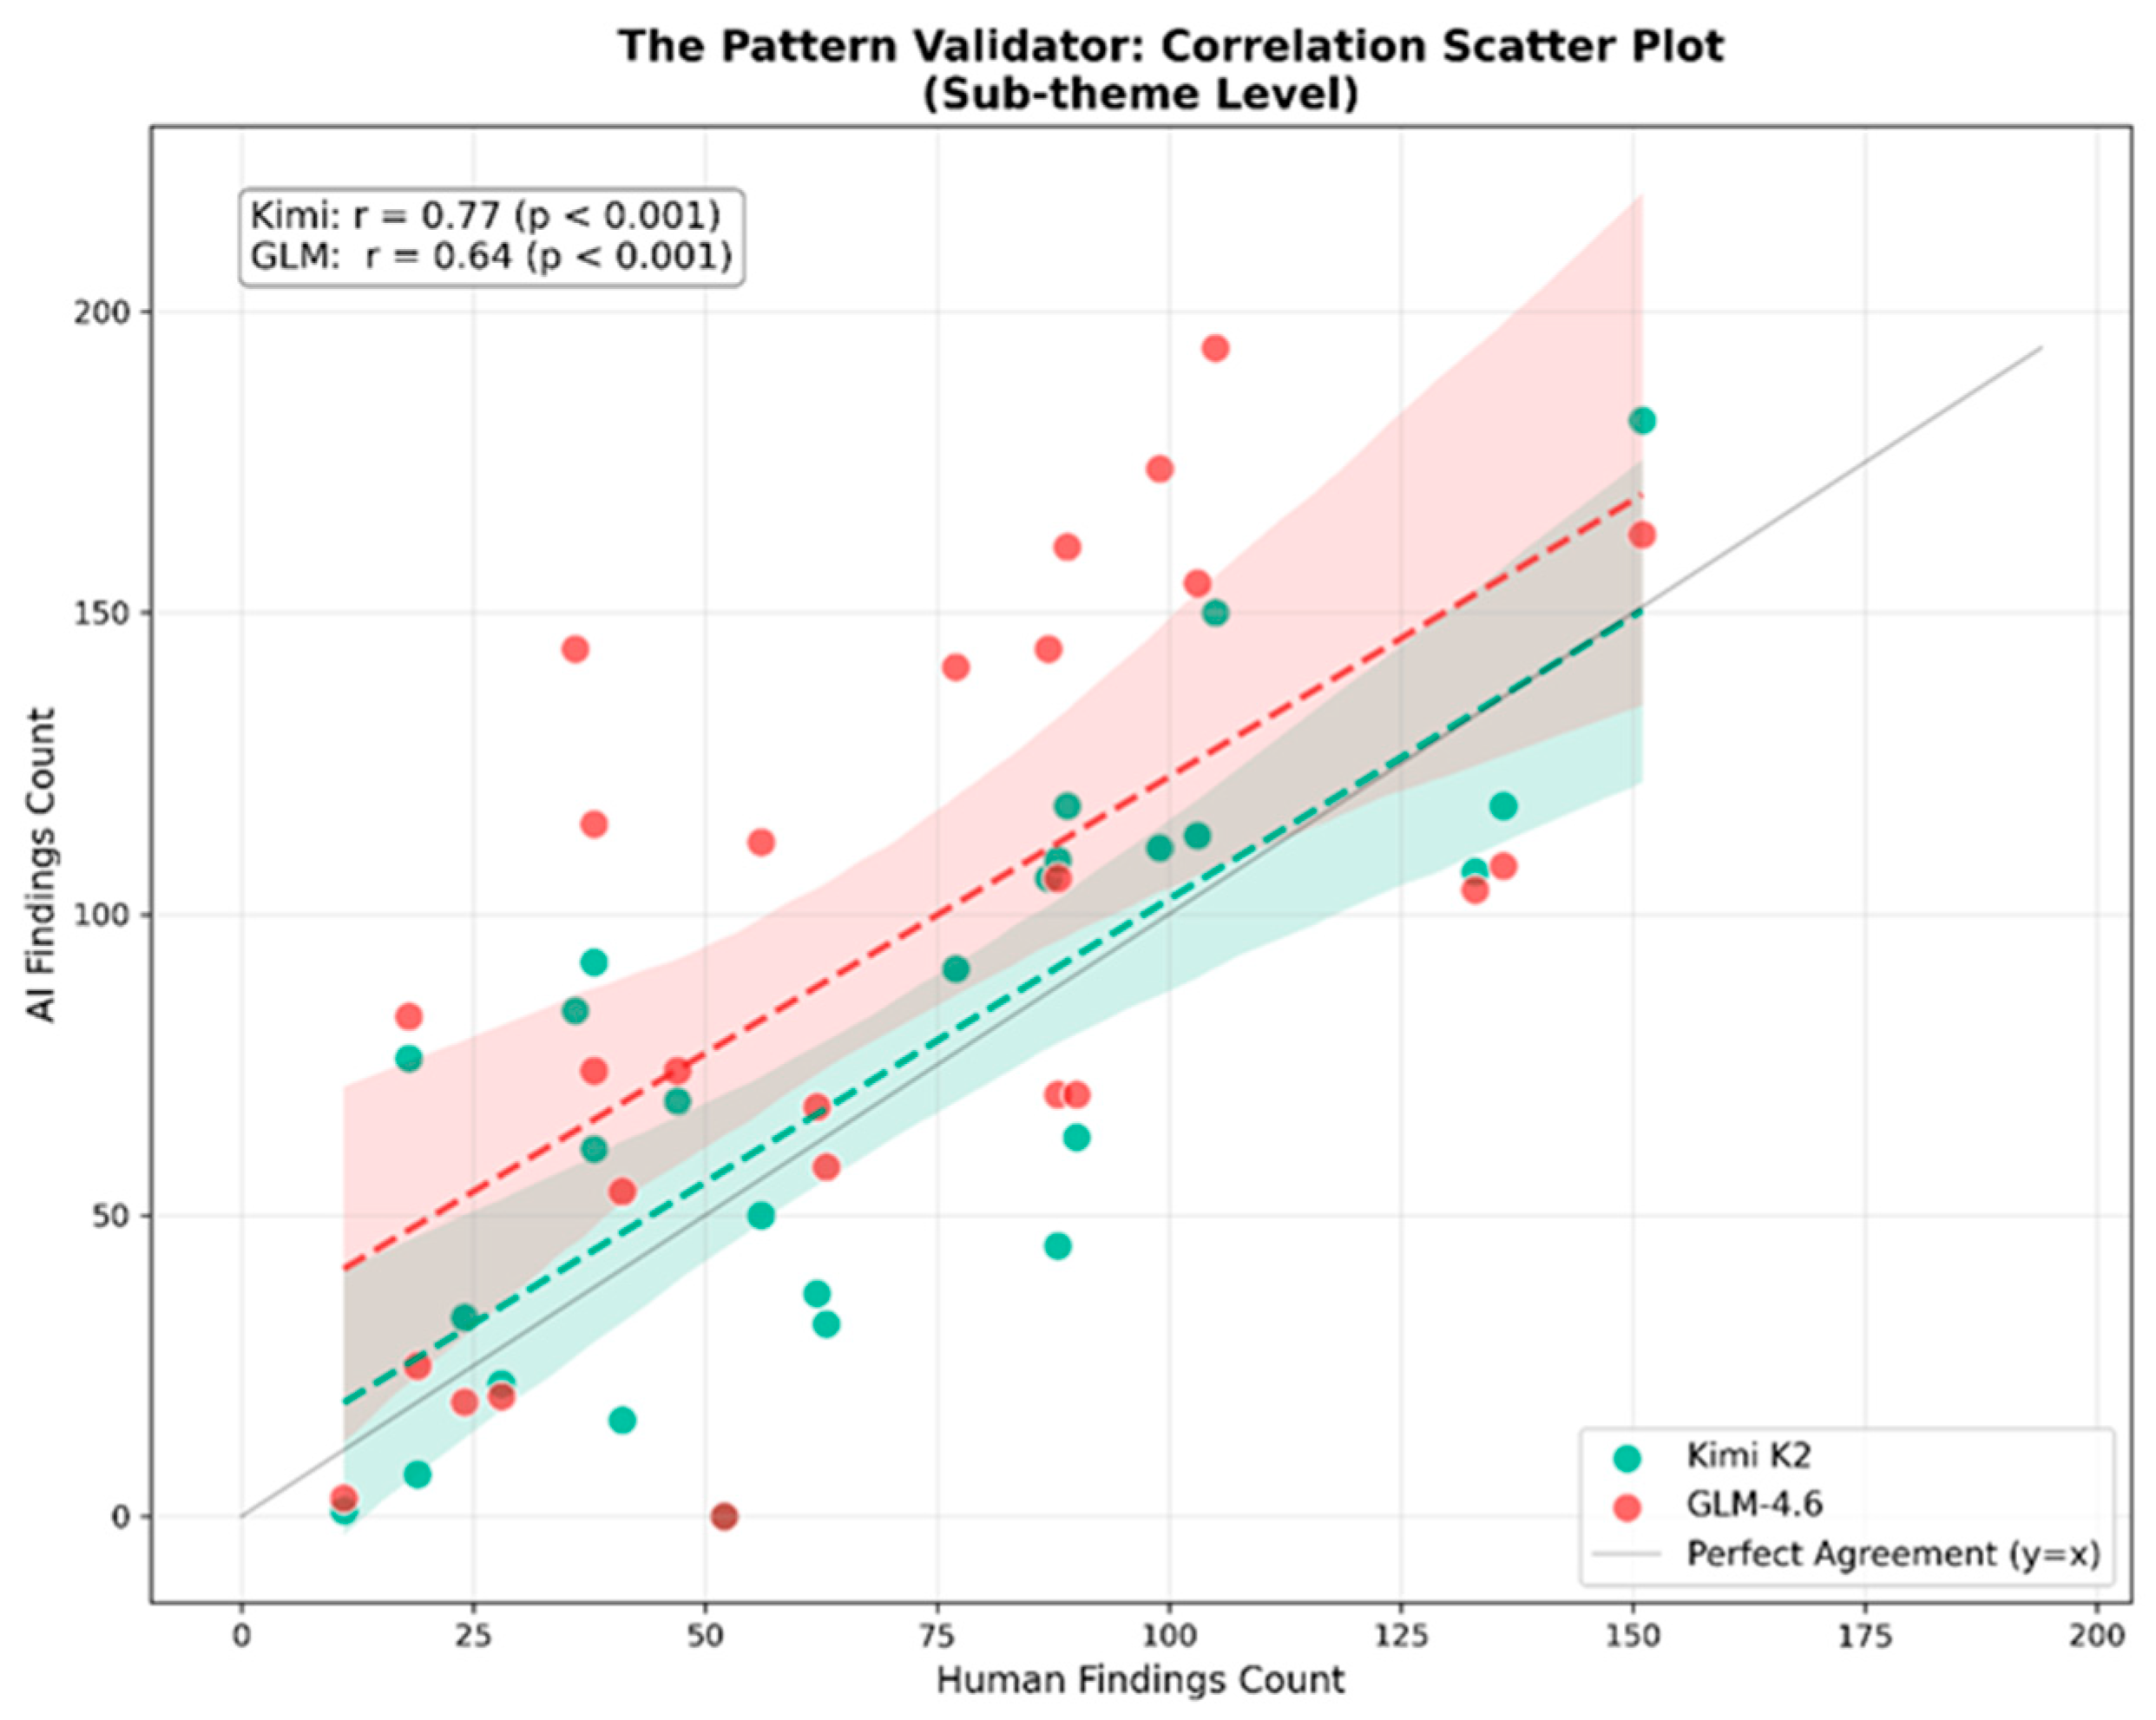
To evaluate the reliability of the automated coding intensity, a scatter plot analysis was conducted at the sub-theme level (Figure 8). This figure visualizes the quantitative relationship between the Human expert and the AI models, with the Human finding counts plotted on the X-axis and the corresponding AI finding counts on the Y-axis. The plot includes a diagonal identity line (y = xy = x), representing perfect agreement, and a regression line indicating the observed trend.
Figure 8.
Correlation between manually and LLM analyzed risk themes.
Analysis of Linear Correlation
The distribution of data points exhibits a distinct positive linear trend. This correlation indicates robust pattern recognition capabilities within the LLMs: as the frequency of risk identification by the Human coder increases within a specific category, the AI models demonstrate a concomitant increase. This linear alignment confirms that the automated systems are not generating random noise but are responding to the same semantic cues and textual signals as the expert coder.
Interpretation of Systematic Bias
Despite the strong correlation, the spatial distribution of the data points reveals a systematic deviation. The majority of the data points are positioned above the identity line (y = xy = x), indicating that both Kimi and GLM consistently identify a higher volume of risk references than the human expert for the same sub-themes. This phenomenon suggests that the LLMs operate with a higher sensitivity (recall) threshold, capturing broader and less explicit mentions of risk. In contrast, the human coder appears to apply a stricter interpretive filter (precision), likely excluding ambiguous or rhetorical references. Although the absolute volume of findings differs, the consistent directionality of the trend confirms the method’s reliability for identifying high-priority risk areas relative to one another. These divergences reflect differences in sensitivity rather than contradictions in interpretation, as the human-coded dataset remains the primary reference and the LLM outputs function solely as validation signals; consequently, variations in counts do not affect the reliability of the overall risk profile.
4.5. Synthesis of Findings: The Final EU Green Deal Risk Profile
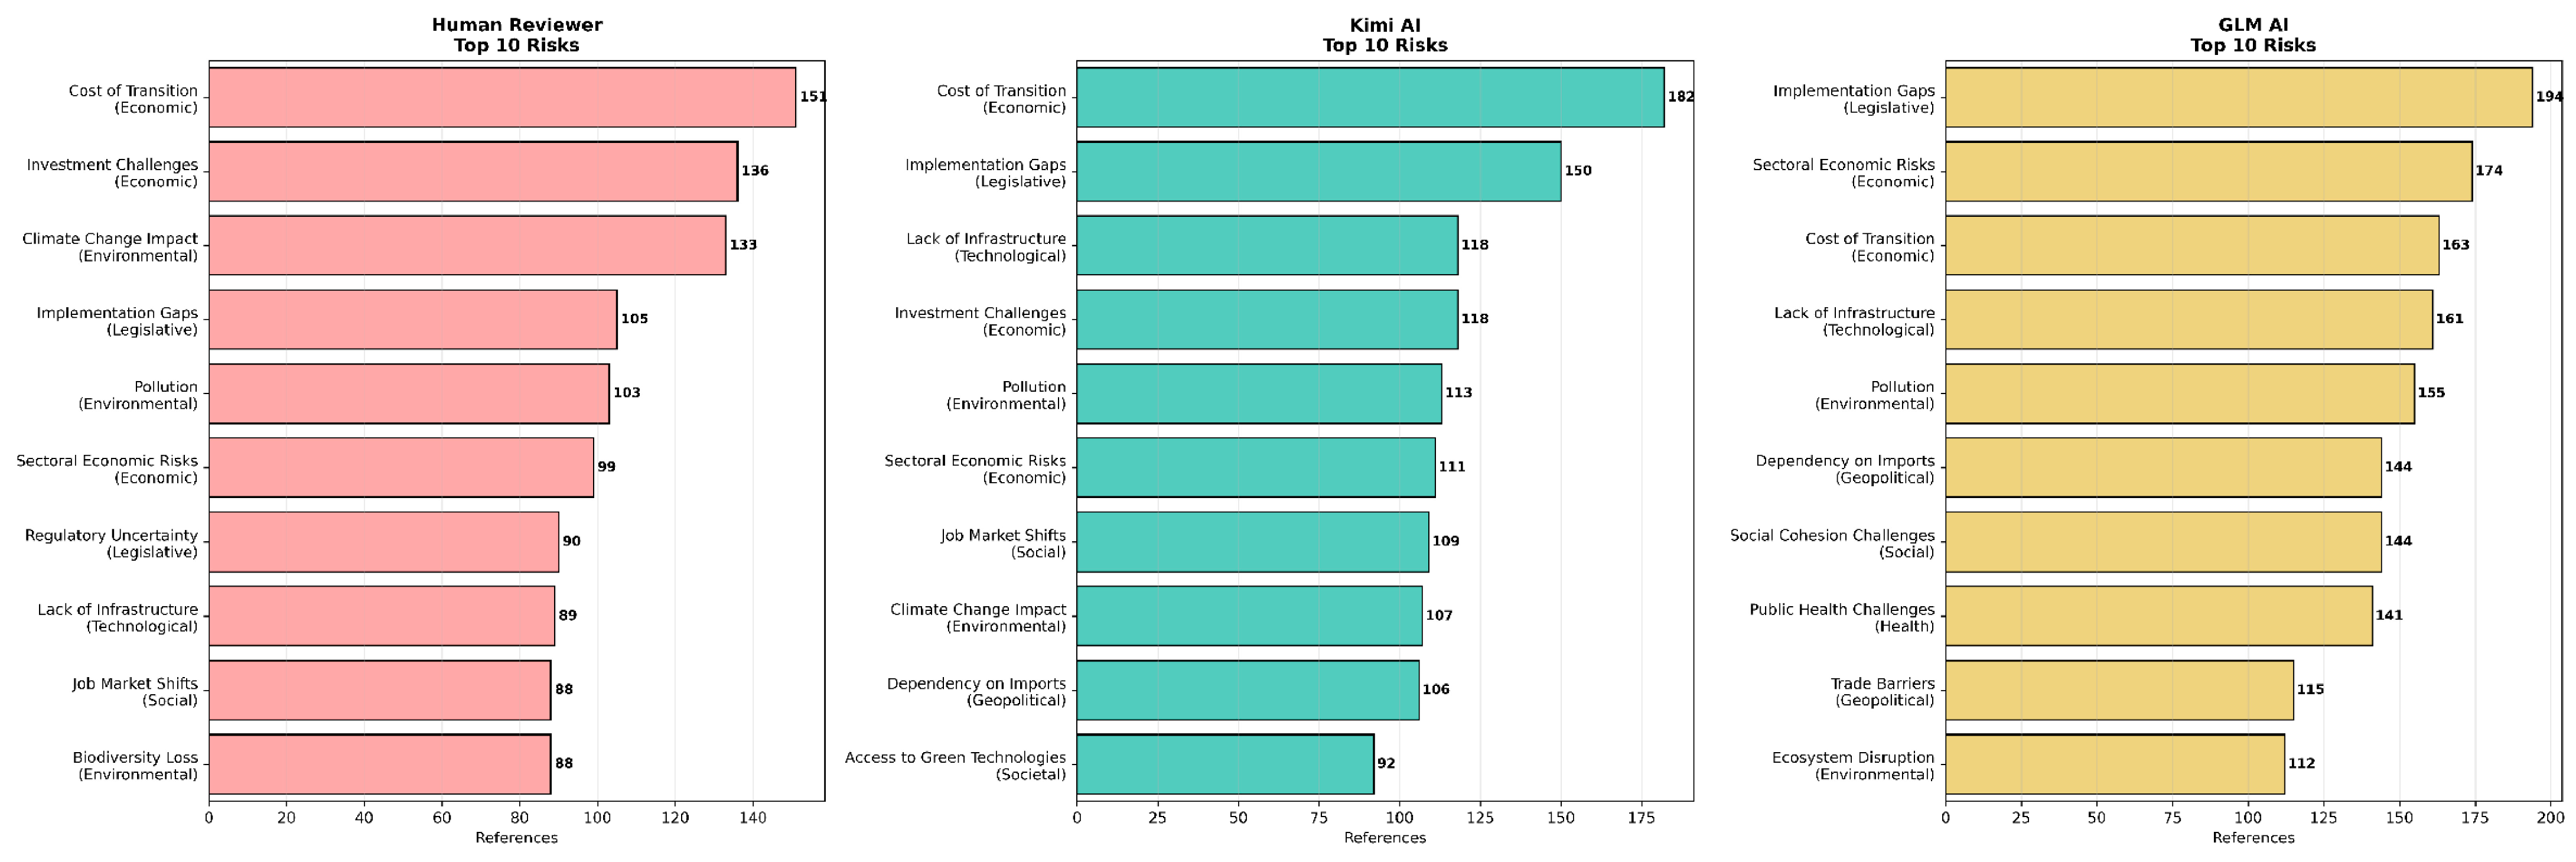
By integrating the validated outputs of the Human coder and the LLMs, a consolidated risk profile of the EGD was synthesized. A key outcome of this synthesis is the strong consistency between human and LLM analyses: the same leading risk categories recur across both approaches, and this reproducible pattern constitutes a central empirical finding of the study. Figure 9 presents a comparative analysis of the top 10 risk priorities identified by each rater, visualized as ranked horizontal bar charts. This comparison highlights both the consensus on core risks and the interpretive nuances specific to each rating method.
Figure 9.
Top 10 risk categories analyzed manually and by LLMs.
4.5.1. Divergent Prioritization and Interpretive Nuance
The Human coder’s prioritization profile is characterized by a pragmatic focus on execution and physical constraints. The top-ranked risks Cost of Transition, Investment Challenges, and Climate Change Impact emphasize financial feasibility and direct ecological threats. Conversely, the LLM raters, particularly GLM, exhibit a distinct shift toward the legislative and socio-political spheres. Risks such as Implementation Gaps and Societal Risks are ranked significantly higher by the models. This divergence reflects the AI’s heightened sensitivity to the bureaucratic, inclusive, and policy-heavy language that permeates EU documentation, which human experts may view as contextual rather than as primary risks.
4.5.2. The Aggregated Core Risk Architecture
Despite these interpretive shifts, a cross-validation of the rankings reveals three core risk domains that appear consistently across all top lists, constituting the definitive “Risk Architecture” of the Green Deal:
- Cost of Transition: The financial burden associated with shifting from linear to circular practices is the undisputed primary concern across all datasets.
- Implementation Gaps: The variability in how Member States enforce, transpose, and execute EU directives represents a critical systemic failure point identified by both human and machine.
- Pollution & Infrastructure: Operational challenges regarding emissions management and the physical capacity to support circular material flows remain central to the discourse.
The synthesis of these findings indicates that the EGD policy discourse is not primarily defined by abstract environmental aspirations, but rather by the concrete economic and legislative hurdles of implementation. The high prevalence of “Implementation Gaps” across all raters serves as a critical empirical signal to policymakers: the transition is currently threatened less by a lack of ambition than by a deficit in execution capacity.
5. Discussion
This study set out to examine how transition-related risks are implied and framed within the EGD corpus and to determine what these patterns reveal about the risk landscape affecting the construction sector. The findings directly address this research question by demonstrating that the same leading risk categories particularly Cost of Transition, Implementation Gaps, Climate Change Impact, Pollution and Investment Risks consistently recur across both manual and LLM-supported analyses. This confirms the need for a policy-level mapping, addressing the research gap identified in the Introduction, where previous literature focused mainly on project- or firm-level risks.
The findings also carry broader implications. The prominence of economic and legislative risks indicates that the EGD’s barriers lie not only in environmental pressures but also in financial and institutional execution capacity. For policymakers, this highlights the need to reduce regulatory fragmentation and strengthen implementation pathways. For scholars, the results demonstrate that policy documents themselves encode risk signals that shape institutional and market expectations a dimension rarely examined in the transition-risk literature.
Methodologically, the study shows that the mixed human–LLM approach provides strong structural consistency while maintaining the interpretive depth of expert judgement. This validates the method as a reliable tool for large policy corpora, while also underscoring that LLM outputs must be human anchored to avoid false sensitivity.
As with any qualitative content analysis, this study has some inherent limitations. The manual coding was conducted by a single analyst, which may introduce interpretive subjectivity, particularly when identifying implied rather than explicitly stated risks. The LLM-supported validation may also exhibit recall sensitivity, and frequency counts should be interpreted as indicators of textual prevalence rather than direct measures of risk importance.
Finally, future research should extend this framework longitudinally to track how the EGD risk structure evolves through policy cycles and examine how construction-sector stakeholders perceive and operationalise these policy-level risks within practice.
6. Conclusions
The central contribution of this study is the first systematic, policy-level mapping of transition risks embedded within the EGD, achieved through a validated mixed human–LLM content analysis. By integrating manual qualitative coding with LLM-based validation, the study moves beyond conventional project- or firm-level perspectives and provides a consolidated view of how transition-related risks are framed within EU policy discourse.
The analysis reveals that Economic and Legislative risks, especially Cost of Transition and Implementation Gaps, form the core vulnerabilities within the EGD framework. These findings indicate that the primary constraints of the green transition relate less to conceptual ambition and more to issues of financial feasibility and execution capacity. Without targeted interventions to address structural and regulatory uncertainties, the transition risks being slowed by systemic inertia. In doing so, the study directly answers its research question by demonstrating how key risk signals are articulated across EGD documents and how these patterns shape the risk landscape facing the construction sector.
Methodologically, the study shows that while LLMs offer scalability, reproducibility, and structural consistency, human expertise remains essential for interpreting context-dependent nuances related to technical, environmental, and systemic complexities. The hybrid approach employed here provides a robust and transparent framework for identifying implicit policy-level risks across large document corpora, offering clearer visibility into where policy ambition intersects with potential implementation risks.
Future research should extend this framework by conducting longitudinal analyses as EGD policies evolve from proposal to implementation, and by examining how transition risks identified at the EU level are understood and operationalized by construction-sector stakeholders. Such work would strengthen the alignment between high-level policy intent and on-the-ground readiness for a circular, low-carbon transition.
Author Contributions
Conceptualization, M.M., E.W. and S.I.; methodology, M.M. and E.W.; software, M.M. and A.R.; validation, M.M., A.R. and E.W.; formal analysis, M.M.; investigation, E.W. and S.I.; data curation, M.M.; writing—original draft preparation, M.M., E.W. and A.R.; writing—review and editing, M.M., E.W. and S.I.; visualization, M.M. and E.W.; supervision, E.W. and S.I.; project administration, M.M., E.W. and S.I.; funding acquisition, E.W. and S.I. All authors have read and agreed to the published version of the manuscript.
Funding
This research has been co-funded by the Housing Decarbonisation Skills for Climate, Health, and Jobs (Skills4Deca) project—grant number DIGITAL-2022-SKILLS-03-SPECIALISEDEDU-101123311 of the European Union’s Digital Europe Programme; Empowering Trainers for Digital innovation in construction Ecosystem (ET4D) project—grant number 2024-1-IT01-KA220-VET-000249119; and REnewable and SUstainable REhabilitation of Cultural and HisToric buildings After Disaster (RESUrRECT—AiD) project—grant number 2025-1-IT02-KA220-HED-000361564 both of the Erasmus Plus Programme of the European Union. The European Commission’s support in producing this publication does not constitute an endorsement of the contents that reflect the views only of the authors, and the Commission cannot be held responsible for any use that may be made of the information contained therein.
Institutional Review Board Statement
Not applicable.
Informed Consent Statement
Not applicable.
Data Availability Statement
The raw data supporting the conclusions of this article will be made available by the authors on request.
Conflicts of Interest
The authors declare no conflicts of interest.
Appendix A
Table A1.
The list of all documents analyzed in this study.
References
- Bonoli, A.; Zanni, S.; Serrano-Bernardo, F. Sustainability in Building and Construction within the Framework of Circular Cities and European New Green Deal. The Contribution of Concrete Recycling. Sustainability 2021, 13, 2139. [Google Scholar] [CrossRef] [Scilit]
- Khan, T. Circular-ESG Model for Regenerative Transition. Sustainability 2024, 16, 7549. [Google Scholar] [CrossRef] [Scilit]
- UNFCCC The Paris Agreement|UNFCCC. Available online: https://unfccc.int/process-and-meetings/the-paris-agreement (accessed on 11 October 2025).
- Aziz, K.M.A.; Daoud, A.O.; Singh, A.K.; Alhusban, M. Integrating Digital Mapping Technologies in Urban Development: Advancing Sustainable and Resilient Infrastructure for SDG 9 Achievement—A Systematic Review. Alexandria Eng. J. 2025, 116, 512–524. [Google Scholar] [CrossRef] [Scilit]
- European Green Deal—European Commission. Available online: https://commission.europa.eu/strategy-and-policy/priorities-2019-2024/european-green-deal_en (accessed on 11 January 2026).
- de las Heras, B.P. The ‘Fit for 55′ Package: Towards a More Integrated Climate Framework in the EU. Rom. J. Eur. Aff. 2022, 22, 63–78. [Google Scholar]
- WBCSD. Circular Economy Action Plan (CEAP) 2020 Summary for Business Implications and Next Steps; WBCSD: Geneva, Switzerland, 2020; 24p. [Google Scholar]
- Falsafi, A.; Togiani, A.; Colley, A.; Varis, J.; Horttanainen, M. Life Cycle Assessment in Circular Design Process: A Systematic Literature Review. J. Clean. Prod. 2025, 521, 146188. [Google Scholar] [CrossRef] [Scilit]
- Construction Products Regulation 2024. Available online: https://www.gov.ie/en/department-of-housing-local-government-and-heritage/publications/construction-products-regulation-2024/ (accessed on 11 January 2026).
- Bao, N.; Nguyen, L. Circular Economy in the Finnish Housing Construction: The Influence of Finnish Government Policies and EU Regulations on the Sustainable Development in the Finnish Housing Construction Sector. Bachelor’s Thesis, Lappeenranta–Lahti University of Technology LUT, Lappeenranta, Finland, 2025. [Google Scholar]
- Gonzalez-Gaya, C.; Sanchez-Lite, A.; María Villena Escribano, B.; Ates Kiral, I. Contextual Evaluation of Risk Identification Techniques for Construction Projects: Comparative Insights and a Decision-Support Model. Buildings 2025, 15, 3806. [Google Scholar] [CrossRef] [Scilit]
- Lawrence, J.; Blackett, P.; Cradock-Henry, N.A. Cascading Climate Change Impacts and Implications. Clim. Risk Manag. 2020, 29, 100234. [Google Scholar] [CrossRef] [Scilit]
- Charef, R.; Morel, J.-C.; Rakhshan, K.; Raimo, N.; Vitolla, F.; Malandrino, O.; Esposito, B.; Fokaides, P. Barriers to Implementing the Circular Economy in the Construction Industry: A Critical Review. Sustainability 2021, 13, 12989. [Google Scholar] [CrossRef] [Scilit]
- Krajewska, A.; Siewczyńska, M. Circular Economy in the Construction Sector in Materials, Processes, and Case Studies: Research Review. Sustainability 2025, 17, 7029. [Google Scholar] [CrossRef] [Scilit]
- Han, N.; Um, J. Risk Management Strategy for Supply Chain Sustainability and Resilience Capability. Risk Manag. 2024, 26, 6. [Google Scholar] [CrossRef] [Scilit]
- Mehra, S.; Singh, M.; Sharma, G.; Kumar, S.; Navishi; Chadha, P. Impact of Construction Material on Environment. In Ecological and Health Effects of Building Materials; Springer Nature: London, UK, 2022; pp. 427–442. [Google Scholar] [CrossRef] [Scilit]
- Rees, W.E. The Built Environment and the Ecosphere: A Global Perspective. Build. Res. Inf. 1999, 27, 206–220. [Google Scholar] [CrossRef] [Scilit]
- Ness, D.A.; Xing, K. Toward a Resource-Efficient Built Environment: A Literature Review and Conceptual Model. J. Ind. Ecol. 2017, 21, 572–592. [Google Scholar] [CrossRef] [Scilit]
- Thomas, S.T.; Chan, J.H.L.; Chan, G.K.C.; Zou, J.W.W. Environmental Impacts of Construction Material Production. Proc. Inst. Civ. Eng. Eng. Sustain. 2017, 170, 169–184. [Google Scholar] [CrossRef] [Scilit]
- TWBAR. The World Bank Annual Report 2022: Helping Countries Adapt to a Changing World. Available online: https://documents.worldbank.org/en/publication/documents-reports/documentdetail/099030009272214630/bosib0db37c9aa05a0961a08a83a0ea76ea (accessed on 11 October 2025).
- WRI. World Greenhouse Gas Emissions: 2020|World Resources Institute. Available online: https://www.wri.org/data/world-greenhouse-gas-emissions-2020 (accessed on 11 October 2025).
- Papamichael, I.; Voukkali, I.; Loizia, P.; Zorpas, A.A. Construction and Demolition Waste Framework of Circular Economy: A Mini Review. Waste Manag. Res. 2023, 41, 1728–1740. [Google Scholar] [CrossRef] [Scilit]
- Osei-Tutu, S.; Ayarkwa, J.; Osei-Asibey, D.; Nani, G.; Afful, A.E. Barriers Impeding Circular Economy (CE) Uptake in the Construction Industry. Smart Sustain. Built Environ. 2023, 12, 892–918. [Google Scholar] [CrossRef] [Scilit]
- Elisha, O.D. Moving Beyond Take-Make-Dispose to Take-Make-Use for Sustainable Economy. Int. J. Sci. Res. Educ. 2020, 13, 497–516. [Google Scholar]
- Howard, M.; Hopkinson, P.; Miemczyk, J. The Regenerative Supply Chain: A Framework for Developing Circular Economy Indicators. Int. J. Prod. Res. 2019, 57, 7300–7318. [Google Scholar] [CrossRef] [Scilit]
- Pomponi, F.; Moncaster, A. Circular Economy for the Built Environment: A Research Framework. J. Clean. Prod. 2017, 143, 710–718. [Google Scholar] [CrossRef] [Scilit]
- Osobajo, O.A.; Oke, A.; Omotayo, T.; Obi, L.I. A Systematic Review of Circular Economy Research in the Construction Industry. Smart Sustain. Built Environ. 2022, 11, 39–64. [Google Scholar] [CrossRef] [Scilit]
- Hassan, M.S.; Ali, Y.; Petrillo, A.; De Felice, F. Risk Assessment of Circular Economy Practices in Construction Industry of Pakistan. Sci. Total Environ. 2023, 868, 161418. [Google Scholar] [CrossRef] [Scilit]
- Beck, U. RISK SOCIETY—Towards a New Modernity; Sage Publications Ltd.: Thousand Oaks, CA, USA, 1992; ISBN 9780803983465. [Google Scholar]
- Kaplan, S. The Words of Risk Analysis. Risk Anal. 1997, 17, 407–417. [Google Scholar] [CrossRef] [Scilit]
- ISO 31000:2018; Risk Management—Guidelines. ISO: Geneva, Switzerland, 2018. Available online: https://www.iso.org/standard/65694.html (accessed on 11 January 2026).
- Bernstein, P.L. Aganst the Gods—The Remarkable True Story of Risk; John Wiley & Sons: Hoboken, NJ, USA, 1998; ISBN 978-0-471-29563-1. [Google Scholar]
- Helbing, D. Globally Networked Risks and How to Respond. Nature 2013, 497, 51–59. [Google Scholar] [CrossRef] [Scilit]
- TCFD. Recommendations of the Task Force on Climate-Related Financial Disclosures. In Task Force on Climate-Related Financial Disclosures; TCFD: Basel, Switzerland, 2017; pp. 1–74. [Google Scholar]
- Hartvig, A.D.; Simo, M.; Fazekas, D.; Fragkos, P.; Fragkiadakis, K.; Fragkiadakis, D.; Vrontisi, Z. Comparing Economic Impacts of Net-Zero Transition with Climate Damage Uncertainties Using a Dual-Model Approach. Environ. Res. Energy 2025, 2, 035005. [Google Scholar] [CrossRef] [Scilit]
- WEF WORLD ECONOMIC FORUM: Annual Meeting. Africa Res. Bull. Econ. Financ. Tech. Ser. 2024, 61, 24581B–24582A. [CrossRef] [Scilit]
- IPCC. Climate Change 2022: Impacts, Adaptation and Vulnerability|Climate Change 2022: Impacts, Adaptation and Vulnerability. Available online: https://www.ipcc.ch/report/ar6/wg2/ (accessed on 11 October 2025).
- Van Tam, N. Mitigating Digital Transformation Risks for Circular Construction in Emerging Economies: An Empirical Investigation in Vietnam. Int. J. Constr. Manag. 2024, 25, 1130–1140. [Google Scholar] [CrossRef] [Scilit]
- Mollaei, A.; Eliote, G.; Guerra, B.; Shahi, S.; Leite, F.; Haas, C.; Weber, O. A Transition Management Framework for Implementing Circular Economy in the Construction Industry. Constr. Res. Congr. 2024, 2, 56–65. [Google Scholar] [CrossRef] [Scilit]
- Manu, E.; Ankrah, N.A.; Bentrar, J. Transitioning from a Linear to a Circular Construction Supply Chain. In Climate Emergency—Managing, Building, and Delivering the Sustainable Development Goals; Springer Nature: Cham, Switzerland, 2022; pp. 33–44. [Google Scholar] [CrossRef] [Scilit]
- Aldemir, B.; Aslan, M. A Strategic Analysis of Construction Organizations during the Industry’s Transition to a Circular Economy. Yönetim Bilim. Derg. 2024, 22, 2302–2331. [Google Scholar] [CrossRef] [Scilit]
- Ferriz-Papi, J.A.; Lee, A.; Alhawamdeh, M. Examining the Challenges for Circular Economy Implementation in Construction and Demolition Waste Management: A Comprehensive Review Using Systematic Methods. Buildings 2024, 14, 1237. [Google Scholar] [CrossRef] [Scilit]
- IEA. World Energy Outlook 2022; IEA: Paris, France, 2022. [Google Scholar]
- Nilsson, L.J.; Bauer, F.; Åhman, M.; Andersson, F.N.G.; Bataille, C.; de la Rue du Can, S.; Ericsson, K.; Hansen, T.; Johansson, B.; Lechtenböhmer, S.; et al. An Industrial Policy Framework for Transforming Energy and Emissions Intensive Industries towards Zero Emissions. Clim. Policy 2021, 21, 1053–1065. [Google Scholar] [CrossRef] [Scilit]
- Stojkov, A.; Warin, T. United Europe: Boundaries and Challenges; Springer: Cham, Switzerland, 2025; pp. 1–73. ISBN 978-3-031-86465-0. [Google Scholar]
- Semieniuk, G.; Campiglio, E.; Mercure, J.F.; Volz, U.; Edwards, N.R. Low-Carbon Transition Risks for Finance. Wiley Interdiscip. Rev. Clim. Change 2021, 12, e678. [Google Scholar] [CrossRef] [Scilit]
- Witt, E. Risks in Transitioning to a Circular Economy in the Construction Sector; Springer Nature: Cham, Switzerland, 2025; pp. 411–423. [Google Scholar]
- Wuni, I.Y.; Abankwa, D.A. Understanding the Key Risks in Circular Construction Projects: From Systematic Review to Conceptual Framework. Constr. Innov. 2025, 25, 1085–1107. [Google Scholar] [CrossRef] [Scilit]
- Khan, A.A.; Yu, R.; Liu, T.; Gu, N.; Walsh, J. Volumetric Modular Construction Risks: A Comprehensive Review and Digital-Technology-Coupled Circular Mitigation Strategies. Sustainability 2023, 15, 7019. [Google Scholar] [CrossRef] [Scilit]
- Boban, M.; Radoykova, G.; Sofia University St Kliment Ohridski, S.; Anthon Mark Jay Alguno Rivas, B.; Pocher, E.; Klosi, D.; Stojkovski, F.; Chebchoub, Z.; AlMaqbali, M.; AlMessabi, R.; et al. Towards a Sustainable Urban Development: Challenges, Risks, and Opportunities in Transitioning into Circular Construction. Int. Acad. J. 2021, 2, 40–56. [Google Scholar]
- Thirumal, S.; Udawatta, N.; Karunasena, G.; Al-Ameri, R. Barriers to Adopting Digital Technologies to Implement Circular Economy Practices in the Construction Industry: A Systematic Literature Review. Sustainability 2024, 16, 3185. [Google Scholar] [CrossRef] [Scilit]
- Gastaldi, M.; Kumar, N.M.; Pasqualotto, C.; Callegaro-De-Menezes, D.; Stephanus, C.; Schutte, L. An Overview and Categorization of the Drivers and Barriers to the Adoption of the Circular Economy: A Systematic Literature Review. Sustainability 2023, 15, 10532. [Google Scholar] [CrossRef] [Scilit]
- Warren, K.F. Implementation: How Great Expectations in Washington Are Dashed in Oakland; Or Why It’s Amazing That Federal Programs Work at All. Jeffrey, L. Pressman, Aaron, B. Wildavsky. J. Polit. 1974, 36, 1090–1091. [Google Scholar] [CrossRef] [Scilit]
- Heinz, E.; Sovacool, B.K.; Kwan, T.; Petit, V. Reviewing the 95 Sociotechnical Barriers to the Decarbonization of Buildings. Nat. Commun. 2025, 16, 9983. [Google Scholar] [CrossRef] [Scilit]
- Rosário, A.T.; Lopes, P.; Rosário, F.S. Sustainability and the Circular Economy Business Development. Sustainability 2024, 16, 6092. [Google Scholar] [CrossRef] [Scilit]
- Wu, J.; Ye, X.; Cui, H. Recycled Materials in Construction: Trends, Status, and Future of Research. Sustainability 2025, 17, 2636. [Google Scholar] [CrossRef] [Scilit]
- Villaizän Marïn, P. Study and Analysis of the Transition towards a Circular Economy in the Construction Sector. Business Models, Indicators and Assessment Methods. Covering a Case Study for the Economic Evaluation as a Design Parameter in Collaboration with Arkitema. Master’s Thesis, Technical University of Denmark, Lyngby, Denmark, 2022. [Google Scholar]
- Brändström, J.; Jazairy, A.; Roos Lindgreen, E. Barriers to Adopting Circular Business Models: A Cross-Sectoral Analysis. Bus. Strateg. Environ. 2024, 33, 4331–4350. [Google Scholar] [CrossRef] [Scilit]
- Ngai, E.W.T.; Lui, A.K.H.; Kei, B.C.W. Natural Language Processing in Government Applications: A Literature Review and a Case Analysis. Ind. Manag. Data Syst. 2025, 125, 2067–2104. [Google Scholar] [CrossRef] [Scilit]
- Popa, M. Modelling Policy Action Using Natural Language Processing: Evidence for a Long-Run Increase in Policy Activism in the UK. J. Comput. Soc. Sci. 2025, 8, 47. [Google Scholar] [CrossRef] [Scilit]
- Errichiello, G.; Falcone, P.M.; Popoyan, L. Navigating Climate Policy: The Influence of Lobbying Trends and Narratives in Europe. Environ. Sci. Policy 2025, 163, 103974. [Google Scholar] [CrossRef] [Scilit]
- Domorenok, E.; Graziano, P. Understanding the European Green Deal: A Narrative Policy Framework Approach. Eur. Policy Anal. 2023, 9, 9–29. [Google Scholar] [CrossRef] [Scilit]
- Askar, R.; Karaca, F.; Salles, A.; Lukyanenko, A.; Cervantes Puma, G.C.; Tavares, V.; Khaidarova, A.; Nadaždi, A.; Pineda-Martos, R.; Díaz-Cabrera, J.M.; et al. Driving the Built Environment Twin Transition: Synergising Circular Economy and Digital Tools. In Circular Economy Design and Management in the Built Environment: A Critical Review of the State of the Art; Springer: Cham, Switzerland, 2025; pp. 459–505. [Google Scholar] [CrossRef] [Scilit]
- Tai, R.H.; Bentley, L.R.; Xia, X.; Sitt, J.M.; Fankhauser, S.C.; Chicas-Mosier, A.M.; Monteith, B.G. An Examination of the Use of Large Language Models to Aid Analysis of Textual Data. Int. J. Qual. Methods 2024, 23, 16094069241231168. [Google Scholar] [CrossRef] [Scilit]
- Braun, V.; Clarke, V. Using Thematic Analysis in Psychology. Qual. Res. Psychol. 2006, 3, 77–101. [Google Scholar] [CrossRef] [Scilit]
- Miles, M.B.; Huberman, A.M.; Saldana, J. Qualitative Data: A Methods Sourcebook; Sage Publications: Thousand Oaks, CA, USA, 2015; Volume 16, ISBN 0123456789. [Google Scholar]

Disclaimer/Publisher’s Note: The statements, opinions and data contained in all publications are solely those of the individual author(s) and contributor(s) and not of MDPI and/or the editor(s). MDPI and/or the editor(s) disclaim responsibility for any injury to people or property resulting from any ideas, methods, instructions or products referred to in the content. |
© 2026 by the authors. Licensee MDPI, Basel, Switzerland. This article is an open access article distributed under the terms and conditions of the Creative Commons Attribution (CC BY) license.