


Abstract
Accessible and comfortable public transportation is a cornerstone of sustainable and inclusive urban mobility. However, there is a knowledge gap in how interior layout influences riders’ comfort perception under constant occupancy conditions. We conducted a pilot laboratory experiment in Valparaíso, Chile using a full-scale urban bus mock-up. Twenty-five participants each experienced four seating scenarios (yielding 100 total observations per outcome) that varied seat pitch (20, 30, 45 cm) and seat orientation (forward-facing vs. side-facing). Cumulative link mixed models were used to estimate seat pitch and orientation effects on the comfort outcomes, with participant-specific random intercepts. Increased seat pitch dramatically improved comfort ratings (e.g., virtually no participants felt comfortable at 20 cm, whereas nearly all did at 45 cm). Side-facing bench seating (longitudinal orientation) yielded significantly higher comfort, legroom, and ease-of-movement ratings than the forward-facing configuration at ~30 cm pitch (p < 0.001). Within the tested mock-up conditions, the results suggest that seat pitch is a major driver of perceived comfort and in-vehicle usability, and that a side-facing bench layout (tested at ~30 cm spacing) can improve perceived spaciousness relative to forward-facing seating. Because this is a small, non-probability pilot sample and a partial factorial design, these findings should be considered preliminary design sensitivities that warrant validation in larger, in-service studies before informing fleet-wide standards.
1. Introduction
Beyond meeting the essential requirements for people with disabilities [1,2,3,4], accessibility in public transport should also be understood more broadly as creating environments that are easy to use, comfortable, and intuitive for all passengers, including young, healthy, and “typical” users. Everyday travel involves diverse needs: people carrying bags or strollers, students with backpacks, older adults without a formal disability, or simply riders who are tired after work. Designs that reduce physical effort, minimize crowding, and facilitate movement inside the vehicle not only benefit persons with disabilities but also improve usability and comfort for the general population. In this sense, universal accessibility is not limited to compliance with technical regulations; it is a human-centered approach that aims to make buses more welcoming, legible, and comfortable for everyone who uses them, recognizing that all passengers may experience temporary or situational limitations at different moments in their lives.
Therefore, there is growing recognition that interior layout and comfort affect the overall accessibility and attractiveness of public transport. The social imperative extends to ensuring dignified and comfortable travel for everyone, not only those with visible disabilities. Discomfort or difficulty moving inside a vehicle can deter older adults, pregnant women, or anyone with mobility limitations from using transit, undermining the inclusivity goal of Sustainable Development Goal 11 (making cities and transport safe, accessible, and inclusive). However, research into specific design factor, such as seat pitch (legroom spacing between rows of seats) and seat orientation (forward- or backward-facing vs. longitudinal sideways placement), and their causal impact on passenger comfort remains limited [5]. Empirical evidence does indicate that perceived ride comfort decreases as crowding (passenger load) and travel time increase [6]. Moreover, seating configuration matters: riders tend to prefer transverse (forward-facing) seats in high-occupancy conditions [7], whereas longitudinal bench seats (facing the aisle) can be less comfortable or secure especially when the vehicle is in motion. These insights hint that layout features like aisle width and seat arrangement could significantly influence perceived comfort and usability, yet quantitative evaluations of these effects in city buses are scarce [5].
Existing norms in regions such as the EU (UNECE Regulation 107) and the United States (ADA guidelines) prioritize minimum accessibility requirements. However, these standards rarely address how interior layout affects perceived comfort or subjective accessibility for the general population, including older adults or individuals with reduced mobility. Prior studies document that comfort, in-vehicle usability/ease of movement, and service quality are strong determinants of user satisfaction and transit use [8,9]. Nevertheless, empirical evidence on how interior geometry influences comfort is limited, especially in controlled settings that allow causal inference.
There is thus a pertinent evidence gap: how do modifications in the bus interior layout translate to changes in user-experienced comfort under constant occupancy conditions? While accessibility laws ensure a baseline, aspects such as seat spacing for legroom or the ease of moving down the aisle receive less attention in standards. Transit agencies and bus manufacturers could benefit from evidence on whether increasing seat pitch or altering layouts yields meaningful improvements in passenger experience. However, given the pilot, laboratory nature of the present study, the results are best interpreted as preliminary design sensitivities rather than a basis for procurement criteria or regulatory standards. National fleet-renewal frameworks (e.g., Chile’s DS 44/2024 [10]) may provide opportunities for future in-service evaluation of interior ergonomics, but translating mock-up findings into fleet-wide requirements requires validation under operational conditions and an explicit assessment of comfort–capacity trade-offs.
Our contribution is an experimental study that directly evaluates how seat pitch and orientation affect perceived comfort and accessibility in a bus context. We implemented a controlled mock-up pilot experiment with human participants to isolate these factors, which would be logistically or ethically difficult to vary in an operational bus service. Specifically, we hypothesized that: (H1) Larger seat pitch (more legroom) significantly increases passengers’ comfort and in-vehicle usability/ease of movement; (H2) Forward-facing (parallel) seating orientation provides better comfort and ease of movement than side-facing (perpendicular) bench seats, particularly under tight spacing; and (H3) User characteristics like body size and transit usage frequency may moderate these effects (e.g., tighter spacing being especially problematic for taller individuals or for infrequent riders unfamiliar with cramped conditions). To test these hypotheses, we collected ordinal Likert-scale ratings of comfort in a simulated bus environment under systematically varied conditions. We then applied ordinal regression models (cumulative link models with random effects) to estimate the effects of the experimental factors while accounting for person-level differences.
It is well established that in-vehicle usability/ease of movement is a key construct influenced by service quality and comfort. However, there is an empirical gap in the direct operationalization of the causal relationship between specific physical dimensions of bus interior design (such as aisle width, seating configuration, maneuvering space, and the placement of internal elements) and levels of in-vehicle usability/ease of movement across different user groups. Most studies address comfort in an aggregated or purely perceptual manner, without systematically linking it to concrete geometric and spatial parameters of the vehicle. In this study, in-vehicle usability/ease of movement is therefore defined as in-vehicle usability or ease of movement.
This paper presents the experimental design, modeling approach, results, and implications of the study. Section 2 describes the literature review used for this study. Section 3 the materials and methods, including the variables, the laboratory set-up in Valparaíso, the ordinal regression techniques. In Section 3, we report the results: sample demographics and response descriptives, the regression estimates (with emphasis on how seat pitch and orientation influenced the probability of positive comfort ratings), interaction/subgroup analyses (e.g., by height tercile), and several robustness checks. Section 4 discusses the findings in the context of prior research and guidelines, and outlines preliminary design sensitivities and hypotheses that require validation in larger, in-service studies before informing fleet-wide practice. Finally, Section 5 concludes with a summary of quantitative insights, the methodological contribution of using advanced ordinal models in this domain, and suggestions for future work and public policy actions to foster accessible, comfortable urban mobility.
2. Literature Review
Universal accessibility in public transport is widely recognized as a core objective of service design and operations [11]. At the same time, transport research and planning increasingly move beyond traditional metrics and minimum-compliance checklists to address user-perceived accessibility [12]. The focus of this review is to establish the need to understand how the interior design of transport vehicles, specifically buses, affects users perception of the system’s ease of use. This focus is justified by a growing consensus that the design of internal elements is crucial for passenger comfort, safety, and ultimately, their perceived accessibility, especially for those with disabilities or reduced mobility. For instance, research on public transport quality consistently identifies accessibility, comfort, and perceived safety as core determinants of user satisfaction and sustained modal shift [13,14]. Perceived Accessibility, the subjective ease of living a satisfactory life using the transport system, has emerged as a valuable complement to traditional accessibility metrics [15]. Comfort, in turn, is shaped by physical design elements such as seat spacing, aisle width, and seating configuration. Evidence suggests that limited space, high crowding, and constrained movement reduce passenger comfort and discourage public transport use [16]. Interior design inconsistencies also undermine accessibility, particularly for visually impaired passengers [17]. For individuals with reduced mobility, adequate maneuvering space and standardized priority seating are essential.
2.1. From Conventional Accessibility to Perceived Accessibility
Universal accessibility is a fundamental condition that must be guaranteed in Public Transport Systems to promote a better quality of life, free mobility, and the autonomous participation of all citizens [11,18]. While conventional accessibility is often defined by the ease of reaching destinations and activities, typically focusing on the journey or the destination, Perceived Accessibility (PA) integrates the traveler’s subjective experience. PA is defined as “how easy it is to live a satisfactory life using the transport system” and it is related to the perception of Service Quality (SQ) and safety [19].
The perception of SQ in public transport is a multidimensional concept [19]. Comfort, for its part, is a fundamentally subjective concept that influences the overall passenger experience [20]. While general bus comfort is affected by objective environmental factors (such as noise, vibration, thermal comfort, and acceleration), SQ, which includes comfort, is a critical determinant of PA [21]. Several studies on bus service quality have considered comfort as a key component, along with convenience, safety, and reliability. Comfort indicators include the sufficiency of seating and the interior temperature of the vehicle [22]. The evidence is clear: Inadequate comfort or low service quality have direct negative effects on PA [19]. In fact, for users, comfort and safety are so important that improvements in these aspects can increase passenger ridership [21].
2.2. Influence of Interior Design (Seating, Layout, and Space)
The design of the vehicle interior and the arrangement of its elements are crucial for determining both comfort and perceived accessibility across the passenger population, particularly under crowding and when circulation space is constrained. The lack of uniformity and consistency in the bus’s design and internal layout has been identified as a significant barrier [23].
The standardization of internal bus elements (such as doors, pillars, stop buttons, seats, and payment totems) is a feature of universal accessibility that users highly value [24]. This standardization is essential for improving the independence of all users by reducing uncertainty in unfamiliar environments.
Fernandez et al. [25] suggest that the internal distribution of vehicles (including the location of seats and aisles) directly influences the user experience and, by extension, operational efficiency. Indeed, beyond subjective comfort, research indicates that interface elements such as door width and the fare collection method (e.g., off-board pre-payment) are critical factors that significantly affect the speed of boarding and alighting. Furthermore, these design and occupancy levels are factors that transit engineers have studied to determine the bus dwell time. This operational metric is significantly affected by the vehicle occupancy and platform congestion.
A central challenge in this regard is that crowding reduces comfort and service quality, negatively affecting PA [20,26]. From an operational perspective, crowding can be relevant, as if the aisle is full, descent time can increase by up to 57% [25]. This significant increase in alighting time not only slows the service (affecting reliability) but also prolongs the user’s discomfort and generates stress by forcing passengers to maneuver with difficulty or wait in high-density conditions, further eroding their PA.
2.3. Seating and Space for Passengers with Mobility Limitations
For passengers with mobility limitations (often grouped as PRM in the literature), in-vehicle accessibility is strongly shaped by the availability of maneuvering space and by the geometry of seating and circulation areas [11]. Valdivieso and Seriani [27], reported that the footprint required by a wheelchair user can be substantially larger (≈60% greater) than that of a passenger without this condition, which can create conflicts with circulation when space is constrained. When this additional space is not accounted for in design, particularly around boarding and waiting areas and at stops, it can increase impediments to movement and reduce perceived comfort and safety for both these users and other riders [11].
The lack of standardized space or designated priority seating on buses for PVD is a reported issue [23]. This problem extends beyond visual impairment; when priority areas are not clearly marked, uniform in size, or consistently located across the fleet, the system fails to communicate its purpose.
Elderly users or those with hemiparesis, preferred seats or spaces are highly relevant variables that affect accessibility within a train (and, by extension, on the bus) [28]. For these users, preferred seats or spaces are highly relevant variables that affect accessibility within the vehicle.
The internal design must allow sufficient clear space for a wheelchair user to maneuver and reach a securement location [29]. However, the U.S. Access Board has clarified the necessary requirements, recognizing the operational realities of public transportation vehicles. Specifically, ADA regulations for buses and vans (Subpart B) require that designated securement locations (for wheelchairs) and the circulation paths within the vehicle must meet precise minimum dimensions to accommodate mobility devices. For instance, the regulations mandate specific minimum turning space and clear width for aisles and doors to ensure barrier-free movement. Despite these stringent requirements, vehicular restrictions (such as track width or body width) inherently limit the strict application of accessibility standards designed for buildings [2].
The available literature establishes that users’ perception of accessibility and comfort in an urban bus is strongly influenced by service quality and the tangible characteristics of the vehicle, including its interior design [11,12].
The literature review establishes that universal accessibility requires moving past minimum regulatory compliance, to focus on Perceived Accessibility. PA is directly determined by SQ and comfort [19,21], with bus interior geometry (e.g., seating layout and clearances) being associated with perceived usability and comfort. Taken together, this literature motivates further empirical work to quantify how specific, measurable design parameters influence perceived accessibility, while recognizing that translating such evidence into standards must account for operational constraints (including potential capacity trade-offs). We measure the in-vehicle usability/ease of movement as a dimension of the Perceived Accessibility.
2.4. Discussion on the Research Gap
The reviewed literature consistently demonstrates that accessibility in public transport extends beyond regulatory compliance and is fundamentally shaped by users’ perceptions of service quality, comfort, and safety. In this context, Perceived Accessibility has emerged as a critical construct for capturing the subjective ease with which individuals can conduct daily activities using the transport system. Prior studies [30] further indicate that the interior design of buses, including seating configurations, aisle widths, maneuvering space, and the standardization of internal elements, plays a significant role in shaping comfort and accessibility, particularly when passengers require additional maneuvering space (e.g., mobility aids) and under crowded operating conditions.
Despite these advances, the existing body of research remains fragmented. Most studies [31] address accessibility, interior design, and operational performance as separate dimensions, with limited empirical integration among them. In particular, there is a lack of systematic evidence linking specific, measurable interior design parameters to Perceived Accessibility outcomes across different user groups under real operating conditions. Moreover, while accessibility-oriented design features are often assumed to improve user experience, their interaction with key operational variables—such as boarding and alighting times, dwell time, crowding, and effective vehicle capacity—has not been sufficiently quantified. However, refs. [32,33] have studied the bus network design problem, in which the bus assigned model is assessed.
Despite of the advance in the literature, the gap highlights the need for an integrated research approach that simultaneously considers vehicle interior geometry, user perception, and operational performance. Advancing knowledge in this area requires moving beyond minimum regulatory standards toward evidence-based design strategies that account for the diverse needs of users while acknowledging the operational constraints of urban bus systems. Addressing this gap will not only contribute to the theoretical development of Perceived Accessibility and in-vehicle usability/ease of movement but also provide practical guidance for vehicle design and policy decisions aimed at enhancing inclusivity, efficiency, and the overall quality of public transport systems.
3. Materials and Methods
A full-scale urban bus mock-up pilot experiment was conducted in the Mobility and Transport Laboratory of the Pontificia Universidad Católica de Valparaíso. Twenty-five adult participants experienced four controlled scenarios varying seat pitch (20, 30, 45 cm) and seat orientation (forward-facing vs. side-facing). After each scenario, participants rated seat comfort, legroom, and ease of movement using 5-point Likert scales. Demographic variables included age, gender, height (terciles), and bus travel frequency. Responses (100 total observations per question, from 25 participants × 4 scenarios) were analyzed using cumulative link mixed models (CLMM) with random intercepts to account for repeated measures. The proportional odds assumption was tested, and robustness checks included partial proportional odds models. The experimental design allowed isolating the effects of spatial configuration on subjective comfort while holding constant potentially confounding factors such as crowding, vehicle motion, and environmental conditions.
3.1. Variables and Data
Perceived comfort and accessibility were measured using three Likert-scale items developed for this study. After each scenario (see Section 2.2), participants answered three questions (P1–P3) in Spanish, each on a 5-point scale from 1 (most negative) to 5 (most positive). The items were: P1—Seat comfort: “How would you rate the comfort of the seat?” (1: Muy incómodo [Very Uncomfortable] … 5: Muy cómodo [Very Comfortable]); P2—Legroom space: “How did you perceive the space available for your legs?” (1: Muy reducido [Very limited] … 5: Muy amplio [Very ample]); and P3—Ease of movement: “How would you rate the ease of moving when boarding, sitting, and alighting?” (1: Muy inaccesible [Very inaccessible] … 5: Muy accesible [Very Accessible]). These responses were treated as ordinal outcome variables for analysis. For descriptive purposes, we also consider the proportion of ratings in the high-comfort category (scores ≥ 4) as an intuitive indicator of positive experience.
The primary independent variables were seat pitch and seat orientation. Seat pitch refers to the distance between one seat and the seat in front of it (for forward-facing seats) or an equivalent spacing between facing benches; effectively, it is the legroom or knee-to-seat clearance. We tested three pitch levels: 20 cm (very tight spacing), 30 cm (moderate spacing), and 45 cm (generous spacing). These distances were chosen to span a range from extremely constrained (20 cm is below typical transit seat spacing) to quite ample (45 cm, approaching the comfort of intercity coaches). Seat orientation had two levels: perpendicular to the bus movement (i.e., seats mounted longitudinally along the aisle, so that passengers sit facing the aisle—analogous to side-facing benches) versus parallel to the bus movement (seats facing forward or backward along the direction of travel—the traditional forward-facing arrangement). In our experiment, the perpendicular orientation is considered a “modified” layout, whereas the parallel orientation is the “traditional” layout for buses. These factors were varied by scenario (see Section 2.2), enabling within-subject comparisons.
We collected basic demographic and anthropometric information from participants to examine them as exploratory moderators (effect modifiers). These included age (in years, treated as a numeric variable), gender (indicator for female = 1, male = 0), height (categorized into terciles), and bus travel frequency. Height was grouped into three categories (terciles) based on the sample distribution: T1 (short) = height ≤ 1.65 m, T2 (medium) = 1.66–1.80 m, and T3 (tall) = ≥ 1.81 m. Each participant was thus classified as having a low, medium, or high stature, corresponding approximately to short, average, or tall body heights for adults. This categorical coding was used to examine if effects of seat spacing differ for shorter vs. taller individuals (given, for example, that a tall person might feel cramped in a space that a short person finds adequate). The sample had an imbalanced height distribution (only one person fell in T3, see Section 3.1), so we note that T3 estimates may be unstable. However, we did not record specific anthropometric measures (e.g., buttock–knee length or knee height), so overall stature served as a crude proxy for legroom needs in this pilot. Bus travel frequency was recorded via a survey question on how often the person uses microbuses (urban buses) in Valparaíso: daily, several times a week, occasionally, or almost never. For analysis, this was simplified to a binary indicator of frequent rider = 1 if the person uses the bus daily or multiple times per week, or = 0 if they use it only occasionally or almost never. This dichotomization yielded 80% frequent users vs. 20% infrequent. We included this variable to see if habitual riders respond differently—e.g., they might be more accustomed (and thus more tolerant) to cramped conditions, or conversely, they might have higher comfort expectations.
A total of N = 25 participants took part in the experiment (see Section 3.1 for details). This was a convenience sample of adult volunteers, consisting primarily of university students and staff in their twenties. The sample was skewed toward young adults (mean age 24.5 ± 3.2 years) and was 68% male. Table 1 summarizes the demographic profile. While not representative of the general population, the sample’s high share of frequent transit users (80% ride microbuses often) is beneficial for the study, as such participants can draw on their daily experience when evaluating comfort.
Table 1.
Demographic and anthropometric profile of participants (N = 25).
3.2. Experimental Setup
The experiment was carried out in a controlled laboratory environment—specifically, the Mobility and Transport Lab at the Pontificia Universidad Católica de Valparaíso in Valparaíso, Chile. We constructed a full-scale mock-up of a bus interior to simulate the experience of boarding and riding an urban bus under different design conditions. The mock-up included key features of a typical mid-sized city bus in Valparaíso: two single doors (one at the front for entry, one in the middle or rear for exit), a central aisle approximately 70 cm wide, and a seating layout with 18 passenger seats (of which 2 were designated as priority seats for people with reduced mobility). The bus floor at the doors was outfitted with two steps (as many local buses are not low-floor), reflecting the common boarding situation in the city. Overall, the physical dimensions and configuration of the mock-up were intended to mimic the interior of a standard Valparaíso urban bus complying with existing norms (e.g., the presence of a priority space, aisle width around 70 cm, etc.).
Using this mock-up, we created four experimental scenarios by reconfiguring the seats between runs. In each scenario, participants were instructed to board the bus through the front door and take a seat, and then a standardized procedure was followed (e.g., the “ride” was simulated for a short duration, or participants were asked to imagine a short trip). The scenarios differed in the arrangement of the seats:
- Scenario 1: Seats oriented parallel to the direction of travel (the seats facing forward, in the traditional arrangement), with a seat pitch (defined as the spacing between seats) of 30 cm. In this scenario, the seat layout resembled a conventional bus: forward-facing rows, two on each side of the aisle. All participants boarded and seated themselves in this configuration.
- Scenario 2: Seats oriented parallel, with seat pitch of 45 cm (wider spacing).
- Scenario 3: Seats oriented parallel, with seat pitch of 20 cm (very narrow spacing).
- Scenario 4: Seats oriented perpendicular to the direction of travel (side-facing benches along the aisle), with a pitch-equivalent spacing of ~30 cm.
Figure 1 schematically illustrates the set-up for the two seat orientations tested: (a) shows the front-facing bench layout (as in Scenarios 1–3), and (b) shows the side-facing layout (Scenario 4). In all scenarios, the bus was “fully seated” in the sense that participants occupied most available seats (in practice, because we had more participants than seats, some individuals stood or the scenarios were rotated so each participant experienced the seating conditions in turn). The aim was to simulate a reasonably loaded bus during boarding and settling in. In all scenarios, the number of participants on board was fixed at 25 (the mock-up had 18 seats, so the remainder stood) to maintain a consistent full load. This occupancy control was a feature of the experiment and should not be interpreted as a capacity-neutral feasible design in actual buses.
Figure 1.
Set-up for the two seat orientations tested. (a) Front-facing bench layout; (b) Side-facing layout.
In this study, seat pitch is defined as the horizontal distance between the backrest of one seat and the front edge of the next seat in the direction of travel, measured at knee height. In the case of “~30 cm equivalent” spacing was computed and measured by the clearance between opposing knees when seated on the side benches, assuming typical posture. It is important to notice that seat shells, cushions, and geometry were identical across configurations. This was controlled by using measurement locations and tools (tape measure, reference points), which were described to allow replication. In the case of standing density and local congestion, it was controlled the number and position of standees who were held constant across scenarios to avoid confounding “ease of movement” ratings. In addition, we identify the precise randomization scheme (e.g., 2 × 2 counterbalancing or block randomization by small groups) so that another researcher could replicate the approach.
After experiencing each scenario for a few minutes, participants were asked to fill out a short survey about that scenario. This survey included the Likert scale questions P1–P3 described above (seat comfort, legroom, ease of movement), plus some open-ended feedback prompts (not analyzed quantitatively in this paper). The order of scenarios was arranged to avoid potential ordering bias; scenarios were presented in a balanced or randomized order for different participant subgroups, so not everyone experienced them in the same sequence. Participants were not told the exact seat spacing in centimeters, only that the bus interior was being reconfigured between runs; they were instructed to rate their comfort/accessibility impressions for that configuration.
The controlled laboratory approach allowed us to isolate the effect of physical design features. By holding many factors constant (same vehicle body, same group of people, no actual vehicle motion or external disturbances) and only changing the seat layout, we could more directly attribute differences in user ratings to the layout itself. This kind of experiment serves as a test-bed before on-road trials, and it addresses practical constraints—one cannot easily change seat arrangements on buses in revenue service or randomly assign passengers to different bus interiors. Such mock-up experimentation has been used as a valid research tool in transportation to evaluate design interventions that would be infeasible or unethical to manipulate in real service [25]. In our case, it provided a safe, repeatable setting to gauge comfort and accessibility outcomes under different design scenarios.
All sessions were conducted during daytime hours in a well-lit indoor space. Facilitators ensured that participants understood the tasks and responded to the surveys after each scenario. Breaks were given between scenarios as needed to avoid fatigue. Standard instructions emphasized that participants should consider each scenario independently and reset their expectations each time (to mitigate carry-over effects). The total duration per participant (for all scenarios and surveys) was around one hour.
3.3. Modeling Approach
Given the ordinal nature of the response variables (Likert 1–5) and the repeated-measures experimental design, we employed cumulative link ordinal regression models with mixed effects. In particular, we used the formulation of a cumulative logit model with a random intercept for each participant, often referred to as a cumulative link mixed model (CLMM). This model treats the Likert responses as manifestations of an underlying continuous propensity, segmented by threshold cut-points, and it naturally accommodates the ordinal scale without assuming equal intervals between numeric codes.
For a given question j (P1, P2, or P3) and participant i, we denote the Likert response as . The CLMM is defined as:
for categories (since is trivial). Here, are the threshold parameters (cut-points) for question j, with . The vector represents the fixed-effect predictors for person i and scenario, and are the corresponding coefficients for question j. The term is a random intercept for participant i, assumed —this captures individual-specific propensity differences and the correlation of responses from the same person. In essence, each participant has their own baseline comfort level, and we are interested in how the experimental factors shift the odds of higher vs. lower responses, on average, controlling for that baseline.
The fixed effects in Xi include the experimentally manipulated factors (seat pitch and/or seat orientation), while accounting for within-participant clustering via a participant-specific random intercept. Participant characteristics (age, gender, height group, travel frequency) were examined only in exploratory extension models. In our main specification, we modeled the outcomes as a function of: seat pitch (with dummy variables for 30 cm and 45 cm, using 20 cm as the reference), seat orientation (a dummy for traditional orientation = forward-facing vs. modified orientation = side-facing), with participant characteristics examined only as exploratory covariates in secondary analyses. Since the experimental design had every participant experience multiple scenarios, we initially incorporated the factors in two equivalent ways: (1) Directly include seat pitch and orientation dummies in a single combined model, and (2) Separate models focusing on specific scenario sets (as described below). For transparency, we report the results in an organized manner per scenario type.
We structured the analysis in two parts:
- Situation 1 (Combined seat-pitch effect): This corresponded to scenarios with the same orientation but different seat pitches. In practice, we took the data from all runs where the seats were oriented in the traditional (forward-facing) direction and varied the pitch. In the model for Situation 1, dummy variables dist_30 and dist_45 indicate seat pitch, with 20 cm as the reference. The orientation is constant and does not appear as a separate predictor here. Essentially, this model asks: holding person characteristics constant, how does increasing legroom from 20 cm to 30 cm or 45 cm affect the odds of a higher comfort rating? We fit this model for each question P1, P2, P3.
- Situation 2 (Orientation effect): This analysis isolates the effect of seat orientation by comparing the side-facing vs. forward-facing configurations at approximately the same pitch (~30 cm). We restricted this model to the scenario with 30 cm forward-facing seats and the scenario with side-facing benches (30 cm-equivalent spacing). Because the side-facing layout was tested at only one pitch, the orientation effect is estimated at that spacing, and any orientation × pitch interaction is not identifiable. We again estimated separate models for P1, P2, P3 outcomes.
All models were estimated using the ordinal logistic framework (logit link). Model fitting was performed with the ordinal package in R for CLMM, and checks were performed for model adequacy. A Brant test or score tests can be used to detect PO violations. In our case of mixed models, we applied a nominal test in the clm framework (ignoring random effects) and also inspected whether a more flexible partial proportional odds model would improve fit [34]. Where the PO assumption was violated, we planned to use a generalized ordered logit (partial-PO) approach that relaxes this assumption for specific predictors [35,36]. However, as reported later, the main effects of interest did not show substantive differences across thresholds; thus, the simpler cumulative link structure was retained for primary results.
Formal closed-form power calculations for cumulative link mixed models are not straightforward because power depends on the distribution of outcome categories and within-subject correlation. To contextualize our N = 25 repeated-measures design, we conducted a conservative prospective power check using a binary approximation of the Likert outcomes (favorable rating ≥ 4) with four repeated measurements per participant. Assuming a moderate effect size (OR ≈ 3) and α = 0.05, simulation under plausible within-subject heterogeneity suggested power below 80% (≈0.60–0.73 depending on the assumed correlation). Therefore, our sample size was constrained by feasibility/resource availability rather than an a priori power target, and moderate effects, especially interactions and subgroup differences, may be underpowered.
Finally, we computed measures to evaluate model fit and predictive performance. We report the Akaike Information Criterion (AIC) and Bayesian Information Criterion (BIC) for models as rough indicators of relative fit (though these are of limited use given identical outcomes and largely similar predictors in our models).
3.4. Ethics and Consent
This study involved human participants providing subjective assessments in a simulated environment. All procedures were conducted in accordance with the relevant ethical guidelines and regulations for human subjects research. Prior to participation, individuals were informed about the purpose of the experiment and what it would entail, and written informed consent was obtained from each participant. Participants were free to withdraw at any time. The data collected were anonymized; no personally identifiable information beyond basic demographics was recorded, and results are reported in aggregate. Participants received a small token of appreciation (snack and refreshments) for their time, but no monetary compensation.
No deception was used in the experiment. Participants were generally aware that the study related to bus design and comfort, but they were not briefed on the specific hypotheses to avoid biasing their responses. After the experiment, a brief explanation was given about the study’s aims and preliminary findings (debriefing), and participants were thanked for their contributions. All data and notes from the sessions were kept confidential.
4. Results
This section provides a description of the experimental results, their interpretation, and the experimental conclusions drawn from the study. Descriptive results indicate substantial differences between scenarios. At 20 cm seat pitch, most participants reported very low comfort, extremely limited legroom, and poor ease of movement. At 45 cm pitch, ratings shifted dramatically toward “comfortable” and “very accessible.” Side-facing seating yielded consistently more favorable ratings than forward-facing seating. CLMM results show that increasing seat pitch from 20 to 30 cm increased the odds of positive comfort ratings by a factor of approximately 27, while increasing pitch to 45 cm raised odds nearly 100-fold. Legroom and ease of movement exhibited similarly large effects. Side-facing orientation significantly improved all outcomes relative to forward-facing seating. Demographic covariates had limited influence, though older participants and frequent riders showed slightly higher tolerance to reduced space. Height did not reach statistical significance due to sample imbalance.
4.1. Descriptive Results
A total of 25 participants (8 female, 17 male) completed all four scenarios of the experiment. As noted in Section 2.1, the sample was predominantly composed of young adults: the average age was 24.5 years (median 24, range 21–33). Most participants (80%) were frequent users of the local bus system (daily or several times a week). The height distribution was skewed toward the lower and middle terciles—only one individual was tall (>1.80 m). This has implications for interpreting any height-related effects (the tall group’s responses may not be representative due to n = 1). The gender split (32% female, 68% male) suggests a slight male predominance in our convenience sample. While this demographic profile does not mirror the general population, it provides a reasonably varied mix of perspectives for a pilot study. No participants reported any disability or condition that would significantly affect mobility (this was not an explicit screening criterion, but none self-identified as using mobility aids, etc., likely due to the young skew). Table 1 (Section 2.1) provides a summary of these characteristics for reference.
All participants responded to all Likert questions for each scenario; there were no missing responses in the collected data. This yielded a total of 25 (participants) × 4 (scenarios) = 100 observations for each question (P1, P2, P3). The data were balanced by design, though as discussed below, some scenario–question combinations exhibited very low variability (e.g., nearly all participants giving the same rating), which is notable in the context of modeling.
Figure 2 visualizes the distribution of ratings (1–5) for each question under each scenario as stacked bar charts. Overall, the patterns strongly support the hypothesized effects of seat pitch and orientation even at a descriptive level.
Figure 2.
Stacked bar charts of the percentage of responses in each Likert category (1–5) by scenario, for P1–P3. Scenario labels: 20 cm forward-facing, 30 cm forward-facing, 45 cm forward-facing, Side-facing.
For P1 (Seat comfort), when seat pitch was very tight, ratings were predominantly low. In Scenario 3 (20 cm forward -facing), over half of the participants rated the seat comfort as “1—Muy incómodo” (Very Uncomfortable) and none gave a “5” rating. The median rating in this scenario was 2 (Uncomfortable). In contrast, in Scenario 2 (45 cm forward-facing, i.e., the same orientation but much more legroom), the comfort ratings shifted upward dramatically—most participants (approximately 80%) rated the seat as Comfortable (4) or Very Comfortable (5). Scenario 1 (30 cm forward-facing) fell in between these extremes, with a mix of neutral (3) and some comfortable ratings; it appears to be a borderline case where some found it acceptable and others still felt discomfort. Scenario 4 (Side-facing) yielded slightly higher comfort ratings on average than Scenario 1 (forward-facing 30 cm), suggesting an orientation benefit even at the same nominal pitch.
For P2 (Legroom space), the results are even more stark since this question directly probed knee/leg space. At 20 cm pitch (Scenario 3, forward-facing), virtually all participants chose the lowest categories (“1—Muy reducido” or “2—Reducido”), indicating that the legroom was perceived as severely limited. Many commented informally that their knees were nearly touching the opposite seat (indeed, 20 cm is far below typical seat spacing). At 45 cm pitch (Scenario 2), no one rated legroom as “1” or “2”—instead, responses concentrated in “4—Amplio” and “5—Muy amplio” (spacious) categories. At 30 cm, the distribution was mixed: some frequent riders rated it neutral or even spacious (perhaps because they were used to tighter conditions), while others still felt constrained. Scenario 4 (side-facing) received slightly more favorable legroom ratings than Scenario 1 (30 cm forward-facing), presumably because having no seat directly in front (open aisle space) made it feel roomier.
For P3 (Ease of movement), Scenario 3 (20 cm forward-facing) was consistently rated as very inaccessible for moving: most participants gave a “1” or “2,” reflecting that the narrow spacing severely hindered movement (e.g., squeezing in and out of the seat was difficult). Scenario 2 (45 cm forward-facing) was at the opposite end—the vast majority rated ease of movement as “4” or “5,” indicating that ample space made it easy to get in and out. Scenario 1 (30 cm forward-facing) again had intermediate results—several neutral (3) and some “inaccessible” (2) ratings, indicating moderate hindrance. Meanwhile, Scenario 4 (side-facing) was generally rated the easiest for movement: most participants gave it a 4 or 5, likely because passengers were already facing the aisle and had no adjacent seat blocking their egress, making it straightforward to stand up and maneuver.
In summary, higher seat pitch (more legroom) and side-facing bench orientation both tended to push comfort and accessibility ratings upward, and side-facing orientation modestly outperformed forward-facing orientation at equivalent spacing. A quick aggregation is illustrative—pooling all side-facing scenarios vs. the forward-facing scenarios: only 10% of side-facing scenario ratings for ease of movement were in the lowest 2 categories (very/mostly inaccessible), compared to about 40% for the forward-facing scenarios.
4.2. Regression Results
To quantify the effects of seat pitch and seat orientation on the odds of achieving a higher comfort/accessibility rating, we fit the CLMM core models described in Section 3.3. For clarity, we first present the findings for Situation 1 (seat pitch effects under forward-facing orientation), followed by Situation 2 (orientation effects). Key coefficient estimates (log-odds units) with their standard errors, z-values, and p-values are provided in Table 2 (for P1–P3, Situation 1) and Table 3 (for P1–P3, Situation 2 comparisons).
Table 2.
Core model outputs for Situation 1 (seat pitch effects under forward-facing orientation) for P1–P3.
Table 3.
Core model outputs for Situation 2 (seat orientation effect at ~30 cm pitch) for P1–P3.
Increasing the seat pitch from the baseline of 20 cm to 30 cm or 45 cm led to large, statistically significant improvements in all three outcome measures:
- P1 (Seat comfort): The coefficient for dist_30 (30 cm pitch vs. 20 cm) was +3.308 (log-odds units) with z = 3.903, p < 0.001. For dist_45, the coefficient was even higher at +4.599, z = 5.042, p < 0.001. These coefficients indicate that, holding other factors constant, moving from 20 cm to 30 cm multiplies the odds of a participant giving a higher comfort rating by a factor of exp(3.308) ≈ 27, and moving from 20 cm to 45 cm multiplies the odds by exp(4.599) ≈ 99 (about a 100-fold increase). In practical probability terms, as noted earlier, the model implies that the probability of a positive comfort evaluation (rating “Cómodo” or “Muy cómodo”, i.e., ≥4) rises sharply with more legroom. For example, if at 20 cm this probability was extremely low (near 0 for many individuals), at 45 cm it becomes very high (on the order of ~80–90% for an average participant, based on model threshold estimates). The 45 cm vs. 30 cm difference itself is notable (coefficient difference ~1.29), meaning 45 cm further triples or quadruples the odds compared to 30 cm, reflecting diminishing but still substantial returns from additional space. However, the 95% confidence interval for this 45 cm vs. 20 cm comfort effect is very wide (~16.6 to 593), underscoring the uncertainty in its precise magnitude given the small sample.
- P2 (Legroom space): This outcome showed the strongest pitch effect as expected. The coefficient for dist_30 was +4.989 (z = 4.93, p < 0.001), and for dist_45 it was +7.039 (z = 5.85, p < 0.001). These coefficients align with the descriptive finding that at 20 cm essentially nobody felt the space was sufficient, whereas at 45 cm almost everyone did. For context, exp(7.039) is on the order of 1130—higher odds of a good legroom rating at 45 cm vs. 20 cm. Even 30 vs. 20 cm gave an odds ratio exp(4.989) ≈ 146, which underscores how critical legroom is. The difference between 45 and 30 (approx. 2.05 in log-odds) was also significant, indicating that the gain from 30 to 45 cm, though smaller on the logit scale than from 20 to 30, still markedly improves comfort. In other words, going from very tight to moderate yields a big jump, and moderate to generous yields another (smaller) jump in perceived space.
- P3 (Ease of movement): The pattern was similar. dist_30 had coefficient +4.743 (z = 4.204, p < 0.001), and dist_45 had +6.082 (z = 5.137, p < 0.001). Thus, at 30 cm side-facing, the odds of reporting the scenario as accessible were e4.743 ~ 115 times that at 20 cm, and at 45 cm it was e6.082 438 times that at 20 cm. In probability terms, the model suggests that at 20 cm the chance of a participant finding it “accessible” (≥4) was practically 0, whereas at 45 cm it becomes overwhelming (nearly all respondents). As noted, even 30 cm yielded a high proportion of accessible ratings, though a few individuals still struggled at 30 cm.
In this pilot sample, person-level effects were generally small and imprecisely estimated relative to the main effects of seat pitch. Interestingly, most of these person-level effects were small and not statistically significant in the pitch-focused models. Age showed a positive coefficient for comfort (older participants tended to report slightly higher comfort: +0.263 ± 0.088, p = 0.003), but was not significant for legroom or ease of movement. Gender and height group had no significant effects (any slight trends were within large confidence intervals given the limited sample). Frequent riders had a significant positive effect in the legroom model (+1.920 ± 0.835, p = 0.022), hinting that habitual bus users might perceive slightly more legroom or be more tolerant, but this pattern did not appear for comfort or ease of movement. Overall, the individual differences were minor compared to the sizable main effects of seat pitch.
We now discuss Situation 2 analyses as presented in Table 3, which focus on how seat orientation influenced ratings by comparing modified (side-facing) vs. traditional (forward-facing) orientation at a ~30 cm spacing.
- P1 (Seat comfort). The coefficient for Orientation (side-facing vs. forward) was +1.981 (SE = 0.606, p = 0.001). This implies that moving from forward- to side-facing multiplies the odds of reporting a higher comfort category by exp(1.981) ≈ 7.25. In practical terms, the model indicates a substantial upward shift in comfort ratings under side-facing seating relative to forward-facing, holding other predictors constant.
- P2 (Legroom space). Orientation shows the strongest effect, as expected for a construct tied to perceived clearance. The Orientation coefficient was +3.323 (SE = 0.784, p < 0.001), corresponding to an odds ratio of exp(3.323) ≈ 27.74. Thus, holding covariates fixed, side-facing seating is associated with dramatically higher odds of more favorable legroom ratings than forward-facing rows. The uncertainty in magnitude remains wide: an approximate 95% CI for the odds ratio is ~6.0 to ~129.0.
- P3 (Ease of movement). The pattern is similar. The Orientation coefficient was +3.010 (SE = 0.703, p < 0.001), implying an odds ratio of exp(3.010) ≈ 20.29. This indicates that side-facing seating substantially increases the odds that participants perceive the scenario as easier to move through (i.e., higher response categories), consistent with the notion that lateral clearance and unobstructed access facilitate standing and maneuvering. The approximate 95% CI for the odds ratio is ~5.1 to ~80.5.
Overall, in Situation 2, seat orientation exerts a large and statistically robust positive effect on perceived comfort, legroom, and ease of movement. Within the tested ~30 cm scenario, side-facing benches yield substantially higher ratings than forward-facing rows, with odds multipliers on the order of ~7× to ~28× across outcomes. While additional person-level covariates are included in the models, Table 3 highlights that the orientation contrast is the dominant effect in this configuration.
4.3. Exploratory Subgroup Analyses and Interactions
We explored whether the effects of seat pitch and orientation were heterogeneous across different user subgroups, particularly by height, given the intuitive expectation that tall passengers suffer more from tight spaces. We also considered gender and frequency of travel as potential moderators. Given the pilot sample size, these subgroup analyses were exploratory and not statistically powered for definitive conclusions.
We attempted to fit models with an interaction between seat pitch and height-tercile (e.g., to see if the improvement from 20 cm to 45 cm was greater for tall people than short people). However, due to the extremely small number of tall individuals (T3, n = 1), the interaction terms were not reliable and the models did not converge meaningfully (especially with random effects included). As an alternative, we performed a sensitivity analysis combining the medium and tall categories (T2 and T3) into a single group of “above-average height” vs. short (T1). This effectively treated height as binary (not-short vs. short). Even with this approach, the interaction of pitch with height group was not statistically significant in predicting any of the outcomes (likely because even the combined “taller” group had only 17 people, and only one truly tall outlier, limiting contrast). The pitch main effects remained overwhelmingly large for both height groups, and no evidence emerged that tall individuals’ slope was different. In other words, while one might expect taller users to gain even more from added space (since they are more constrained at low space), our data were insufficient to demonstrate a differential pitch effect.
That said, the signs of certain coefficients did suggest some subgroup tendencies. In the main effects models, the coefficient for the tallest group (T3) was consistently negative (non-significant) for P2 and P3, indicating tall participants tended to report worse outcomes (less legroom, less ease) than the reference (short) group, under the conditions tested. For P1, height effects were negligible or inconsistent.
For ease of movement (P3), even though height did not show significant interaction with pitch, it is reasonable to assume from practical standpoint that someone 1.9 m tall would have more trouble maneuvering in narrow aisles than someone 1.6 m. Our data partially reflected this: the tallest participant often gave low scores for P3, contributing to alt_max’s negative coefficient in those models. Thus, while not conclusive statistically, the trend aligns with expectations: limited headroom or legroom predominantly impacts taller individuals, and having only one tall person likely under-represents what the true effect would be in a population with more tall riders.
We did not find any significant differences between male and female participants in terms of how they perceived the scenarios. There were no significant interactions between gender and seat pitch or orientation. Both groups responded similarly to the experimental manipulations. This suggests that, at least in our sample and for these particular comfort measures, gender (which could correlate with body size to some extent, but here we already accounted for height) was not a determinant of comfort perception. It is worth noting that about one-third of our sample was female; a larger sample might be needed to detect if, for example, women feel more insecure on side-facing seats.
Similarly, frequent versus infrequent bus users did not show clear differential effects in the interactions. While frequent riders had a slight tendency to give higher legroom ratings (as noted in the main effects results for Situation 1), we did not observe robust interaction effects by frequency. Any small moderation by familiarity (e.g., “familiarity breeds tolerance”) would require a larger sample to detect and confirm.
5. Discussion
Our pilot experiment provides empirical evidence on how interior design geometry influences perceived comfort and accessibility, under controlled conditions where confounding factors are minimized. The results confirm intuitive expectations: increasing seat pitch greatly improves comfort and perceived in-vehicle space, and in our static mock-up setting, side-facing bench seating (with no seat in front) further enhances legroom and ease-of-movement perceptions compared to the traditional forward-facing arrangement (at least at the tested moderate spacing). At the same time, the internal validity of the laboratory design came at the expense of external generalizability: we isolated two design factors in a stationary environment with a small convenience sample. The findings therefore illustrate directional sensitivities rather than definitive magnitudes applicable to all riders or conditions.
Crucially, our study’s scope was a pilot. The sample size (N = 25) was determined by feasibility and resource constraints, not by a formal power calculation, and as such it was not sufficient to detect anything but very large effects. We observed extremely large odds ratio estimates for seat pitch—on the order of tens or even hundreds—but the confidence intervals were very wide, indicating substantial uncertainty in those exact values. Moderate effects (and especially interaction or subgroup effects) may have gone undetected given the limited power. We emphasize that these results should be interpreted as preliminary evidence of the direction and potential scale of comfort benefits from design changes, rather than precise estimates.
Another limitation is that we only captured overall stature as a proxy for body size. Key anthropometric measures like sitting height or buttock–knee length were not collected, which likely blunted our ability to identify how body dimensions interact with seat pitch. Future experiments should include such measurements to better tailor design guidelines to user physiques (e.g., ensuring accommodation of taller passengers’ leg length). Our height subgroup analysis was extremely underpowered (only one truly tall participant), underscoring the need for larger and more diverse samples to explore user heterogeneity.
Furthermore, the experimental design was not fully factorial. In particular, the side-facing orientation was evaluated at only one seat pitch (~30 cm equivalent). This means we could not assess whether the advantage of side-facing benches would hold at other spacings (or under very tight conditions). In statistical terms, an orientation × pitch interaction was not identifiable. Thus, while side-facing provided a benefit at 30 cm in our pilot, we cannot claim that it would universally outperform forward-facing at, say, 20 cm or 45 cm—additional data would be needed to check for any interaction effects across the range of pitches.
Despite these caveats, the controlled nature of the study lends strong internal validity. By holding constant the number of people on board (occupancy), the vehicle dimensions, and eliminating motion or noise, we could attribute differences in comfort ratings directly to the seat layout changes. In practice, of course, any real-world implementation of increased seat pitch would entail capacity trade-offs (fewer seats per bus if bus length is fixed). Our pilot was capacity-neutral by design—we kept 25 people in the bus for each scenario—but this was an experimental convenience. In a real bus, adding legroom usually means removing seats (or using a larger vehicle). We explicitly did not address how such a change would play out in an operational sense (e.g., whether reducing seats could be offset by deploying higher-capacity buses or increasing service frequency).
For that reason, we caution that while our results suggest directions for design improvement (e.g., more legroom is unequivocally better for comfort), we are not claiming that one can simply enlarge seat spacing “without reducing capacity” in practice. Trade-offs with vehicle capacity, operational efficiency, and cost were not evaluated, and the laboratory setting does not account for adaptive behaviors observed in real services. The study therefore informs design discussions but does not, on its own, justify definitive policy prescriptions.
Our findings must also be interpreted in the context of a stationary mock-up. A moving vehicle environment introduces factors like acceleration, braking, turning forces, and vibrations, which can significantly affect perceived comfort and safety. For instance, while side-facing seats gave higher static comfort ratings, many transit agencies avoid longitudinal seating for long distances because passengers can feel less secure during accelerations or sudden stops when seated sideways. In our experiment, there were no such forces. Thus, a logical next step is to validate these results in an on-road setting—e.g., using an instrumented bus or test track where motion dynamics are present, to see if forward-facing seats become preferable once ride stability is considered.
Relatedly, external validity to everyday transit conditions is limited. Our participants were mostly young, healthy adults. We did not include people with disabilities, very old adults, or children—groups who might experience the layouts differently. Future research should involve a broader user sample, including those with mobility impairments, to ensure that design recommendations are inclusive. Additionally, real transit trips involve longer exposure times, crowding variations (standing passengers in the aisle), and psychological factors of being in public—none of which were present here. Longer-duration trials or field studies can check whether the comfort gains we observed persist over a whole trip and how they influence overall satisfaction or mode choice.
Despite the above limitations, this pilot study contributes a quantitative data point in an area often lacking controlled experimental evidence. Interior bus design is an engineering and policy domain that has traditionally been guided by standards and expert judgment, rather than user-centered trials. Our approach demonstrates the feasibility of using a mock-up and ordinal models to obtain user feedback on specific design tweaks. The large effect sizes observed (albeit with uncertainty) suggest that even modest increases in seat pitch can yield substantial improvements in perceived comfort and accessibility. Such insights can motivate transit agencies to consider passenger experience metrics—not just capacity—in design decisions. For example, if providing an extra 10–15 cm of legroom (at the expense of 1–2 fewer seats) results in a dramatic jump in comfort ratings, agencies might weigh that in cost–benefit analyses of vehicle layout, especially on routes where extreme crowding is less frequent or where rider satisfaction is a key goal.
Moreover, the controlled occupancy of our experiment (keeping the bus “full” with the same number of participants) highlights an important consideration: comfort improvements should ideally be evaluated in tandem with operational strategies. A design that reduces seated capacity might be acceptable if accompanied by higher service frequency or larger vehicles, maintaining overall throughput. Future work should also integrate interior design choices with operational planning (effective capacity and frequency). For instance, if larger seat pitch reduces seating capacity, transit agencies might compensate by deploying higher-capacity vehicles or increasing service frequency. Modeling approaches (e.g., transit assignment and frequency-setting models) can help evaluate such comfort–capacity trade-offs.
Finally, we reflect on the practical implications of our pilot findings. In this controlled mock-up, layouts with more constrained seat spacing were rated less favorably than the more spacious layouts, indicating that seat spacing can shape perceived comfort and in-vehicle usability. Rather than proposing any numerical seat-pitch threshold from this pilot, we suggest that agencies and manufacturers treat seat spacing as a candidate design lever to be evaluated through staged user testing (mock-up and, critically, in-service) that documents comfort–capacity trade-offs under local operating conditions. At the same time, longitudinal (side-facing) seating—while useful for accommodating priority users or increasing standing room—should be used judiciously for general seating. Our pilot indicates a potential benefit in perceived spaciousness when side benches are used sparingly, but side-facing seats can pose stability issues in real operations. Any introduction of more side-facing seating should therefore be paired with design measures to ensure safety (e.g., handrails and carefully selected placement in less jostling areas of the vehicle).
In summary, our small-scale experiment suggests that designing for comfort (e.g., maintaining adequate legroom) can coexist with the broader goals of accessibility and capacity—but achieving that balance requires careful consideration of both engineering and operational strategies. The evidence presented here should be viewed as hypothesis-generating: it provides a basis for larger studies and field pilots that can confirm these results in real buses, with diverse passengers, over longer durations. Ultimately, the integration of such human-centered design evidence into transit policy could lead to vehicles that are not only compliant with accessibility laws, but also genuinely comfortable and inviting for all riders—supporting the ridership growth and inclusion goals of sustainable urban mobility.
5.1. Implications for Design and Practice
Drawing from our findings, we outline a few practical, non-prescriptive implications for bus interior design. Because this is a pilot study in a stationary mock-up, the points below should be interpreted as qualitative design sensitivities and hypotheses for future in-service validation, not as minimum seat-pitch thresholds or procurement specifications:
- Seat spacing and legroom: In this pilot mock-up, the most constrained seat-spacing configuration received markedly lower ratings for comfort, legroom, and ease of movement than the more spacious configurations. This indicates that seat spacing is a salient design lever for perceived in-vehicle usability. Rather than proposing a numerical minimum based on this pilot, we recommend that agencies and manufacturers evaluate alternative seat-spacing layouts through staged testing (mock-up and, critically, in-service) and explicitly quantify comfort–capacity trade-offs under local operating conditions, route context, and service frequency.
- Seating orientation: Use side-facing (longitudinal) seating sparingly. While our static mock-up showed that side-facing benches can increase perceived space at a given pitch, in a moving bus they may cause discomfort or insecurity due to lateral forces. If longitudinal benches are used (e.g., for fold-up priority seats), they should be placed in low-acceleration areas of the bus and equipped with ample handholds, so that passengers feel stable during acceleration/braking.
- Aisle width and circulation: Preserve aisle width for circulation. Although we did not vary aisle width in this study, it can be extrapolated that extremely narrow aisles would reduce ease of movement. Chile’s norms already require a step-free route from the door to the reserved area [37], which implies the aisle cannot be obstructed. We emphasize keeping that route wide and free of intrusions (no excess inward-folding seats or thick barriers). Also consider that a slightly wider aisle (if bus width allows) can facilitate faster boarding/alighting, which is operationally beneficial.
- Comfort as part of accessibility: Prioritize comfort in addition to baseline accessibility features. It is not enough to have a priority seat if the general seating is so cramped that people with minor mobility issues, or even average riders, are uncomfortable. A holistic approach to bus design should treat comfort as part of accessibility. This perspective is consistent with inclusive- and universal-design approaches discussed in accessibility guidance. More comfortable layouts can improve usability for a broad range of passengers (e.g., older adults and pregnant passengers) while supporting everyday service quality goals.
5.2. Future Research
Looking ahead, we recommend that future research:
- Validate these findings in real operational settings, with a moving bus or realistic simulator that introduces dynamic forces. This will confirm whether the comfort gains of increased seat pitch persist in motion and whether side-facing seats still offer a perceived benefit or become a liability when the bus accelerates/brakes.
- Include a broader range of participants, especially those with disabilities or mobility impairments, to ensure that design recommendations truly account for all users. It would be valuable to test whether certain design changes (like extra legroom) disproportionately benefit those with joint pain, balance issues, etc., and whether any unanticipated issues arise for those populations.
- Incorporate objective measures alongside subjective ratings—for example, using motion capture or pressure sensors to see how people of different sizes fit in various seat pitches, or measuring the time/assistance required for a person with a walker to maneuver in different layouts. Such data can complement subjective comfort ratings with functional outcomes.
- Evaluate long-term behavior: Would a more comfortable interior lead to higher transit use or satisfaction over time? While our study cannot address that, longer-term field trials (e.g., deploying a bus with modified seating on a route and surveying riders over weeks) could explore whether comfort improvements translate into tangible benefits like higher rider satisfaction scores or retention of riders.
- Optimize design and operations jointly: As noted, comfort-oriented design changes should be studied in conjunction with service planning. We encourage the use of simulation and optimization models to identify scenarios where increasing comfort (via design) and adjusting service (via frequency, bus size, etc.) can produce net positive outcomes. For instance, one might simulate a route with buses that have fewer seats but run more frequently, and assess the overall passenger utility and capacity delivered.
By pursuing these lines of inquiry, the transit research community can build on our pilot results to develop evidence-based guidelines for bus interiors that maximize both accessibility and comfort without unduly sacrificing capacity or efficiency. In doing so, we take a step toward transit vehicles that better reflect inclusive design goals, vehicles that are easier to use in everyday conditions and are pleasant and inviting for a wide range of riders.
6. Conclusions
This pilot study employed a laboratory-based mock-up experiment to examine how two specific interior design variables—seat pitch and seat orientation—are associated with passengers’ perceived comfort and in-vehicle accessibility in an urban bus context. Using ordinal regression models, the analysis indicates that both variables are statistically significant and substantively relevant predictors of perceived comfort, legroom, and ease of movement within the controlled scenarios tested. In particular, increases in seat pitch from a constrained configuration (20 cm) to more moderate (30 cm) and generous (45 cm) configurations were consistently associated with higher probabilities of favorable perceptions. Conversely, in the ~30 cm pitch comparison, longitudinal (side-facing) seating was associated with higher perceived legroom and ease of movement, and higher (though smaller in magnitude) seat comfort, relative to forward-facing seating in this controlled mock-up.
While these findings support the intuitive expectation that interior geometry matters for user experience [38], their contribution should be understood as incremental rather than definitive. The experiment isolates a small set of design features under static conditions in order to identify their directional effects. As such, the results do not capture the full complexity of real-world bus travel, where vehicle motion, trip duration, passenger turnover, and dynamically evolving crowding conditions play a central role in shaping comfort and in-vehicle usability/ease of movement. The observed effects therefore represent short-term, scenario-based perceptions, and causal interpretations should be framed within this restricted experimental context.
From a methodological perspective, the study demonstrates the applicability of cumulative link mixed models for analyzing Likert-scale data in transport research, including their ability to account for within-subject correlations and to express results in probabilistic terms. The robustness checks performed—addressing issues such as quasi-complete separation and testing alternative ordinal specifications—provide confidence that the reported associations are not artifacts of model choice. At the same time, the methodological contribution should be seen as illustrative rather than novel per se, reinforcing good practice rather than advancing new statistical theory.
Importantly, the exploratory extension models including participant characteristics suggest that, within the limits of this pilot sample and the tested scenarios, interior design features exerted larger and more robust effects on perceived comfort and accessibility than individual characteristics such as age, gender, height, or riding frequency. This finding should not be interpreted as evidence that user heterogeneity is unimportant, but rather as an indication that basic spatial constraints can dominate perception under constrained conditions. Broader generalization to populations such as older adults or persons with disabilities remains beyond the scope of the present experiment.
In practical terms, the results point toward design sensitivities rather than prescriptive standards. The evidence suggests that highly constrained seating layouts can substantially degrade perceived in-vehicle usability and that, within the configuration tested for the orientation comparison, a side-facing bench layout improved perceived spaciousness relative to forward-facing seating. These indications should be validated in larger, in-service studies before informing fleet-wide standards. However, translating these findings into fleet-wide design recommendations or regulatory changes requires caution. Trade-offs with vehicle capacity, operational efficiency, and cost were not evaluated, and the laboratory setting does not account for adaptive behaviors observed in real services. The study therefore informs design discussions but does not, on its own, justify definitive policy prescriptions.
In relation to the existing literature, this work contributes a controlled empirical data point to an area that has often relied on aggregated comfort indicators or observational evidence. Rather than claiming a comprehensive quantification of comfort “elasticities,” the study provides preliminary evidence that perceived comfort and accessibility respond nonlinearly to changes in interior space, with diminishing marginal gains as seat pitch increases. This insight aligns with prior work on spatial comfort and service quality, while highlighting the need for further validation under operational conditions.
Finally, this study should be understood as a pilot contribution toward the broader research gap identified in the literature: the lack of integrated evidence linking interior vehicle geometry, in-vehicle usability/ease of movement, and operational realities. Future research should extend this work by including more diverse user groups, incorporating dynamic conditions such as vehicle motion and crowding, and examining additional design variables (e.g., aisle width, standing density, handhold placement). Linking perceptual outcomes to operational and economic analyses would be particularly valuable for informing balanced, evidence-based design decisions.
In summary, the findings underscore that interior bus geometry matters for perceived comfort and accessibility, but they also highlight the limits of what can be inferred from controlled, short-term experiments. By adopting a more modest and precise framing, this study contributes to a cumulative evidence base that can progressively inform human-centered design of public transport vehicles, rather than offering definitive solutions on its own.
Author Contributions
Conceptualization, M.F., V.A., A.P. and S.S.; methodology, M.F., V.A. and S.S.; software, M.F.; validation, S.S. and V.A.; formal analysis, M.F.; investigation, M.F., V.A., A.P. and S.S.; resources, A.P.; data curation, E.B. and S.S.; writing—original draft preparation, M.F. and S.S.; writing—re-view and editing, V.A., A.P. and E.B.; visualization, M.F. and S.S.; supervision, M.F., V.A. and S.S.; project administration, S.S.; funding acquisition, S.S. All authors have read and agreed to the published version of the manuscript.
Funding
This research received funding from Concurso DI Investigación Asociativa Interdisciplinaria 2025, proyecto código: 039.776/2025, Pontificia Universidad Catolica de Valparaíso, Chile.
Institutional Review Board Statement
This study was conducted according to the guidelines of the Declaration of Helsinki and approved by the Ethics Committee of the Pontificia Universidad 1017 Católica de Valparaíso (PUCV-ET-2024/012) on 25 November 2024.
Informed Consent Statement
Informed consent for participation was obtained from all subjects involved in the study.
Data Availability Statement
The original contributions presented in this study are included in the article. Further inquiries can be directed to the corresponding authors.
Acknowledgments
The authors thank the Transportation Engineering Lab at PUCV for providing the space and equipment to construct the bus mock-up. We are grateful to the 25 volunteers whose feedback made this study possible. We also acknowledge helpful discussions with transit design experts during the planning of this experiment.
Conflicts of Interest
The authors declare no conflicts of interest.
References
- Legal Information Institute, Cornell Law School 49 CFR § 38.23—(Ramps, Securement and Accessibility Details). Available online: https://www.law.cornell.edu/cfr/text/49/38.23 (accessed on 1 January 2026).
- U.S Access Board Comparison of NPRM and Existing Accessibility Guidelines for Buses Vans and Over-the-Road Buses. Available online: https://www.access-board.gov/guidelines-standards/vehicles/update-buses-vans/comparison/ (accessed on 1 January 2026).
- Shen, X.; Feng, S.; Li, Z.; Hu, B. Analysis of Bus Passenger Comfort Perception Based on Passenger Load Factor and In-Vehicle Time. SpringerPlus 2016, 5, 62. [Google Scholar] [CrossRef] [Scilit]
- Batarce, M.; Muñoz, J.C.; Ortúzar, J.D.D.; Raveau, S.; Mojica, C.; Ríos Flores, R.A. Evaluation of Passenger Comfort in Bus Rapid Transit Systems; Inter-American Development Bank: Washington, DC, USA, 2015. [Google Scholar]
- United Nations Convention on the Rights of Persons with Disabilities (CRPD)—Article 9: Accessibility 2006. Available online: https://www.un.org/development/desa/disabilities/convention-on-the-rights-of-persons-with-disabilities/article-9-%20accessibility.html (accessed on 1 January 2026).
- Coxon, S.; Burns, K.; de Bono, A.; Napper, R. An Examination of Three Approaches to Metro Rolling Stock Design to Ameliorate Extended Dwell Times Due to Passenger Growth and Associated Crowding. In Proceedings of the 34th Australasian Transport Research Forum (ATRF), Adelaide, SA, Australia, 28–30 September 2011. [Google Scholar]
- Wawryszczuk, R.; Kardas-Cinal, E.; Lejk, J.; Sokołowski, M. Methods of Passenger Ride Comfort Evaluation—Tests for Metro Cars. Sensors 2023, 23, 5741. [Google Scholar] [CrossRef] [Scilit] [PubMed]
- Eboli, L.; Mazzulla, G. A Methodology for Evaluating Transit Service Quality Based on Subjective and Objective Measures from the Passenger’s Point of View. Transp. Policy 2011, 18, 172–181. [Google Scholar] [CrossRef] [Scilit]
- Lucas, K. Transport and Social Exclusion: Where Are We Now? Transp. Policy 2012, 20, 105–113. [Google Scholar] [CrossRef] [Scilit]
- Ministry of Transport and Telecommunications (Chile). Supreme Decree No. 44/2024: Maximum Age and Registration Conditions for Buses in the Metropolitan System; Ministry of Transport and Telecommunications (Chile): Santiago de Chile, Chile, 2024.
- Andrade, A.; Escudero, M.; Parker, J.; Bartolucci, C.; Seriani, S.; Aprigliano, V. Perceptions of People with Reduced Mobility Regarding Universal Accessibility at Bus Stops: A Pilot Study in Santiago, Chile. Case Stud. Transp. Policy 2024, 16, 101190. [Google Scholar] [CrossRef] [Scilit]
- Levine, K.; Karner, A. Approaching Accessibility: Four Opportunities to Address the Needs of Disabled People in Transportation Planning in the United States. Transp. Policy 2023, 131, 66–74. [Google Scholar] [CrossRef] [Scilit]
- Susilo, Y.O.; Cats, O. Exploring Key Determinants of Travel Satisfaction for Multi-Modal Trips by Different Traveler Groups. Transp. Res. Part A Policy Pract. 2014, 67, 366–380. [Google Scholar] [CrossRef] [Scilit]
- Hansson, J.; Pettersson, F.; Svensson, H.; Wretstrand, A. Preferences in Regional Public Transport: A Literature Review. Eur. Transp. Res. Rev. 2019, 11, 38. [Google Scholar] [CrossRef] [Scilit]
- Lättman, K.; Olsson, L.E.; Friman, M. Development and Test of the Perceived Accessibility Scale (PAC) in Public Transport. J. Transp. Geogr. 2016, 54, 257–263. [Google Scholar] [CrossRef] [Scilit]
- Çelebi, D.; İmre, Ş. Measuring Crowding-Related Comfort in Public Transport. Transp. Plan. Technol. 2020, 43, 735–750. [Google Scholar] [CrossRef] [Scilit]
- Low, W.-Y.; Cao, M.; De Vos, J.; Hickman, R. The Journey Experience of Visually Impaired People on Public Transport in London. Transp. Policy 2020, 97, 137–148. [Google Scholar] [CrossRef] [Scilit]
- Seriani, S.; Aprigliano, V.; Peña, A.; Briones, H.; Arredondo, B.; Requesens, J.; Fujiyama, T. Evaluating the Accessibility of Pedestrian Sidewalks to Connect Public Transport: A Pilot Study in Valparaíso, Chile. Appl. Sci. 2025, 15, 1106. [Google Scholar] [CrossRef] [Scilit]
- Jamei, E.; Chan, M.; Chau, H.W.; Gaisie, E.; Lättman, K. Perceived Accessibility and Key Influencing Factors in Transportation. Sustainability 2022, 14, 10806. [Google Scholar] [CrossRef] [Scilit]
- Zhang, K.; Zhou, K.; Zhang, F. Evaluating Bus Transit Performance of Chinese Cities: Developing an Overall Bus Comfort Model. Transp. Res. Part A Policy Pract. 2014, 69, 105–112. [Google Scholar] [CrossRef] [Scilit]
- Yendra, D.; Haworth, N.; Watson-Brown, N. A Comparison of Factors Influencing the Safety of Pedestrians Accessing Bus Stops in Countries of Differing Income Levels. Accid. Anal. Prev. 2024, 207, 107725. [Google Scholar] [CrossRef] [Scilit] [PubMed]
- Watthanaklang, D.; Jomnonkwao, S.; Champahom, T.; Wisutwattanasak, P. Exploring Accessibility and Service Quality Perceptions on Local Public Transportation in Thailand. Case Stud. Transp. Policy 2024, 15, 101144. [Google Scholar] [CrossRef] [Scilit]
- Boadi-Kusi, S.B.; Amoako-Sakyi, R.O.; Abraham, C.H.; Addo, N.A.; Aboagye-McCarthy, A.; Gyan, B.O. Access to Public Transport to Persons with Visual Disability: A Scoping Review. Br. J. Vis. Impair. 2024, 42, 71–85. [Google Scholar] [CrossRef] [Scilit]
- Cabello, N.; Galilea, P.; Ortúzar, J.D.D. Valuing Improvements to Bus Universal Accessibility for Visually Impaired Users: A Case Study in Santiago, Chile. Res. Transp. Econ. 2025, 110, 101523. [Google Scholar] [CrossRef] [Scilit]
- Fernández Aguilera, R. Temas de Ingeniería y Gestión de Tránsito; RIL Editores: Santiago, Chile, 2024; ISBN 978-956-01-0063-4. (In Spanish) [Google Scholar]
- Tiznado-Aitken, I.; Muñoz, J.C.; Hurtubia, R. Public Transport Accessibility Accounting for Level of Service and Competition for Urban Opportunities: An Equity Analysis for Education in Santiago de Chile. J. Transp. Geogr. 2021, 90, 102919. [Google Scholar] [CrossRef] [Scilit]
- Valdivieso, J.; Seriani, S. Study of the Space Occupied by a Wheelchair User at Metro de Santiago Platforms by Laboratory Experiments. J. Adv. Transp. 2021, 2021, 1–20. [Google Scholar] [CrossRef] [Scilit]
- Seriani, S.; Blanche, V. Gestión de Pasajeros y Accesibilidad En La Interfaz Tren-Andén En Estaciones de Metro. Rev. Estud. De Transp. 2021, 22, 1–17. [Google Scholar]
- U.S. Access Board 49 CFR Part 38, Subpart B—Buses, Vans, and Systems. Available online: https://www.access-board.gov/ada/vehicles/guides/subpart-b-guide/ (accessed on 6 October 2025).
- Lohith, K.; Narayani, M.V.; Durupudi, N.R.; Rohit, N.; Nair, N.C. Optimizing Urban Transit: Adaptive and Inclusive Seating Allocation Strategies. In Proceedings of the 2025 IEEE International Conference on Interdisciplinary Approaches in Technology and Management for Social Innovation (IATMSI), Gwalior, India, 6–8 March 2025; IEEE: Piscataway, NJ, USA; Volume 3, pp. 1–5. [Google Scholar]
- Kaitaro, K.K.; Budiman, I.A.; Sahroni, T.R. Analysis and assessment of passenger comfort level in sustainable public bus transportation system. IOP Conf. Ser. Earth Environ. Sci. 2024, 1324, 012067. [Google Scholar] [CrossRef] [Scilit]
- Almutairi, A.; Owais, M.; Ahmed, A.S. Notes on bus user assignment problem using section network representation method. Appl. Sci. 2024, 14, 3406. [Google Scholar] [CrossRef] [Scilit]
- Owais, M. Transit network design problem: A half century of methodological research. Innov. Infrastruct. Solut. 2026, 11, 3. [Google Scholar] [CrossRef] [Scilit]
- Christensen, R.H.B. Clmm—Cumulative Link Mixed Models (R Package “Ordinal”). Available online: https://cran.r-universe.dev/ordinal/doc/manual.html (accessed on 1 January 2026).
- Liu, A.; He, H.; Tu, X.M.; Tang, W. On Testing Proportional Odds Assumptions for Proportional Odds Models. Gen Psych 2023, 36, e101048. [Google Scholar] [CrossRef] [Scilit]
- Williams, R. Generalized Ordered Logit/Partial Proportional Odds Models for Ordinal Dependent Variables. Stata J. Promot. Commun. Stat. Stata 2006, 6, 58–82. [Google Scholar] [CrossRef] [Scilit]
- Ministry of Social Development and Family. Regulations of Law No. 20,422 Concerning Public Passenger Transport (Supreme Decree No. 142/2010); Ministry of Social Development and Family: Santiago, Chile, 2010.
- Givoni, M.; Banister, D. (Eds.) Moving Towards Low Carbon Mobility; Edward Elgar Publishing: Cheltenham, UK; Northampton, MA, USA, 2013; ISBN 978-1-78100-722-8. [Google Scholar]
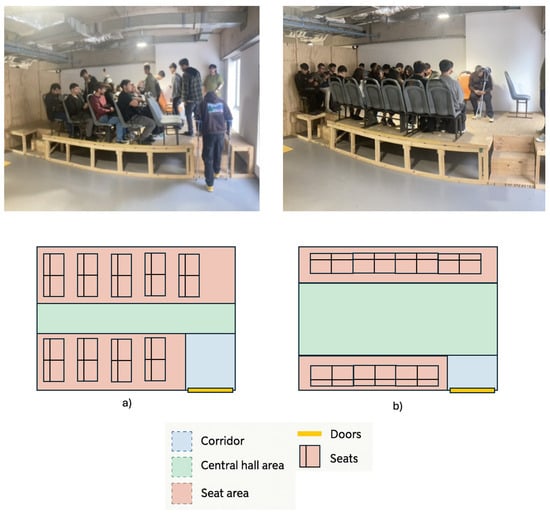
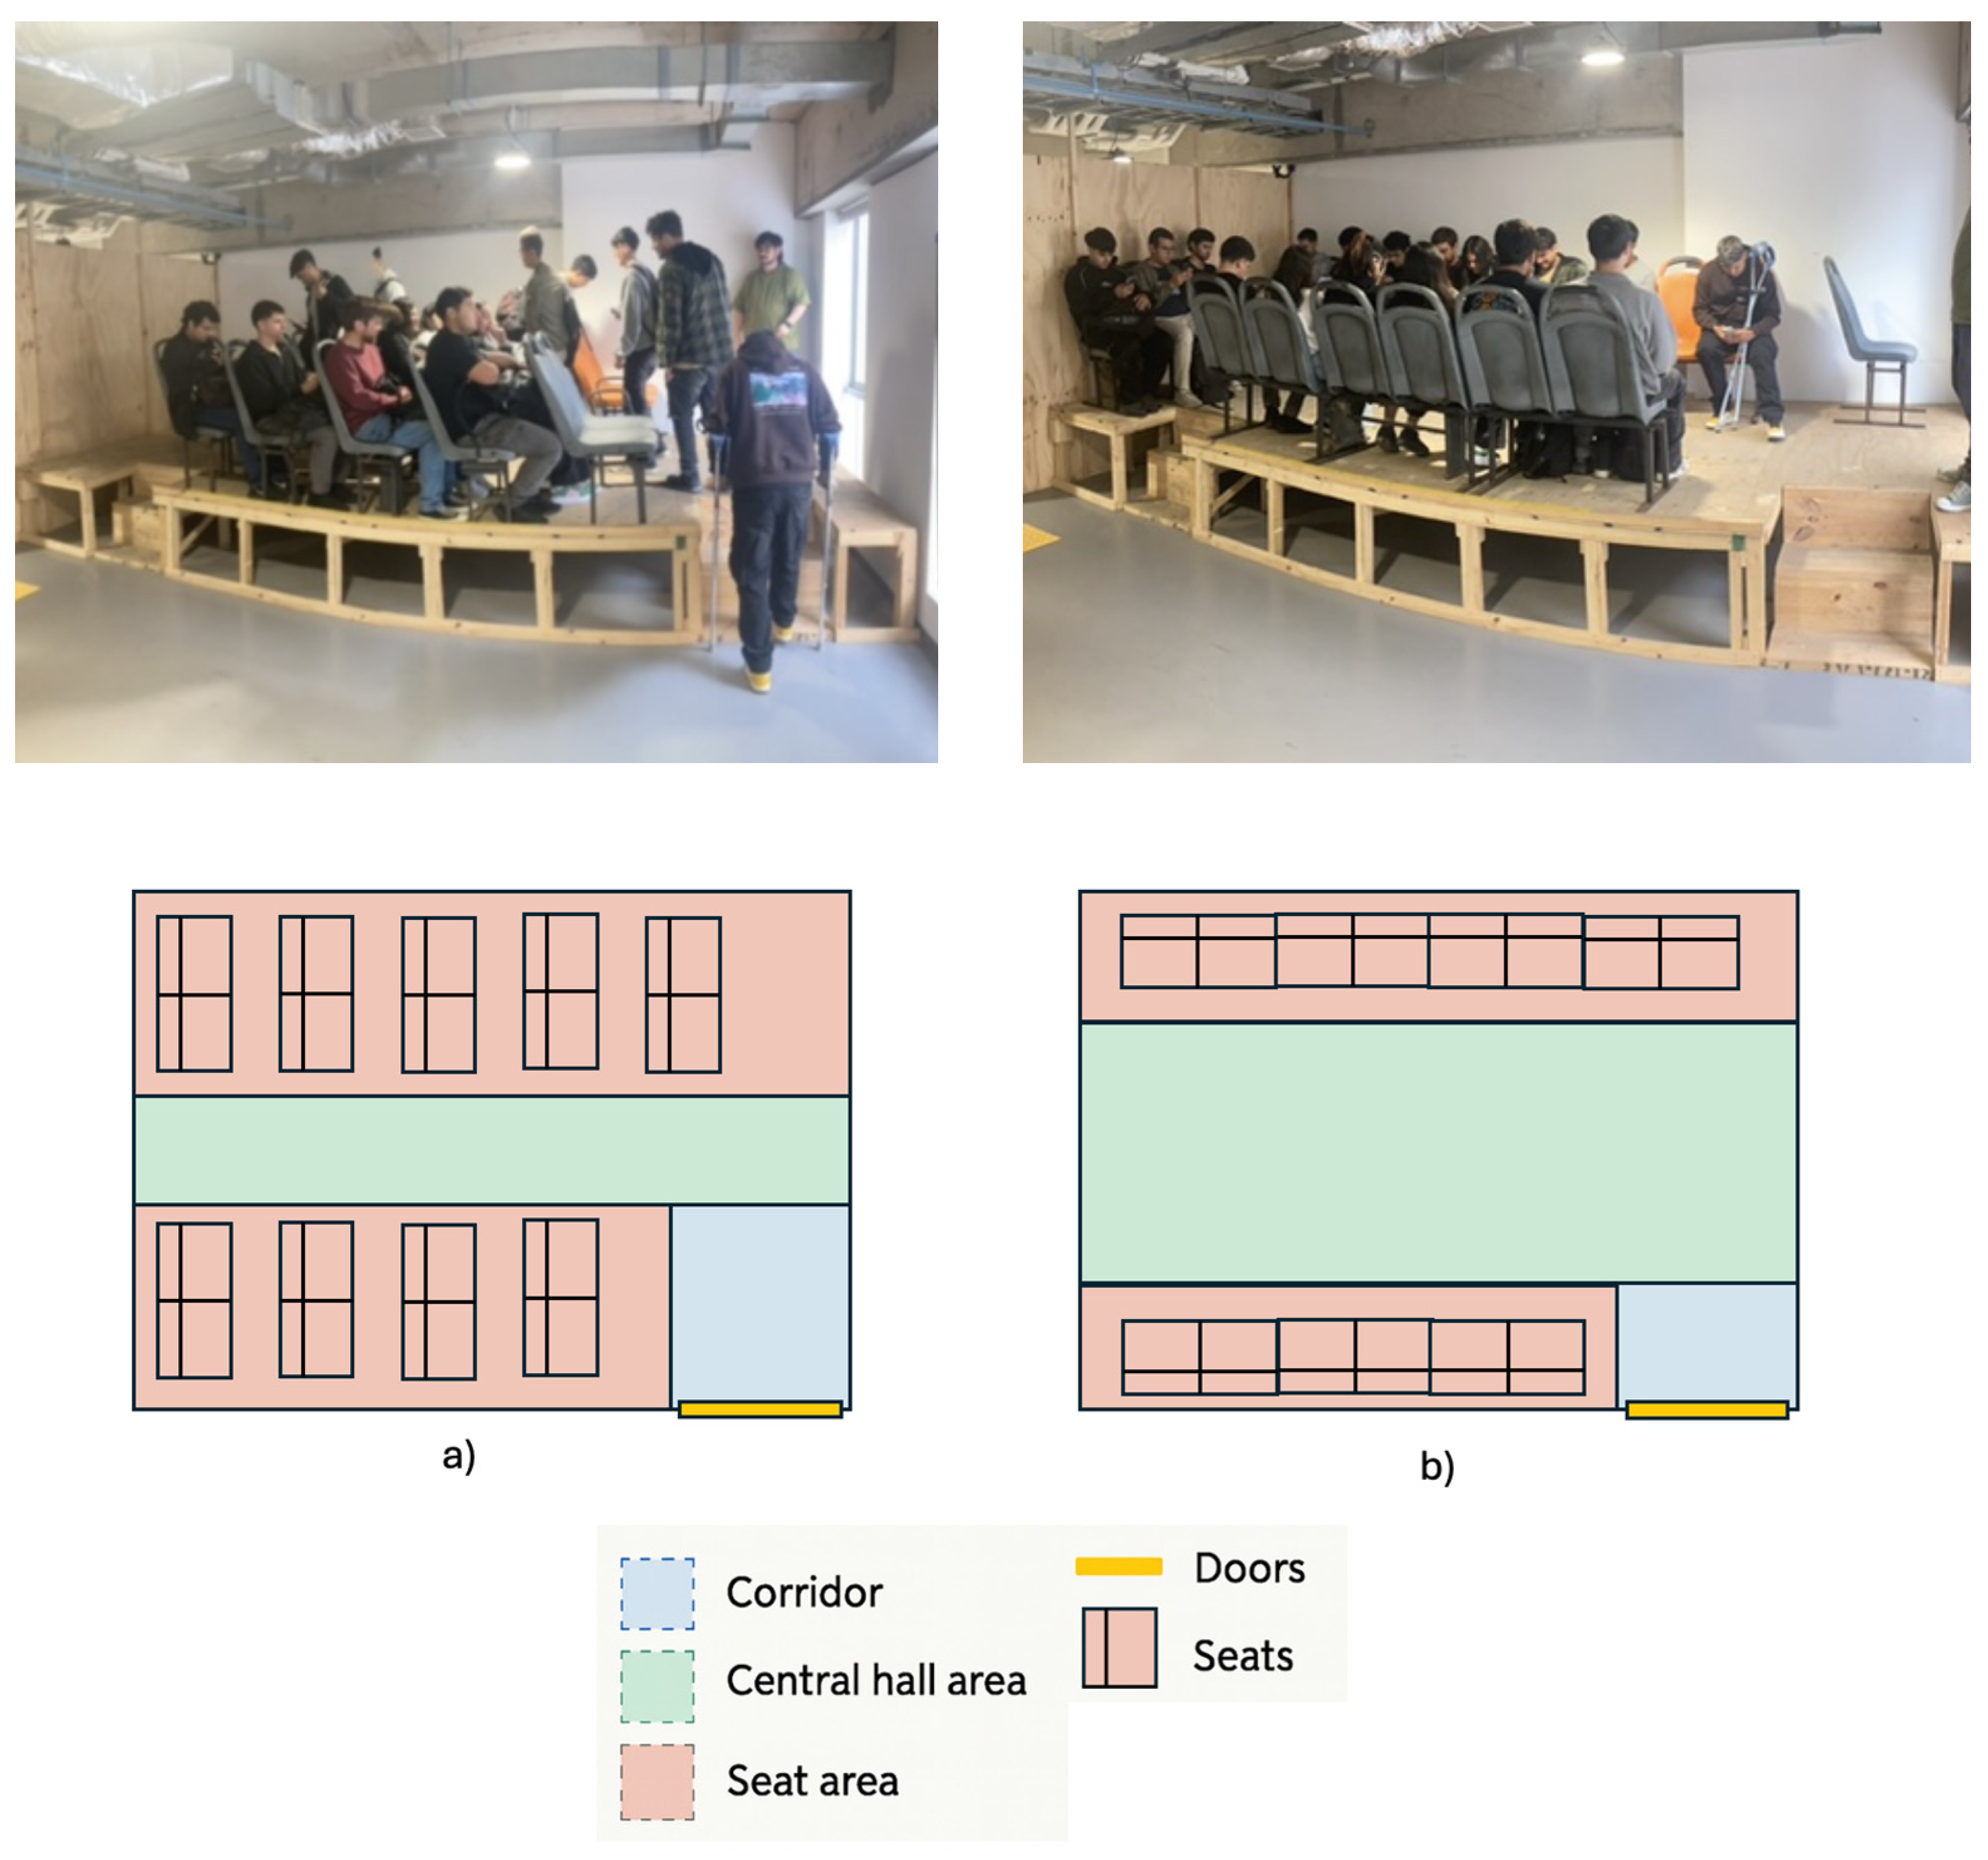
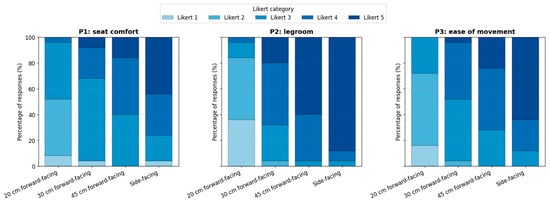
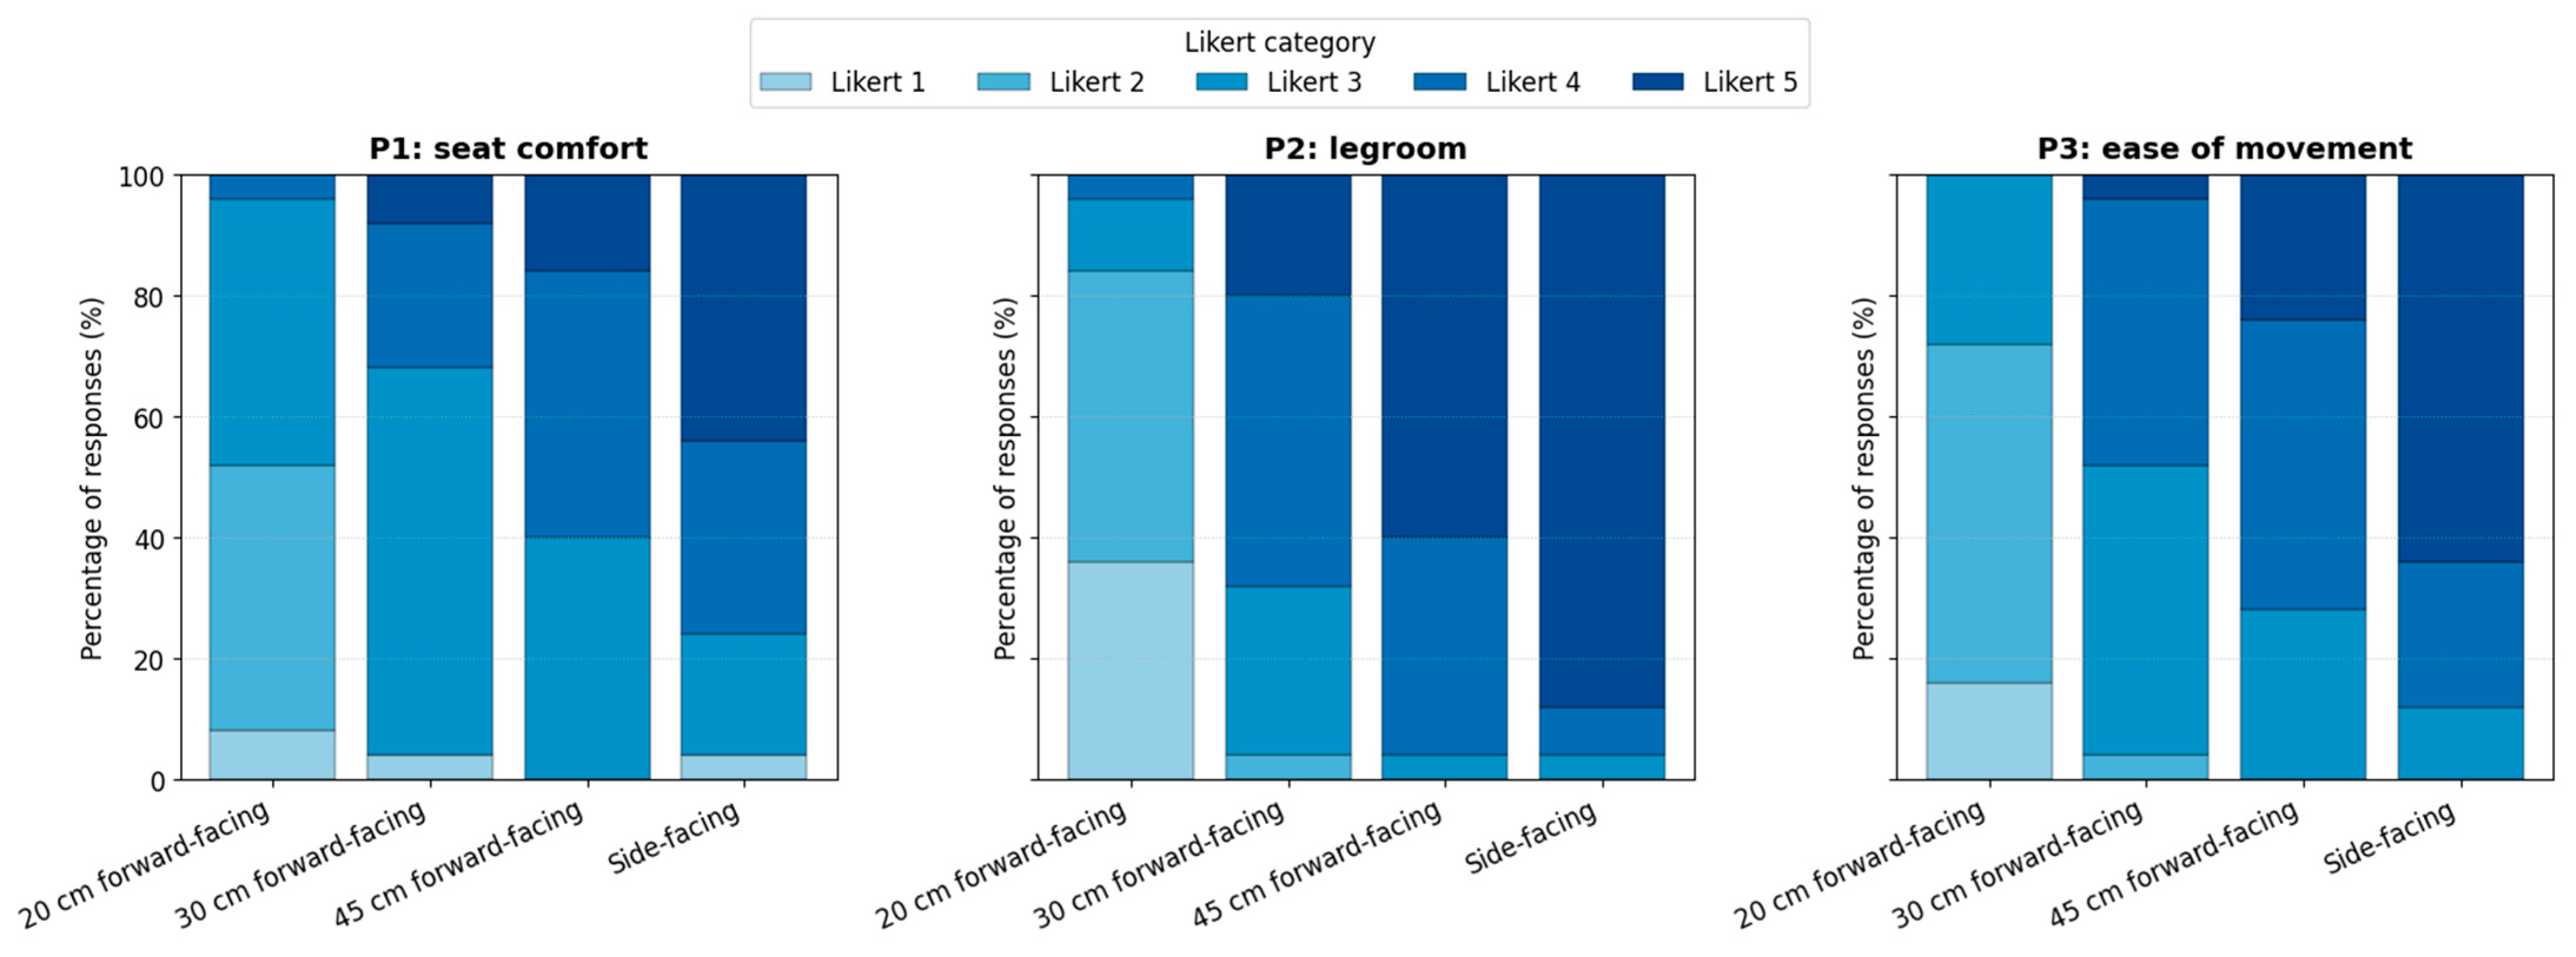

Disclaimer/Publisher’s Note: The statements, opinions and data contained in all publications are solely those of the individual author(s) and contributor(s) and not of MDPI and/or the editor(s). MDPI and/or the editor(s) disclaim responsibility for any injury to people or property resulting from any ideas, methods, instructions or products referred to in the content. |
© 2026 by the authors. Licensee MDPI, Basel, Switzerland. This article is an open access article distributed under the terms and conditions of the Creative Commons Attribution (CC BY) license.