


Abstract
The digital and ecological transition of the industrial sector requires methodological tools that integrate information modelling, performance simulation, and operational decision support. In this context, the present study introduces and tests a semi-automatic BIM-to-BEM framework to optimise human–machine interaction and support critical data interpretation through Graphical User Interfaces. The objective is to propose and validate a BIM-to-BEM workflow for an existing industrial facility to enable comparative evaluation of energy retrofit scenarios. The information model, developed through an interdisciplinary federated approach and calibrated using parametric procedures, was exported in the gbXML format to generate a dynamic, interoperable energy model. Six simulation scenarios were defined incrementally, including interventions on the building envelope, Heating, Ventilation and Air Conditioning (HVAC) systems, photovoltaic production, and relamping. Results are made accessible through dashboards developed with Business Intelligence tools, allowing direct comparison of different design configurations in terms of thermal loads and indoor environmental stability, highlighting the effectiveness of integrated solutions. For example, the combined interventions reduced heating demand by up to 32% without compromising thermal comfort, while in the relamping scenario alone, the building could achieve an estimated 300 MWh reduction in annual electricity consumption. The proposed workflow serves as a technical foundation for developing an operational and evolving Digital Twin, oriented toward the sustainable governance of building–system interactions. The method proves to be replicable and scalable, offering a practical reference model to support the energy transition of existing industrial environments.
1. Introduction
1.1. General Context
The construction sector is one of the main contributors to global climate-changing emissions, accounting for approximately 30% of final energy consumption and 26% of global energy-related emissions [1]. In this scenario, the United Nations 2030 Agenda has set promoting clean energy, urban sustainability, and climate action among its main objectives [2]. At the European level, the Renovation Wave strategy aims to double the annual rate of building energy renovation by 2030 [3]. At the same time, the Fit for 55 legislative package fits into this scenario by defining a series of binding regulatory instruments to ensure a reduction in net greenhouse gas emissions of at least 55% by 2030, compared to 1990 levels [4]. In this scenario, the industrial sector is one of the main critical areas in the global challenge to decarbonise the building stock. Although public policies and scientific research have often focused on residential and tertiary buildings, production facilities continue to contribute significantly to the construction sector’s overall environmental footprint. According to the International Energy Agency [5], the industrial sector accounts for around 30% of global final energy consumption and is responsible for a significant share of climate-changing emissions from air conditioning, ventilation, and internal process power systems. In particular, existing industrial buildings constructed between the 1960s and 1990s typically suffer from obsolete systems, poor building envelope performance and limited system digitisation. These factors make them not only energy-inefficient but also ill-equipped to cope with the transition to sustainable, predictive, and flexible management. The United Nations Global Status Report for Buildings and Construction [6] highlights how, despite the acceleration of digital innovation in residential and tertiary buildings, the industrial sector remains one of the least monitored and least digitised segments. In this context, energy retrofitting is a strategic priority when supported by decision-making tools that compare scenarios, evaluate trade-offs, and enable informed choices. To this end, the Industry 5.0 paradigm, promoted by the European Commission, proposes an integrated vision in which humans are placed at the centre of digital interaction, not as mere observers but as conscious actors in the decision-making process [7].
In such a challenging context, integrating innovative processes and tools, such as Building Information Modelling (BIM) and Environmental, Social, and Governance (ESG) practices, is crucial for charting a course toward sustainability. ESG represents a set of criteria that guide organisations in their responsibility towards the environment, society, and proper corporate management. These principles establish a balance between economic performance and social and environmental impacts, pointing the way to building solutions that are not only efficient and innovative but also responsible and sustainable on a global level. It is in this context that Building Information Modelling to Building Energy Modelling (BIM-to-BEM) processes serve as a strategic approach to addressing the challenges posed by ESG, enabling the energy transition and optimised resource management throughout the life cycle of buildings, in line with globally defined sustainability goals.
Figure 1 shows the integration between the three ESG pillars, namely the environment, the people and the governance, and the methods and tools identified (BIM, BEM, and Digital Twin (DT)), highlighting how the convergence of these areas contributes to the creation of sustainable management models for the building-plant system.
Figure 1.
Environmental, Social, Governance framework with BIM, BEM and Digital Twin methods and tools.
Despite their significant role within the European building stock, industrial facilities remain underrepresented in energy and digital retrofit strategies, with operational DT applications still limited and often restricted to controlled or experimental contexts. The implementation of advanced simulation workflows is frequently hampered by inconsistent, outdated, or non-interoperable information models, which obstruct the establishment of continuous digital pipelines and hinder the transition from BIM to BEM. Persistent interoperability issues, including fragmented data formats, semantic misalignment and the lack of shared standards, continue to represent structural barriers to the development of fully operational digital systems.
Within this perspective, the visual representation of technical information takes on a central role. Tools such as BIM, BEM and interactive dashboards not only enable the simulation of energy behaviour and consumption profiles but also render design configurations legible and comparable across comfort, efficiency and adaptability criteria. More importantly, these tools can now be understood within a broader continuum of digital representations of the built environment. At one end, Digital Models are static virtual constructs that are manually updated and used primarily for documentation, design, and isolated simulations. Progressing along this spectrum, Digital Shadows introduces periodic data flows from the physical asset to its virtual counterpart, enhancing monitoring and diagnostic capacity while maintaining a unidirectional relationship. At the most advanced stage, Digital Twins (DTs) establish real-time, bidirectional communication between virtual and physical layers, enabling predictive analytics, optimisation and operational control. Recognising this continuum helps clarify the diversity of digital practices currently applied to industrial buildings and the varying levels of automation, data integration and operational capability they entail.
Building on these considerations, the evolution of Digital Models into operational tools calls for a broader reflection on how users access and interact with data. Intelligent visual interfaces, interactive dashboards, conversational agents, and immersive eXtended Reality (XR) environments are increasingly essential for bridging the gap between technical information modelling and strategic decision-making. Aligned with the principles of the New European Bauhaus [8], these approaches foster a transition that is not only technologically efficient but also inclusive and culturally accessible. In this expanded perspective, the DT ceases to be a mere digital replica and instead becomes a dynamic knowledge infrastructure integrating geometry, environmental parameters, operational data and predictive algorithms within a unified ecosystem.
Consistent with the principles of Industry 5.0, which emphasise the convergence of digital technologies, sustainability and human-centricity, the DT emerges as an operational environment in which human decision-makers engage directly with data-driven insights. Adaptive interfaces, real-time feedback loops and semantic querying mechanisms transform the DT from a descriptive artefact into an active, interactive system capable of supporting collaborative reasoning, transparent energy management and continuous performance optimisation. In light of these technological and sustainability-driven transformations, the need for methodological frameworks that are replicable, interoperable and scalable becomes increasingly evident. Such frameworks must reliably connect information modelling, energy simulation and DT-oriented operational strategies to provide tangible support for the energy and maintenance management of the existing industrial heritage.
1.2. Scientific Problem
The growing urgency to respond systematically to environmental and climate challenges has confronted the construction and manufacturing sectors with the need not only to reduce energy consumption, but also to restructure the cognitive processes through which such consumption is monitored, interpreted and managed [6]. In this context, industrial buildings represent a particularly critical area: the fragmentation of information sources, poor interoperability between systems and the presence of incomplete or obsolete data prevent the construction of truly reliable operational models that can be used in day-to-day management [9]. The complexity of industrial plants, combined with the fragmentation of modelling protocols, effectively prevents the adoption of unified solutions capable of integrating all the information dimensions necessary for advanced energy management. The idea of relying on a single software environment capable of covering all aspects of industrial building management, from geometric modelling to energy simulation and plant control, faces structural and operational limitations: no platform currently in use coherently integrates all these components, making modular, coordinated solutions necessary [10]. This gives rise to the need to build distributed modular architectures based on complementary tools and articulated workflows, where each phase, from geometric modelling to dynamic simulation, from sensor technology to operational governance, is addressed by diverse specialist skills [11].
In this scenario, data visualisation represents the cognitive and operational heart of the system: tools such as interactive dashboards, immersive XR environments, and intelligent reports become strategic levers for converting energy and performance data into real, shared knowledge, making plant systems accessible and interpretable even to non-technical users and non-specialist decision-makers [2]. Within this perspective, an interdisciplinary approach becomes essential: the convergence of BIM modellers, energy engineers, dynamic simulation experts, interface developers, and information visualisation designers provides the proper foundation for an effective digital transition for the industrial sector [12].
1.3. Scope of the Work
Within this framework, the present work introduces an integrated operational methodology for the energy retrofitting of existing industrial buildings. The approach combines BIM, BEM, advanced control strategies, and interactive visualisation tools to establish a clear, actionable transition from BIM to BEM. Particular emphasis is placed on creating interoperable, updatable and replicable workflows that support informed decision-making in real-world industrial contexts, bridging the gap between design environments, monitoring practices and operational management within a sustainability-oriented perspective. To situate the proposed workflow within the broader landscape of digital representations, the methodology also articulates an explicit mapping across progressive stages of digital maturity. In its current implementation, the proposed BIM-to-BEM workflow operates as a Digital Model, providing a structured, static representation used for documentation, design analyses and comparative simulations. When enriched with operational data, monitoring inputs and control strategies, the system evolves into a Digital Shadow, where the virtual environment is periodically informed by the behaviour of the real asset, enabling enhanced diagnosis and performance assessment without influencing the physical system. This progression establishes the methodological foundation for future development into a Digital Twin, in which real-time, bidirectional connections between physical and virtual layers would enable predictive analytics, optimisation and operational control.
This evolution of the BIM-to-BEM from a Digital Model to a Digital Shadow and then to an operational Digital Twin is one of the core proposed scientific novelties. The framework presented here is therefore designed as a preparatory, extensible digital infrastructure: while functioning today as a decision-support environment for energy retrofitting, it is also conceived to be progressively expanded towards full DT capability through additional layers of data connectivity, automation, and real-time feedback mechanisms. In this sense, the proposed methodology acts as a sustainability-oriented decision-support tool, operationalising data-driven principles by integrating models, monitoring inputs, and user interfaces into a multifunctional digital environment. Its navigability and clarity ensure that both technical and non-specialist users can query and interpret information, effectively linking information modelling with operational management and offering a concrete, transferable methodological reference for the digital transformation of industrial facilities.
The methodology was applied and validated on an existing industrial plant in Italy. After developing the BIM model and converting it into a performance-oriented BEM, six alternative retrofit scenarios were simulated, each incorporating specific modifications to the building configuration to evaluate energy savings and operational performance under different conditions. A further component of the workflow is the creation of an interactive dashboard that enables intuitive visualisation, scenario comparison, and access to dynamic results for diverse user profiles.
2. State of the Art
To structure a coherent critical review of the scientific landscape on BIM-to-BEM information flow, a comparative matrix was developed to classify existing contributions systematically. The matrix consists of nine operational phases, identified as representative of the main stages that characterise the transformation from BIM to BEM, culminating in interactive outputs geared towards decision support. These phases include: (1) data collection, (2) static modelling, (3) simplification and structuring of the model, (4) assignment of energy properties, (5) export to simulation engines, (6) simulation and validation, (7) comparative scenario modelling, (8) results visualisation, and (9) interactive decision-support dashboard. In particular, the last two phases of the matrix (i.e., (8) and (9), respectively) represent the link between the simulation model and its operational use. It is, in fact, in the display of results and user interaction that the BEM model could evolve from an analytical tool to an operational DT. Rather than being a static replica, the DT provides energy scenarios, performance indicators, and dynamic comparisons through responsive interfaces. In this framework, the dashboard plays a central role, acting as the primary link between the model and end users, enabling both understanding and informed decision-making. Without this interactive component, the DT remains purely descriptive and lacks practical operability.
As shown in Table 1, each literature contribution was mapped within the matrix using a binary criterion: the actual and substantial presence of each phase was indicated with the symbol “o”, while its absence, marginal or implicit treatment was marked with “x”. Partial presence of the phase is indicated by “x/o”. This approach excluded partial or purely citation-based approaches and isolated the methodological references that were actually relevant to each phase of the flow.
Table 1.
Comparative matrix of the selected scientific contributions across nine BIM-to-BEM methodological steps. The “o” indicates the presence of each step; “x” indicates its absence, while “o/x” indicates partial presence.
The matrix’s organisation also informed the analysis discussion of this section, which has been divided into three main thematic areas: (i) BIM-to-BEM, (ii) Dashboard and decision support, and (iii) Operational DT. Only contributions that explicitly and verifiably addressed each specific phase were included in the corresponding category. This structure ensures that the text remains internally consistent, accurately reflects the covered content, and avoids unnecessary overlaps or misinterpretations.
2.1. BIM-to-BEM
The transition from BIM to BEM is one of the central methodological challenges in the digitisation of the construction sector [13]. The transformation process involves multiple levels: from data collection and architectural modelling to simplification, definition of astrophysical properties and export to simulation engines [14]. However, recent literature shows that no established pipeline can connect all these phases in a continuous, automated, and interoperable manner [15].
Figure 2 shows a conceptual diagram of HCI designed to build a digital ecosystem. In this context, the DT is defined as a layer of static data (BIM, BEM) and dynamic data (real-time data), which must be linked to enable critical, integrated interpretation of the information. The development of graphical interfaces enables direct relationships between users and data, facilitating the definition of new strategies and policies for smart cities. The initial data collection phase includes heterogeneous sources such as geometric surveys, existing drawings, IoT systems, and plant documentation [16]. This heterogeneity, if not accompanied by consistent structuring, generates semantic ambiguities in the informative model [17]. Some studies propose shared information flows between planners and managers to strengthen model consistency [18].
Figure 2.
Conceptual framework of Human Machine Interaction. Dashed lines indicate dynamic dataflows, while the continuous line indicate static ones.
Once constructed, the BIM model can vary widely in granularity, semantic structuring, and information consistency [19]. The presence or absence of coded parametric families, the definition of thermal zones, and the organisation of information directly affect the possibility of reuse in the energy domain [20].
Model simplification is often necessary for adaptation to energy simulation software, but it is rarely systematic [21]. Some authors adopt manual filtering and aggregation strategies, compromising the reliability of the process [22]. Others propose more structured approaches, based on archetypes or functional categories [23].
The attribution of energy properties represents another critical point in the flow [24]. While some studies use standard libraries of materials and loads, others highlight the need to adapt these parameters to the specific building context [25]. The lack of interoperability between BIM and energy environments further complicates this phase [26].
The model is usually exported to simulation engines using intermediate formats such as green building eXtensible Markup Language (gbXML) or IDF, but this introduces known problems of information loss and geometric conversion [27]. In many cases, manual intervention is required to correct import errors and ensure that the model is readable in the simulator [28].
Once the BEM model has been completed, energy simulation is carried out using software such as EnergyPlus, IES-VE or DesignBuilder [29]. However, few studies go beyond static simulation, and even fewer systematically address calibration with respect to measured data [30]. Even when usage profiles or local climate files are entered, the simulation almost always remains disconnected from an integrated operational phase [31].
Overall, the literature presents a fragmented picture: each contribution explores a single phase of the BIM-to-BEM flow, but none proposes a complete, interoperable, and reusable pipeline. This methodological discontinuity confirms the absence of a shared solution for the integrated transition between digital design and energy modelling, highlighting a clear opportunity for theoretical and operational innovation.
2.2. Dashboard and Decision Support
The representation of energy simulation results is increasingly important in the transition from static models to operational decision-support tools [21]. While most academic contributions conclude with numerical or graphical results, some experiences seek to bridge the gap between the analytical phase and the final user interface [23].
Dashboards are designed as interactive environments capable of providing information in a concise, visual format tailored to different user profiles, such as designers, managers and energy managers, but their implementation in the BIM-to-BEM context is often incomplete [24]. Some studies highlight the use of reporting tools or interfaces integrated into simulation software. Still, these environments are rarely interoperable with the original BIM model or updatable to reflect new energy scenarios [25].
A critical issue is the lack of a transparent, structured approach to data based on its use. Simulation results are often returned as static outputs (files, graphs, maps) without any functional organisation for decision-making processes or maintenance [30]. In some cases, the use of immersive environments or XR is proposed to facilitate the reading of simulated data, but these are experiments that do not enter the operational cycle of building management [32].
The possibility of interacting with results, filtering scenarios or analysing alternatives via responsive interfaces is still poorly addressed in existing literature. Even in the most advanced cases, the decision support component is relegated to descriptive and non-interactive levels, preventing integration with energy management or maintenance processes [31].
In conclusion, although the visualisation of results is recognised as a key step in operationalising the BIM-to-BEM flow, existing solutions remain fragmented. None of the revised studies propose a dashboard that is truly integrated with the previous modelling and simulation stages, nor a dynamic visualisation system capable of adapting to the different roles involved in the decision-making process. This severely limits the potential of simulated data as a tool for building management and control.
2.3. Operational Digital Twin
The evolution of information models towards a more dynamic paradigm has led to the introduction of the concept of DT in the construction industry, although its operational definition is still vague and applied in a heterogeneous manner [15]. In the BIM-to-BEM field, DT is often understood as a simulation extension of the energy model, capable of providing scenarios and indicators in a visual format and, in some cases, updatable [16].
However, the analysed solutions show an apparent prevalence of descriptive approaches, focused on representation rather than continuous operation.
Some studies propose federated models that integrate architectural geometry, systems and thermal zones, which can be used for energy and maintenance assessments [17]. These models are usually developed using traditional BIM software and then enriched with simulation-relevant attributes, but they cannot be updated or connected to monitoring systems [18]. Even when the information flow covers the entire BIM-to-BEM chain, the final model remains static, lacking interaction and adaptive capacity [19].
The simulation component is often treated as an external environment, separate from the original BIM model. Exporting software, such as EnergyPlus, enables analysis of energy scenarios but lacks feedback on the initial model or iterative data management [20]. The update cycle is therefore interrupted: the DT does not evolve according to the context or plant modifications, limiting its validity over time.
Another critical issue is the lack of connection between simulation and decision-making. Although some contributions address the generation of multiple scenarios or comparative modelling, these approaches do not converge into a coherent structure that allows continuous control or maintenance based on simulated data [22]. Modelling remains confined to the design phase and is not intended to be reused during the building’s useful life [28]. Some more advanced cases introduce concepts of data sharing among the BIM, BEM, and Facility Management (FM) domains, aiming to unify information sources and produce a consistent model [29]. However, these are still experimental architectures, lacking operational validation or scalability.
In summary, the review shows that none of the examined articles proposes a truly operational DT, i.e., one capable of integrating modelled, simulated, and visualised data in a continuous, updatable cycle for management. DT is often invoked as a concept but not implemented as a platform, leaving the link between simulated performance and concrete action unaddressed.
2.4. Scientific Novelty
The conducted analysis highlights a cross-cutting element: none of the contributions examined fully covers all nine phases identified, nor does it propose an interoperable, continuous and validated methodological pipeline. On the contrary, fragmented approaches prevail, focusing on individual aspects of the flow and often disconnected from information modelling, simulation, and operational feedback. Specifically, the 9 phases can be grouped into two critical areas of discontinuity: phases 1 to 6 for methodological fragmentation in BIM-to-BEM; phases 7 to 9 for the lack of interaction between simulated performance and practical management action. This occurs because current modelling methodologies tend to focus on specific tasks in isolation, and the dashboards employed in existing works remain predominantly descriptive and static.
The proposed research addresses the identified gap by proposing a complete, operationalised, and end-to-end BIM-to-BEM framework that fills the gaps, by introducing a systematic methodological flow designed to ensure information consistency and continuity across all nine phases and by implementing a real-time scenario comparison into an interactive dashboard, supporting decision-making. In this sense, this work delivers a Digital Shadow, not merely descriptive but characterised by a continuous and updatable cycle that aligns modelled and simulated data with the objective of supporting active management. In doing so, the framework transforms the traditional static analytical model into a dynamic and adaptive platform for continuous performance evaluation and operational control. The architecture of the workflow also makes it naturally extensible towards the development of a full Digital Twin, requiring only the future integration of real-time sensing and bidirectional interaction with the real-world environment. Overall, the methodology establishes a sustainability-oriented digital environment that effectively bridges the gap between modelling, simulation, and operational decision-support within industrial buildings.
3. Materials and Methods
The methodological framework adopted in this study is structured around a sequential BIM-to-BEM workflow designed to ensure consistency, traceability, and interoperability from geometric modelling to energy simulation and final performance evaluation. As illustrated in Figure 3, the process unfolds across three interconnected layers: (i) the creation and federation of the BIM, where the building is digitally structured and filtered to support analytical use; (ii) the construction and verification of the BEM, including interoperability checks, parameter assignment, and simulation preparation; and (iii) the generation of decision-support outputs through a dashboard environment, enabling comparison of retrofit scenarios and extraction of performance indicators. Together, these stages provide a clear, reproducible pathway from digital modelling to scenario-based evaluation, supporting informed decision-making throughout the study.
Figure 3.
Methodological framework from BIM to Dashboard.
3.1. BIM Model Organisation
In this research, the construction of the digital information model was not conceived as a mere geometric exercise or a simple three-dimensional transposition of the existing building. Rather, it was approached as a strategic process aimed at structuring a solid, interoperable database capable of supporting subsequent energy simulations. The process was developed iteratively, starting from survey and data analysis (provided in digital format), through a sequence of progressively refined models in which a constant balance was sought between geometric complexity and the simplicity required to ensure efficiency, readability, and consistency in the plant’s digitalisation flow, as sketched in Figure 4.
Figure 4.
Digitisation process of BIM data for energy simulation of industrial plants.
The federated BIM pursued a dual objective: on one hand, to ensure topological consistency among physical environments, thermal zones, and plant components; on the other, to establish an information system accessible not only to BIM specialists but also to technical managers, energy engineers, and facility management personnel.
Within this framework, the federation process acted as a cognitive infrastructure, integrating three distinct disciplinary models, architectural, Heating, Ventilation and Air Conditioning (HVAC), and electrical, into a single coordinated environment that laid the foundations for the development of the BEM through interoperable software tools. The modelled information was not treated as an end in itself but selectively filtered and organised according to its relevance to performance analysis. Priority was therefore given to elements essential for thermal simulations and internal load calculations, while secondary or decorative components were intentionally minimised. In line with what is discussed in [33] federation is understood here not as a formal objective but as a critical and operational act, constructing a model that is action-oriented, capable of enabling reliable simulations, supporting decision-making processes, and, in perspective, feeding dynamic representations typical of DTs. The resulting federated model, depicted in Figure 5, thus serves multiple purposes: it is not only a reliable tool for comparative energy analyses across alternative design scenarios, but also an operational instrument for space and system management, thanks to its hierarchical structure and interdisciplinary readability. Moreover, it has proven particularly effective for training purposes, allowing technical staff to digitally explore the plant, understand its functional structure, and visualise planned transformations by comparing the existing configuration with proposed layouts. This educational dimension, often overlooked in BIM workflows oriented solely toward production, highlights the generative and multifunctional nature of the Digital Model when conceived as a medium for knowledge rather than merely documentation.
Figure 5.
BIM of an industrial plant as an example.
From a technical standpoint, the federated BIM environment was organised into three distinct yet interoperable subsystems, reflecting the previously defined disciplinary models: the architectural, HVAC, and electrical models, depicted in Figure 6. Each subsystem was developed as an independent file within Autodesk Revit 2021, following parametric object modelling principles and designed to be semantically and spatially integrated with the others in a coherent information structure. The architectural model represents the building envelope, shed roof structure, internal partitions, and the functional division of spaces, with particular attention to the correspondence between physical environments and thermal zones to facilitate energy modelling. The HVAC model describes the main terminals and duct networks at an appropriate level of abstraction to capture the functional organisation without excessive geometric complexity. The electrical model includes the central distribution systems, lighting fixtures, and control panels, providing a concise yet informative overview of the plant network.
Figure 6.
Federated BIM and its components.
This three-part division simplified modelling workflows while maintaining a high degree of readability for users involved in management and control activities. The disciplinary separation, though technical, was intended to enhance accessibility for non-specialist users, such as maintenance technicians, energy managers, and production supervisors. Consequently, the BIM model evolved from a mere authoring environment into a shared interface between design, simulation, and operational management.
Finally, the modular organisation of the model facilitated the identification and manipulation of components relevant to energy simulation, simplifying the export of data to interoperable formats (Industry Foundation Classes–IFC 2x3 and Green Building XML–gbXML). This ensured compatibility with specialised energy-modelling software and represented a key step in the overall workflow: the hierarchically structured federated model could thus be transformed into an environment for testing and comparing scenarios, suitable for technical evaluation as well as for training and management.
3.2. Interoperability and Verification of the BIM-to-BEM Model
The implemented modelling techniques were defined to obtain a consistent, manipulable, and, above all, reliable information model for export to energy simulation tools, to reduce corrective operations in the post-processing phase as much as possible. In complex production contexts, such as the presented case study, characterised by an industrial plant with a shed roof, any errors replicated during the modelling phase, for example, on a windowed component multiplied by dozens of modules, can generate systematic critical issues, whose correction may be time-consuming within calculation environments, such as DesignBuilder, and compromise the reliability of the result.
On the contrary, the ability to intervene on a single instance in a BIM environment and seeing it automatically replicated throughout the information system is one of the main operational advantages of the method: modifying a ‘standard’ window in Revit is equivalent to instantly updating all its occurrences, strengthening the control and traceability of the entire model.
To ensure this approach, a Level of Development (LOD) between 200 and 250 was adopted, as defined in UNI 11337-4:2017—Digital management of construction information processes—Part 4 [34], which specifies the minimum information and geometric requirements for technical and analytical use of the model. This level allowed for the representation of the volumetric organisation and the building elements, which are significant for energy simulation purposes, in a concise yet accurate manner, avoiding unnecessary over-detail. Elements that do not influence performance, such as furnishings, secondary details or decorative components, were excluded from the modelling. The priority objective was the volumetric closure of the rooms, the accurate definition of the envelope surfaces, and the association of materials only where relevant to the thermal balance. The HVAC system components were modelled using generic, simplified families, consistently positioned to ensure the system is readable without weighing down the model.
At the end of the modelling process, the verification and interoperability phase took place, allowing the transition from the information model into a BEM. The process was structured in two distinct but complementary stages. The first, conducted within Autodesk Revit, involved using the Autodesk Revit Energy Analytical Model (EAM) module to verify the thermo-geometric integrity of the system: closure of environments, correct definition of zones, and assignment of consistent physical properties. In this phase, any minor errors in the association between spaces and dispersing surfaces were corrected by acting directly on the native model. The second stage took place outside the BIM platform, using the open-source LadyBug Tools (version 1.7.26), as depicted in Figure 7, which allowed the building envelope to be validated through a series of lightweight, parametric analyses: verification of openings, solar exposure, flow mapping, and automatic recognition of perimeter surfaces. This environment, in addition to ensuring transparency and accessibility, allowed for targeted testing before final import into DesignBuilder (version 6.1.5), minimising the typical errors associated with reading the gbXML format. The simulation engine for the energy computations is EnergyPlus (version 8.9). During the gbXML export, specific options were applied to ensure simulation accuracy and interoperability: tessellation was set to “medium” to balance geometric detail with computational efficiency; zoning was based on the architectural thermal zones defined in the BIM model; and tolerance settings were adjusted to a precision of 0.001 m to avoid gaps or overlaps in the exported surfaces. To further ensure transparency and reproducibility, a detailed mapping was established between Revit main categories and objects and the corresponding gbXML and EnergyPlus entities. Each building element, including walls, roofs, floors, windows, doors, internal partitions, HVAC terminals and plant components, was systematically translated into simulation-relevant entities. Simplification rules were applied to reduce geometric complexity while maintaining thermal accuracy, such as merging repetitive elements, omitting minor projections, or abstracting HVAC systems to representative terminals and plant objects. Openings, including windows, doors, and skylights, were treated carefully to preserve size, orientation, and solar exposure for accurate energy simulations. A complete summary of this mapping, including simplifications and the treatment of openings, is provided in Table 2, ensuring full traceability of the modelling assumptions and supporting reproducibility of the workflow for future industrial building applications. It should be noted that HVAC and other MEP components were not exported directly via gbXML; instead, they were configured in DesignBuilder and subsequently represented in EnergyPlus as conservative system archetypes consistently associated with the thermal zones derived from the BIM model. Table 2 builds upon the BIM-to-BEM data-exchange framework previously developed for industrial buildings energy assessment [16].
Figure 7.
gbXML model of the industrial plant developed for energy analysis. The model was checked using the open-source Spider gbXML Viewer v12 by LadybugTools (https://www.ladybug.tools/spider/gbxml-viewer/r12/gv-app/gv-app.html (accessed on 30 July 2025)).
Table 2.
Mapping table between Revit, gbXML and EnergyPlus categories. ‘N/A’ indicates that the attribute is not applicable to the corresponding category.
At this stage, the exported federated model fully expressed its potential—combining compactness, readability, and interoperability. These qualities proved valuable not only for generating the BEM but also for consolidating an information structure suitable for future exports to other analytical or simulation platforms. The adopted strategy thus eliminated the need for manual corrections in DesignBuilder while enhancing the structural robustness of the BIM model. As a result, the model became a reusable, scalable, and easily updatable resource: any modification introduced in the native BIM environment is automatically propagated throughout all occurrences, reducing error margins and maximising the overall efficiency of the BIM-to-BEM workflow.
Finally, the smooth execution of this step confirmed the model’s adaptability. Once verified, the gbXML file served as a reliable foundation for iterative simulations, comparative design alternatives, and new analytical workflows, while preserving complete consistency and information integrity across successive exports (see Figure 8).
Figure 8.
Federated BIM in Revit and DesignBuilder.
3.3. Output and Strategic Role of the Model in the Decision-Making Process
At the end of the federation, simplification and verification process, the digital information model took on a function that goes beyond that of a traditional geometric container: it became a strategic device within the decision-making flow, capable of supporting energy analyses, comparisons between design alternatives, and technical evaluations at multiple levels.
The main output, i.e., the interoperable file exported in gbXML format, served as the single, consolidated basis for generating the BEM model. Thanks to its consistent, validated, and formally closed structure, this output could be reused across multiple simulation iterations with different retrofit scenarios without the need for rework. In this sense, the model acted as a stable information hub, capable of conveying knowledge between the various phases of the project: from surveying to feasibility studies, from simulation to decision support.
Furthermore, the quality of the exported model enabled complete traceability of changes, facilitating adaptation to emerging needs and integration with subsequent visualisation and management tools (e.g., business intelligence dashboards, interactive VAR environments, digital twins).
This condition makes the BIM model not only a starting point for energy calculation, but a true platform for interdisciplinary dialogue, accessible even to non-specialised users.
Looking ahead, this approach is shaping up to be the technical basis for a full transition to an operational DT, in which project, simulation and management information can converge in a dynamic, updatable way, ensuring continuity of information between the digital environment and the real system.
4. Case Study
4.1. Description of the Industrial Plant
The industrial plant covered by this study is located in Piedmont, in a production area characterised by prefabricated buildings with extensive floor plans, as shown in Figure 9. The architectural configuration of the building reflects the types commonly found in the automotive manufacturing sector: a single large volume, with a floor plan organised around a regular structural grid of prefabricated pillars that support both the roof and the bridge cranes, which move the moulds within the plant.
Figure 9.
Case study of the industrial plant. Aerial view from Google Earth (© 2025 Google, accessed on 30 July 2025).
The internal division of spaces reflects the functional requirements of a production plant. There are no permanent physical separations, but the distribution of areas is entrusted to horizontal signage on the ground, in line with the safety and operational flexibility requirements of the industrial sector. The system is completed by large entrance halls located at the plant’s main entrances.
One of the most significant elements from an energy perspective is the shed roof, which uniquely defines the building’s upper layout. This solution, widely used in 20th-century industrial buildings, consists of an alternating sequence of sloping pitches and vertical glazed surfaces, designed to promote natural lighting and limit the thermal load from direct radiation (Figure 10).
Figure 10.
Technical survey of the industrial plant used to support the digital modelling and energy analysis process.
Specifically, on the roof we can find three types of shed modules, distinguishable by size and glazed surface area, whose repetition determines the overall geometry of the building, the intensity and distribution of natural light and potential heat loss during the winter season.
The factory has a covered usable area of approximately 23,000 m2, with internal heights ranging from 9 to 11 metres, and a total gross volume of over 230,000 m3. The functional layout includes large central production areas, integrated with plant corridors, technical areas, offices, service rooms and warehouses, organised according to the logic of logistical efficiency and operational continuity.
From a plant engineering perspective, the building is equipped with a centralised HVAC system featuring air-handling units (AHUs) on the ground floor, connected via a network of suspended metal ducts. The electrical infrastructure includes main switchboards and main backbones located in technical rooms outside the heated area. At the same time, internal power distribution is provided by busbars fixed to the main beams, allowing for wide coverage and simplified maintenance [35].
The size and complexity of the plant make the factory a paradigmatic case study for the application of BIM-to-BEM flow in the production sector. The modular repetitiveness, combined with the regular geometry of the roof, has in fact allowed the adoption of parametric modelling strategies, significantly reducing processing times and paving the way for the analysis of future energy scenarios with high traceability and technical consistency.
4.2. Layout and Information Structure of the Model
The digital representation of the plant has been developed from the building’s actual configuration, aiming to produce a faithful yet functionally simplified replica of the existing plant. The model was created through a disciplinary federation process in Autodesk Revit 2021, starting from three main models: architectural, HVAC and electrical.
The architectural model involved the construction of the building envelope, the subdivision of the interior spaces and the definition of the opaque and transparent envelope. The production areas, which by their nature have no permanent physical subdivisions, were mapped according to functional and thermal logic, based on the location of the systems, their primary usage and their geometric characteristics. The shed units were modelled as repetitive types, parameterised to ensure consistency and speed of updates.
The HVAC model integrated the main visible plant components: air handling units (AHUs), main ducts and terminals. The representation focused on positional accuracy and consistency with thermal zoning rather than construction details. The chosen modelling families were simplified to keep the file lightweight and ensure exportability to the energy model.
Although secondary to the thermal simulation objectives, the electrical model was included to ensure a complete view of the building-plant system. The main electrical panels, busbar routes, secondary distribution points and vertical backbones were represented, all of which are relevant for future management and maintenance assessments.
The entire modelling system has been organised according to federation logic, in which each discipline maintains its internal consistency but is spatially and semantically coordinated with the others.
At the information level, the parameter structure has been arranged to support export to energy simulation environments, ensuring alignment between geometries, zones, and the physical properties of materials assigned to opaque and transparent stratigraphies, without introducing information overload while maintaining compatibility with the gbXML format.
This approach allowed us to build a structured, interoperable and technically reliable AS-IS model capable of supporting both energy simulations and future developments in the context of a DT oriented towards retrofitting and building management.
4.3. System and Thermophysical Characteristics
The plant is equipped with a centralised hot-water system that supplies the various AHUs, which heat the air using a water-air scheme shown in Figure 11, where the red lines indicate the hot water flow path from the boiler to the AHU, while the black lines represent the supply air path from the AHU to the indoor environment. The AHUs, located on the ground floor, are connected to a distribution system of metal ducts running longitudinally through the production areas.
Figure 11.
Constant Air Volume (CAV) system scheme modelled in DesignBuilder version 6.1.5 for energy simulation.
These components were modelled with attention to positional and functional consistency with respect to thermal zoning, without resorting to excessive detail that would have compromised the model’s readability. The primary objective was not to reproduce the real elements with high fidelity, but to clearly define the volumes served by the ducts, with a view to exporting them in gbXML format and subsequently importing them into the BEM energy engine.
The electrical system was also modelled based on the existing single-wire system. The general layout, the technical rooms outside the heated area, and the main busbars, which run along the load-bearing beams and distribute energy to the various production areas, were represented. Although these components do not directly affect the energy simulation, their presence contributes to an integrated view of the building-plant system, which is helpful for future management or maintenance analyses.
The thermophysical properties of the building envelope were established according to the available technical documentation and the data collected during the survey:
- The prefabricated reinforced concrete panels used for the infill walls were associated with stratigraphies with thermal transmittance values compatible with the construction characteristics of the period;
- The shed roof was modelled by distinguishing between opaque and transparent surfaces, each of which was assigned consistent thermophysical parameters;
- The ribbon windows, made of metal profiles and single glazing, were identified as one of the critical points of the building envelope in terms of winter heat loss and were correctly mapped as heat-loss surfaces.
In this phase, two versions of the thermophysical model were developed, Model 1.0 and Model 1.5, both consistent with the available technical documentation and designed to support differentiated simulation scenarios. Together, they provide a reliable representation of the main energy flows and serve distinct purposes within the analysis process. Model 1.0 adopts a much simpler architectural layout and features a flat roof. It was conceived to ensure rapid responsiveness and ease of manipulation during the experimental stages. Its streamlined structure makes it particularly suitable for assessing the impact of specific modifications, allowing the effects of individual interventions to be isolated through successive parametric simulations. Model 1.5, by contrast, incorporates a higher level of architectural detail, enabling a more accurate representation of the building’s geometry by modelling the three different types of shed modules installed on the roof. This refinement enhances both the overall volumetric definition and the correct solar orientation of transparent surfaces, aspects that directly influence the simulation of solar gains and internal thermal behaviour. The transition from Model 1.0 to Model 1.5 does not involve changes to the HVAC and electrical systems but introduces geometric and radiative improvements that are valuable in the advanced stages of validation. The difference between the two configurations is highlighted in Figure 12.
Figure 12.
Comparison between BIM Model 1.0 and Model 1.5.
Both models were calibrated against the actual methane consumption for heating, as obtained from monthly utility bills. The comparison between measured and simulated data was performed only for the heating period, i.e., from January to March and from October to December of the year 2022. A model is calibrated correctly when the deviation between simulated and real data is below 8%. Under this criterion, Model 1.0 achieved a seasonal mean difference of 4.01% in consumption, while Model 1.5 achieved a deviation of only 1.35%. The monthly difference between the simulations and the real data is shown in Figure 13.
Figure 13.
Comparison between real and simulated data.
The integration between the building envelope and the systems laid the foundation for enriching the BIM model toward BEM, ensuring alignment between the built reality and its digital replica.
5. Scenario Simulation
5.1. General Setup of Simulation Scenarios
The plant’s energy modelling aimed to compare a series of intervention scenarios, understood as alternative design configurations hypothesised from the current state, capable of improving the building’s thermal energy performance.
In this context, a scenario is defined as a coherent combination of modifications to the building envelope or systems, parameterised and simulated to assess its effectiveness with respect to several objectives: reduction in energy consumption, improvement of indoor comfort and overall sustainability of the intervention. These scenarios are not limited to the technical dimension; they also represent operational tools to support decision-making, geared towards energy efficiency and a sustainable transition.
The scenarios were constructed using an incremental and parametric approach. Each configuration was defined by modifying one or more significant parameters, while keeping the climatic conditions (via .epw files), building usage profiles and internal thermal load assumptions unchanged. This ensured comparative homogeneity between the scenarios, isolating the specific effect of each intervention while providing an operational interpretation of the results. Specifically, six distinct configurations have been developed to cover a wide range of possibilities, differentiated by level of intrusiveness, impact on existing infrastructure, and required investment. Some scenarios focus on specific elements, such as replacing windows and doors or insulating the roof; others propose integrated solutions, combining modifications to the building envelope with the introduction of an intelligent, adaptive control strategy that manages HVAC systems.
The exploration of multiple scenarios enabled the evaluation of alternative solutions to reduce energy consumption while adapting intervention strategies to available resources, technical scalability, and implementation timelines. This approach supported a comparative, replicable decision-making framework that integrated technical–energy analysis with considerations of operational and management feasibility.
5.2. Advanced Control Strategy
Incorporating a smart control strategy into the building model enhances its analytical potential across different operating conditions. In the proposed scenarios, a Reinforcement Learning (RL) [36] approach was adopted to optimise the HVAC system’s operation.
RL is a data-driven control method in which an agent interacts with the environment by selecting control actions and learns over time the optimal strategy, or policy, that maximises a defined reward function. In this study, the reward function was designed to evaluate each control decision according to its impact on energy performance, thermal comfort, and system stability. The algorithm rewards actions that keep indoor temperatures close to the desired setpoints while reducing unnecessary energy use or abrupt fluctuations. Through repeated interactions with the simulated environment, the agent gradually learns to operate the HVAC system more adaptively and efficiently. The control variable in this case is the supply air temperature, that is, the degree to which the air can be heated by the coil in the plant’s AHU. The action space was defined as a set of 8 discrete temperature adjustments, ranging from 0 °C to +5 °C, representing incremental heating steps available to the control agent. The control strategy was implemented using a Double Deep Q-Network algorithm [37], a reinforcement learning technique that improves decision accuracy and stability during the training process.
The agent was trained offline, meaning the optimal control policy was derived from pre-collected operational data generated through the BEM simulations. During the testing phase, however, the trained agent interacted directly with the simulated environment, which replicated the behaviour of the actual building, allowing performance to be evaluated under realistic operating conditions. This was enabled by the OpenAI Gym tool (v. 0.26.2) [38] (Gym, s.d.).
5.3. Layout Description of the Six Simulated Scenarios
The energy simulation process was divided into six distinct design scenarios, each representing a structured variation in the model, aimed at evaluating the effectiveness of specific intervention strategies on the building envelope and/or plant systems. The six identified scenarios are:
- Scenario 1: the advanced HVAC control strategy applied to version 1.0 of the model, with the aim of testing the responsiveness of the model in the presence of adaptive control logic. The simulation enabled evaluation of the optimisation algorithm’s effectiveness in modulating internal setpoints in response to thermal loads and the building envelope’s dynamic behaviour.
- Scenario 2: an advanced control strategy was coupled with a window and door retrofit in Model 1.5, involving the replacement of the existing single-glazed units with high-performance components. In particular, the new fixtures feature a thermal transmittance of 1.1 W/m2K, in line with current regulatory requirements. This solution reduced transmission losses and, when integrated with active system management, significantly improved both requirements and the stability of internal comfort.
- Scenario 3: advanced control in model 1.5 was coupled with the improvement of the stratigraphy of the prefabricated infill panels in the vertical walls, by introducing low-conductivity insulating materials. The new configuration consists of a ventilated façade system, incorporating an external insulation layer and an air cavity, resulting in a thermal transmittance of approximately 0.12 W/m2K. The objective of this intervention was to assess reductions in winter heating loads and evaluate the system’s ability to maintain thermal stability when paired with active control.
- Scenario 4: in Model 1.5, the advanced control strategy was combined with an intervention on the shed roof (see Figure 14a), involving both the addition of insulating layers on the sloping pitches and the rationalisation of glazed surfaces. In Figure 14a, the different colours identify distinct groups of sheds. For the flat portions of the roof, a pendent system was applied to ensure proper rainwater drainage, achieving a thermal transmittance of approximately 0.17 W/m2K. For the inclined shed elements, the chosen configuration included installing an insulation layer over a corrugated metal sheet with aluminium protection, resulting in a thermal transmittance of about 0.15 W/m2K. This scenario enabled the simulation of variations in solar gains and thermal losses through the upper envelope, an especially critical component in industrial buildings, as illustrated in Figure 14b, where two different insulation solutions are shown according to the roof surface type.
- Scenario 5: a rooftop photovoltaic system was simulated in Model 1.0, by modelling the integration between electricity production and the building’s needs. Self-consumption flows and the reduction in grid consumption were evaluated without modifying the building envelope or HVAC systems.
- Scenario 6: simulation of a relamping intervention in Model 1.0, replacing the entire lighting system with high-efficiency LED fixtures. The aim was to reduce internal loads and observe any interactions with air conditioning requirements, even indirectly.
Figure 14.
Examples of energy retrofit actions in the plant: (a) window type identification based on shed configuration; (b) selection of insulating material according to roof installation specifications.
Overall, the six scenarios address a wide range of strategies, from active plant management to passive interventions, from renewable generation to load reduction, providing a solid basis for energy comparisons and for defining scalable, replicable strategies in an industrial context.
5.4. Simulation Settings
All simulations were conducted in DesignBuilder v.6.1.5, using EnergyPlus v.8.9 as the calculation engine. The energy model, exported from the verified BIM model in gbXML format, was used as the basis for annual standardised simulations to ensure analytical consistency and robust comparisons.
The climatic conditions for the simulations were defined using an .epw file representative of the industrial plant’s location. While pre-existing .epw weather files are typically available for many locations [39], in this case, a customised file was required because none was available for the city of interest, namely San Benigno Canavese (Torino, Italy). To this end, hourly meteorological data for the year 2022, including air temperature, dew point temperature, relative humidity, rainfall, snow depth, surface pressure, wind speed, wind direction, Global Horizontal Irradiance, Diffuse Horizontal Irradiance, and Direct Normal Irradiance, were retrieved from [40] and used to construct the corresponding weather file, the name of which remains confidential. This ensured homogeneity between the simulated configurations and significance in relation to the compared values [41].
Employment profiles and internal workloads were also kept constant across scenarios to allow comparison of results. The profiles were constructed based on the plant’s actual production shifts, accounting for continuous presence during daytime shifts and limited activity during night-time shifts. This methodological choice enabled the isolation of the actual impact of the simulated design changes, preventing external factors from introducing distortions.
As regards thermal setpoints, the heating system configuration provided for a reference temperature of 19 °C during regular operation, with attenuation temperatures set at 15 °C during periods of lower activity, as depicted in Figure 15. These values were set to match the actual settings of the existing system and remained the same across all simulated scenarios to ensure the comparability of the results and the rigour of the comparative analysis.
Figure 15.
Daily profile of system startup schedule and variation in thermal setpoint temperatures in the industrial plant. The dashed lines separate the heating season from the cooling season.
The simulations were conducted on an annual basis, but the analysis focused exclusively on the winter heating season, since the plant is not equipped with cooling systems or active mechanical ventilation. Unheated periods were therefore not considered for energy assessment purposes. The calculation was performed with 15 min timesteps, using a dynamic, iterative algorithm that enabled continuous evaluation of the interactions among the building envelope, external environmental conditions, and plant performance.
The outputs selected for scenario comparison included, in particular, monthly heating demand and the operative temperature extracted at a sub-hourly timestep (15 min) for each heated zone. These indicators enabled both quantitative and qualitative readings of the building’s behaviour in response to the simulated design interventions.
Thanks to the accurate definition of these settings, it was possible to construct a stable and consistent simulation matrix, in which each scenario was analysed using consistent, traceable criteria.
6. Critical Analysis of Results and Operational Implications
6.1. Energy Performance Assessment
The energy performance analysis highlighted significant differences between the six simulated scenarios, confirming the effectiveness of the intervention strategies applied to both the building envelope and the plant systems. The comparison was based on heating requirements, calculated in kWh/month for the entire heating season, while keeping the load profiles, setpoints, climatic conditions, and all operating assumptions consistent.
Scenario 1, which implemented advanced control in Model 1.0, demonstrated a consistent 41% reduction in energy demand (see Table 3 and Figure 16), driven by more efficient setpoint management and improved adaptability to variable loads. These energy savings were achieved without altering the building envelope’s physical characteristics, highlighting the positive impact of an intelligent management approach. The total annual consumption drops to 4.541 MWh in Scenario 1, with reductions occurring systematically across the entire heating season. Monthly values confirm this trend: where the calibrated model records winter-month consumptions of 2.135 MWh, 1.508 MWh, and 984 kWh, Scenario 1 lowers them to 1.563 MWh, 1.074 MWh, and 599 kWh, reflecting proportional savings of 26% to 39%. Even in milder transitional months, the optimisation produces offsets exceeding 60%, as seen in the drop from 194 kWh to 34 kWh, highlighting how the improved algorithm prevents unnecessary system operation during low-load conditions.
Table 3.
Results of Scenario 1 simulation.
Figure 16.
Real data, validated model and Scenario 1 comparison.
It is important to note, however, that the results are influenced by the simplifications inherent in Model 1.0. Although the model was calibrated to the actual building (with a 4% offset) and provides a reasonable level of accuracy, these simplifications mean that the results should be interpreted as indicative of strategic trends rather than precise predictions. This does not diminish the value of the study but instead underscores the importance of using the model as a dynamic decision-making tool that can be refined over time with progressively more real-world data, potentially sourced from monitoring systems.
Scenario 2 combines advanced control with window refurbishment in Model 1.5. The results, shown in Table 4, are first presented for the structural refurbishment alone, followed by an assessment of the additional impact of the advanced control on the updated model. The window intervention alone produced a noticeable reduction in heating demand, approximately 7%, particularly during the warmer months of the heating season (April and October), where reductions reach 11.9% and 56.2%, respectively, due to reduced heat losses through transparent surfaces, as illustrated in Figure 17. With the introduction of the advanced control strategy, methane consumption can be reduced by nearly 28% compared to the refurbished version of Model 1.5, highlighting the combined effect of envelope improvements and optimised control. Monthly data show that the most significant savings occur in March, November, and December, with reductions of 31.9%, 27.6%, and 28.9%, respectively.
Table 4.
Results of Scenario 2 simulation.
Figure 17.
Real data, validated model and Scenario 2 comparison.
Similarly, Scenario 3, which focused on vertical wall insulation and advanced control, showed a reduction in consumption, with particular effectiveness during the months with the greatest temperature range, as depicted in Table 5 and Figure 18.
Table 5.
Results of Scenario 3 simulation.
Figure 18.
Real data, validated model and Scenario 3 comparison.
In this case, the offset related to the structural retrofit stands around 3%. This offset remains consistently low across high-demand months, generally between 1.51% and 3.60%. The crucial finding is that the structural retrofit focused solely on the opaque walls contributes only 2.92% to the total energy savings potential. In contrast, the final Scenario 3 (walls + control) achieves a substantial 32.80% reduction in total. This disparity strongly indicates that the glazed surfaces represent the dominant thermal weakness. The relatively minor 2.92% impact of insulating the opaque surfaces, contrasted with the significant remaining potential for savings, justifies the conclusion that the influence of the glazed surface is greater than that of the vertical opaque surfaces.
Scenario 4, addressing the insulation of the shed roof, confirmed the strategic importance of the upper envelope. The presence of large sloped and glazed surfaces results in significant heat loss; therefore, improving their thermal performance reduced energy consumption by 21%. This intervention effectively limited dispersions and produced a clear impact on the monthly consumption profile, as shown in Figure 19. Monthly data show that roof insulation is particularly effective during high-consumption periods, likely summer and winter extremes. For instance, as indicated in Table 6, the Roof offset reaches its peak impact in November at 27.32% (reducing consumption from 979 MWh to 711 MWh and is similarly high in December at 22.02% (reducing consumption from 2135 MWh to 1665 MWh and January at 21.62% (from 2258 MWh to 1770 MWh).
Figure 19.
Real data, validated model and Scenario 4 comparison.
Table 6.
Results of Scenario 4 simulation.
Scenario 5, which involved installing a photovoltaic (PV) system, did not affect heating demand but influenced the overall energy balance by improving on-site electricity production and reducing net demand from external sources. This scenario was developed in response to the steady increase in the building’s electrical consumption observed over recent years. The sloped shed roof modules, with a 30° inclination and south-facing orientation, were leveraged to optimise solar capture, and the potential electricity production was estimated using PVGIS software (v. 5.2) [42]. The analysis led to the hypothetical installation of 4271 PV panels, resulting in an estimated annual electricity generation of approximately 2.5 GWh. Considering that the plant’s electrical consumption in 2022 was about 14.3 GWh, the proposed PV system would cover roughly 17% of the annual demand.
Finally, Scenario 6, which focused on relamping, primarily affected the electrical loads, with minor secondary effects on the thermal balance but clear benefits for overall system efficiency. By replacing 264 lighting fixtures with new, more efficient technologies such as LEDs, the installed lighting power would be reduced by approximately 40%. This intervention would result in energy savings exceeding 300 MWh per year, assuming continuous 24 h operation, while also improving light distribution and visual comfort within the spaces.
These data confirm the central role of a combined strategy, in which envelope quality and smart management capabilities work in synergy to optimise building energy performance.
6.2. Comparative Analysis
The comparison of the six simulated scenarios led to a systematic assessment of the impact of the various intervention strategies on the plant. The comparison was carried out while keeping all operating and climatic conditions constant to isolate the specific effect of each design change relative to the reference scenario.
In terms of reducing heating requirements, the scenarios that combined advanced control with passive interventions on the building envelope achieved the most significant results. Scenario 3, which involved insulating vertical walls alongside the implementation of the smart controller, showed a substantial reduction in energy consumption (see Figure 18, confirming the critical role of transmission losses in the original prefabricated panels. Although Scenario 1 reported the highest level of savings (Figure 15), its results are less reliable because Model 1.0, on which the scenario is based, has lower accuracy. The insulation of the shed roof, presented in Scenario 4, also produced tangible benefits, particularly during the mid-season months of the heating period.
The results highlight how the quality of the building envelope and the responsiveness of the control system act synergistically in determining both thermal performance and indoor environmental comfort. Scenarios 5 and 6, involving indirect plant interventions, such as the installation of photovoltaic systems and relamping, although not directly influencing the heat balance, contributed to lowering overall electrical loads and improving the self-consumption profile, with positive implications for sustainability and decarbonization.
This analysis indicates that no single measure alone can achieve a radical transformation of the building’s energy performance. The greatest potential emerges instead from the progressive integration of multiple strategies, balancing cost, invasiveness, and performance return.
This comparative phase, therefore, represents not only an ex-post interpretation of the results but also a decision-support tool for planning interventions and managing operations in coordination with plant production. It can guide the definition of priorities, the selection of technologies, and the development of progressive and realistic operational roadmaps.
6.3. Indoor Comfort
The analysis of thermal comfort was based exclusively on the Predicted Percentage of Dissatisfied (PPD) index, computed for all scenarios directly influencing indoor thermal conditions. According to ISO 7730 [43], PPD values below 10% are considered acceptable for most environments. In the baseline configuration with optimised control (i.e., Scenario 1.0), the system already achieves a mean PPD of 6%, indicating that advanced HVAC regulation substantially improves thermal stability compared with a purely static control logic.
Across all subsequent scenarios involving either control optimisation or envelope refurbishment, the PPD index remains consistently within the 6–8.4% range, confirming that every intervention maintains comfort within acceptable ISO thresholds. The scenarios that combine optimised control with envelope upgrades deliver the most balanced performance. Windows replacement (Scenario 2) achieves a PPD of 8%, while wall insulation (Scenario 3) slightly increases it to 8.4% due to local variations in thermal transients. The intervention on the shed roof (Scenario 4) results in the lowest PPD value (6.4%), demonstrating the significant contribution of improved upper-envelope insulation in reducing vertical temperature gradients and mitigating cold-draft effects.
These results confirm that envelope-related measures, when paired with advanced control strategies, enhance thermal uniformity more effectively than control logic alone. Although the obtained PPD values remain higher than those typically targeted in residential or office buildings, they fall fully within the expected and acceptable range for industrial environments, where large volumes, intermittent occupancy, and process-related internal loads inherently limit tighter comfort targets. It is important to note that PPD was not evaluated for Scenarios 5, regarding the PV system installation, and Scenario 6, regarding the relamping, as these interventions do not modify the building’s thermal behaviour in a way that would meaningfully affect occupants’ thermal perception. Their influence is primarily energetic rather than comfort-related, and thus outside the scope of PPD assessment. Overall, the comfort analysis confirms that integrated solutions, combining optimised HVAC control with targeted envelope improvements, provide the most relevant reductions in thermal dissatisfaction, ensuring stable and acceptable indoor conditions without compromising industrial operational needs.
6.4. Interactive Dashboard for Energy Scenarios
In parallel with the numerical analyses and simulations, another important result of the study was the development of an interactive summary dashboard. This tool was designed to rework the simulation outputs into tabular and graphical formats, making the main performance indicators easily accessible and interpretable. Its purpose is to enable rapid comparisons between scenarios and to support a decision-making-oriented understanding of the results.
The dashboard integrates data from all simulated scenarios, with particular attention to monthly heating requirements and average operating temperatures by zone, identified as the most representative indicators during the performance evaluation phase. The data were reorganised in .xlsx format and structured for direct import into dynamic visualisation environments. A snippet from the dashboard is shown in Figure 20.
Figure 20.
Interactive dashboard comparing different energy simulation scenarios.
The representation logic was conceived to facilitate comparison: values are displayed in chronological order, with automatic highlighting of differences between scenarios and filtering options by scenario, month, or zone. The goal is not to display single results in isolation but to create a transparent interface between simulation data and project decisions, effectively translating numerical outputs into operational insights.
From a communication standpoint, the dashboard serves as a synthesis of the BIM-to-BEM workflow, visually conveying the impact of each design hypothesis while maintaining coherence with the original information model. In this sense, the export process is not a secondary task but a true interpretative extension of the model—valuable for management, planning, and interdisciplinary discussion.
The ability to intuitively access complex data and compare the energy impact of different simulated configurations in real time represents one of the most significant achievements in terms of the model’s practical applicability. The dashboard, therefore, acts as a mediation tool between technical simulation and decision-making, offering a clear, dynamic, and scalable foundation for the strategic evaluation of interventions.
6.5. Results Interpretation and Implementation Considerations
The results obtained from the simulation of the six scenarios confirmed the effectiveness of integrated strategies combining interventions on the building envelope with advanced management of plant systems in the context of an existing industrial building. However, the analysis cannot be limited to a numerical comparison of energy savings; it requires a broader reflection on operating conditions, design constraints, and the practical implications of implementing the simulated measures.
One of the first aspects that emerged concerns the technical scalability of the proposed scenarios. Interventions such as relamping or the introduction of advanced control systems are relatively easy to implement because they do not require significant modifications within the models. In contrast, more invasive actions, particularly those involving the building envelope, can deliver greater energy savings but raise critical issues related to accessibility, execution time, and interference with ongoing operations. Therefore, the evaluation must consider not only the direct energy benefits but also operational feasibility, economic sustainability, and compatibility with production cycles.
A second key aspect relates to the consistency between simulation and operational reality, which depends on the level of detail in the two model versions. Using a simplified model (i.e., Model 1.0) inevitably leads to lower accuracy; however, this does not diminish the value of the analysis. On the contrary, it underscores the importance of viewing the model as a dynamic decision-making tool, capable of being continuously refined through progressive integration of real monitoring data.
The assessment also highlighted that maximum effectiveness is achieved not through isolated actions but through integrated configurations, in which envelope improvements are complemented by active and optimised system management. The combinatorial logic underlying the simulated scenarios revealed that the interaction of multiple measures can produce non-linear outcomes, sometimes exceeding the sum of individual effects. This finding reinforces the need for interdependent and interdisciplinary design approaches, capable of addressing the building–system complexity with a systemic perspective.
Looking ahead, the adoption of dynamic simulation tools linked to digital information models paves the way for an evolutionary approach to building management, where intervention planning is integrated with predictive control and real-time optimisation. The operational implications of this work, therefore, extend beyond a single simulation exercise, outlining a replicable and adaptable methodology that supports more informed, transparent, and scalable decision-making processes.
6.6. Replicability and Scalability
The approach tested in the industrial plant case study demonstrates a high degree of technical replicability, thanks to the construction of a methodological flow based on interoperable tools, readable information models and a parametric energy simulation strategy. The process of exporting from the BIM model to gbXML format, subsequent import into DesignBuilder and controlled management of simulation scenarios represents a repeatable chain of operations, based on clearly documentable steps that can be transferred to other building contexts. This replicability is reinforced by the fact that the energy model was built from the actual configuration of the building with an intermediate level of detail, sufficiently informative to return the geometry, zoning and thermo-physical characteristics of the building, but also light enough to be managed without excessive computational loads. The decision not to introduce excessive customisation in the setpoints or operating profiles has made it possible to maintain standardisable starting conditions, which make the entire process suitable for application in other production plants with similar configurations.
In terms of scalability, the scenario structure allows for a modular and progressive interpretation of the interventions, in which each element (insulation, control, relamping, photovoltaics) can be activated or combined according to the retrofit strategy. In this sense, the method is scalable both technically, as it can be adapted to more complex or simpler models, and operationally, as it can accompany phased planning processes with incremental investment logic.
The ability to export outputs to dashboards is also a key element of management scalability: the same information structure can be used for monitoring, communication with decision-makers and continuous updating of the model over time. This condition foreshadows a natural transition towards a DT, understood not as a high-fidelity replica, but as a dynamic interoperable model that evolves with the building and accompanies its transformation strategies.
7. Conclusions
The study showed how the integration of information modelling and dynamic energy simulation can be applied in an operational and traceable manner even in complex industrial contexts. Through an approach based on six intervention scenarios, it was possible to analyse and compare different design strategies with the aim of improving the energy performance of the existing building.
The results of the simulations showed a progressive reduction in thermal requirements when interventions were made to the building envelope and HVAC systems were optimised. The best-performing configurations were those in which passive and active measures worked in synergy, confirming the need for integrated approaches to efficiency in the production sector.
The entire process made it possible to build a solid comparative matrix capable of supporting the decision-making process, not considering energy performance only, but also feasibility, scalability and the degree of interference with the plant’s operating cycle.
7.1. Methodological Limitations
The methodology enabled a clear analysis of the different intervention strategies. However, it is necessary to highlight some limitations that must be considered when critically interpreting the results. The first constraint concerns the simplification of the energy model, derived from a BIM at an intermediate level of detail, i.e., Model 1.0. Although this choice ensured short processing times and good manoeuvrability in the iterative phases, it led to a reduction in geometric fidelity compared to more refined configurations, such as that represented in Model 1.5. In particular, the simplified representation of inclined surfaces and solar gains linked to the orientation of the shed modules may have limited the accuracy of the estimate of winter loads linked to radiation. The same can be said about the uncertainties about the structural material properties, which were retrieved during the on-site survey, but were not recalled from official documentation.
A second limitation is related to the consistency of occupancy profiles, setpoints and operating conditions in all scenarios. This choice was made to ensure comparative homogeneity between the simulated configurations and to isolate the impact of individual design variables. However, it excluded the possibility of simulating more complex usage dynamics or adaptive scenarios based on the variability of actual energy demand. Another relevant constraint arises from the use of a single climatic dataset for all simulations. While this ensured comparability among scenarios, it did not account for interannual weather variability or potential future climatic changes, which could influence overall energy performance. Similarly, the analysis focused solely on the heating season, deliberately omitting the simulation of summer behaviour; therefore, the cooling operating mode was not simulated, as it was not relevant to the plant system currently in use. This allowed the analysis to be focused but also reduced the breadth of the simulation spectrum. Moreover, the study did not include the energy contribution of the industrial production process. This simplification, intentionally adopted to focus on building–system interactions, narrows the scope of the analysis when considering the complete energy balance of the facility. Another aspect to consider is that, despite starting from a consistent BIM model, the process of exporting to gbXML and subsequent manipulation in DesignBuilder required some adjustments, which may have generated minor discrepancies between the original information representation and the actual simulation. Although checked and validated, these operations highlight the need for even more stable interoperability tools for transfer between BIM and BEM environments. Finally, it should be noted that the energy model was not calibrated on actual monitoring data but was constructed on the basis of actual monthly consumption, declared parameters and technical documentation. This does not compromise the comparative validity of the scenarios, but it does limit the absolute predictive accuracy of the results, which may need to be integrated in the future through measurement campaigns or operational monitoring systems. However, beyond the methodological consistency of the workflow, it is necessary to highlight a cross-cutting critical issue concerning the effective operational implementation of the BIM-to-BEM process.
The theoretical replicability of the procedures does not automatically translate into ease of adoption in the real world: the preparation of the entire digital infrastructure, from the construction of the information model to the processing of simulation results, requires the availability of interoperable tools, access to reliable data, and above all, the structured coordination of multidisciplinary skills. The complete automation of the process, understood as a continuous and transparent chain of digital steps from BIM modelling to energy export, dynamic simulation, and the return of results, is not yet a consolidated system, but rather a trajectory in development. Some phases can already be made more efficient through parametric and interoperable tools, but the overall effectiveness of the workflow still depends largely on the active intervention of technical experts capable of managing transitions between the information, simulation, and management environments. In this sense, the main limitation lies not so much in technological constraints as in the organisational and systemic complexity of the process. For a BIM-to-BEM flow to become truly operational, it is necessary to address an initial phase characterised by high design and interdisciplinary inertia, which involves the coordinated activation of different professional skills, architectural, plant engineering, energy, and IT, capable of communicating and converging towards shared objectives. Recognising this limitation does not diminish the value of the proposed method, but instead emphasises its advanced and strategic nature, reiterating that the success of an integrated simulation process does not depend solely on the availability of digital tools, but on the ability to build a shared operating culture based on interoperability, transparency and collaboration.
7.2. Connection with Operational Digital Twin
The work can be seen as a technical and methodological prerequisite for the construction of an operational energy DT. In particular, the proposed BIM-to-BEM workflow can be interpreted as a key intermediate step within a broader BIM-to-BEM-to-DT pipeline. The structuring of the BIM model, its informed simplification, interoperability with BEM tools and the reorganisation of simulated data in visual form are all elements consistent with the architecture of an advanced digital system, not only capable of simulating, but also of representing, monitoring and optimising the building in real time.
The transition from static simulation to DT will require the integration of sensor and actuator systems, for example, via Internet-of-Things (also known as IoT) technologies and ecosystems, connection to real data and the definition of updatable predictive models. Within this perspective, the BIM-to-BEM framework serves as the digital backbone on which an energy-operational DT can be progressively built, once the appropriate sensing and control layers are deployed. Notably, the method already demonstrates a shift toward operationality, transforming digital information from a static representation into a decision-support mechanism. In this sense, the DT becomes not merely an aspirational future development but a concrete, attainable evolution of the current workflow, capable of delivering tangible benefits in terms of efficiency, sustainability and strategic management.
7.3. Future Perspectives
While the results obtained are significant, the methodological development remains open and evolving. Future work will concentrate, on the one hand, on strengthening the model’s information richness, both geometrically and dynamically, through the integration of real monitoring data and the refinement of system parameters. On the other hand, the process will be extended towards higher levels of automation, reducing manual intervention and improving the consistency of data exchanges between BIM environments and simulation platforms. In parallel, the growing availability of dashboarding and real-time visualisation environments offers the opportunity to build dynamic interfaces that support continuous operational decision-making rather than isolated, one-off simulations. These developments will not only enhance the robustness of the BIM-to-BEM workflow but will also move the system closer to its intended trajectory: the realisation of a fully operational Digital Twin.
Author Contributions
Conceptualization, M.D.G.; methodology, A.J.D.; software, M.A.L., P.R.M. and L.B.; validation, A.J.D., M.A.L., P.R.M. and L.B.; formal analysis, M.A.L.; investigation, M.D.G.; resources, E.P.; data curation, A.J.D.; writing—original draft preparation, M.D.G. and A.J.D.; writing—review and editing, M.D.G., M.A.L., L.B. and E.P.; visualization, M.D.G. and A.J.D.; supervision, A.O.; project administration, A.O.; funding acquisition, A.O. All authors have read and agreed to the published version of the manuscript.
Funding
This research is part of the Manage 5.0 (Manufacturing Automotive Green Evolution 5.0) project, funded by the Ministero per lo Sviluppo Economico (MISE)—F/310302/01-05/X56 under the National Recovery and Resilience Plan (PNRR).
Institutional Review Board Statement
Not applicable.
Informed Consent Statement
Not applicable.
Data Availability Statement
The original contributions presented in this study are included in the article. Further inquiries can be directed to the corresponding author.
Conflicts of Interest
The authors declare no conflict of interest.
References
- International Energy Agency (IEA). International Energy Agency (IEA) Buildings—Tracking Report 2023; International Energy Agency (IEA): Paris, France, 2023.
- United Nations. Transforming Our World: The 2030 Agenda for Sustainable Development; United Nations: New York, NY, USA, 2015.
- European Commission. A Renovation Wave for Europe—Greening Our Buildings, Creating Jobs, Improving Lives; European Commission: Brussels, Belgium, 2020.
- Council of the European Union. Fit for 55: The EU’s Plan for a Green Transition; Council of the European Union: Brussels, Belgium, 2021.
- International Energy Agency (IEA). World Energy Outlook 2022; International Energy Agency (IEA): Paris, France, 2022.
- United Nations Environment Programme (UNEP). 2022 Global Status Report for Buildings and Construction: Towards a Zero-Emission, Efficient and Resilient Buildings and Construction Sector; United Nations Environment Programme (UNEP): Nairobi, Kenya, 2022.
- Breque, M.; De Nul, L.; Petridis, A. Industry 5.0: Towards a Sustainable, Human-Centric and Resilient European Industry; European Commission, Directorate-General for Research and Innovation: Brussels, Belgium, 2021.
- European Commission. The New European Bauhaus: Beautiful, Sustainable, Together; European Commission: Brussels, Belgium, 2021.
- Jahangir, F.; Boje, C.; Rezgui, Y.; Davarzani, H. A Systematic Review on Challenges to Digital Twin Adoption in the Construction and Built Environment Industry. J. Inf. Technol. Constr. (ITcon) 2024, 29, 164–188. [Google Scholar]
- Madubuike, O.C.; Anumba, C.J.; Khallaf, R. A Review of Digital Twin Applications in Construction. J. Inf. Technol. Constr. (ITcon) 2022, 27, 145–172. [Google Scholar] [CrossRef] [Scilit]
- Gourlis, G.; Kovacic, I. A Holistic Digital Twin Simulation Framework for Industrial Facilities: BIM-Based Data Acquisition for Building Energy Modelling. Front. Built Environ. 2022, 8, 918821. [Google Scholar] [CrossRef] [Scilit]
- Mousavi, Y.; Gharineiat, Z.; Karimi, A.A.; McDougall, K.; Rossi, A.; Gonizzi Barsanti, S. Digital Twin Technology in Built Environment: A Review of Applications, Capabilities and Challenges. Smart Cities 2024, 7, 2594–2615. [Google Scholar] [CrossRef] [Scilit]
- Saad, M.M.; Eicker, U. Investigating the Reliability of Building Energy Models: Comparative Analysis of the Impact of Data Pipelines and Model Complexities. J. Build. Eng. 2023, 71, 106511. [Google Scholar] [CrossRef] [Scilit]
- Boje, C.; Hahn Menacho, Á.J.; Marvuglia, A.; Benetto, E.; Kubicki, S.; Schaubroeck, T.; Navarrete Gutiérrez, T. A Framework Using BIM and Digital Twins in Facilitating LCSA for Buildings. J. Build. Eng. 2023, 76, 107232. [Google Scholar] [CrossRef] [Scilit]
- Bastos Porsani, G.; Del Valle De Lersundi, K.; Sánchez-Ostiz Gutiérrez, A.; Fernández Bandera, C. Interoperability between Building Information Modelling (BIM) and Building Energy Model (BEM). Appl. Sci. 2021, 11, 2167. [Google Scholar] [CrossRef] [Scilit]
- Del Giudice, M.; Dettori, M.; Magnano, S.; Osello, A. A BIM to BEM Approach for Data Exchange: Advantages and Weaknesses for Industrial Buildings Energy Assessment. In ECPPM 2021—eWork and eBusiness in Architecture, Engineering and Construction; CRC Press: London, UK, 2021; pp. 98–105. ISBN 978-1-003-19147-6. [Google Scholar]
- Delgado, J.M.P.Q.; Guimarães, A.S.; Poças Martins, J.; Parracho, D.F.R.; Freitas, S.S.; Lima, A.G.B.; Rodrigues, L. BIM and BEM Interoperability–Evaluation of a Case Study in Modular Wooden Housing. Energies 2023, 16, 1579. [Google Scholar] [CrossRef] [Scilit]
- Massafra, A.; Predari, G.; Gulli, R. Towards Digital Twin Driven Cultural Heritage Management: A Hbim-Based Workflow forEnergy Improvement of Modern Buildings. Int. Arch. Photogramm. Remote Sens. Spat. Inf. Sci. 2022, XLVI-5/W1-2022, 149–157. [Google Scholar] [CrossRef] [Scilit]
- Průša, D.; Šťastník, S.; Šuhajda, K.; Psota, J.; Svobodová, K.; Sochorová, Z.; Vala, J. From BIM to BEM—Modern Thermal Simulations Using a Building Information Management Model: A Case Study. Appl. Sci. 2025, 15, 2878. [Google Scholar] [CrossRef] [Scilit]
- Ciccozzi, A.; Santavicca, A.; De Rubeis, T.; Ambrosini, D. BIM-BEM Interoperability for Energy Analysis: A Comparative Study of Different Strategies. Energy Rep. 2025, 13, 4705–4718. [Google Scholar] [CrossRef] [Scilit]
- Massafra, A.; Jabi, W.; Gulli, R. Topological BIM for Building Performance Management. Autom. Constr. 2024, 166, 105628. [Google Scholar] [CrossRef] [Scilit]
- Guo, H.; Chen, Z.; Chen, X.; Yang, J.; Song, C.; Chen, Y. UAV-BIM-BEM: An Automatic Unmanned Aerial Vehicles-Based Building Energy Model Generation Platform. Energy Build. 2025, 328, 115120. [Google Scholar] [CrossRef] [Scilit]
- Abdelalim, A.; O’Brien, W.; Shi, Z. Data Visualisation and Analysis of Energy Flow on a Multi-Zone Building Scale. Autom. Constr. 2017, 84, 258–273. [Google Scholar] [CrossRef] [Scilit]
- Apellániz, D.; Alkewitz, T.; Gengnagel, C. Visualisation of Building Life Cycle Assessment Results Using 3D Business Intelligence Dashboards. Int. J. Life Cycle Assess. 2024, 29, 1303–1314. [Google Scholar] [CrossRef] [Scilit]
- Khan, H.R.; Kazmi, M.; Lubaba; Khalid, M.H.B.; Alam, U.; Arshad, K.; Assaleh, K.; Qazi, S.A. A Low-Cost Energy Monitoring System with Universal Compatibility and Real-Time Visualisation for Enhanced Accessibility and Power Savings. Sustainability 2024, 16, 4137. [Google Scholar] [CrossRef] [Scilit]
- An, N.; Li, X.; Yang, H.; Pang, X.; Gao, G.; Ding, D. From Building Information Modelling to Building Energy Modelling: Optimisation Study for Efficient Transformation. Buildings 2024, 14, 2444. [Google Scholar] [CrossRef] [Scilit]
- Yang, Y.; Pan, Y.; Zeng, F.; Lin, Z.; Li, C. A gbXML Reconstruction Workflow and Tool Development to Improve the Geometric Interoperability between BIM and BEM. Buildings 2022, 12, 221. [Google Scholar] [CrossRef] [Scilit]
- González, J.; Soares, C.; Najjar, M.; Haddad, A. BIM and BEM Methodologies Integration in Energy-Efficient Buildings Using Experimental Design. Buildings 2021, 11, 491. [Google Scholar] [CrossRef] [Scilit]
- Barone, G.; Buonomano, A.; Forzano, C.; Giuzio, G.F.; Palombo, A. Improving the Efficiency of Maritime Infrastructures through a BIM-Based Building Energy Modelling Approach: A Case Study in Naples, Italy. Energies 2021, 14, 4854. [Google Scholar] [CrossRef] [Scilit]
- Nagy, G.; Ashraf, F. HBIM Platform & Smart Sensing as a Tool for Monitoring and Visualising Energy Performance of Heritage Buildings. Dev. Built Environ. 2021, 8, 100056. [Google Scholar] [CrossRef] [Scilit]
- Desogus, G.; Quaquero, E.; Rubiu, G.; Gatto, G.; Perra, C. BIM and IoT Sensors Integration: A Framework for Consumption and Indoor Conditions Data Monitoring of Existing Buildings. Sustainability 2021, 13, 4496. [Google Scholar] [CrossRef] [Scilit]
- Fenz, S.; Giannakis, G.; Bergmayr, J.; Iousef, S. RenoDSS—A BIM-Based Building Renovation Decision Support System. Energy Build. 2023, 288, 112999. [Google Scholar] [CrossRef] [Scilit]
- Del Giudice, M.; Osello, A.; Donato, A.J.; Fratto, A. Verso La Neutralità Climatica. Il Ruolo Chiave Del Digital Twin Nell’Industria 5.0. Agathón—Int. J. Archit. Art Des. 2024, 15, 276–285. [Google Scholar] [CrossRef]
- UNI 11337-4:2017; Gestione Digitale Dei Processi Informativi Delle Costruzioni—Parte 4: Evoluzione e Sviluppo Informativo Di Modelli, Elaborati e Oggetti. UNI—Ente Italiano di Normazione: Milan, Italy, 2017.
- Di Leo, P.; Del Giudice, M.; Fratto, A.; Osello, A. BIM and Digital Twin for Electrical Systems: A Case Study of an Industrial Building. In Proceedings of the 2024 IEEE International Conference on Industrial Technology (ICIT), Bristol, UK, 25–27 May 2024; pp. 1–6. [Google Scholar]
- Al Sayed, K.; Boodi, A.; Sadeghian Broujeny, R.; Beddiar, K. Reinforcement Learning for HVAC Control in Intelligent Buildings: A Technical and Conceptual Review. J. Build. Eng. 2024, 95, 110085. [Google Scholar] [CrossRef] [Scilit]
- AlMahamid, F.; Grolinger, K. Reinforcement Learning Algorithms: An Overview and Classification. In Proceedings of the 2021 IEEE Canadian Conference on Electrical and Computer Engineering (CCECE), Waterloo, ON, Canada, 12 September 2021; pp. 1–7. [Google Scholar]
- Brockman, G.; Cheung, V.; Pettersson, L.; Schneider, J.; Schulman, J.; Tang, J.; Zaremba, W. OpenAI Gym. arXiv 2016, arXiv:1606.01540. [Google Scholar] [CrossRef] [Scilit]
- EnergyPlus Website. Available online: https://energyplus.net/ (accessed on 25 June 2025).
- Zippenfenig, P. Weather API. 2024. Available online: https://open-meteo.com/ (accessed on 25 June 2025).
- Moradi, A.; Kavgic, M.; Costanzo, V.; Evola, G. Impact of Typical and Actual Weather Years on the Energy Simulation of Buildings with Different Construction Features and under Different Climates. Energy 2023, 270, 126875. [Google Scholar] [CrossRef] [Scilit]
- Joint Research Centre Photovoltaic Geographical Information System (PVGIS). Available online: https://joint-research-centre.ec.europa.eu/photovoltaic-geographical-information-system-pvgis_en (accessed on 25 June 2025).
- UNI EN ISO 7730:2006; Ergonomia Degli Ambienti Termici—Determinazione Analitica e Interpretazione Del Benessere Termico Mediante Il Calcolo Degli Indici PMV e PPD e Dei Criteri Di Benessere Termico Locale. UNI—Ente Italiano di Normazione: Milan, Italiy, 2006.
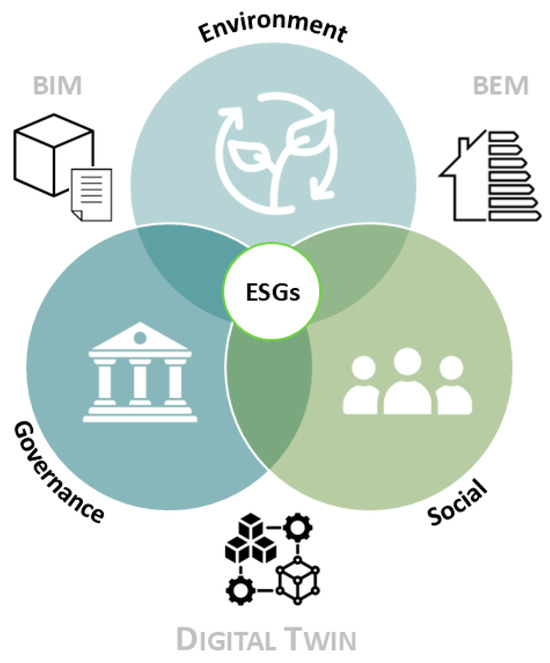
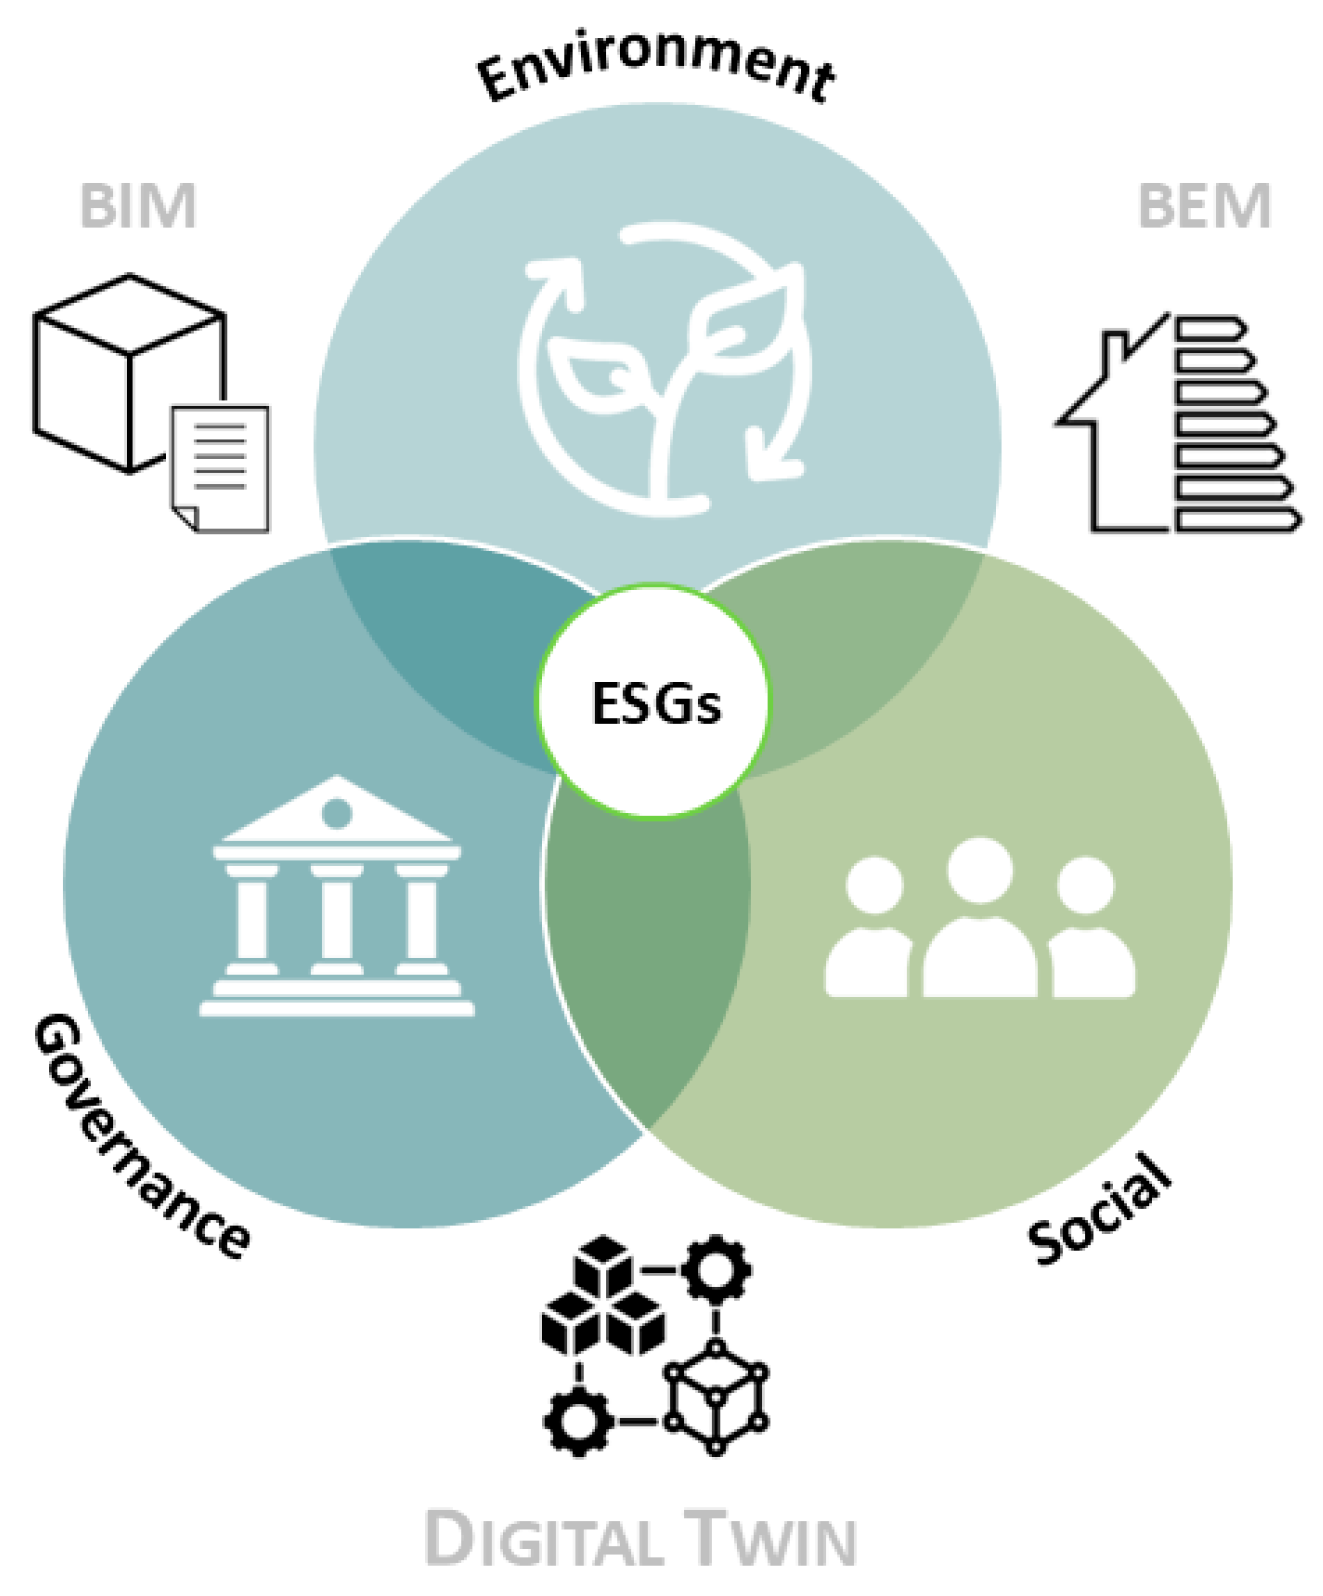
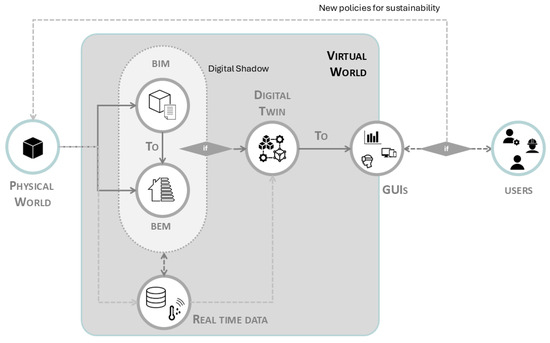
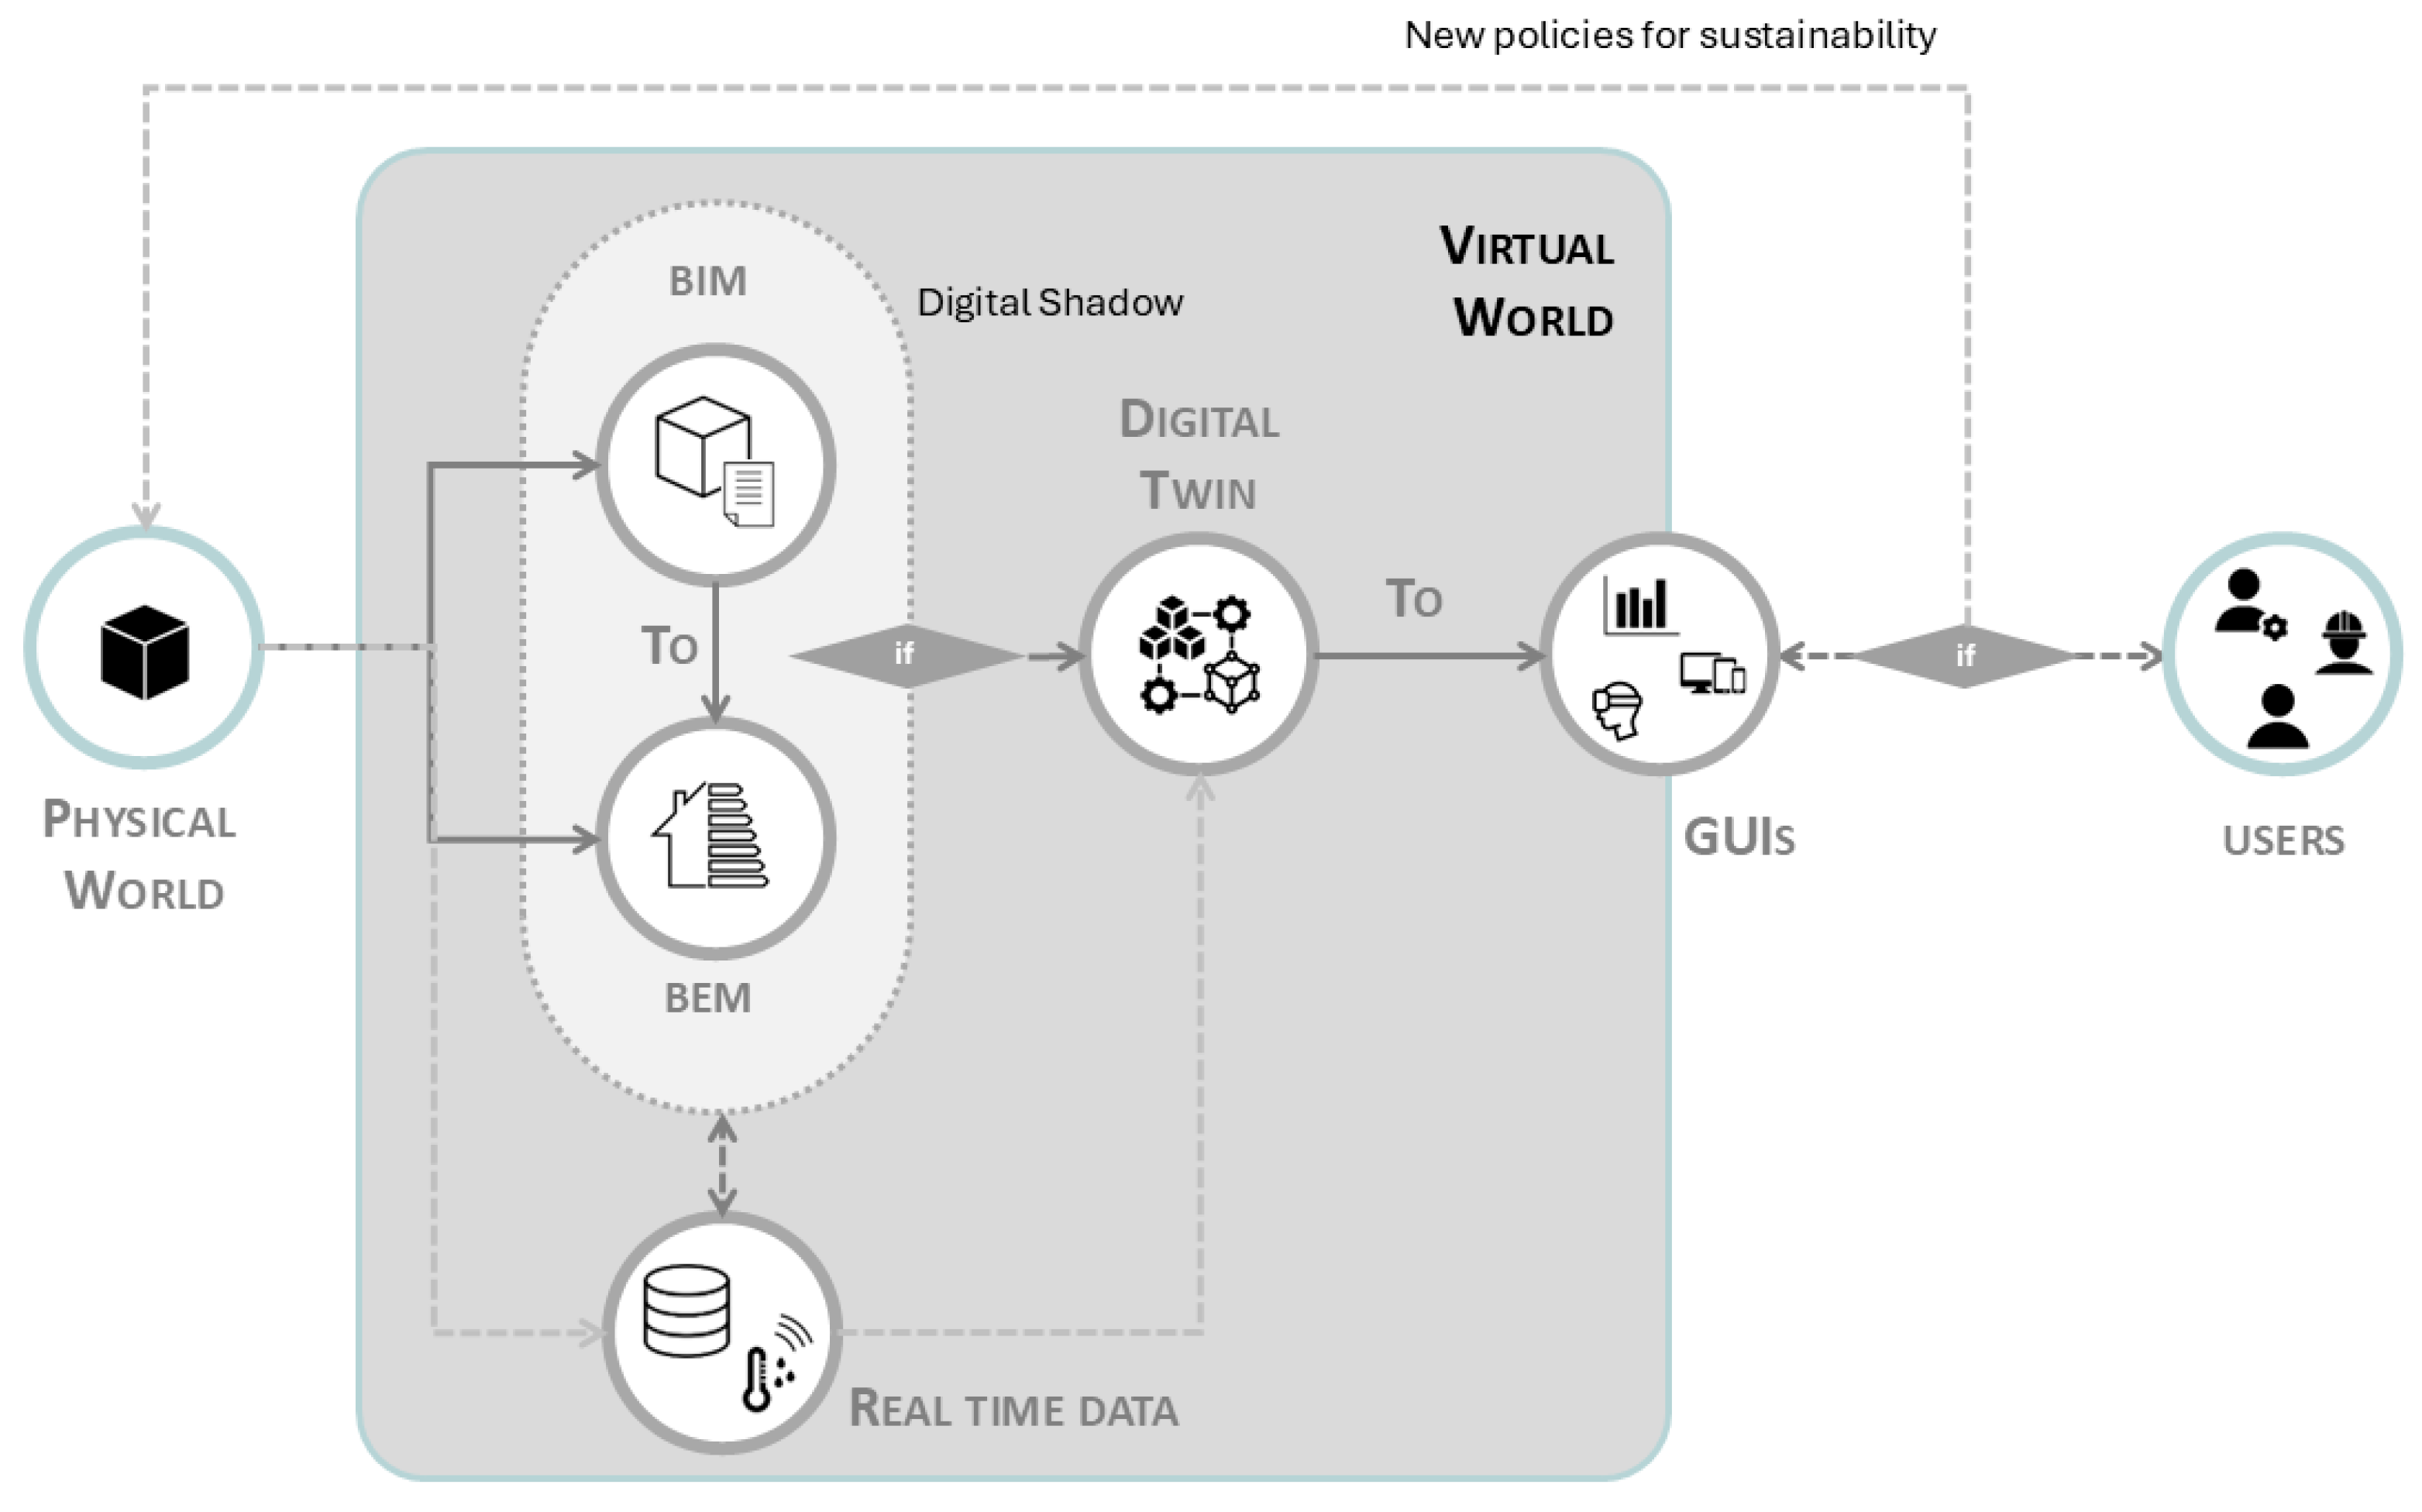
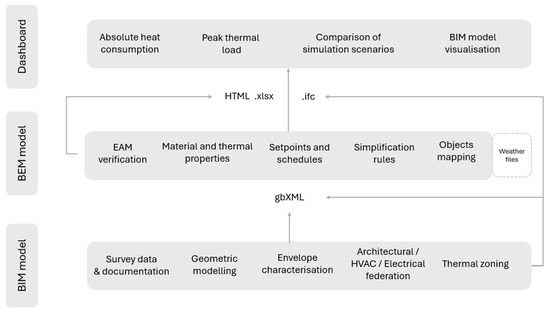
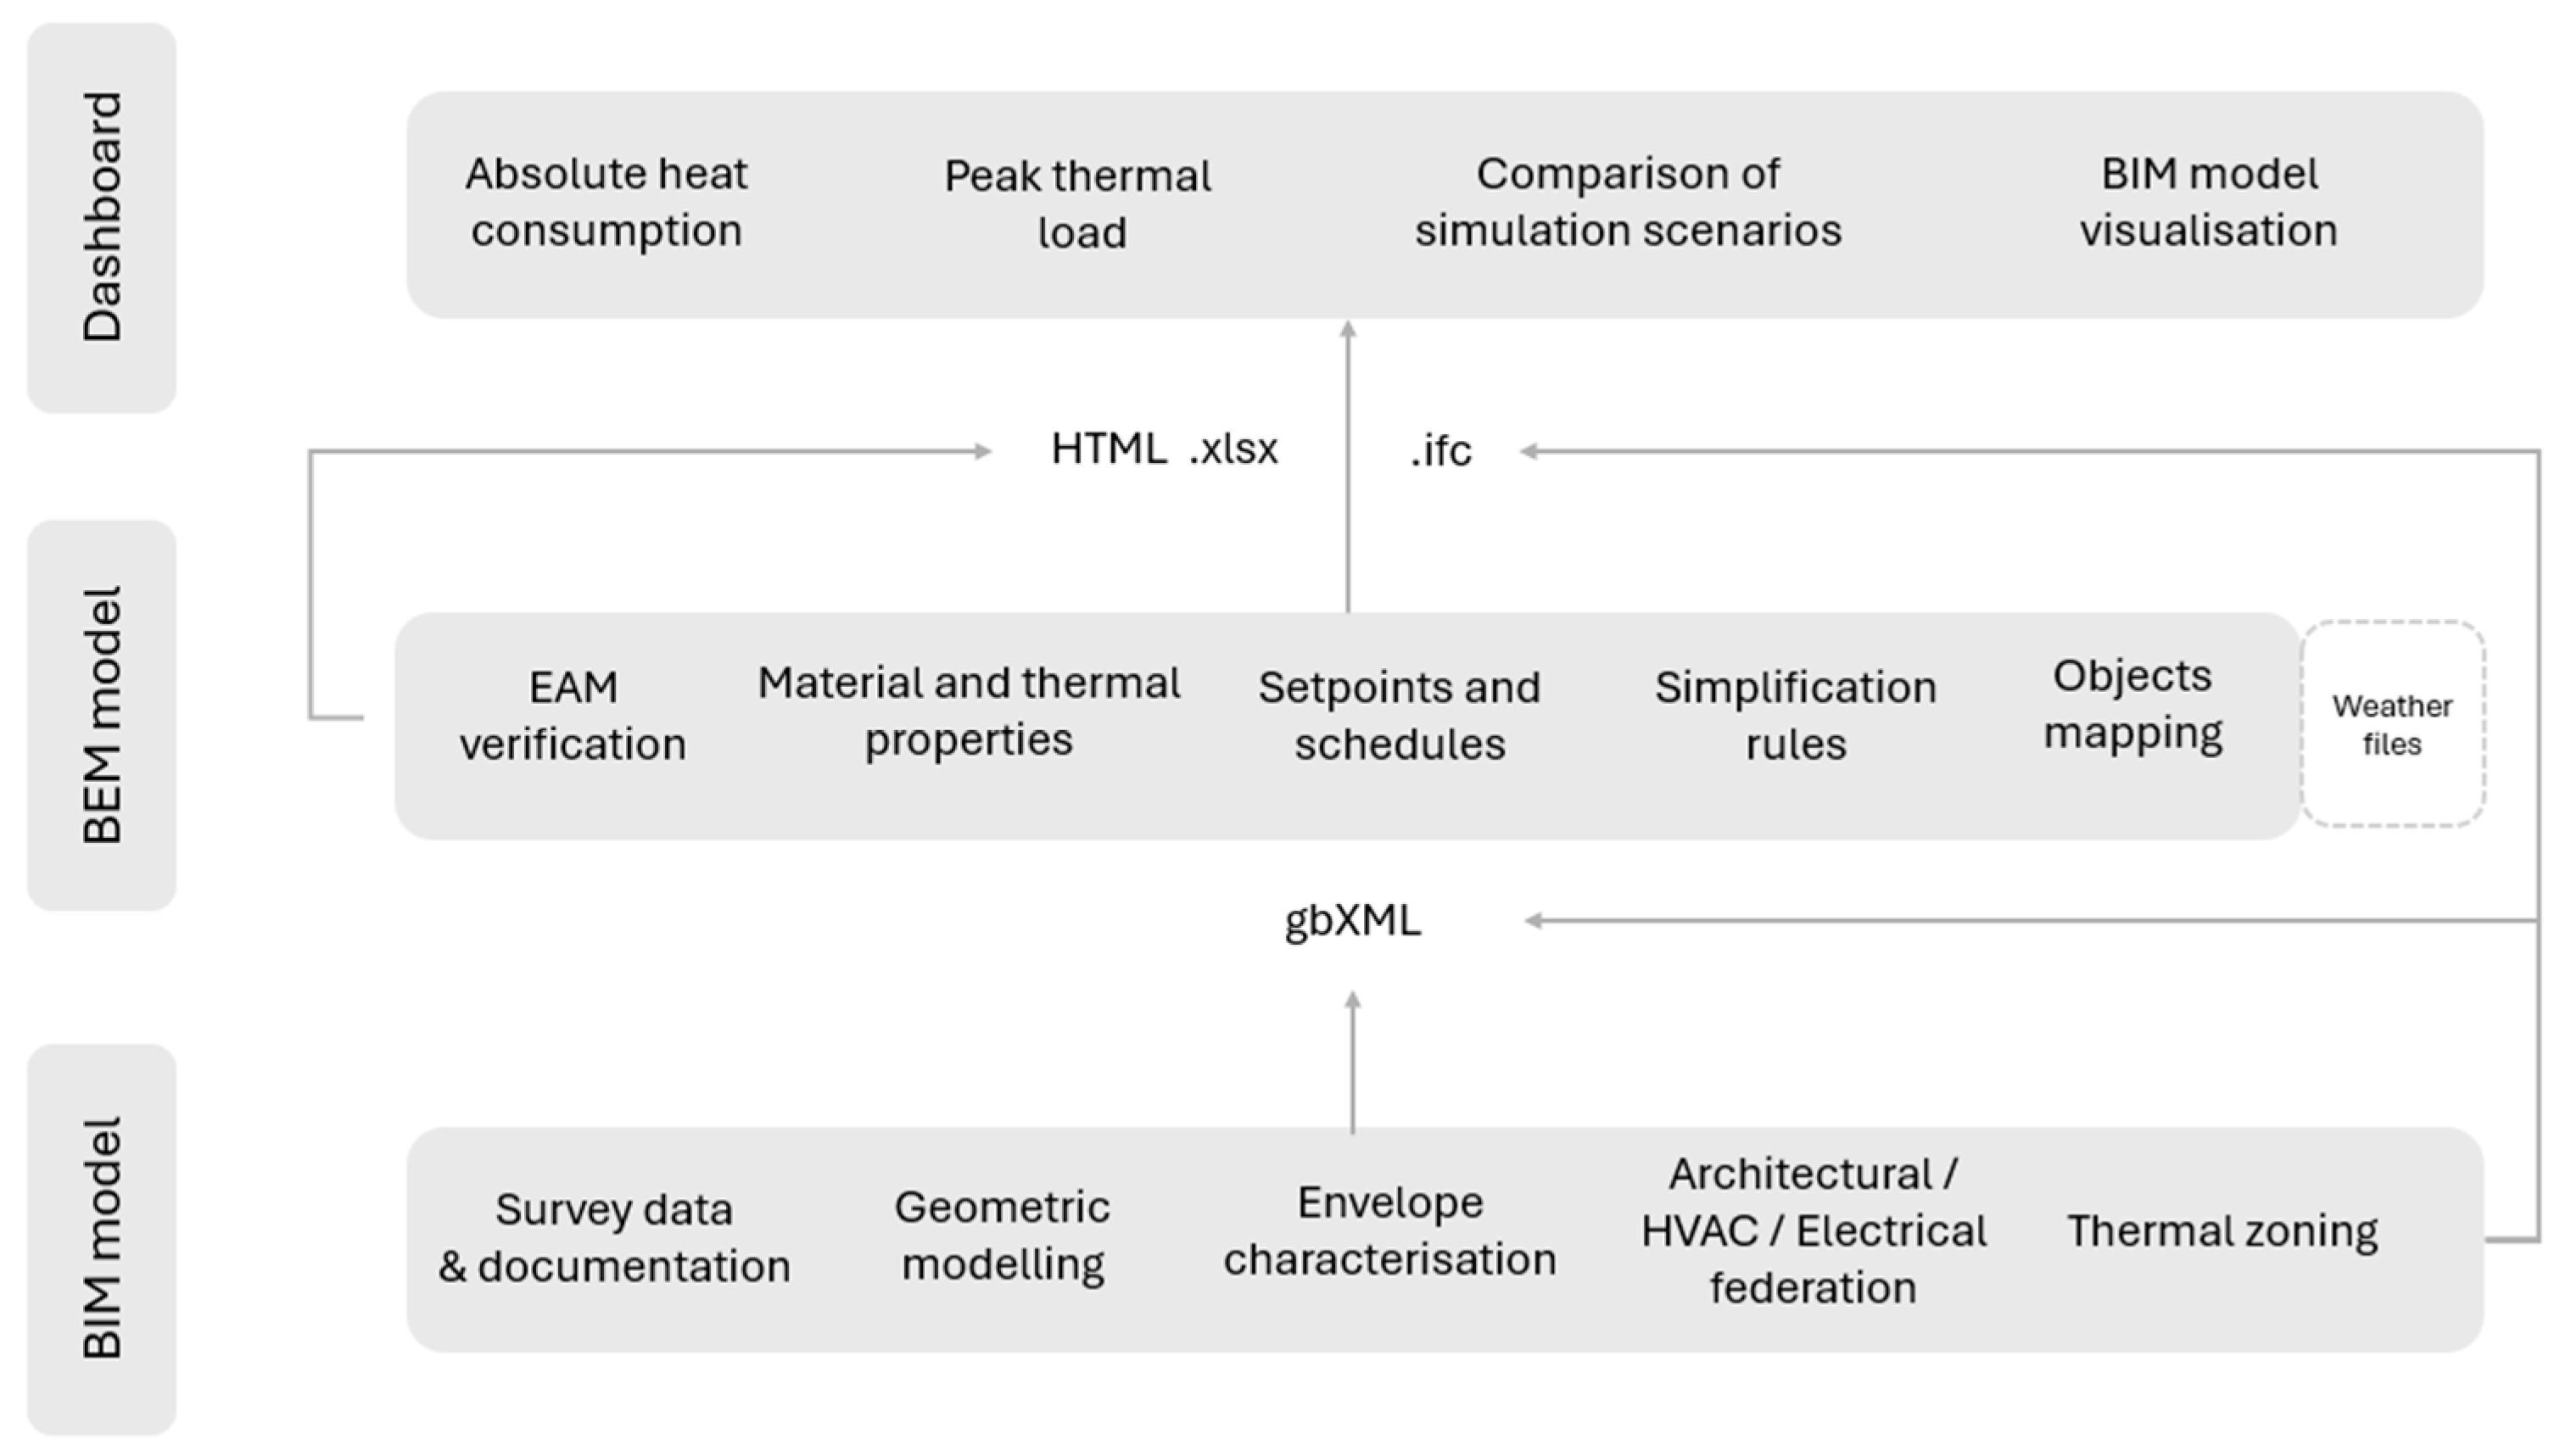
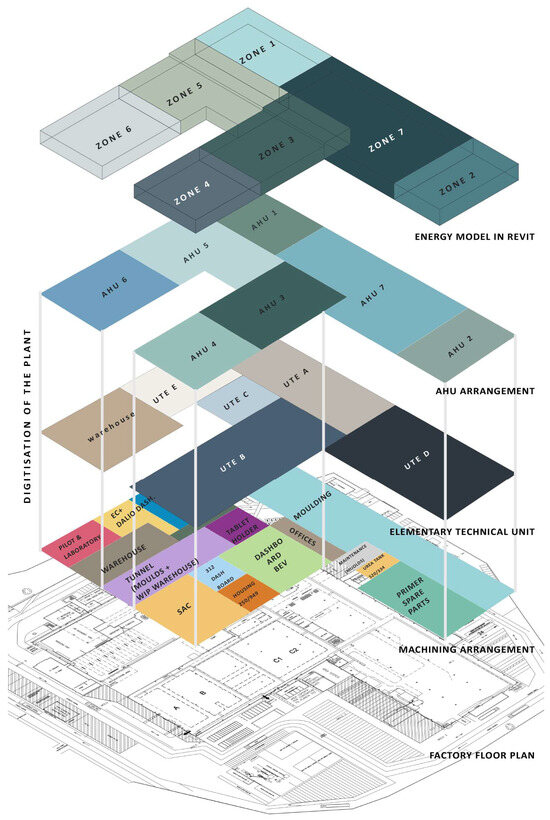
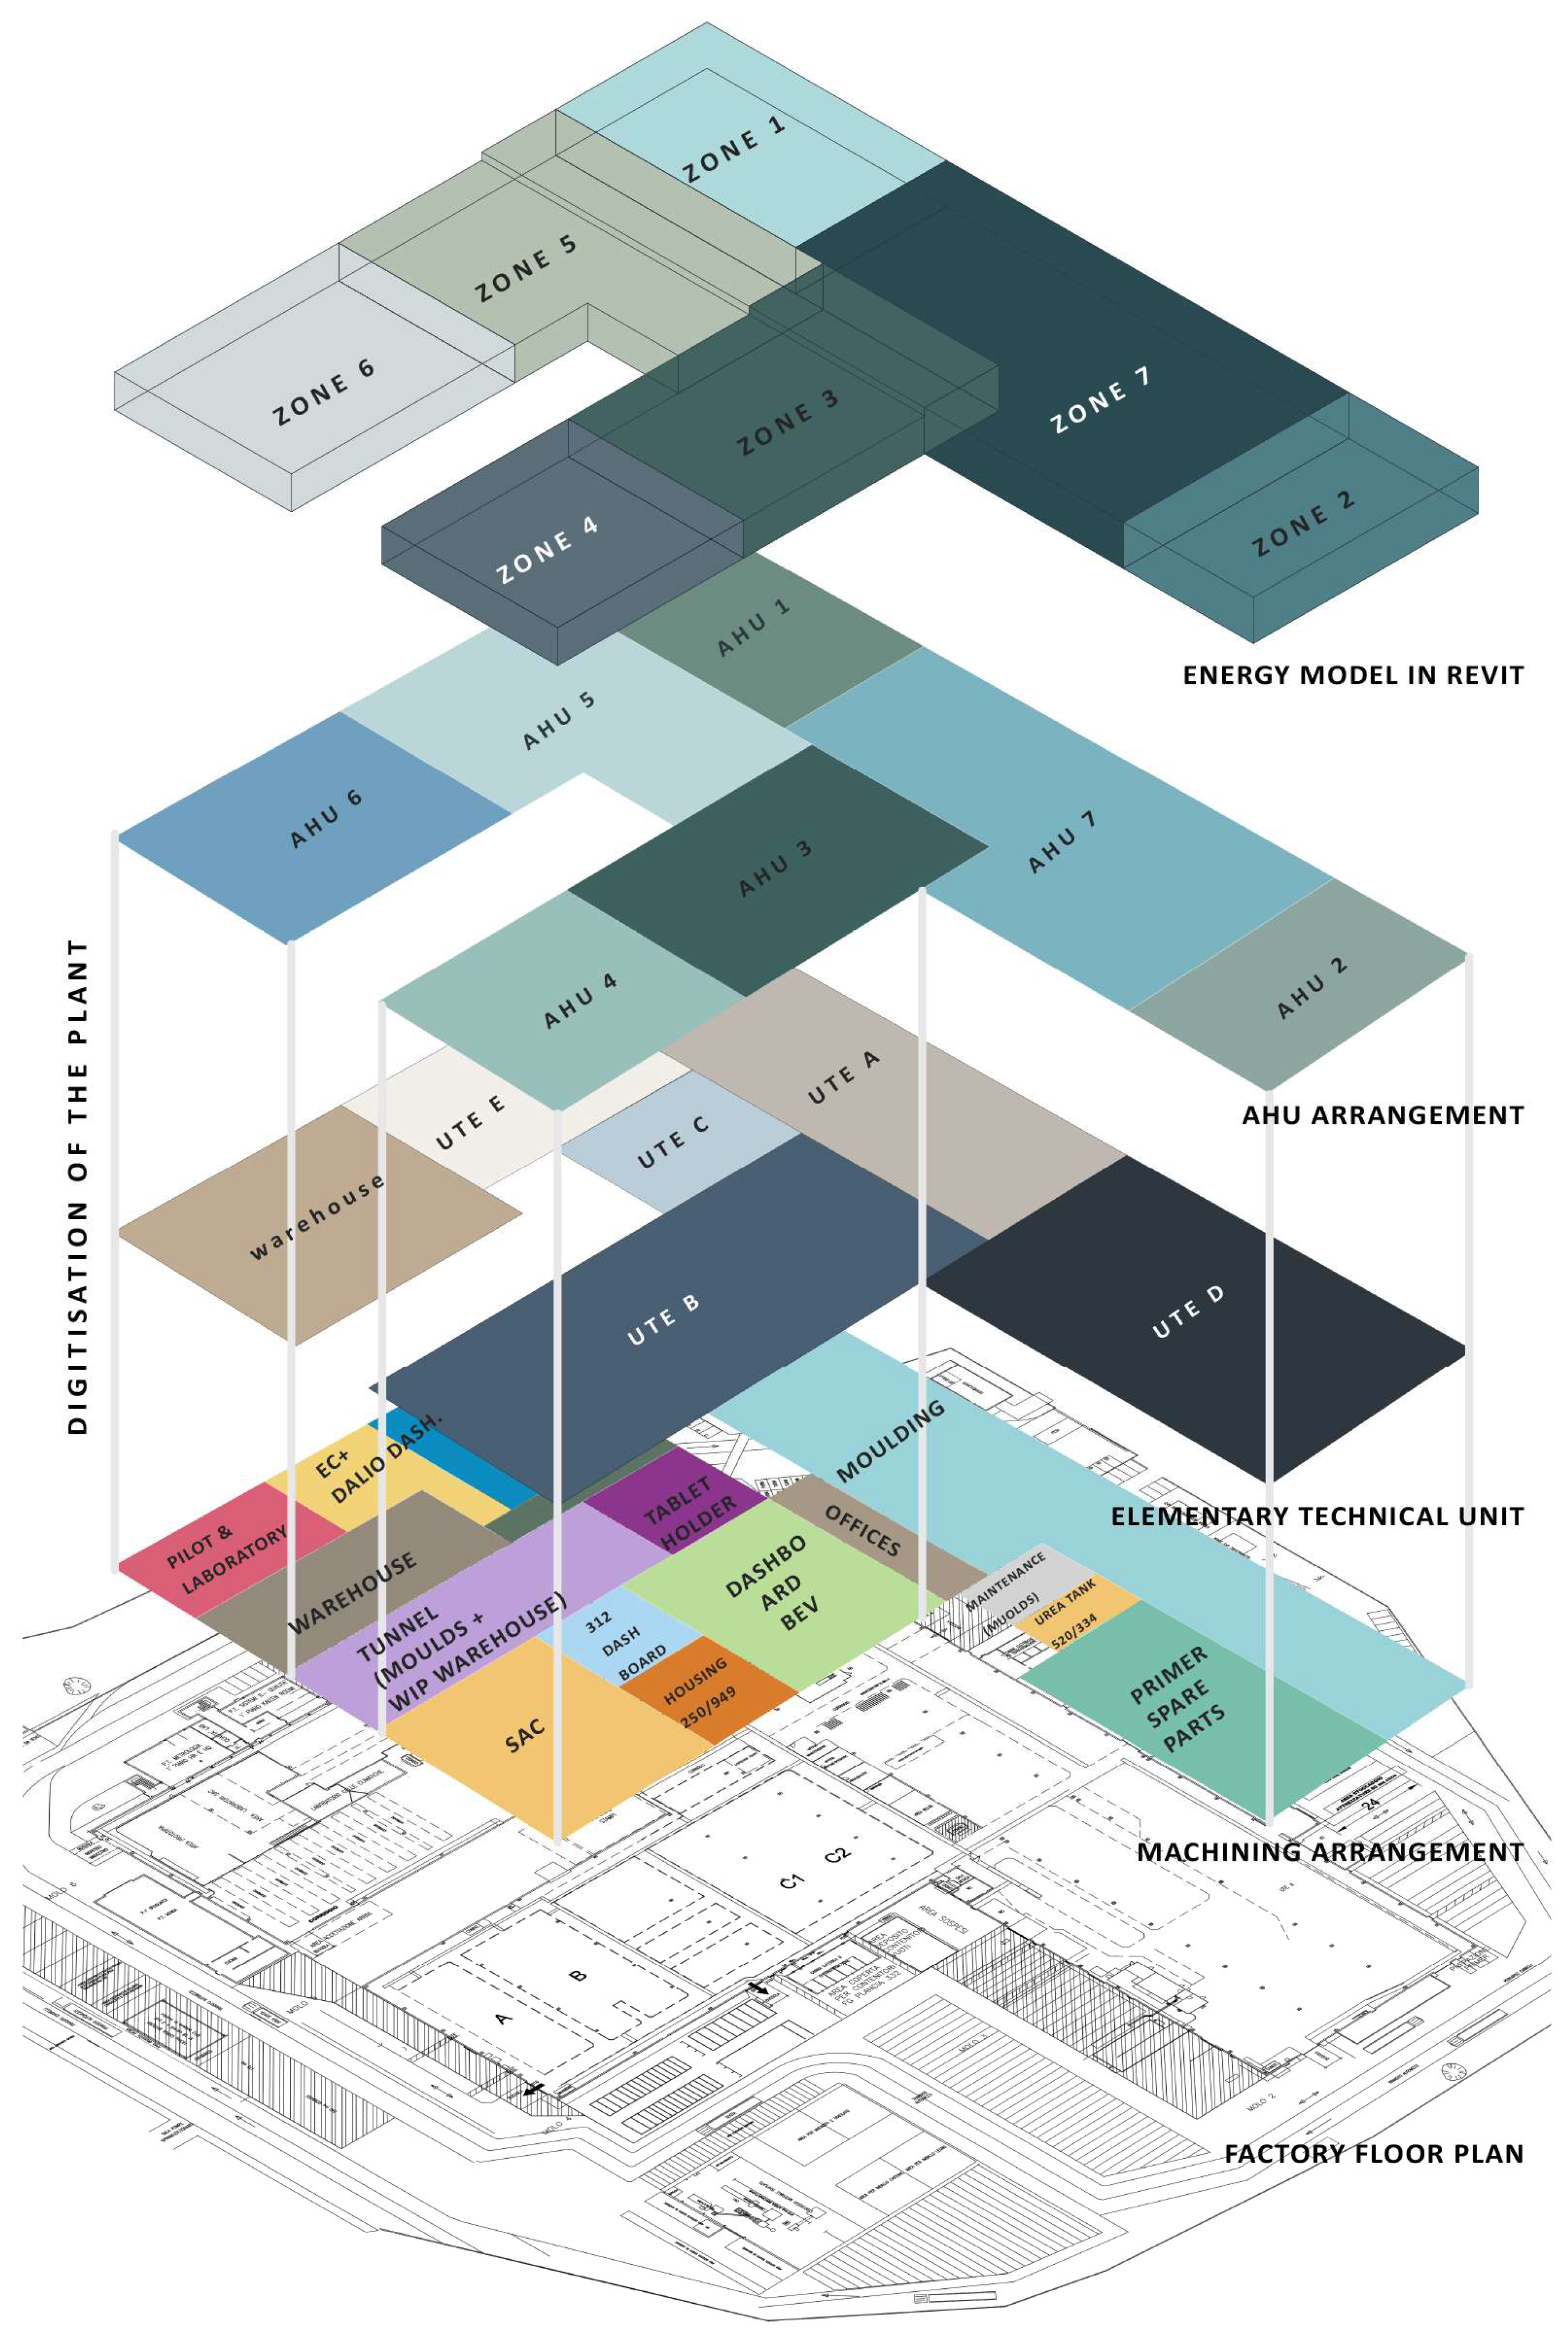
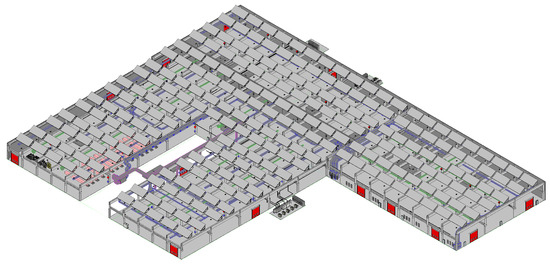
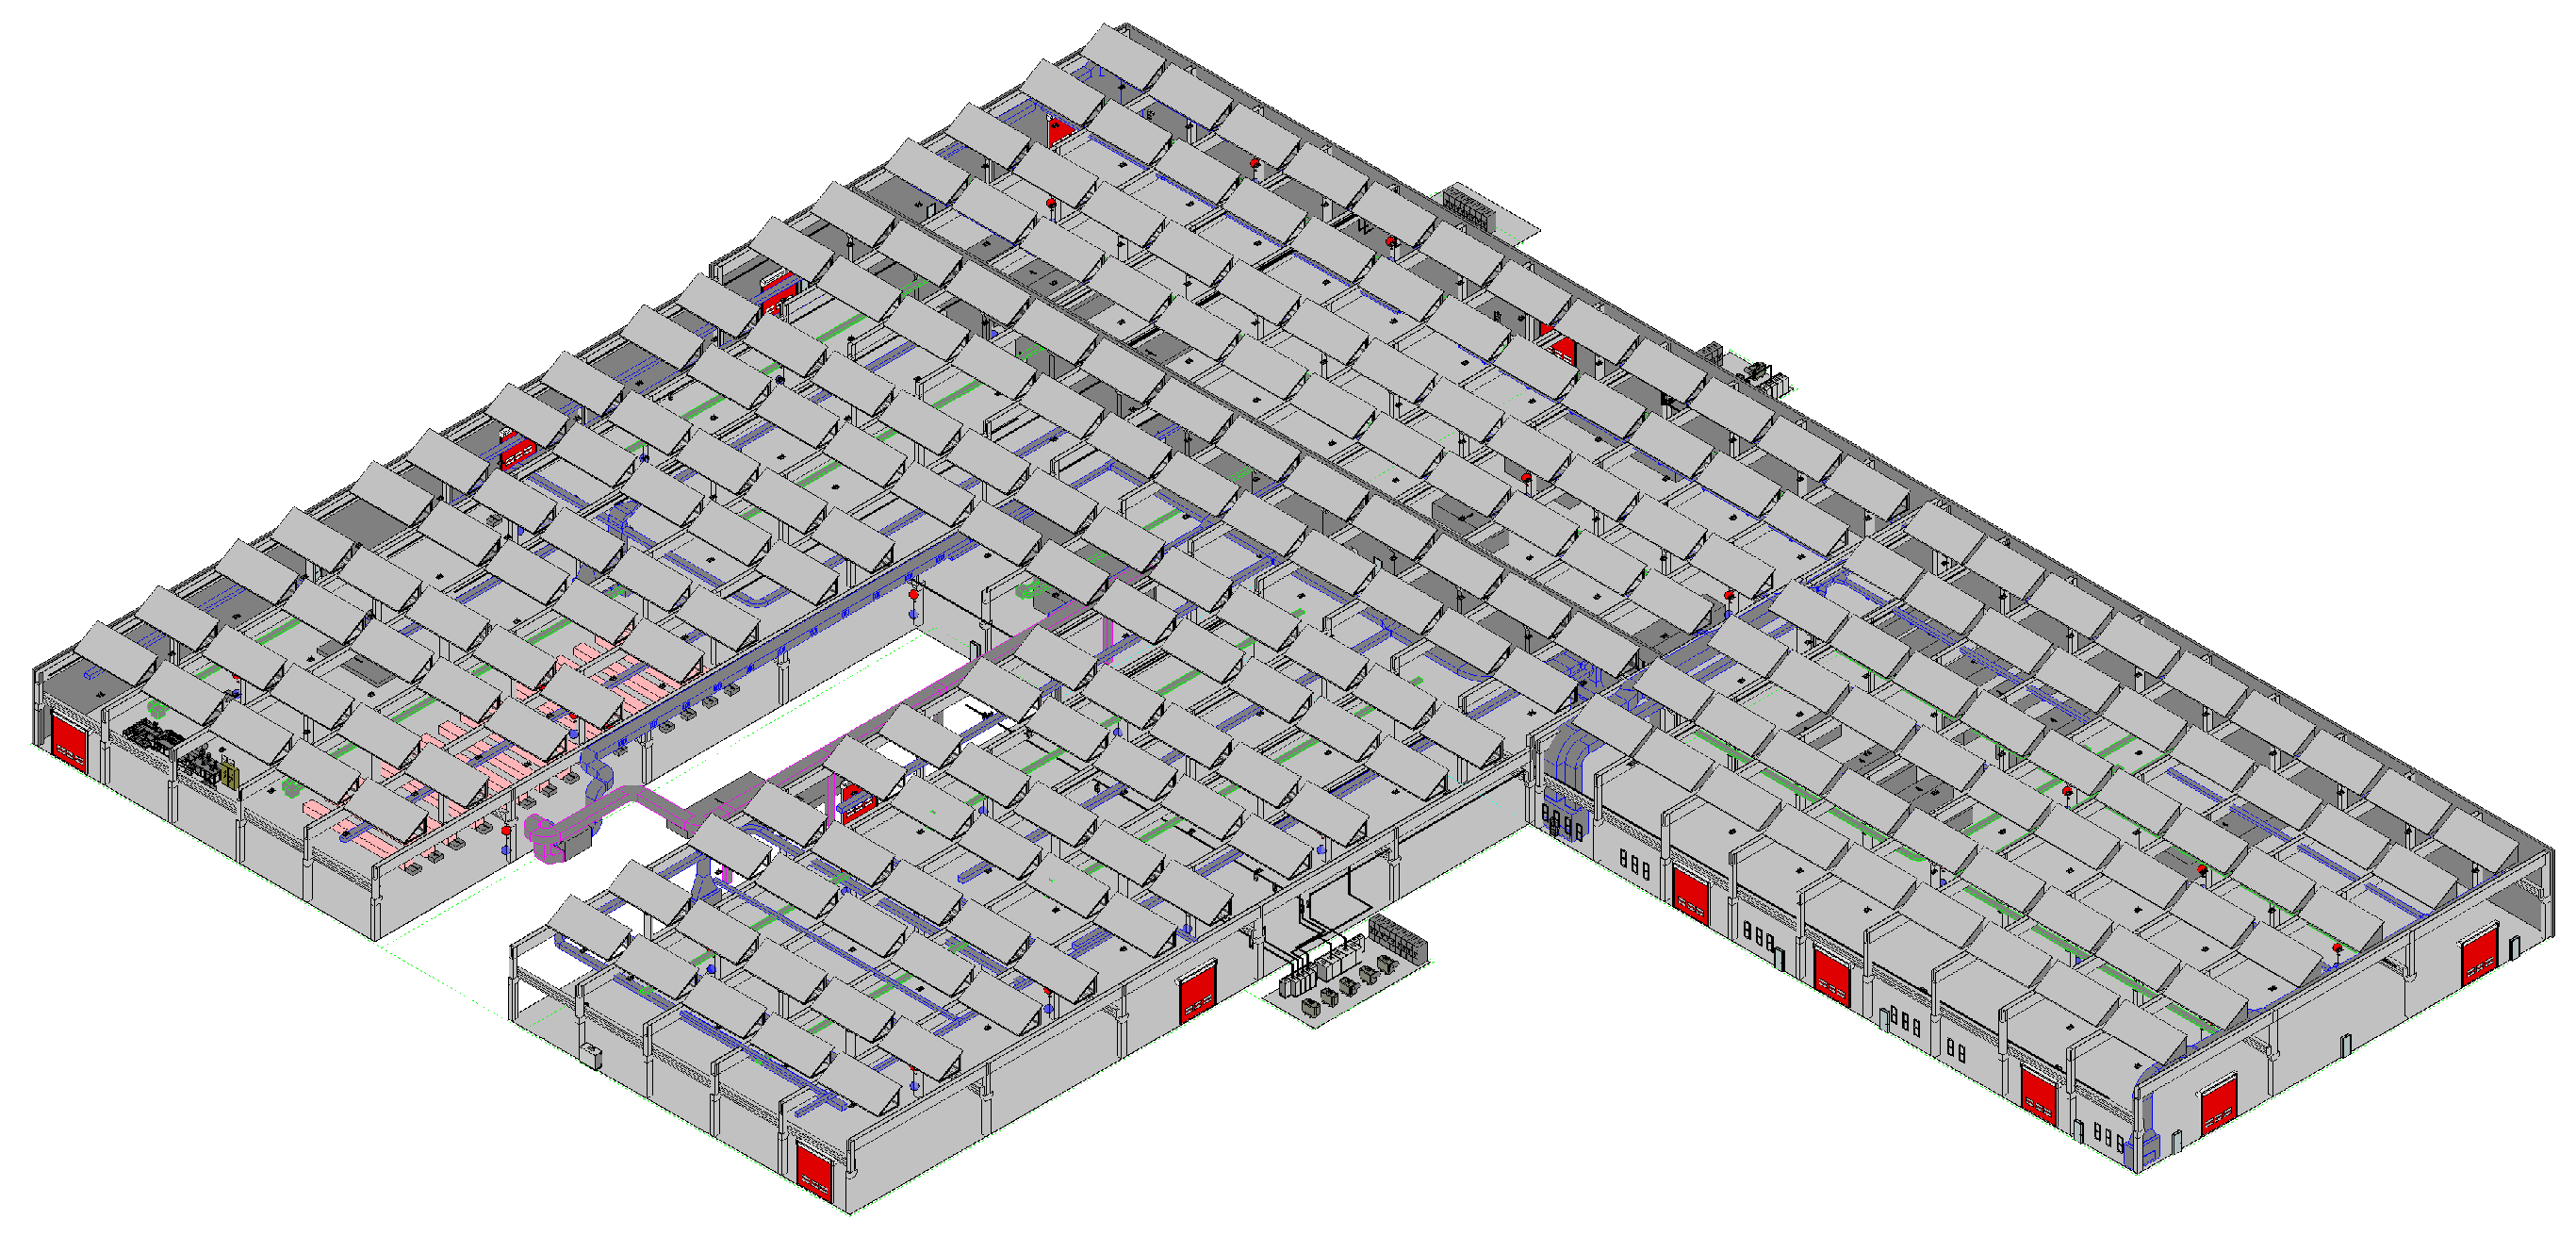
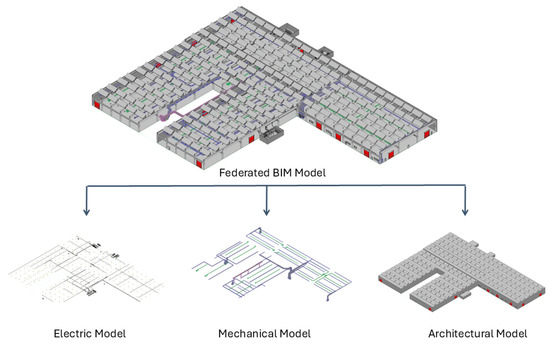
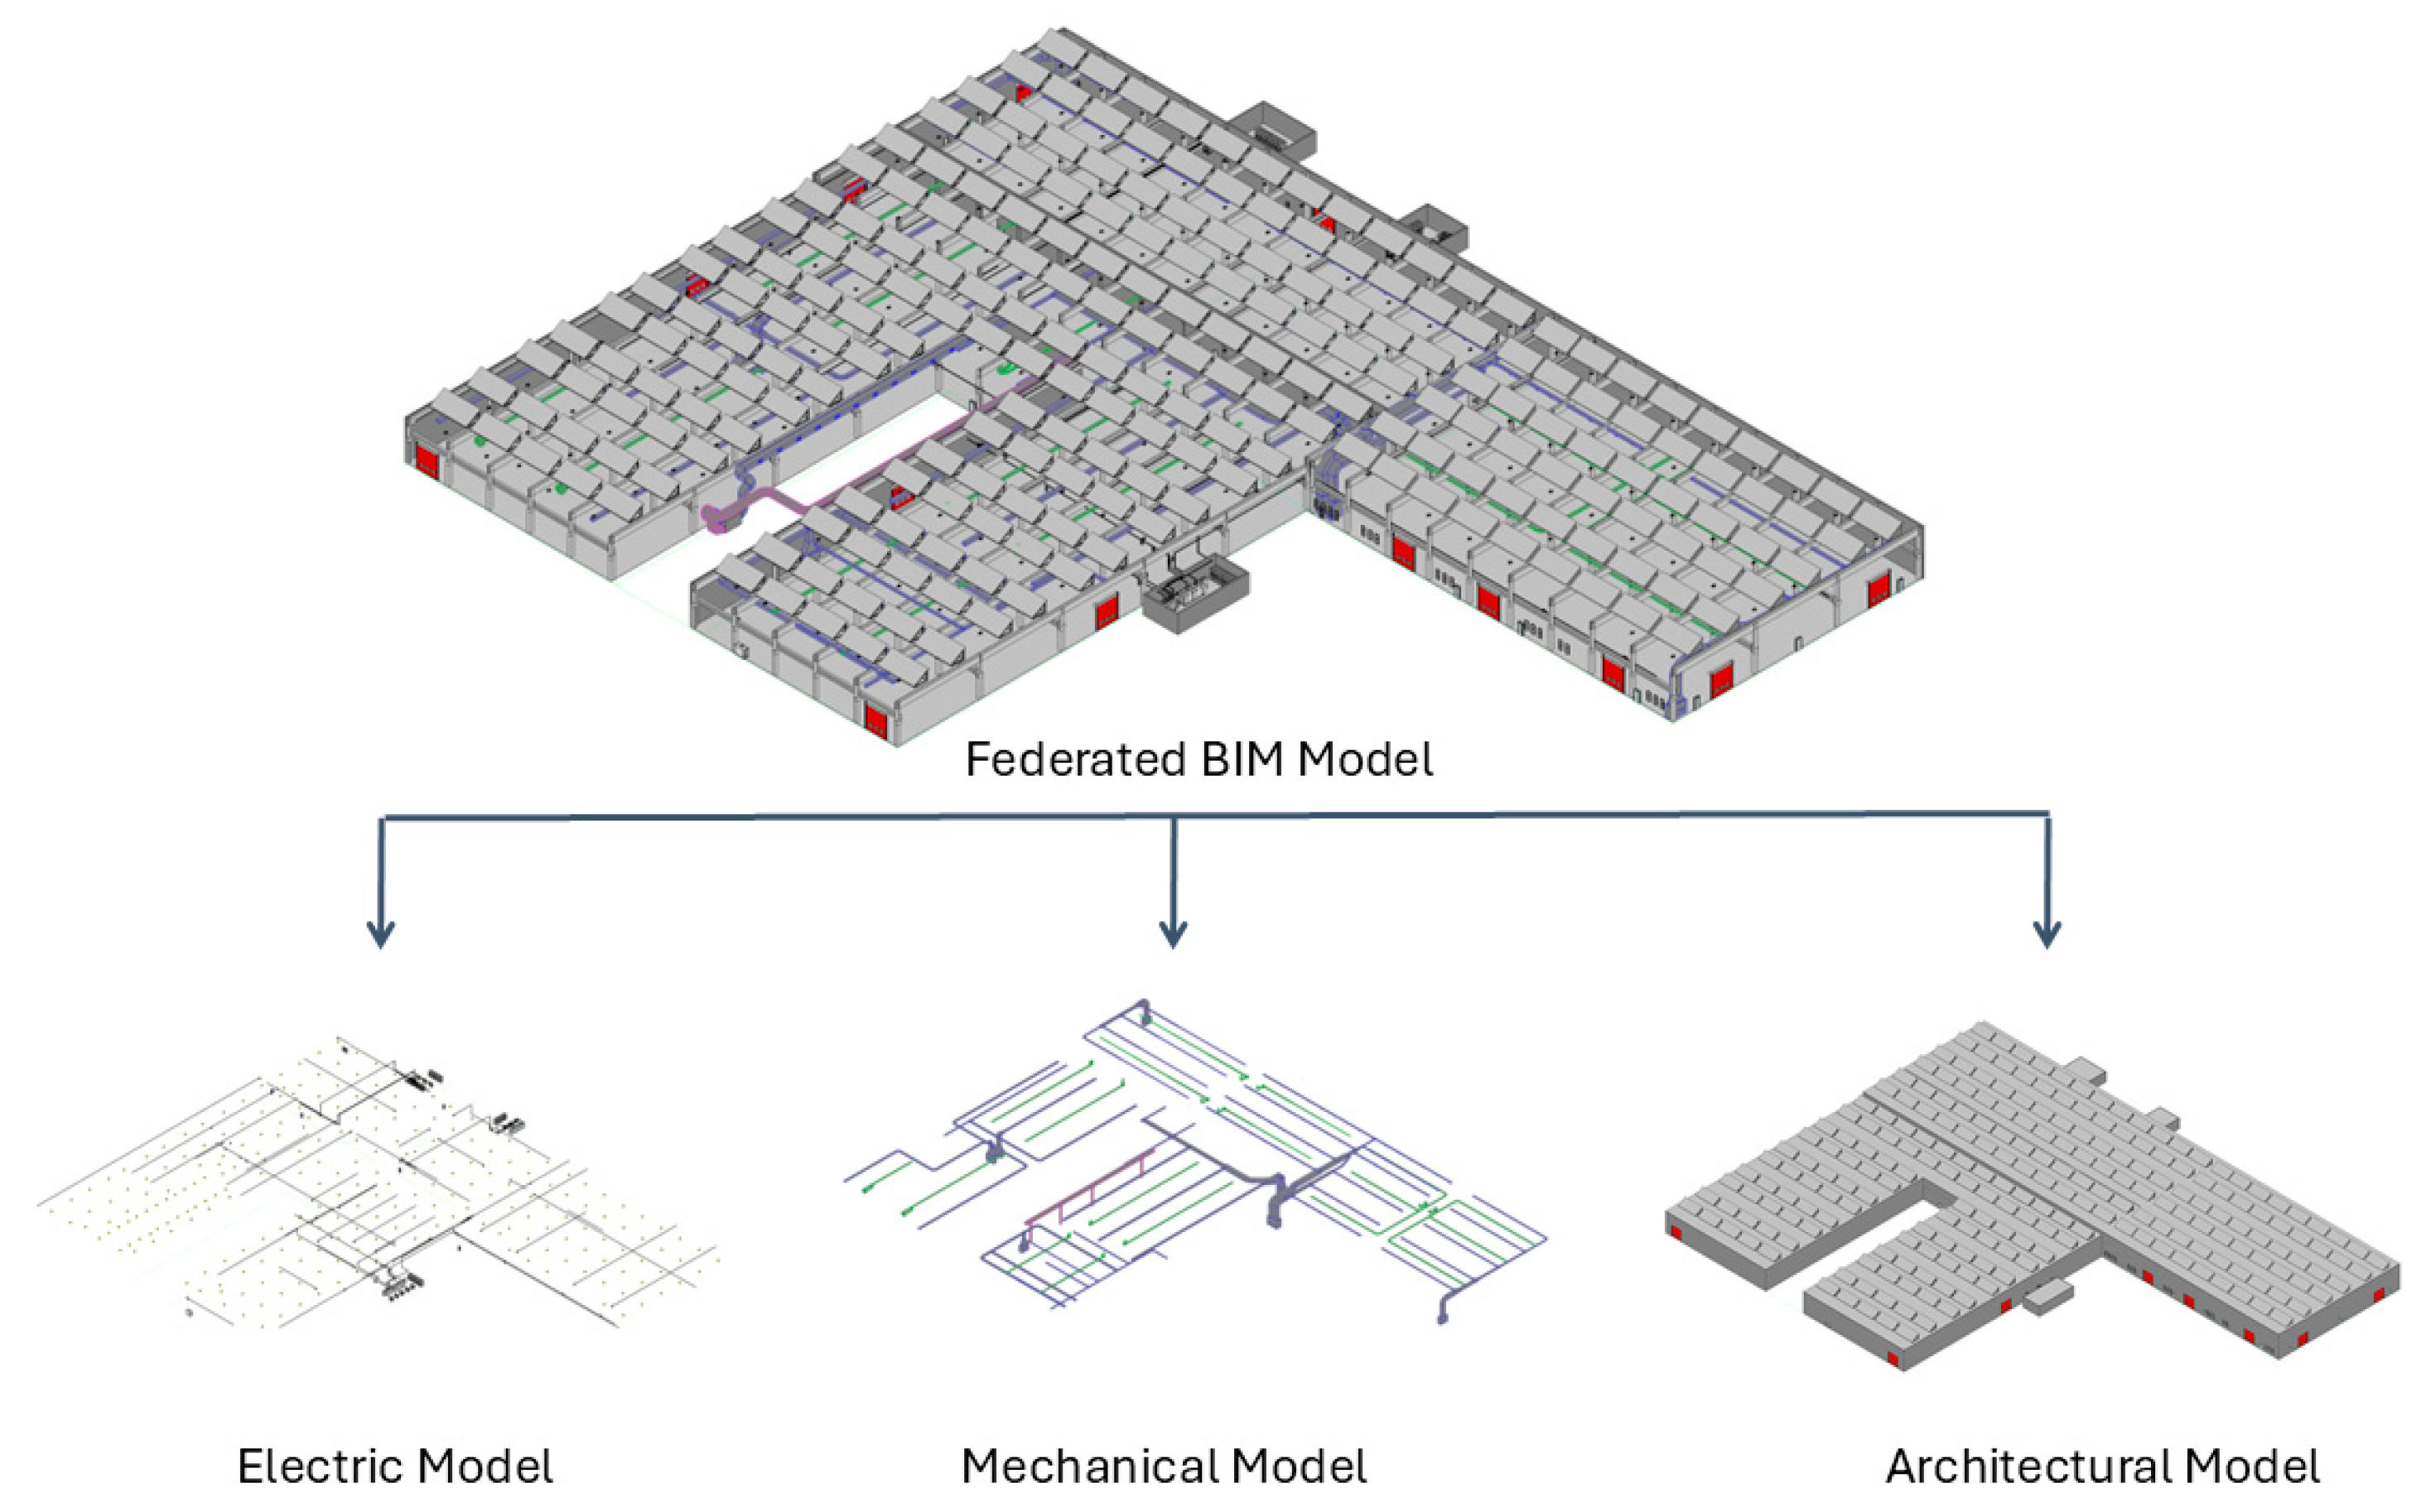
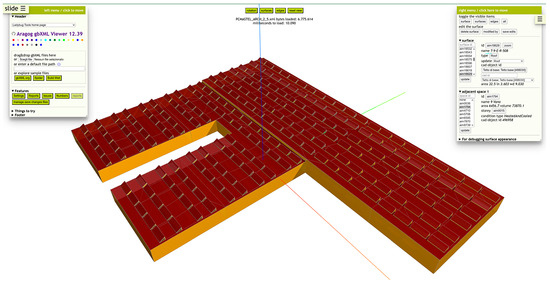
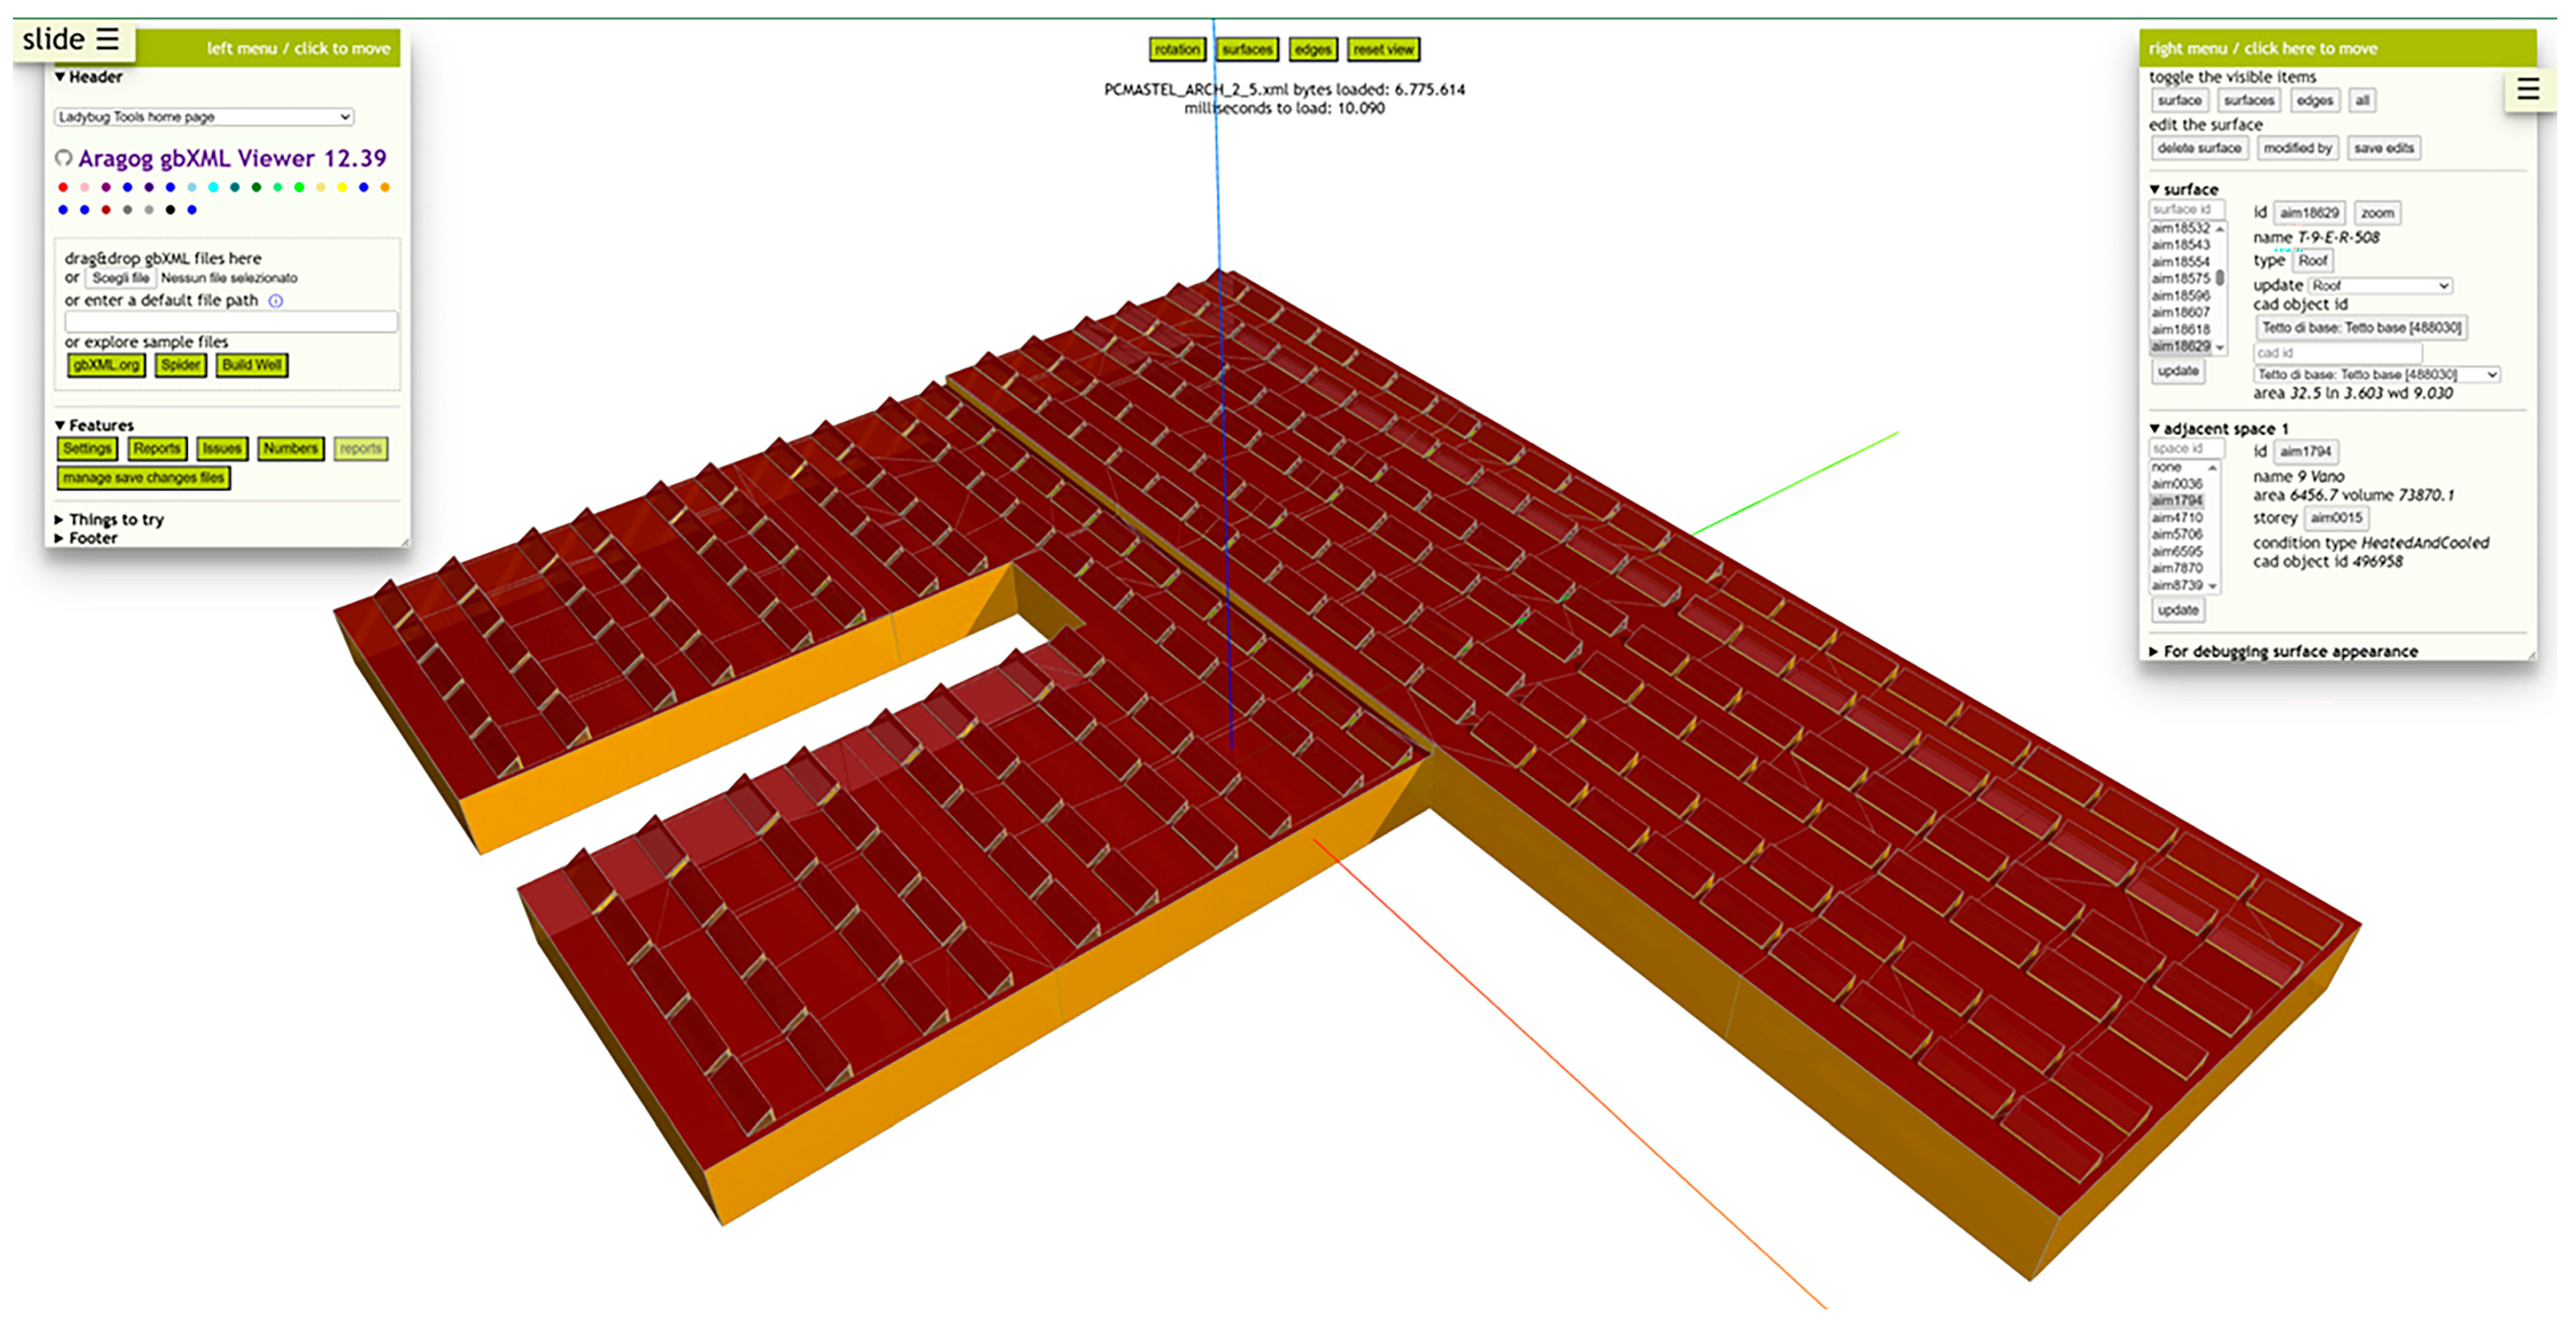
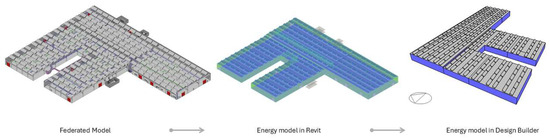
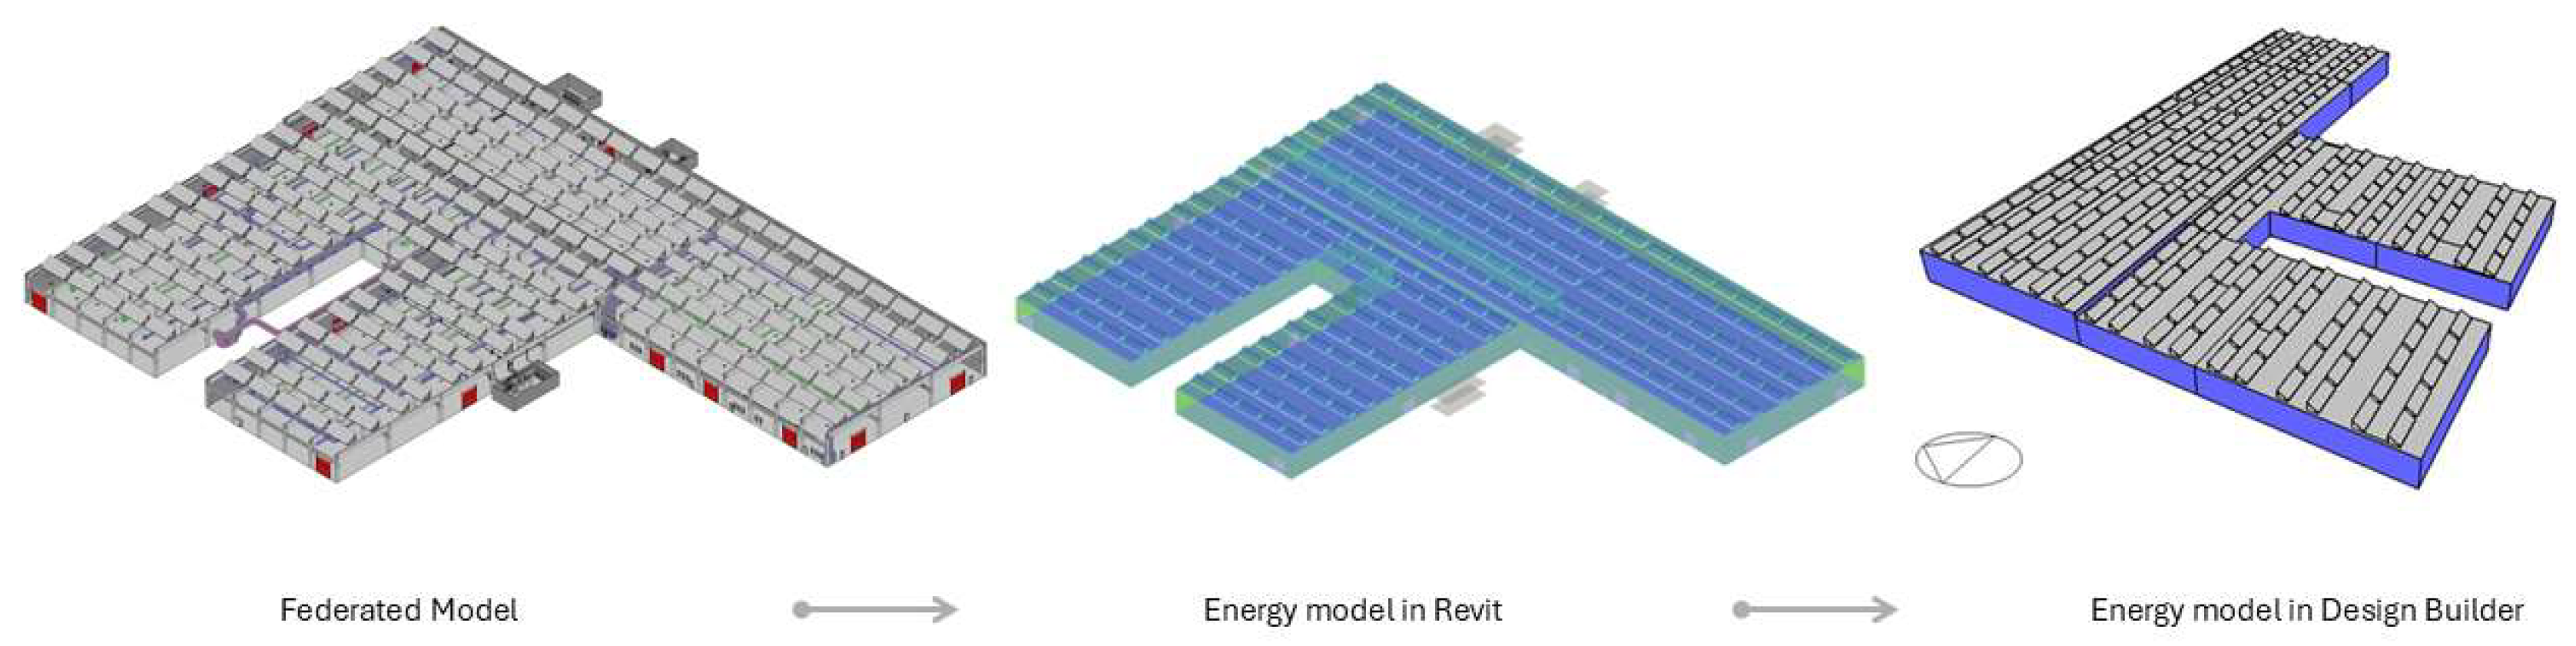
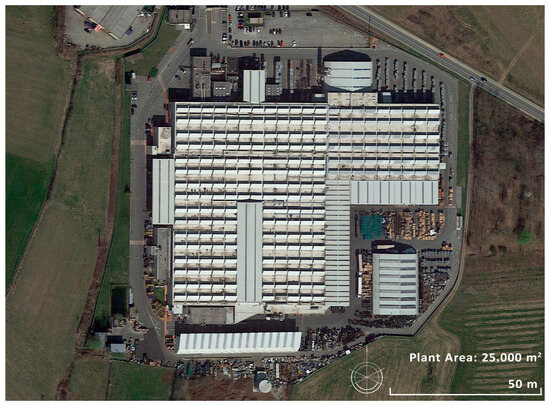
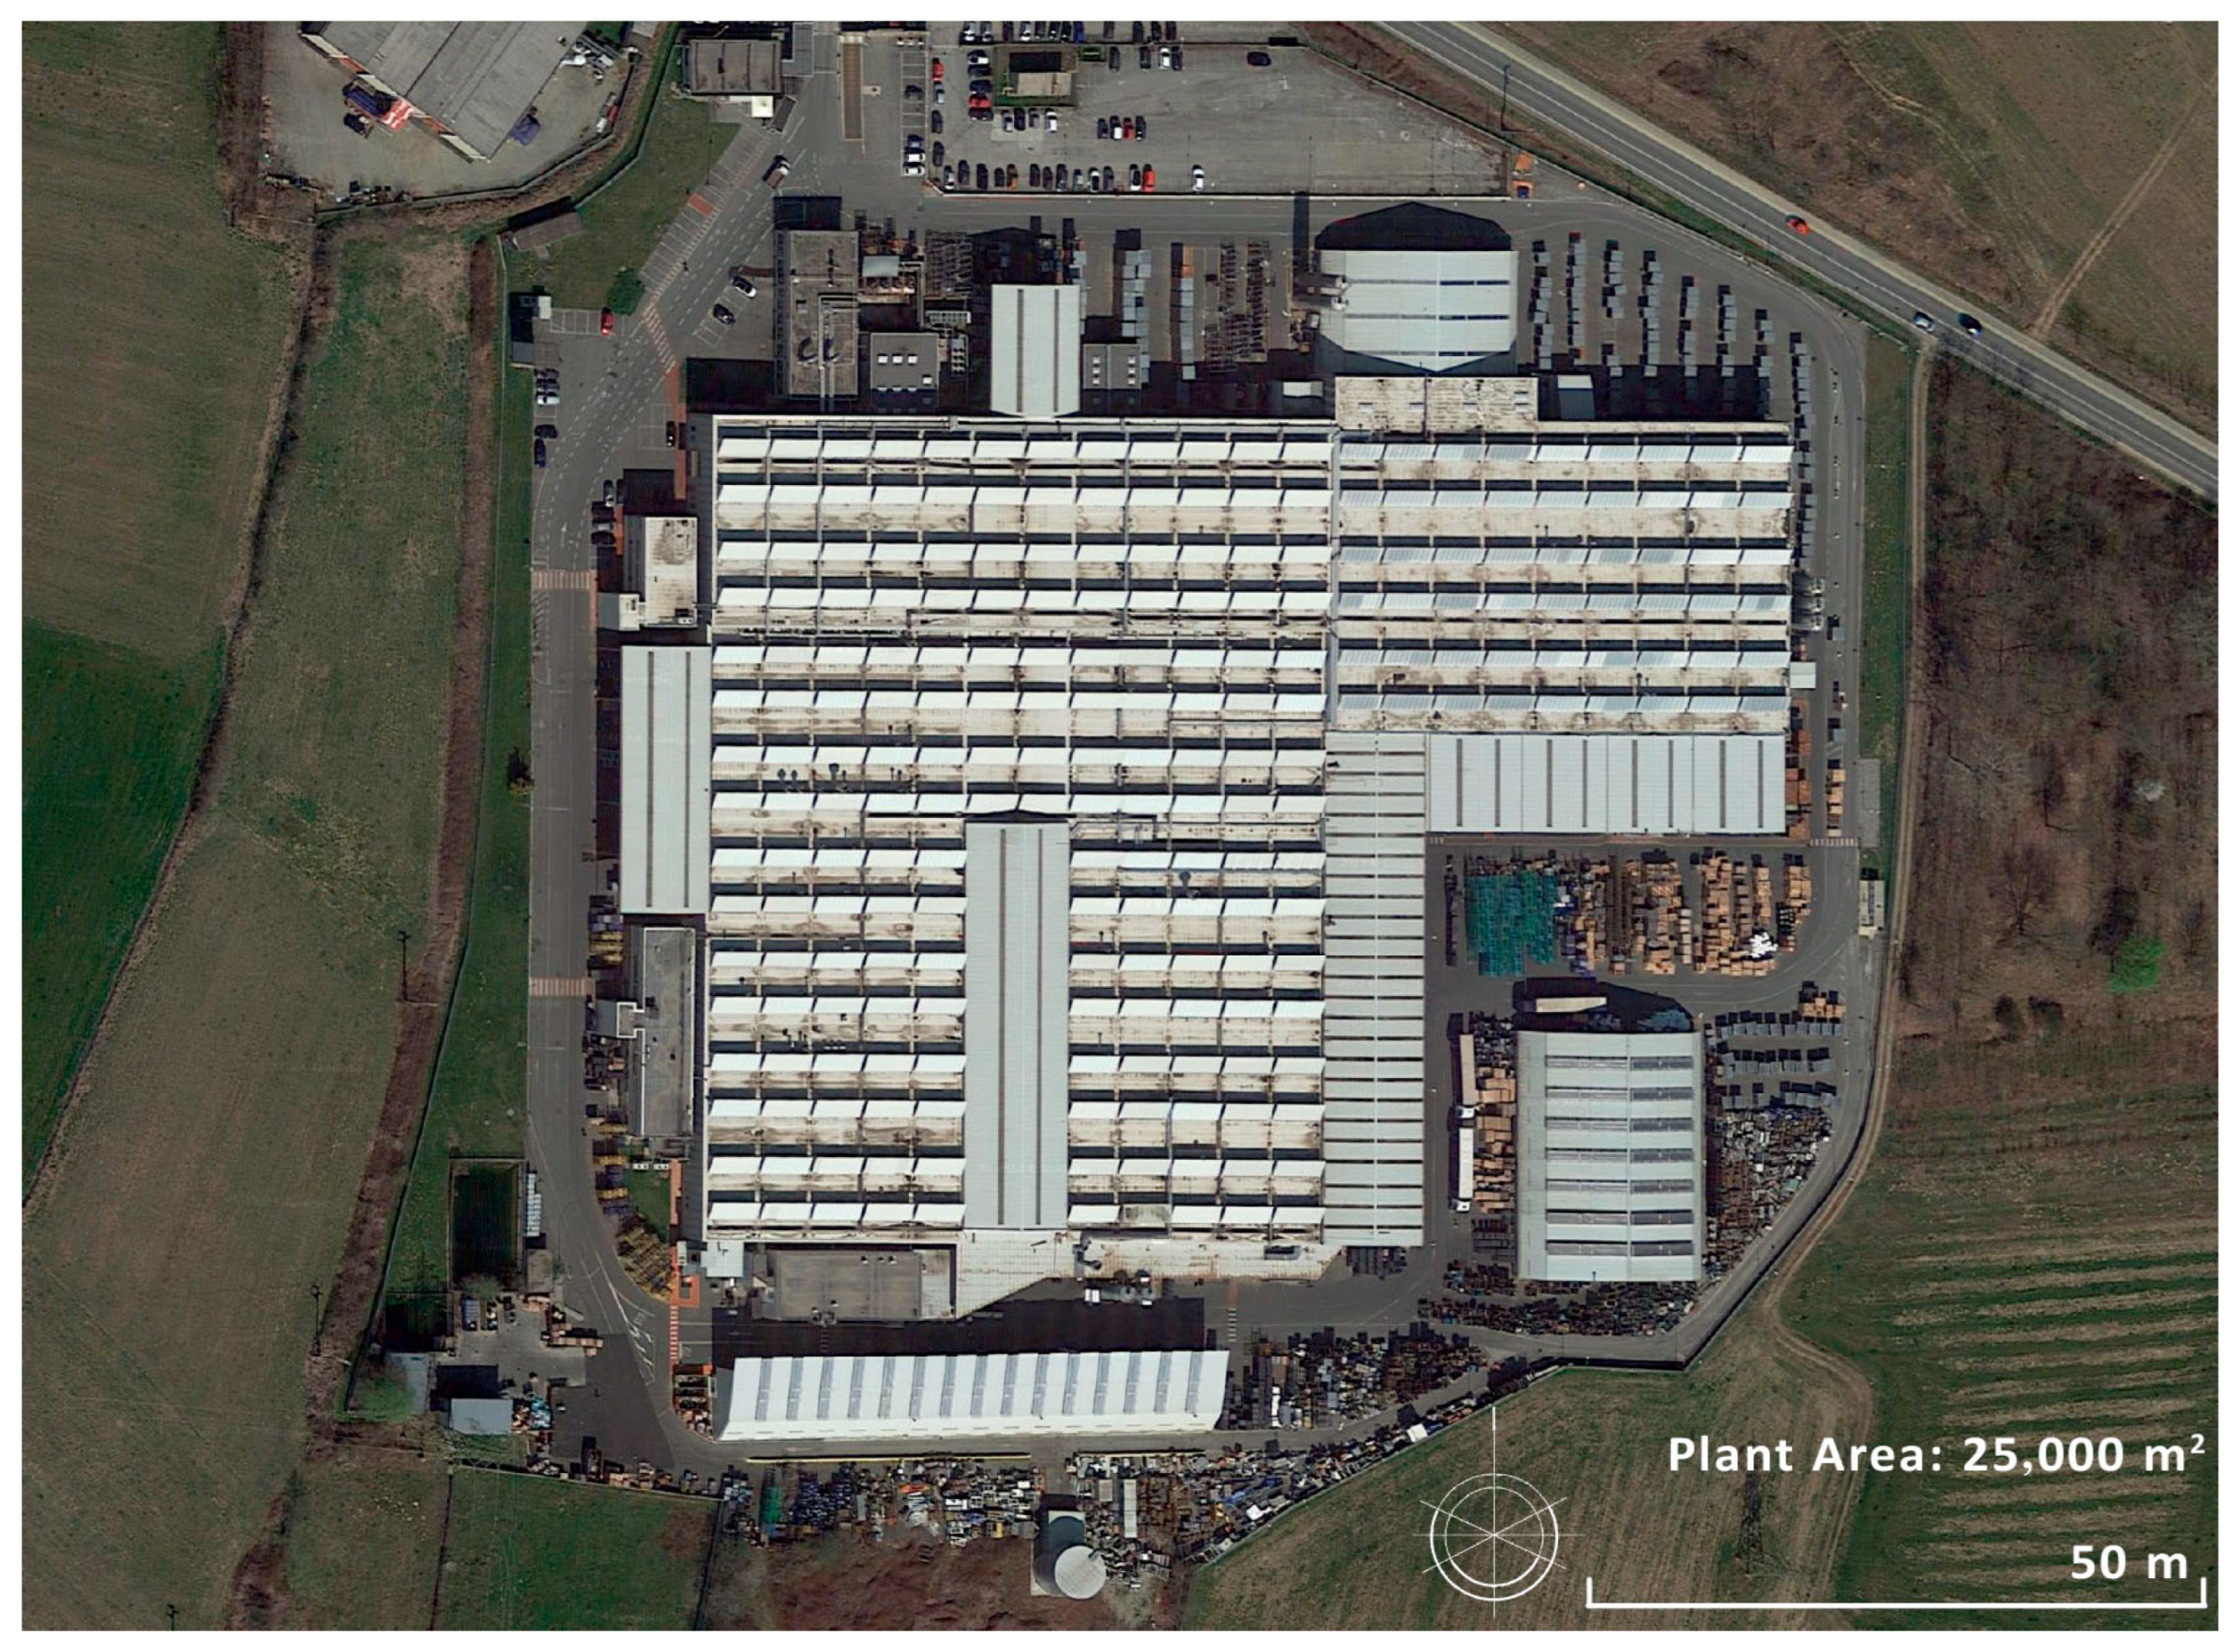
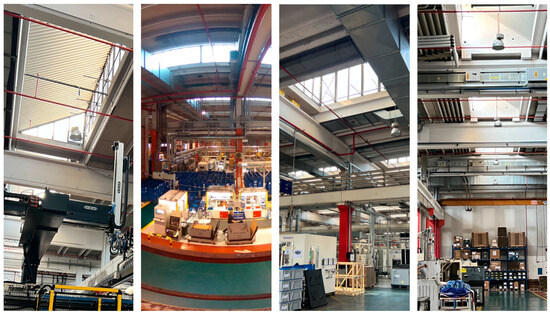
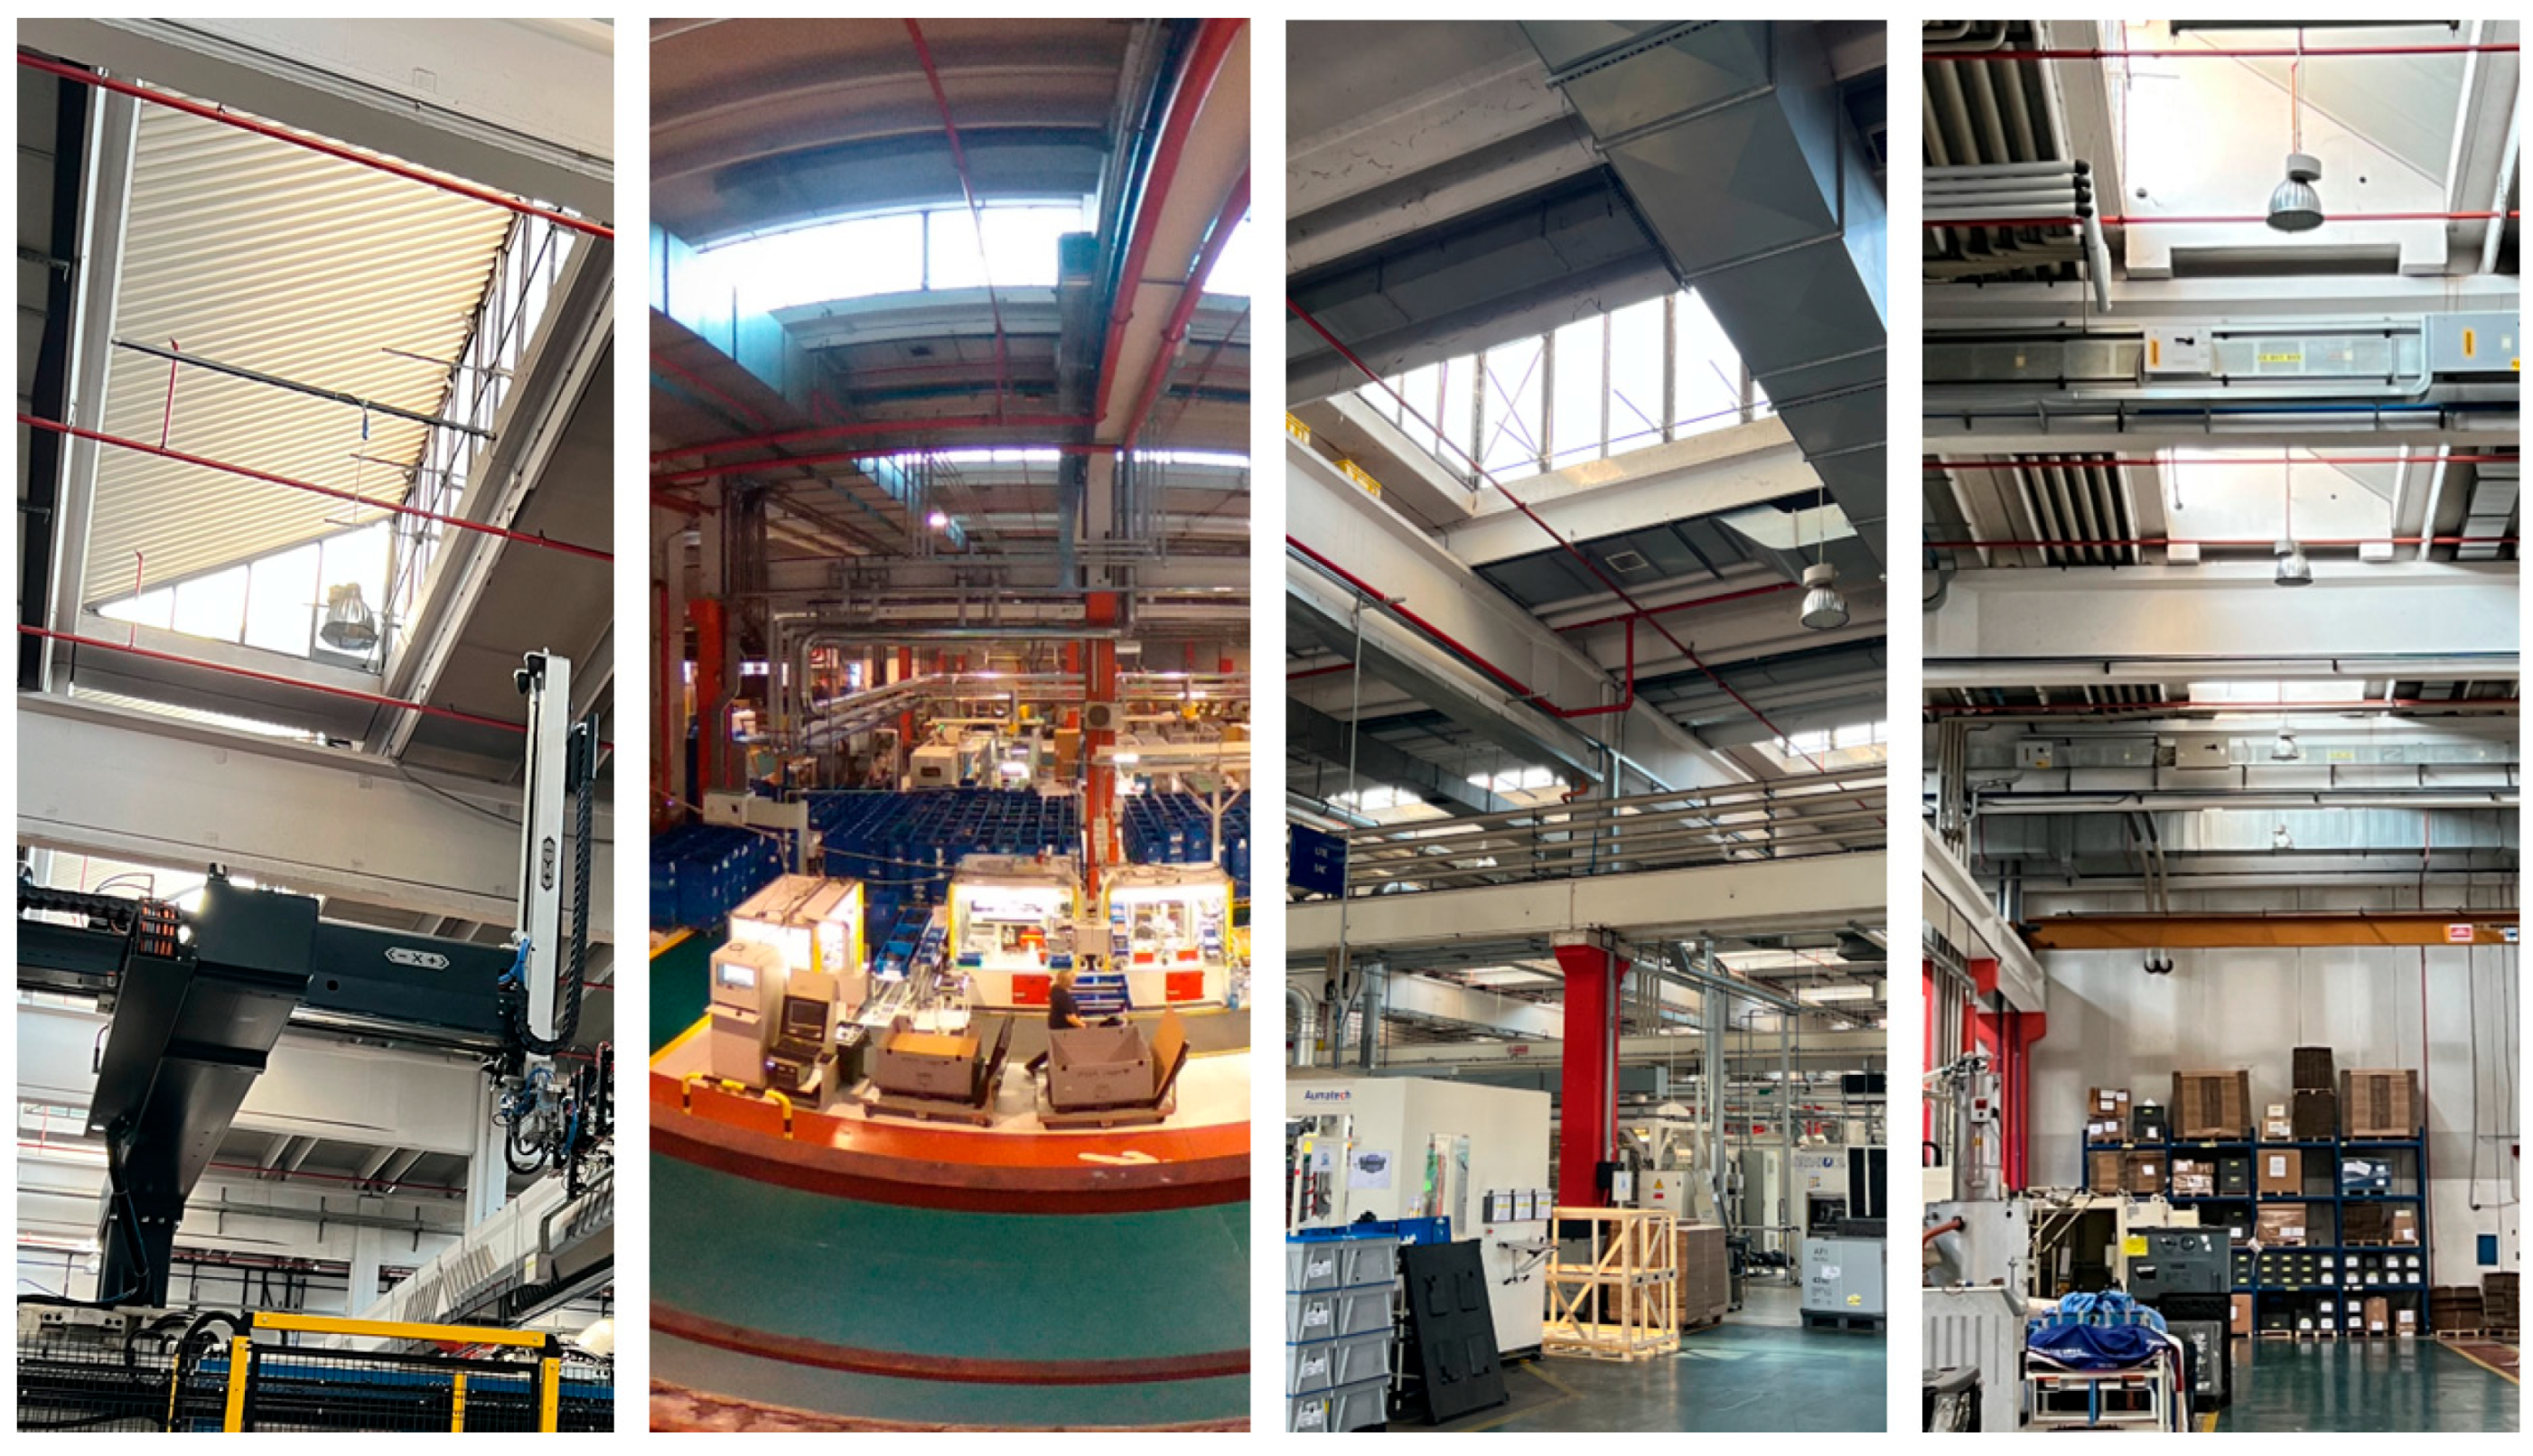
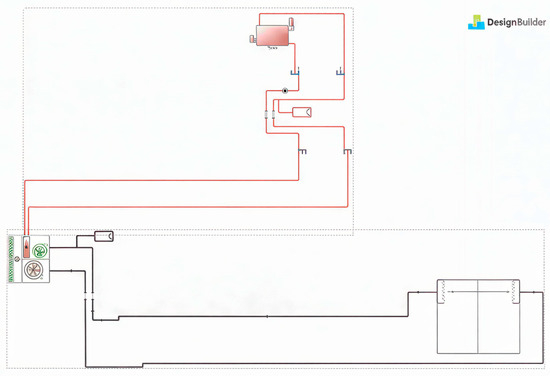
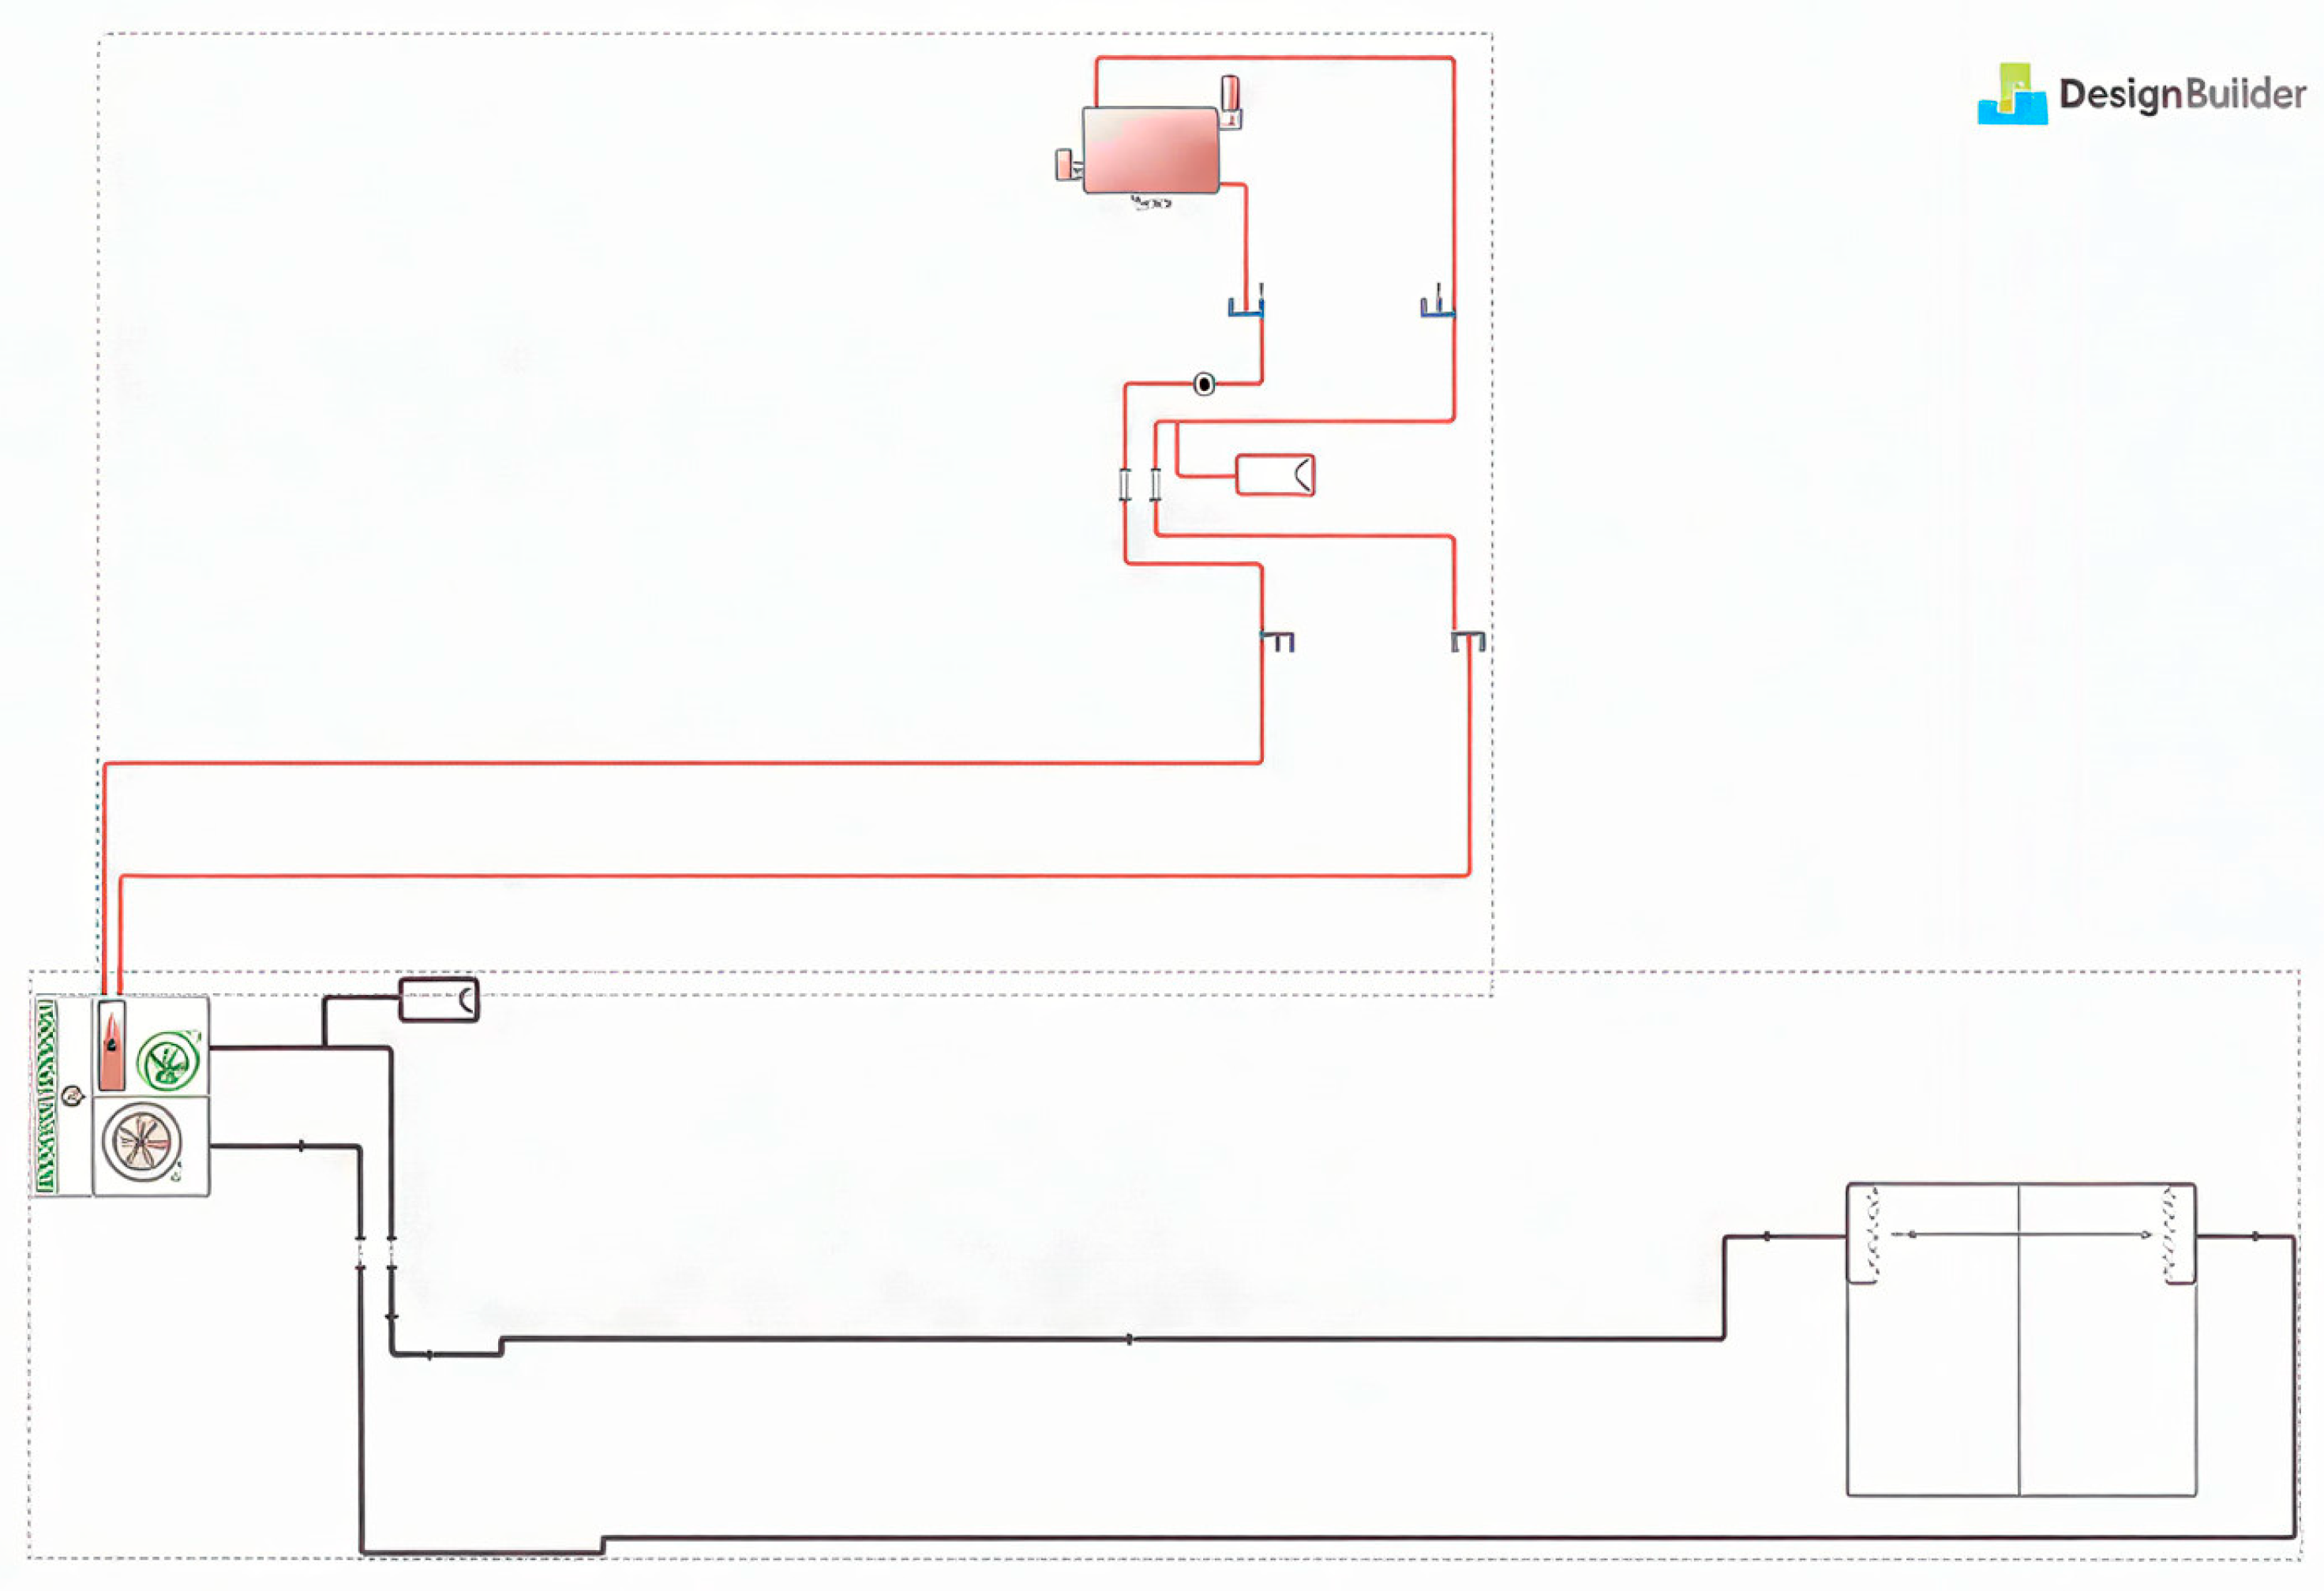
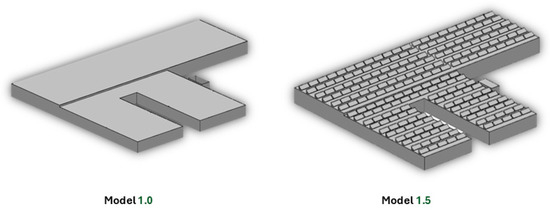
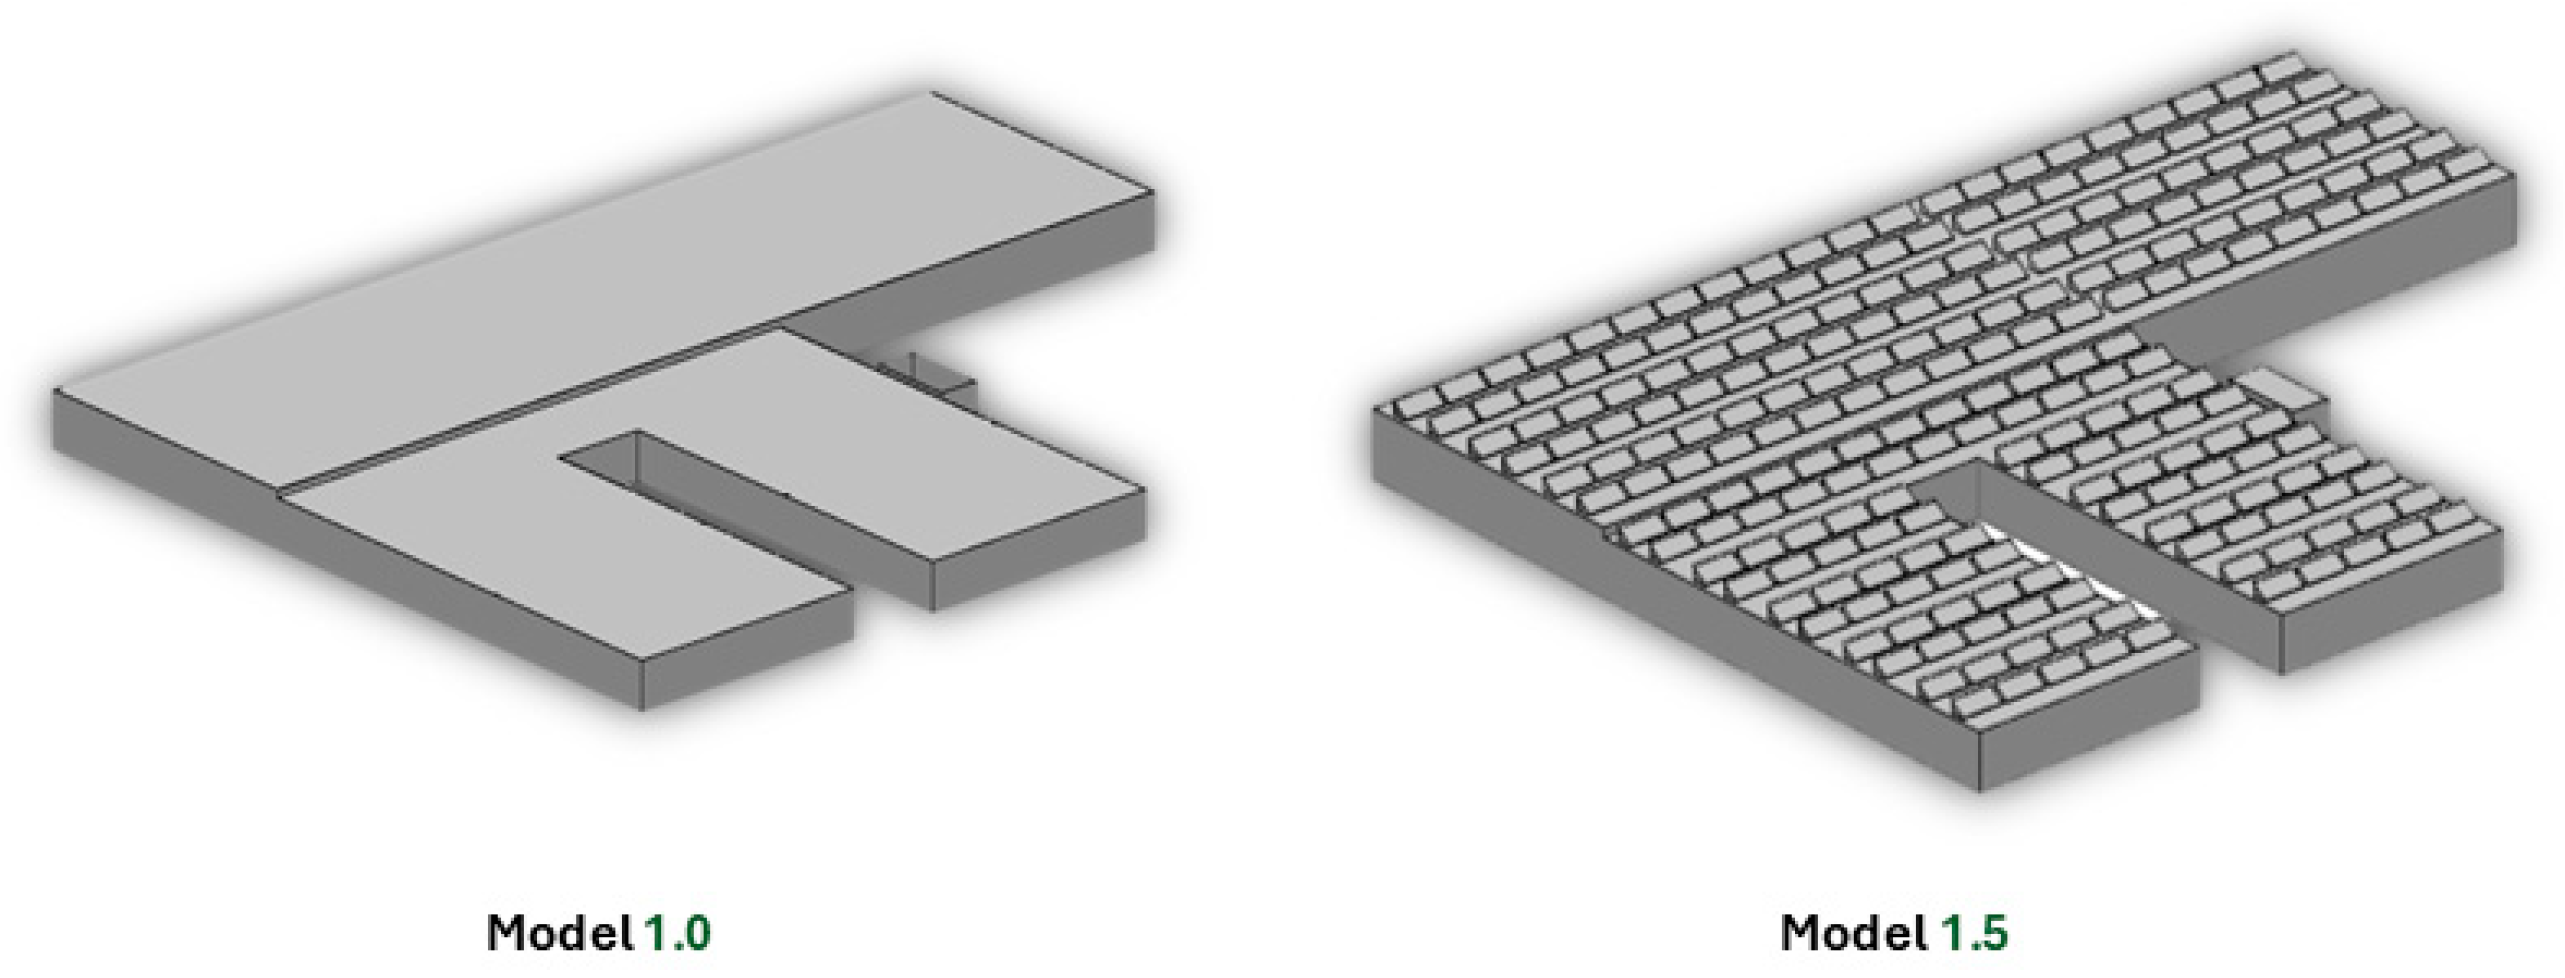
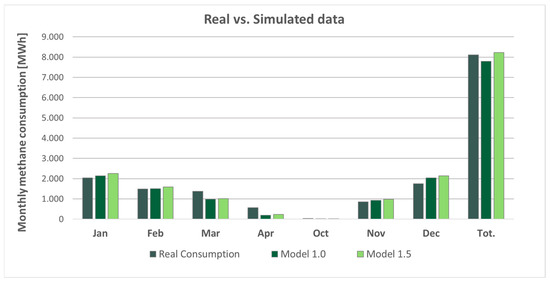
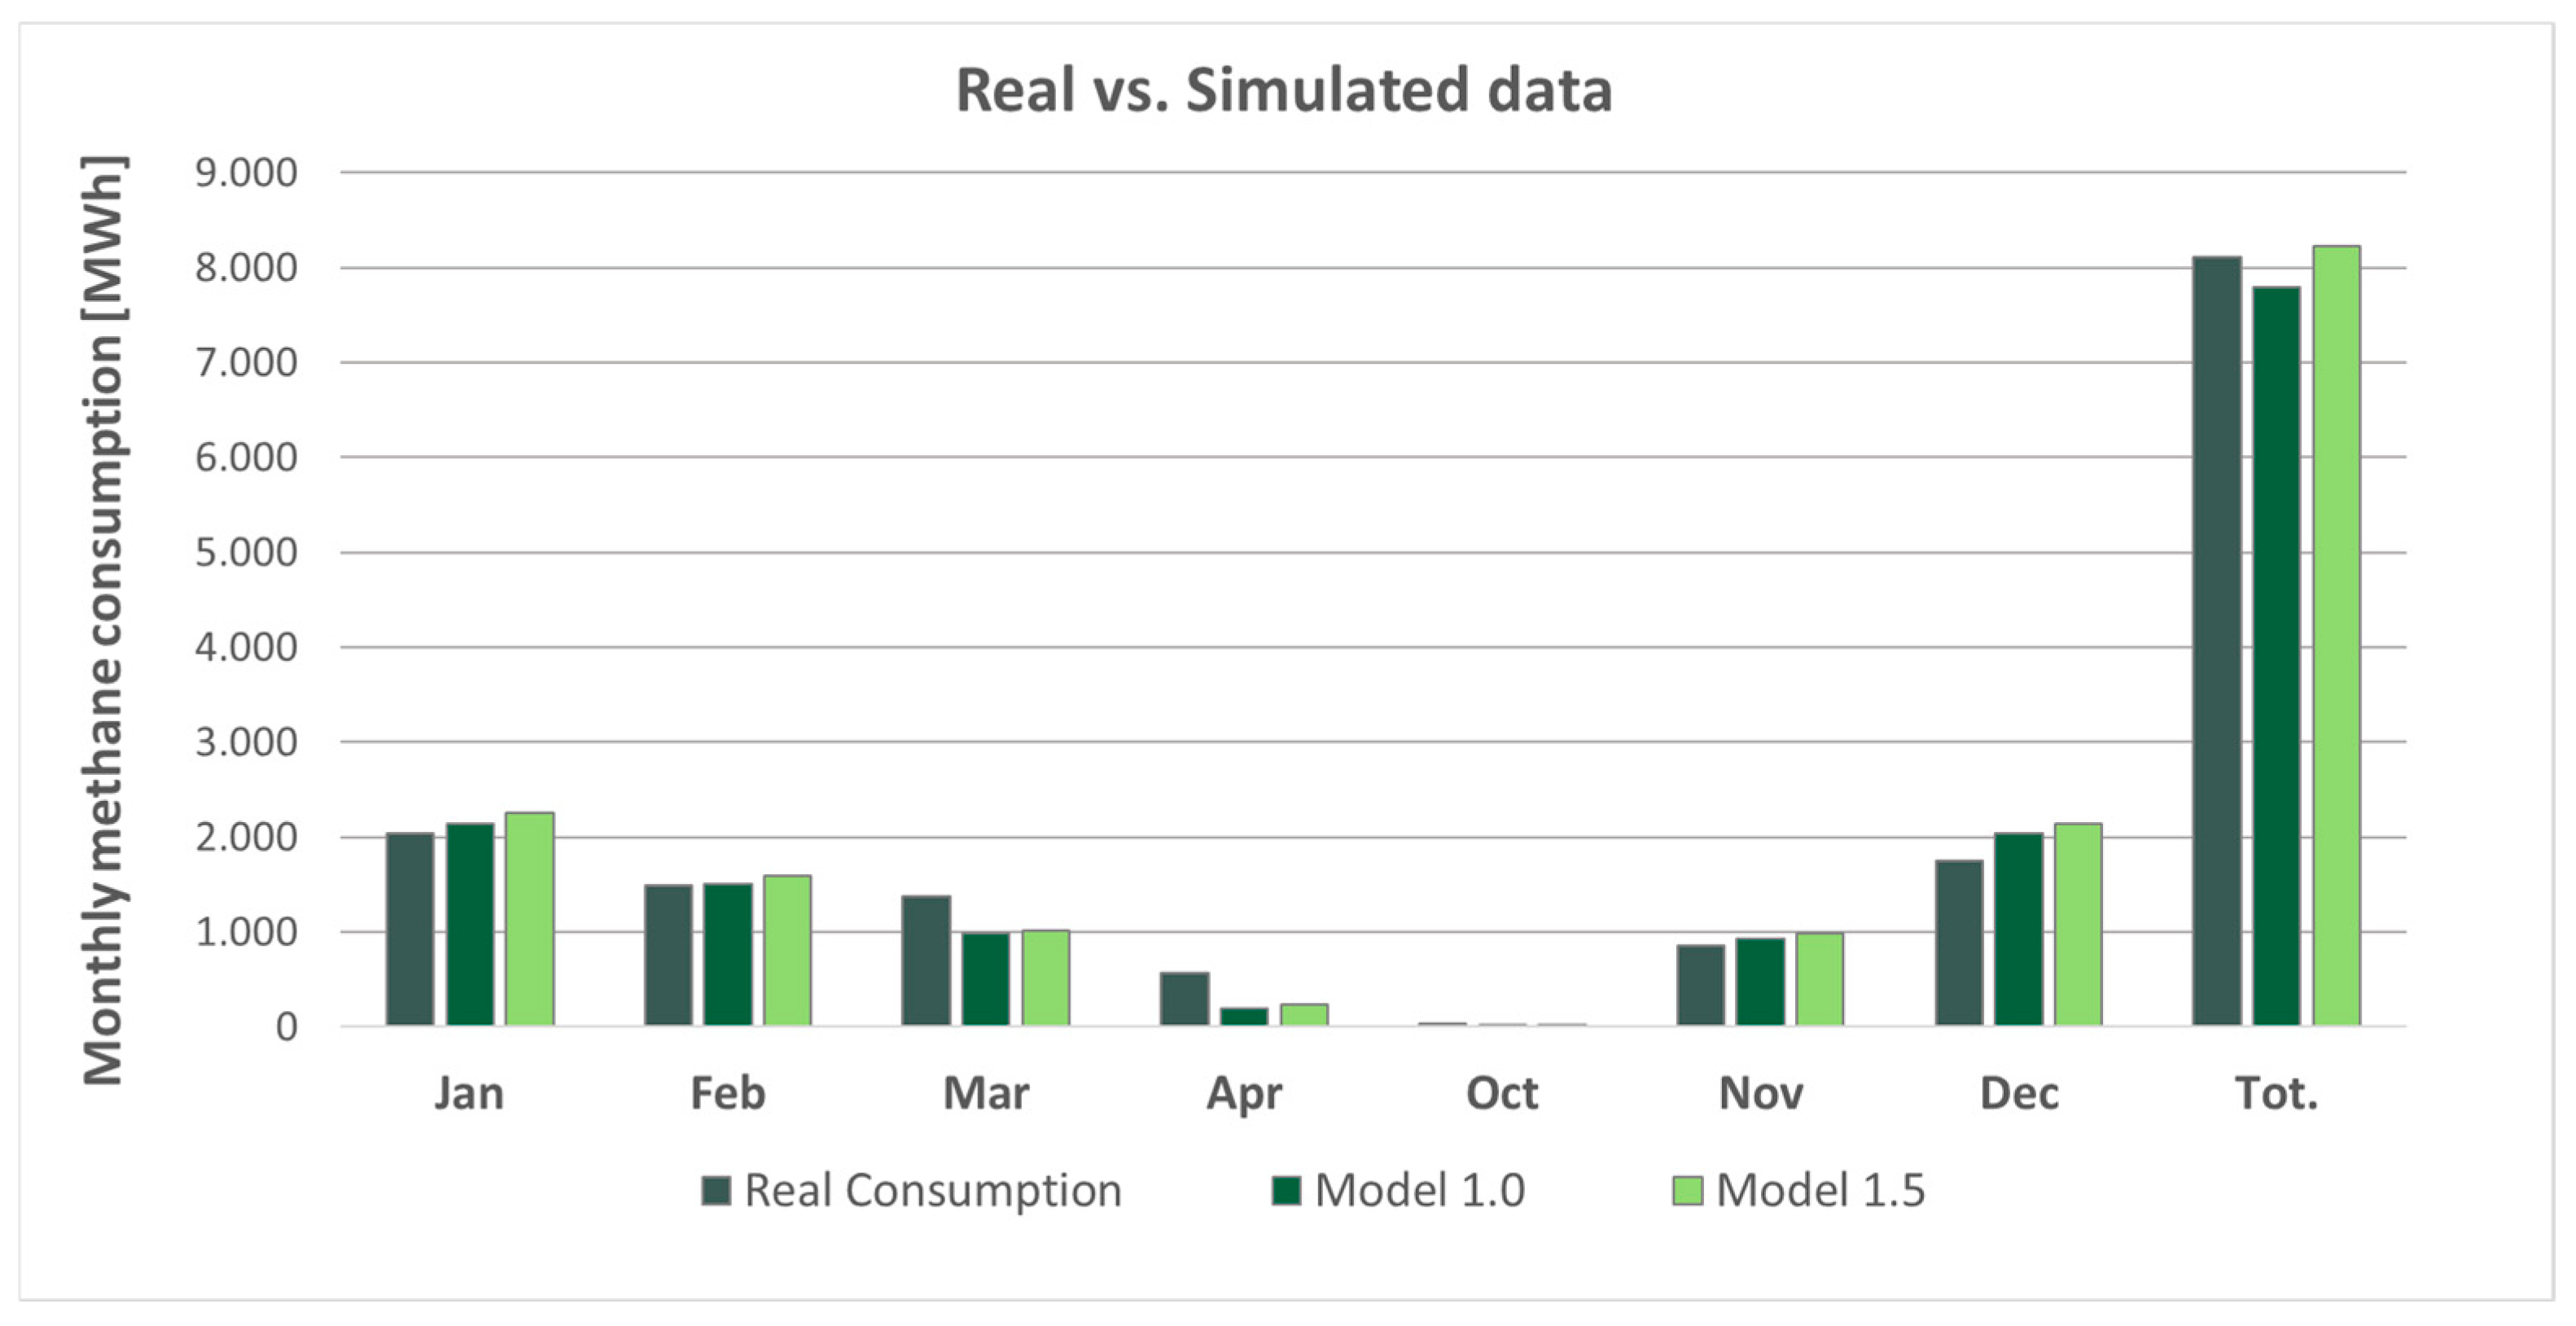
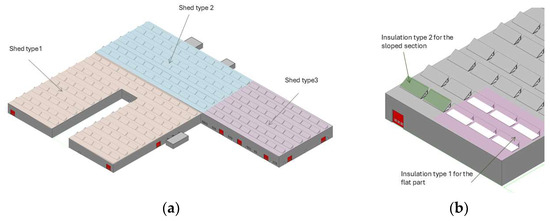
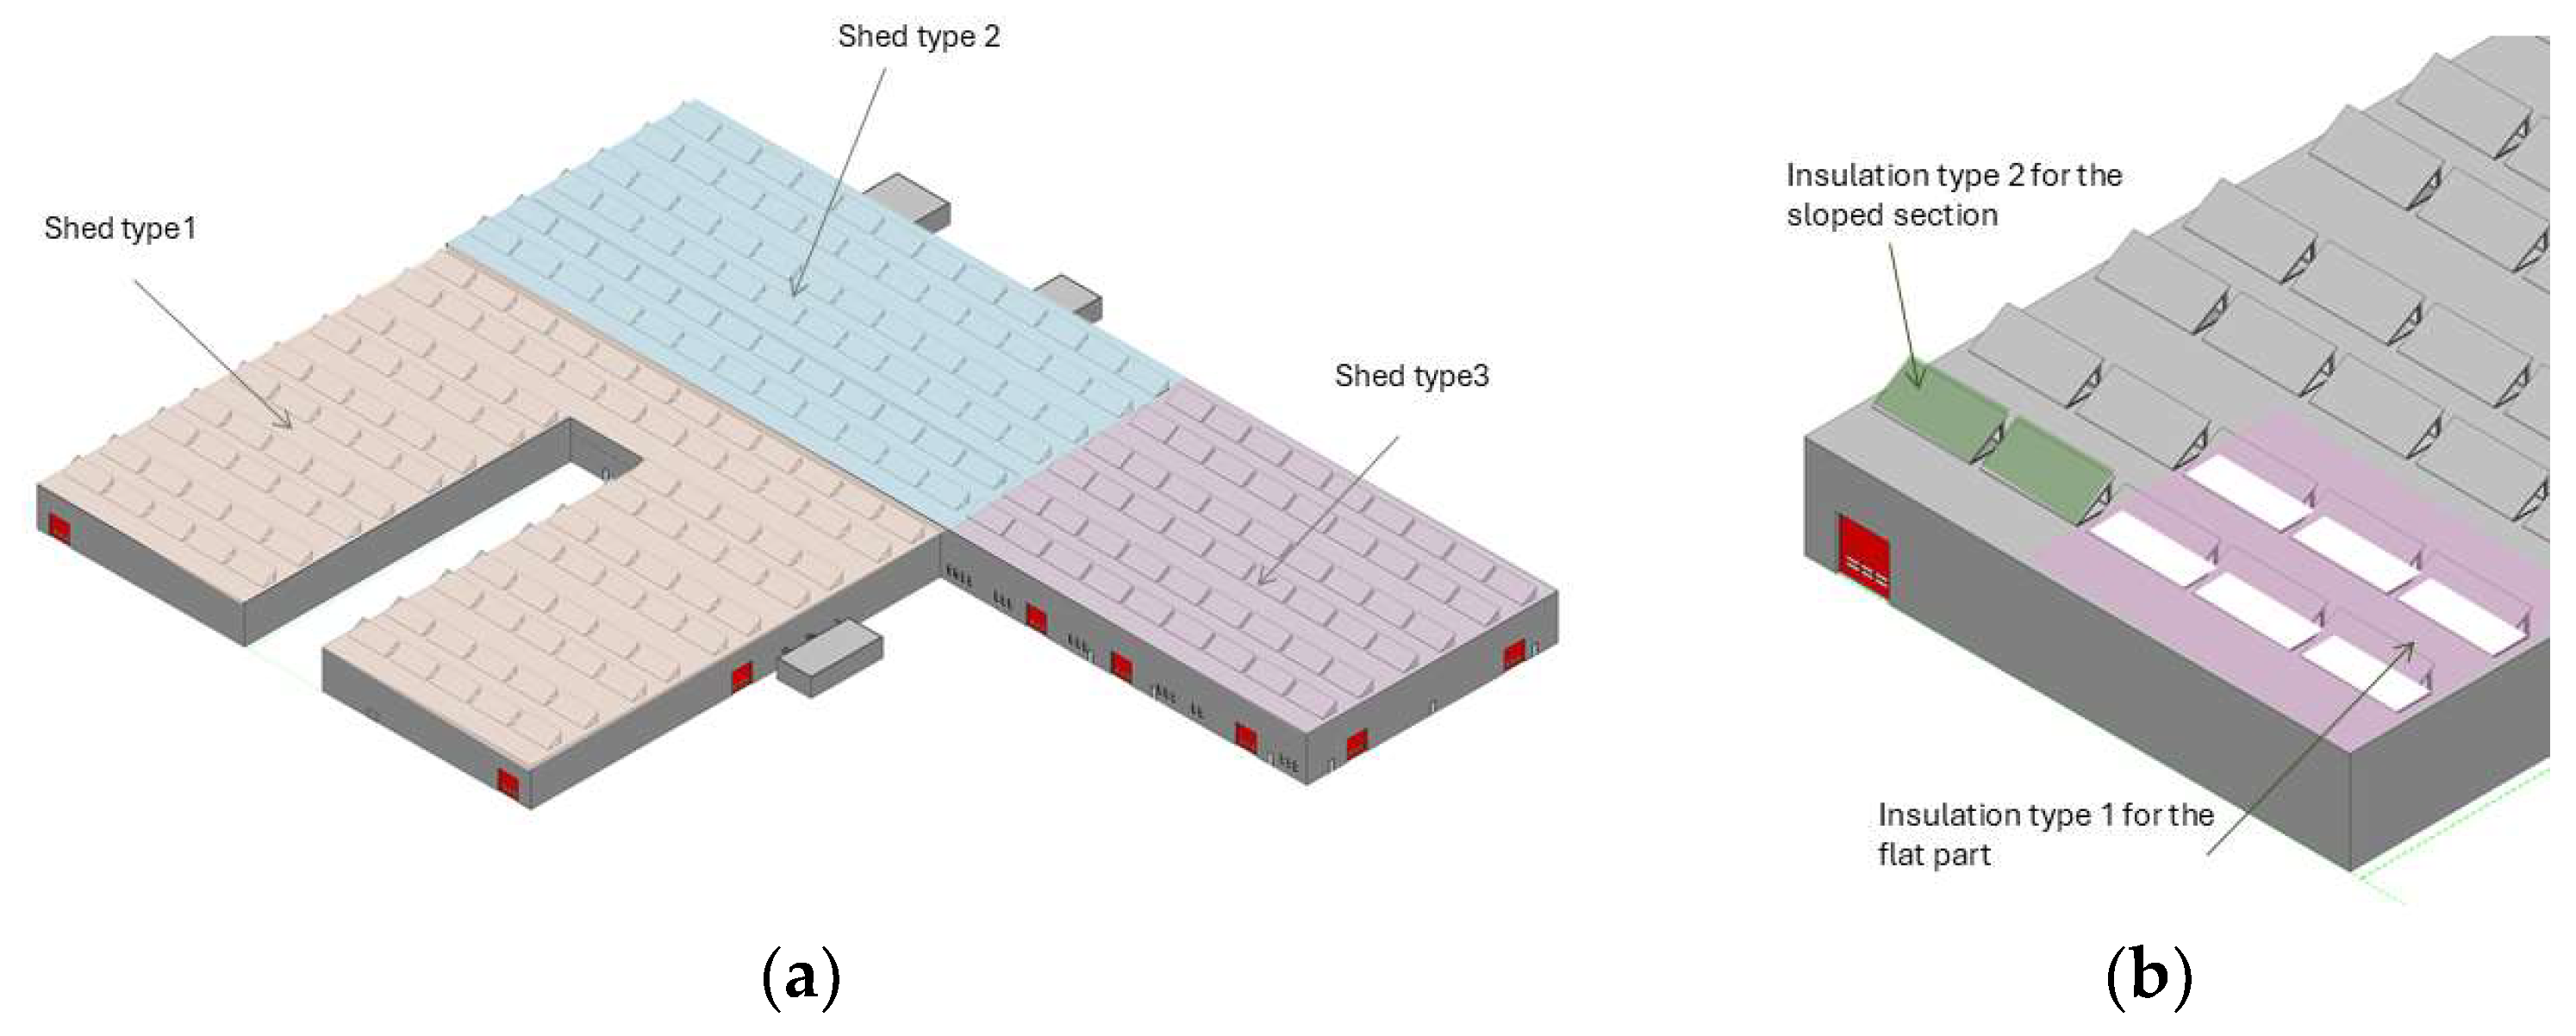
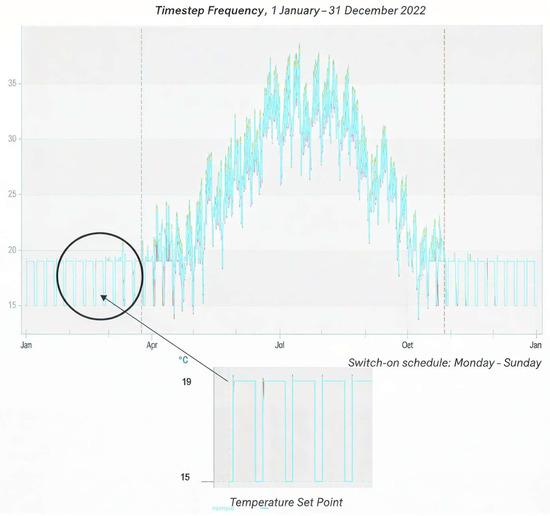
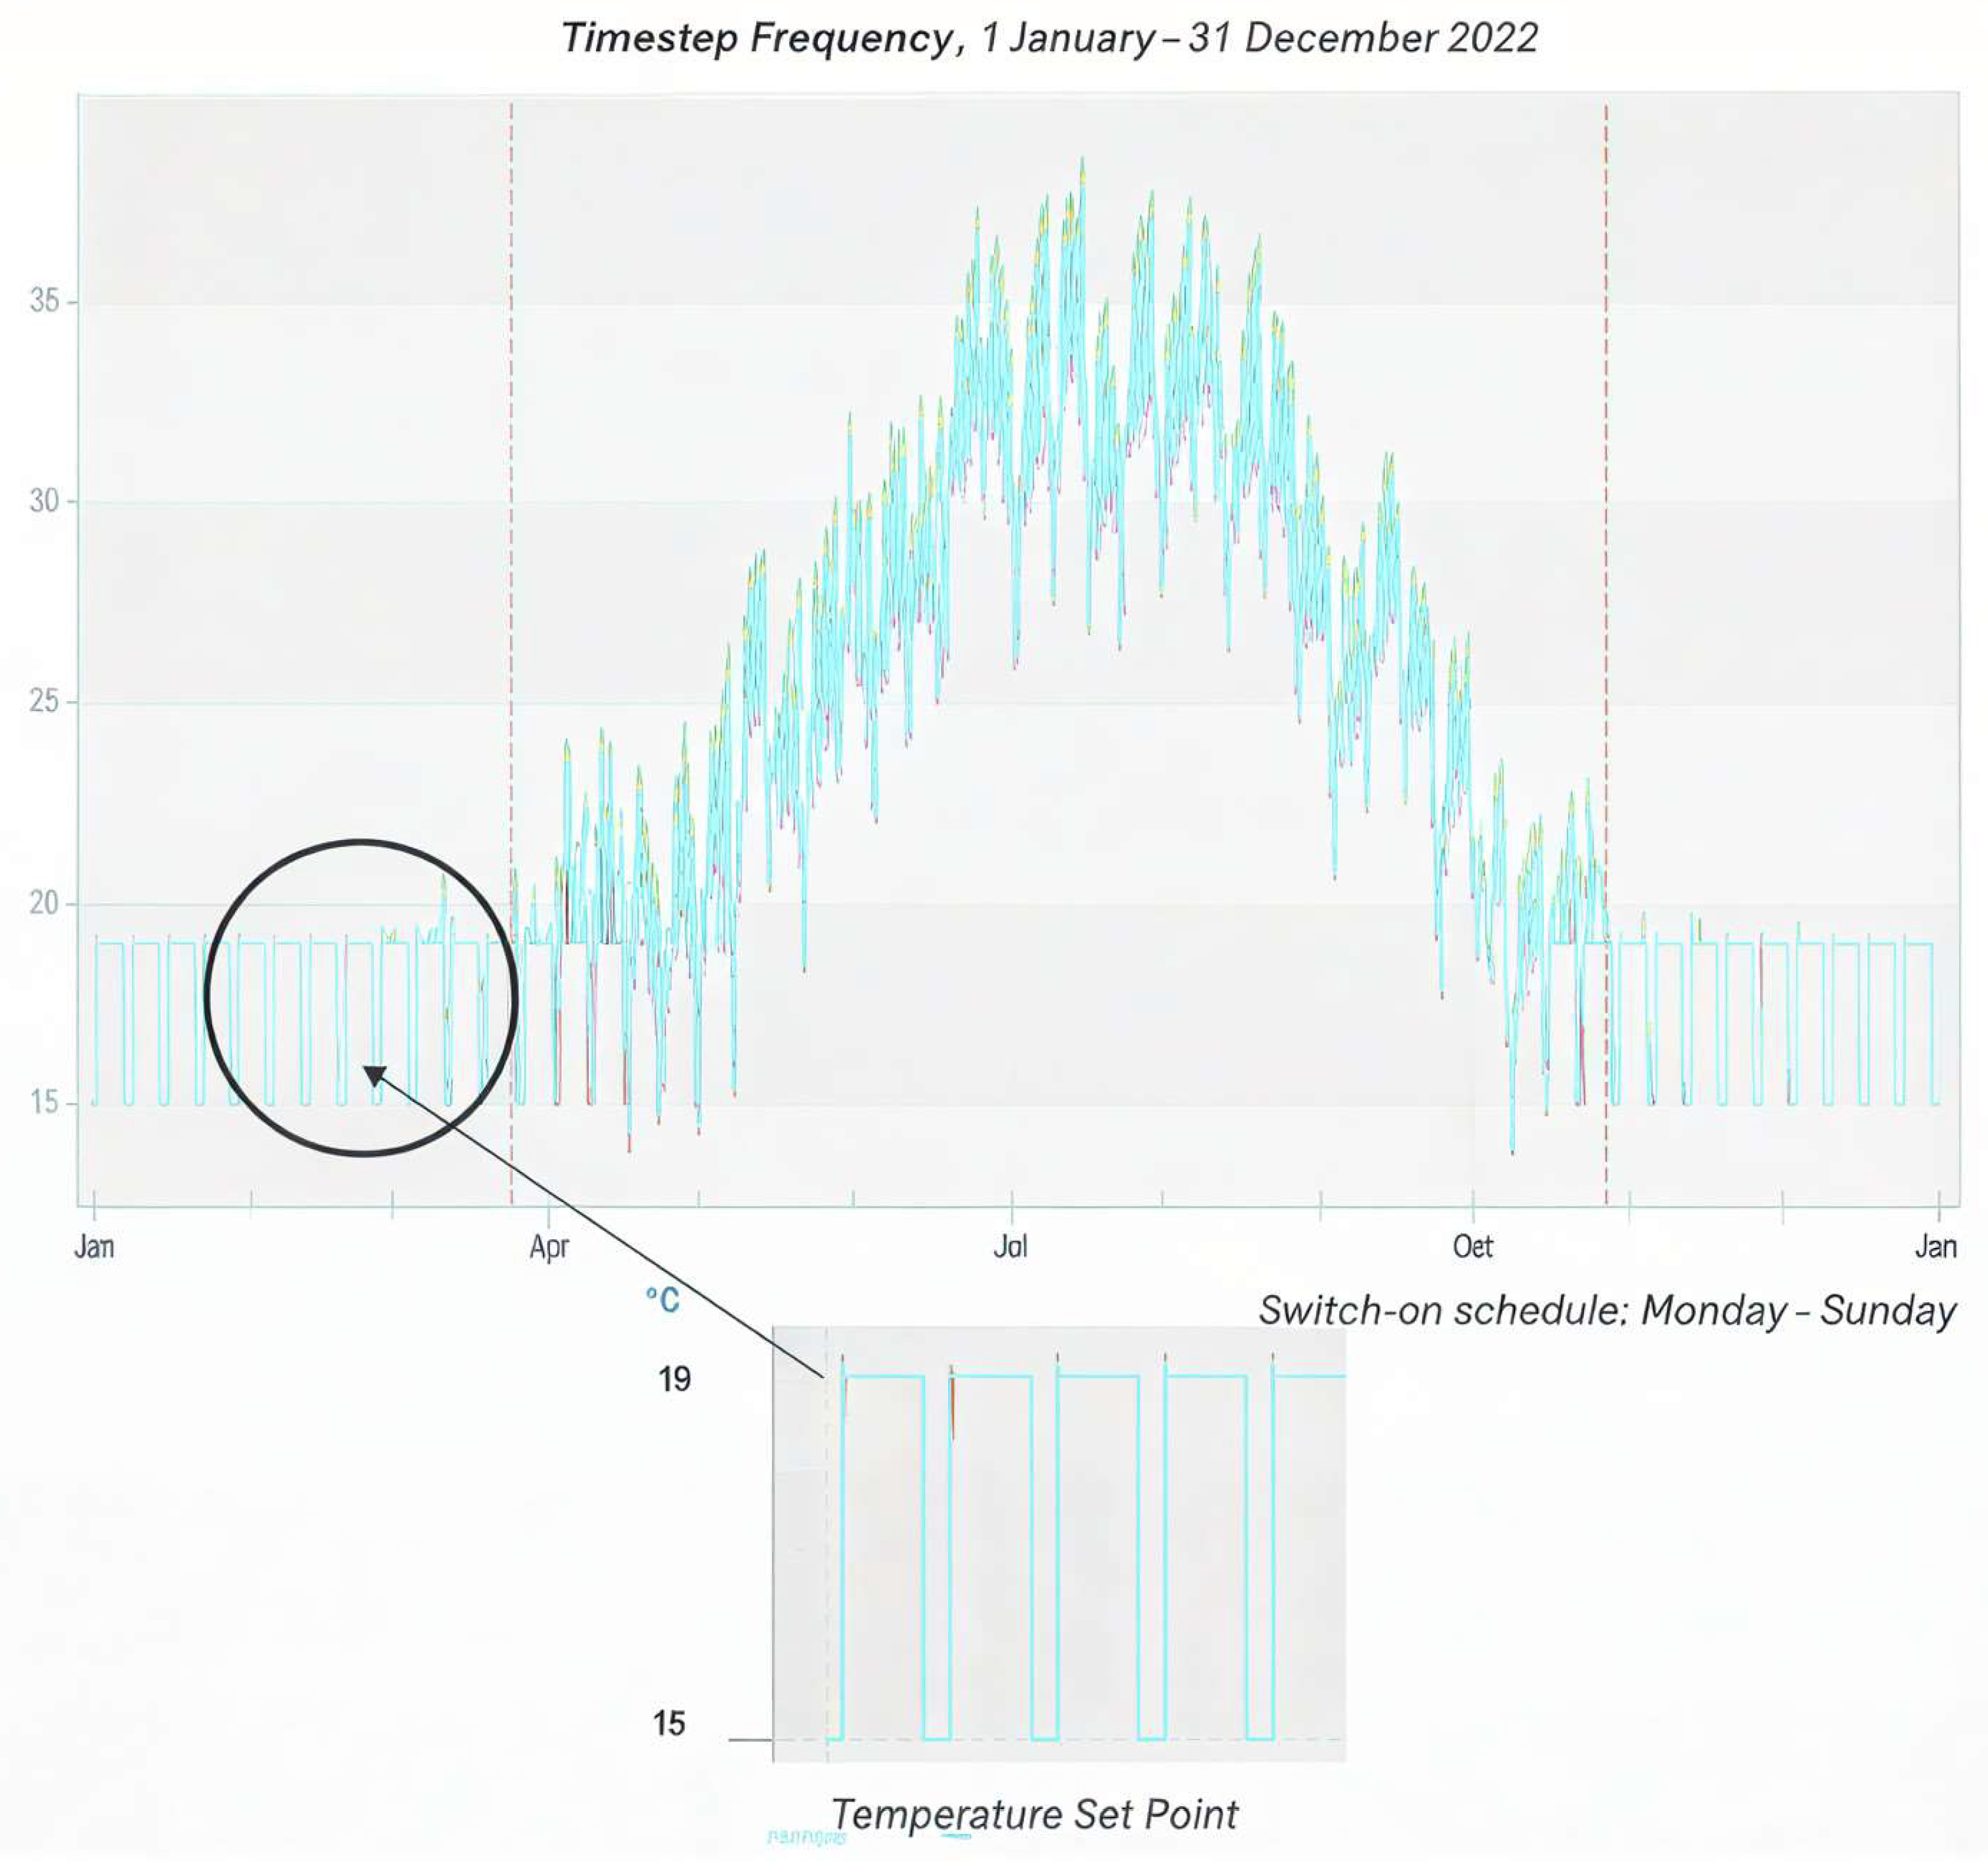
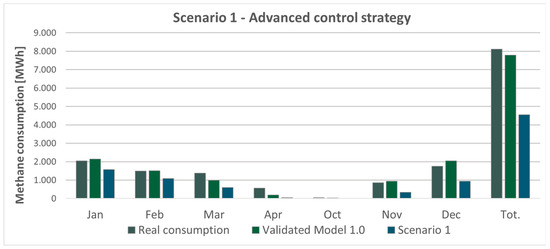
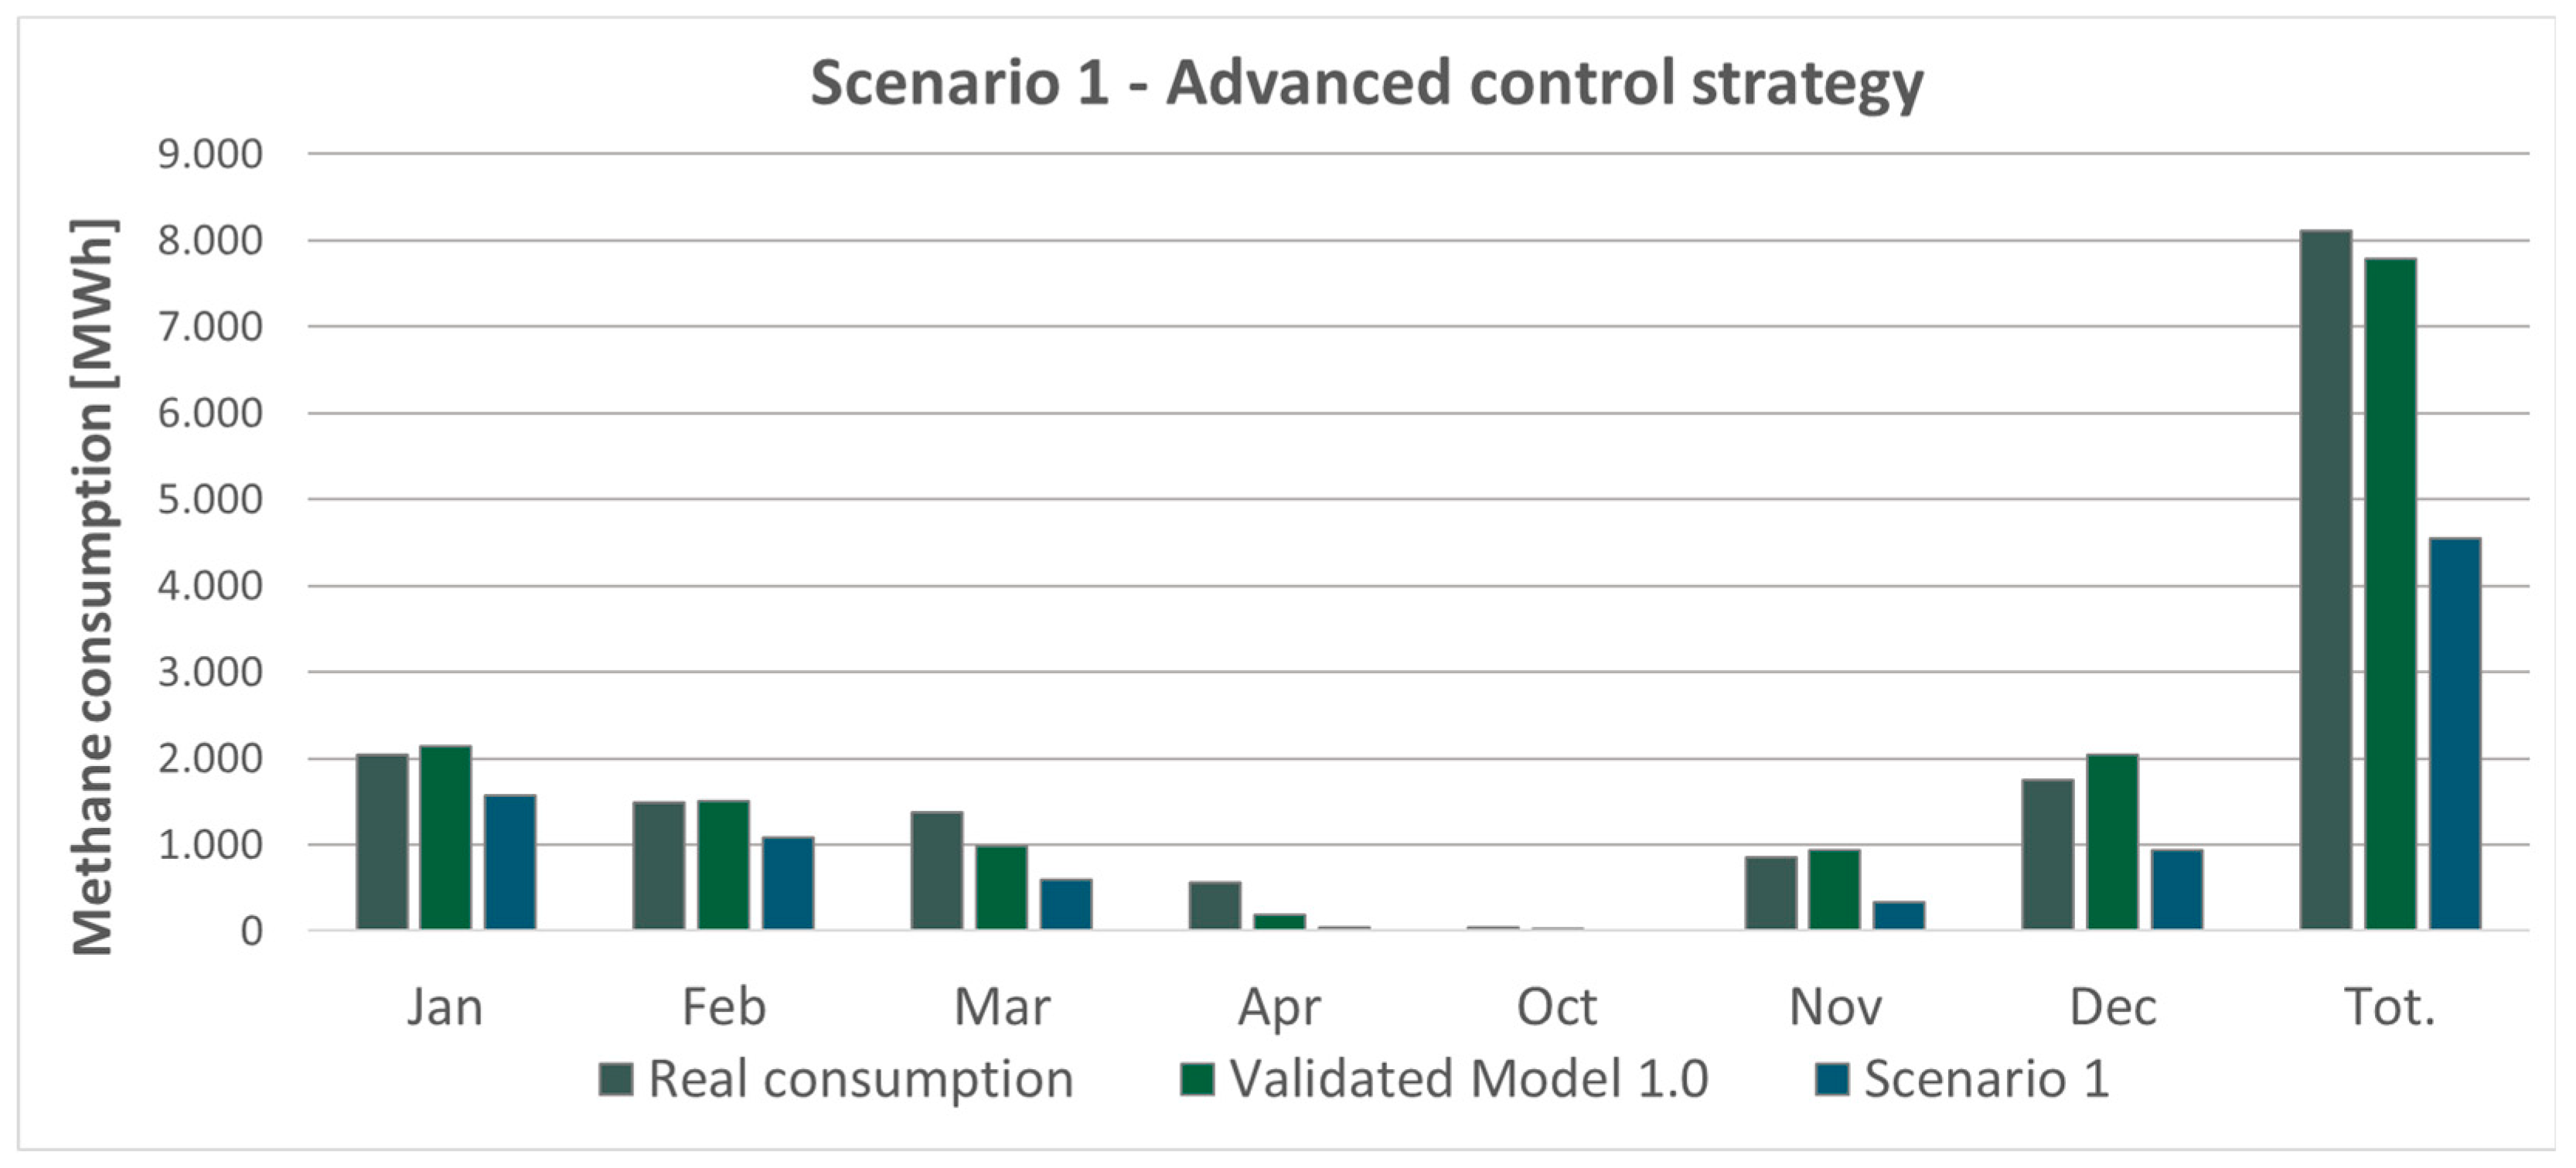
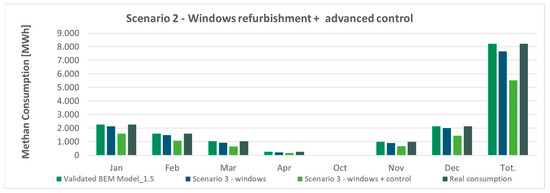
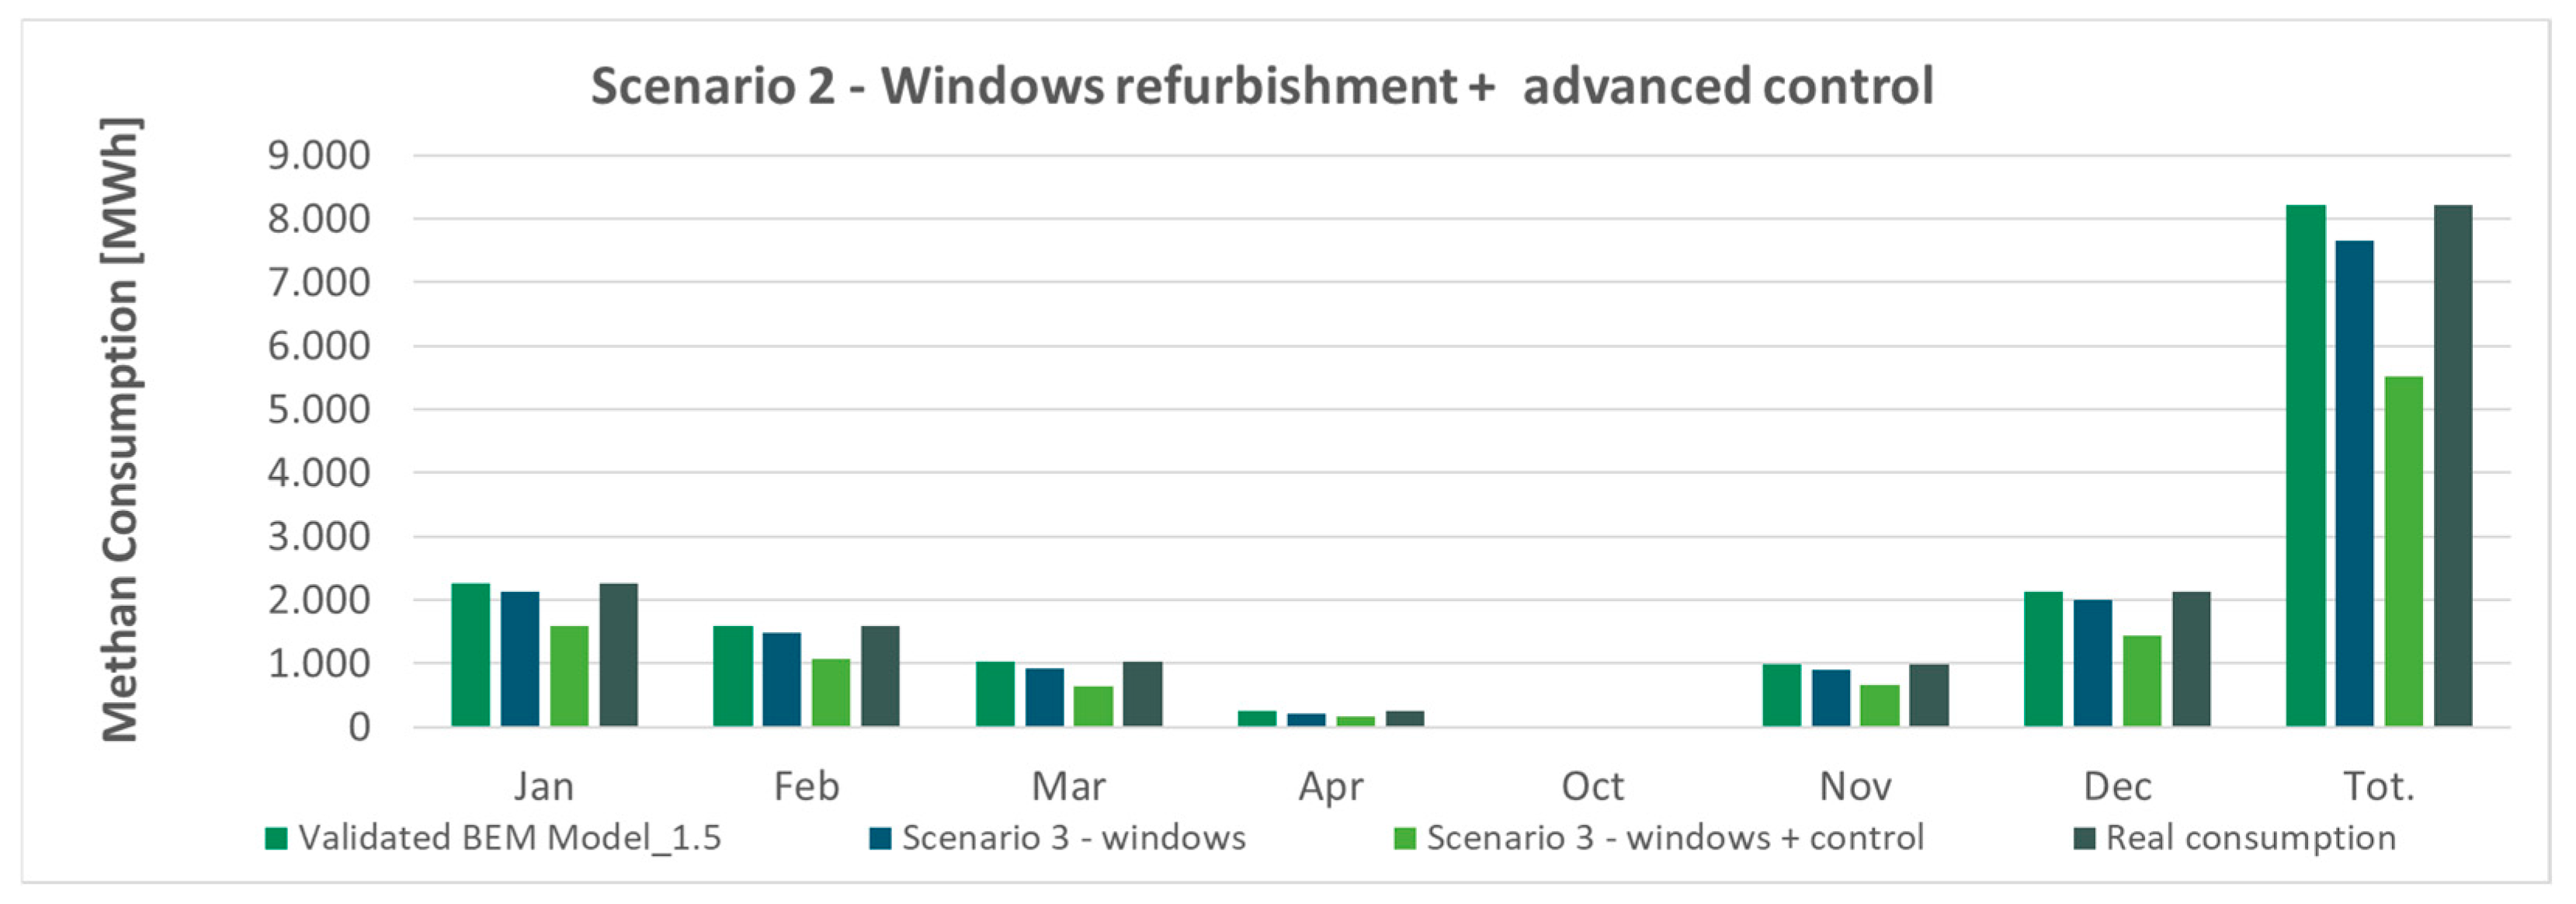
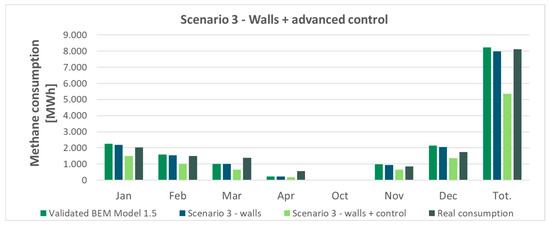
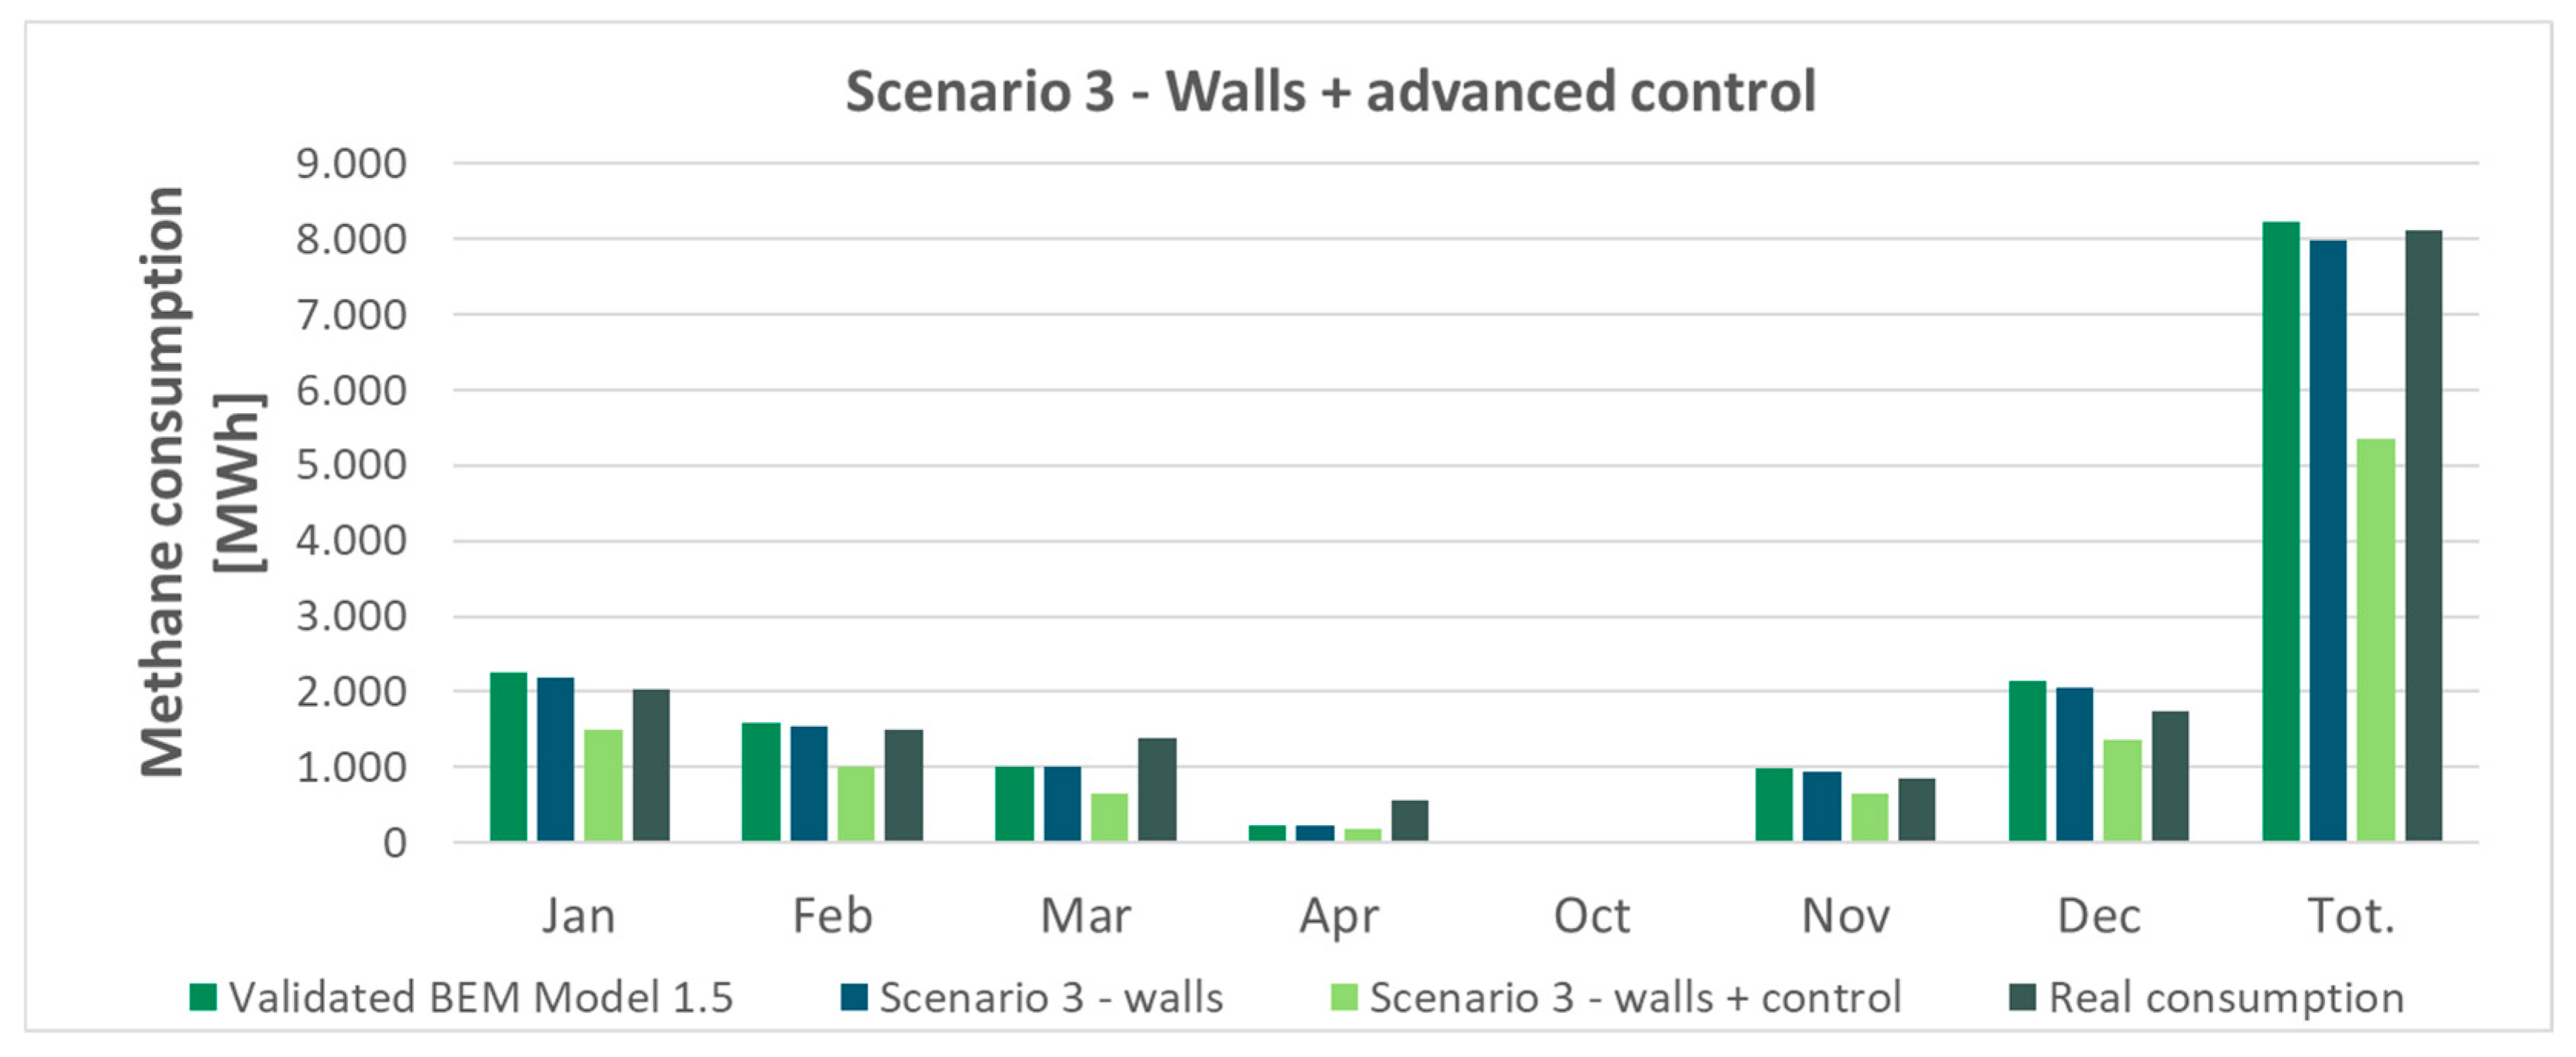
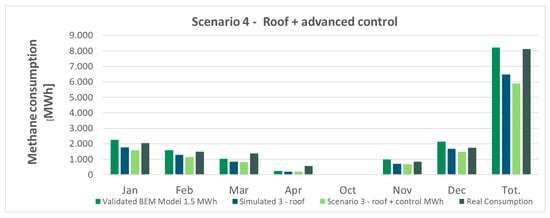
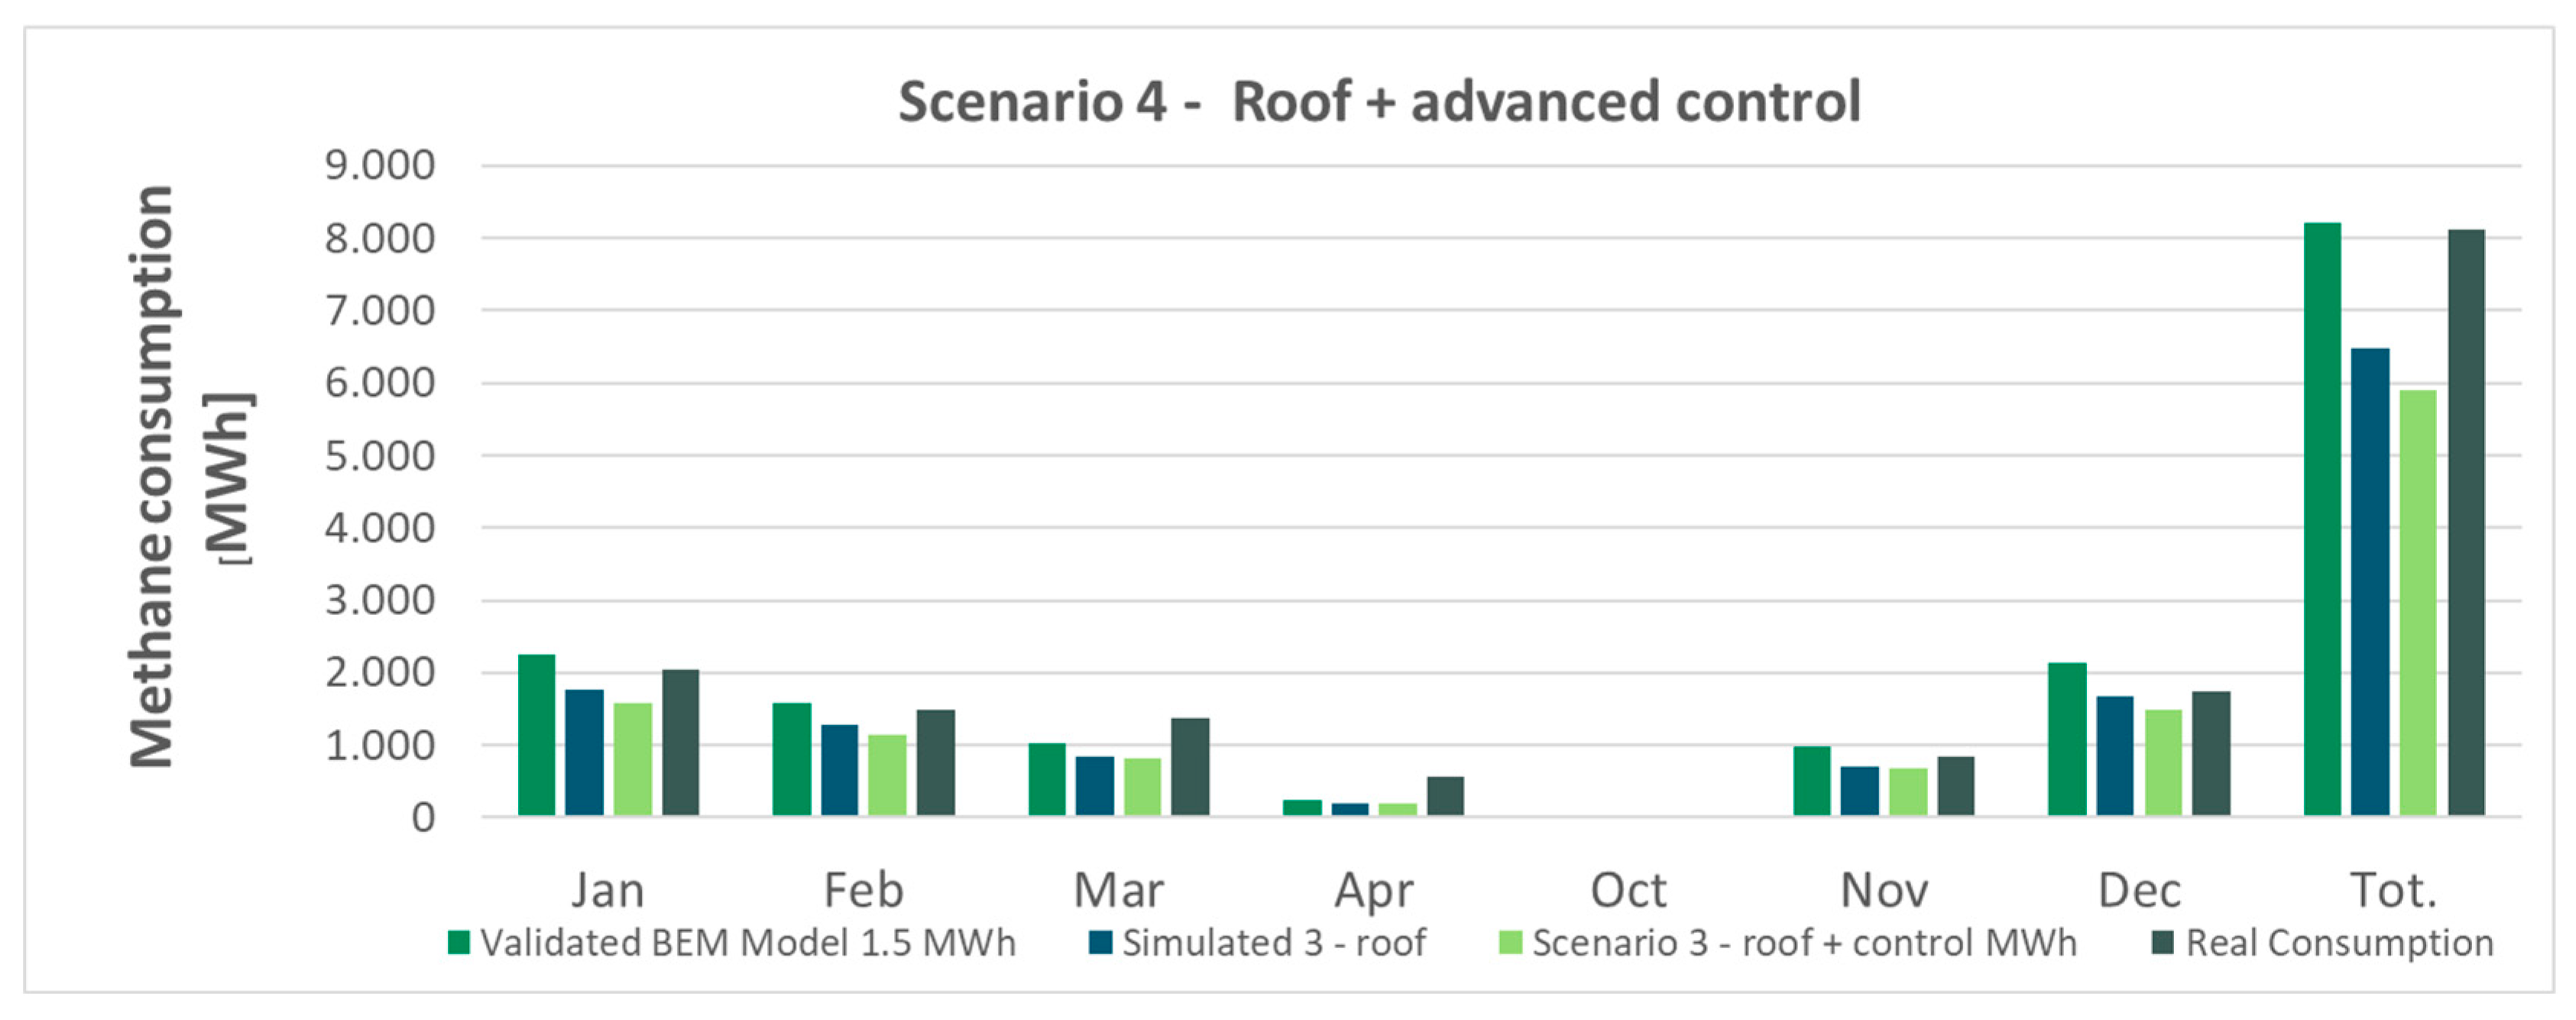
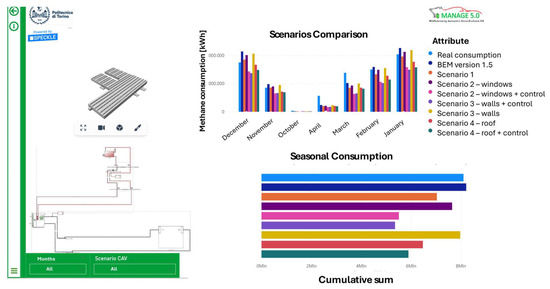
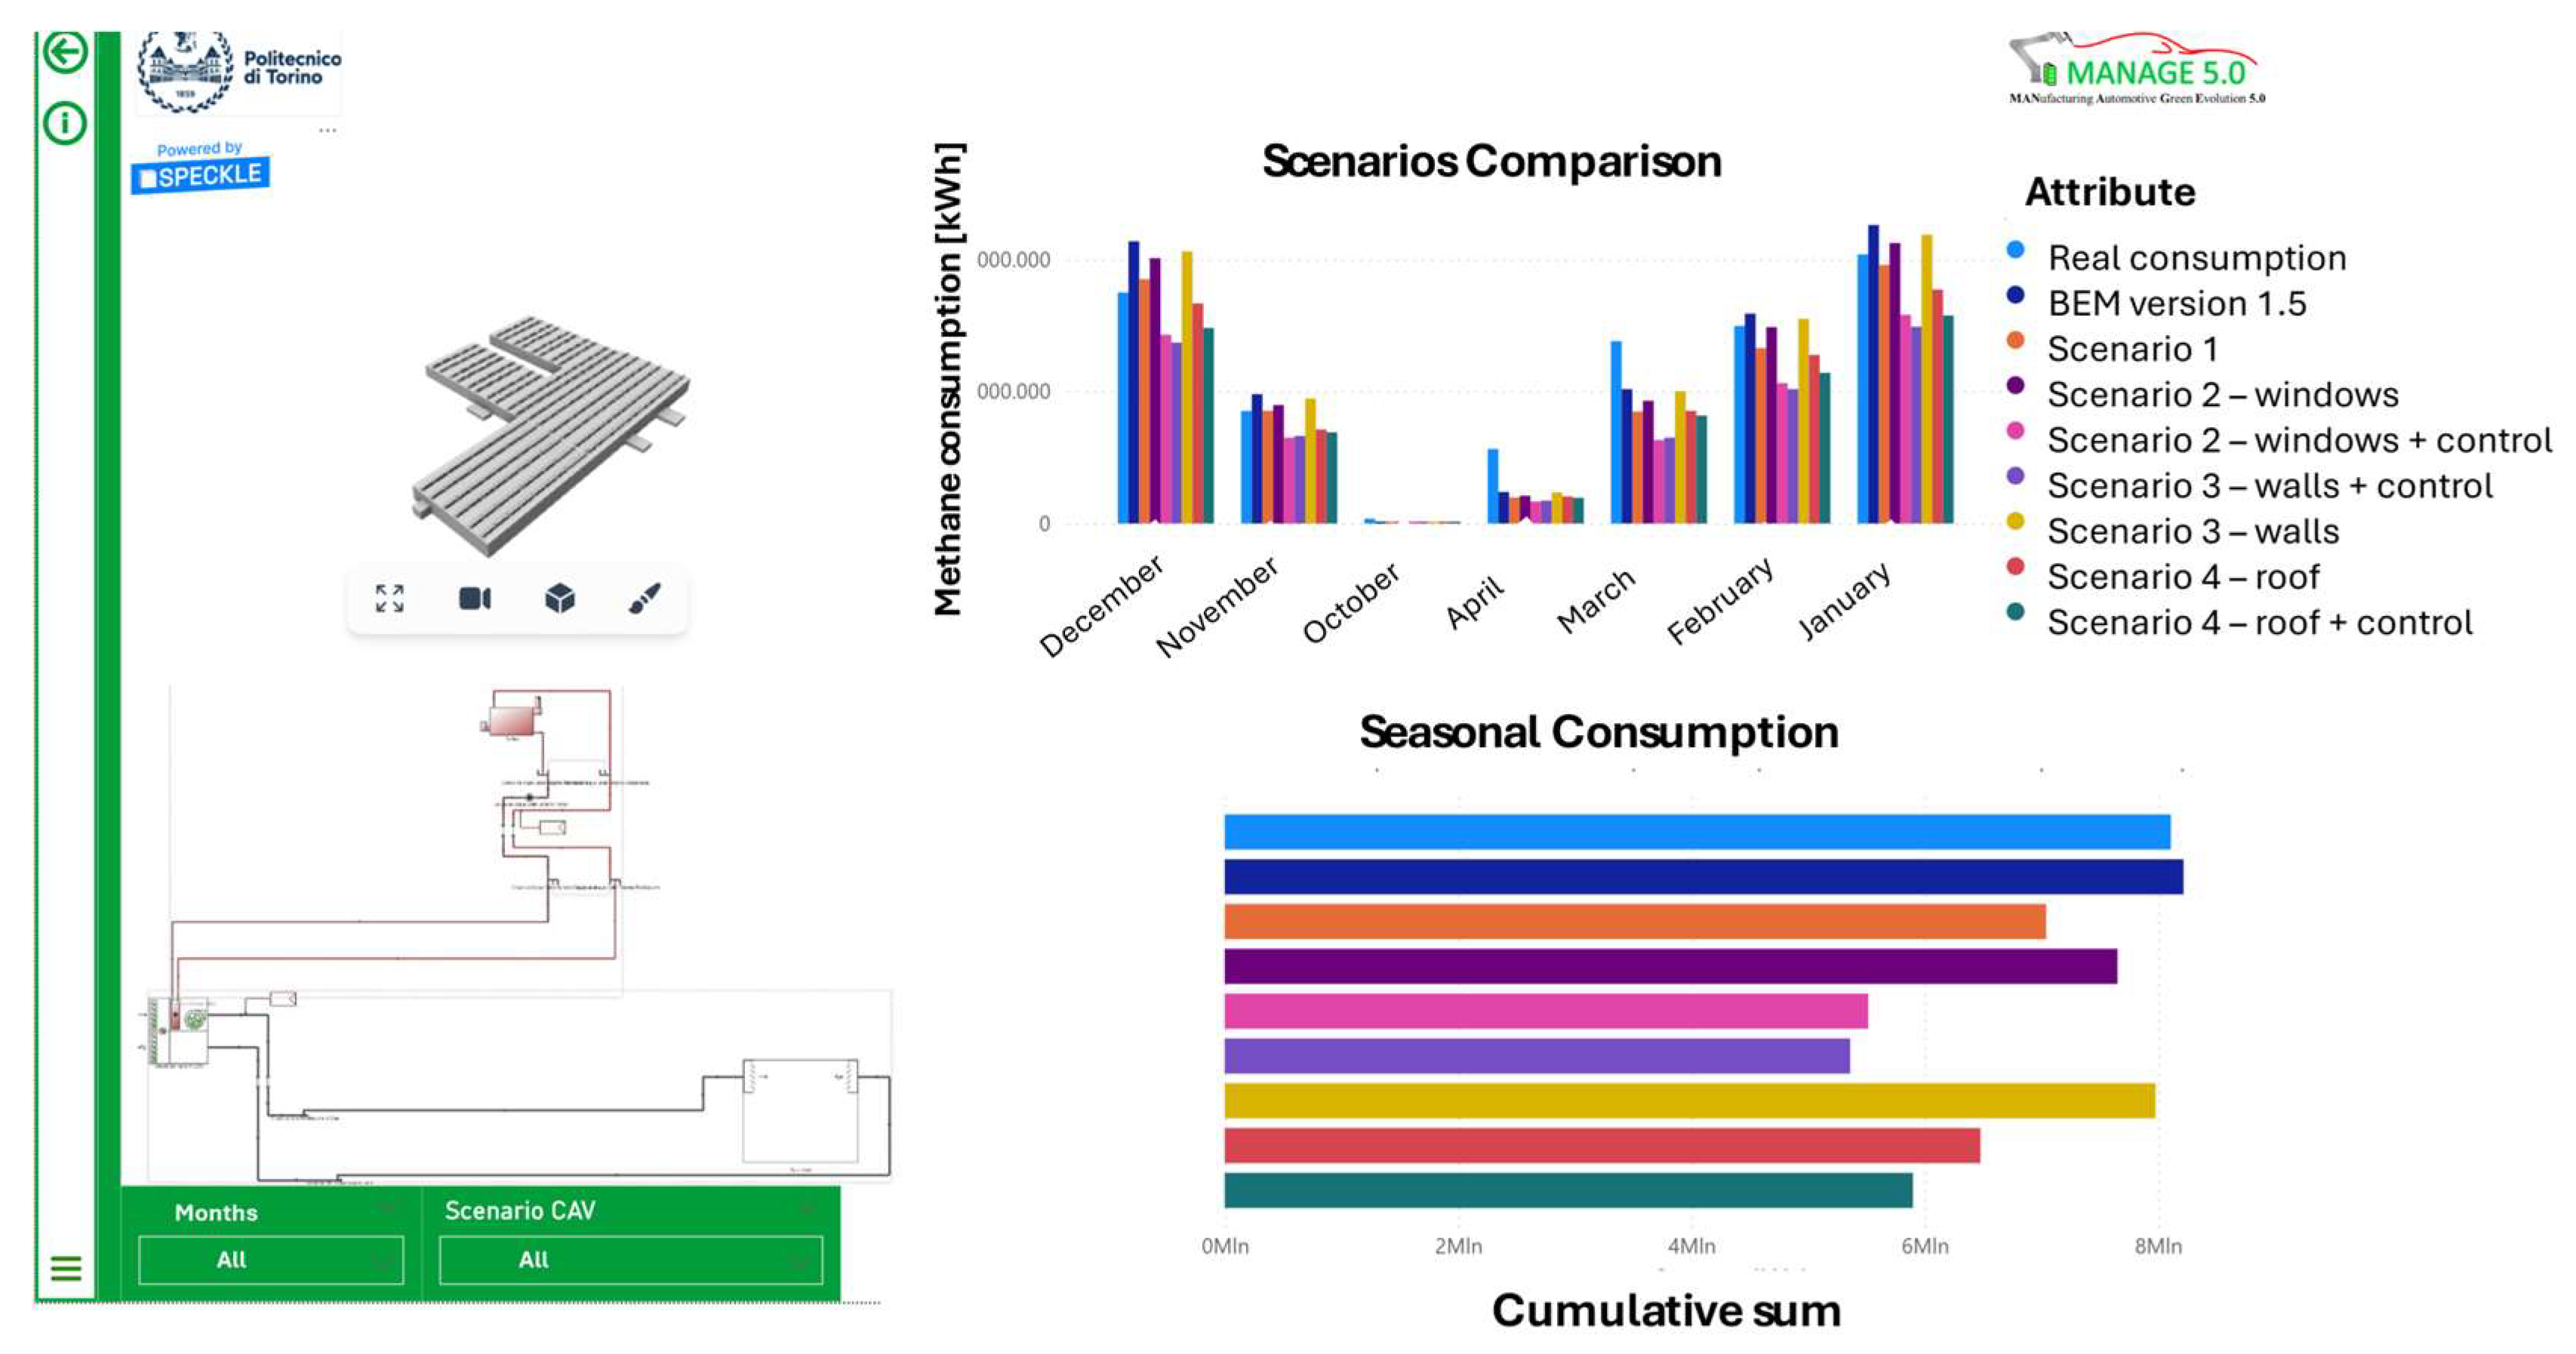

Disclaimer/Publisher’s Note: The statements, opinions and data contained in all publications are solely those of the individual author(s) and contributor(s) and not of MDPI and/or the editor(s). MDPI and/or the editor(s) disclaim responsibility for any injury to people or property resulting from any ideas, methods, instructions or products referred to in the content. |
© 2026 by the authors. Licensee MDPI, Basel, Switzerland. This article is an open access article distributed under the terms and conditions of the Creative Commons Attribution (CC BY) license.