


Abstract
Green technology supply chains combine rapid demand growth with concentrated production, uneven environmental performance, and exposure to trade disruption. This article links trade network analysis, next-year bilateral trade link prediction, multi-objective portfolio optimization, and disruption stress testing across 14 importing markets and six technology and material groups from 2015 to 2024. The cleaned sample contains 15,186 supplier-year observations and USD 696.1 billion in foreign supplier trade. Concentration rose most clearly in photovoltaic equipment, lithium-ion batteries, and wind equipment. In the chronological 2022–2023 test, gradient boosting achieved ROC AUC 0.911 and a Brier score of 0.119. Logistic regression produced slightly higher AUC, while persistence retained the strongest F1. Event-specific tests show that exits and reactivations are more predictable than rare first observed entries. A historical decision comparison finds only a small and statistically uncertain advantage of calibrated gradient boosting over calibrated logistic regression, while predictive continuity information improves allocation performance relative to a specification without the probability term. Latest-year portfolios remain highly concentrated, with median HHI of 0.632 and a median top-three supplier share of 95.5%. Under balanced priorities, median HHI falls by 53.7%, and sourcing exposure to supplier-country CO2 intensity of GDP falls by 32.3%. These changes are accompanied by a 5.2% median unit value increase and a 4.8 percentage point decline in predicted next-year link activity. Joint supplier budget scenarios show that individually feasible national diversification plans can compete for the same alternatives. The framework provides a transparent basis for screening sourcing options, identifying cases that require supplier-level verification, and assessing where coordinated investment may be needed.
1. Introduction
The transition to low-carbon energy systems is creating a distinctive supply chain paradox. Technologies intended to reduce environmental pressure depend on production networks that are geographically concentrated, environmentally heterogeneous, and exposed to policy, logistics, and governance disruptions. The International Energy Agency reports that concentration in critical mineral refining has continued to rise, with the three largest refining countries accounting for an average 86% share across key energy minerals in 2024 [1]. Trade policy exposure has also intensified. Recent OECD evidence indicates that export restrictions cover a meaningful and growing share of critical raw material trade [2,3]. These pressures span mined inputs and manufactured components. Solar modules, batteries, wind components, and processed materials move through production systems in which a small number of supplier economies can shape costs, emissions, and the feasibility of industrial decarbonization. A sourcing decision that looks efficient under stable conditions may become fragile when a supplier exits, a trade route closes, or a sustainability criterion becomes binding.
Sustainable supply chain transformation therefore requires two related decisions. The first is to assess which bilateral commercial relationships are likely to remain active. The second is to allocate purchases across feasible suppliers while balancing price, environmental exposure, labor conditions, distance, and institutional risk. Artificial intelligence can support the first decision by identifying nonlinear patterns in trade history and country attributes. The resulting probabilities become decision inputs only after they are combined with explicit priorities and sourcing constraints.
Diversification is useful only when alternative suppliers are commercially plausible and can absorb additional demand. This introduces a system-level concern because several importing markets may turn to the same alternative suppliers at the same time. The empirical design therefore moves from concentration and prediction to constrained allocation and then to tests of individual and shared feasibility.
Research on sustainable supply chain management has established that environmental, social, and economic objectives should be integrated into interorganizational decisions [4,5,6]. Resilience research has shown why redundancy, flexibility, and network design matter under disruption [7,8,9,10]. A parallel literature applies machine learning, big data analytics, and artificial intelligence to forecasting, risk identification, and operational coordination [11,12,13,14]. Yet these streams often remain separated. Descriptive trade studies identify concentration, predictive studies assess accuracy, multicriteria studies rank supplier, and resilience studies simulate shocks. Fewer studies carry the same empirical unit from observed trade to time-ordered prediction into constrained allocation and post-allocation stress testing.
Green technology sourcing makes the trade-offs unusually sharp. Moving purchases away from a dominant supplier may lower dependency while raising embodied carbon, water stress, vulnerable employment, transport distance, or price. A low-carbon strategy may also rely on a narrow set of suppliers and weaken commercial continuity. The managerial question is how a particular allocation balances concentration, sustainability, institutional exposure, trade link persistence, and implementation effort. Portfolio logic treats supplier shares as an interdependent system [15,16], adapted here to the discrete structure of international supplier networks and observed capacity history.
This progression motivates four research questions. RQ1 asks how supplier concentration evolved between 2015 and 2024 across six green technology and material groups in 14 major importing markets. RQ2 asks how accurately nonlinear gradient boosting and interpretable logistic regression predict next-year bilateral trade link activity relative to persistence and other simple benchmarks, and how performance differs for exits, reactivations, and first observed entries. RQ3 asks how cost first, balanced transformation, low-carbon, and resilience-first sourcing portfolios change concentration, unit value price, distance, supplier country carbon intensity of GDP exposure, renewable electricity exposure, social and water indicators, governance risk, and predicted link activity and whether gradient-boosting probabilities add decision value over simpler forecasts. RQ4 asks how robust the recommendations are to dominant supplier disruptions, objective and constraint choices, and shared supplier budget constraints when several importing markets reallocate simultaneously.
Bilateral UN Comtrade records form importer technology supplier panels. World Bank indicators add environmental, social, logistics, income, governance, and country coordinate information. Bilateral distance is calculated as great circle distance from those coordinates. Concentration and network measures diagnose structural dependency. Prediction is evaluated with chronological holdouts, rolling origin tests, and event-specific forecasts for exits, reactivations, and first observed entries. Predicted next-year link activity probabilities then enter a capped supplier allocation model with cost, sustainability, and risk criteria. Historical sourcing shares define transparent scenario bounds, while sensitivity analysis examines parameter choices, price data coverage, and shared supplier budgets across importing markets.
The study makes four contributions. Empirically, it provides comparable concentration and dependency evidence across upstream materials and downstream green technology products and separates continuation, exit, reactivation, and first observed entry risks. Methodologically, it links prediction to deterministic portfolio allocation and tests whether model complexity changes the resulting decision, while shared supplier budget scenarios expose competition among importing markets for the same alternatives. Robustness analysis makes the consequences of normative share caps, expansion bounds, supplier count screens, adjustment and missing data penalties, governance weighting, and unit value coverage visible instead of treating them as calibrated facts. Conceptually, the framework treats AI-enabled business transformation as a governed evidence process in which prediction estimates a clearly defined commercial link outcome, optimization expresses declared priorities, and stress tests reveal where attractive allocations depend on fragile assumptions or system-level capacity competition.
The remainder of the article develops the analytical foundations, explains the data and methods, reports structural, predictive, portfolio, and stress test results, and discusses their implications for supply chain strategy and public policy. The appendices document country coverage, variable definitions, validation results, and optimization diagnostics so that the main findings can be assessed without relying on an opaque model narrative.
2. Literature Review and Analytical Framework
Concentration metrics, sustainability indicators, prediction models, and sourcing optimization answer different parts of the sourcing problem. The literature reviewed here covers four closely related areas. These are critical material and green technology dependency, sustainable and resilient supply chain design, AI-enabled operational decision making, and portfolio-based supplier allocation. Their overlap provides the analytical basis for the empirical sequence used in this study.
2.1. Concentration and Dependency in Green Technology Networks
Energy transition technologies depend on materials whose geology, processing capacity, and trade are unevenly distributed. The World Bank [17], IRENA [18], and IEA [19] document the resulting pressures on mineral demand and supply. Criticality assessments combine supply risk with the economic or technological consequences of disruption [20]. Life-cycle research quantifies the environmental burdens of metal production [21], while studies of material bottlenecks and extraction show how environmental and social pressures can rise with demand and declining ore grades [22,23]. National procurement systems also depend on processed goods such as batteries, photovoltaic equipment, and wind components. The analysis therefore covers both material inputs and manufactured green technology products.
Trade concentration is usually summarized with top supplier shares or the Herfindahl–Hirschman Index (HHI). A top-one or top-three share gives decision makers an immediate view of exposure. HHI uses the full share distribution and distinguishes one dominant supplier from a more even portfolio with the same observed partner count. Its reciprocal is the effective supplier count. These measures cover dependency inside of the selected product market boundary. Market power, technical substitutability, inventory, contracts, and domestic production belong to the operational due diligence layer. Gravity research also shows that distance, market size, fixed costs, and selection shape trade relationships [24,25,26]. Concentration therefore serves as a structural screening signal.
Network analysis adds the pattern of relationships around each supplier. Centrality reflects export value and the number and variety of importer technology connections. A country may dominate one market yet remain peripheral across the sample while another links several technologies. This matters for correlated disruption because many importers may turn to the same alternative hub. The viability perspective similarly treats resilience as a property of interconnected systems [10,27]. Here, every centrality result is reported within the 14-market sample boundary.
2.2. Sustainable Supply Chain Management and Resilience
Sustainable supply chain management extends firm-level environmental performance to coordinated decisions across suppliers, customers, and institutions. Foundational reviews identify the joint treatment of economic, environmental, and social goals as the field’s defining challenge [4,5,28]. Measurement studies add that sustainability constructs must be operationalized consistently enough to support comparison and action [6,29]. Supplier selection research reflects this multidimensionality through multicriteria decision methods, mathematical programming, and hybrid models [30,31]. A persistent difficulty is commensurability. Prices, emissions intensities, governance estimates, labor indicators, and water stress use different scales and carry different normative meanings.
Resilience is the capacity to prepare for, respond to, and recover from disruption. Christopher and Peck [7] emphasize visibility, collaboration, agility, and risk understanding, whereas Tang [8] shows how robust strategies preserve efficiency while creating response options. Facility location and network design models formalize redundancy and disruption protection [9], while supply network studies trace propagation and ripple effects [10,32]. Effective diversification depends on the share distribution, common upstream inputs, and the ability of alternatives to scale. Capacity, qualification time, quality standards, and contracts shape the pace of reallocation. The analysis therefore reports both nominal and effective supplier counts and applies recent history expansion caps.
Sustainability and resilience sometimes reinforce one another and sometimes compete. Renewable-powered production can lower embedded emissions and fossil price exposure, whereas strong governance and logistics can support assurance and continuity. Redundancy may add transport, inventory, auditing, and coordination costs, and a low-emissions supplier may be distant or commercially intermittent. Pagell and Wu [33] connect this tension to practices that depart from conventional efficiency assumptions. Visible scenario weights, comparisons across priorities, and weight sensitivity results make those choices reviewable.
2.3. Artificial Intelligence and Supply Chain Transformation
Transaction, sensor, and external data have expanded the analytical reach of supply chain planning. Big data capability improves visibility and decision speed when organizations embed it in operating processes [11,34,35]. Reviews document applications in demand forecasting, inventory, logistics, supplier selection, and risk detection [13,14,36]. Transformation occurs when these tools change how functions collect information and coordinate decisions. Clear outcome definitions, future-facing validation, and an explicit path from probability to action provide the governance needed for deployment.
Trade link activity is a useful predictive target because international sourcing relationships exhibit persistence, entry, exit, and reactivation. A simple persistence rule is therefore a demanding benchmark. If a relationship is active now, predict that it remains active next year. Machine learning adds value only if it extracts incremental information from current value, share, relationship history, distance, logistics, macroeconomic conditions, environmental indicators, and governance. Gradient boosting is attractive because it can represent nonlinearities and interactions without requiring an ex ante functional form [37]. Logistic regression remains important as a transparent comparator. Evaluation should include ranking metrics, threshold metrics, and probability quality. Receiver operating characteristic area under the curve measures discrimination [38], precision–recall measures are informative under class imbalance [39], and the Brier score measures squared probability error [40]. Calibration error separately measures the gap between predicted probabilities and observed frequencies [41].
Chronology is central. A time-ordered holdout mirrors a procurement team that uses historical data to assess the next period, and rolling origin tests show how performance changes across cutoffs. Random splitting would mix later and earlier observations in a persistent relationship panel. Feature importance also has a precise scope. Permutation importance records the loss in predictive performance when a feature is shuffled [42]. It ranks conditional predictive contribution within the fitted feature set, matching the forecasting purpose of the model.
2.4. From Prediction to Constrained Portfolio Choice
Portfolio reasoning offers a bridge from multidimensional evidence to sourcing shares. Its core insight is that the value of an option depends on its own score and the full allocation surrounding it [15]. Procurement models have applied this logic to supplier selection, order allocation, risk, and disruption response [16,43]. In the present setting, concentration is an endogenous portfolio property represented by the sum of squared shares. Supplier attributes contribute linear expected criteria, and a quadratic adjustment term discourages large deviations from observed sourcing. Share caps, historically grounded capacity bounds, and an operational support screen keep the solution interpretable and executable.
The analytical framework can be summarized as a governed sequence. Observed trade first defines relationships and current shares. Structural metrics diagnose dependency. A time-ordered model estimates the probability that each eligible bilateral link is active next year. Scenario-specific portfolio optimization then combines that probability with normalized sustainability, risk, distance, and price criteria. Finally, shocks and weight perturbations test the dependence of recommendations on supplier availability and decision priorities. Each stage produces a different type of evidence, including description, prediction, prescription, and robustness. Keeping those categories separate supports stronger claims and makes the approach suitable for sustainable supply-chain-driven business transformation, where a technically sophisticated model must still be reviewable by procurement, sustainability, risk, and governance functions.
2.5. Synthesis, Theoretical Adaptation, and Research Gap
Portfolio theory provides a useful way to evaluate supplier shares as an interdependent allocation, but its financial interpretation transfers only partly to cross-border sourcing [15,16]. Country product trade relationships are not freely divisible financial assets with comparable returns. Technical qualification, product quality, contracts, transport infrastructure, and adjustment time constrain substitution. Suppliers may also depend on common upstream inputs or infrastructure, which means that geographic diversification does not necessarily eliminate correlated risk. In this application, HHI therefore serves as a transparent concentration penalty rather than a covariance-based measure of portfolio risk. Historical sourcing shares define feasible scenario bounds, while sustainability and institutional indicators enter as screening criteria. The approach retains the allocation logic of portfolio theory without assuming that supplier relationships behave like traded securities.
The literature supports joint consideration of economic, environmental, and social objectives while also showing that prediction, diversification, and resilience measure different aspects of the sourcing problem. Predictive models estimate commercial continuity. Optimization makes allocation trade-offs explicit. Neither strong predictive discrimination nor a lower concentration index is sufficient to establish a better sourcing decision. The value of a more complex predictive model must therefore be assessed after its probabilities enter the allocation problem and must be compared with simpler alternatives under identical constraints. This study addresses that gap through structural analysis, prospective prediction, constrained allocation, decision stage model comparison, and shared capacity stress testing.
3. Materials and Methods
The empirical strategy follows the sequence developed above and uses importer–technology–supplier relationships as its common unit. Data construction precedes any model fitting, chronological rules are applied before preprocessing, and all portfolio cases inherit the same supplier and indicator definitions. This section describes the study boundary, data treatment, structural measures, predictive models, optimization problem, and robustness procedures. The details are intentionally explicit because apparently small choices, such as the treatment of self-trade, estimated quantity, missing indicators, or supplier capacity, can materially change a sourcing recommendation.
3.1. Study Scope and Technology Baskets
The sample consists of 14 reporting markets, including Brazil, China, Egypt, France, Germany, India, Japan, Morocco, the Republic of Korea, Saudi Arabia, South Africa, the United Arab Emirates, the United Kingdom, and the United States. They were selected to provide geographic and development diversity while covering major manufacturing, consuming, and trade hubs. Annual data span 2015–2024, except that the latest usable year for the United Arab Emirates is 2023. Appendix A Table A1 reports country-level row, period, technology, and value coverage. The analysis concerns foreign supplier exposure. Reporter partner self-flows and aggregate “world” partners are excluded, and partner economies are harmonized to ISO3 codes.
Six technology baskets connect manufactured clean energy goods with strategically important material inputs. Table 1 reports their Harmonized System codes and analytical scope. The photovoltaic basket combines legacy HS 854140 with the more granular HS 2022 codes 854142 and 854143 to preserve continuity across the classification change. The battery basket represents lithium-ion accumulators, the wind basket represents generating sets, and the material baskets cover rare earth metals, natural graphite, and selected cobalt forms. This design provides product-specific sourcing exposure across both upstream and downstream segments.
Table 1.
Green technology and material baskets used in the analysis.
3.2. Data Sources, Cleaning, and Panel Construction
Bilateral trade values and quantities come from the UN Comtrade Database [44]. Imports are measured in current United States dollars on the reporting economy’s customs basis. The raw extraction produced 25,178 records valued at USD 1.432 trillion. Cleaning removed 213 self-partner rows worth USD 19.9 billion, non-country aggregates, records outside of the technology definitions, and relationships below the annual activity threshold. The analytical trade table contains 15,186 supplier-year observations and USD 696.147 billion in foreign supplier trade. Table 2 traces the sample transitions.
Table 2.
Construction and coverage of the analytical sample.
A bilateral importer–supplier–technology relationship is active in year t when aggregated import value reaches USD 10,000. The threshold filters very small flows while retaining entry and reactivation events. Expanding known relationships across their relevant years produces 22,422 relationship-year rows and 19,672 next-year transitions, including 57.7% continuations, 12.3% exits, 5.5% reactivations, and 24.5% continued inactivity. The target records whether the same bilateral trade link exceeds the activity threshold in t + 1. Contracted delivery, plant capacity, on-time performance, and supplier quality remain separate operational measures.
Country-year covariates come from the World Development Indicators [45] and related World Bank series. They cover carbon dioxide intensity of GDP, renewable electricity, Political Stability and Absence of Violence/Terrorism, Control of Corruption, the Logistics Performance Index, GDP per capita, vulnerable employment, and water stress. The underlying source institutions include EDGAR for carbon dioxide emissions [46], ILOSTAT for employment [47], FAO AQUASTAT for water stress [48], and the World Bank Logistics Performance Index [49]. Governance data use the Worldwide Governance Indicators 2025 revision [50]. Bilateral distance is calculated as great circle distance from World Bank country coordinates following standard bilateral distance practice [51]. Indicator values are matched to the trade year where available. When a same-year value is unavailable, the most recent prior observation is carried forward and its age is retained. Appendix B Table A2 reports source codes, coverage, and staleness. Coverage exceeds 94.5% for every country-level criterion, although the episodic Logistics Performance Index has the largest stale row share.
Unit value equals trade value divided by reported net weight and is expressed in United States dollars per kilogram. It is a trade-based price proxy shaped by product quality, composition, reporting practice, transport terms, and classification mix. Price construction uses observations with reported, non-estimated net weight and retains unknown estimation status as a quality flag. Within each importer technology candidate set, supplier price is the median unit value in the case-specific five-year window. When at least five supplier prices are observed, the cross-supplier distribution is winsorized at the 5th and 95th percentiles. Usable non-estimated quantity covers 40.8% of raw trade value. Across the 83 latest portfolio cases, median current matched-value quantity coverage is 89.6%, although the mean is 64.1% and coverage differs sharply by technology. The median is only 14.1% for solar photovoltaic equipment compared with at least 66.4% in every other product group. Sensitivity analysis therefore includes specifications without price, alternative treatments of missing price, and a strict observed price screen. The strict screen is feasible for 37 of 83 latest cases. Price results are interpreted as directional screening evidence rather than supplier quotations or landed cost estimates.
3.3. Structural Concentration and Network Measures
For importer i, technology k, and year t, supplier j’s value share is sijkt. The Herfindahl–Hirschman Index and effective supplier count are defined as follows:
HHIikt = Σj sijkt2, Neffikt = 1/HHIikt.
HHI approaches zero as sourcing becomes more dispersed and equals one under single supplier sourcing. The analysis also reports the largest supplier share, top-three share, nominal supplier count, trade-weighted distance, and trade-weighted country indicators. Annual trends use composition stable panels in which each importer technology case appears throughout the relevant window. A linear slope is estimated for every case, followed by 1000 bootstrap draws across cases for technology summaries. Figure-level bands use 500 bootstrap draws around yearly means. These intervals summarize descriptive variation in the observed case set.
The latest-year supplier network is a directed, weighted, two-mode graph linking supplier countries to importer technology markets. Supplier value share measures scale within the sample, degree counts distinct importer–technology links, and importer reach counts reporting economies. Node size reflects sample trade value, while the visualization retains the largest links for readability. All network shares are explicitly labeled as 14-market sample shares.
3.4. Trade Link Prediction and Validation
The predictive feature set is restricted to information available in year t or earlier. It includes current link activity, log trade value, supplier share, one-year lags, relationship age, active years, historical presence rate, historical mean share, historical value variability, bilateral distance, and the matched country indicators. Infinite values are replaced with missing values. Medians are calculated using the training sample only, and standardized values use a StandardScaler fitted only on training rows. This sequencing prevents later period information from entering preprocessing.
The primary predictive specification is a histogram-based gradient boosting classifier with a learning rate of 0.06, 250 boosting iterations, 15 maximum leaf nodes, L2 regularization of 0.5, and random seed 42. Logistic regression with the same information set provides a transparent learned benchmark. Persistence predicts next-year activity from current activity, while the training base rate provides a non-informative probability benchmark. The main chronological evaluation trains through 2021 and tests on 2022–2023 transitions, yielding 14,526 training observations and 5146 test observations. Four rolling origin evaluations test 2020, 2021, 2022, and 2023 separately using only earlier labeled years for model estimation and preprocessing.
Performance is assessed with ROC AUC, average precision, accuracy, F1, and the Brier score. ROC AUC and average precision measure ranking across thresholds, accuracy and F1 use the stated class decision, and the Brier score measures the squared probability error. Weighted expected calibration error captures the gap between predicted and observed frequency. Appendix C Table A3 reports product-specific results, and Appendix C Table A4 reports rolling origin results. Permutation importance shuffles each feature in the chronological test set and records the mean ROC AUC loss. The resulting rank describes the conditional predictive contribution within the fitted model.
The event-specific validation uses a prospective, sample-bounded exporter universe at each forecast origin. A potential supplier becomes eligible only after it has exported the technology to at least one sampled importer by year t. Exporters first observed in later years are not introduced retrospectively. Three risk sets are evaluated. Exit risk applies to links active at t. Reactivation risk applies to inactive links with prior activity in the observed history. First observed entry applies to links that have not previously been active for the importer but whose exporter is already visible elsewhere in the sampled technology network.
For each forecast origin, the latest earlier labeled year is reserved for sigmoid probability calibration, and all preceding observations form the model development sample. Gradient-boosting hyperparameters are selected based on the minimum mean Brier score over the final two rolling validation years available in that earlier sample. The candidate settings vary learning rate, iteration count, leaf count, and L2 regularization. Logistic regression compares C values of 0.1, 1, and 10. Medians and scaling are fitted on training observations only. Gradient boosting is estimated without early stopping so that each candidate configuration is evaluated consistently. Calibration follows model fitting, and the test year is excluded from tuning and threshold selection. Event-specific classification thresholds maximize F1 on the preceding calibration year, while fixed 0.5 results are also reported.
The robustness analysis also includes a Laplace-smoothed product-by-risk Markov benchmark and a gradient-boosting ablation that removes current and lagged trade value and share magnitudes while retaining activity and relationship history information. Performance is reported with ROC AUC, average precision, Brier score, log loss, calibration error, precision, recall, and F1. These tests complement the main chronological evaluation by focusing on event-specific forecasting and model complexity rather than replacing the headline holdout results.
3.5. Candidate Suppliers and Multiobjective Portfolio Optimization
Each candidate receives normalized decision terms for unit value price, supplier country CO2 intensity of GDP, inverse renewable electricity share, water stress, vulnerable employment, bilateral distance, governance risk, and predicted next-year trade link inactivity. A portfolio-level concentration penalty is added separately. The carbon term is a country-level contextual exposure proxy and does not measure embodied product carbon. Governance risk combines reverse-scaled Political Stability and Absence of Violence/Terrorism with reverse-scaled Control of Corruption using 0.55/0.45 weighting. Continuous criteria are min–max scaled within each case. Case medians fill missing values after scaling. A missingness penalty of 0.05 assigns a modest disadvantage to less completely documented candidates.
Let x denote recommended supplier shares, x0 observed shares, c the weighted linear supplier criterion vector, including the data gap penalty, λ the scenario concentration weight, and μ the adjustment penalty. The baseline uses μ = 0.04. Both coefficients operate on normalized objective units. λ expresses the chosen emphasis on diversification, while μ discourages large one-period reallocations. The latter is not interpreted as a monetary switching cost, and neither coefficient is estimated as a structural parameter.
minx c′x + λ Σj xj2 + μ Σj (xj − xj0)2
subject to Σj xj = 1, 0 ≤ xj ≤ uj.
The supplier bound uj equals the greater of the latest observed share and 1.5 times the supplier’s maximum share in the five-year window, subject to a 40% global share cap. These are sourcing scenario bounds derived from recent trade shares rather than measurements of physical spare capacity. When a case has too few candidates for a unit sum allocation under the global cap, the cap is raised only by the minimum amount needed for feasibility. If the empirical supplier bounds still sum to less than one, proportional headroom is added, and the amount of relaxation is reported. The continuous objective is a convex quadratic program with a deterministic global solution. When more than eight suppliers receive positive weight, a deterministic support screen retains the largest allocations and the portfolio is reprojected. Additional suppliers are retained when an eight supplier support cannot satisfy the unit sum constraint.
Four scenarios represent different managerial priorities. Table 3 reports declared weights that sum to one across the eight linear criteria and the concentration term. The cost first scenario places the largest weight on the unit value proxy. Balanced transformation spreads weight across price, supplier country carbon exposure, governance risk, predicted link activity, concentration, and other sustainability criteria. The low-carbon scenario emphasizes the country-level carbon proxy and renewable electricity, while the resilience-first scenario emphasizes governance risk, predicted link inactivity, and concentration. Because normalization is case-specific, the weights express relative priorities within each importer technology decision rather than universal cardinal values.
Table 3.
Objective weights in the four sourcing scenarios.
The parameter settings are treated as transparent decision assumptions and examined through sensitivity analysis. Historical observations through 2021 provide descriptive context. The median largest supplier share is 60.9%, and the median nominal supplier count is 15. Among cases with a recent maximum share of at least 0.5%, 90.4% of realized next-year supplier shares remain within 1.5 times that recent maximum. In contrast, only 24.6% of historical cases already satisfy a 40% largest supplier ceiling and 38.1% have eight or fewer suppliers. The 40% cap is therefore a deliberate diversification constraint rather than a typical observed condition, while the 1.5 times expansion rule is broadly consistent with historical year to year changes. The adjustment penalty, missingness penalty, governance split, supplier count screen, and concentration weight remain normative choices. Their influence is evaluated over broader parameter ranges rather than presented as empirically estimated preferences.
To test whether gradient boosting adds value after prediction enters the sourcing decision, a historical portfolio comparison holds candidate sets, criterion data, constraints, and objective weights constant and changes only the next-year activity probability. Calibrated gradient boosting is compared with calibrated logistic regression, persistence, a product by risk Markov benchmark, a gradient boosting model without trade value and share magnitudes, and a specification that omits the probability term. Across 115 common feasible importer technology years grouped in 61 importer–technology clusters, the primary ex post diagnostic is the realized share allocated to suppliers that are inactive in the following year. A common ex post portfolio score is also reported. Cluster bootstrap intervals summarize variation within this historical comparison. They are descriptive and are not interpreted as causal effects or measures of delivery performance.
3.6. Disruption, Shared Capacity, Parameter Sensitivity, and Reproducibility
Four shocks are applied to the balanced transformation portfolio. They remove the largest current supplier, remove the two largest suppliers, remove China, or reduce China’s historical share-based bound by 50%. Country shocks use cases with positive current China exposure. After each shock, the remaining candidates are reoptimized under balanced weights. Outcomes cover concentration, unit value price, the supplier country CO2/GDP proxy, renewable electricity, water stress, vulnerable employment, governance risk, predicted link activity, supplier count, turnover, and any required relaxation of historical share-based bounds. Post-shock severity is assessed across these measures because forced redistribution can lower HHI while increasing cost or implementation pressure.
Preference uncertainty is evaluated with 100 Dirichlet draws centered on the balanced weight vector and concentration parameter 80. For every case, the analysis records the 5th, 50th, and 95th percentiles of HHI, the supplier country CO2/GDP proxy, renewable electricity, water, social exposure, governance risk, predicted link activity, and turnover. Supplier-level selection frequency and allocation intervals indicate whether a recommendation is structurally stable or whether several near substitutes exchange small weights. This distinction matters because narrow portfolio-level outcome intervals can coexist with unstable supplier identities.
A system-level test addresses the possibility that several importing markets may rely on the same alternative suppliers. For each technology in the common 2023 year, joint optimization imposes an aggregate supplier budget across sampled importers. The budget is based on the supplier’s maximum nominal trade value during the preceding five years multiplied by a scenario factor. It is a trade value proxy for shared sourcing headroom, not a measure of physical production or spare capacity. Strict constraints are retained without automatic relaxation. Results are reported for the full sample and for the subset of importer technology cases that are individually feasible under the same bounds, which separates cross-market competition from case-level infeasibility. Capacity factors of 1.0, 1.25, 1.5, and 2.0 are examined. Additional scenarios remove China, reduce China’s budget by 50%, and lower primary import demand by 10% or 20%. The demand reductions are illustrative circular economy sensitivities and are not estimates of specific recycling policies.
The analysis was implemented in Python 3.12.12 (Anaconda distribution) using pandas 2.3.3, NumPy 2.3.5, SciPy 1.16.3, scikit-learn 1.8.0 [52], NetworkX 3.6.1, Matplotlib 3.10.8, and Seaborn 0.13.2. Fixed random seeds were used for bootstrap sampling, model estimation, permutation importance, and weight draws to improve computational reproducibility.
4. Results
The results follow the four research questions and move from observed structure to predictive performance, portfolio implications, and robustness. All reported comparisons use the cleaned foreign supplier sample. Trend results use composition-stable cases, predictive metrics use chronologically later observations, and portfolio results refer to the latest available year in each importer technology case. This separation prevents changes in sample composition or decision assumptions from being confused with observed historical change.
4.1. Concentration, Dependency, and Network Structure
Supplier concentration increased across the pooled composition-stable panel. Mean HHI rose from 0.415 in 2015 to 0.578 in 2024, and the mean case-level annual slope was 0.0172 (95% bootstrap interval 0.0091–0.0251). Only 28.2% of cases had declining HHI slopes. The pooled result masks pronounced technological differences, as Table 4 and Figure 1 show. Solar photovoltaic equipment recorded the steepest increase, from mean HHI 0.276 to 0.737 and an annual slope of 0.0553. Lithium-ion batteries also increased sharply, with a slope of 0.0282, followed by wind equipment at 0.0208. The bootstrap intervals for these three groups exclude zero. Cobalt and graphite exhibit slightly negative mean slopes, but their intervals span zero. Rare earth concentration is high and broadly stable on average.
Table 4.
Concentration change in composition-stable importer technology panels, 2015–2024.
Figure 1.
Mean supplier concentration by technology in composition-stable panels, 2015–2024. Note: Shading shows bootstrap uncertainty around yearly case means. HHI equals one under single-supplier sourcing.
Latest-year cross-sectional exposure is also substantial. Across 83 cases, median HHI is 0.632, equivalent to only 1.58 equally sized suppliers. The median largest supplier share is 77.3%, and the median top-three share reaches 95.5%. The mean simple supplier count is 17.1, demonstrating why nominal relationship counts can overstate diversification. Many markets transact with numerous small partners, while most value remains concentrated in one or two. Figure 2 maps top-three exposure by reporting market and technology. Exposure varies markedly across these cases, with downstream equipment concentration especially visible in photovoltaic and wind markets.
Figure 2.
Latest-year top-three foreign supplier share by reporter and technology. Note: Values use the latest available year for each case. Darker cells indicate a larger combined share of the three leading foreign suppliers.
The latest-year network reinforces the difference between market-specific and system-wide dependency. Within the 14-market sample, China accounts for 54.8% of trade value, followed by Vietnam at 6.7%, Poland at 4.5%, Hungary at 3.9%, Malaysia at 3.5%, Thailand at 3.4%, and the Republic of Korea at 3.4%. China connects to 13 reporting markets and 72 importer technology nodes. Figure 3 shows centrality across multiple technology baskets, while several other large suppliers occupy specialized positions. The pattern also signals that importer-level diversification plans may compete for capacity in the same alternative hubs.
Figure 3.
Central suppliers in the latest-year green technology trade network. Note: Node and edge prominence reflect value within the latest-year 14-market sample. Filtering preserves the most legible relationships.
4.2. Predictive Performance and Calibration
The chronological holdout shows metric-dependent strengths. Table 5 reports the 2022–2023 test. Gradient boosting reaches ROC AUC 0.911 and average precision 0.926. Logistic regression is marginally higher at 0.912 and 0.929. Gradient boosting records better accuracy and probability error than logistic regression, including a Brier score of 0.119 versus 0.123. Persistence remains strongest on F1 at 0.847 and nearly matches gradient boosting accuracy. Its coarser binary probabilities yield weaker AUC, average precision, and Brier performance. Learned models therefore supply markedly better discrimination and probability resolution, while persistence remains a strong fixed threshold benchmark.
Table 5.
Next-year trade link activity prediction on the chronological 2022–2023 test set.
Rolling origin validation supports the stability of this pattern. Across the 2020–2023 test years, mean ROC AUC is 0.903 for gradient boosting, 0.905 for logistic regression, and 0.810 for persistence. The corresponding mean Brier scores are 0.126, 0.129, and 0.182. Figure 4 shows a temporary decline in learned model discrimination in 2021, followed by recovery to approximately 0.924 in 2023. Logistic regression matches or slightly exceeds gradient boosting in ROC AUC in three out of four years, while gradient boosting generally offers a small calibration advantage. Appendix C Table A4 reports every year-model combination, preventing mean performance from concealing temporal variation.
Figure 4.
Rolling origin validation of next-year trade link activity models. Note: Each point uses only years preceding the displayed test year for model training and preprocessing.
Calibration matters because predicted probabilities enter the portfolio objective. Figure 5 shows gradient boosting tracking observed frequencies closely across probability bins. Its weighted expected calibration error is 0.0216, compared with 0.0531 for logistic regression and 0.1648 for persistence. This aggregate result supports gradient boosting as the primary decision input, alongside product-level checks. Appendix C Table A3 reports ROC AUC from 0.849 for wind equipment to 0.919 for batteries. Logistic regression performs especially well for batteries, while gradient boosting records lower Brier scores in several other groups.
Figure 5.
Calibration of predicted next-year trade link activity probabilities. Note: A perfectly calibrated model lies on the diagonal. Expected calibration error is weighted by bin frequency.
Permutation results in Figure 6 identify current log trade value as the leading predictor. Shuffling it reduces AUC by 0.1089. Historical presence rate follows at 0.0111, then logistics performance, lagged log value, current trade share, active year history, historical mean share, distance, value variability, and renewable electricity. The dominance of current value reflects the persistence of large established flows above the USD 10,000 threshold. Country sustainability and governance variables contribute less incremental ranking information after commercial history is known. Their direct role lies in responsible sourcing preferences inside of the portfolio model.
Figure 6.
Permutation importance for the gradient boosting model on the chronological test set. Note: Values are mean decreases in ROC AUC after shuffling one feature. Near-zero values identify features with a small, stable, incremental ranking contribution within the fitted predictive model.
Across the four prospective forecast origins, the event risk evaluation contains 6057 exit risk observations with 1165 exits, 3954 reactivation risk observations with 651 reactivations, and 15,995 first observed entry observations with 289 entries. At the fixed 0.5 threshold, calibrated gradient boosting has average Brier scores of 0.120 for exits, 0.133 for reactivations, and 0.0178 for first observed entries. Average precision is 0.558, 0.283, and 0.039, respectively. Rare first observed entries are therefore substantially harder to identify than exits. Thresholds selected only on the preceding calibration year raise average F1 to 0.539 for exits, 0.361 for reactivations, and 0.056 for first observed entries. Calibrated logistic regression produces corresponding average F1 values of 0.541, 0.348, and 0.060. The comparison shows that greater model complexity does not produce uniformly better event prediction.
The prospective universe also clarifies the limits of entry prediction. Of 1226 bilateral first appearances observed during the study period for which a previous importer technology origin exists, 985, or 80.3%, involve an exporter already visible for that technology elsewhere in the sampled network one year earlier. The remaining 241 appearances, or 19.7%, involve exporters that were not yet visible in the prospective candidate universe. Trade activity remains distinct from delivery reliability. The results identify where historical commercial information can support early warning and where firm-, contract-, logistics-, and plant-level evidence is still required. Appendix E provides the detailed event calibration and temporal validation results.
4.3. Sustainable Sourcing Portfolio Trade-Offs
Observed latest-year portfolios combine high concentration with high predicted continuation of established links. The median current HHI is 0.632, the median effective supplier count is 1.58, and the median predicted next-year link activity is 0.977. Optimization changes this profile across all four scenarios. Median HHI falls to 0.236 in the cost first case, 0.240 under balanced transformation, 0.258 under low carbon, and 0.233 under resilience first. The corresponding effective supplier counts rise to 4.24, 4.16, 3.88, and 4.30. These values remain below an evenly allocated eight supplier portfolio because empirical capacity bounds and other criteria preserve unequal shares.
Table 6 reports median changes from observed sourcing. The balanced portfolio reduces HHI by 53.7%, sourcing exposure to supplier country CO2 intensity of GDP by 32.3%, governance risk by 11.6 percentage points, water stress by 4.5 percentage points, vulnerable employment by 8.4 percentage points, and distance by 7.5%. Its unit value price rises by 5.2%, predicted link activity falls by 4.8 percentage points, and one-way turnover reaches 0.512. The carbon result refers to a change in exposure to a country-level proxy and should not be interpreted as a reduction in embodied emissions from batteries, photovoltaic modules, wind equipment, or mineral inputs.
Table 6.
Median changes from current sourcing across 83 latest-year cases.
Figure 7 makes the scenario trade-offs visible. Each scenario leads on a different dimension. Cost first contains price exposure, low carbon gives environmental criteria the strongest influence, resilience first reaches the lowest median concentration and smallest decline in predicted link activity, and balanced transformation sits between these priorities. Medians are used for price because photovoltaic unit values contain classification and quality heterogeneity. By technology, the balanced median price change ranges from −10.8% for wind equipment to +19.0% for batteries, while photovoltaic equipment reaches +275.1%. That photovoltaic result diagnoses product mix sensitivity in the proxy. Appendix D Table A5 keeps the technology-level heterogeneity visible.
Figure 7.
Trade-offs among observed and optimized sourcing portfolios. Note: Metrics retain their reported scales. “Carbon” in the figure refers to import-share-weighted supplier country CO2 intensity of GDP, not embodied product emissions. Scenario comparisons are results from the prescriptive sourcing model.
Figure 8 aggregates the suppliers most often recommended under balanced transformation. Every importer retains a case-specific allocation based on its candidate set and capacity history. Median coverage of the decision criteria is about 99.7%, while weighted coverage of unit value price is lower and varies by scenario. Capacity bounds require relaxation in 21 out of 83 cases under each scenario, with mean relaxation mass 0.069 and median zero. The operational eight-supplier screen expands in 16–23 cases, depending on the scenario. Appendix D Table A6 reports every optimizer status and relaxation. These cases identify where additional supplier qualification or capacity development is needed to achieve a unit sum diversified portfolio.
Figure 8.
Balanced transformation allocations for leading recommended suppliers by technology. Note: Shares aggregate case-specific recommendations and show recurring supplier roles across the sampled portfolios.
The historical decision back-test provides a stricter test of the AI claim than predictive ranking alone. Relative to calibrated logistic regression, calibrated gradient boosting reduces the realized next-year inactive allocation share by only 0.124 percentage points on average across 115 common feasible case-years, with a cluster bootstrap 95% interval from −0.365 to +0.063 percentage points and 84.3% exact ties. Relative to persistence, the mean difference is −0.066 percentage points with an interval from −0.395 to +0.244. The nonlinear model therefore shows no robust incremental decision advantage over these simpler alternatives in this back-test. In contrast, including calibrated predictive continuity information improves the same outcome by 1.649 percentage points relative to omitting the probability term entirely (95% interval 0.853 to 2.768 percentage points in favor of the predictive specification). The evidence supports the use of validated predictive information but not a blanket claim that gradient boosting is necessary when logistic regression produces essentially the same decision.
Constraint sensitivity materially affects feasibility. Under the strict 40% share cap, 1.5 times historical expansion rule, and eight supplier screen, 58 out of 83 latest cases, or 69.9%, are feasible without added headroom. The baseline feasibility procedure produces a portfolio for all 83 cases by applying only the minimum required relaxation. A 30% cap lowers strict feasibility to 55.4% at the 1.5 times expansion factor, while a 50% cap raises it to 77.1%. Increasing the adjustment penalty from 0.04 to 0.16 reduces median turnover, as intended, but it also weakens the diversification gain. These patterns confirm that the parameter values shape the recommended degree and pace of reallocation and should be interpreted as scenario assumptions rather than empirically identified optima.
4.4. Disruption, Shared Capacity, and Sensitivity Results
The stress tests reveal the operational cost of substitution (Table 7). Removing the largest current supplier affects 80 balanced cases and displaces a median 77.0% of current sourcing. Removing the two largest affects 77 cases and displaces 90.2%. Reoptimization spreads the displaced share across alternatives and often lowers HHI, alongside large adjustments elsewhere. The two supplier shock raises the median unit value price by 38.0%, reduces predicted link activity by 9.6 percentage points, and requires capacity relaxation in 68.8% of cases. The single supplier shock raises the median unit value by 12.6% and requires relaxation in 53.8%. Cost, continuity, turnover, and feasibility give the lower post-shock HHI its operational meaning.
Table 7.
Median balanced portfolio outcomes under supplier shocks.
China exposure makes country-specific shocks consequential beyond the largest supplier cases. Including zero exposure cases, China’s mean latest-year share is 78.8% in photovoltaic equipment, 69.2% in batteries, 60.8% in rare earth metals, 42.8% in graphite, 40.6% in wind equipment, and 8.8% in cobalt materials. Figure 9 separates partial capacity reduction from full removal. A 50% capacity reduction often leaves the balanced allocation inside of the tighter cap, producing a zero median price response. Full removal forces substitution and more capacity relaxation. Exposure varies widely across importer technology cases, supporting graded, case-specific stress tests.
Figure 9.
Latest-year China exposure and balanced portfolio responses to China shocks. Note: Exposure summaries include zero share cases. Shock outcomes use cases with positive current China exposure and are calculated after reoptimization. The capacity reduction scenario refers to the historical share-based sourcing bound and does not measure physical production capacity.
The shared supplier budget analysis reveals a constraint that independent importer portfolios cannot capture. At a 1.5 times recent nominal trade value budget, five out of the six technology groups are jointly feasible in 2023 when the analysis is restricted to importer cases that are individually feasible under the same strict bounds. Solar photovoltaic equipment retains a small shortfall equal to 0.027% of import demand. Independent plans nonetheless place substantial pressure on particular alternatives before joint reallocation. For batteries, the largest single-supplier excess reaches USD 5.30 billion, and summed positive supplier excesses reach USD 18.76 billion. Removing China makes five out of the six technology-level joint problems infeasible at the same budget factor. The result does not establish physical capacity shortages, but it shows how independently designed diversification plans can compete for the same trade-based sourcing headroom. Figure 10 reports the complementary weight-sensitivity analysis, showing how balanced-portfolio concentration varies across 100 perturbations of the objective weights.
Figure 10.
Sensitivity of balanced portfolio concentration to objective weight perturbations. Note: Intervals summarize 100 Dirichlet weight draws centered on balanced priorities and represent preference uncertainty.
Preference perturbations around the balanced vector leave portfolio-level outcomes relatively narrow, but the broader parameter analysis shows that stability should not be equated with parameter identification. Across the original 100 Dirichlet draws, the median case’s 5th–95th percentile HHI interval spans 0.229–0.251, and the corresponding supplier country CO2 intensity of GDP proxy spans 0.188–0.204. Supplier identities remain more flexible than these aggregate outcomes. Appendix E complements the weight perturbations with share cap, expansion, supplier count, adjustment, concentration, governance, missingness, and price treatment checks.
5. Discussion
The results support an architecture of linked decisions. Historical measurement shows where dependency is growing, prediction differentiates the commercial persistence of candidate relationships, optimization makes stakeholder trade-offs explicit, and stress testing identifies recommendations that depend heavily on capacity or supplier availability. The four stages answer the research questions with distinct descriptive, predictive, prescriptive, and robustness evidence.
5.1. Interpreting Concentration and the Diversification Imperative
The first research question yields a clear answer. Supplier concentration rose significantly in photovoltaic equipment, lithium-ion batteries, and wind equipment, while the mean trends for graphite, cobalt, and rare earth metals were statistically indistinguishable from zero within the observed stable panels. This downstream concentration is consistent with the broader industrial logic of scale economies, clustered manufacturing ecosystems, and cumulative production capability. It complements critical mineral research that has focused on the geographic specificity of extraction and refining [1,19,20]. The combined evidence suggests that the energy transition faces layered dependencies when upstream material constraints can coexist with even sharper concentration in manufactured components.
The latest-year contrast between a median 15 nominal suppliers and 1.58 effective suppliers is especially important. Simple counts can overstate redundancy when most value flows through one partner. HHI and the top-three share therefore belong beside supplier count in managerial risk dashboards. The result also supports weighted network approaches to disruption propagation [10,32]. Concentration functions as the first screen. Inventory coverage, technical substitutability, contract duration, domestic production, and supplier ownership then show how exposure translates into vulnerability.
The sampled network also points to a collective action problem. When many importers target the same small group of alternatives, diversification plans compete for capacity and may recreate concentration elsewhere. Viability research similarly emphasizes system-level adaptation across intertwined networks [27], and policy work calls for coordinated investment in processing, recycling, infrastructure, and skills [17,18]. A system-wide sourcing program therefore needs capacity information across buyers as well as bilateral plans.
5.2. What the Predictive Evidence Says About AI
The second research question has a metric- and decision-dependent answer. In the main chronological holdout, learned models improve ranking and probability quality over persistence. Logistic regression is close to gradient boosting in AUC, while persistence retains the strongest F1. The event-specific analysis reaches a similar conclusion. Calibrated logistic regression is essentially tied with gradient boosting for exits and first observed entries and remains competitive for reactivations. The decision stage comparison also finds only a small and statistically uncertain difference between the two learned models. These results support the use of validated predictive probabilities, but they do not show that nonlinear gradient boosting is consistently superior to a simpler logistic model.
Current trade value dominates feature importance because next-year activity is highly path dependent. This is consistent with fixed-cost and selection mechanisms in heterogeneous firm trade models [25], direct evidence on persistent buyer–supplier relationships [53], and capabilities built through repeated transactions. The reduced value model and event-specific tests show why that dominance must be interpreted carefully. Commercial history variables make the prediction problem easier, but they do not measure delivery reliability, and they provide limited information about rare first observed entries. Country sustainability and governance attributes add less incremental predictive information once commercial history is known. Their principal role in this study is to inform responsible sourcing choices rather than establishing commercial continuity.
The chronological design and rolling origin checks strengthen future-facing validity. Policy shocks, technology changes, reclassification, and large investments can still shift the relationship between historical value and future activity. Annual back-testing, calibration monitoring, data drift checks, and a documented simple rule fallback provide a practical governance cycle. Procurement teams can also use probability ranges or risk tiers and compare allocations across alternative probability models. In that form, analytics changes the cadence and transparency of cross-functional decisions [12,14].
5.3. Portfolio Results and Managerial Transformation
The third research question examines large modeled diversification gains accompanied by substantial reallocation. Every scenario roughly halves median HHI and more than doubles the effective supplier count. The balanced case also lowers median exposure to the supplier country CO2 intensity of GDP proxy, distance, water stress, vulnerable employment, and governance risk. These are changes in portfolio screening indicators rather than verified reductions in embodied product carbon or supplier-level impacts. Several current portfolios lie far from the modeled joint criteria frontier. Median turnover near 0.5 indicates that implementation would require a multi-period sourcing program with technical qualification, contract negotiation, price verification, quality assurance, lead time management, and supplier development.
The scenario comparison offers a practical governance mechanism. Procurement, sustainability, operations, and risk teams can begin with a common candidate set and observe how priorities move allocations. Cost first tests the room for diversification while containing median price. Low-carbon and resilience-first cases quantify the cost and relationship novelty associated with stronger environmental or institutional priorities. Balanced transformation serves as the common reference case. This structure operationalizes organizational information processing under uncertainty [54] and the dynamic capabilities of sensing, seizing, and reconfiguring [55].
Implementation can proceed in stages. Robust core suppliers selected across most weight draws merit early technical qualification and commercial engagement. Marginal suppliers can be developed as options using pilot volumes to validate quality, emissions data, labor practices, and delivery performance. Capacity relaxation cases deserve the earliest supplier-level verification because recent history bounds leave insufficient headroom. Supplier development, long-term offtake, joint investment, inventory, recycling, product redesign, and demand flexibility provide concrete ways to close those gaps. Optimization thereby acts as a boundary object that makes cross-functional disagreement measurable and identifies the constraints a target portfolio must change.
Unit value price deserves separate governance. Reported non-estimated quantity covers 40.8% of raw trade value, and latest case matched value coverage is especially weak for photovoltaic equipment, whose product-level median is 14.1%. A no-price specification leaves the main concentration result broadly similar among matched feasible cases, but the strict observed price screen reduces the analyzable latest sample to 37 cases. Procurement deployment should therefore replace the trade proxy with supplier quotations and landed total cost, including tariffs, freight, insurance, inventory, qualification, and carbon-related costs. At the current stage, the price criterion is a directional screening scenario rather than a business case cost estimate.
For enterprises, the framework provides a screening and discussion tool for procurement, operations, sustainability, and risk teams. It can identify candidate alternatives, make priorities visible, show when a recommendation depends on weak price coverage or demanding expansion assumptions, and establish whether a complex prediction model actually changes the decision. A sourcing change would still require supplier qualification, quotations, contracts, facility-level sustainability information, capacity confirmation, and delivery performance evidence. Cases requiring relaxation or showing unstable supplier identity should be treated as due diligence priorities rather than automatic reallocations.
5.4. Resilience, Policy, and Sustainable Industrial Strategy
The fourth research question shows why pre-disruption exposure and post-disruption response belong on the same dashboard. Removing dominant suppliers can lower HHI after forced redistribution while also displacing large shares, raising costs, lowering predicted link activity, and exhausting recent history capacity. Executable substitution at acceptable cost and service gives resilience its meaning. The stress results therefore support multidimensional measures of recovery paths, flexibility, and ripple effects [8,9,10].
The China scenarios separate exposure from sensitivity, while the shared supplier budget exercise adds a coordination dimension. A 50% China budget reduction can be absorbed in several cases because recommended shares already fit below the tighter bound, whereas complete removal produces large joint shortfalls in five out of six technology groups at the 1.5× budget factor. More generally, multiple importing markets can target the same alternatives and recreate concentration or exhaust their nominal historical headroom. Policymakers can use these scenarios to identify where standard alignment, infrastructure, processing capacity, joint procurement, strategic stocks, supplier development, or recycling investment merit investigation. Because the budgets are based on sampled nominal trade values rather than physical capacity or global supply–demand equilibrium, the estimates identify coordination pressure but do not establish production gaps, subsidy effects, or an optimal industrial policy.
Environmental criteria remain integral to resilience policy, but their measurement level must be explicit. Critical material expansion can transfer ecological and social pressure to new locations [23,56,57]. The country CO2/GDP, renewable electricity, labor, water, and governance indicators used here provide a first-stage country screen. Mine-, plant-, product-, and basin-level evidence is required for claims about embodied emissions or local impacts. Circular economy strategies can reduce primary material demand through durability, reuse, remanufacturing, recovery, and recycling [17,19,58]. The illustrative 10% and 20% demand reduction scenarios show how lower primary import requirements affect feasibility under fixed assumptions. They are not estimates of any specific circular economy policy.
5.5. Limitations
The study uses country product trade flows rather than firm transactions or delivery records. Trade link activity measures commercial continuity above a value threshold and cannot validate on-time delivery, disruption probability, supplier quality, or supply fulfillment. Country-level environmental, labor, and governance indicators describe contextual exposure. Carbon intensity of GDP is not embodied carbon in batteries, solar modules, wind equipment, or mineral inputs. Unit value price is available only where usable quantity is reported and affected by product mix and reporting practice. The first observed entry analysis is left-censored by the 2015 sample start. Country indicators use the historical series available in the current source releases rather than contemporaneous data releases from each observation year.
The optimization layer is also conditional on information that trade data cannot provide. Historical shares and values offer transparent bounds for scenario analysis, but they do not identify physical spare capacity, supplier contracts, technical qualification, demand from markets outside of the 14-country sample, or common upstream dependencies. Objective weights, the concentration coefficient, adjustment and missingness penalties, governance mix, and supplier count screen express declared analytical choices rather than estimated structural preferences. Shared supplier budgets partly address competition across sampled importing markets, but they remain nominal trade value proxies. Product- and plant-level capacity data would be required for engineering claims about available supply.
5.6. Future Research
Theoretical development can examine how buyer-level diversification interacts with network-wide competition for qualified suppliers and whether apparently resilient country portfolios create new common exposures across multi-tier production networks. Firm- and plant-level data could add certifications, lead time, defect rates, contract terms, physical capacity, product carbon footprints, and basin-level water risk. Longitudinal implementation studies could then test how decision architectures change supplier development, procurement performance, resilience, and environmental outcomes rather than evaluating only modeled portfolios.
Policy simulation is a second priority. Better identified supply constraints could support counterfactuals for capacity support, joint procurement, standards recognition, strategic inventories, infrastructure, export restrictions, and coordinated investment. Circular economy extensions should distinguish recovery yields, product durability, reuse, remanufacturing, collection systems, secondary material quality, and technology-specific substitution instead of representing circularity only as lower primary demand. Distributionally robust, stochastic, equilibrium, and multi-period formulations can then connect uncertainty in demand, price, capacity, policy, and link activity to these theoretical and policy questions.
6. Conclusions
This study develops and tests an integrated framework for sustainable diversification across six green technology and material supply chains. Concentration increased significantly in composition-stable photovoltaic, battery, and wind panels between 2015 and 2024, and latest-year sourcing remains dominated by a small number of effective suppliers. The predictive analysis confirms that established trade relationships contain substantial information about next-year link activity. Event-specific tests show that exits and reactivations can be predicted more effectively than rare first observed entries, while logistic regression remains competitive with gradient boosting. The results therefore favor model choice based on out-of-time validation and decision performance rather than model complexity alone.
Portfolio optimization substantially reduces modeled dependency under the stated assumptions. In the balanced scenario, median HHI falls by 53.7%, and exposure to the supplier country CO2 intensity of GDP proxy falls by 32.3%. Median unit value rises by 5.2%, predicted link activity falls by 4.8 percentage points, and one-way turnover reaches 0.512. The decision stage comparison provides an important qualification. Calibrated gradient boosting does not deliver a robust incremental advantage over calibrated logistic regression, although using predictive information performs better than omitting the probability term. Shared supplier budget tests further show that independently feasible diversification plans can place pressure on the same alternatives. These results make the framework most useful as a transparent screening and scenario tool rather than as an automated sourcing rule.
For enterprises, the practical value lies in transparent screening. Procurement, sustainability, operations, and risk teams can compare candidates, expose trade-offs, identify cases that require capacity or price verification, and select the simplest predictive model that performs adequately for the intended decision. The framework should be followed by supplier qualification, facility- and product-level sustainability evidence, quotations, contracts, and delivery performance data before reallocation.
For policymakers, the principal implication is that diversification is a collective as well as a bilateral problem. Shared capacity scenarios can reveal where several markets depend on the same alternatives and where coordinated capacity expansion, infrastructure, standards, strategic inventories, or circular economy measures deserve further analysis. The current estimates do not identify global physical capacity or embodied product emissions, so their role is to organize evidence, expose assumptions, and identify the empirical information needed for credible policy simulation.
Funding
The author has received no funding.
Institutional Review Board Statement
Not applicable.
Informed Consent Statement
Not applicable.
Data Availability Statement
The original contributions presented in this study are included in the article. Further inquiries can be directed to the corresponding author.
Conflicts of Interest
The author declares no conflicts of interest.
Appendix A. Country and Trade Coverage
Appendix A Table A1 provides reporter-level coverage for the analyses in RQ1–RQ4. The table distinguishes the initial trade records from the usable foreign supplier observations after the stated cleaning rules and makes the shorter reporting window for the United Arab Emirates visible. Values are descriptive totals within the selected product baskets and should not be compared with whole-economy merchandise imports.
Table A1.
Reporter-level trade coverage.
Appendix B. Variables, Sources, and Coverage
Appendix B Table A2 documents the country indicators matched to trade relationships. Coverage is measured over the 15,186 usable supplier-year observations. Indicator age is the difference between the trade year and the most recent available indicator year after prior value matching. A value is classified as stale when this gap exceeds five years. These diagnostics are used to interpret indicator quality and to construct the portfolio missingness penalty.
Table A2.
Country indicator definitions and trade row coverage.
Appendix C. Full Predictive Validation Results
The product-specific and rolling origin results below provide the detailed validation evidence summarized in Section 4.2. Test observations are used only for evaluation after model fitting and preprocessing on earlier data. Logistic regression serves as the transparent learned benchmark, while persistence provides a simple operational comparator. The coefficient estimates are interpreted only within the predictive specification and are not given a causal interpretation.
Table A3.
Chronological test performance by product group.
Table A4.
Complete rolling origin validation results, 2020–2023.
Appendix D. Portfolio Heterogeneity and Optimizer Diagnostics
Appendix D Table A5 disaggregates balanced transformation outcomes by technology. Appendix D Table A5 reports every optimizer status and feasibility relaxation across scenarios. These diagnostics qualify the aggregate medians in Section 4.3 and identify where the continuous convex solution required an operational support screen or additional capacity headroom.
Table A5.
Median balanced transformation changes by product group.
Table A6.
Optimizer status and constraint relaxations by scenario (83 cases each).
Appendix E. Additional Validation, Decision, Capacity, and Parameter Checks
This appendix provides additional robustness analyses for prediction, decision performance, parameter sensitivity, shared supplier budgets, and unit value coverage. The event risk panel uses a broader sample-bounded candidate universe than Appendix C so that exits, reactivations, and first observed entries can be evaluated separately. The historical decision comparison holds the sourcing problem fixed while changing only the probability model. The shared budget analysis imposes aggregate constraints across importing markets. All capacity quantities remain trade value scenario proxies unless explicitly stated otherwise.
Table A7.
Prospective event risk performance across the 2020–2023 forecast origins.
Figure A1.
Event probability calibration by risk set and predictive model. Note: Calibration uses out-of-time forecasts only. Trade link events describe commercial activity and do not measure delivery performance.
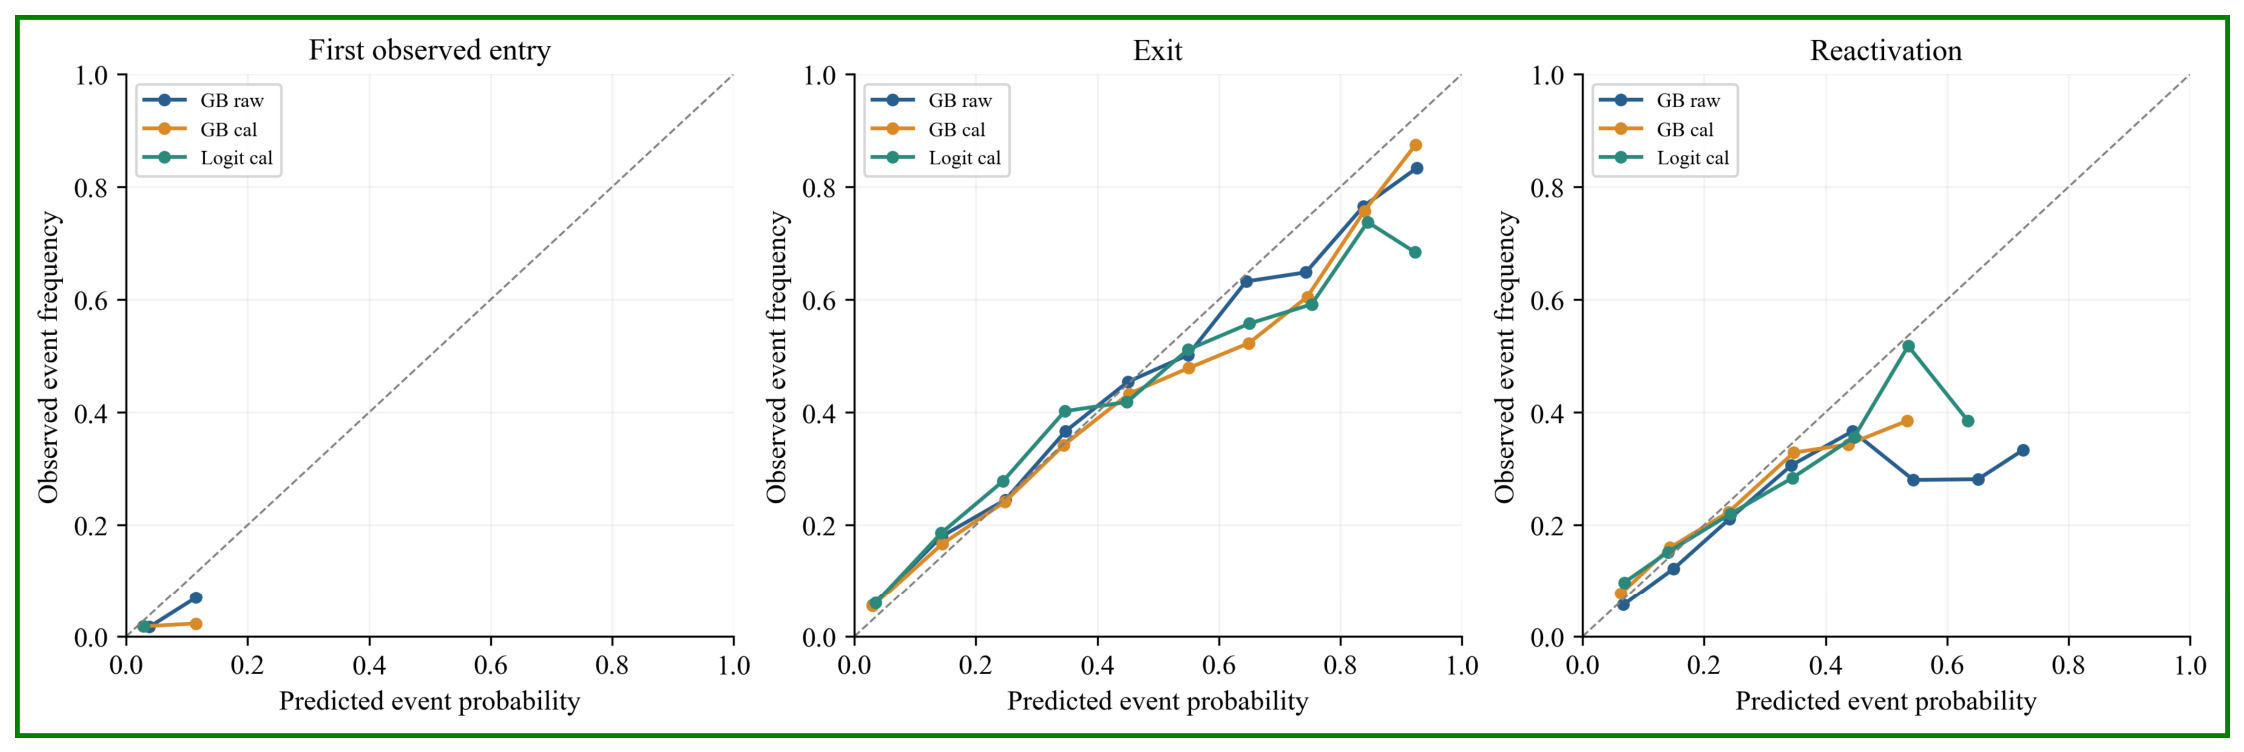
Table A8.
Selected time-ordered hyperparameter configurations.
Table A9.
Incremental decision performance of calibrated gradient boosting.
Figure A2.
Incremental decision benefit of gradient boosting relative to simpler probability specifications. Note: The decision-stage comparison holds common candidate sets, objective terms, and feasibility constraints fixed.
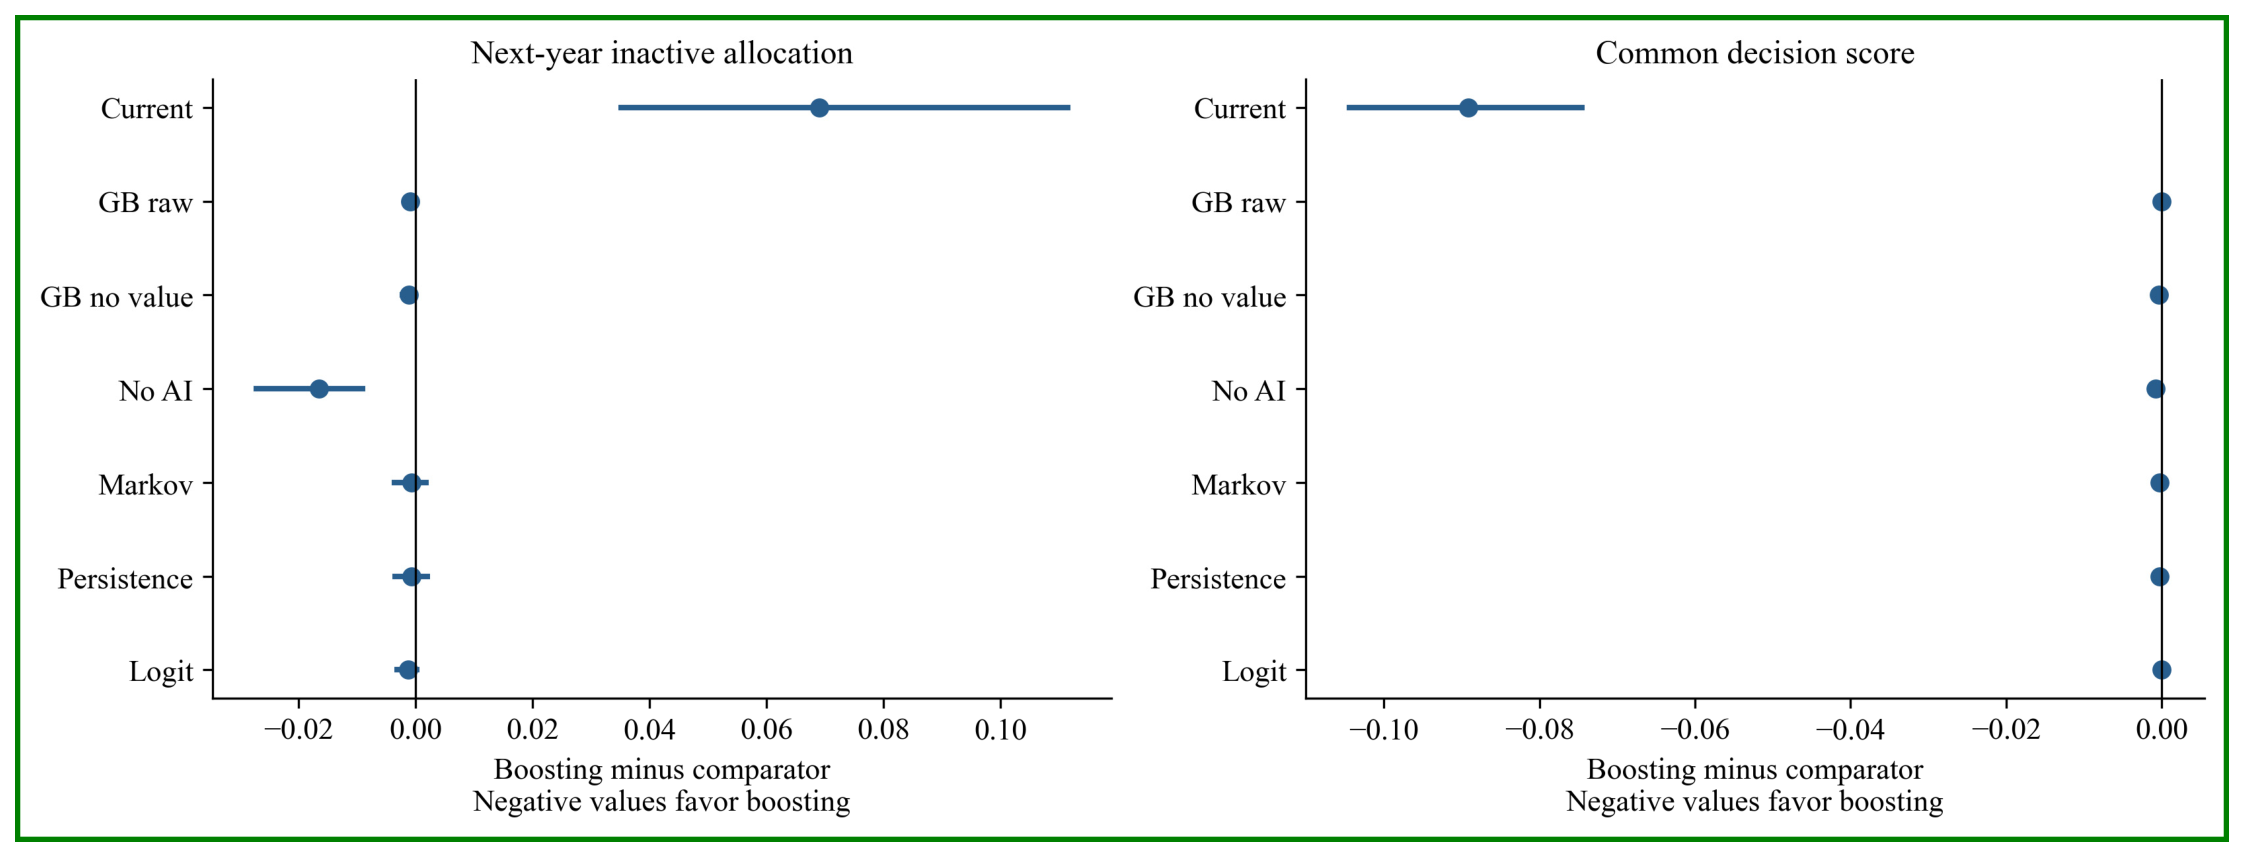
Table A10.
Basis and sensitivity range for key decision parameters.
Figure A3.
Strict latest-case feasibility across share cap and historical expansion settings. Note: Feasibility is assessed without automatic relaxation. The baseline 40% cap and 1.5 times expansion setting is feasible for 58 of 83 latest cases.
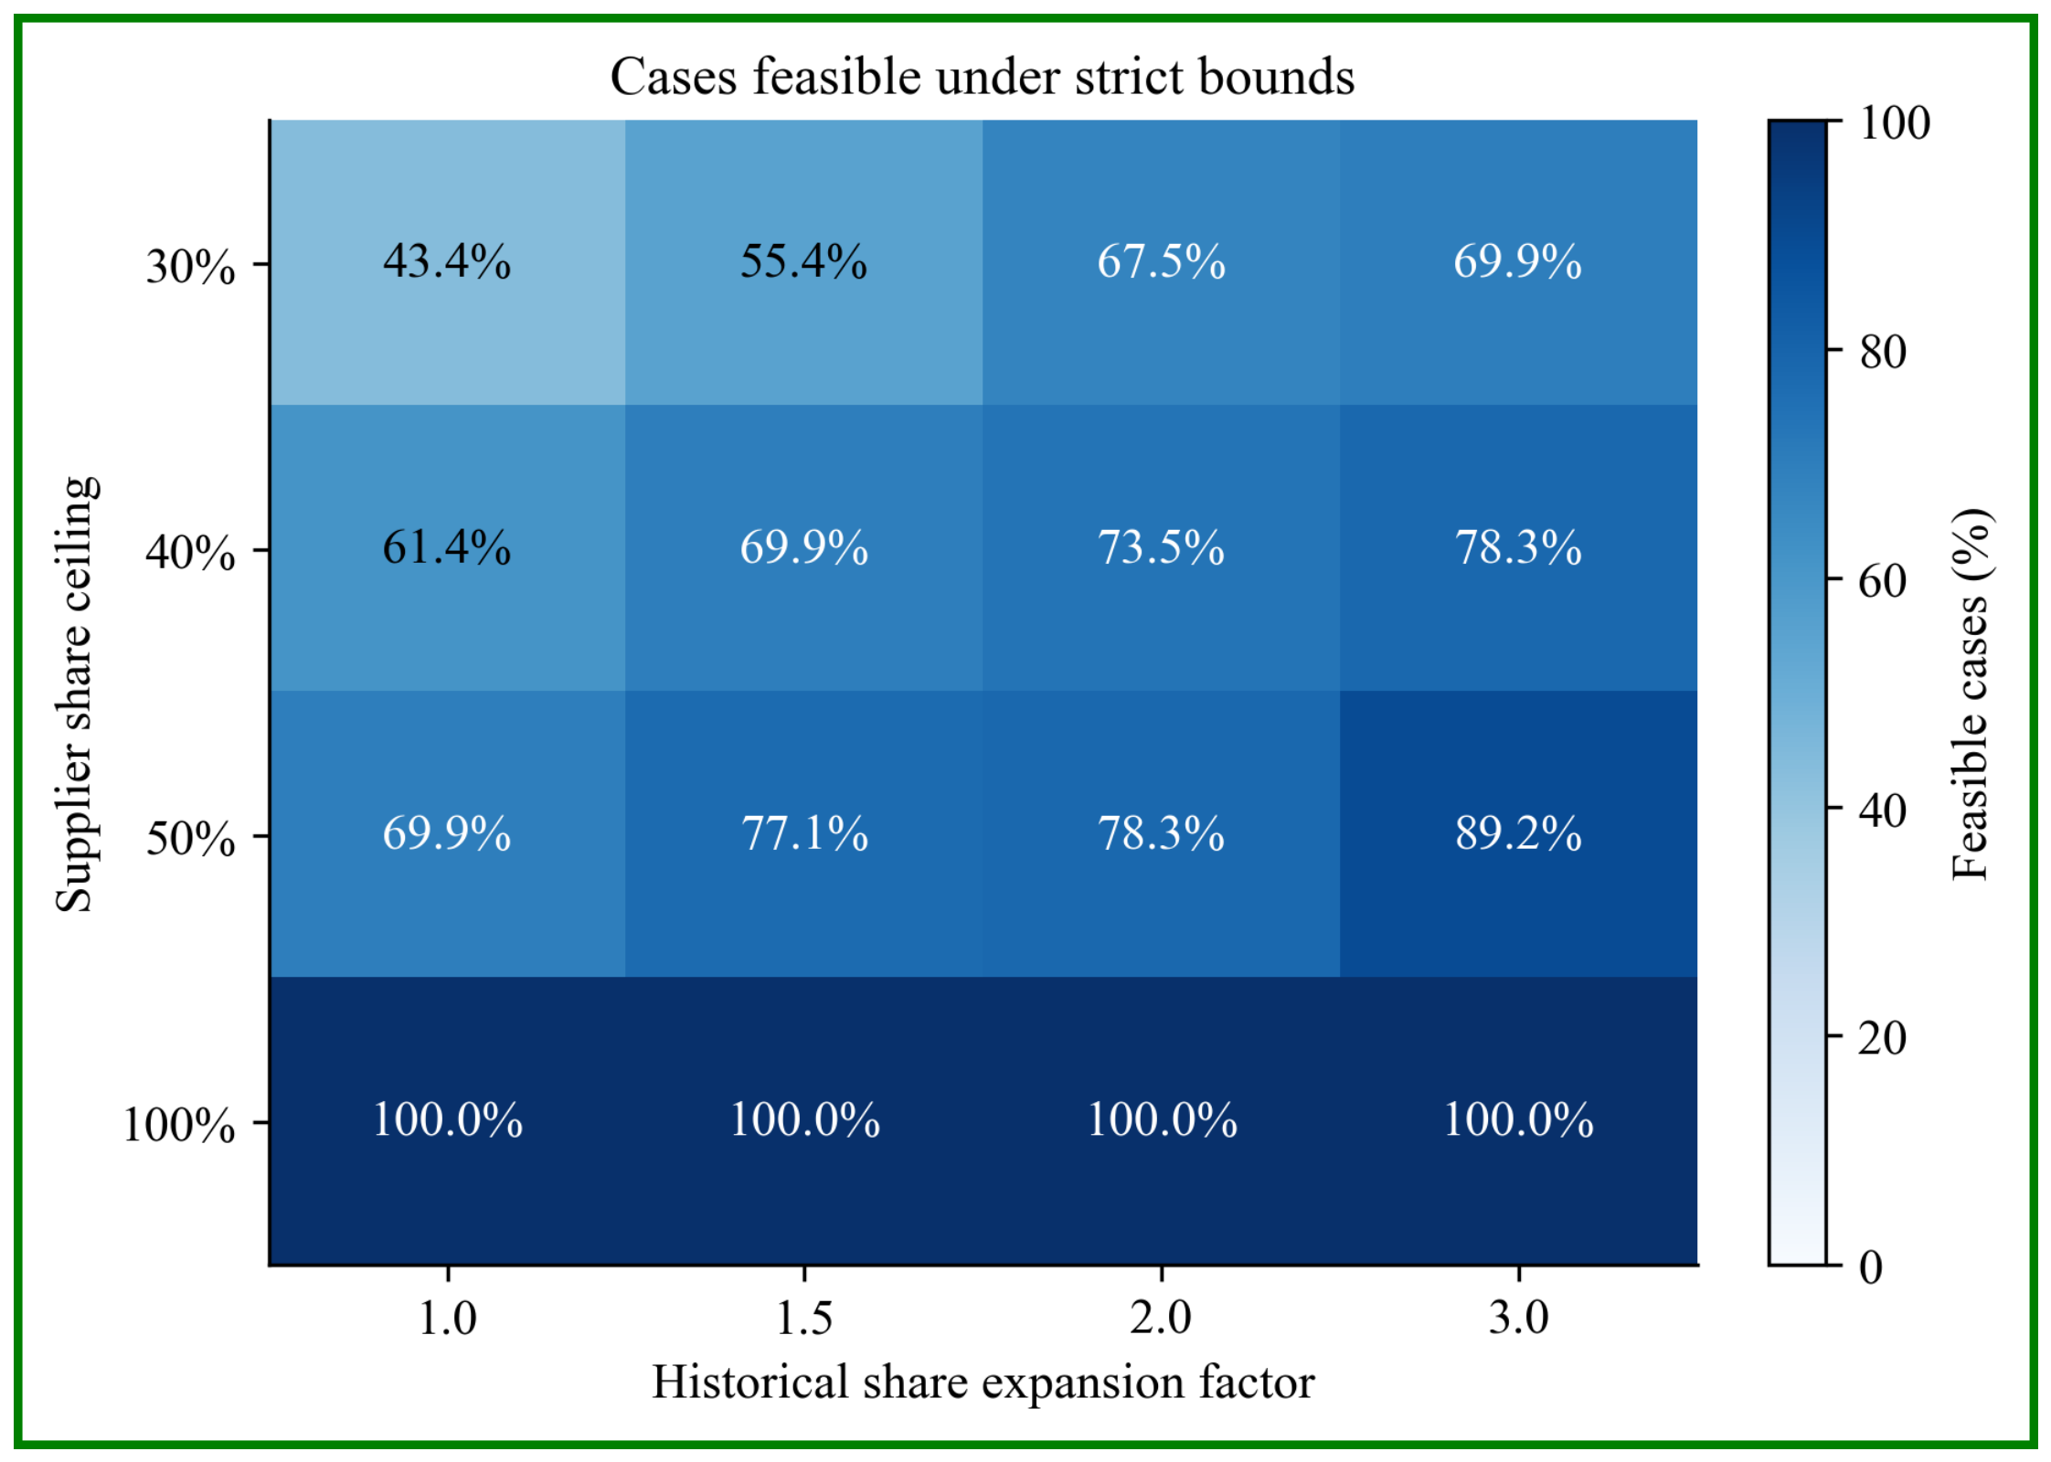
Table A11.
Selected latest-case parameter and data quality sensitivities.
Table A12.
Shared supplier budget feasibility at the 1.5× trade value factor in 2023.
Table A13.
Latest-case unit value proxy coverage by technology.
Figure A4.
Minimum unallocated demand under shared supplier-budget scenarios. Note: The figure distinguishes the full sample from individually feasible subsamples and reports China and demand reduction sensitivities as conditional scenarios.
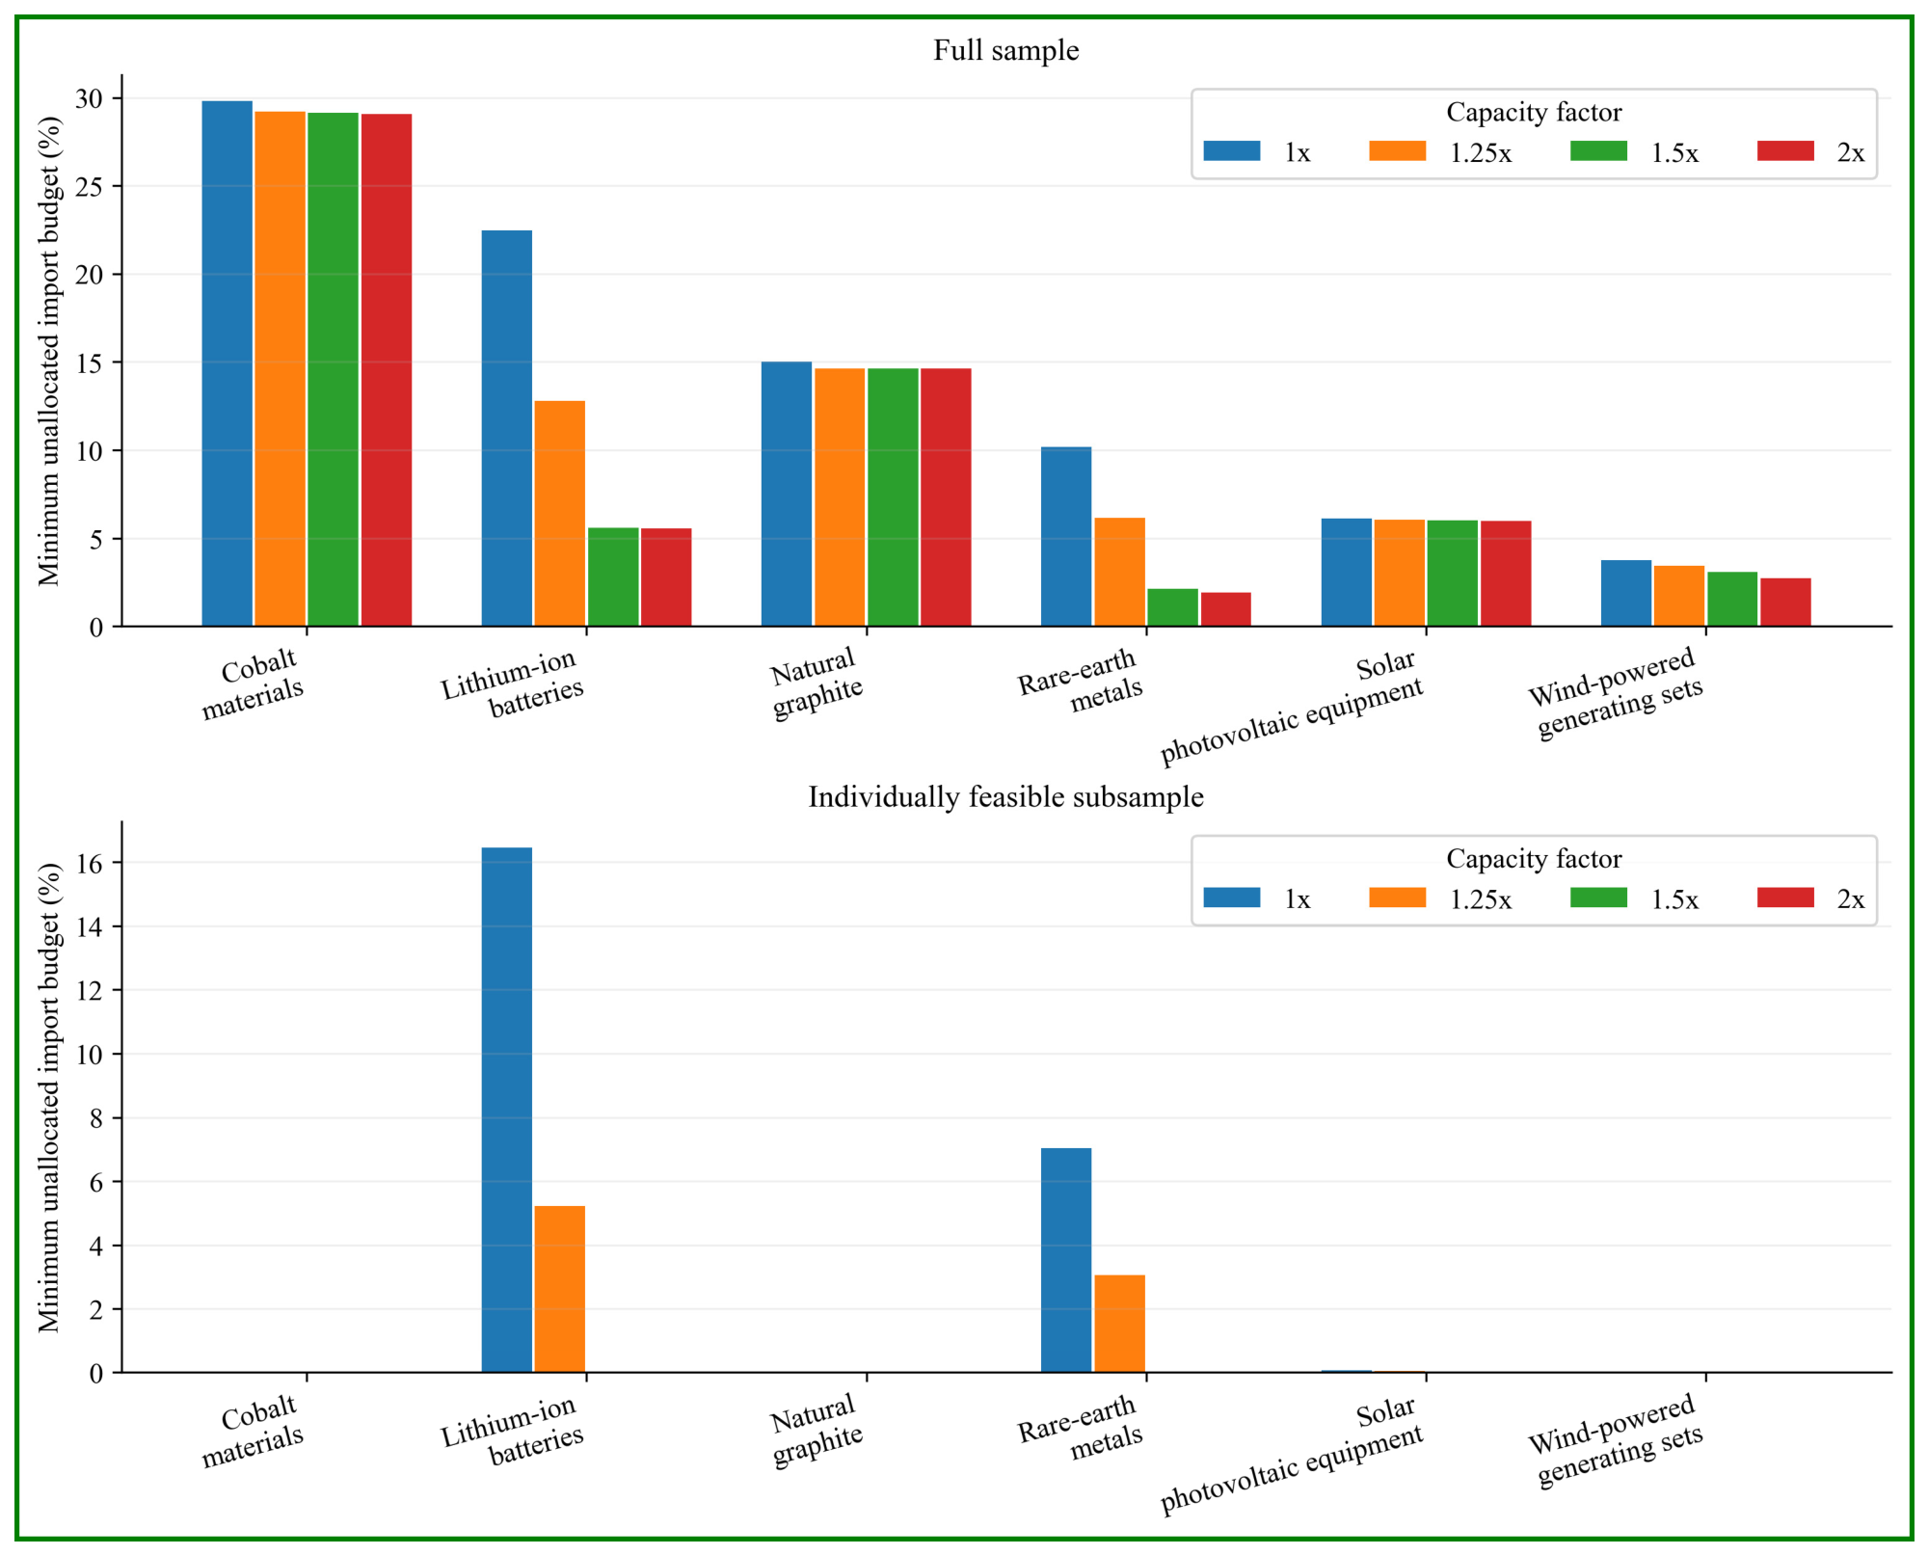
Figure A5.
Unit value data coverage by technology and year. Note: Low photovoltaic quantity coverage is a central reason for treating price outcomes as directional and for reporting no price and strict observed price sensitivity checks.
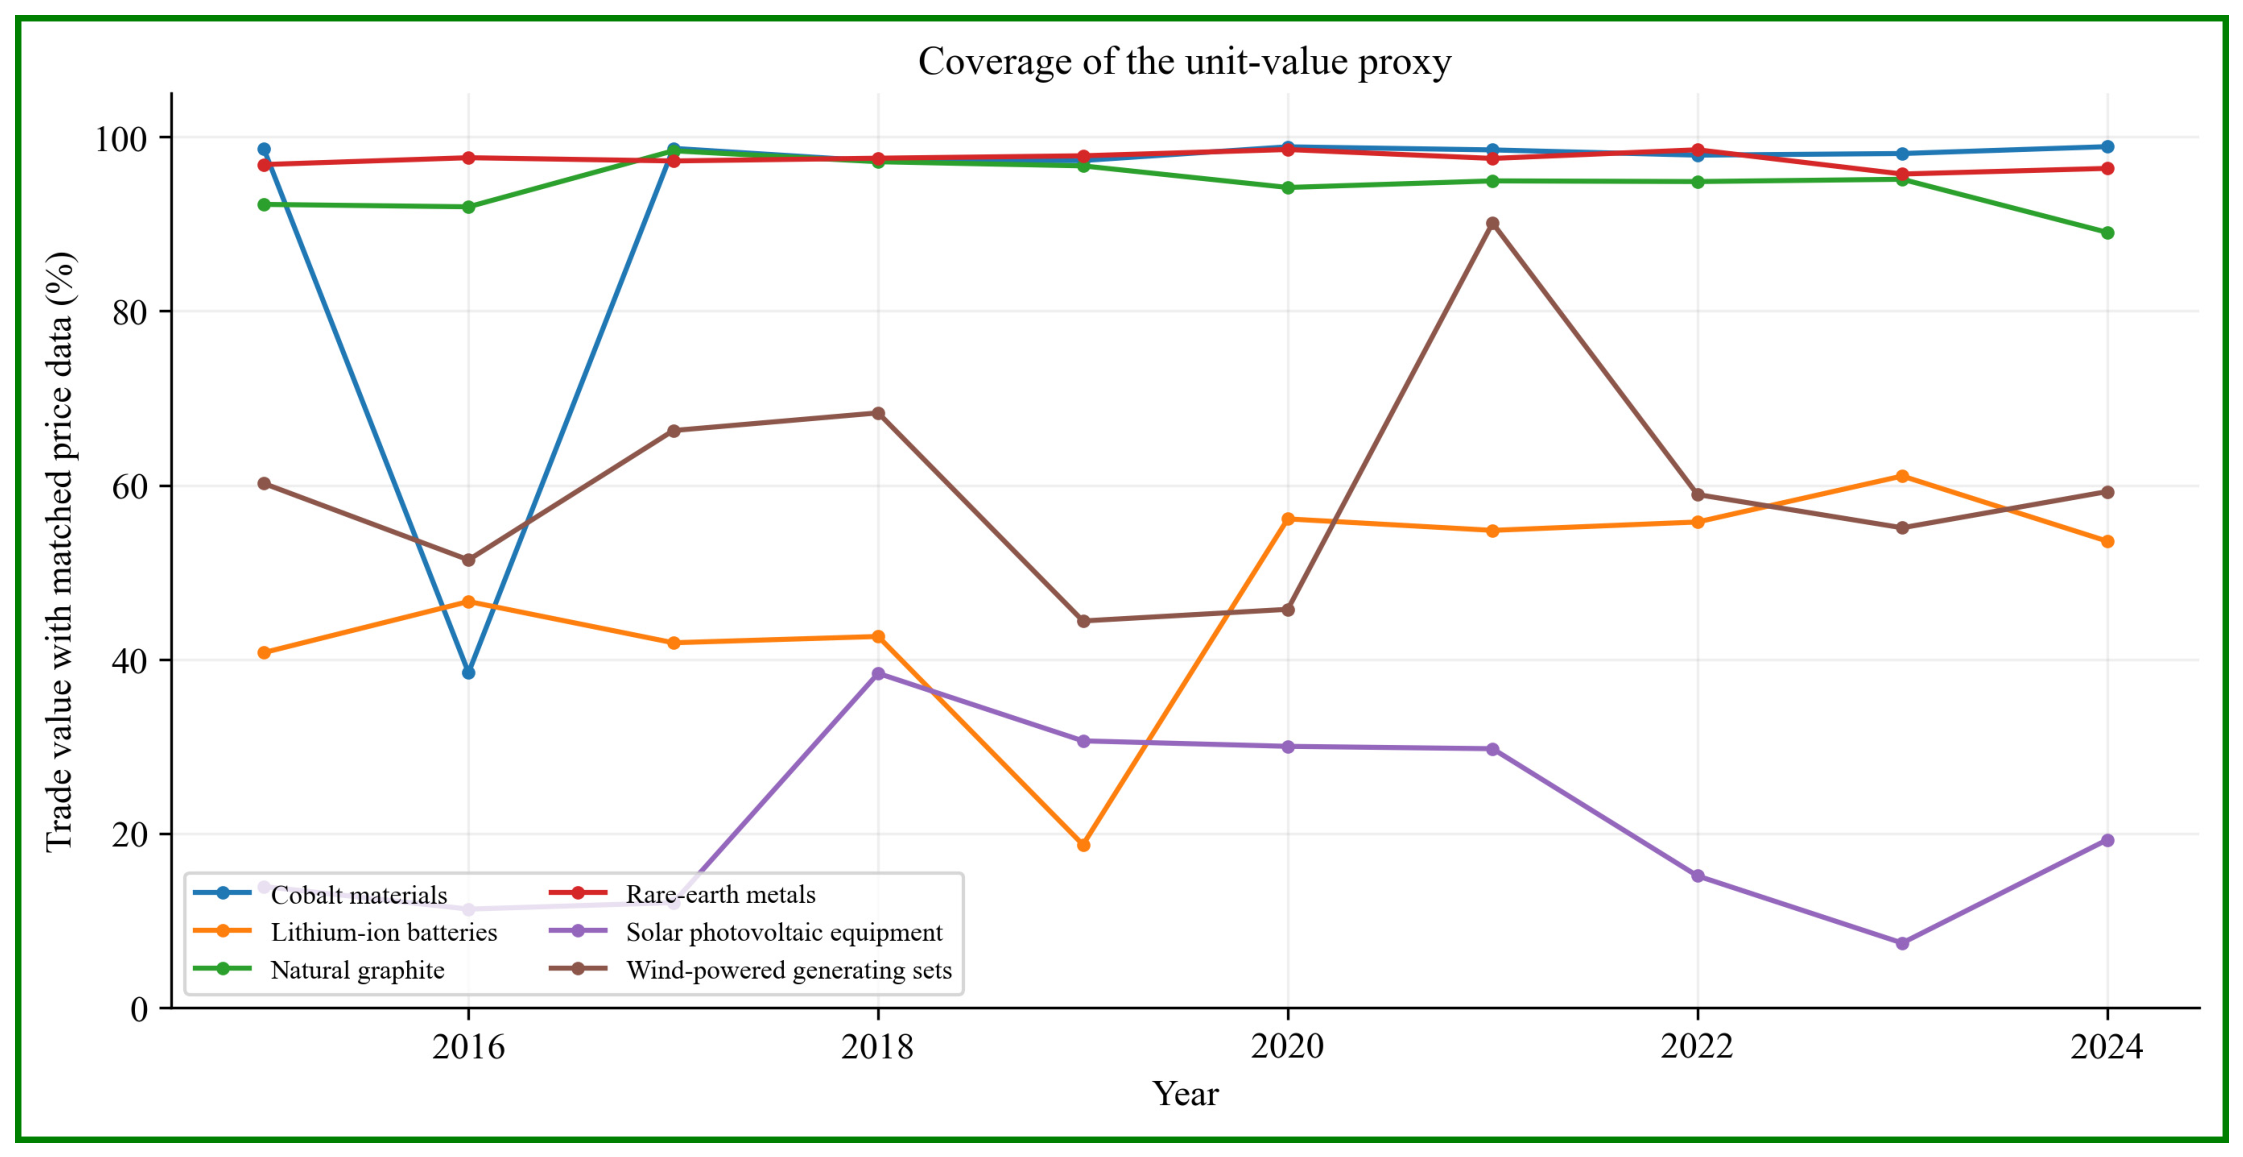
References
- International Energy Agency (IEA). Global Critical Minerals Outlook 2025; IEA: Paris, France, 2025; Available online: https://www.iea.org/reports/global-critical-minerals-outlook-2025 (accessed on 28 August 2026).
- Kowalski, P.; Legendre, C. Raw Materials Critical for the Green Transition: Production, International Trade and Export Restrictions; OECD Trade Policy Papers, No. 269; OECD Publishing: Paris, France, 2023. [Google Scholar] [CrossRef] [Scilit]
- Organisation for Economic Co-operation and Development (OECD). OECD Inventory of Export Restrictions on Critical Raw Materials 2026: Monitoring the Use of Export Restrictions Amidst Growing Market and Policy Tensions; OECD Publishing: Paris, France, 2026. [Google Scholar] [CrossRef] [Scilit]
- Seuring, S.; Müller, M. From a literature review to a conceptual framework for sustainable supply chain management. J. Clean. Prod. 2008, 16, 1699–1710. [Google Scholar] [CrossRef] [Scilit]
- Carter, C.R.; Rogers, D.S. A framework of sustainable supply chain management: Moving toward new theory. Int. J. Phys. Distrib. Logist. Manag. 2008, 38, 360–387. [Google Scholar] [CrossRef] [Scilit]
- Ahi, P.; Searcy, C. A comparative literature analysis of definitions for green and sustainable supply chain management. J. Clean. Prod. 2013, 52, 329–341. [Google Scholar] [CrossRef] [Scilit]
- Christopher, M.; Peck, H. Building the resilient supply chain. Int. J. Logist. Manag. 2004, 15, 1–14. [Google Scholar] [CrossRef] [Scilit]
- Tang, C.S. Robust strategies for mitigating supply chain disruptions. Int. J. Logist. Res. Appl. 2006, 9, 33–45. [Google Scholar] [CrossRef] [Scilit]
- Snyder, L.V.; Atan, Z.; Peng, P.; Rong, Y.; Schmitt, A.J.; Sinsoysal, B. OR/MS models for supply chain disruptions: A review. IIE Trans. 2016, 48, 89–109. [Google Scholar] [CrossRef] [Scilit]
- Ivanov, D.; Dolgui, A. Viability of intertwined supply networks: Extending the supply chain resilience angles towards survivability. A position paper motivated by COVID-19 outbreak. Int. J. Prod. Res. 2020, 58, 2904–2915. [Google Scholar] [CrossRef] [Scilit]
- Waller, M.A.; Fawcett, S.E. Data science, predictive analytics, and big data: A revolution that will transform supply chain design and management. J. Bus. Logist. 2013, 34, 77–84. [Google Scholar] [CrossRef] [Scilit]
- Kache, F.; Seuring, S. Challenges and opportunities of digital information at the intersection of big data analytics and supply chain management. Int. J. Oper. Prod. Manag. 2017, 37, 10–36. [Google Scholar] [CrossRef] [Scilit]
- Baryannis, G.; Validi, S.; Dani, S.; Antoniou, G. Supply chain risk management and artificial intelligence: State of the art and future research directions. Int. J. Prod. Res. 2019, 57, 2179–2202. [Google Scholar] [CrossRef] [Scilit]
- Toorajipour, R.; Sohrabpour, V.; Nazarpour, A.; Oghazi, P.; Fischl, M. Artificial intelligence in supply chain management: A systematic literature review. J. Bus. Res. 2021, 122, 502–517. [Google Scholar] [CrossRef] [Scilit]
- Markowitz, H. Portfolio selection. J. Finance 1952, 7, 77–91. [Google Scholar] [CrossRef] [Scilit]
- Sawik, T. Selection of resilient supply portfolio under disruption risks. Omega 2013, 41, 259–269. [Google Scholar] [CrossRef] [Scilit]
- Hund, K.; La Porta, D.; Fabregas, T.P.; Laing, T.; Drexhage, J. Minerals for Climate Action: The Mineral Intensity of the Clean Energy Transition; World Bank: Washington, DC, USA, 2020; Available online: https://pubdocs.worldbank.org/en/961711588875536384/Minerals-for-Climate-Action-The-Mineral-Intensity-of-the-Clean-Energy-Transition.pdf (accessed on 28 August 2026).
- International Renewable Energy Agency (IRENA). Geopolitics of the Energy Transition: Critical Materials; IRENA: Abu Dhabi, United Arab Emirates, 2023; Available online: https://www.irena.org/Publications/2023/Jul/Geopolitics-of-the-Energy-Transition-Critical-Materials (accessed on 28 August 2026).
- International Energy Agency (IEA). The Role of Critical Minerals in Clean Energy Transitions; IEA: Paris, France, 2021; Available online: https://www.iea.org/reports/the-role-of-critical-minerals-in-clean-energy-transitions (accessed on 28 August 2026).
- Graedel, T.E.; Harper, E.M.; Nassar, N.T.; Nuss, P.; Reck, B.K. Criticality of metals and metalloids. Proc. Natl. Acad. Sci. USA 2015, 112, 4257–4262. [Google Scholar] [CrossRef] [Scilit] [PubMed]
- Nuss, P.; Eckelman, M.J. Life cycle assessment of metals: A scientific synthesis. PLoS ONE 2014, 9, e101298. [Google Scholar] [CrossRef] [Scilit] [PubMed]
- Valero, A.; Valero, A.; Calvo, G.; Ortego, A. Material bottlenecks in the future development of green technologies. Renew. Sustain. Energy Rev. 2018, 93, 178–200. [Google Scholar] [CrossRef] [Scilit]
- Lèbre, É.; Stringer, M.; Svobodova, K.; Owen, J.R.; Kemp, D.; Côte, C.; Arratia-Solar, A.; Valenta, R.K. The social and environmental complexities of extracting energy transition metals. Nat. Commun. 2020, 11, 4823. [Google Scholar] [CrossRef] [Scilit] [PubMed]
- Anderson, J.E.; van Wincoop, E. Gravity with gravitas: A solution to the border puzzle. Am. Econ. Rev. 2003, 93, 170–192. [Google Scholar] [CrossRef] [Scilit]
- Helpman, E.; Melitz, M.; Rubinstein, Y. Estimating trade flows: Trading partners and trading volumes. Q. J. Econ. 2008, 123, 441–487. [Google Scholar] [CrossRef] [Scilit]
- Head, K.; Mayer, T. Gravity equations: Workhorse, toolkit, and cookbook. In Handbook of International Economics; Gopinath, G., Helpman, E., Rogoff, K., Eds.; Elsevier: Amsterdam, The Netherlands, 2014; Volume 4, pp. 131–195. [Google Scholar] [CrossRef] [Scilit]
- Ivanov, D.; Dolgui, A. A digital supply chain twin for managing the disruption risks and resilience in the era of Industry 4.0. Prod. Plan. Control 2021, 32, 775–788. [Google Scholar] [CrossRef] [Scilit]
- Brandenburg, M.; Govindan, K.; Sarkis, J.; Seuring, S. Quantitative models for sustainable supply chain management: Developments and directions. Eur. J. Oper. Res. 2014, 233, 299–312. [Google Scholar] [CrossRef] [Scilit]
- Hassini, E.; Surti, C.; Searcy, C. A literature review and a case study of sustainable supply chains with a focus on metrics. Int. J. Prod. Econ. 2012, 140, 69–82. [Google Scholar] [CrossRef] [Scilit]
- Weber, C.A.; Current, J.R.; Benton, W.C. Vendor selection criteria and methods. Eur. J. Oper. Res. 1991, 50, 2–18. [Google Scholar] [CrossRef] [Scilit]
- Govindan, K.; Rajendran, S.; Sarkis, J.; Murugesan, P. Multi criteria decision making approaches for green supplier evaluation and selection: A literature review. J. Clean. Prod. 2015, 98, 66–83. [Google Scholar] [CrossRef] [Scilit]
- Hosseini, S.; Ivanov, D.; Dolgui, A. Review of quantitative methods for supply chain resilience analysis. Transp. Res. Part E Logist. Transp. Rev. 2019, 125, 285–307. [Google Scholar] [CrossRef] [Scilit]
- Pagell, M.; Wu, Z. Building a more complete theory of sustainable supply chain management using case studies of 10 exemplars. J. Supply Chain Manag. 2009, 45, 37–56. [Google Scholar] [CrossRef] [Scilit]
- Wamba, S.F.; Gunasekaran, A.; Akter, S.; Ren, S.J.-F.; Dubey, R.; Childe, S.J. Big data analytics and firm performance: Effects of dynamic capabilities. J. Bus. Res. 2017, 70, 356–365. [Google Scholar] [CrossRef] [Scilit]
- Dubey, R.; Gunasekaran, A.; Childe, S.J.; Papadopoulos, T.; Luo, Z.; Wamba, S.F.; Roubaud, D. Can big data and predictive analytics improve social and environmental sustainability? Technol. Forecast. Soc. Change 2019, 144, 534–545. [Google Scholar] [CrossRef] [Scilit]
- Min, H. Artificial intelligence in supply chain management: Theory and applications. Int. J. Logist. Res. Appl. 2010, 13, 13–39. [Google Scholar] [CrossRef] [Scilit]
- Friedman, J.H. Greedy function approximation: A gradient boosting machine. Ann. Stat. 2001, 29, 1189–1232. [Google Scholar] [CrossRef] [Scilit]
- Fawcett, T. An introduction to ROC analysis. Pattern Recognit. Lett. 2006, 27, 861–874. [Google Scholar] [CrossRef] [Scilit]
- Saito, T.; Rehmsmeier, M. The precision-recall plot is more informative than the ROC plot when evaluating binary classifiers on imbalanced datasets. PLoS ONE 2015, 10, e0118432. [Google Scholar] [CrossRef] [Scilit]
- Brier, G.W. Verification of forecasts expressed in terms of probability. Mon. Weather Rev. 1950, 78, 1–3. [Google Scholar] [CrossRef] [Scilit]
- Naeini, M.P.; Cooper, G.F.; Hauskrecht, M. Obtaining well calibrated probabilities using Bayesian binning. Proc. AAAI Conf. Artif. Intell. 2015, 29, 2901–2907. [Google Scholar] [CrossRef] [Scilit]
- Fisher, A.; Rudin, C.; Dominici, F. All models are wrong, but many are useful: Learning a variable’s importance by studying an entire class of prediction models simultaneously. J. Mach. Learn. Res. 2019, 20, 1–81. Available online: https://jmlr.org/papers/v20/18-760.html (accessed on 29 August 2026).
- Chai, J.; Liu, J.N.K.; Ngai, E.W.T. Application of decision-making techniques in supplier selection: A systematic review of literature. Expert Syst. Appl. 2013, 40, 3872–3885. [Google Scholar] [CrossRef] [Scilit]
- United Nations Statistics Division. UN Comtrade Database. Available online: https://comtradeplus.un.org/ (accessed on 28 August 2026).
- World Bank. World Development Indicators. Available online: https://databank.worldbank.org/source/world-development-indicators (accessed on 28 August 2026).
- European Commission, Joint Research Centre. Emissions Database for Global Atmospheric Research (EDGAR). Available online: https://edgar.jrc.ec.europa.eu/ (accessed on 28 August 2026).
- International Labour Organization. ILOSTAT Database. Available online: https://ilostat.ilo.org/data/ (accessed on 28 August 2026).
- Food and Agriculture Organization of the United Nations (FAO). AQUASTAT Core Database. Available online: https://www.fao.org/aquastat/en/databases/maindatabase/ (accessed on 28 August 2026).
- World Bank. Logistics Performance Index. Available online: https://lpi.worldbank.org/en/home (accessed on 28 August 2026).
- World Bank. The Worldwide Governance Indicators: Revised Methodology for Measuring Governance Using Perception Data; World Bank: Washington, DC, USA, 2025; Available online: https://www.worldbank.org/en/publication/worldwide-governance-indicators (accessed on 28 August 2026).
- Mayer, T.; Zignago, S. Notes on CEPII’s Distances Measures: The GeoDist Database; CEPII Working Paper No. 2011-25; CEPII: Paris, France, 2011. Available online: https://www.cepii.fr/CEPII/en/publications/wp/abstract.asp?NoDoc=3877 (accessed on 28 August 2026).
- Pedregosa, F.; Varoquaux, G.; Gramfort, A.; Michel, V.; Thirion, B.; Grisel, O.; Blondel, M.; Prettenhofer, P.; Weiss, R.; Dubourg, V.; et al. Scikit-learn: Machine learning in Python. J. Mach. Learn. Res. 2011, 12, 2825–2830. Available online: https://jmlr.org/papers/v12/pedregosa11a.html (accessed on 28 August 2026).
- Monarch, R.; Schmidt-Eisenlohr, T. Longevity and the value of trade relationships. J. Int. Econ. 2023, 145, 103842. [Google Scholar] [CrossRef] [Scilit]
- Galbraith, J.R. Organization design: An information processing view. Interfaces 1974, 4, 28–36. [Google Scholar] [CrossRef] [Scilit]
- Teece, D.J. Explicating dynamic capabilities: The nature and microfoundations of (sustainable) enterprise performance. Strateg. Manag. J. 2007, 28, 1319–1350. [Google Scholar] [CrossRef] [Scilit]
- Ali, S.H.; Giurco, D.; Arndt, N.; Nickless, E.; Brown, G.; Demetriades, A.; Durrheim, R.; Enriquez, M.A.; Kinnaird, J.; Littleboy, A.; et al. Mineral supply for sustainable development requires resource governance. Nature 2017, 543, 367–372. [Google Scholar] [CrossRef] [Scilit] [PubMed]
- Sovacool, B.K.; Ali, S.H.; Bazilian, M.; Radley, B.; Nemery, B.; Okatz, J.; Mulvaney, D. Sustainable minerals and metals for a low-carbon future. Science 2020, 367, 30–33. [Google Scholar] [CrossRef] [Scilit] [PubMed]
- Watari, T.; Nansai, K.; Nakajima, K. Review of critical metal dynamics to 2050 for 48 elements. Resour. Conserv. Recycl. 2020, 155, 104669. [Google Scholar] [CrossRef] [Scilit]
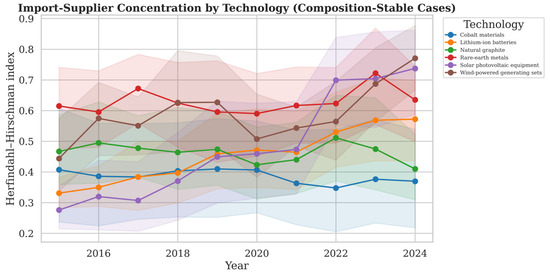
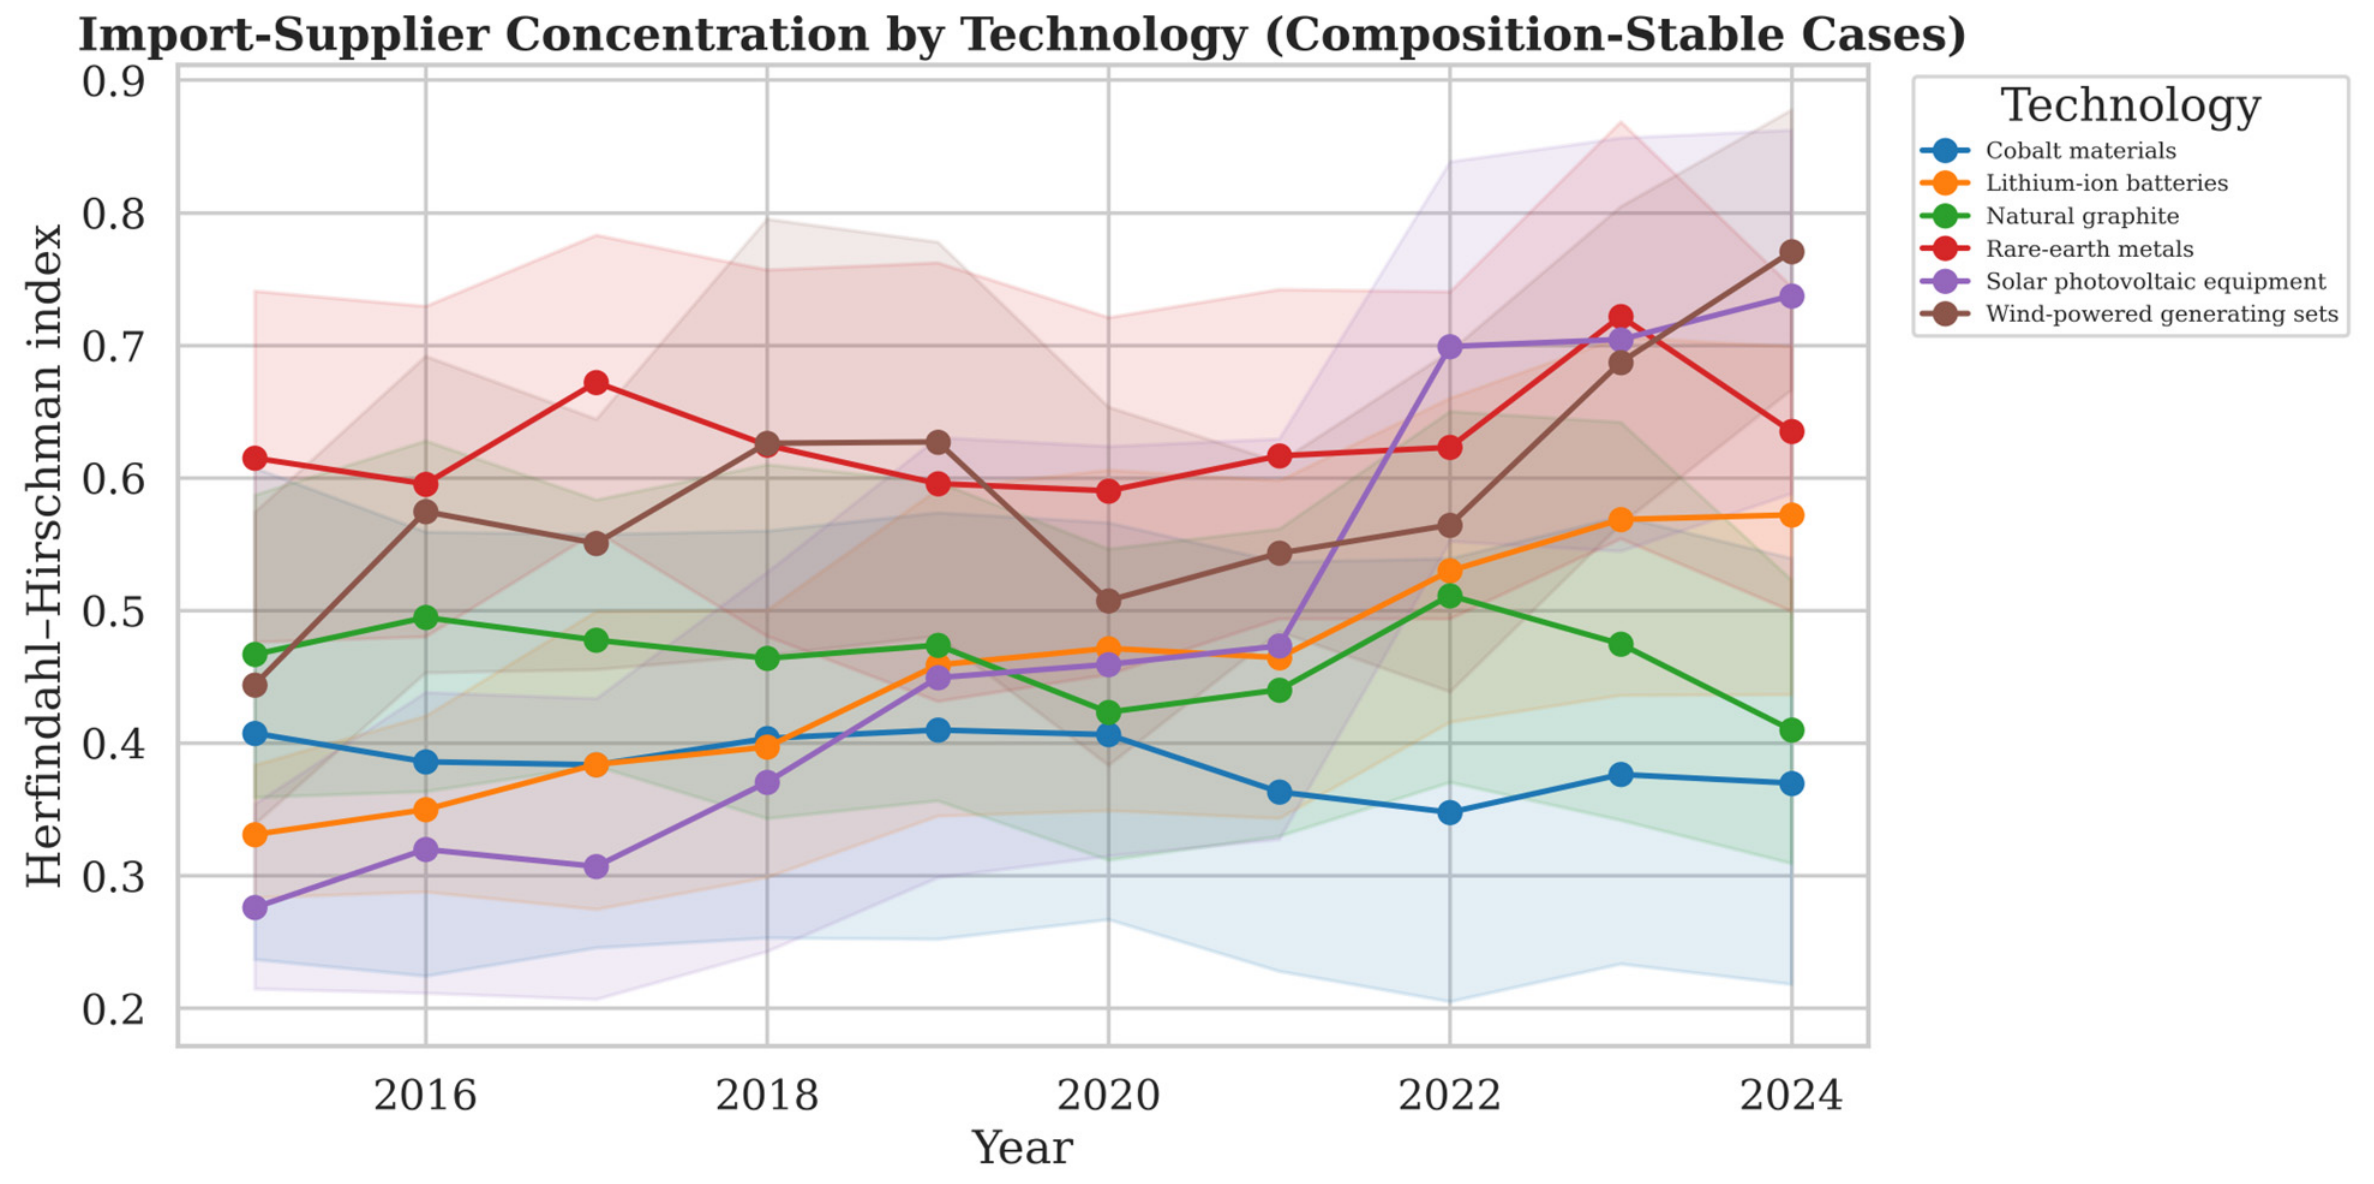
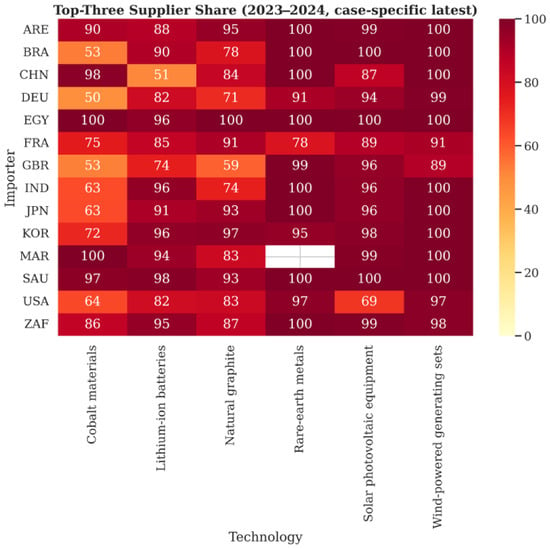
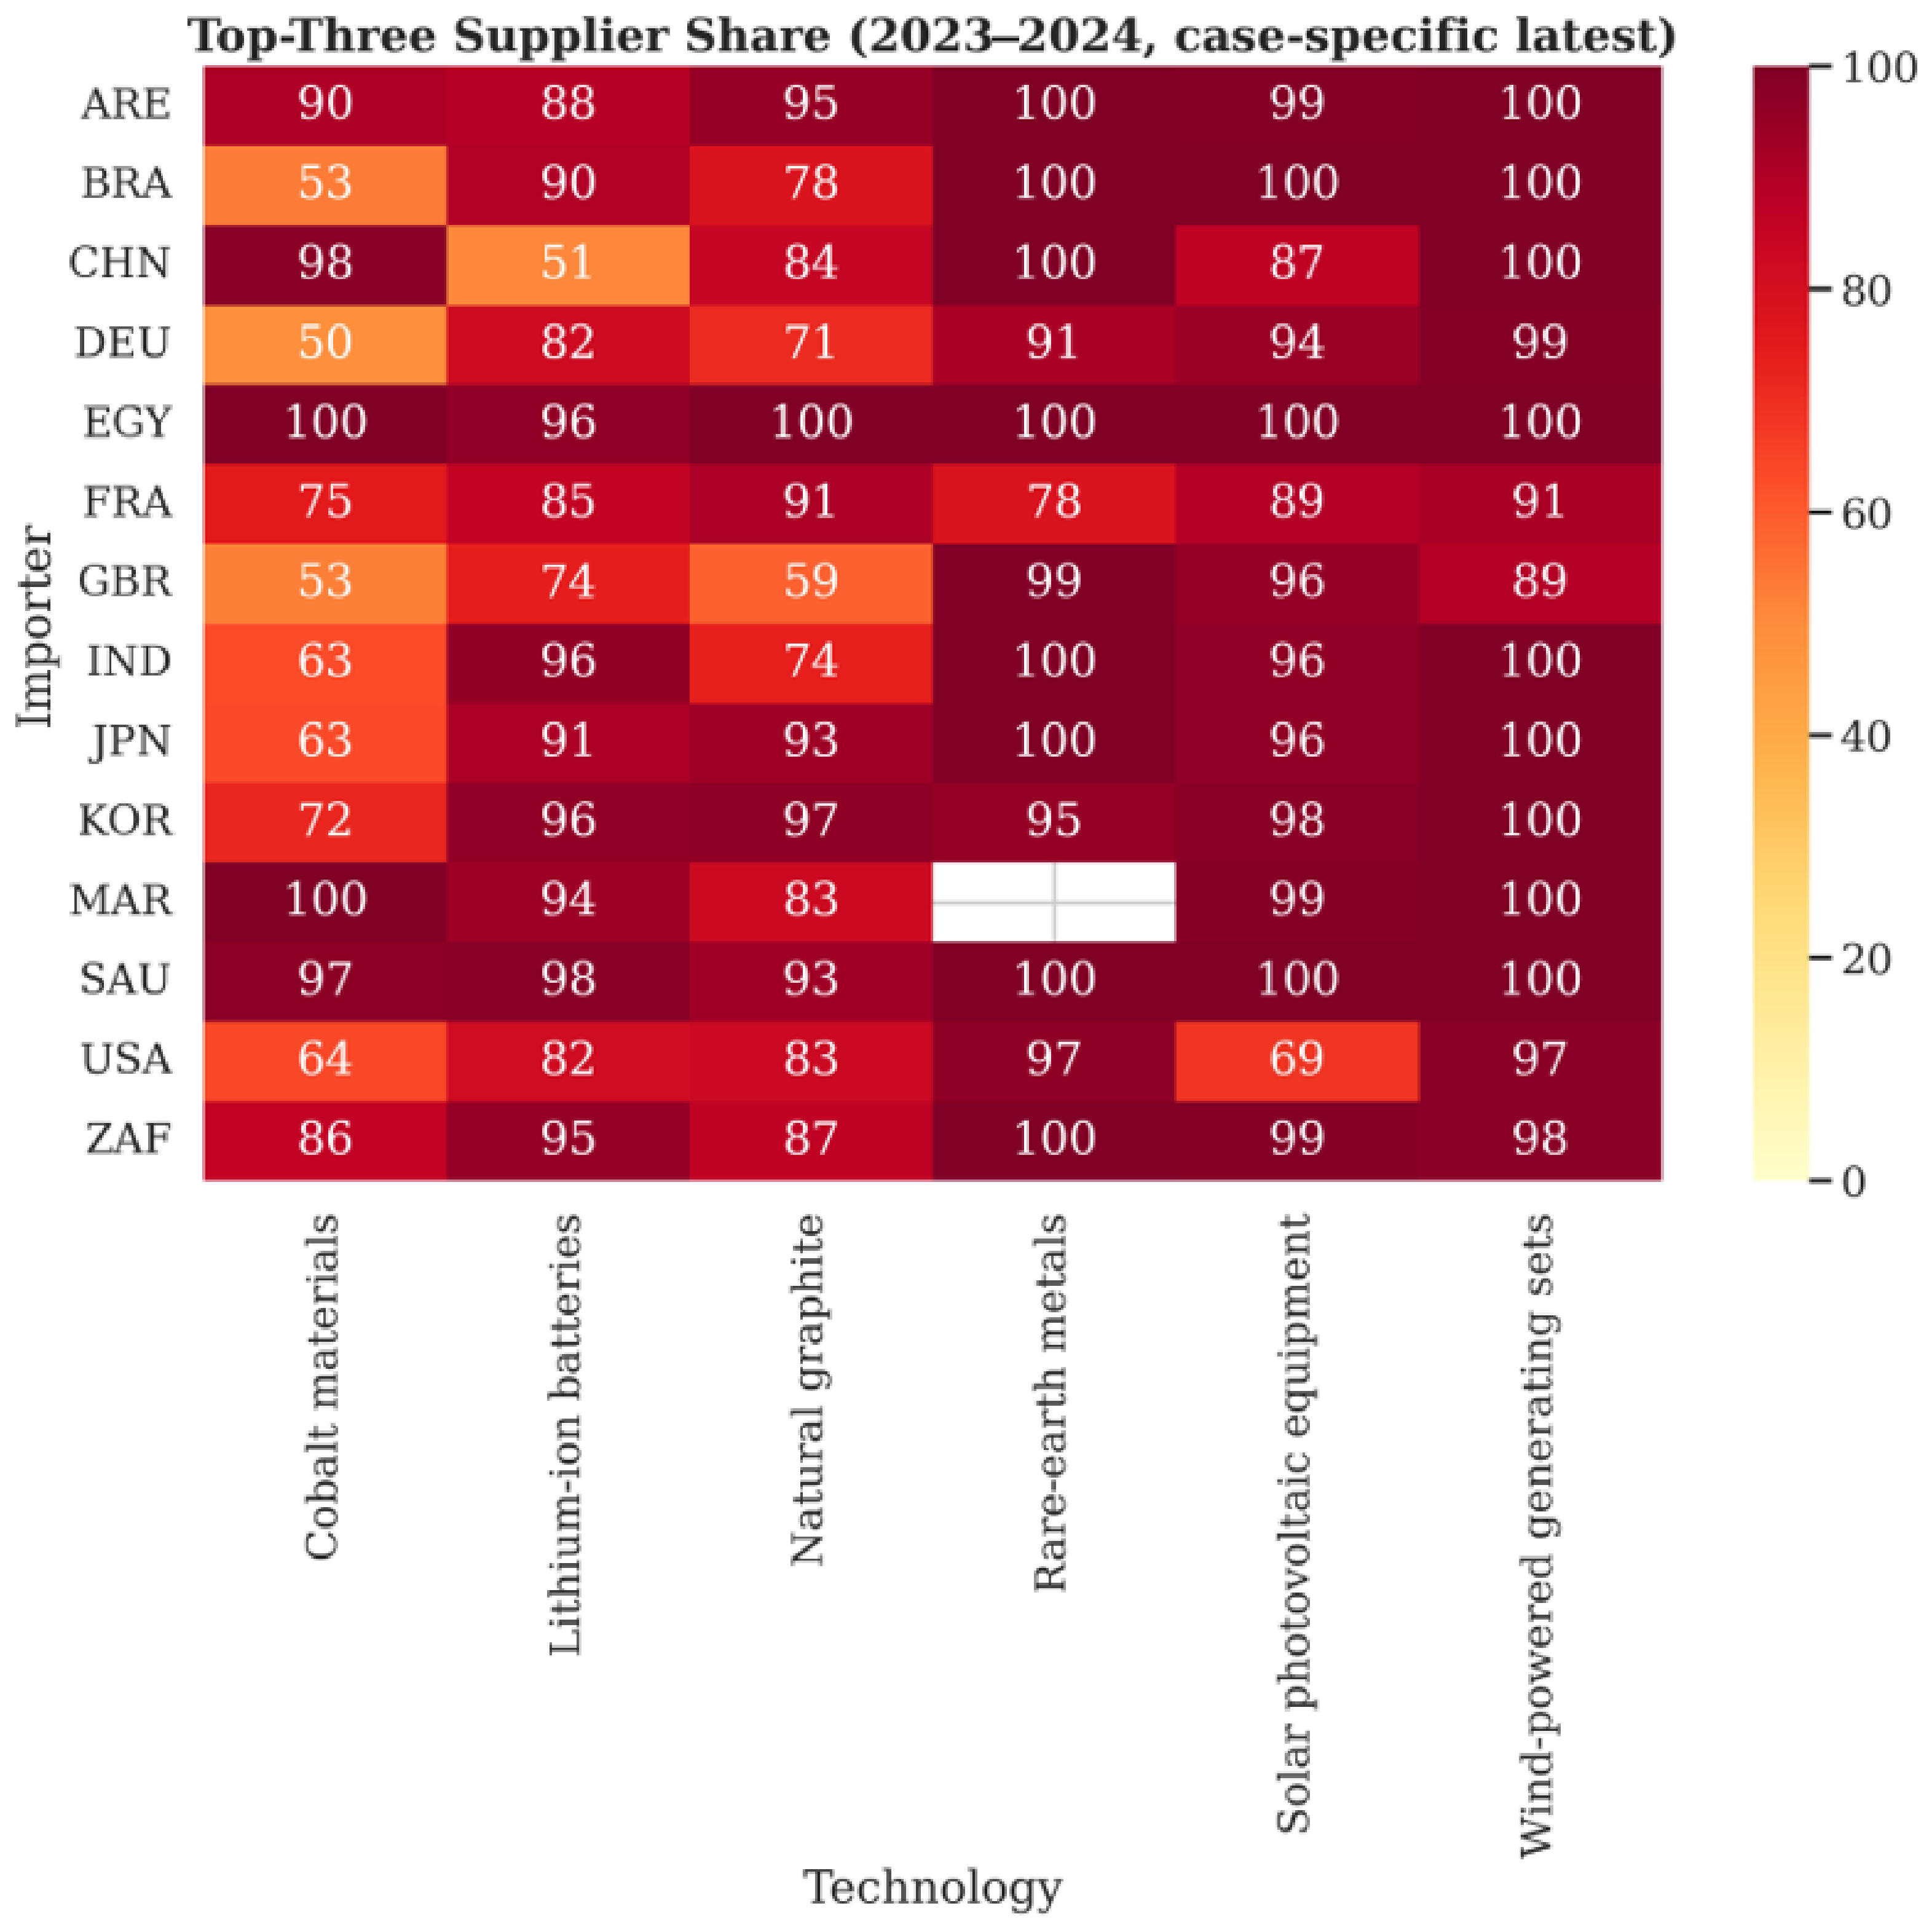
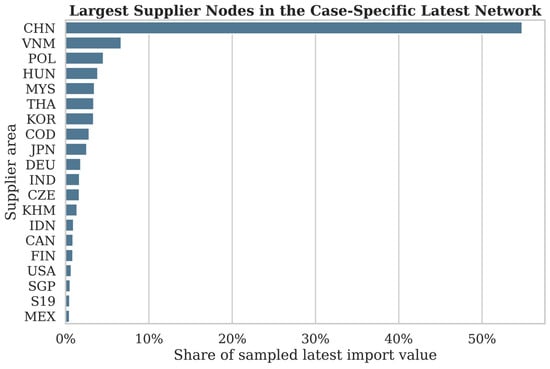
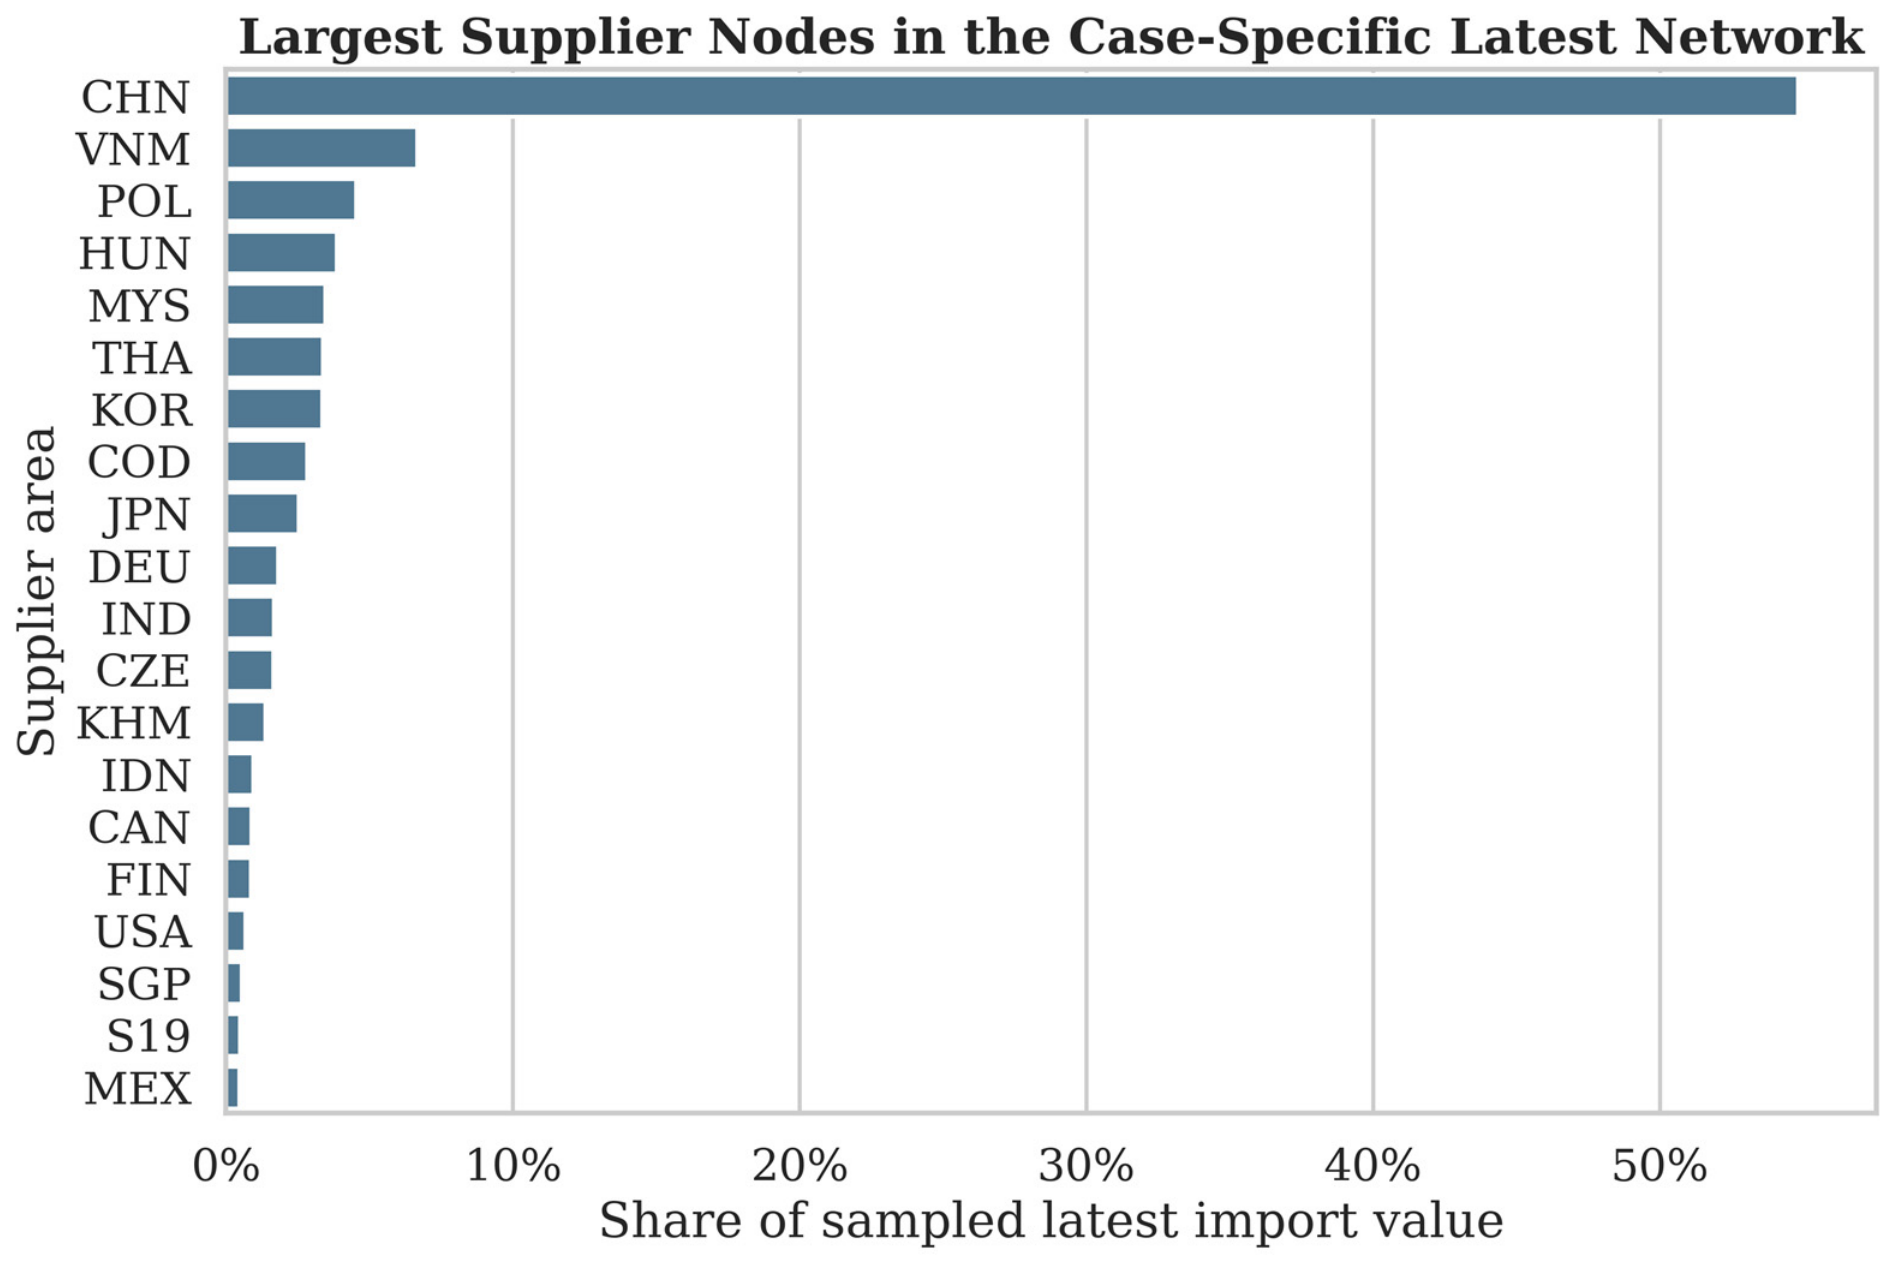
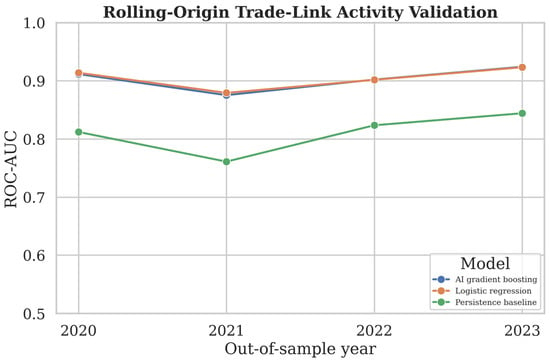
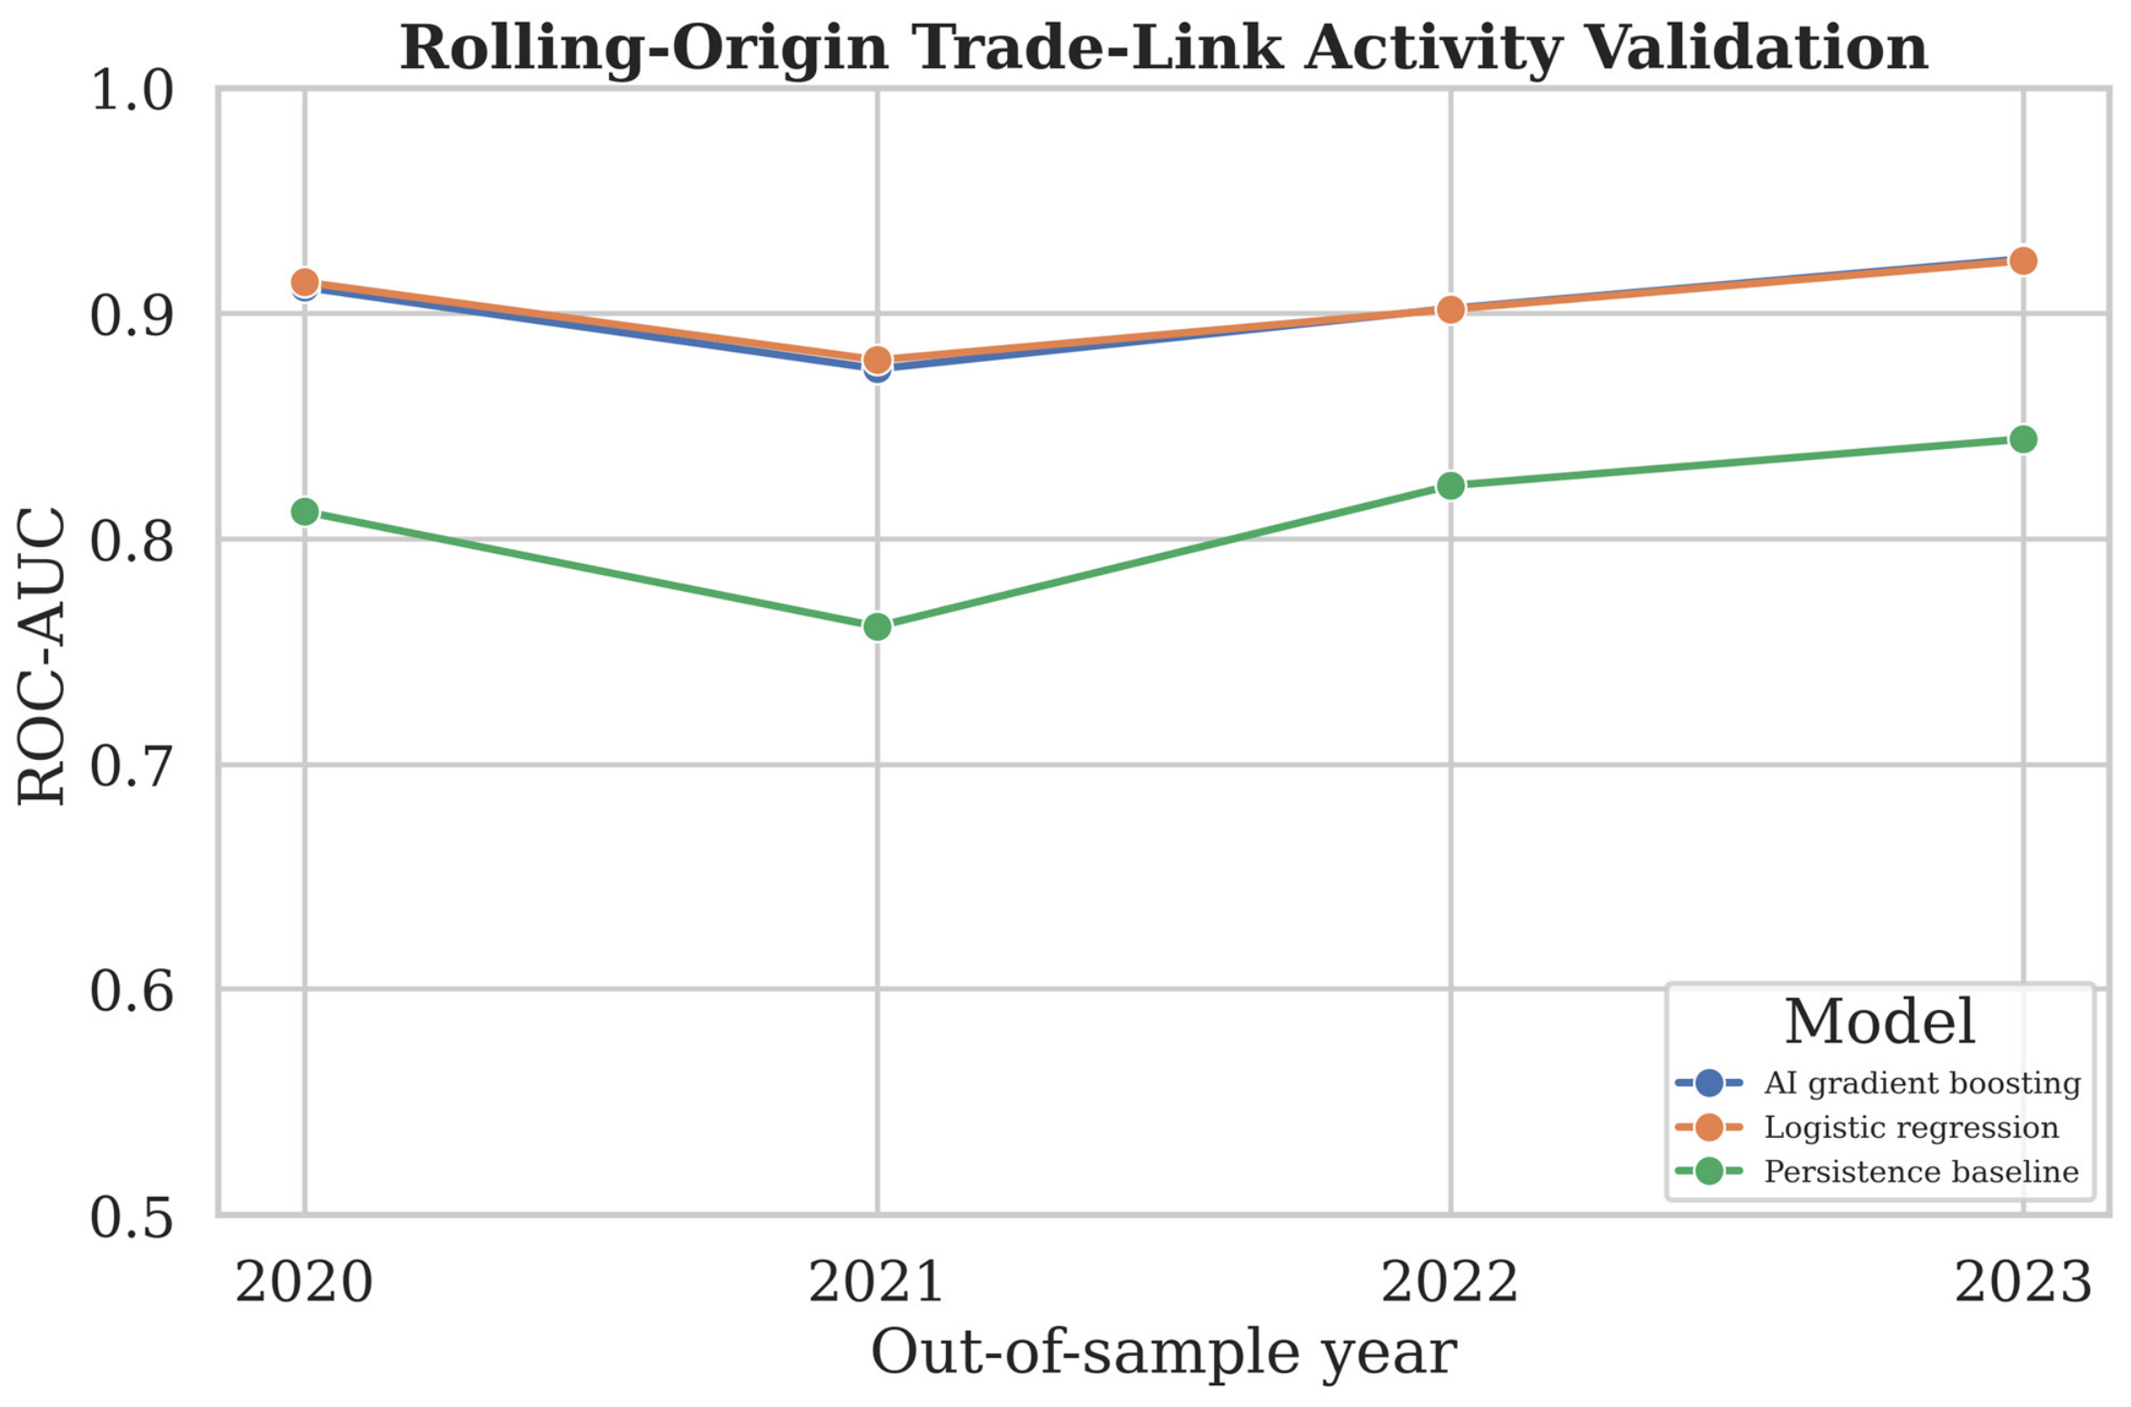
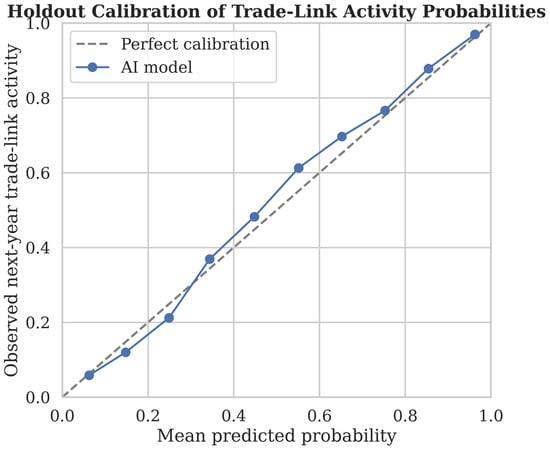
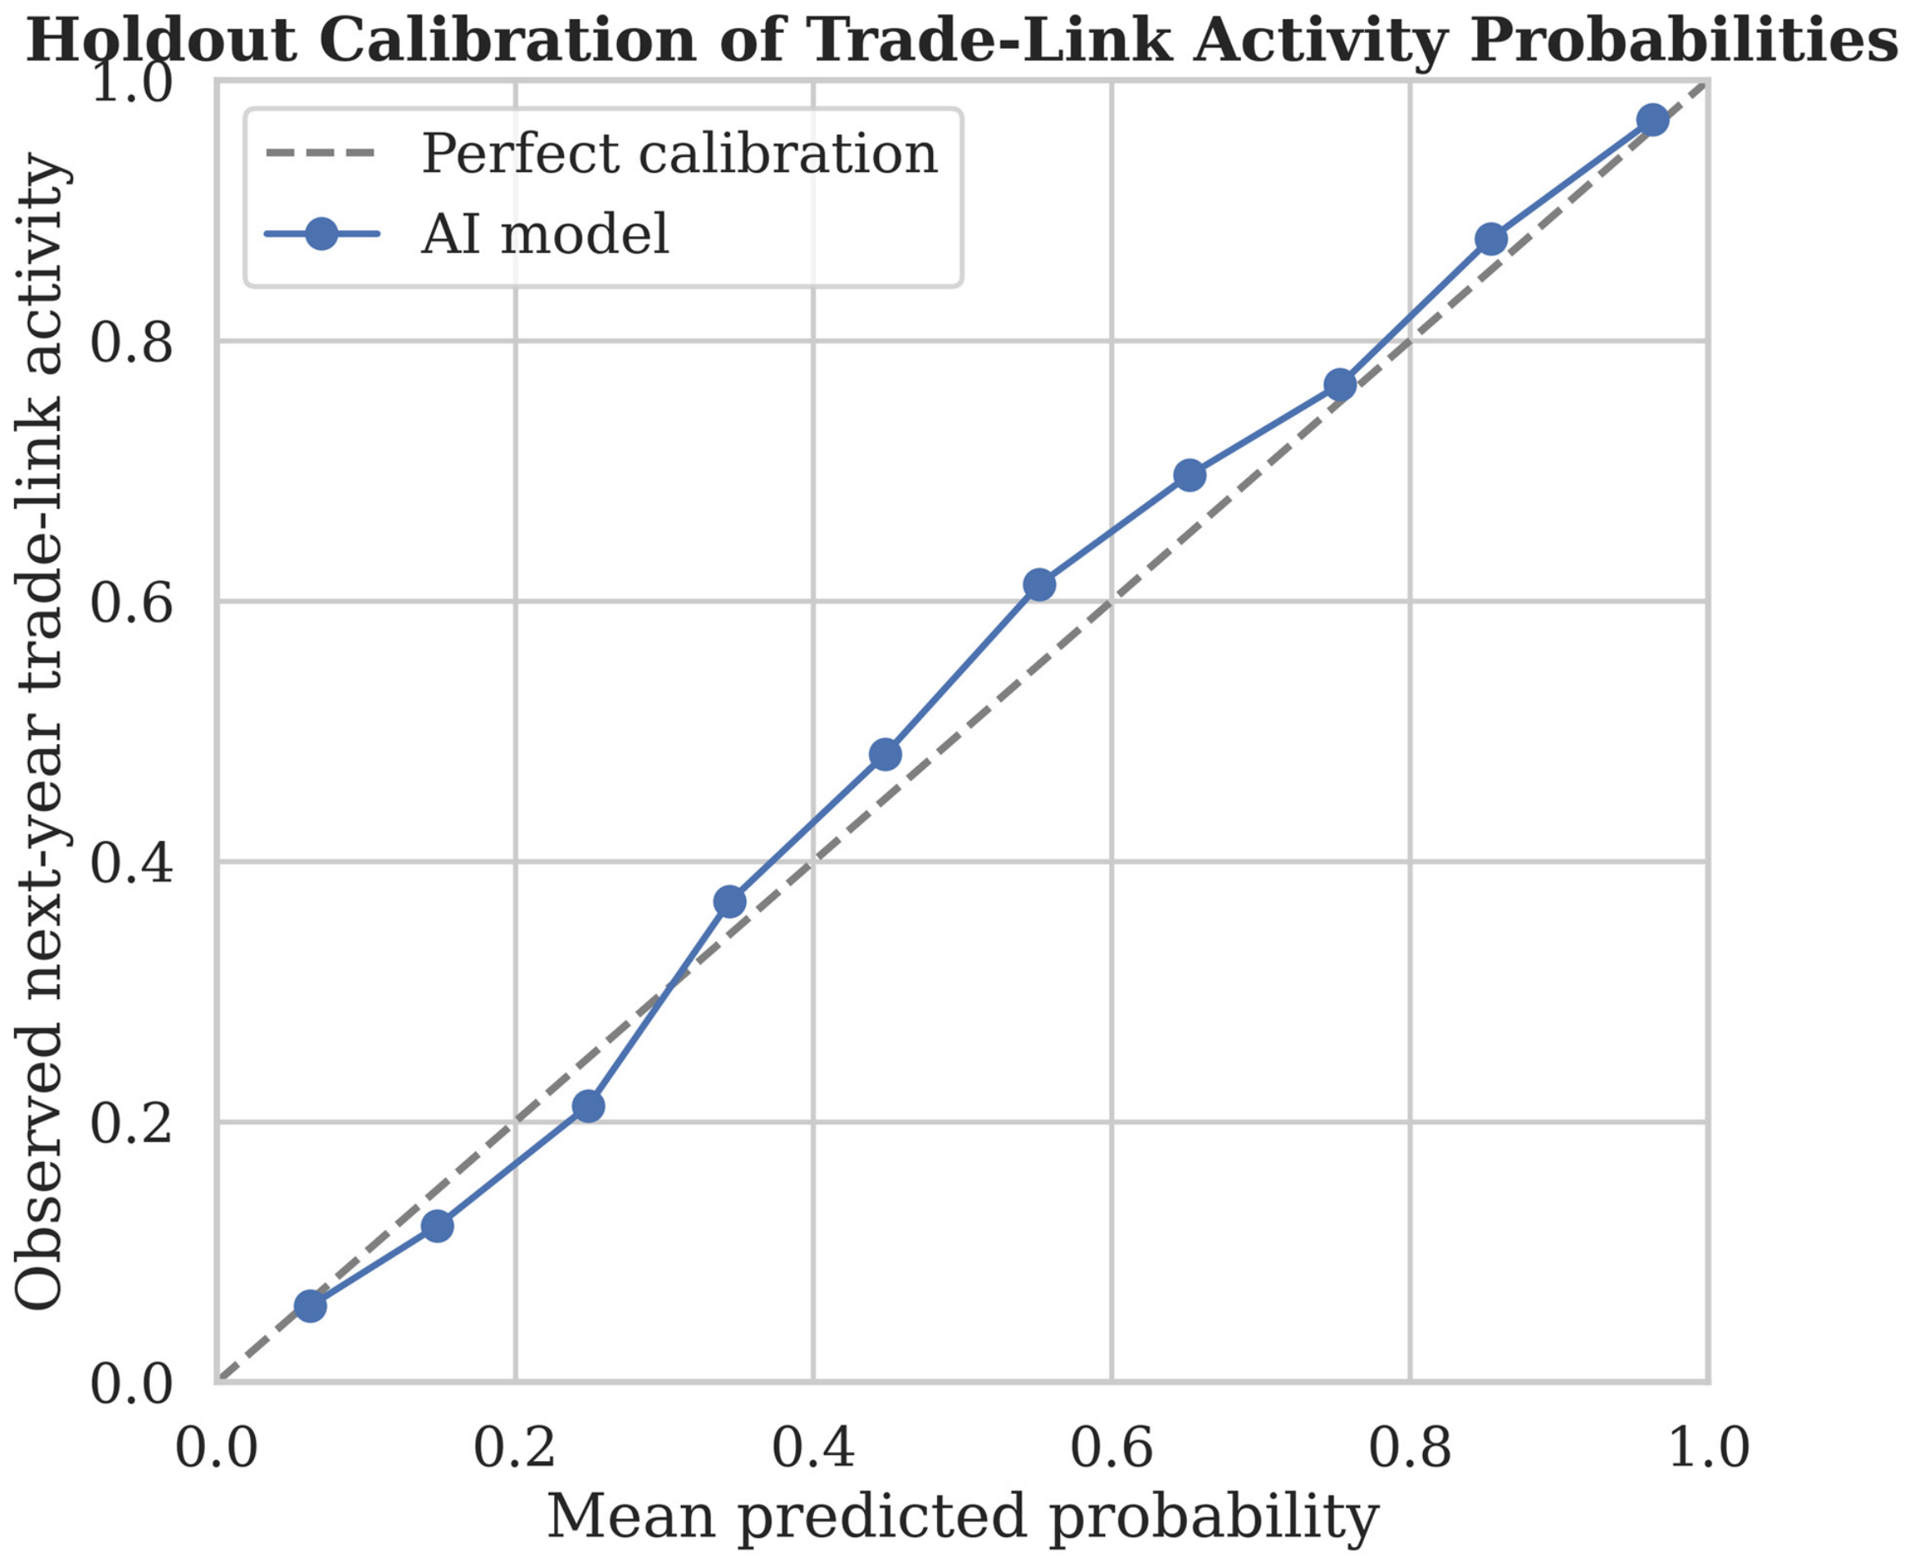
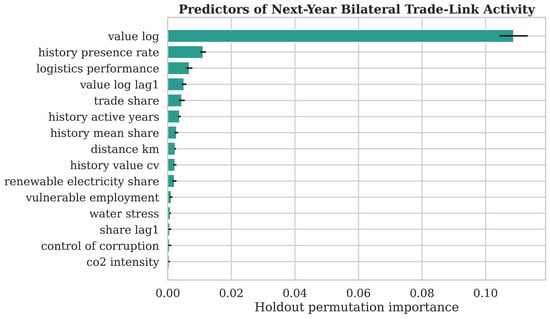
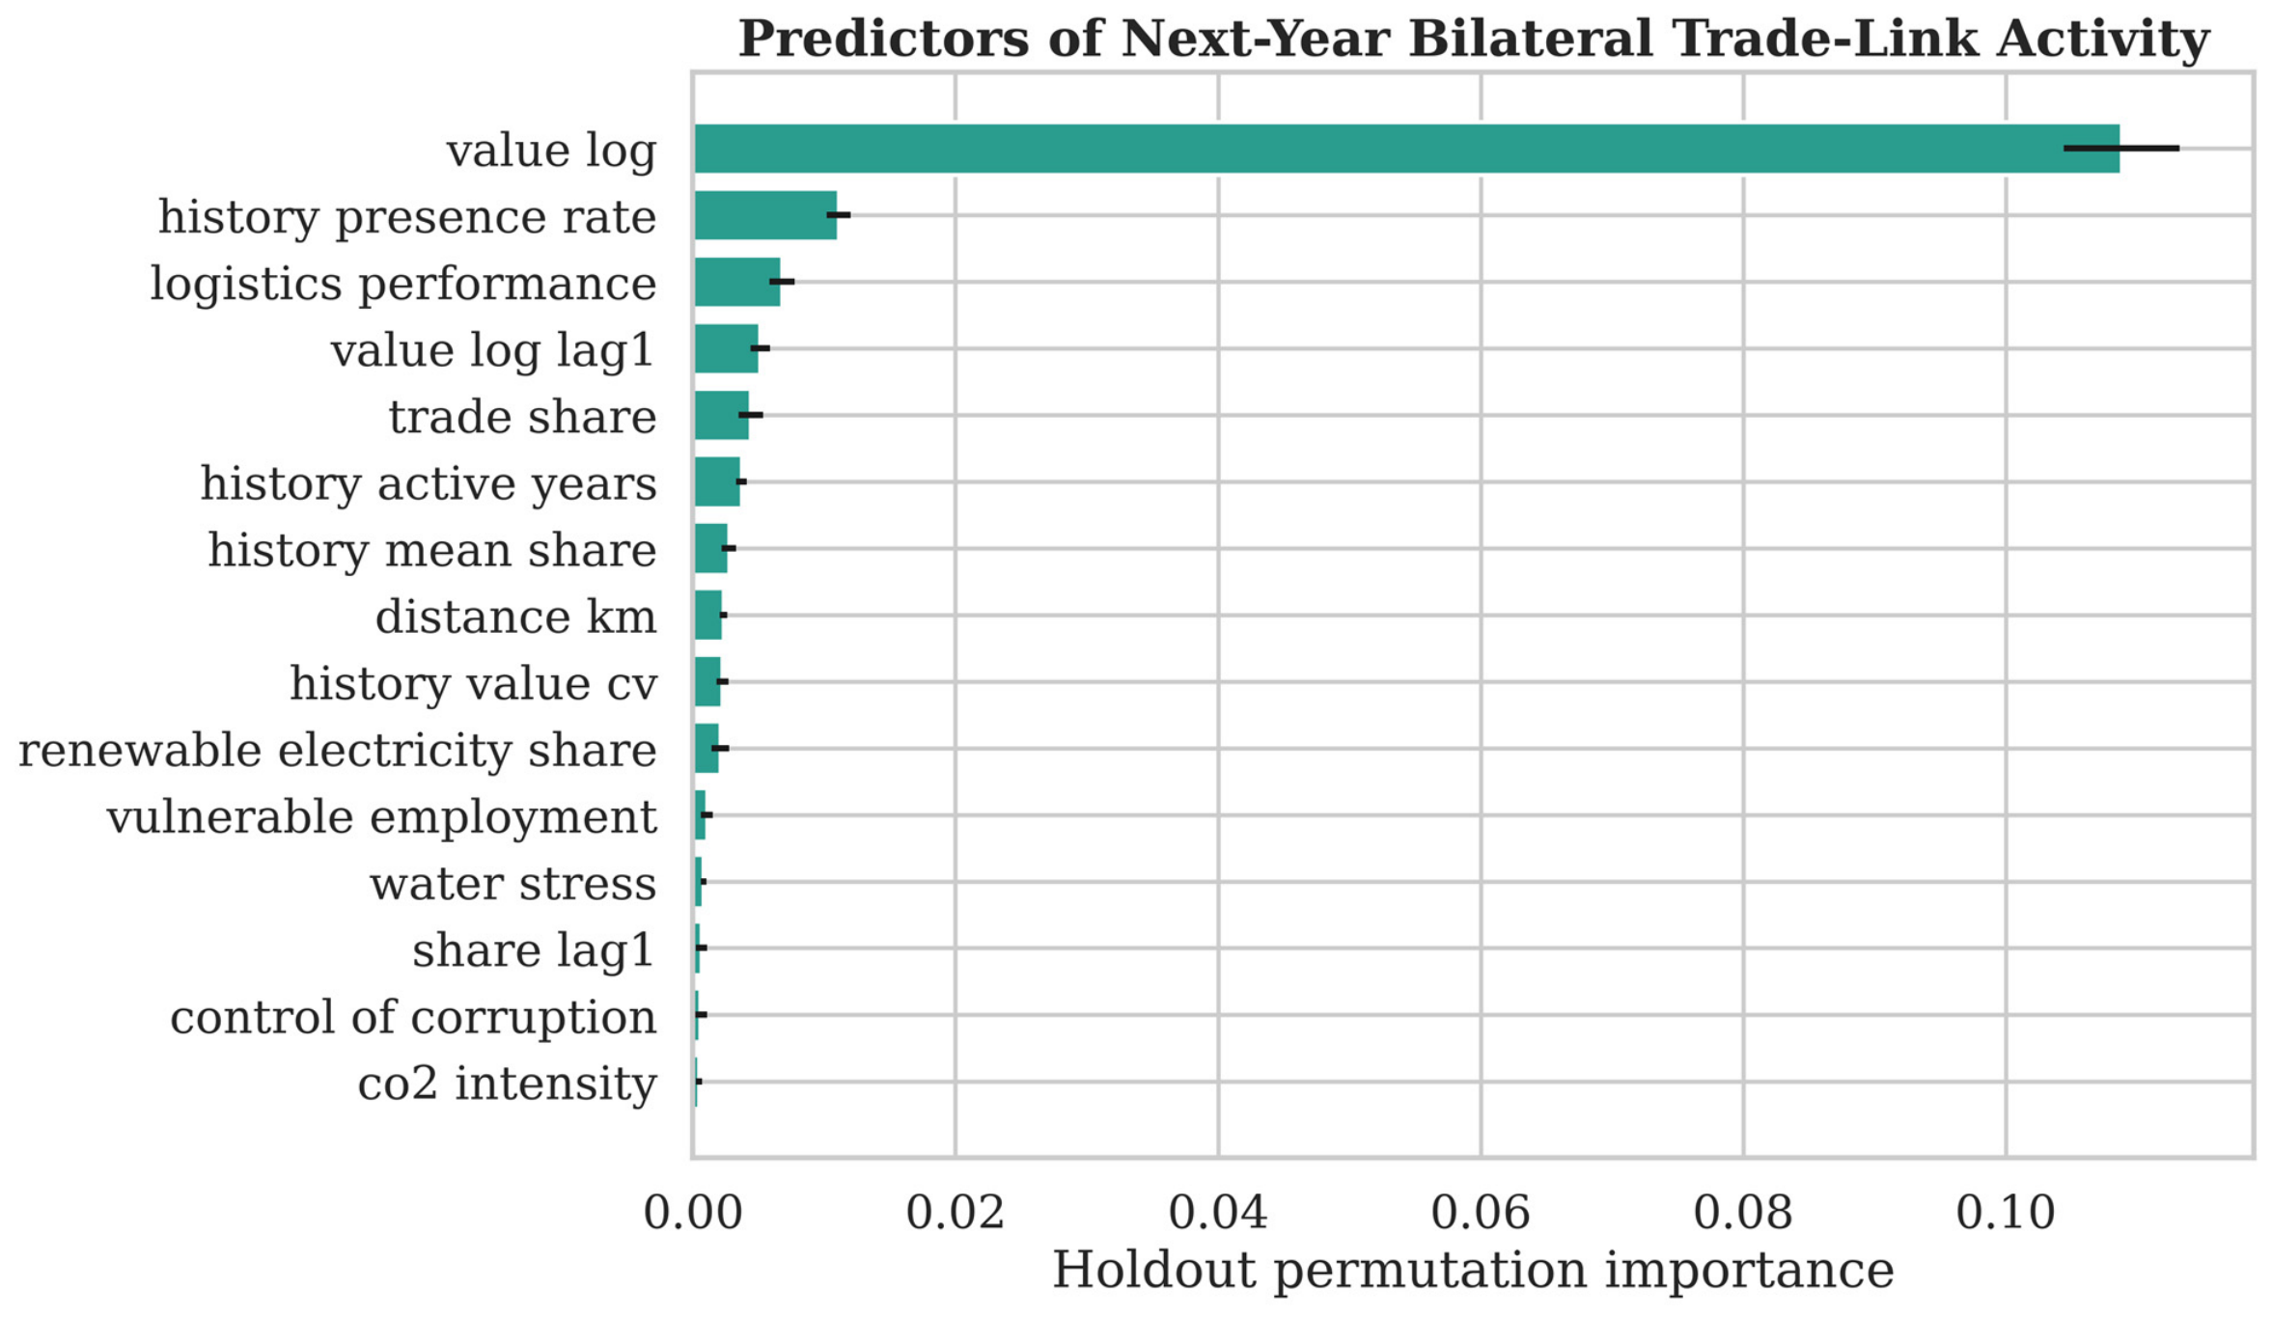
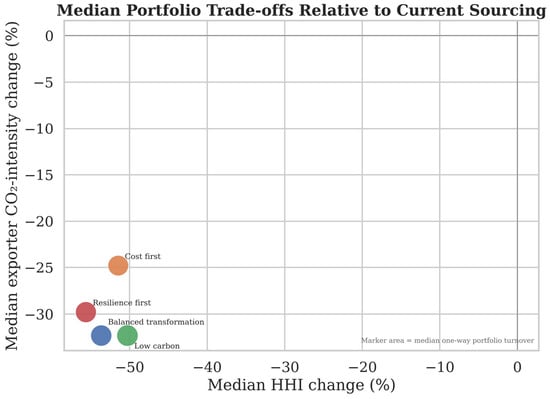
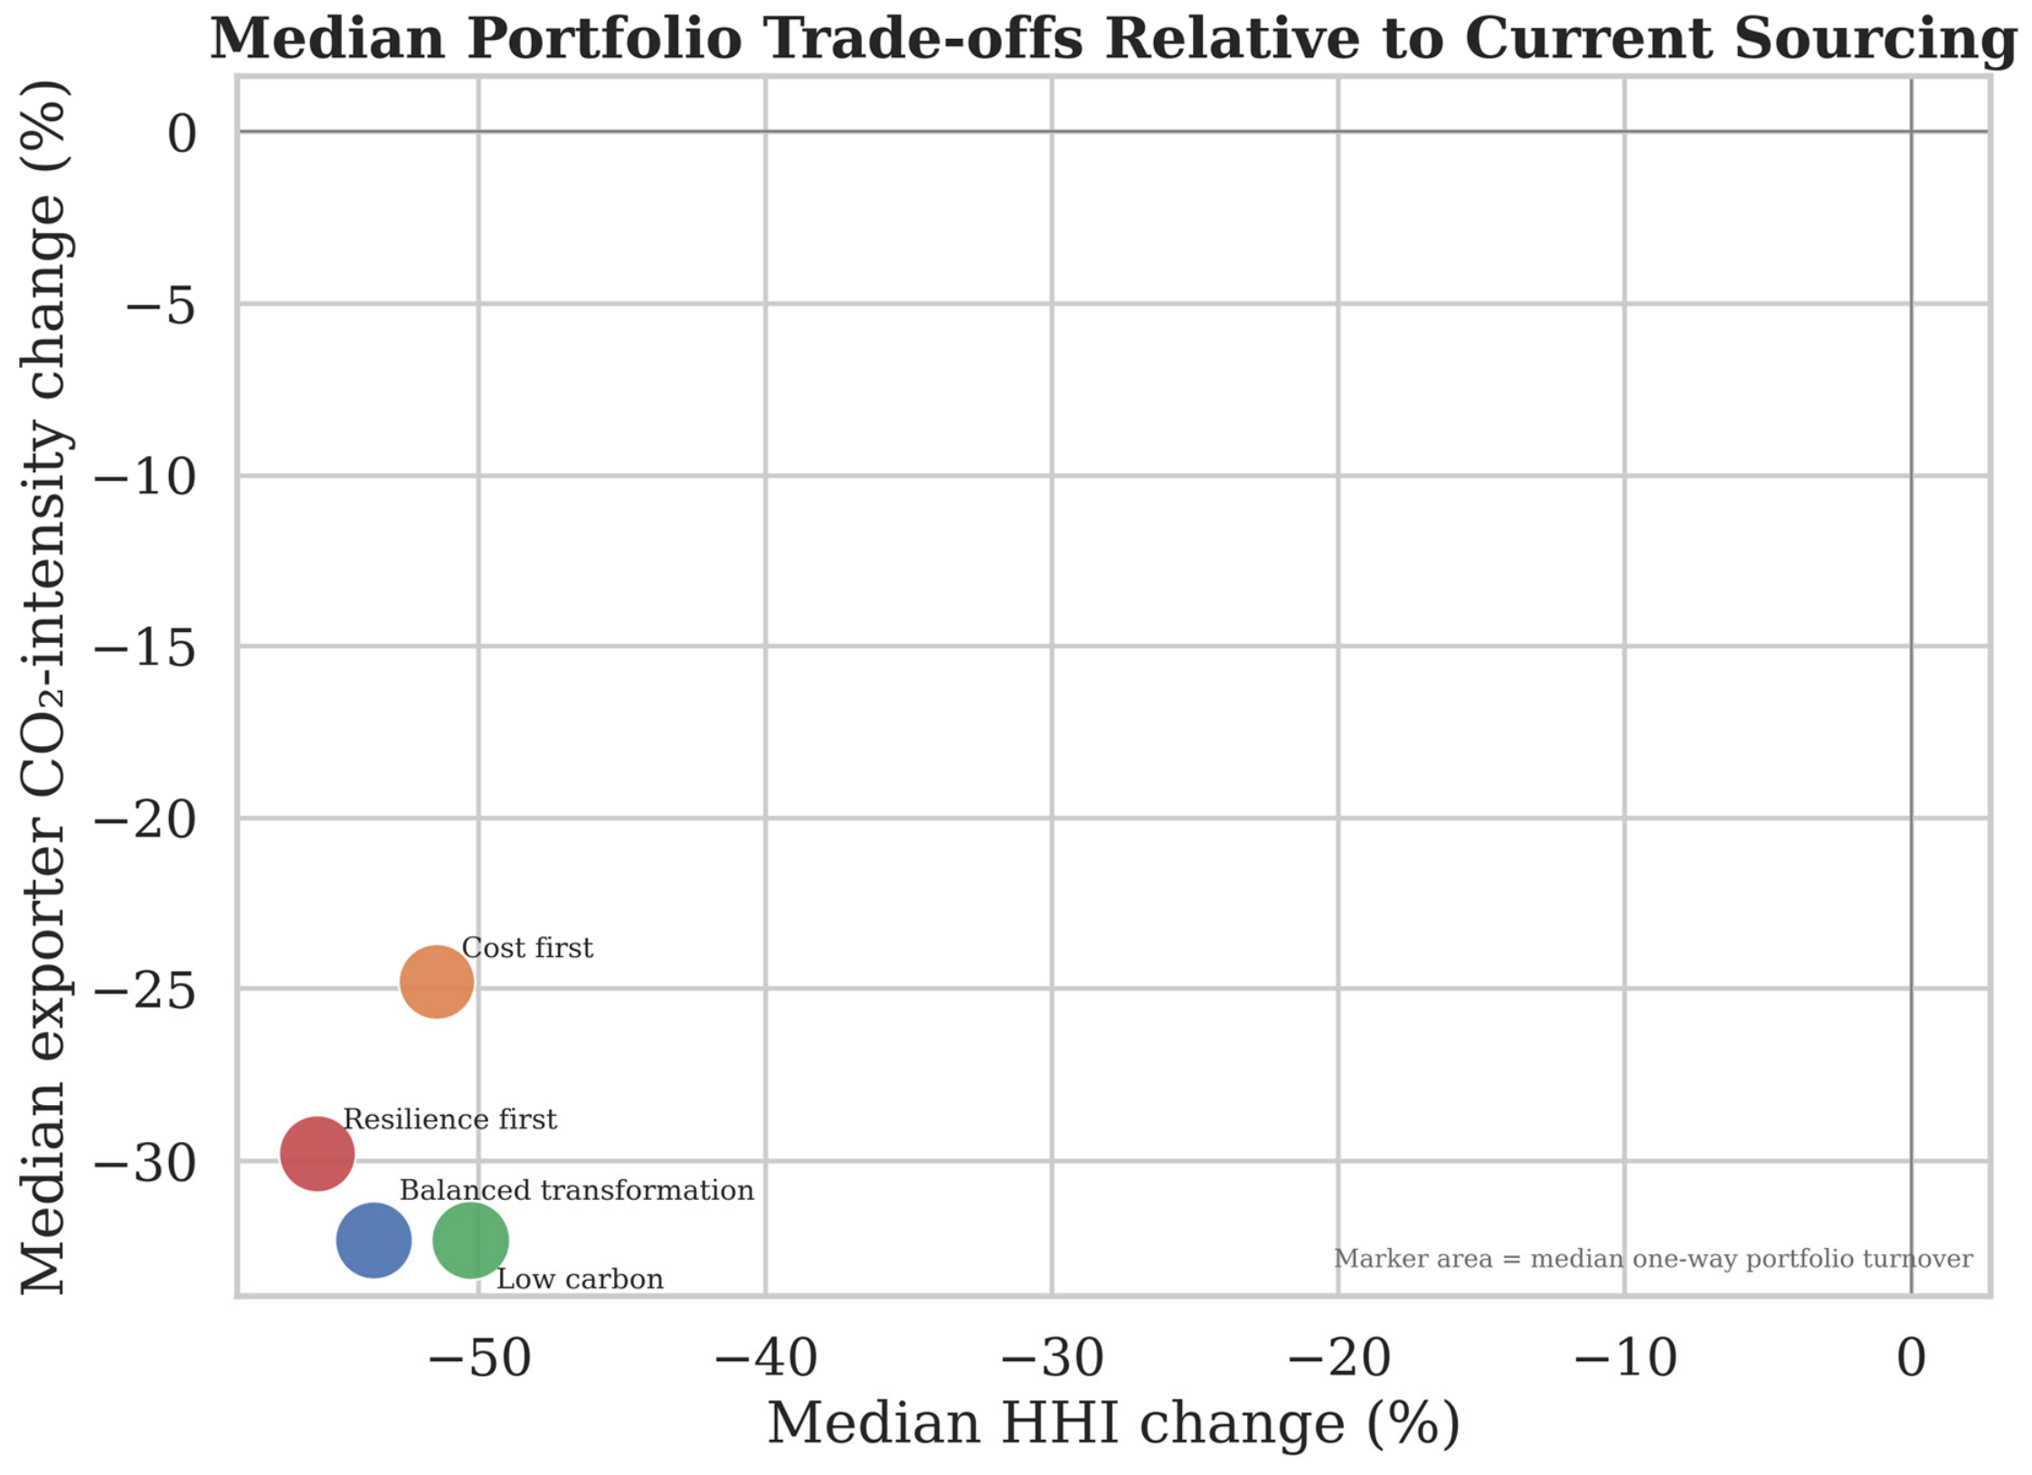
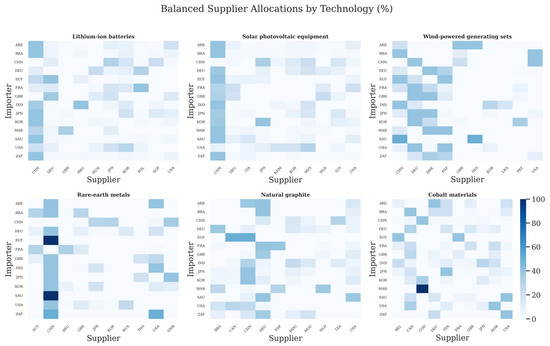
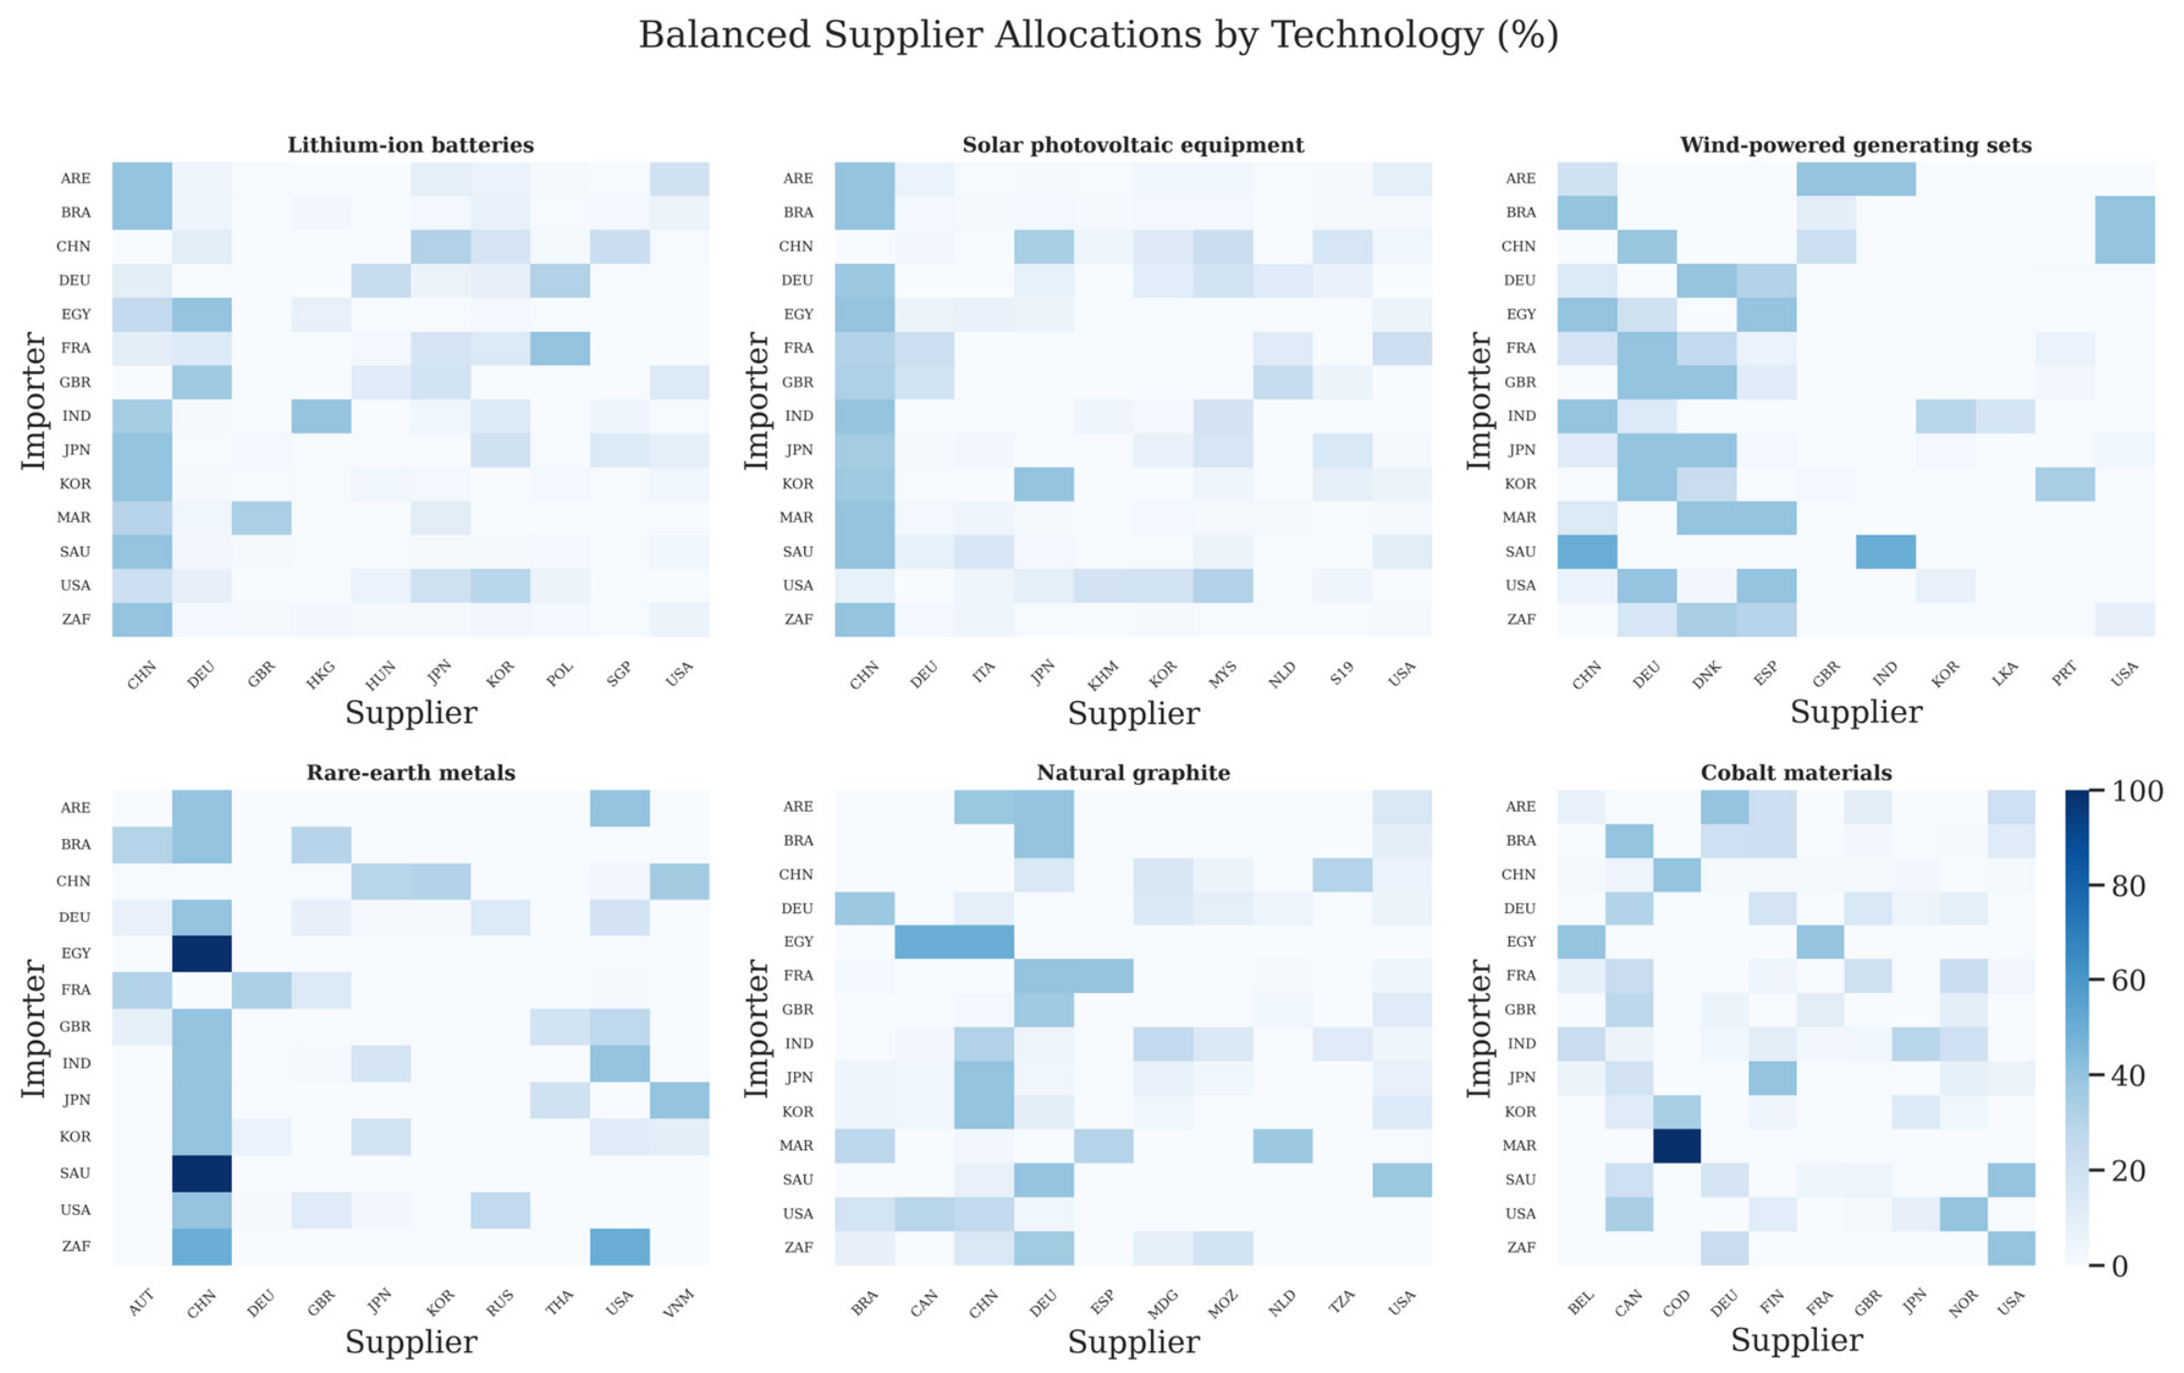
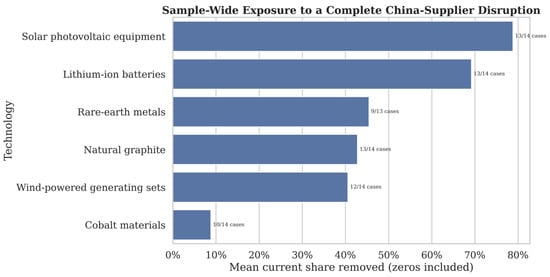
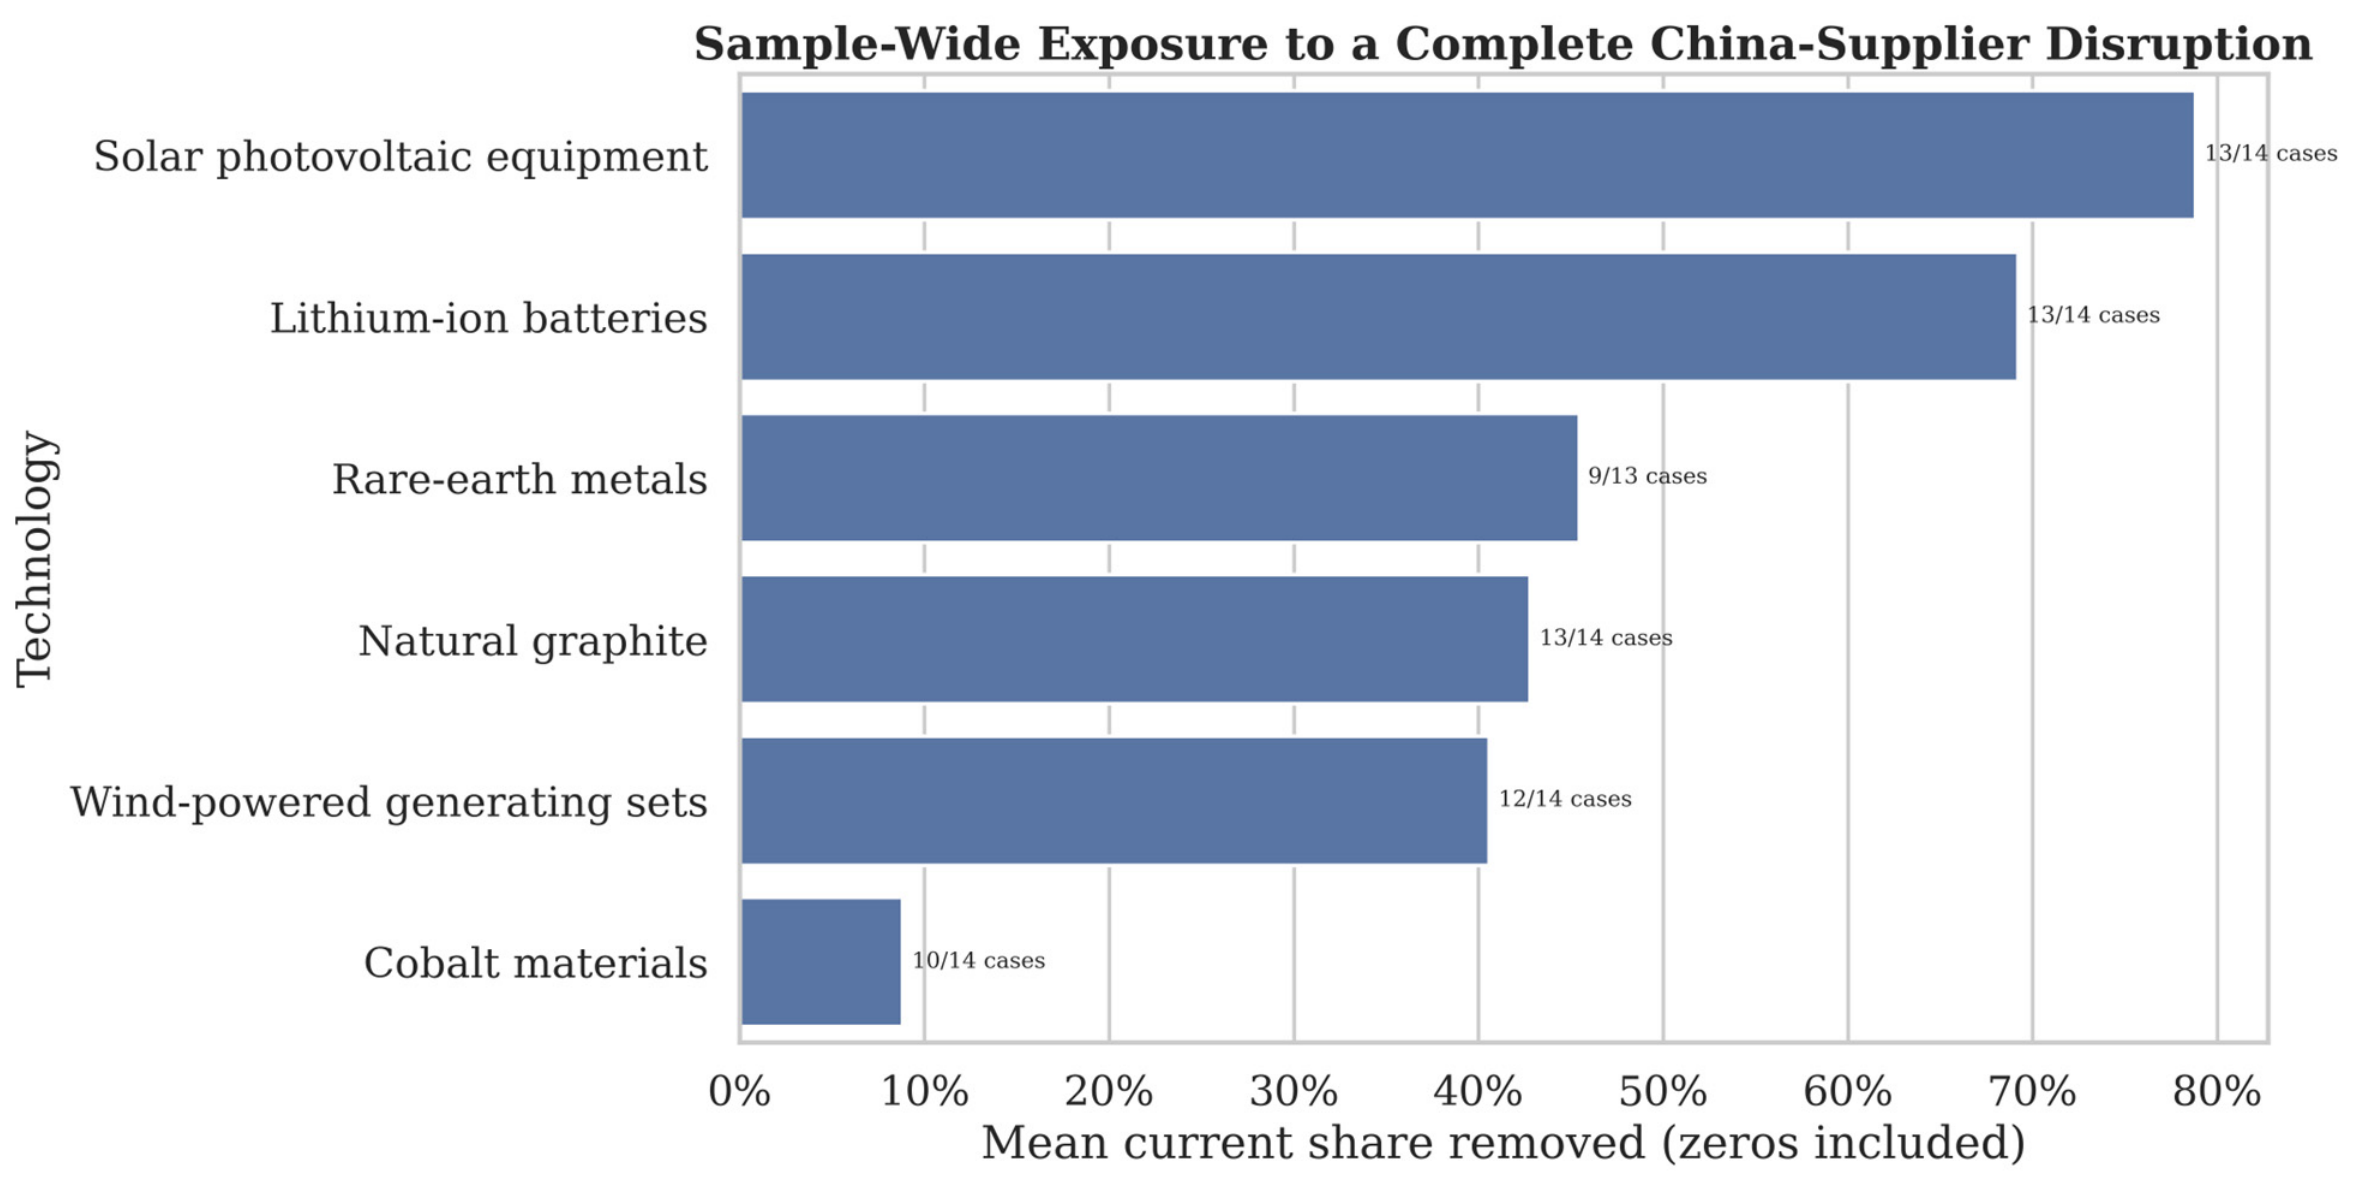
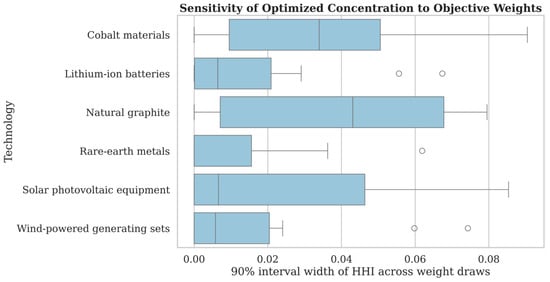
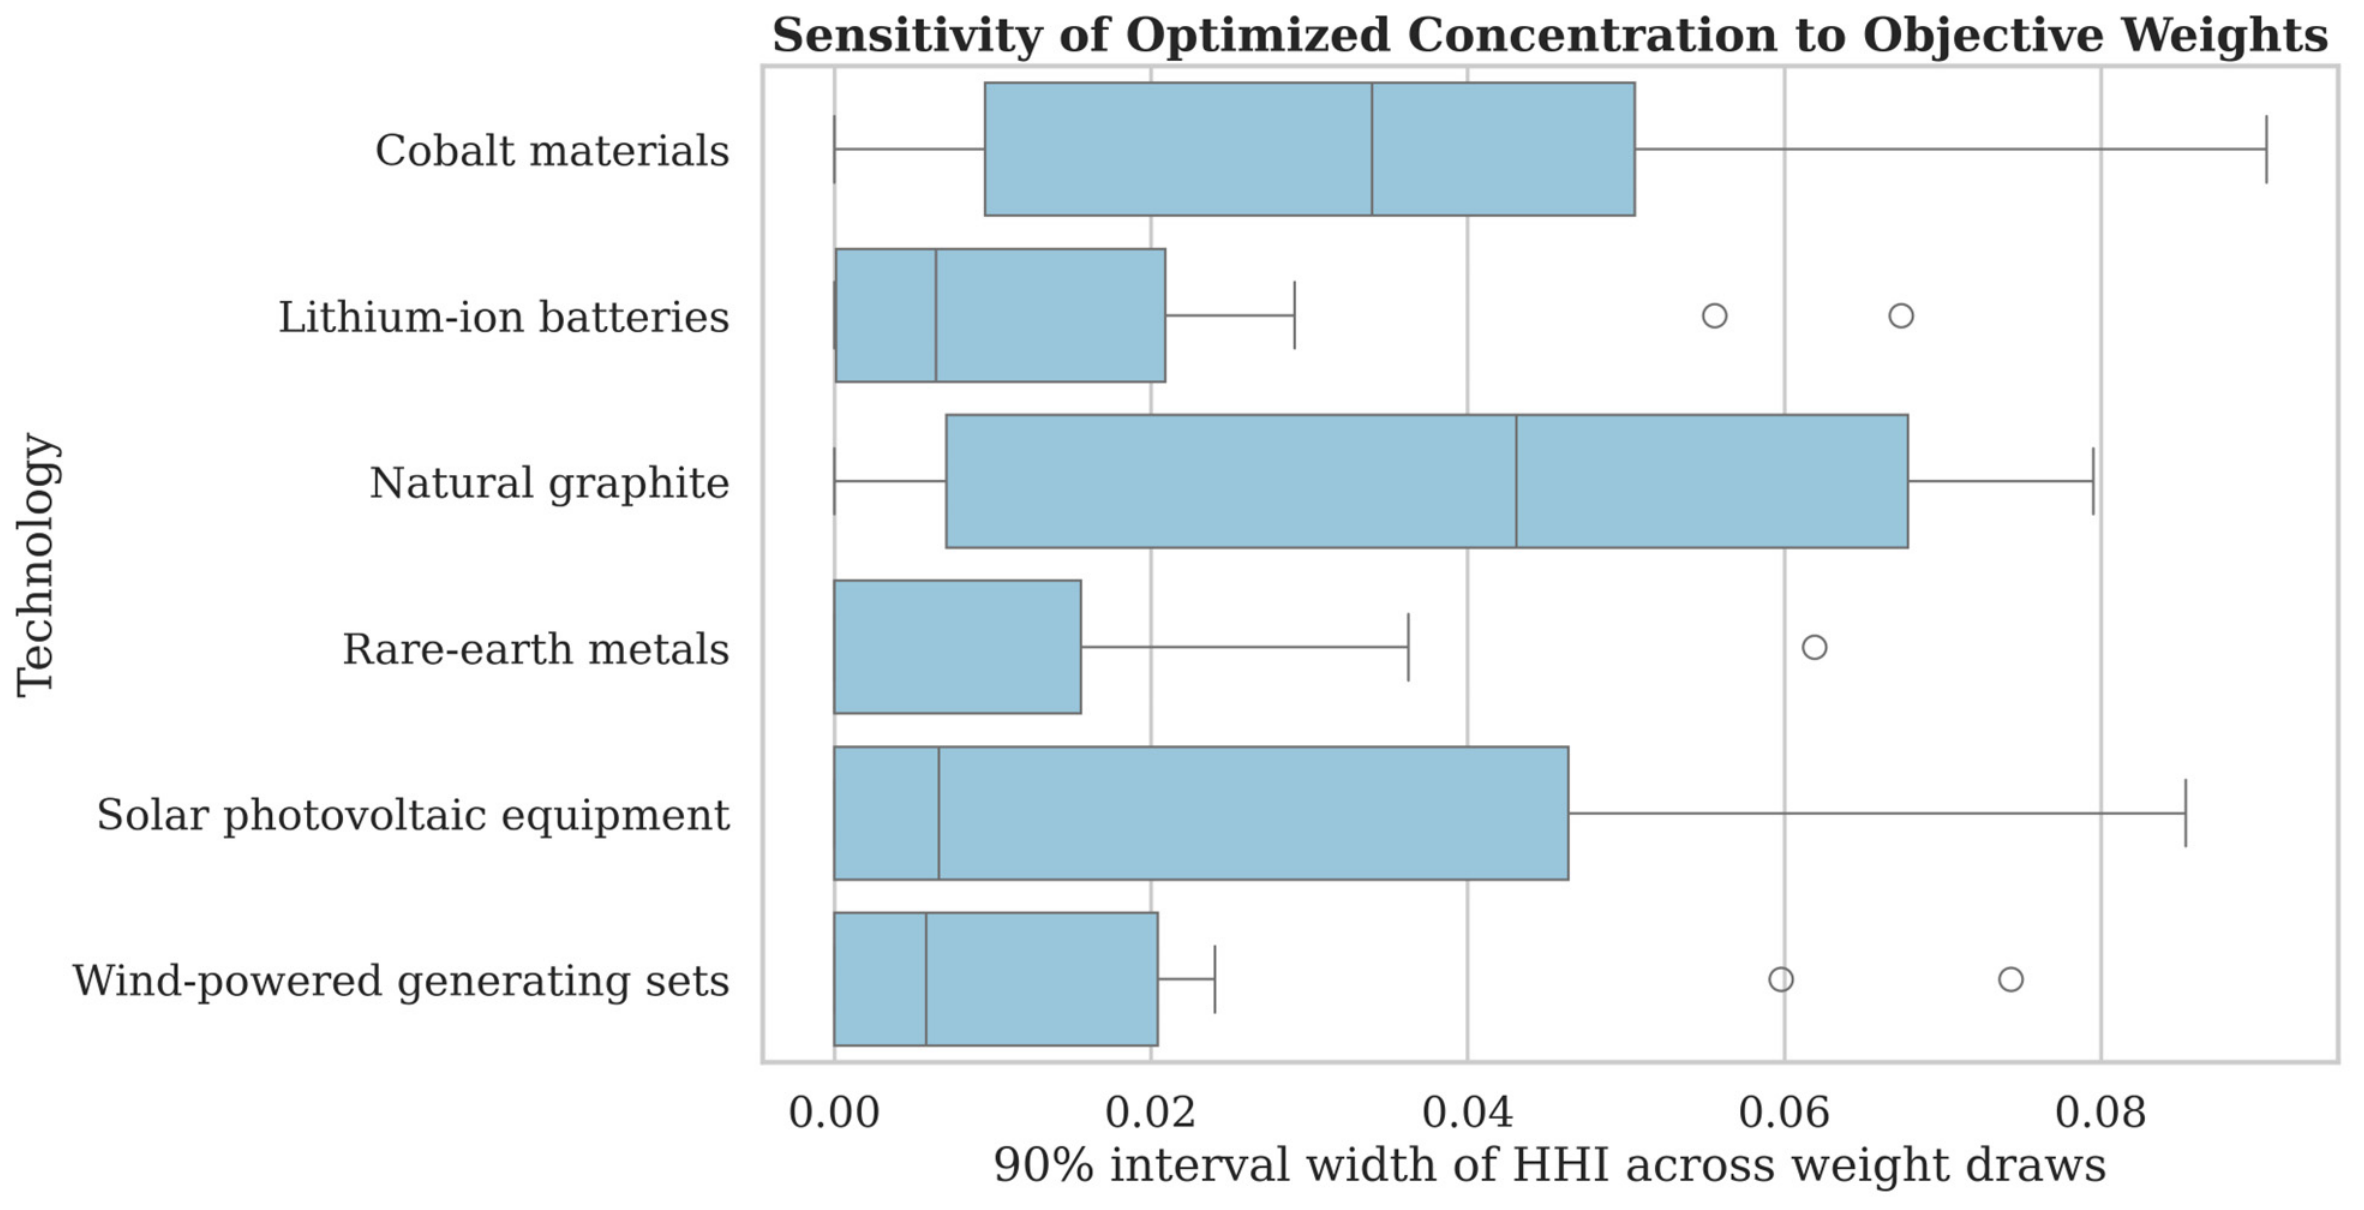

Disclaimer/Publisher’s Note: The statements, opinions and data contained in all publications are solely those of the individual author(s) and contributor(s) and not of MDPI and/or the editor(s). MDPI and/or the editor(s) disclaim responsibility for any injury to people or property resulting from any ideas, methods, instructions or products referred to in the content. |
© 2026 by the author. Licensee MDPI, Basel, Switzerland. This article is an open access article distributed under the terms and conditions of the Creative Commons Attribution (CC BY) license.