


Abstract
Allotment gardens (AG) provide a unique combination of urban and suburban productive and recreational spaces with numerous functions. As part of ecological systems, they are experiencing a renaissance, driven by contributions to fostering more sustainable cities. Unfortunately, hydro-hazards are increasing in frequency due to climate change, often because of the specific location of allotment gardens in low-lying areas and river valleys. The article aims to analyze flood risk to AG in the area of three voivodeships in south-western Poland: Lower Silesia, Opole, and Silesia. The analyzed AG, having diverse landscapes and hydrographically belonging to the Odra River Basin, are frequently affected by catastrophic floods. The objective of the study is to create flood risk maps separately for each area at risk of flooding with a probability of 0.2%, 1%, and 10%, taking into account the land use of individual allotment gardens. For this purpose, the building coverage ratio (BCR) was used in the study, which required the acquisition and processing of LiDAR data. One of the most important findings is that the building coverage ratio (BCR) does not differ significantly between allotment gardens located in and outside flood-prone zones. This result suggests that flood risk was not a major factor influencing the density of development in the analyzed allotment gardens. The spatial analysis also revealed that a considerable number of allotment gardens are located within the officially mapped flood hazard zones, with nearly 10% of the analyzed AG situated within the 0.2% annual exceedance probability zone. Moreover, observations from the 2024 flood event indicate that local inundation may also occur outside the areas identified by the available flood hazard maps, highlighting the uncertainty associated with modeling the spatial extent of individual flood events.
1. Introduction
Systematic urban sprawl and the development of industry in Western Europe in the 19th century caused an increase in the importance of urban gardening. The peak popularity of the phenomenon occurred during both World Wars, supplementing food shortages [1]. We now observe a revival of interest in gardening, mainly due to sustainable aspects and a bundle of ecosystem services provided: the nature protection movement and ecological culture, which contribute to the development of both collective and individual gardening.
One of the types of collective urban gardening is allotment gardening with a century-long tradition rooted in a European cultural landscape mainly due to its important economic function—growing their own vegetables and fruit [2]. They are defined as small plots of land (part of a larger garden site) that are rented to individuals or families for the purpose of growing plants. The history of allotment gardens, dating back to the 17th century, is widely analyzed in world literature (e.g., [3,4,5,6,7,8,9,10,11,12,13]). At present, allotment gardens are a characteristic, multifunctional part of the European urban landscape in many cities and their suburbs, e.g., Denmark, Great Britain, France, the Netherlands, Norway, Sweden, the Czech Republic, and Poland.
Allotment gardening in Poland is administered mainly by the Polish Allotment Association (PAA), managing 4582 allotment gardens encompassing 901,869 plots and covering a total of almost 40,000 hectares [14]. Apart from that, a small number of allotment gardens in Poland are organized under separate associations. The vast majority of allotment gardens in Poland were organized during the socialist planned economy, and their number continued to grow even after the collapse of socialism [1]. Presently, allotment gardens in Poland are located on land owned by the State Treasury, local government, and garden associations and are made available under long-term, rent-free leases [15].
Allotment gardens have been the subject of many scientific studies in the fields of urban landscape planning and management, environmental protection, climate change, horticulture, agriculture, and others [1,2,11,15,16,17,18,19]. The phenomenon is also analyzed in terms of alternative lifestyle options [17,18,20]. Their significant economic, ecological, social, and recreational functions are underlined [2,10,21,22,23,24]. Allotment gardens are extremely important for sustainable development—they provide recreational opportunities for inhabitants, which ultimately results in a better quality of life and fosters social interactions and nature-embedded opportunities for environmental learning [3,5,6,13,15,23,25,26,27].
As a result of the flood that hit southwestern Poland in 2024, many allotment gardens suffered significant losses. A comprehensive analysis of flood risk zones for Polish allotment gardens has not yet been conducted, and further research is still needed. A crucial issue is the fact that allotment gardens in Poland are usually built up by their users without any documentation. According to internal regulations, an allotment house of up to 35 m2 (plus 12 m2 of terrace) is permitted on each plot. Such a structure is not classified as a house or building in any category and therefore does not appear in any databases.
The aim of the study is to analyze the level of flood risk zones affecting AG in three voivodeships in south-western Poland: Lower Silesia, Opole, and Silesia. Flood risk zones (on three levels corresponding to average recurrence intervals) were created separately for each of the three voivodeships exposed to flooding, with a GIS analysis of the distribution of allotment gardens in the study area in terms of their risk of flooding.
Moreover, the authors analyzed the building coverage ratio (BCR) for the area, which required the acquisition and processing of LiDAR data. It was intended to verify whether AGs or their parts, located in flood-risk zones, differ in terms of building coverage ratio (BCR) from those located outside such zones. Flood risk zones were created separately for each of the three voivodeships exposed to flooding, with a GIS analysis of the distribution of allotment gardens in the study area in terms of their risk of flooding. To calculate BCR, it was necessary to acquire and preprocess LiDAR data so that a layer of buildings and structures could be extracted.
The study area, characterized by complex morphology and diverse landscape and belonging to the Odra River Basin, covers 41,742.5 km2, constituting 13.38%.
Although numerous studies have examined allotment gardens and flood hazard separately, no comprehensive study has combined flood hazard mapping with LiDAR-derived building coverage ratio analysis for allotment gardens in Poland. This study addresses this research gap by contributing to integrating official flood hazard maps with LiDAR, developing BCR from point clouds, and evaluating whether flood hazard influenced spatial development.
2. Allotment Gardens in the Light of Flood Risk
Throughout history, allotment gardens have always adapted to changing political situations and difficult environmental conditions. Unfortunately, allotment gardens located in urban and suburban areas are vulnerable to weather-related challenges, particularly flooding. An intensified hydrological cycle, as a result of climate change, has led to an increase in the frequency of natural hazards, such as floods, in recent years.
A flood is defined as a random, natural, and extreme phenomenon, often extraordinary and difficult to predict [28]. The increase in the risk of floods is primarily caused by global climate change. Since the beginning of the 1990s, periods of drought, low-snow winters, often with relatively high temperatures, and heavy rains have become characteristic [28].
Flood risk is a product of natural hazard (physical and statistical characteristics of floods), exposure, and vulnerability (the susceptibility of the elements at risk to the threat) [29,30]. It is the probability of flooding occurring in a specific area within a certain period of time. Over recent decades, the concept of flood risk management has been developed across the globe. Implementation, however, remains stubbornly difficult to achieve [31]. Devastating impacts of extreme events pose challenges for decision-makers regarding how to address climate change. As part of flood protection, the following activities are undertaken: designation of flood risk zones, limiting development in areas particularly prone to flooding, moving existing facilities to higher areas, creating a system of subsidies and insurance, improving the organizational structures of water management [28]. However, flood-risk management strategies are needed, such as resilience, understood as a system’s ability to recover following a disturbance [31,32]. The phenomenon of climate change also increases flood risk for allotment gardens, especially in cities. While there has been significant research on flood mitigation strategies for allotments, there is still a lack of comprehensive studies.
In Poland, the issues of estimating flood damage are dealt with by the Water Management Board (KZGW), the Institute of Meteorology and Water Management (IMGW), the Head Office of Geodesy and Cartography (GUGiK), and the Government Security Centre (RCB) [33]. Flood damage covers a wide range of effects on people, their health, property, heritage, and ecological systems. In order to increase safety and mitigate adverse effects of floods, preliminary flood risk assessment (WORP) as well as hazard maps (MZP) and flood risk maps (MRP) were developed. The factors determining the size of flood risk are flood scenarios, land use, property values, and flood loss functions. Flood characteristics can be described by: surface area, depth, duration of flooding, water flow velocity, and time of flooding [34].
Remote sensing data, including LiDAR data, are widely used for flood risk mapping and analysis [35,36]. They serve as the basis for constructing digital terrain models (DTM) and digital surface models (DSM) [37]. Based on these data, hydrotechnical structures (levees) as well as engineering structures (road/railway embankments, bridges) can also be identified [38]. This information—both the terrain models themselves (DTM, DSM) and the data on identified hydrotechnical and engineering structures—subsequently forms the basis for hydrological and hydraulic modeling and for simulating flood wave propagation, from which flood hazard and flood risk maps are constructed [38,39,40]. Airborne and terrestrial laser scanning data are also used to prevent flooding through monitoring the condition of flood levees [41,42], as well as to estimate the consequences of flood occurrence [36,43,44,45,46].
Laser scanning data are additionally used to model built-up areas. Existing publications show the benefits of incorporating building information into flood wave flow modeling [47], including for built-up areas with homogeneous building heights [46]. Prior work has also addressed the estimation of flood consequences [39,43]. Terrestrial laser scanning data have been used, among other things, to detect door and window openings and compare their heights with the predicted water level in flood simulations, which made it possible to construct a per-building flood risk index [40].
Building detection based on LiDAR and terrestrial laser scanning data is well documented in the scientific literature, with the issue relating both to the detection of 2D planes representing building footprints and to full 3D models. The detection of small structures as garden sheds and summer houses in family allotment gardens can be problematic. It has been shown that objects with an area below 50 m2 are characterized by poorer precision, recall, and F1-score results [48]. Although the literature does contain methodological studies enabling the detection of objects as small as 5 m2 [49], due to the risk of misclassifying vegetation elements, including shrubs, as buildings, studies often adopt higher classification thresholds, such as 60 or 100 m2 [50,51]. At the same time, no papers could be identified in the Web of Science or Scopus databases that address the detection of small garden sheds and summer houses in family allotment gardens used for recreation and occupied seasonally. Only the work of Awrangjeb and Siddiqui [49] relates partly to this topic, demonstrating the ability to detect objects the size of a garden shed (as small as 5 m2) based on a classified point cloud.
Allotment gardens exposed to flooding experience wide-ranging material and intangible impacts. Flooding disrupts food production processes, and damage to infrastructure leads to a variety of environmental and social consequences. It causes soil erosion and waterlogging—the ability to produce plants is reduced. Prolonged water saturation may erode the soil, wash away nutrients, and leave behind toxic sediments; thus, the land becomes unsuitable for planting. Many plant species may not survive waterlogging—floods severely damage crops. Moreover, pollution and contamination carried by floodwaters can make growing plants hazardous in the near future. The flood damage to allotment gardens also includes damage to buildings [52]. The flood situation in allotment gardens in Poland relates to flooding their area as a result of heavy rainfall, spring thaws, or rising groundwater levels. In Poland, allotment gardens are often located in low-lying areas, which makes them particularly vulnerable to flooding. Historically, the main factor determining the urban location of allotment gardens was the industrial development of cities (close to industrial areas, factories). However, later on, their location was also connected with physiographic conditions, determining the availability of land for establishing gardens (e.g., vacant building plots) [11]. Thus, a concentration of allotment gardens is often noticeable near rivers, streams, and valleys, which endangers their safety in case of floods.
In September 2024, Poland experienced severe flooding, particularly affecting southwestern regions of the country. The main cause of this phenomenon was the heavy rainfall caused by the Genoa Low, which brought intense and long-lasting precipitation to Central Europe. The flood mainly affected the Lower Silesia, Opole, and Silesia voivodeships. Alarm levels were exceeded on many rivers, including Biała Lądecka, Bóbr, and Strzegomka, breaking the records from 1997. On the Bóbr River, in Nowogród Bobrzański, a water level of 413 cm was recorded (the highest level ever recorded).
The flood led to the destruction of roads, bridges, residential and farm buildings, management buildings, as well as power grids and fences. It also destroyed allotment gardens situated in low-lying flood areas. For example, the Sudetes board of PAA, as of 30 September 2024, reported 41 flooded AGs with an area of over 20 ha, covering 558 plots [14]. Emergency services conducted rescue and security operations, including evacuations. The flood in September 2024 was one of the most serious phenomena of this type in Poland in recent years.
3. Research Methods and Source Materials
3.1. Study Area
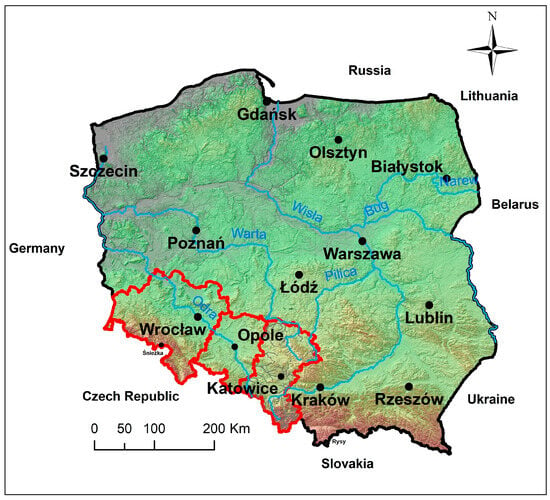
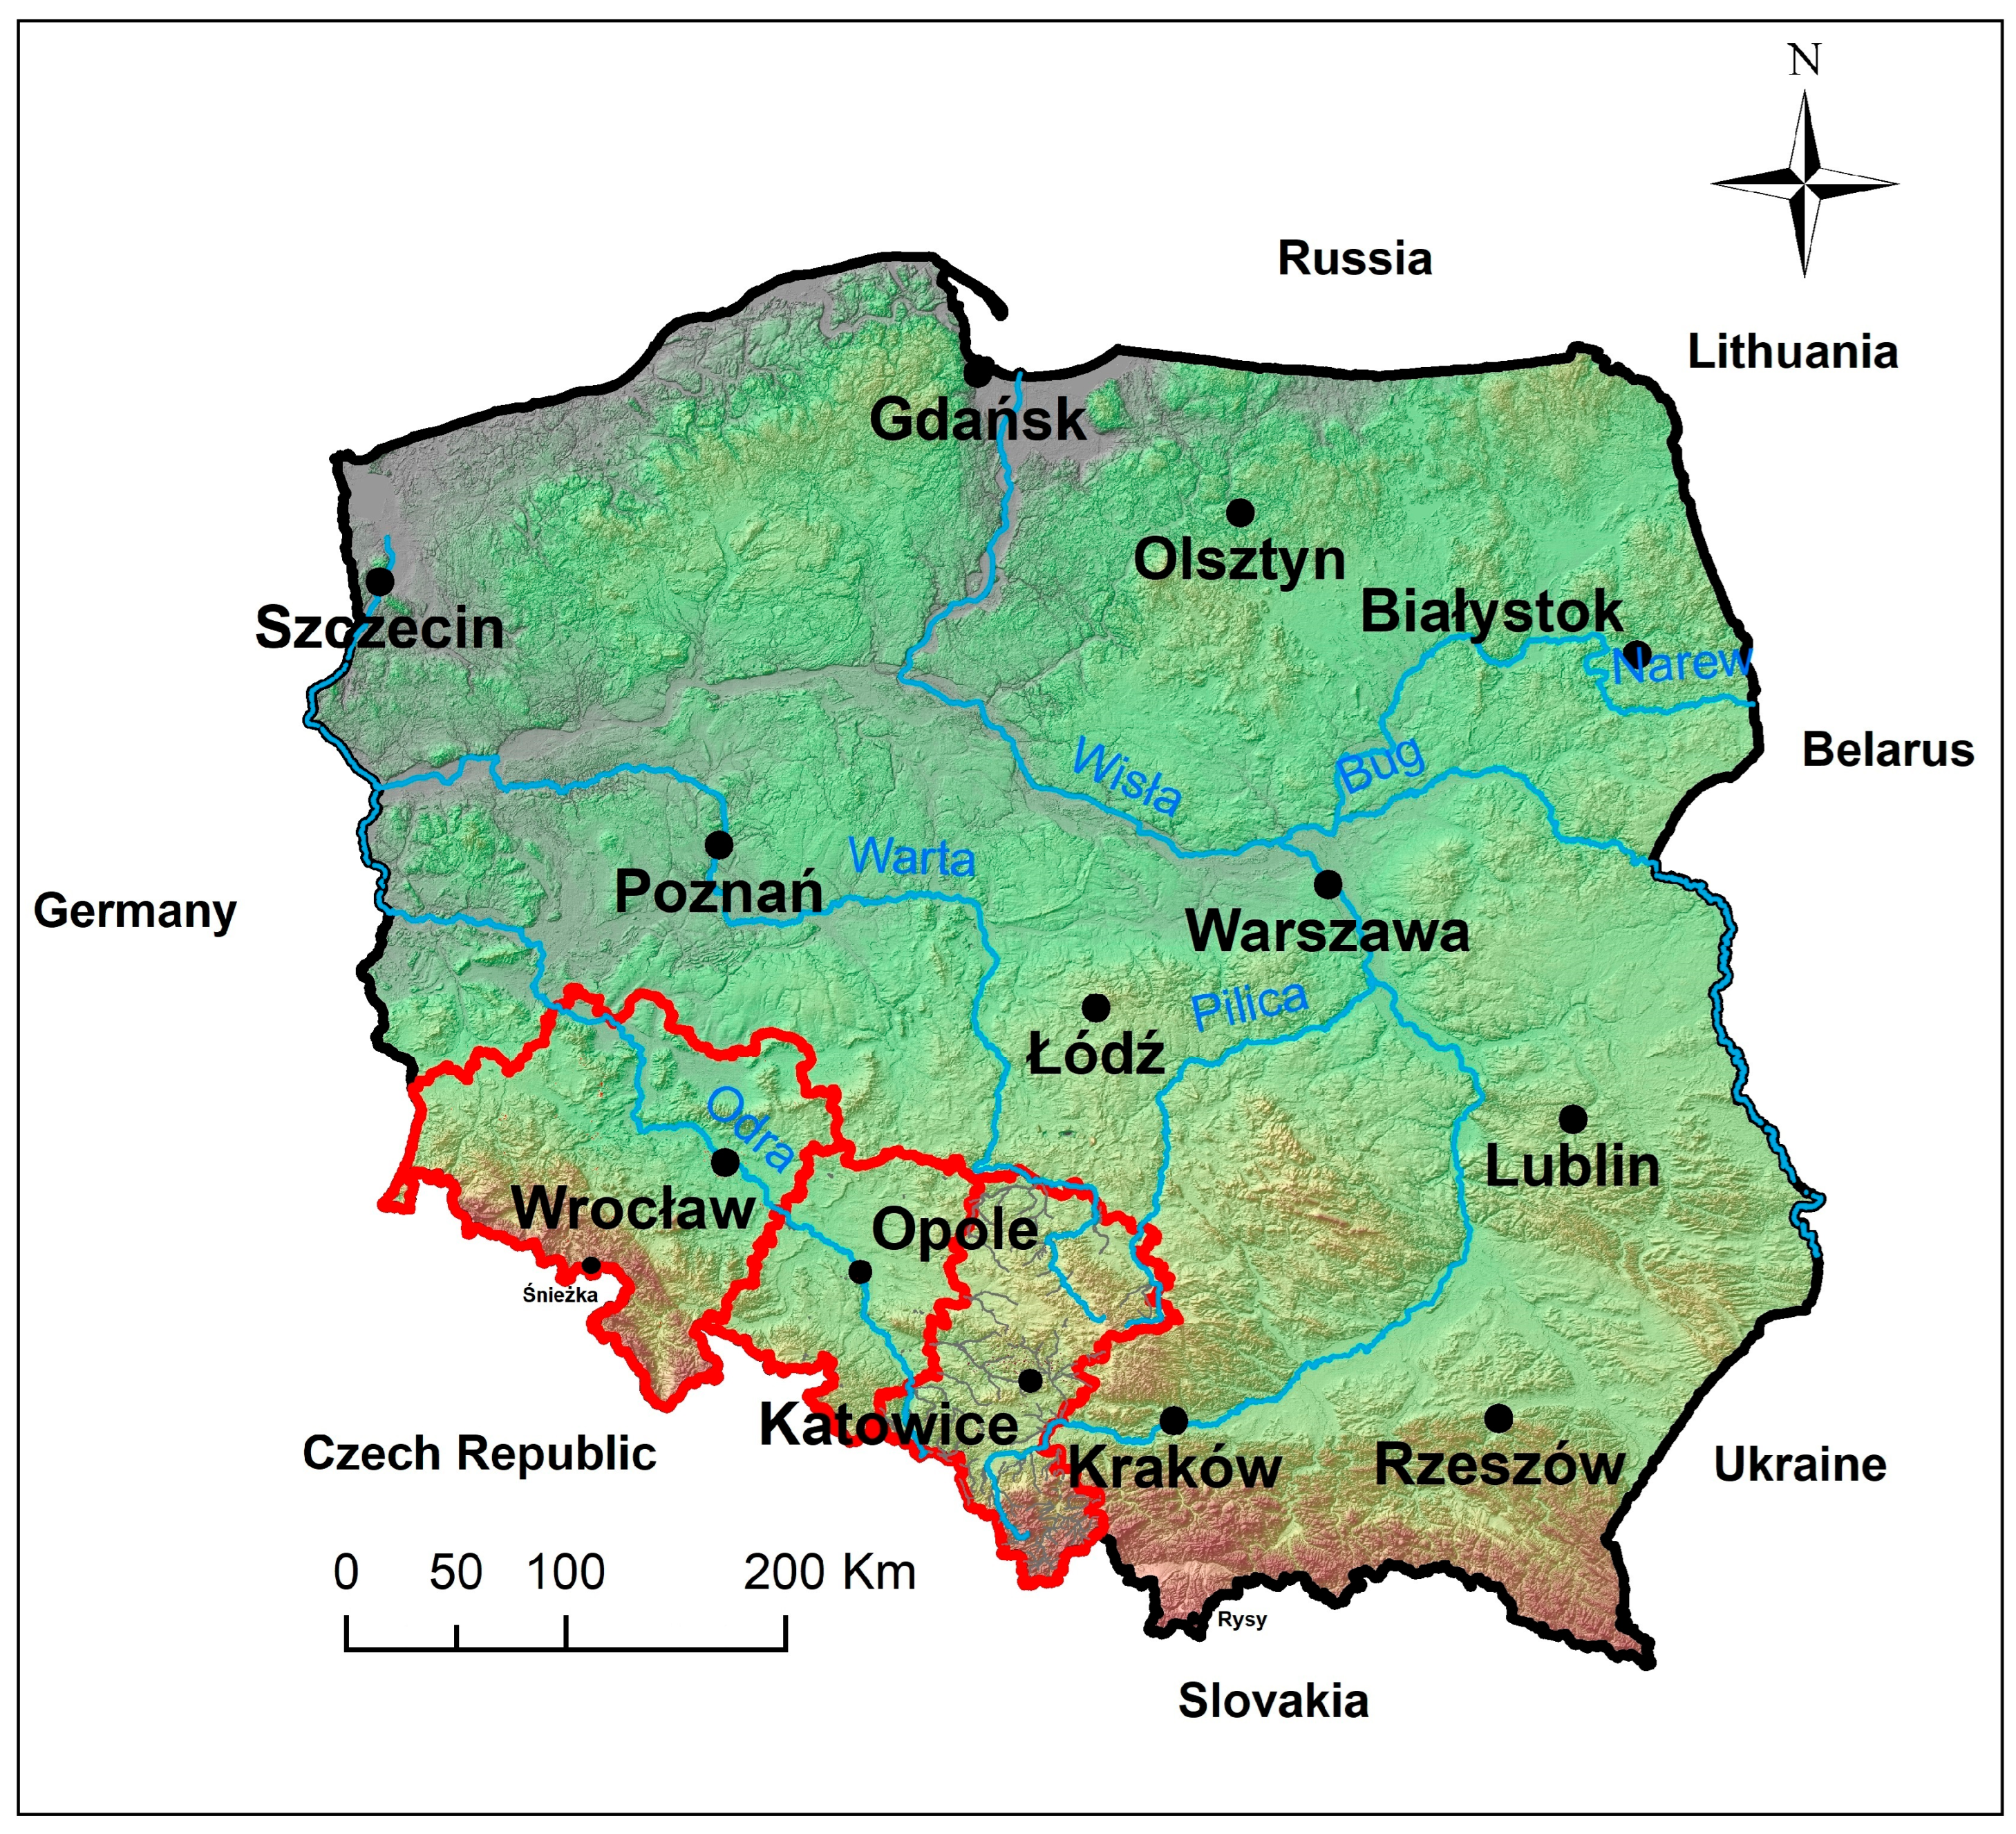
The study area covers three voivodeships of south-western Poland: Lower Silesia, Opole and Silesia (Figure 1). It covers 41,742.5 km2, which is 13.38% of the area of Poland. The study area extends approximately from 49°58′ N to 51°48′ N and from 14°58′ E to 19°02′ E. It is a region with complex morphology and diverse landscapes, including both mountainous and upland areas of the Sudetes and the Silesian Upland, as well as lowland areas of the Sudetes Foreland and the Silesian Lowland.
Figure 1.
Research area—three voivodeships in Poland. Source: own elaboration based on GUGiK data [53].
Hydrographically, this area belongs to the Odra River Basin, which is the main water artery of the region, together with tributaries such as Nysa Kłodzka, Barycz, Kaczawa, Bóbr, Kwisa, and Mała Panew. These rivers often have a strongly developed upper part of the catchment area, which quickly responds to heavy rainfall through high flows. The morphology of the terrain combined with the moderate oceanic climate stimulates “hydrological unrest” manifested by frequent, catastrophic floods [54]. They have been known since historical times, and since about 1900, detailed studies have been able to document subsequent examples of floods. The floods occurred in the following years: 1903, 1938, 1952, 1967, 1970, 1972, 1977, 1997, 2010, 2024 [55].
3.2. Methods, Data Sources, and Limitations
Flood risk zones in the form of maps covering the study area were obtained from officially published flood hazard maps developed within the ISOK project on the basis of hydraulic modeling performed by the national authorities. Then, a GIS-based spatial overlay analysis was conducted, using officially published flood risk maps to determine the exposure of allotment gardens to flooding at three probability levels (10-, 100-, and 500-year floods).
Estimating annual exceedance probabilities within the Polish ISOK methodology poses a core problem: no single distribution or estimation procedure fits every catchment equally well, so the guideline structures the analysis as a sequence of verification steps rather than a fixed default. Before any distribution is fitted, each observed series of annual maximum discharges or precipitation is tested for homogeneity using the non-parametric Mann–Kendall test, and a series exhibiting a significant trend cannot proceed to frequency analysis. Only a homogeneous series is then fitted to the Pearson Type III distribution as the principal model, with its parameters estimated by either the decile method or the method of maximum likelihood, the choice depending on how closely empirical points align with the theoretical curve on the probability grid; the decile approach additionally relies on a quantile skewness coefficient (s), read from a dedicated reference table rather than computed as a classical third moment. Where Pearson III proves inadequate, the log-normal and Weibull distributions serve as parallel alternative procedures, with log-normal parameters likewise estimated by maximum likelihood. Goodness of fit of the chosen distribution is then verified using the Kolmogorov (λ) test, comparing empirical and theoretical probability curves, after which a one-sided confidence interval (e.g., at the β = 84% level) is computed to express the uncertainty of the resulting design quantile, a step distinct from distribution selection itself. A separate problem arises for ungauged catchments, where the absence of an observed series requires a rainfall-based formula for small areas (≤50 km2) or a regional regression equation for larger basins before any distribution can be applied at all [56].
In this article, the terms “10-year flood”, “100-year flood”, and “500-year flood” are used interchangeably with terms referring to the annual probability of flooding. This means that “100-year flood” corresponds to a flood with an annual exceedance probability (AEP) of 1%, meaning an event that has a 1 in 100 chance of occurring or being exceeded each year. Similarly, “10-year flood” refers to a flood with an annual probability of 10%, while “500-year flood” corresponds to an annual probability of 0.2%. It should be emphasized that the terms “10-year”, “100-year”, and “500-year” refer to the average recurrence period of the event, not its regularity—such events can also occur in subsequent years.
Maps in vector format in the form of a .shp layer were downloaded from the resources of Hydroportal ISOK (Informatics System of National Protection in Poland—IT System for protection of the country). The authors decided to conduct a geoinformation analysis of the distribution of allotment gardens in the study area in terms of their risk of flooding. For this purpose, the previously prepared data were processed and compiled in ArcMap 10.8.2 software by Esri. The vector layer with plotted polygons in the form of allotment gardens was intersected with flood risk maps on three levels—each of them meaning an average recurrence interval (statistical probability for assessing the risk of floods). The most probable flooding (10-year flood) means there is a 1-in-10 chance that a flood of this size will happen during any year. Then, analogously, areas with slightly safer risk of flooding—every 100 years (100-year flood); and the safer—500-year flood (500-year flood).
Poland lacks an official spatial dataset that would allow the boundaries of allotment gardens (AG) to be mapped. The Local Data Bank of Statistics Poland (GUS) provides only aggregate figures on their number and on the plots located within them. According to these data, the study area contained a total of 1259 AG in 2025 [57]. In the absence of such official spatial data, this study relied on geometric information on AG obtained from OpenStreetMap (OSM), a free, crowdsourced spatial database maintained by contributors worldwide [58]. According to the OSM wiki documentation, the entire area occupied by an allotment garden is mapped as a single polygon tagged land-use = allotments, with point features used only in exceptional cases when a precise area cannot be delineated [59]. A total of 1083 objects were retrieved. The underestimation of AG counts was not spatially uniform: in the Lower Silesian Voivodeship, the number of AG in OSM was close to the GUS figure (505 versus 515 objects), whereas for the remaining voivodeships the discrepancy was more pronounced—529 versus 642 in the Silesian Voivodeship and 49 versus 102 in the Opole Voivodeship.
Next, the building coverage ratio (BCR) was examined. The BCR was calculated for each allotment garden as the percentage ratio between the total ground area occupied by buildings and gazebos identified from LiDAR data and the total area of the corresponding allotment garden polygon:
where Aβ is the total ground area of buildings and gazebos within the allotment garden, and Ar is the total area of the allotment garden polygon.
BCR = (Aβ/Ar) × 100%
The analysis was carried out separately for each assumed level of flood risk. Each allotment garden was divided into parts situated within and outside a flood risk zone. Initially, it was checked whether the level of flood risk in a given location affects the level of the garden’s development. To do this, the BCR indicator values for the total built-up area and the total area of allotment gardens in each of the analyzed parts were compared. Since the study took into account all allotment gardens situated in three voivodeships, regardless of their location to the river, origins, and period of creation, it was necessary to select and compare the allotment gardens located partially or entirely within specific flood risk zones. Additionally, for the flood risk with a 1% probability of occurrence, a case of a breached levee was also considered. The gardens that were separated by different zones were particularly interesting. They allowed the authors to answer the question of whether decision-makers, when organizing the space within the allotment gardens, considered the possibility of flooding or waterlogging.
When differences in the BCR index were observed (Table 6), statistical tests were conducted to determine whether these differences were statistically significant. Due to the small number of allotment garden complexes located within the flood risk zone, the Shapiro–Wilk test was used to assess normality of the data distribution. Since the data did not follow a normal distribution, the Mann–Whitney U test was applied to compare differences between the portions of allotment gardens located within and outside the flood risk zone. Because the Mann–Whitney U test compares the overall distributions of the two independent groups without accounting for the paired structure of the data, the Wilcoxon signed-rank test was additionally performed to verify whether pairwise comparison of values would yield different results.
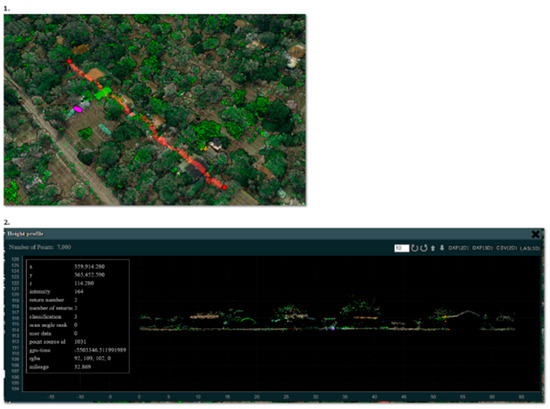
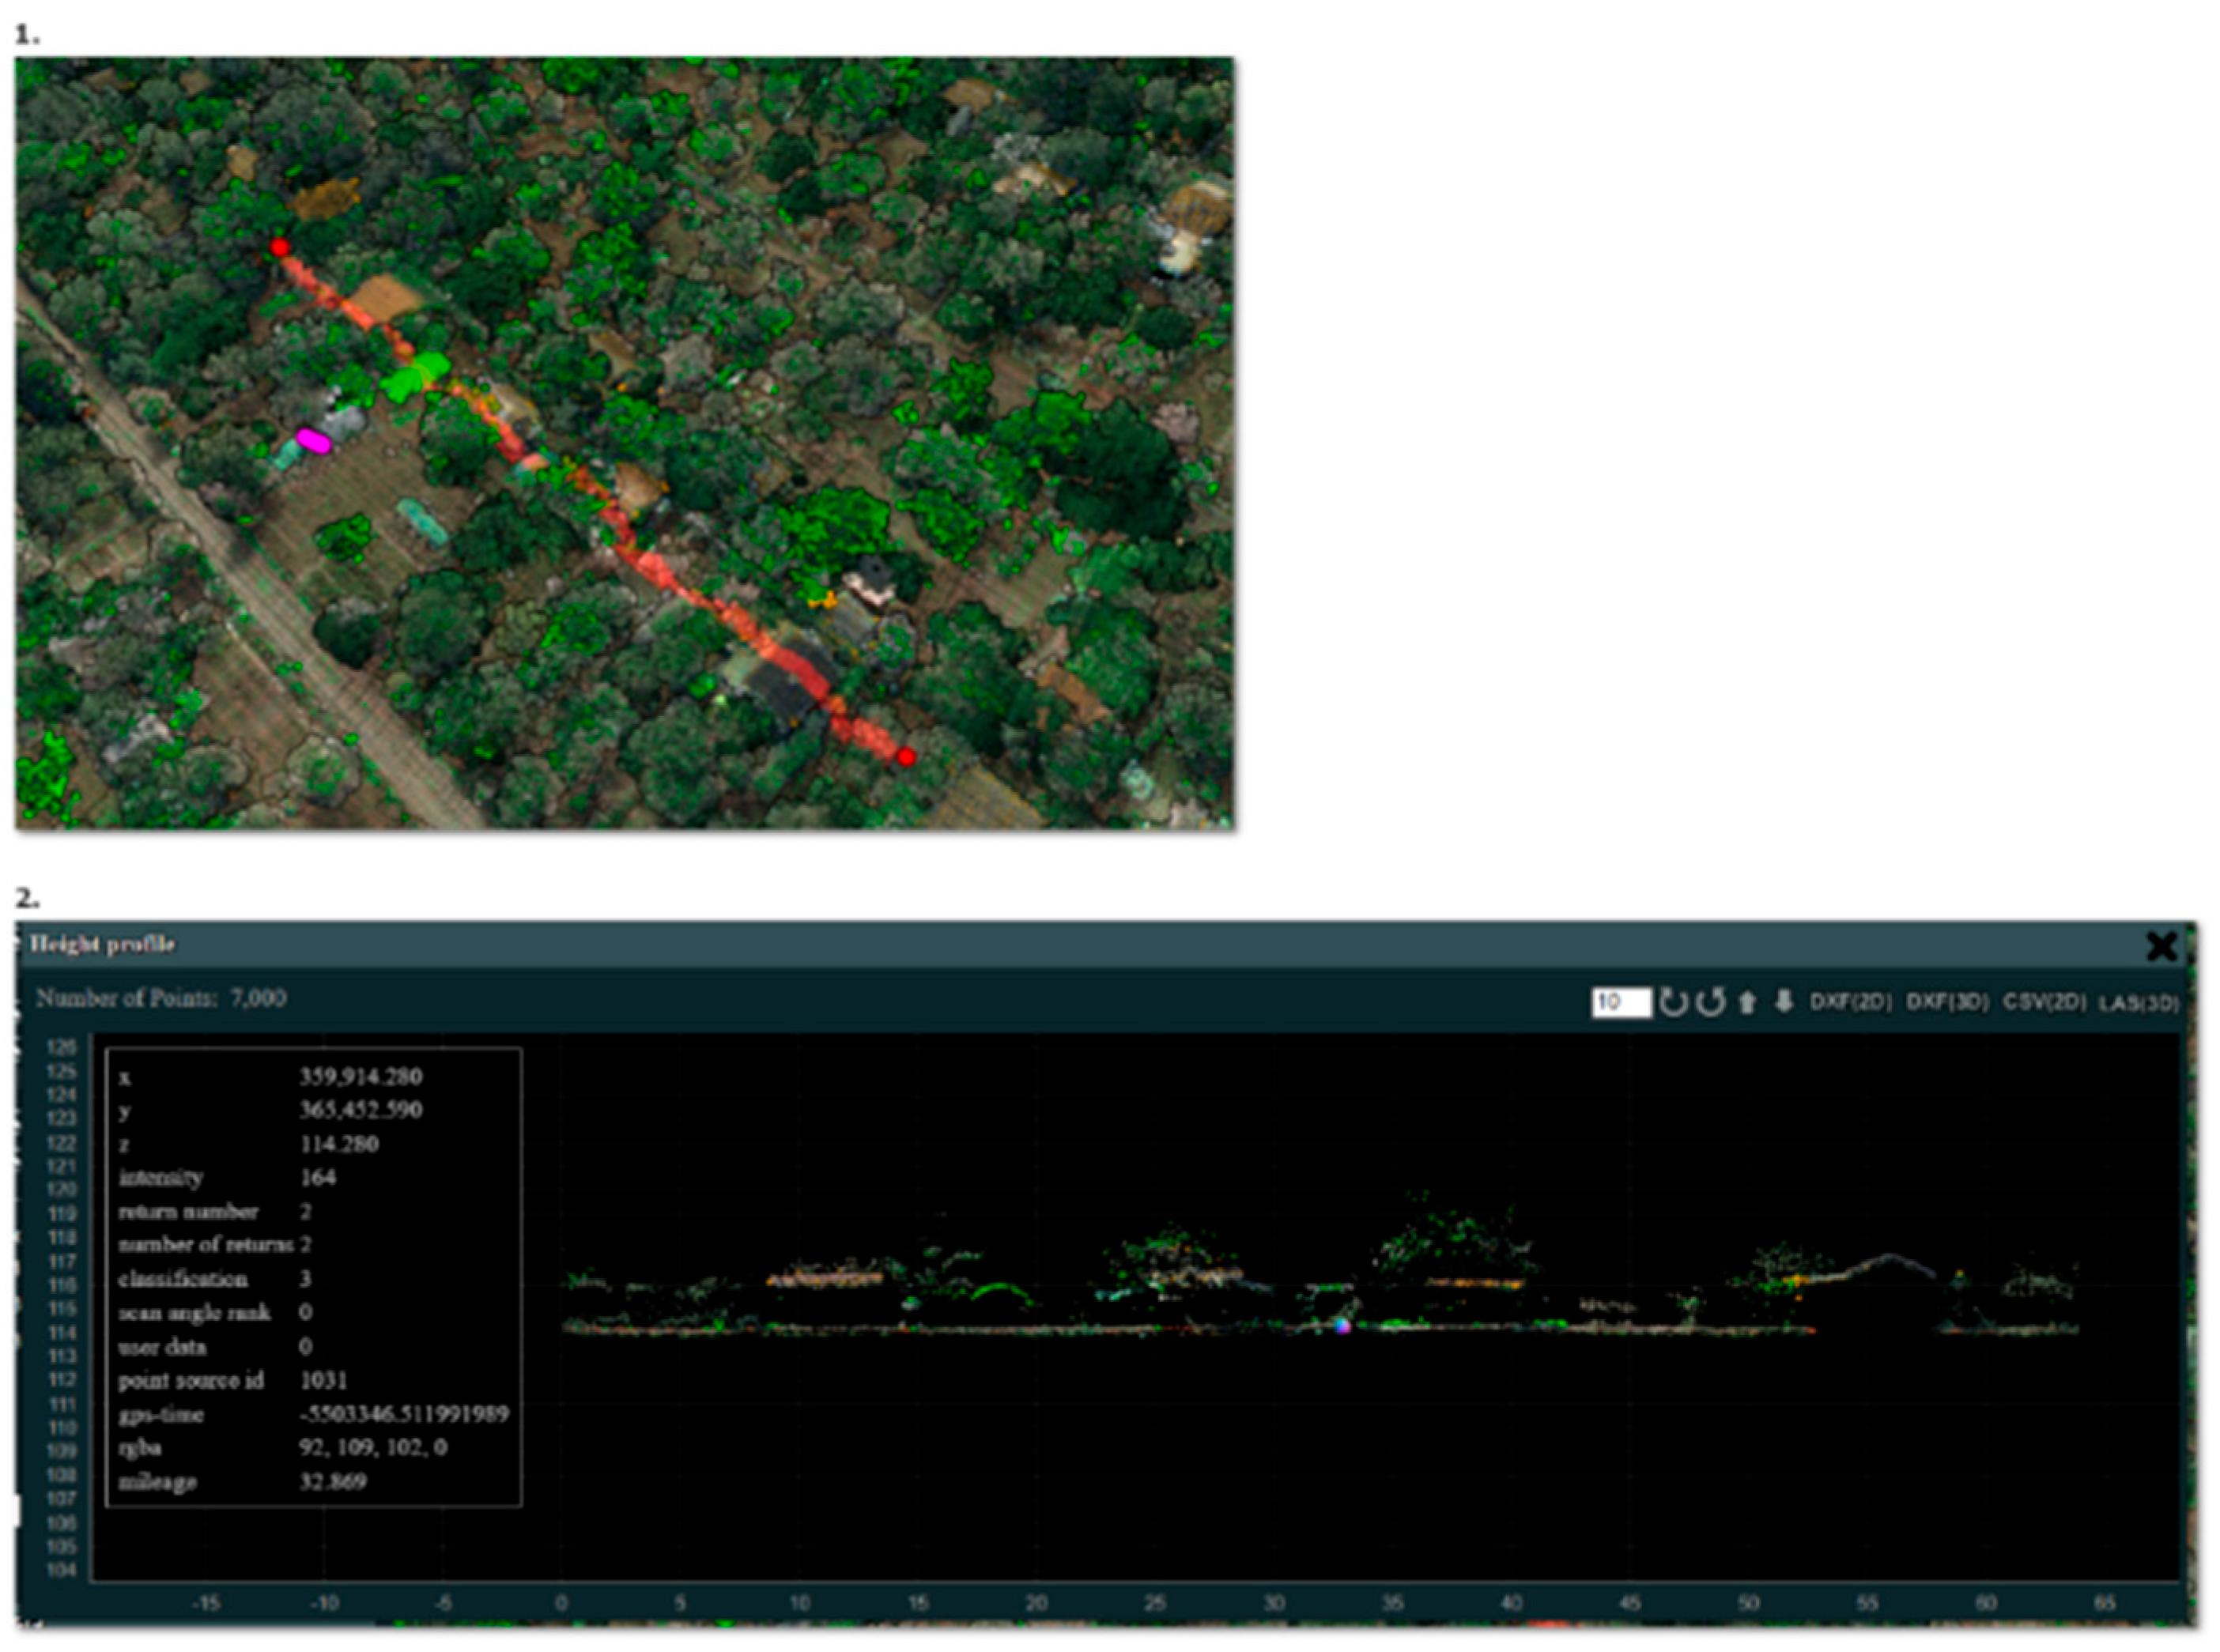
The building coverage ratio (BCR) within allotment gardens was based on LiDAR data from the archives of the GUGiK [60]. These data were originally collected for the IT System of Protecting the Country against Unusual Threats project (ISOK). The data included in the database adhered to two standards (Figure 2 and Figure 3). The first applied to rural areas and involved the creation of a point cloud with a density of 4–6 points per m2. For urban areas, Standard II required a minimum point cloud density of 12 points per m2 or more [61]. These data were collected between 2019 and 2024. Depending on the map sheet used, the year, and the standard adopted by GUGiK, the mean positional error ranged from 0.03 to 0.3 m, which can be considered sufficient for the research objectives. For each allotment garden, only the most recent LiDAR data sheet was selected. Ultimately, 2333 sheets were used, as shown (Table 1).
Figure 2.
Collected point cloud showing the top view and the cross section. Source: own elaboration based on GUGiK data [53].
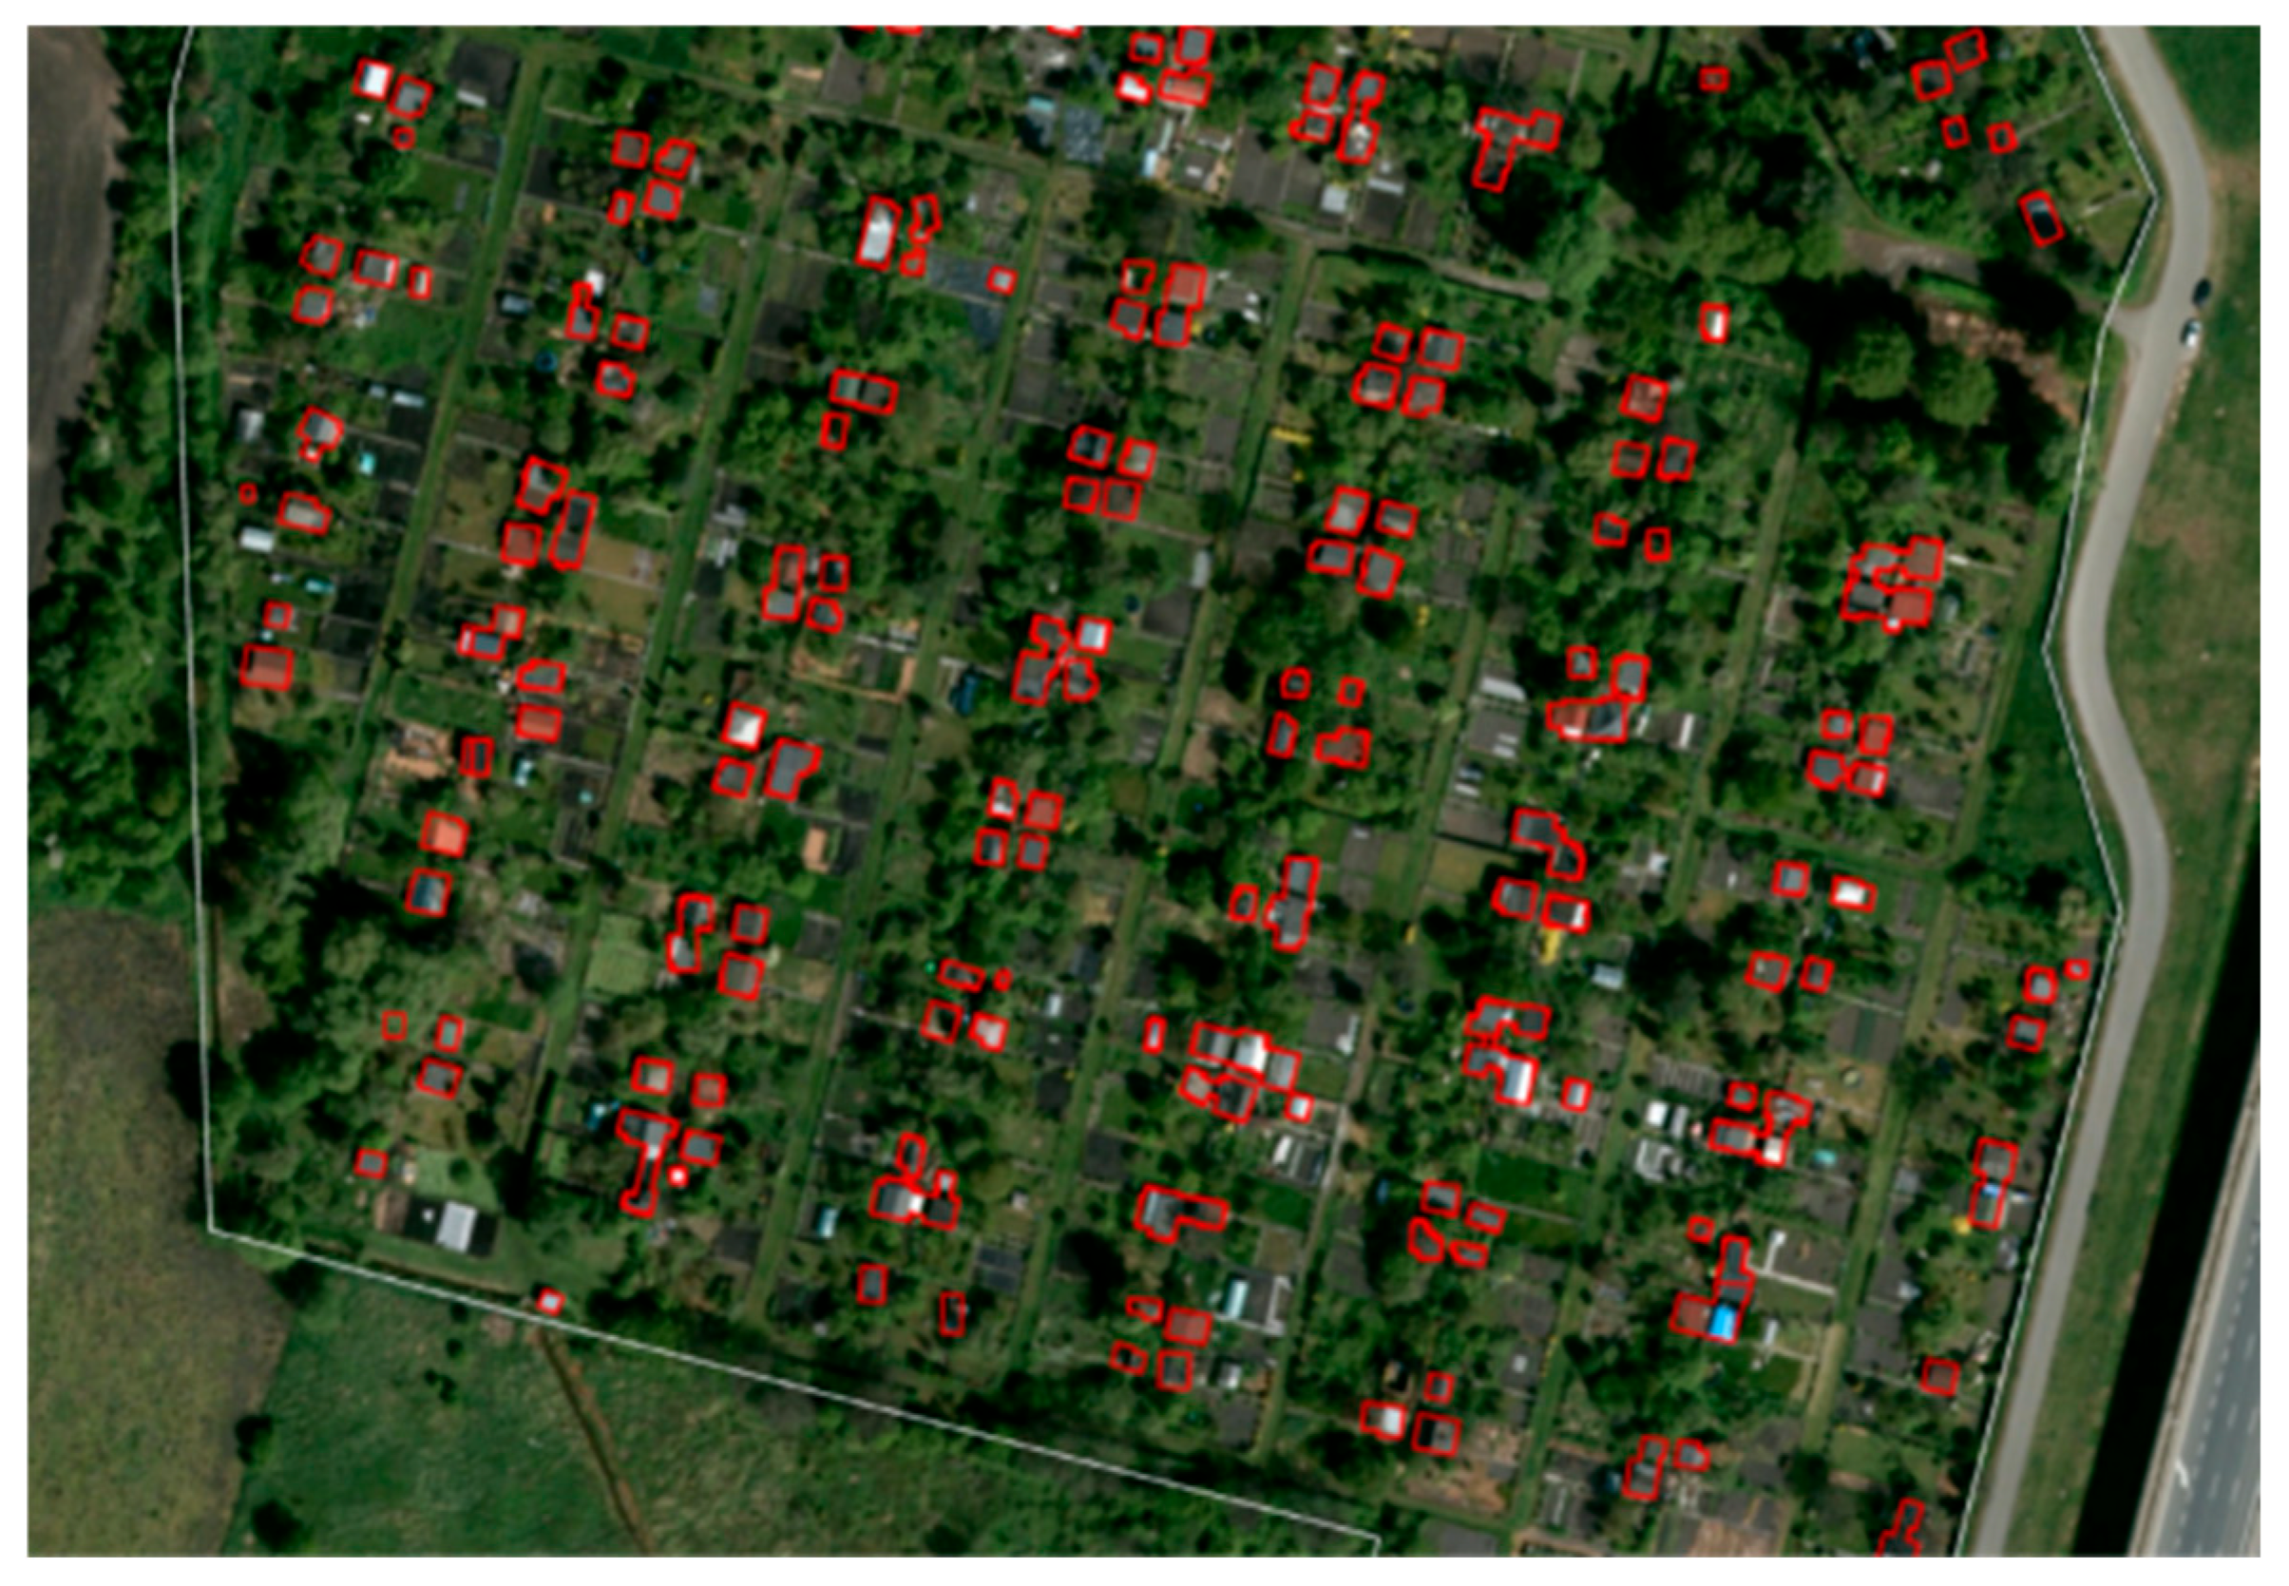
Figure 3.
The result of processing the cloud in the form of a surface layer containing the outlines of buildings located in the AG area. Source: own elaboration based on GUGiK data [53].
Table 1.
Number of LiDAR tiles used in the study, by year.
Data acquisition from GUGiK servers, preprocessing, and extraction of LiDAR points classified as buildings were performed using Python 3.12.0 with the GDAL 3.6.2, geopandas 0.14.3, and pylas 0.6.0a2 libraries. These points were converted into a raster with a spatial resolution of 0.5 m, based on the dominant LiDAR class assigned to each pixel.
The raster was smoothed using the majority filter and Boundary Clean ArcGIS Pro 3.5.1 methods, and then the polyline compression algorithm was used to regularize the shape of the buildings and remove unnecessary geometric artifacts. This method reduces distortions in building footprint polygons that were created through the feature extraction workflow [62]. Only buildings and structures with a coverage area exceeding 5 m2 were included in the analysis. Of the 1.083 AG analyzed, seasonal dwellings were found on the territory of only one. This allotment garden was removed from the analysis.
The quality of buildings generated from LiDAR data was assessed using 50 randomly selected allotment garden complexes (AG) located in the Lower Silesian and Silesian voivodeships (Table 2). In total, 4543 buildings and structures were verified. As reference data, the most recent orthophotomaps available from the national repository of the Head Office of Geodesy and Cartography (GUGiK) were used. When evaluating changes in building geometry, only substantial differences in shape relative to the reference data were taken into account.
Table 2.
Confusion matrix and key metrics for LiDAR-derived building footprints.
The validation of the building modeling results shows that the adopted approach represents building locations sufficiently accurately for the purposes of this study. Only 3.8% of objects detected from LiDAR were incorrectly classified as buildings (false positives), while 4.9% of all buildings visible on the orthophotomaps were missed by the model (false negatives). The most common false positives were larger greenhouses or terraces located under large umbrellas, whereas the model most frequently failed to detect small buildings situated beneath tree canopies. In addition, the time difference between LiDAR acquisition and orthophoto production—sometimes reaching 2–3 years—also affected the apparent accuracy of the model, as real changes in land use and building stock occurred between these dates. Overall, the detected buildings exhibit a generally good geometric correspondence with the reference data.
Among the most important limitations of the study is, in the first place, the incomplete number of allotment gardens within the studied areas in available databases. First, the BDOT10k database1 was considered, which distinguishes the category defined as “garden plots”, referring to a wide variety of green spaces ranging from small private gardens to plots included within allotment gardens. Thus, the number of allotment gardens (plotted polygons) used in the analysis was related to the availability of analyzed objects according to OpenStreetMap (OSM). The authors are aware of the incompleteness of the database. The dataset obtained from OSM accounts for 86% of the object count reported by GUS, which constitutes a sufficient basis for statistical analysis. However, the degree of its incompleteness varies by location, introducing a systematic bias in the spatial distribution of the sample. This aspect should be taken into account when interpreting the study results.
It should be noted, however, that OpenStreetMap is a global geospatial database, while LiDAR data can be acquired locally, for example through UAV-based laser scanning. Consequently, the datasets used in this study provide a basis for the global comparability of the results, provided that the same methodological approach is applied. Thus, in the opinion of the authors, further research covering other units is advisable.
It is also important to underline that the flood risk zones defined within the ISOK project are the result of hydraulic modeling, which is a kind of simplification of reality. As a result, the floods that occur, as shown in the paper, can happen outside the official flood risk zones. Moreover, different entities responsible for managing flood risk may model flood risk differently, which makes it hard to compare data internationally. Additionally, OSM data, due to the way it is collected (crowdsourcing), can be incomplete, and this uncertainty can also vary across locations. Errors can also occur at a semantic level, meaning different people might label the same object differently. On the other hand, the LiDAR data come from the period 2019–2024, so there is some uncertainty about existing buildings on the plots due to the time gap between the data collection and the conduct of the research.
4. Results
The primary objective of this study was not only to identify allotment gardens located within official flood hazard zones, but also to determine whether historical spatial development within these gardens reflected flood hazard conditions. For this purpose, the Building Coverage Ratio (BCR), derived from airborne LiDAR data, was compared between garden areas located inside and outside flood hazard zones.
The analysis demonstrated that the Building Coverage Ratio did not differ significantly between allotment garden areas situated within flood hazard zones and those located outside them. This finding suggests that flood hazards have generally not influenced the historical spatial development of allotment gardens. In other words, the intensity of development appears to be independent of the officially designated flood hazard zones.
To provide the spatial context for interpreting these results, the distribution of allotment gardens within the official flood hazard zones was subsequently analyzed for three annual exceedance probability (AEP) scenarios (10%, 1%, and 0.2%), corresponding to the 10-, 100-, and 500-year flood events. The descriptive statistics are presented in Table 3.
Table 3.
Descriptive statistics of flood risk in the study area.
The results indicate that 2.59% of all AG are exposed to the most frequent 10-year flood, affecting a total area of 1.92 km2. The highest percentage of AG at risk from a 10-year flood is observed in the Opole voivodeship, where 10.20% of AG fall within this hazard zone. In Lower Silesia, this figure is 3.02%, while in Silesia, only 1.39% of AG are affected. The extent of flood risk increases significantly with longer return periods. In the case of a 100-year flood, 69 AG, comprising 6.37% of the total, are located within the hazard zone, affecting an area of 3.77 km2. The highest percentage of exposed AG is again observed in Opole voivodeship, where 14.29% of allotment gardens fall within the 100-year floodplain. In comparison, the proportion is lower in Lower Silesia (8.32%) and Silesia (3.56%).
The flood risk does not decrease but intensifies for longer return periods. The most severe scenario, a 500-year flood, poses a threat to 108 AG, representing 9.97% of all analyzed allotment gardens, with a total affected area of 5.48 km2. The highest exposure is observed again in Opole voivodeship, where 16.33% of AG are located in the flood-prone area, followed by Lower Silesia with 13.04% and Silesia with 6.14%. These findings suggest that Opole and Lower Silesia voivodeships are particularly vulnerable to extreme flooding events.
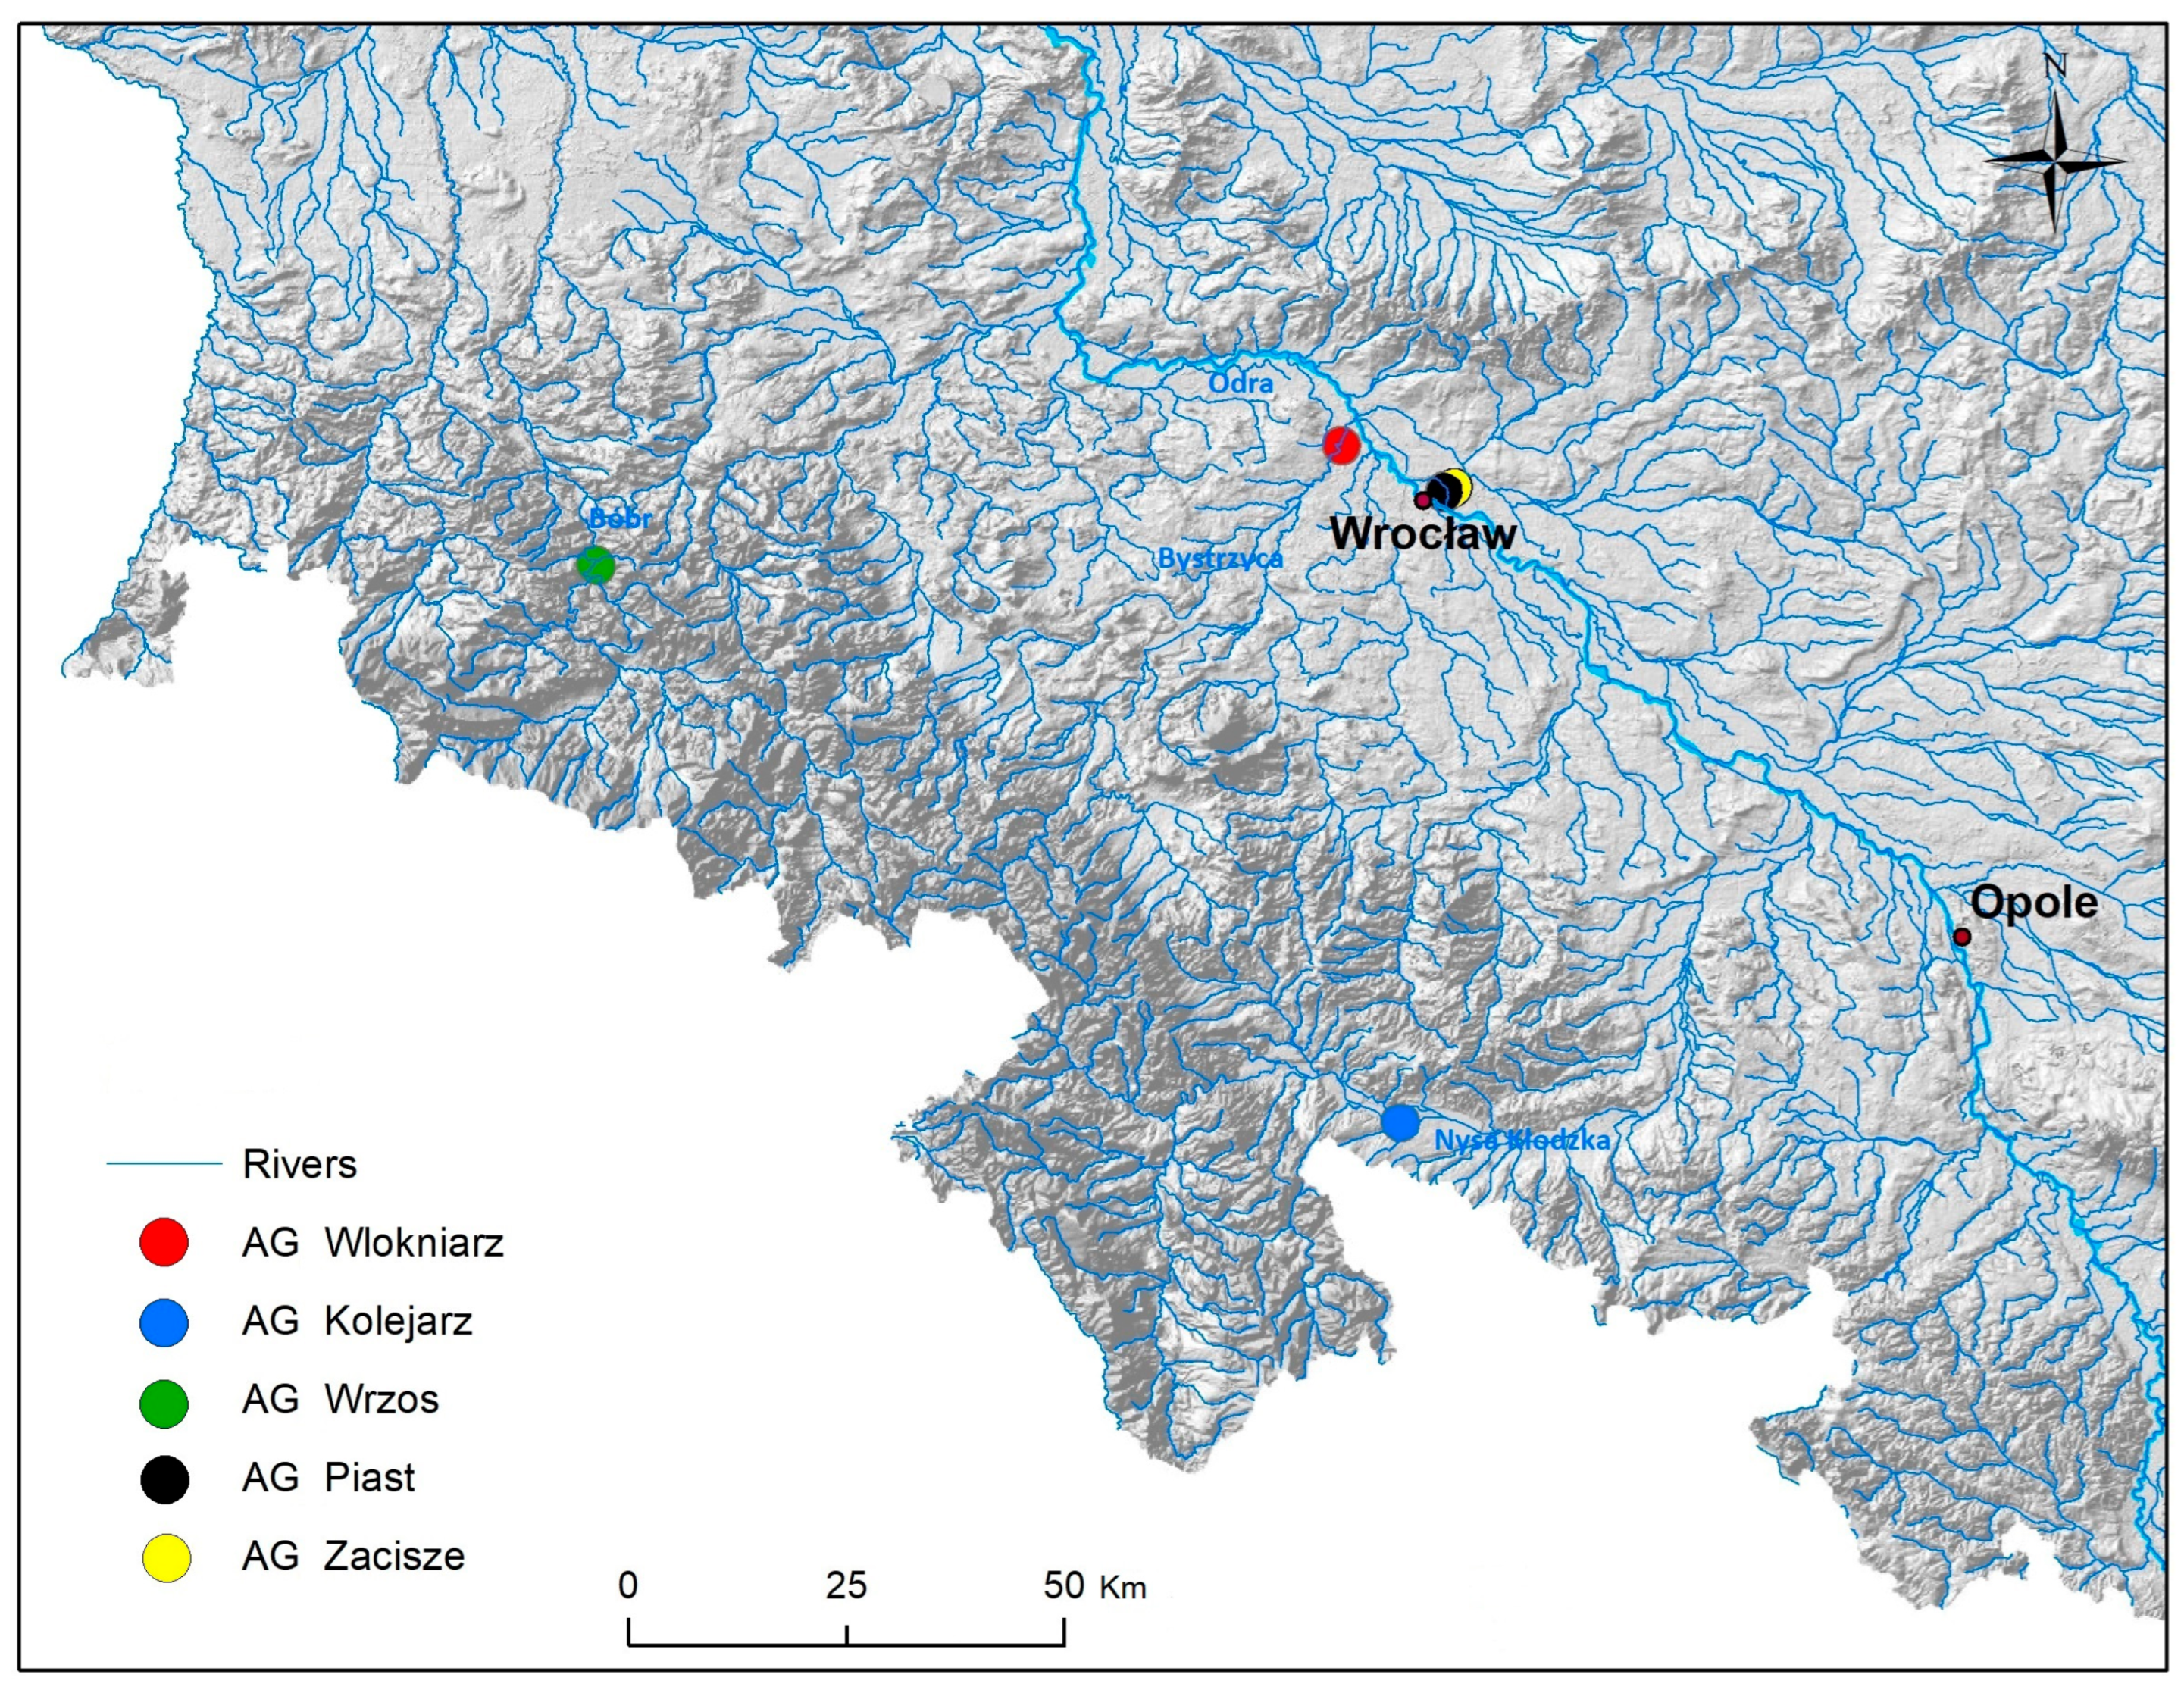
In order to thoroughly analyze the flood situation, the authors decided to take a closer look at five selected allotment gardens (Figure 4): AG “Kolejarz” in Pomianów Dolny (Opole voivodeship), AG “Wrzos” in Wleń (Lower Silesia voivodeship), AG “Zacisze” in Wrocław (Lower Silesia voivodeship), AG “Włókniarz” in Wrocław (Lower Silesia voivodeship), and AG “Piast” in Wrocław (Lower Silesia voivodeship).
Figure 4.
Research area—five selected AG against the background of the river network and topography. Source: own elaboration based on GUGiK data [53].
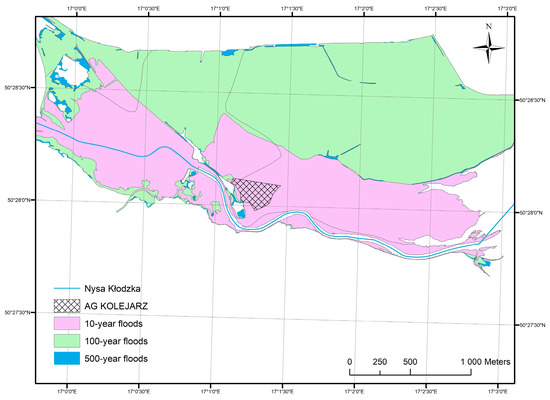
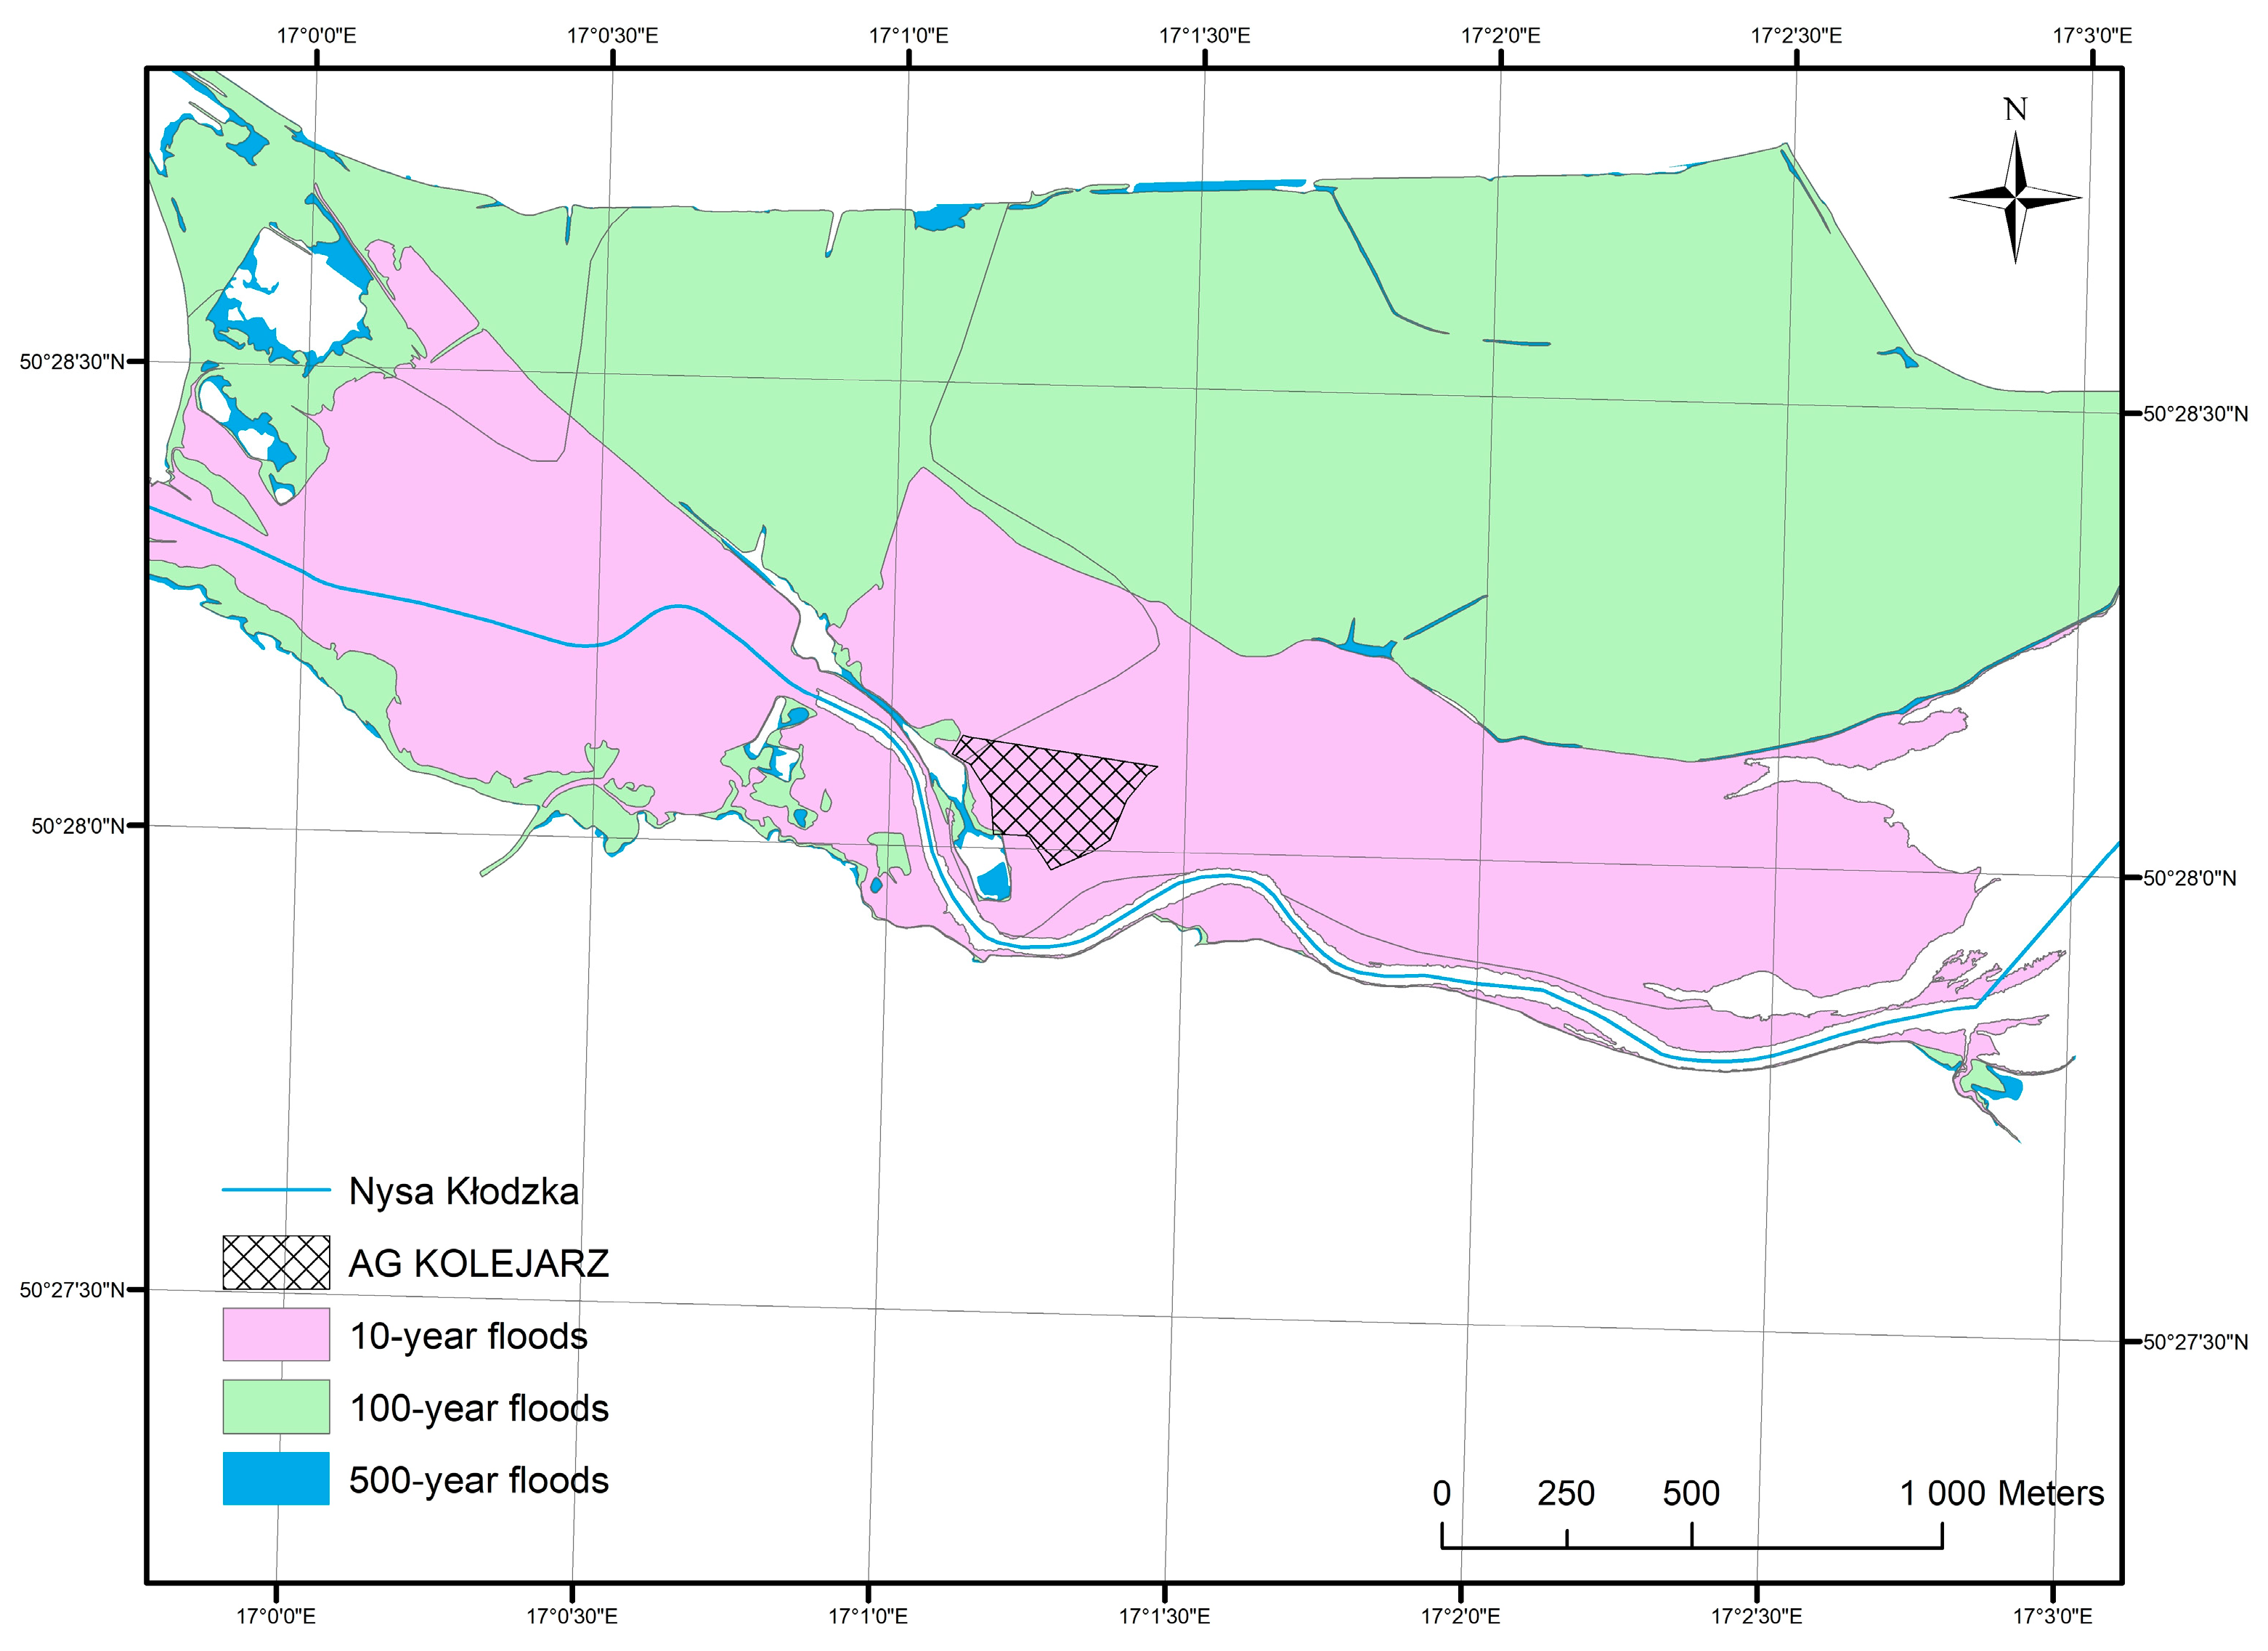
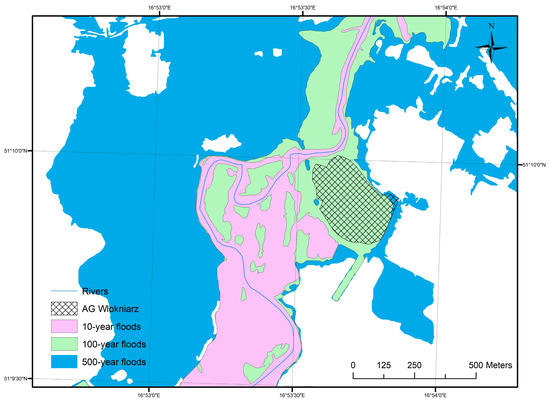
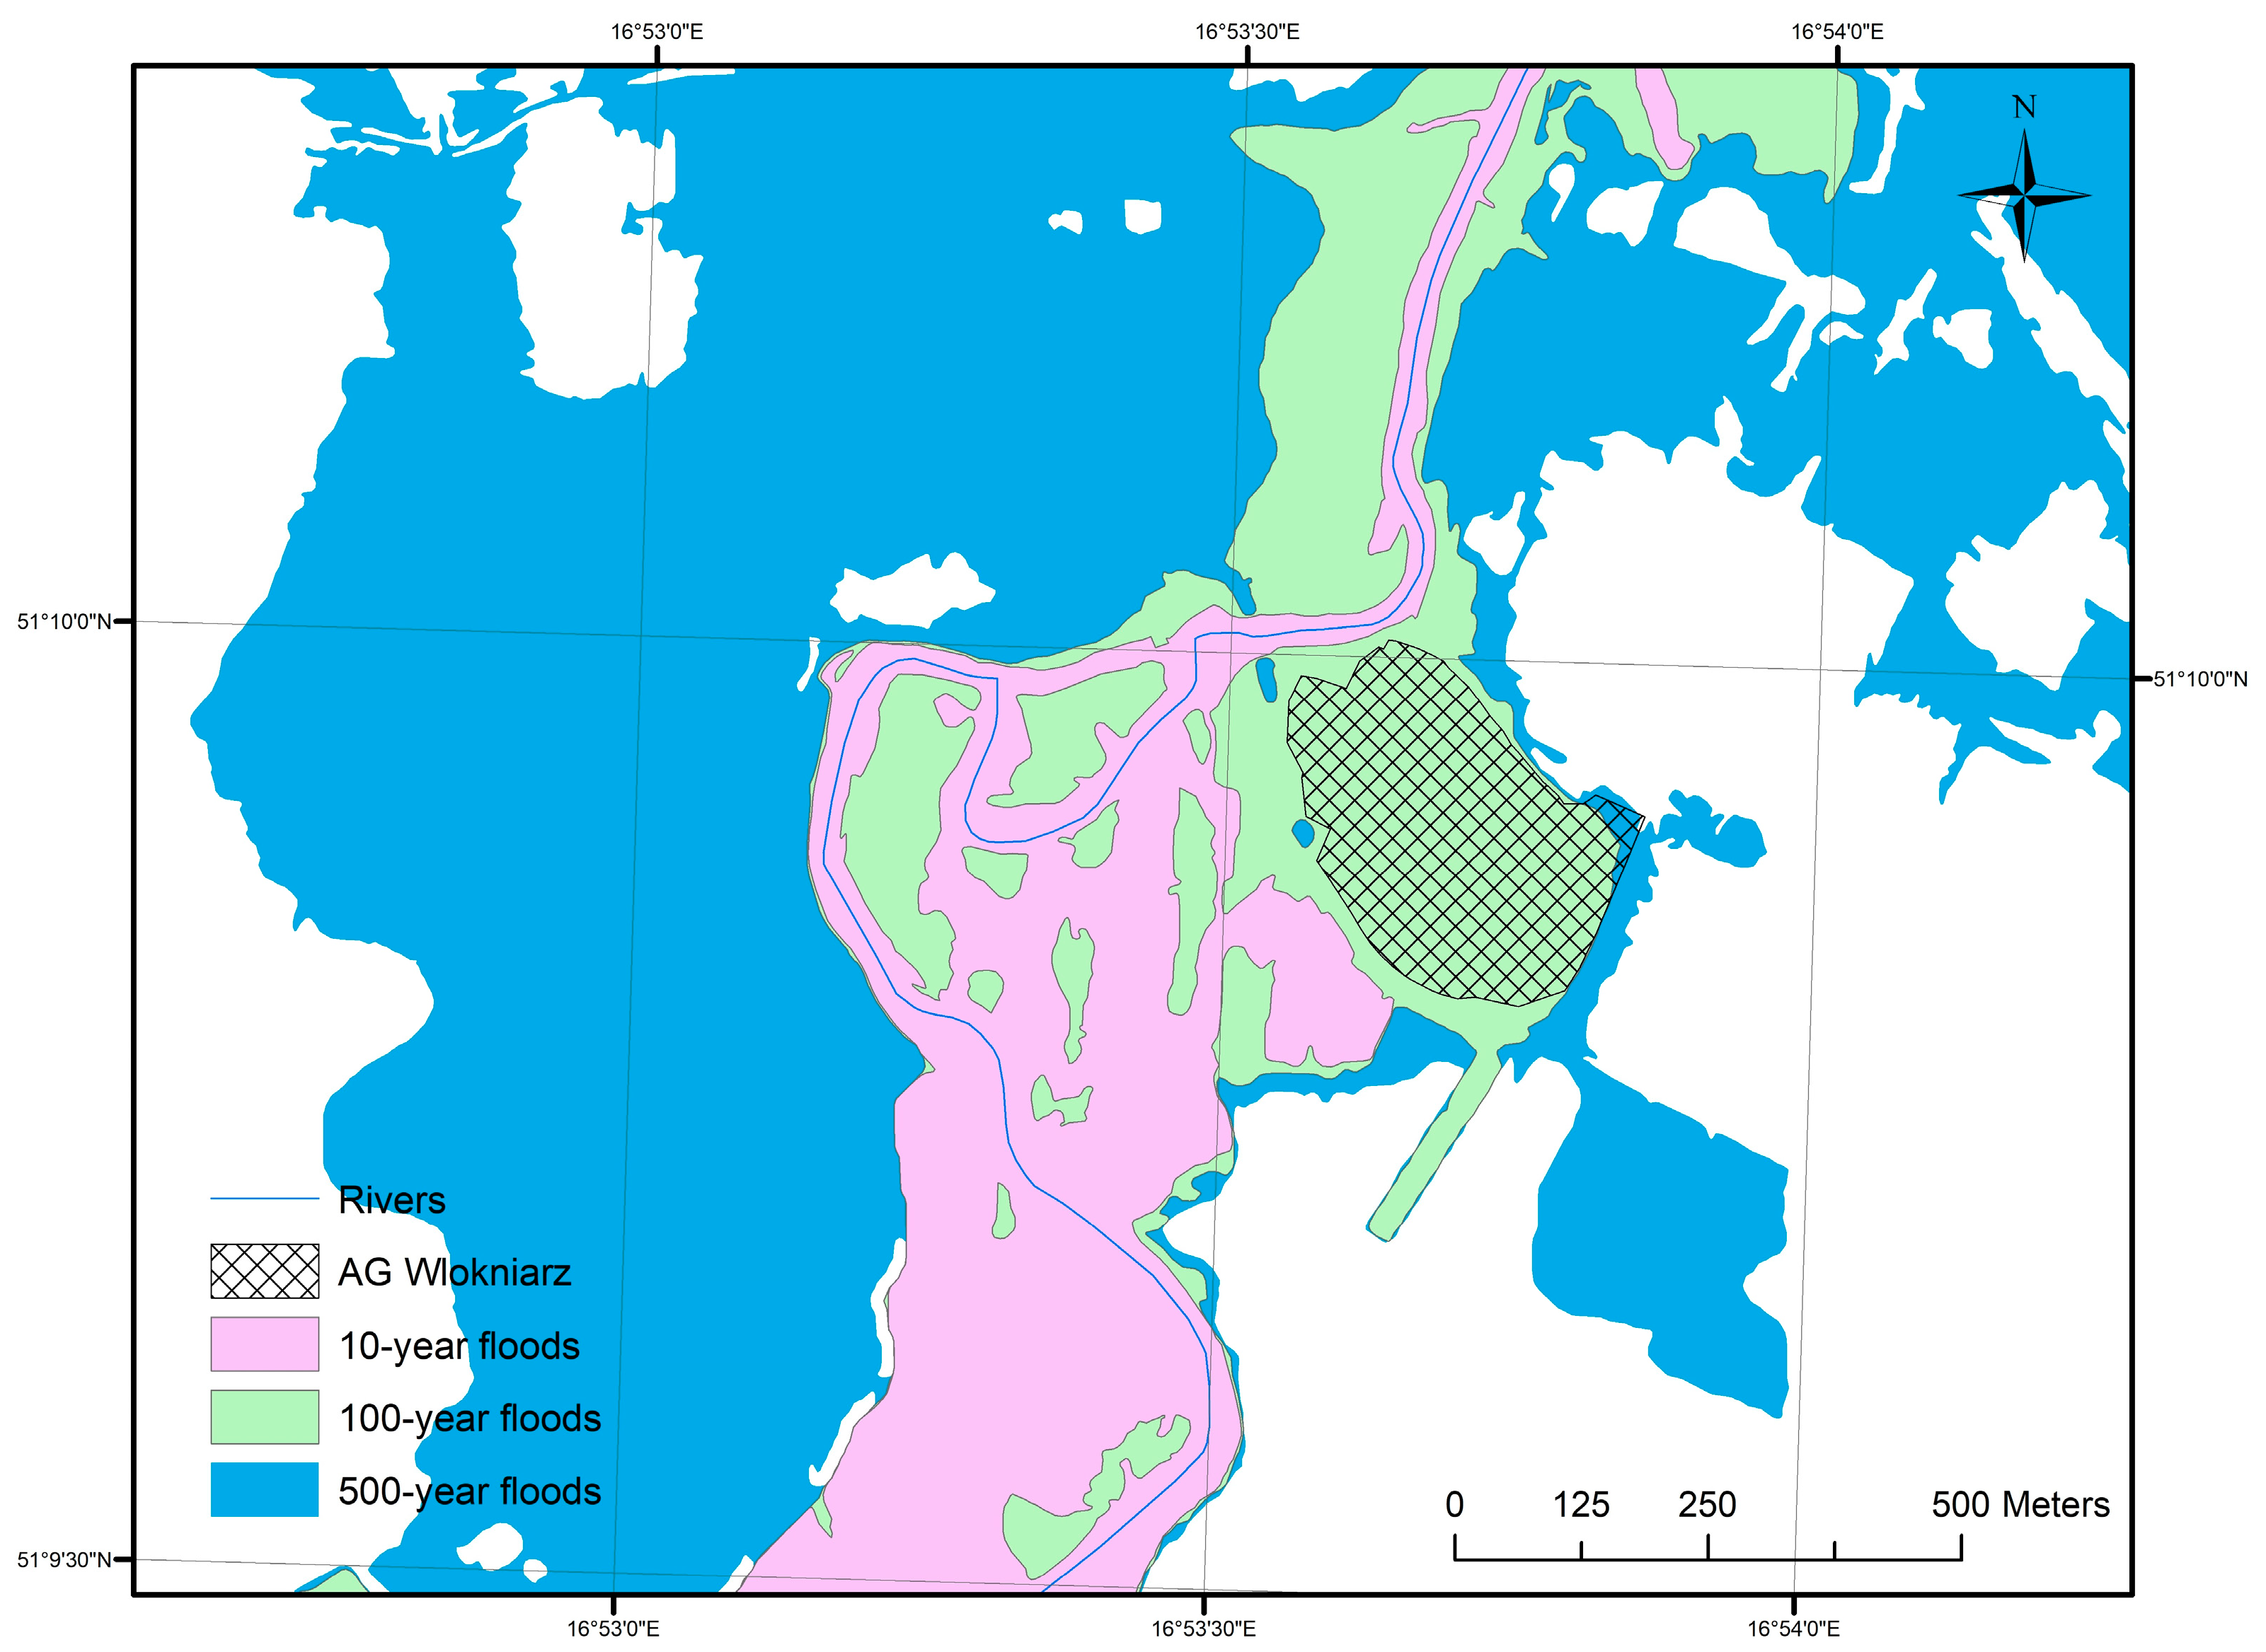
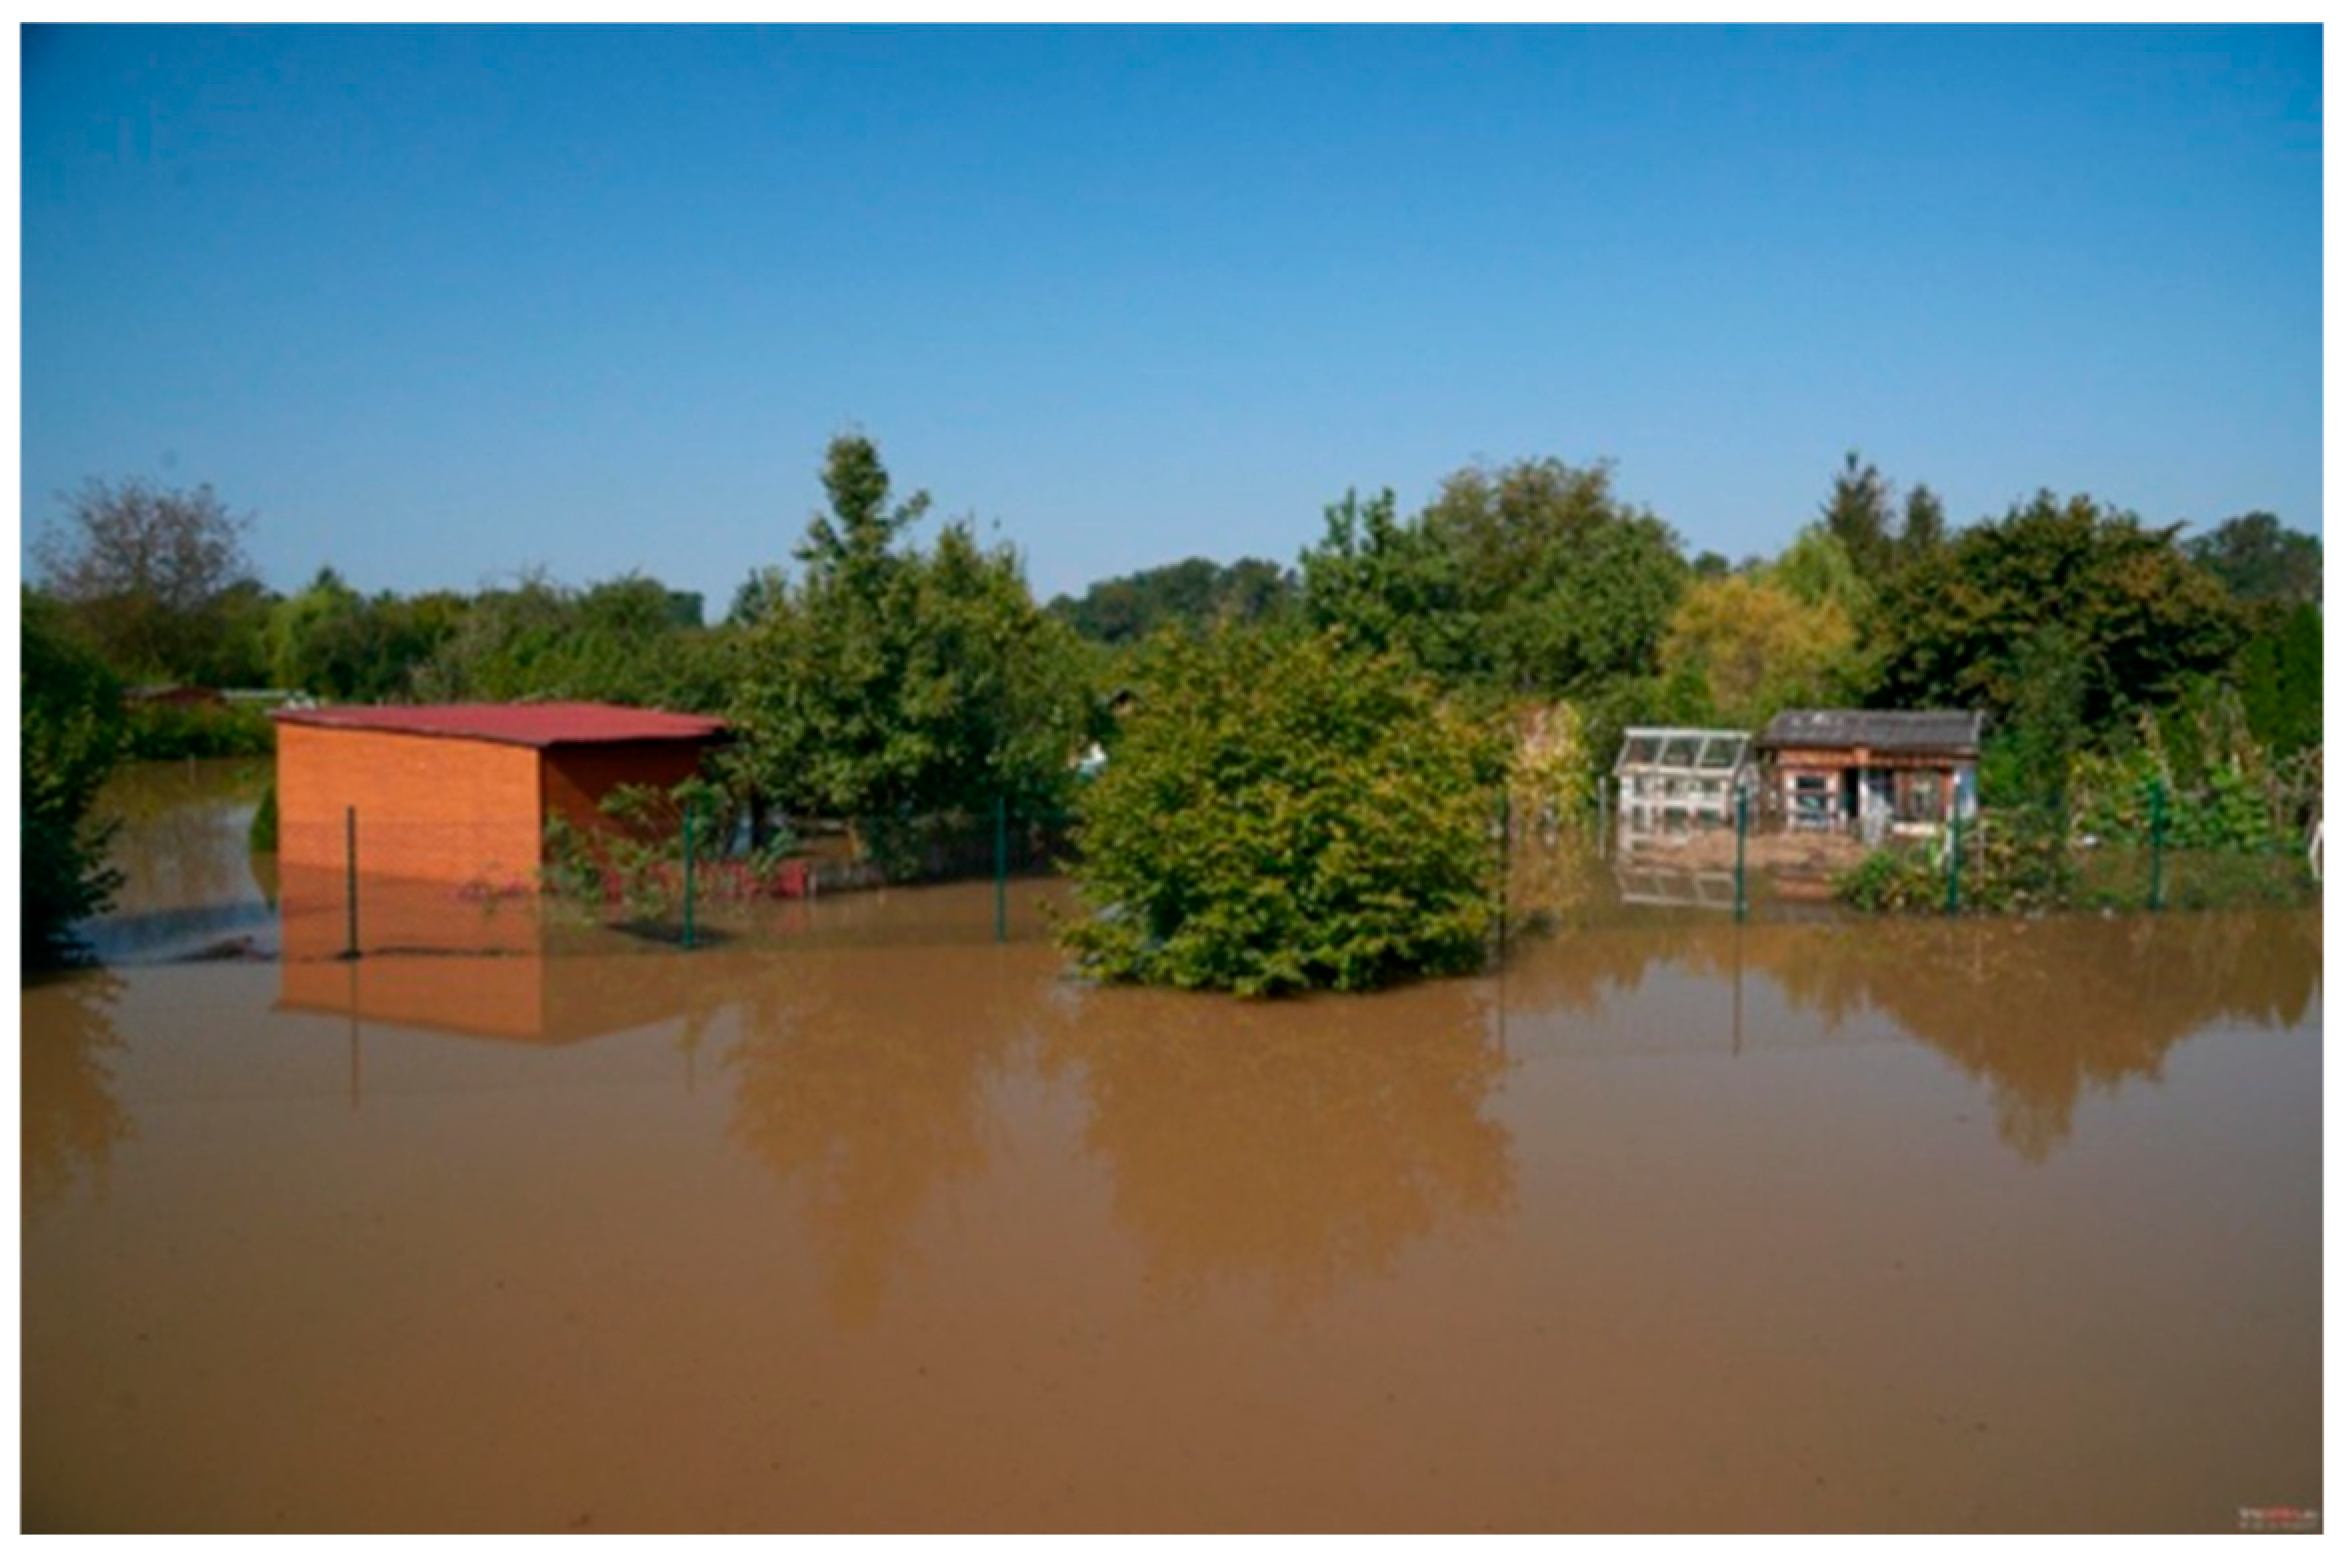
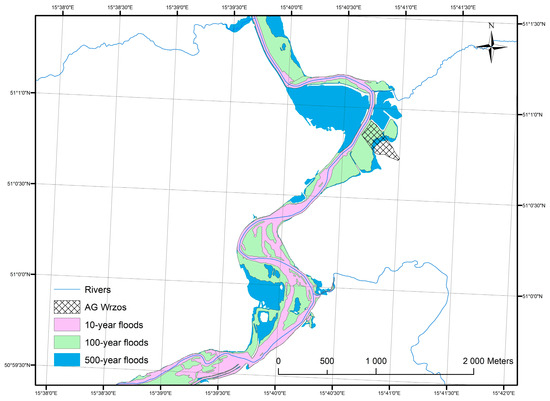
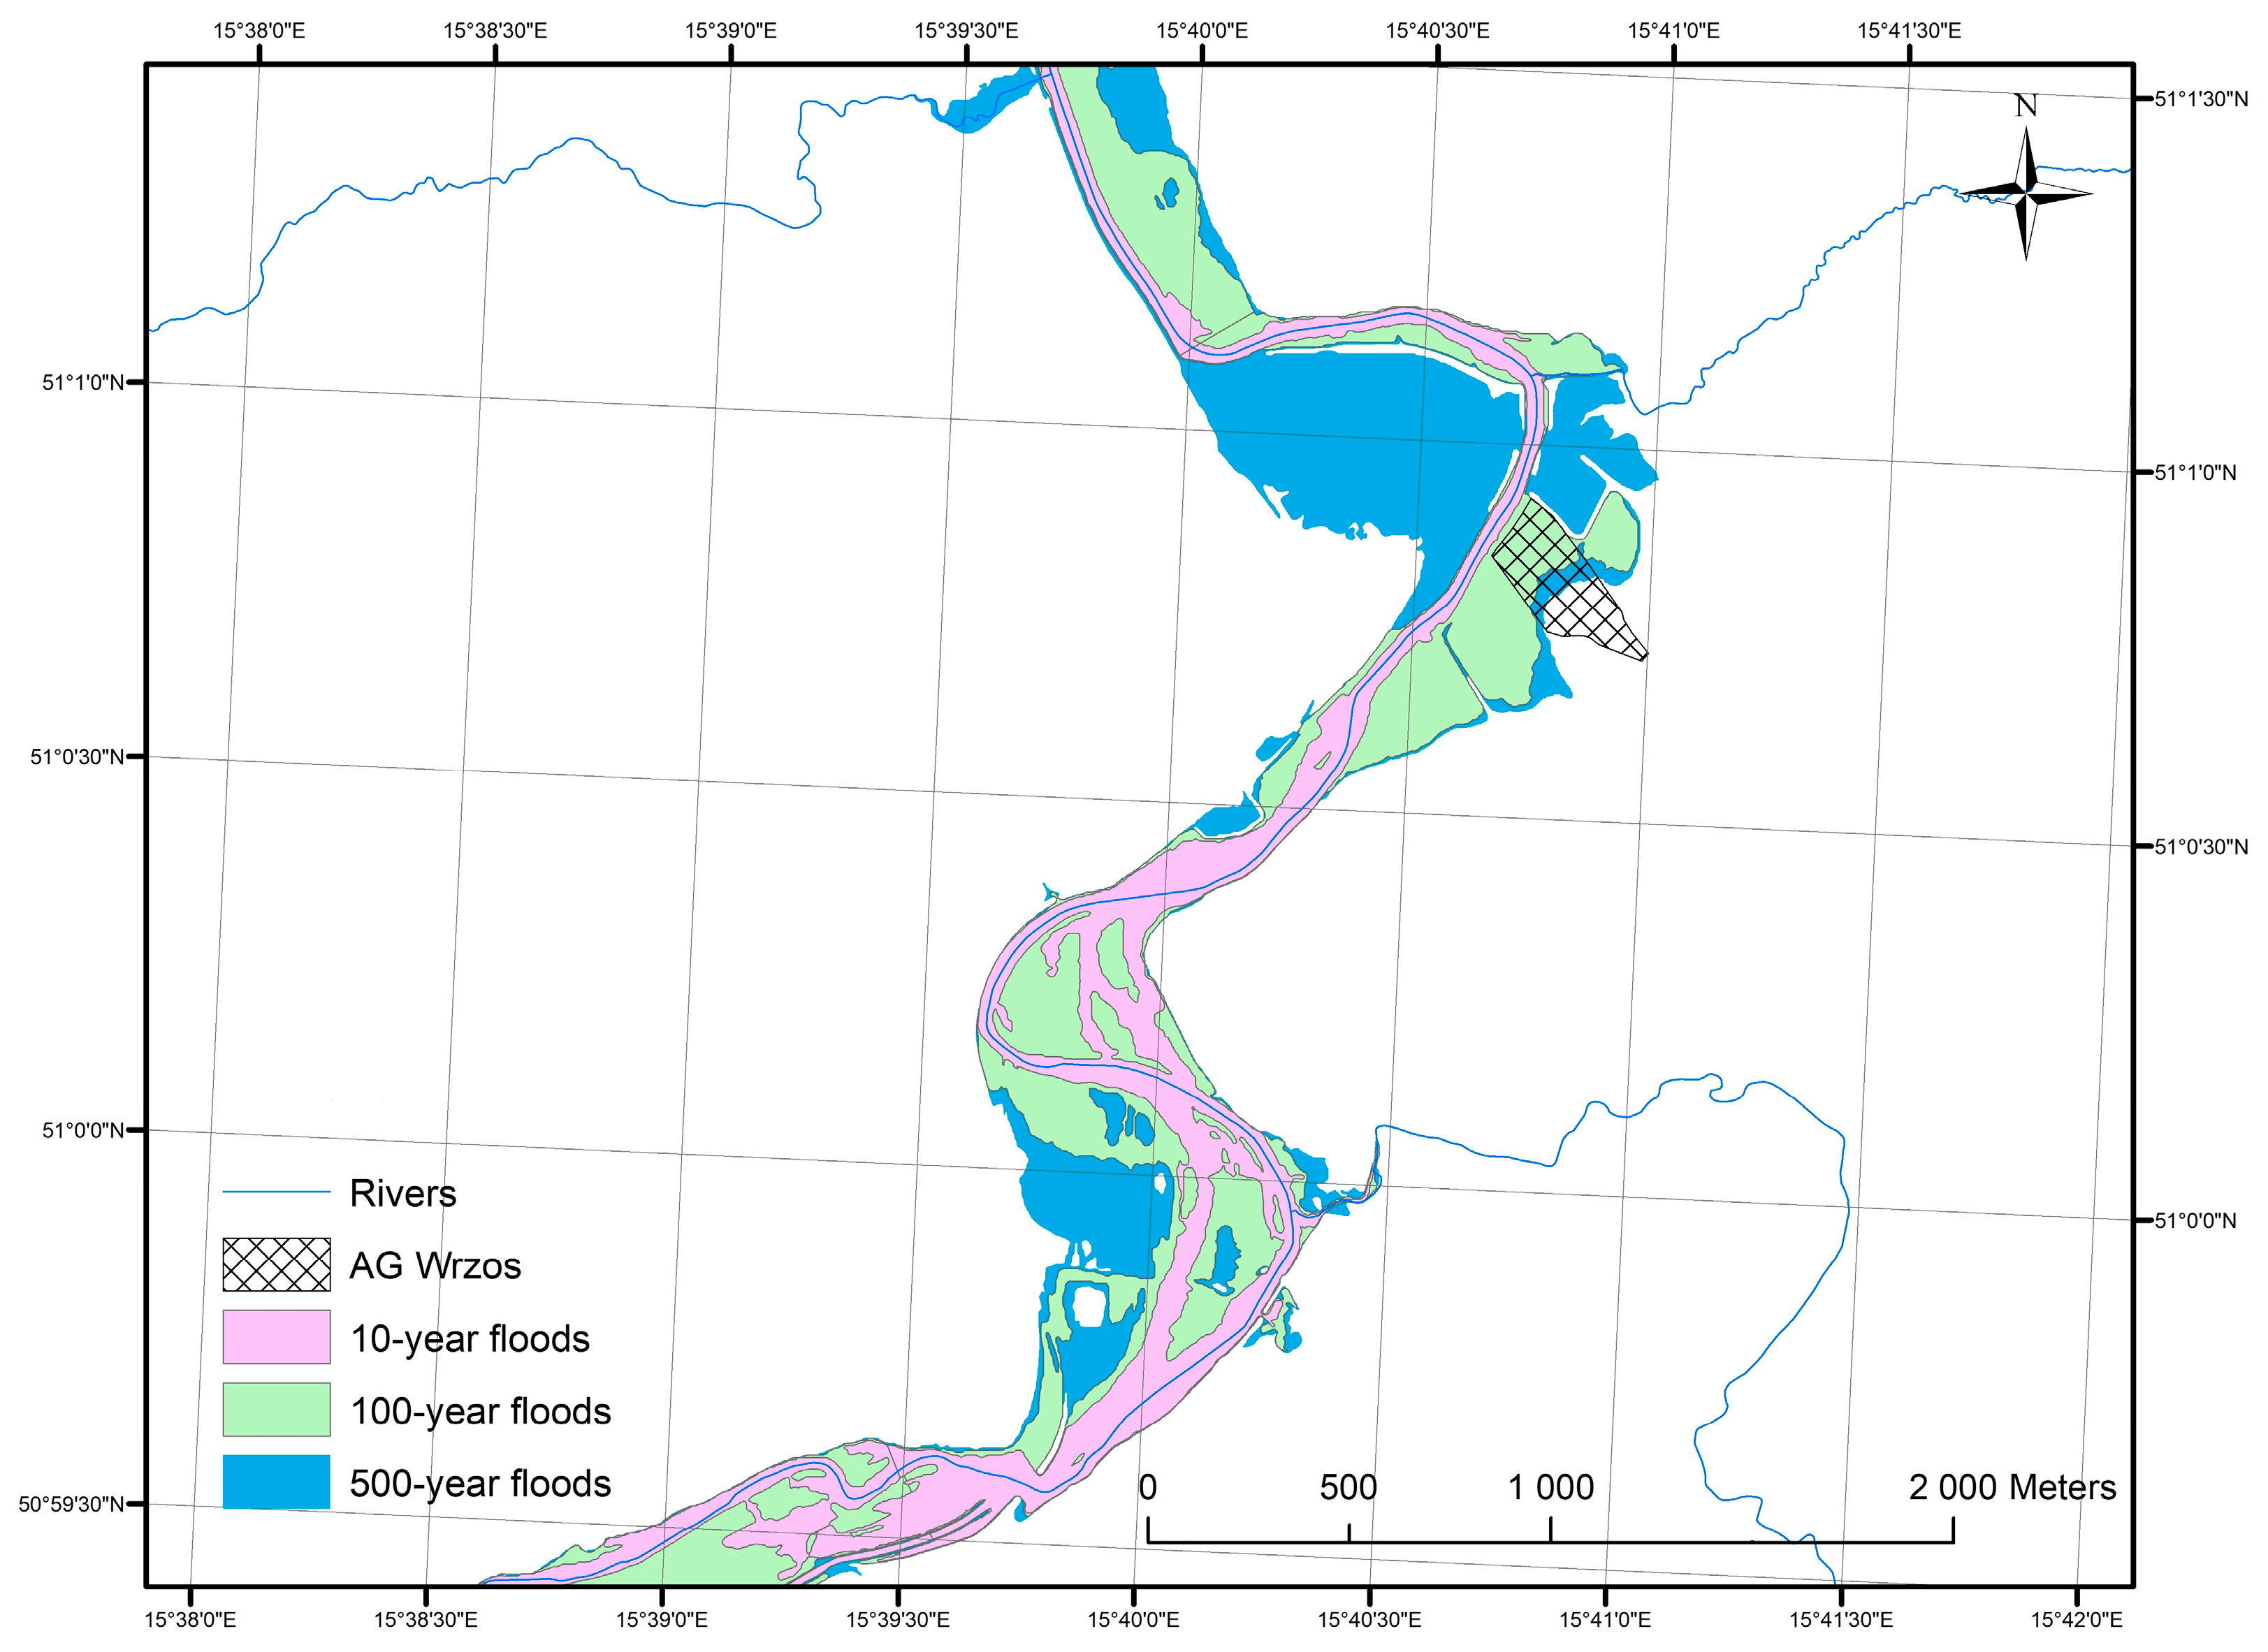
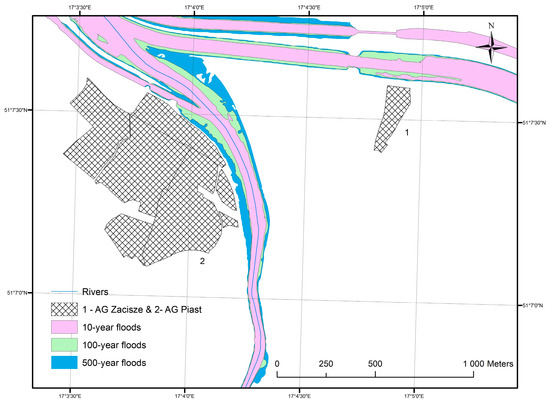
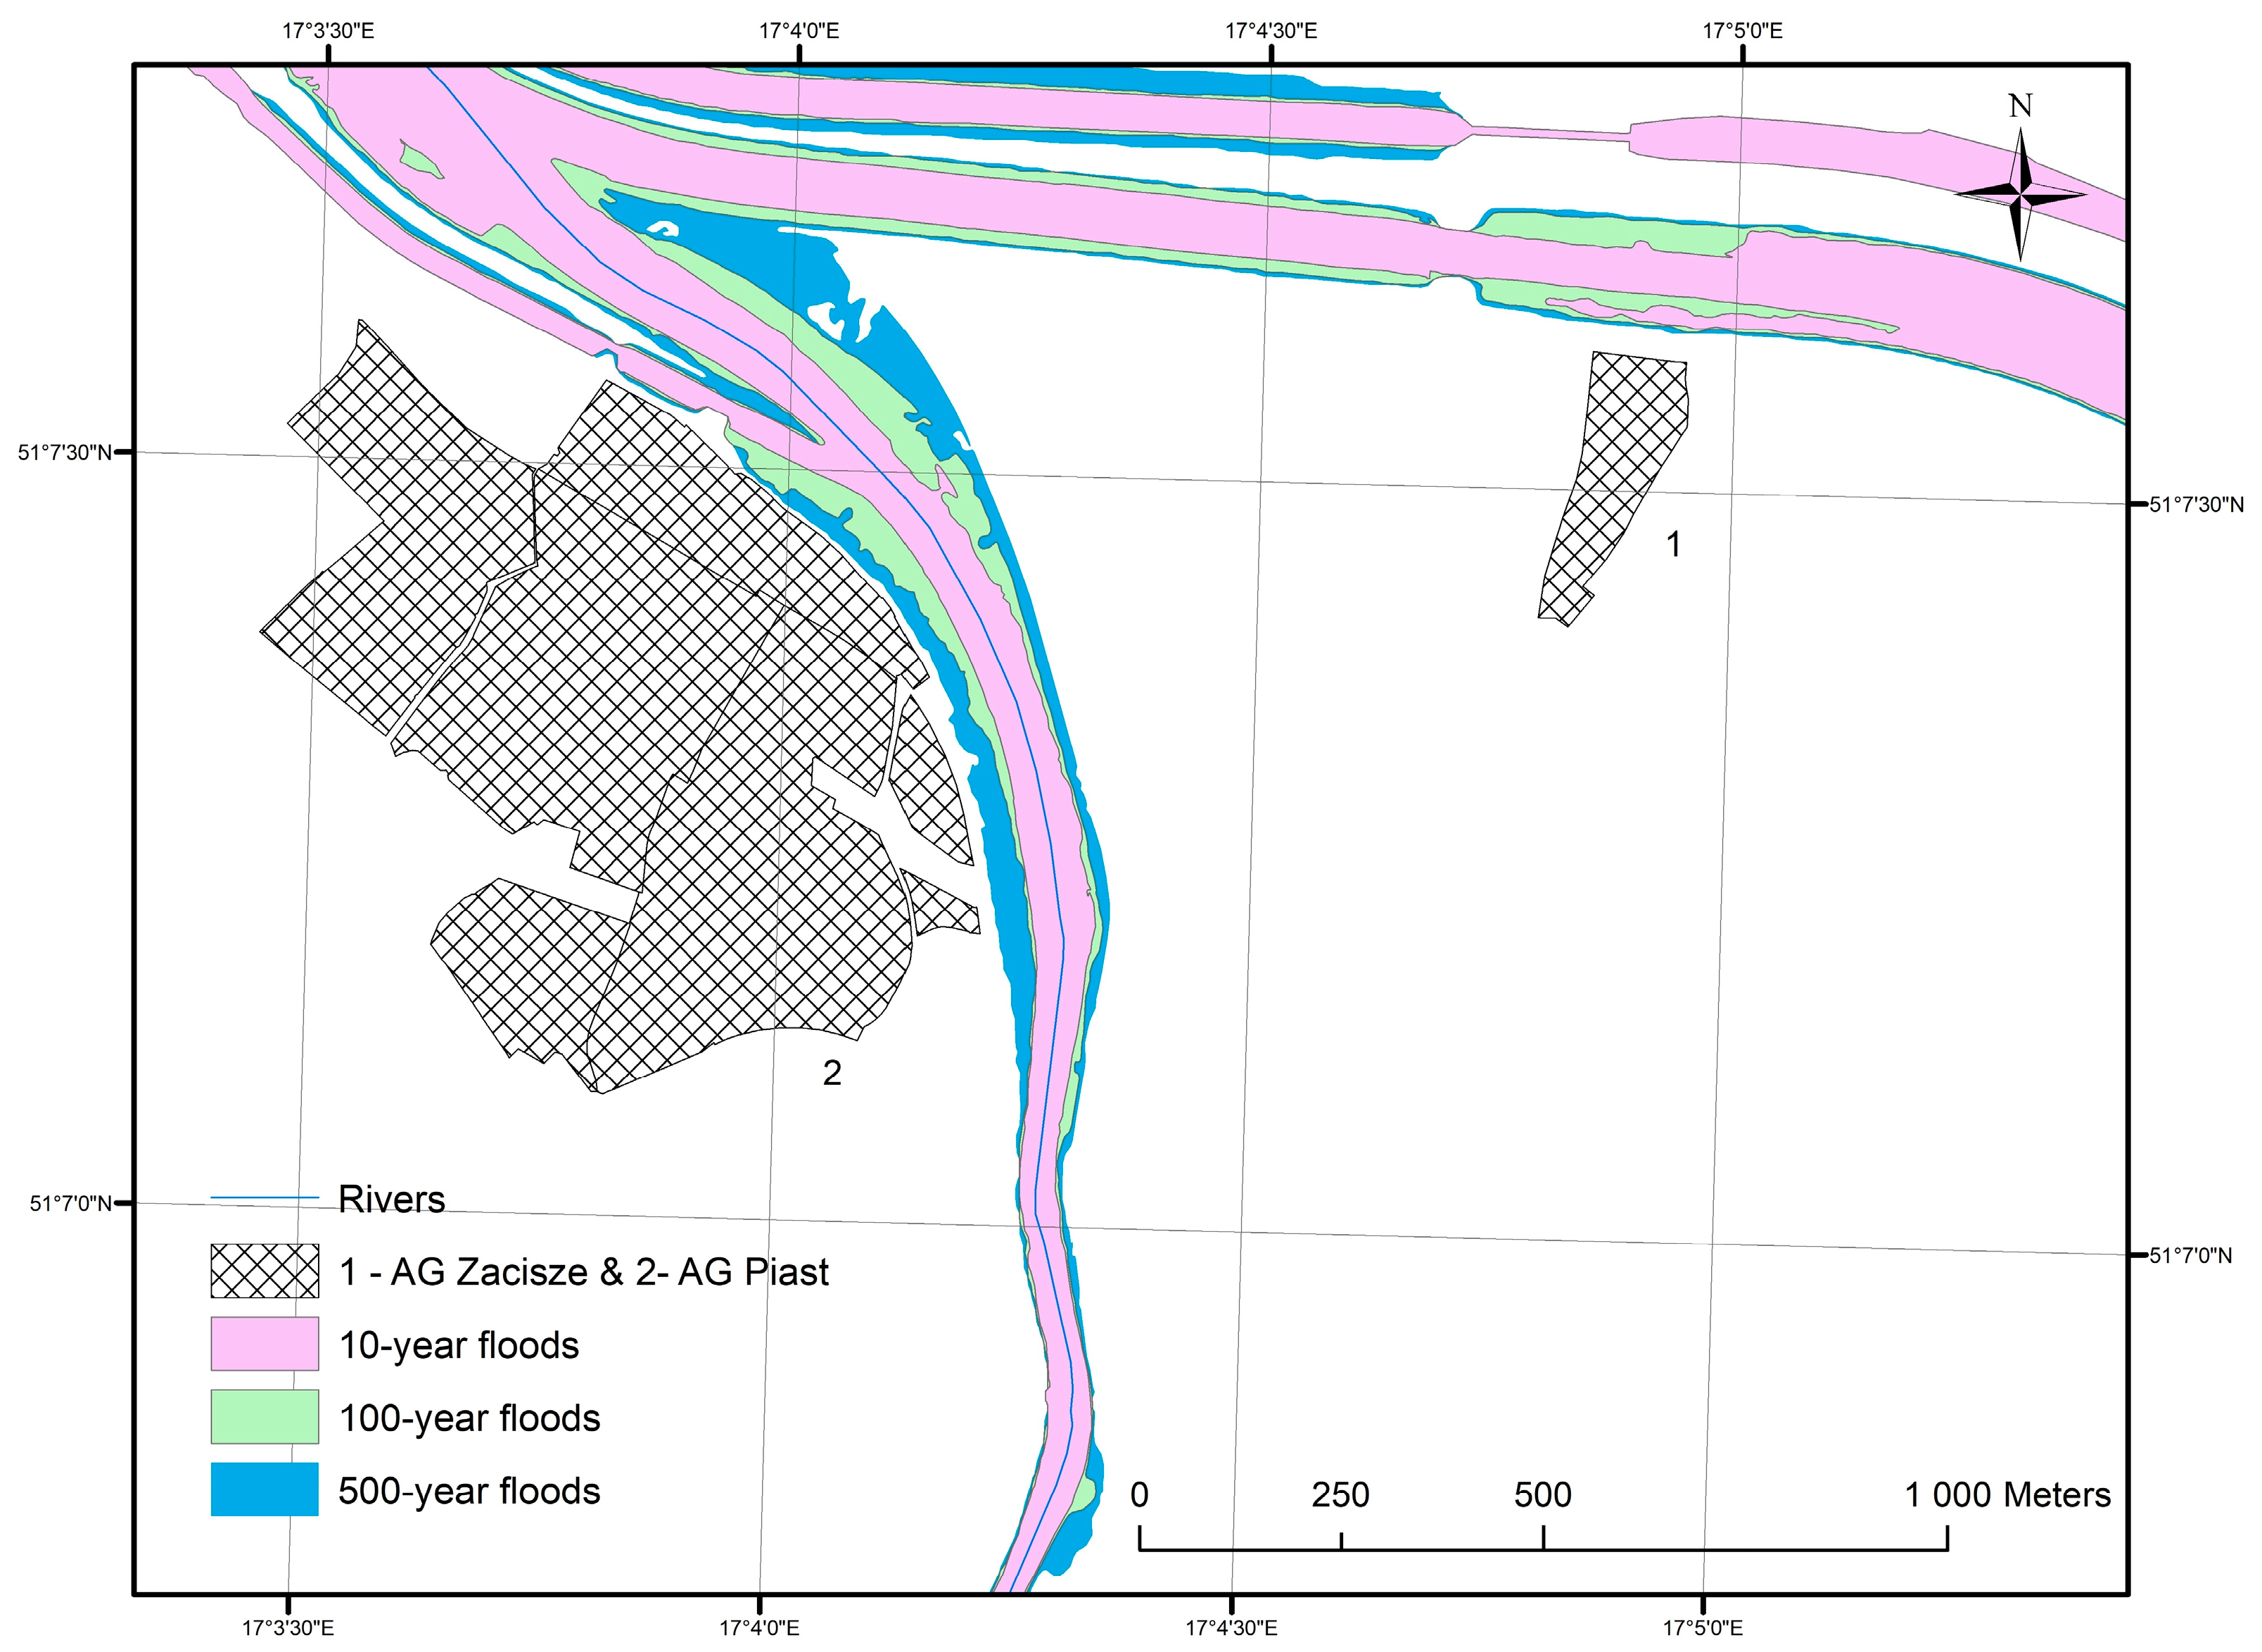
AG “Kolejarz”, situated by the Nysa Kłodzka River, above the Paczków retention reservoir in Pomianów Dolny (Opole voivodeship), is located entirely within the hazard zone (Figure 5). AG “Włókniarz” is situated in Wrocław by the Bystrzyca River (Figure 6 and Figure 7). Although it lies entirely located in the area marked as a 100-year flood zone, it was flooded during floods in 1997, 2010, and 2024. In September 2024, almost 5 ha and 120 plots of the AG were flooded [14]. AG “Wrzos”, situated on the slope of the Bóbr River valley (Figure 8), has the lowest-lying plots on the border of the 10-year and 100-year floodplains. The rest of the allotment garden is situated in the area of the 100-year and 500-year floodplains. According to simulations, the upper part of the garden is located outside the flood-prone area, but it was flooded in 2024. AG “Zacisze” and “Piast” in Wrocław lie close to the Stara Odra and the Flood Canal (Figure 9). Although their location was entirely outside the areas at risk of flooding, they were flooded in 1997 [65].
Figure 5.
AG “Kolejarz” by Nysa Kłodzka River in Pomianów Dolny—flood risk zones map. Source: own elaboration based on OSM (OpenStreetMap), GUGiK, ISOK (Informatic System of National Protection in Poland) data [53,63,64].
Figure 6.
AG “Włókniarz” by the Bystrzyca River in Wrocław—flood risk zones map. Source: own elaboration based on (OpenStreetMap), GUGiK, ISOK (Informatic System of National Protection in Poland) data [53,63,64].
Figure 7.
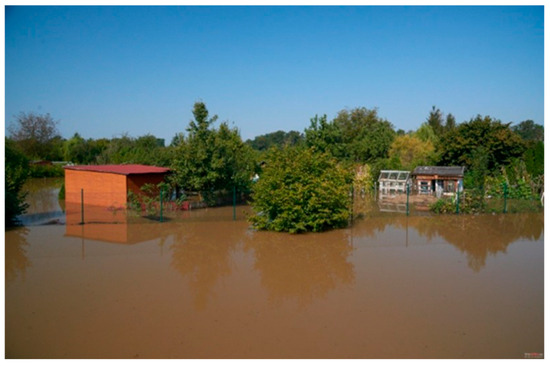
AG “Włókniarz” in Wrocław during the flood in 2024. Source: Fotopolska [66].
Figure 8.
AG “Wrzos” by the Bóbr River in Wleń—flood risk zones map. Source: own elaboration based on OSM (OpenStreetMap), GUGiK, ISOK (Informatic System of National Protection in Poland) data [53,63,64].
Figure 9.
AG “Zacisze” and AG “Piast” in Wrocław—flood risk zones map. Source: own elaboration based on OSM (OpenStreetMap), GUGiK, ISOK (Informatic System of National Protection in Poland) data [53,63,64].
As can be seen in the above data, in some cases, analysis reveals that flood risk is even more severe than simulations suggest. Areas located in the 500-year floodplain have been flooded three times in the last 30 years. There have also been floods in garden plots located outside the designated flood-prone area.
At the level of all analyzed allotment gardens (AG), BCR values are strongly differentiated between individual gardens within the study area (Table 4). The total areas of the allotment gardens are less variable than the total building area on the plots. The mean building coverage ratio for the entire set of AG is 7.85%, and the variability of this indicator is moderate (CV = 0.47). BCR ranges from 0.29% to just over 22%, excluding the single garden for which no data were available. The distribution shows slight positive skewness, as evidenced by the median being lower than the mean. Despite large differences in the sizes of the gardens—they usually range from 2 to over 8 ha, as shown by the interquartile range—the relative share of built-up area in the garden surface is therefore more homogeneous than the garden area.
Table 4.
Basic statistics for the analyzed AG (n = 1082).
Analyzing flood risk zones with probabilities of 0.2%, 1%, and 10%, the results show that the mean BCR values are not particularly high (Table 5). In all cases, BCR within the flood risk zones is lower than both the overall mean BCR (7.85%) and the mean BCR for AG located entirely outside the zones. The difference between the mean values inside and outside the zones is consistently about 1.1–1.3 percentage points, and the largest differences were observed for AG located wholly or partly within the 10% flood risk zone. This may suggest that the spatial arrangement of buildings in AG situated along watercourses differs from that in other locations.
Table 5.
Total Building Coverage Ratio of Allotment Gardens by flood risk zone (0.2%, 1%, 10%) and garden location.
However, it must be taken into account that the flood risk zones overlap (e.g., the 10% zone is nested within the 1% and 0.2% zones), and that some allotment gardens included in the analysis lie only partly within the analyzed zones. To address this, the results were compared with those for AG that, for a given flood risk zone, could be split into two parts: one located inside the zone, and one located outside it (Table 6).
Table 6.
Main descriptive statistics of the BCR index.
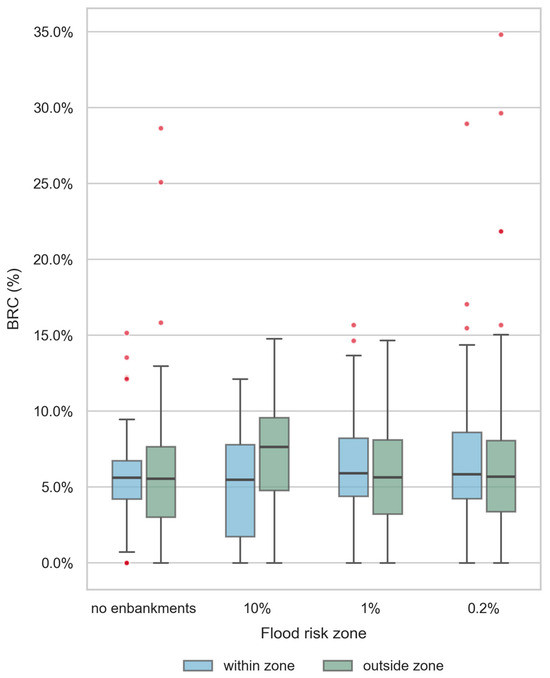
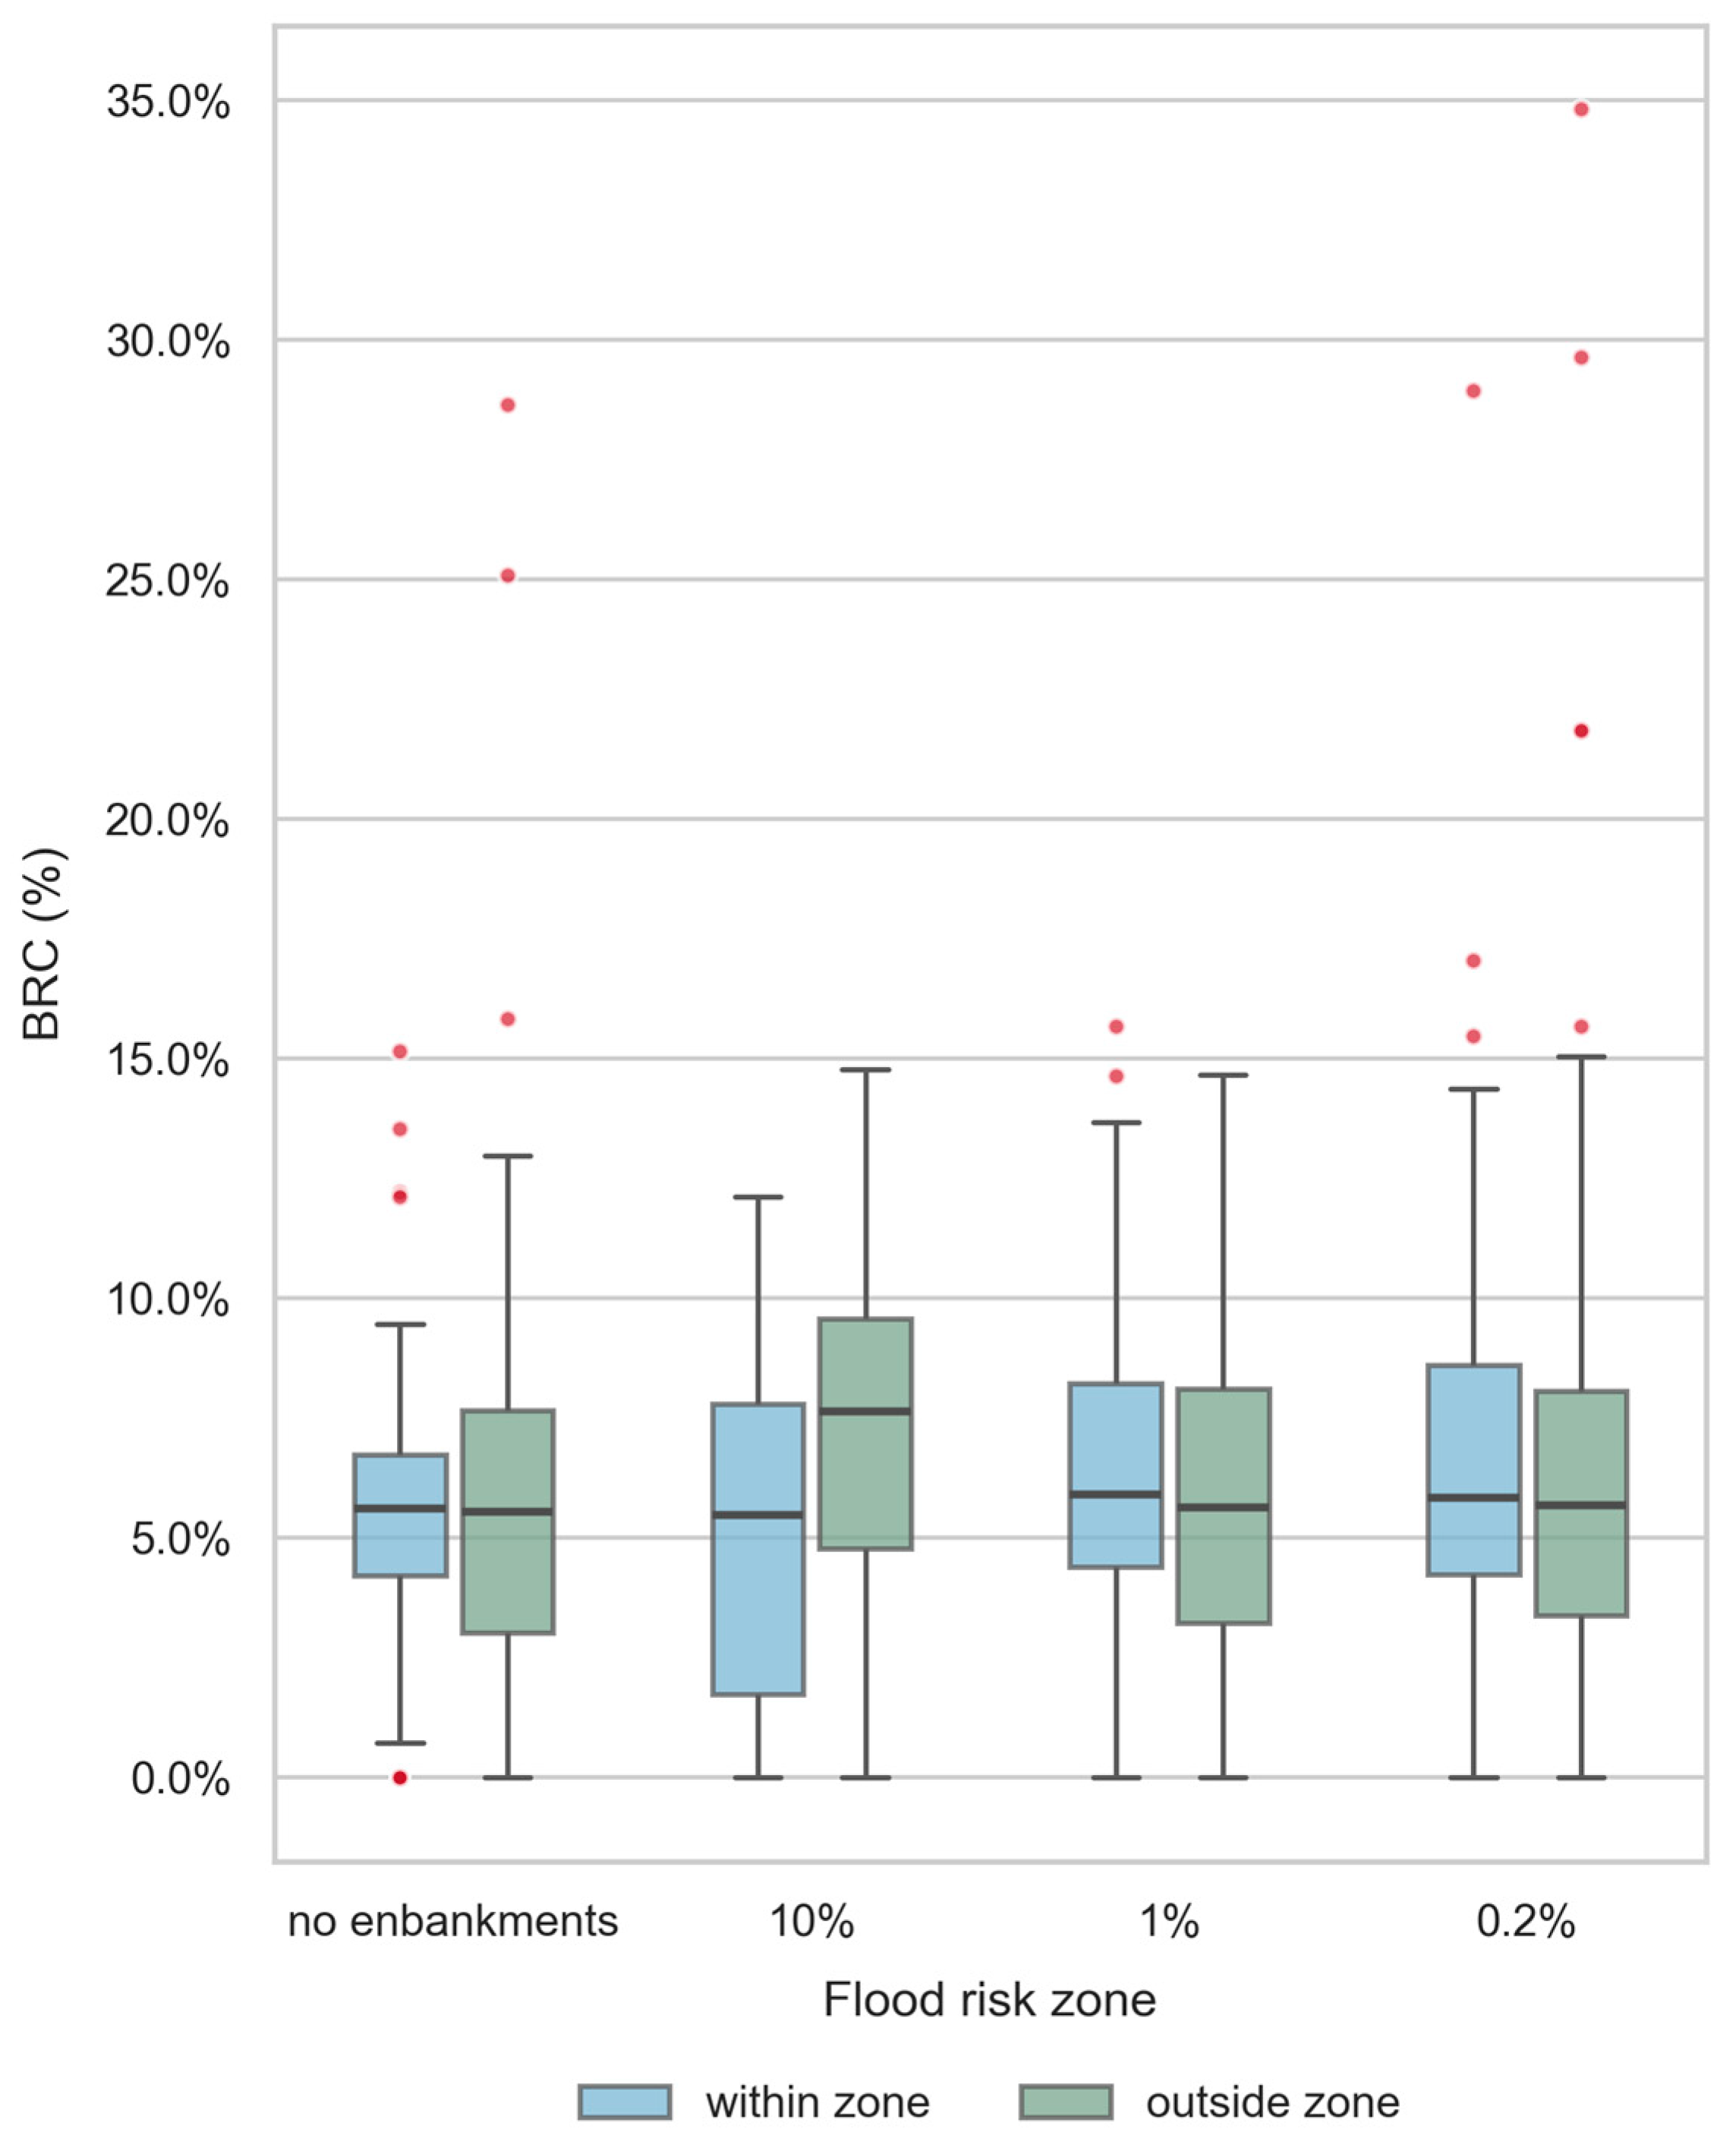
For these AG, the mean and median BCR values inside and outside the zones are very similar. At the level of individual gardens, the BCR shows high variability and marked asymmetry, which can affect conclusions based solely on averages. For areas outside the zones in the scenarios without embankments and for the 500-year flood, the distributions exhibit the highest positive skewness, meaning that a few AG have significantly higher BCR values than the rest. In contrast, the parts of gardens located in the 10-year flood zone show approximately symmetric distributions of building coverage (skewness of 0.08 within and −0.18 outside the zone), indicating no dominant tail of extreme values and a relatively even spread of BCR values across plots. In general, the main difference between the parts inside and outside the zones is the spread of values around the central tendency (Figure 10). In most scenarios, the parts of gardens situated outside the flood risk zones are slightly more variable with respect to BCR. The results of the BCR analysis indicate that, for the 100-year flood risk zones (regardless of whether levee breaching is assumed or not) and for the 500-year flood zones, there is no clear relationship between the percentage of building area located inside the flood risk zone and outside it. The differences in the 10% flood risk zone, although noticeable (higher BCR in 7 out of 25 cases), are not statistically significant, as shown by the Wilcoxon Signed-Rank test (W = 26.0, p = 0.3078; Figure 10). This non-parametric test compares paired observations inside and outside the zone, taking into account both the direction and the magnitude of differences. The result indicates that the share of buildings does not differ significantly between the 10% flood risk zone and the area outside it, which implies that the observed differences are most likely due to random variation and the relatively small number of cases.
Figure 10.
Distribution of BCR in AG partly inside and outside flood risk zones. Source: own elaboration.
Shapiro–Wilk within 10-year flood: W = 0.4049, p = 0.0000; Shapiro–Wilk outside 100-year flood: W = 0.4205, p = 0.0000; Mann–Whitney U: U = 116.5, p = 0.8844.
The comparison between official flood hazard maps and observed flooding in 2024 indicates that several allotment gardens located outside mapped flood zones were nevertheless inundated.
5. Conclusions and Discussion
The study addresses an unexplored topic in the Polish context, as previous research on allotment gardens has rarely considered their exposure to flood risk. The use of GIS and spatial analysis provides objective, replicable evidence regarding the distribution of allotment gardens within flood-prone areas.
The findings can support urban planners, local authorities, and allotment garden managers in identifying and managing flood risk in allotment garden areas. The study contributes to evidence-based planning by highlighting the vulnerability of allotment gardens located in flood-prone zones and by providing insights that can inform climate adaptation strategies, land-use planning, and risk-mitigation measures. It also has important implications for crisis and disaster risk management. The findings can support emergency preparedness, risk assessment, and the development of local flood response strategies, as well as help crisis management agencies prioritize vulnerable areas, improve early warning systems, and enhance the resilience of allotment garden communities to extreme weather events.
Apart from the most important limitations highlighted earlier, it should be noted that the study focuses on spatial exposure and does not assess the consequences of flood events, such as economic losses, damage to infrastructure, or impacts on users. The assessment does not account for future climate change scenarios or changing flood regimes. Thus, future research should examine the integration of allotment gardens into local disaster risk reduction and crisis management frameworks. Particular attention could be paid to emergency preparedness, risk communication, evacuation planning, and the effectiveness of early warning systems among allotment garden users. Future studies may also assess how allotment gardens contribute to urban resilience before, during, and after flood events.
In recent years, floods in Poland have caused enormous damage, also within crucial urban ecosystem allotment gardens. It is therefore necessary to reliably estimate the potential flood risk. The method presented in the paper is applicable especially to allotment gardens where floods caused huge damage. On the basis of the analysis, it is possible to estimate the risk level in particular parts of allotment gardens, which is important in the process of developing an appropriate flood protection policy. The results highlight the substantial risk faced by allotment gardens in the analyzed regions, especially in areas susceptible to 100-year and 500-year floods. Given that nearly 10% of AG are situated within the 500-year flood zone, appropriate flood mitigation measures should be considered to enhance resilience and safeguard these recreational areas from future hydrological hazards. Moreover, spatial planning strategies should integrate flood risk assessments to minimize potential damages and ensure sustainable land use in the affected areas. However, it should also be noted that the flood risk may be even more severe than the simulations analyzed suggest.
The research inspired a multi-aspect discussion on allotment garden flood risk analysis—increasingly needed around the world in the context of climate change. Long-term global climate change increases extreme weather patterns, including flood risk, which is becoming a trend in Europe, facing more frequent extreme hydro-meteorological events. The results of the study contribute to the existing knowledge, but it also fills a gap in the subject literature.
It should also be emphasized that allotment gardens in Poland have diverse origins and locations, and, as shown by these studies, they have relatively high variability in infrastructure development. One might have expected that the level of flood risk, based on users’ knowledge and experience at the time the garden was created, might have influenced how, and to what extent, the garden was developed. However, the analysis did not confirm such a relationship, regardless of the flood risk level based on ISOK data. This suggests that this factor was not taken into account by decision-makers when organizing the allotment garden and dividing the land. As a result, some plot users are exposed to material losses due to the increasing flood risk, related to global warming, whether it is a 10% chance, a 1% chance, or a rapid flood. Allotment areas prone to seasonal flooding are therefore not well suited to fulfill their original functions. Since one of the key roles of allotment gardens is to build the resilience of the local food system, flooding significantly limits this function. With a flood, chemicals and heavy metals can be deposited, leading to long-term soil contamination and restricting its use both for food production and recreational purposes.
The results show that the overlap between flood risk zones and allotment gardens (AG) sites affects, at the maximum extent (the 500-year flood zone), only 9.97% of all analyzed units, with the proportion of AG area located within flood risk zones ranging from 2.74% (10-year flood zone) to 7,83% (500-year flood zone). This is not a substantial share of all objects; however, the problem occurs in many countries, e.g., in Germany [67,68], in the Czech Republic and Slovakia [69], and also in Austria. A distinction should be made here between the different approaches and models of allotment garden use across Europe. This type of land use was commonly developed on sites unattractive for investment, in river valleys, and on degraded land [11]. While in Anglo-Saxon countries such areas are not subject to recreational construction, in Poland and Germany seasonal recreational buildings are widely used, whereas in Austria year-round use is permitted [70].
Using the example of AG sites in Poland, it was shown that their location in river valleys, even outside the formally designated flood risk zone, does not mean they are entirely safe. Every model is a representation of the real world burdened with uncertainty, resulting from model generalization and from processes that are either not accounted for or are stochastic in nature, such as climate change. This is not an isolated case in the literature. For example, the official flood hazard map available in July 2021 for the extreme scenario (HQextreme) significantly underestimated the flood extent in the Ahr Valley, Germany. The forecast published 24 h before the disaster predicted a maximum water depth of 5.74 m at the Altenahr gauge—the actual level reached 10.2 m [71]. As many as 75% of the fatalities from this flood occurred outside the area formally designated as flood-prone [71]. A similar problem of systematic underestimation in hazard mapping has also been confirmed at the pan-European scale [72]. Every such case should serve as source material for improving the modeling of this phenomenon in the future.
From a planning perspective, an interesting issue is the analysis of AG land development in the context of flood risk. Based on the obtained results, it appears that the level of development within AG flood-risk areas, represented as BCR, is lower for each flood risk zone than outside these zones. This could indicate that regulations restricting construction in flood-prone areas—as in the case of private plot owners in the Q100 zone in Pilsen [73] or the risk-adapted land-use approach implemented in Germany following the 2002 flood [74]— have an effect on the current state of investment in recreational plots. However, these results should be interpreted with caution. First, this is a subset of such objects in Poland, located in the south-western part of the country, so the results may not be representative of the entire population of AG sites. In addition, the risk zones overlap one another, which makes it difficult to determine to what extent the level of flood risk affects BCR. Furthermore, AGs have been established since the 19th century, and the origins of their formation, local conditions, planning decisions, and legal regulations may have introduced a level of bias into the assessment of the effect of flood risk on the level of BCR for AGs. This is certainly an issue worth further investigation.
Also at the micro scale, within a single allotment garden where part of the area lies within a flood risk zone, and part lies outside it, no clear difference in the level of BCR is observed, even for the 10-year flood hazard zone. It could have been assumed that even if knowledge from flood risk maps was not available at the time decisions were made on siting AG locations, decision-makers might have relied on local conditions and historical memory of floods and high river levels. The study did not confirm this. On the contrary, it appears that the decisions made did not take this factor into account in planning decisions, consequently contributing to higher potential material losses at present in the event of a flood.
Attention should also be paid to the influence of uncertainty on the obtained research results. The analysis is based on the overlay of spatial layers, each of which (flood risk modeling, building delineation from LiDAR data, and AG data obtained from OpenStreetMap) carries a certain systematic error. This represents a methodological limitation. However, in the authors’ opinion, this does not significantly affect the conclusions regarding flood risk assessment in allotment garden areas.
Author Contributions
Conceptualization, M.J. and J.M.-G.; methodology, M.J. and Ł.L.; validation, Ł.L. and J.M.-G.; formal analysis, M.J., Ł.L., and J.M.-G.; writing—original draft preparation, J.M.-G.; writing—review and editing, J.M.-G.; visualization, M.J. and Ł.L.; project administration, J.M.-G. All authors have read and agreed to the published version of the manuscript.
Funding
This research received no external funding.
Institutional Review Board Statement
Not applicable.
Informed Consent Statement
Not applicable.
Data Availability Statement
All data used in this study were obtained from publicly available open-access sources. The datasets were provided by Polish government institutions and OpenStreetMap (OSM). No proprietary or restricted-access datasets were used in the study.
Acknowledgments
The authors would like to extend their sincere appreciation to Mateusz Kowalczyk, a third-year bachelor’s student of the Faculty of Geographical Sciences, University of Łódz, Geoinformation course, for his invaluable technical assistance in the research process. His support played a significant role in collecting and elaborating data from allotment gardens used in the paper.
Conflicts of Interest
The authors declare no conflicts of interest.
References
- Rusanov, A.V. Dacha Dwellers and Gardeners: Garden Plots and Second Homes in Europe and Russia. Popul. Econ. 2019, 3, 107–124. [Google Scholar] [CrossRef] [Scilit]
- Tomatis, F.; Egerer, M.; Correa-Guimaraes, A.; Navas-Gracia, L.M. Urban Gardening in a Changing Climate: A Review of Effects, Responses and Adaptation Capacities for Cities. Agriculture 2023, 13, 502. [Google Scholar] [CrossRef] [Scilit]
- Burgin, S. Sustainability as a Motive for Leisure-Time Gardening: A View from the ‘Veggie Patch’. Int. J. Environ. Stud. 2018, 75, 1000–1010. [Google Scholar] [CrossRef] [Scilit]
- Auželienė, I.; Daubaras, L.; Eidimtienė, V.V. Urban Gardening: Elements, Social, Cultural and Recreational Aspects. Maz. Stud. Reg. 2016, 18, 35–47. [Google Scholar] [CrossRef] [Scilit]
- Fritsche, M.; Klamt, M.; Rosol, M.; Schulz, M. Social Dimensions of Urban Restructuring: Urban Gardening, Residents’ Participation, Gardening Exhibitions. In Perspectives in Urban Ecology; Endlicher, W., Ed.; Springer: Berlin/Heidelberg, Germany, 2011; pp. 261–295. ISBN 978-3-642-17730-9. [Google Scholar]
- Drescher, A.W.; Holmer, R.J.; Iaquinta, D.L. Urban Homegardens and Allotment Gardens for Sustainable Livelihoods: Management Strategies and Institutional Environments. In Tropical Homegardens; Kumar, B.M., Nair, P.K.R., Eds.; Advances in Agroforestry; Springer: Dordrecht, The Netherlands, 2006; Volume 3, pp. 317–338. ISBN 978-1-4020-4947-7. [Google Scholar]
- Szkup, R.; Pytel, S. Rodzinne Ogrody Działkowe (ROD) w Przestrzeni Dużego Miasta. Przykład Łodzi. Rodz. Ogrody Działk. (ROD) Przestrz. Dużego Miasta Przykład Łodzi 2016, 32, 109–124. [Google Scholar]
- Dymek, D.; Bednorz, L. Zagospodarowanie Rodzinnych Ogrodów Działkowych (ROD) Na Przykładzie ROD Im. Józefa Chociszewskiego w Poznaniu. Stud. Miej. 2017, 25, 133–147. [Google Scholar] [CrossRef] [Scilit]
- Vejre, H.; Eiter, S.; Hernández-Jiménez, V.; Lohrberg, F.; Loupa-Ra, I.; Recasens, X.; Pickard, D.; Scazzosi, L.; Simon-Rojo, M. Can Agriculture Be Urban? In Urban Agriculture Europe; Lohrberg, F., Lička, L., Scazzosi, L., Timpe, A., Eds.; Jovis Verlag: Berlin, Germany, 2016; pp. 18–25. [Google Scholar]
- Szczurek, M.; Zych, M. (Eds.) Dzieło—Działka; Muzeum Etnograficzne im. Seweryna Udzieli: Kraków, Poland, 2012; ISBN 978-83-61369-17-2. [Google Scholar]
- Duś, E. Miejsce i Rola Ogrodów Działkowych w Przestrzeni Miejskiej. Geogr. Stud. Diss. 2011, 33, 79–100. [Google Scholar]
- Wolaniuk, A. Ogrody Działkowe Łodzi Jako Teren Wypoczynku Mieszkańców Miasta. Turyzm 1991, 1, 31–53. [Google Scholar] [CrossRef] [Scilit]
- Szczepańska, M.; Kacprzak, E.; Maćkiewicz, B.; Poniży, L. How Are Allotment Gardens Managed? A Comparative Study of Usage and Development in Contemporary Urban Space in Germany and Poland. Morav. Geogr. Rep. 2021, 29, 231–250. [Google Scholar] [CrossRef] [Scilit]
- Polish Allotment Association Dataset. Available online: http://pzd.pl/archiwum/strona.php?31 (accessed on 24 February 2025).
- Trembecka, A.; Kwartnik-Pruc, A. An Analysis of the Changes in the Structure of Allotment Gardens in Poland and of the Process of Regulating Legal Status. Sustainability 2018, 10, 3829. [Google Scholar] [CrossRef] [Scilit]
- Chiesura, A. The Role of Urban Parks for the Sustainable City. Landsc. Urban Plan. 2004, 68, 129–138. [Google Scholar] [CrossRef] [Scilit]
- Crouch, D.; Ward, C. The Allotment. Its Landscape and Culture; Five Lives Publication: Nottingham, UK, 1999. [Google Scholar]
- Duś, E. Allotment Gardens and Spatial Development—Two Case Studies from the Katowice Conurbation, Poland. Environ. Socio-Econ. Stud. 2013, 1, 41–51. [Google Scholar] [CrossRef] [Scilit]
- Kołosowska, A. Uwarunkowania i Perspektywy Przemian Przestrzeni Miejskiej Związanych z Likwidacją Rodzinnych Ogrodów Działkowych—Studium Przypadku Szczecina. Stud. Ind. Geogr. Comm. Pol. Geogr. Soc. 2022, 36, 43–54. [Google Scholar] [CrossRef] [Scilit]
- Mokras-Grabowska, J. Allotment Gardening in Poland—New Practices and Changes in Recreational Space. Misc. Geogr. 2020, 24, 245–252. [Google Scholar] [CrossRef] [Scilit]
- Spilková, J.; Vágner, J. The Loss of Land Devoted to Allotment Gardening: The Context of the Contrasting Pressures of Urban Planning, Public and Private Interests in Prague, Czechia. Land Use Policy 2016, 52, 232–239. [Google Scholar] [CrossRef] [Scilit]
- Gawryszewska, B.J.; Myszka-Stąpór, I. Ogrody Towarzyszące Zamieszkiwaniu w Procesach Rewitalizacji i Redefiniowaniu Przestrzeni Miejskich. Pr. Kom. Kraj. Kult. 2016, 71–82. [Google Scholar]
- Poniży, L.; Latkowska, M.J.; Breuste, J.; Hursthouse, A.; Joimel, S.; Külvik, M.; Leitão, T.E.; Mizgajski, A.; Voigt, A.; Kacprzak, E.; et al. The Rich Diversity of Urban Allotment Gardens in Europe: Contemporary Trends in the Context of Historical, Socio-Economic and Legal Conditions. Sustainability 2021, 13, 11076. [Google Scholar] [CrossRef] [Scilit]
- Poniży, L.; Stachura, K. Future of Allotment Gardens in the Context of City Spatial Policy—A Case Study of Poznań. Quaest. Geogr. 2017, 36, 121–127. [Google Scholar] [CrossRef] [Scilit]
- Barthel, S.; Parker, J.; Ernstson, H. Food and Green Space in Cities: A Resilience Lens on Gardens and Urban Environmental Movements. Urban Stud. 2015, 52, 1321–1338. [Google Scholar] [CrossRef] [Scilit]
- Lovell, R.; Husk, K.; Bethel, A.; Garside, R. What Are the Health and Well-Being Impacts of Community Gardening for Adults and Children: A Mixed Method Systematic Review Protocol. Environ. Evid. 2014, 3, 20. [Google Scholar] [CrossRef] [Scilit]
- Pawlikowska-Piechotka, A. Ogrody Działkowe w Rozwoju Zrównoważonym Współczesnego Miasta. Probl. Ekol. 2009, 13, 106–111. [Google Scholar]
- Kowalewski, Z. Powodzie w Polsce—Rodzaje, Występowanie Oraz System Ochrony Przed Ich Skutkami. Woda-Sr.-Obsz. Wiej. 2006, 6, 207–220. [Google Scholar]
- Borowska-Stefańska, M. Ocena Strat Materialnych Na Terenach Zagrożonych Powodziami w Małych Miastach Województwa Łódzkiego. Space Soc. Econom. 2016, 16, 7–27. [Google Scholar] [CrossRef] [Scilit][Green Version]
- Merz, B.; Thieken, A. Flood Risk Analysis: Concepts and Challenges. Osterr. Wasser Abfallwirtsch. 2004, 56, 27–34. [Google Scholar]
- McClymont, K.; Morrison, D.; Beevers, L.; Carmen, E. Flood Resilience: A Systematic Review. J. Environ. Plan. Manag. 2019, 63, 1151–1176. [Google Scholar] [CrossRef] [Scilit]
- Wang, L.; Cui, S.; Li, Y.; Huang, H.; Manandhar, B.; Nitivattananon, V.; Fang, X.; Huang, W. A Review of the Flood Management: From Flood Control to Flood Resilience. Heliyon 2022, 8, e11763. [Google Scholar] [CrossRef] [Scilit] [PubMed]
- Borowska-Stefańska, M. Zagospodarowanie Terenów Zagrożonych Powodziami w Wybranych Miastach Województwa Łódzkiego. Pr. Geogr. 2015, 140, 57–77. [Google Scholar] [CrossRef]
- Głosińska, E. Zastosowanie GIS w Szacowaniu Potencjalnych Strat Powodziowych w Kontekście Zagospodarowania Obszarów Zalewowych Na Przykładzie Miast Województwa Zachodniopomorskiego. Rocz. Geomatyki 2013, 13, 25–41. [Google Scholar]
- Muhadi, N.A.; Abdullah, A.F.; Bejo, S.K.; Mahadi, M.R.; Mijic, A. The Use of LiDAR-Derived DEM in Flood Applications: A Review. Remote Sens. 2020, 12, 2308. [Google Scholar] [CrossRef] [Scilit]
- Bodoque, J.M.; Aroca-Jiménez, E.; Eguibar, M.Á.; García, J.A. Developing Reliable Urban Flood Hazard Mapping from LiDAR Data. J. Hydrol. 2023, 617, 128975. [Google Scholar] [CrossRef] [Scilit]
- Costabile, P.; Macchione, F.; Natale, L.; Petaccia, G. Flood Mapping Using LIDAR DEM. Limitations of the 1-D Modeling Highlighted by the 2-D Approach. Nat. Hazards 2015, 77, 181–204. [Google Scholar] [CrossRef] [Scilit]
- Lee, S.-J.; Han, Y.-S.; Kim, J.-S.; Yun, H.-S. High-Resolution Flood Risk Assessment in Small Streams Using DSM–DEM Integration and Airborne LiDAR Data. Sustainability 2025, 17, 9616. [Google Scholar] [CrossRef] [Scilit]
- Shen, D.; Wang, J.; Cheng, X.; Rui, Y.; Ye, S. Integration of 2-D Hydraulic Model and High-Resolution Lidar-Derived DEM for Floodplain Flow Modeling. Hydrol. Earth Syst. Sci. 2015, 19, 3605–3616. [Google Scholar] [CrossRef] [Scilit]
- Feng, Y.; Xiao, Q.; Brenner, C.; Peche, A.; Yang, J.; Feuerhake, U.; Sester, M. Determination of Building Flood Risk Maps from LiDAR Mobile Mapping Data. Comput. Environ. Urban Syst. 2022, 93, 101759. [Google Scholar] [CrossRef] [Scilit]
- Casas, A.; Riaño, D.; Greenberg, J.; Ustin, S. Assessing Levee Stability with Geometric Parameters Derived from Airborne LiDAR. Remote Sens. Environ. 2012, 117, 281–288. [Google Scholar] [CrossRef] [Scilit]
- Bakuła, K.; Pilarska, M.; Salach, A.; Kurczyński, Z. Detection of Levee Damage Based on UAS Data—Optical Imagery and LiDAR Point Clouds. ISPRS Int. J. Geo-Inf. 2020, 9, 248. [Google Scholar] [CrossRef] [Scilit]
- Bodoque, J.; Guardiola-Albert, C.; Aroca-Jiménez, E.; Eguibar, M.; Martínez-Chenoll, M. Flood Damage Analysis: First Floor Elevation Uncertainty Resulting from LiDAR-Derived Digital Surface Models. Remote Sens. 2016, 8, 604. [Google Scholar] [CrossRef] [Scilit]
- Haselbach, L.; Adesina, M.; Muppavarapu, N.; Wu, X. Spatially Estimating Flooding Depths from Damage Reports. Nat. Hazards 2023, 117, 1633–1645. [Google Scholar] [CrossRef] [Scilit]
- Cian, F.; Marconcini, M.; Ceccato, P.; Giupponi, C. Flood Depth Estimation by Means of High-Resolution SAR Images and LiDAR Data. Nat. Hazards Earth Syst. Sci. 2018, 18, 3063–3084. [Google Scholar] [CrossRef] [Scilit]
- Malinverni, E.S.; Di Stefano, F.; Chiappini, S.; Darvini, G.; Fronzi, D.; Pierdicca, R.; Tazioli, A. LiDAR-Driven Topographic Surveys for Floodplain Management. Int. Arch. Photogramm. Remote Sens. Spat. Inf. Sci. 2025, XLVIII-G-2025, 1035–1042. [Google Scholar] [CrossRef] [Scilit]
- Trepekli, K.; Balstrøm, T.; Friborg, T.; Fog, B.; Allotey, A.N.; Kofie, R.Y.; Møller-Jensen, L. UAV-Borne, LiDAR-Based Elevation Modelling: A Method for Improving Local-Scale Urban Flood Risk Assessment. Nat. Hazards 2022, 113, 423–451. [Google Scholar] [CrossRef] [Scilit]
- Su, S.; Nakano, K.; Wakabayashi, K. Building Detection from Aerial LiDAR Point Cloud Using Deep Learning. Int. Arch. Photogramm. Remote Sens. Spat. Inf. Sci. 2022, XLIII-B2-2022, 291–296. [Google Scholar] [CrossRef] [Scilit]
- Awrangjeb, M.; Siddiqui, F.U. A New Mask for Automatic Building Detection from High Densitypoint Cloud Data and Multispectral Imagery. ISPRS Ann. Photogramm. Remote Sens. Spat. Inf. Sci. 2017, IV-4/W4, 89–96. [Google Scholar] [CrossRef] [Scilit]
- Zhang, K.; Yan, J.; Chen, S.-C. Automatic Construction of Building Footprints from Airborne LIDAR Data. IEEE Trans. Geosci. Remote Sens. 2006, 44, 2523–2533. [Google Scholar] [CrossRef] [Scilit]
- Awrangjeb, M.; Lu, G.; Fraser, C. Automatic Building Extraction from LIDAR Data Covering Complex Urban Scenes. Int. Arch. Photogramm. Remote Sens. Spat. Inf. Sci. 2014, XL-3, 25–32. [Google Scholar] [CrossRef] [Scilit]
- Messner, F.; Meyer, V. Flood Damage, Vulnerability and Risk Perception—Challenges for Flood Damage Research. In Proceedings of the Flood Risk Management: Hazards, Vulnerability and Mitigation Measures; Schanze, J., Zeman, E., Marsalek, J., Eds.; Springer: Dordrecht, The Netherlands, 2006; pp. 149–167. [Google Scholar]
- Head Office of Geodesy and Cartography in Poland (GUGiK). Available online: https://www.geoportal.gov.pl/ (accessed on 22 May 2025).
- Bartnik, A.; Jokiel, P. Geografia Wezbrań i Powodzi Rzecznych; Wydawnictwo Uniwersytetu Łódzkiego: Łódź, Poland, 2012; ISBN 978-83-7525-716-8. [Google Scholar]
- Łach, J. Rola Gwałtownych Ulew i Powodzi w Modelowaniu Rzeźby Kotliny Kłodzkiej Oraz Zachodnich Pasm Górskich Sudetów Wschodnich; Instytut Geografi i i Rozwoju Regionalnego Uniwersytetu Wrocławskiego: Wrocław, Poland, 2012. [Google Scholar]
- Państwowe Gospodarstwo Wodne Wody Polskie; Krajowy Zarząd Gospodarki Wodnej. Aktualizacja Metodyki Obliczania Przepływów i Opadów Maksymalnych o Określonym Prawdopodobieństwie Przewyższenia dla Zlewni Kontrolowanych i Niekontrolowanych oraz Identyfikacji Modeli Transformacji Opadu w Odpływ; Metodyka Opracowania Map Zagrożenia Powodziowego i Map Ryzyka Powodziowego w II Cyklu Planistycznym; Państwowe Gospodarstwo Wodne Wody Polskie (Krajowy Zarząd Gospodarki Wodnej): Warszawa, Poland, 2020. [Google Scholar]
- Central Statistical Office (CSO). Bank Danych Lokalnych: Rodzinne Ogrody Działkowe. Available online: https://bdl.stat.gov.pl/bdl/metadane/podgrupy/219 (accessed on 16 August 2026).
- Haklay, M.; Weber, P. OpenStreetMap: User-Generated Street Maps. IEEE Pervasive Comput. 2008, 7, 12–18. [Google Scholar] [CrossRef] [Scilit]
- Wiki. Available online: https://wiki.openstreetmap.org/ (accessed on 16 August 2026).
- LiDAR Data Sheets Available for Download. Available online: https://mapy.geoportal.gov.pl/imap/Imgp_2.html?gpmap=gp0 (accessed on 10 May 2026).
- Kulawiak, M. A Cost-Effective Method for Reconstructing City-Building 3D Models from Sparse LiDAR Point Clouds. Remote Sens. 2022, 14, 1278. [Google Scholar] [CrossRef] [Scilit]
- Gribov, A. Optimal Compression of a Polyline While Aligning to Preferred Directions. In Proceedings of the 2019 International Conference on Document Analysis and Recognition Workshops (ICDARW); IEEE: Sydney, Australia, 2019; pp. 98–102. [Google Scholar]
- OpenStreetMap (OSM). Available online: https://www.openstreetmap.org (accessed on 9 May 2025).
- Informatic System of National Protection in Poland. Available online: https://isok.gov.pl/index.html (accessed on 9 May 2025).
- Miasto Wrocław. Available online: https://www.wroclaw.pl (accessed on 22 May 2025).
- Fotopolska EU. Available online: https://fotopolska.eu/ (accessed on 22 February 2024).
- Cabral, I.; Keim, J.; Engelmann, R.; Kraemer, R.; Siebert, J.; Bonn, A. Ecosystem Services of Allotment and Community Gardens: A Leipzig, Germany Case Study. Urban For. Urban Green. 2017, 23, 44–53. [Google Scholar] [CrossRef] [Scilit]
- Haase, D.; Wolff, M.D. Connecting Urban Nature: Allotment Gardens’ Transition Potential to the Connectivity of Natura 2000 Areas 2025. Available online: https://papers.ssrn.com/sol3/papers.cfm?abstract_id=5526731 (accessed on 15 September 2026).
- Tóth, A.; Duží, B.; Vávra, J.; Supuka, J.; Bihuňová, M.; Halajová, D.; Martinát, S.; Nováková, E. Changing Patterns of Allotment Gardening in the Czech Republic and Slovakia. Nat. Cult. 2018, 13, 161–188. [Google Scholar] [CrossRef] [Scilit]
- Lorbek, M.; Martinsen, M. Allotment Garden Dwellings: Exploring Tradition and Legal Framework. Urbani Izziv 2015, 26, S98–S113. [Google Scholar] [CrossRef] [Scilit]
- Rhein, B.; Kreibich, H. Causes of the Exceptionally High Number of Fatalities in the Ahr Valley, Germany, during the 2021 Flood. Nat. Hazards Earth Syst. Sci. 2025, 25, 581–589. [Google Scholar] [CrossRef] [Scilit]
- Dottori, F.; Alfieri, L.; Bianchi, A.; Skoien, J.; Salamon, P. A New Dataset of River Flood Hazard Maps for Europe and the Mediterranean Basin. Earth Syst. Sci. Data 2022, 14, 1549–1569. [Google Scholar] [CrossRef] [Scilit]
- Macháč, J.; Louda, J. Urban Wetlands Restoration in Floodplains: A Case of the City of Pilsen, Czech Republic. In Nature-Based Flood Risk Management on Private Land; Hartmann, T., Slavíková, L., McCarthy, S., Eds.; Springer International Publishing: Cham, Switzerland, 2019; pp. 111–126. ISBN 978-3-030-23841-4. [Google Scholar]
- Petrow, T.; Thieken, A.H.; Kreibich, H.; Merz, B.; Bahlburg, C.H. Improvements on Flood Alleviation in Germany: Lessons Learned from the Elbe Flood in August 2002. Environ. Manag. 2006, 38, 717–732. [Google Scholar] [CrossRef] [Scilit] [PubMed]

Disclaimer/Publisher’s Note: The statements, opinions and data contained in all publications are solely those of the individual author(s) and contributor(s) and not of MDPI and/or the editor(s). MDPI and/or the editor(s) disclaim responsibility for any injury to people or property resulting from any ideas, methods, instructions or products referred to in the content. |
© 2026 by the authors. Licensee MDPI, Basel, Switzerland. This article is an open access article distributed under the terms and conditions of the Creative Commons Attribution (CC BY) license.