


Abstract
Microforests (also called mini forests or tiny forests) are increasingly recognized as a promising nature-based solution for mitigating urban challenges such as flooding, biodiversity loss, air pollution, and the heat island effect. Despite their rapid global adoption, practitioners have limited access to practical, evidence-based guidance for planning, implementing, and monitoring these projects. This article presents an adaptable framework for community-based microforest establishment and long-term monitoring based on lessons learned from two contrasting case studies in the northeastern United States: a demonstration microforest at the New York State Department of Environmental Conservation’s Five Rivers Environmental Education Center and a series of urban microforests established by Groundwork Elizabeth in New Jersey. We describe practical approaches to site selection, soil assessment and preparation, native species selection, volunteer engagement, planting, and maintenance that can be adapted to diverse environmental and social contexts. We also introduce a standardized yet flexible monitoring framework encompassing five complementary components: forest development, soil recovery, biodiversity recovery, microclimate regulation, and community stewardship. The framework incorporates monitoring methods ranging from accessible citizen science protocols to more advanced ecological techniques, enabling organizations with varying levels of technical capacity to document ecological change and compare outcomes across projects. Rather than prescribing a single implementation model, we provide communities, nonprofit organizations, government agencies, and researchers with practical guidance to establish, evaluate, and adapt microforests while promoting standardized monitoring, long-term stewardship, and evidence-based urban ecological restoration.
1. Introduction
Cities worldwide are increasingly turning to nature-based solutions to address the ecological and social challenges accompanying urbanization, including flooding [1], poor air quality [2], the heat island effect [3], and biodiversity loss [4]. Among these approaches, microforests—small, densely planted native forests inspired by the Miyawaki Method—have emerged as a promising form of urban green infrastructure capable of rapidly restoring ecological function while strengthening community connections with nature. Requiring as little area as two parking spaces in size, microforests can be established in vacant lots, underutilized lawns, schoolyards, parks, and other overlooked urban spaces. By transforming these small parcels into diverse native forests, microforests can create ecological refuges even in the most densely developed communities.
Developed in the 1970s by Japanese botanist Akira Miyawaki, the Miyawaki Method represents a distinctive approach to forest restoration that involves the dense planting of diverse assemblages of native tree species [5,6,7]. The method is intended to accelerate forest development in degraded landscapes, potentially enabling the establishment of mature forest communities within decades rather than centuries. The Miyawaki Method prioritizes quickly returning ecological function to an area as opposed to focusing on timber production or aesthetics, as in traditional forestry [8]. Elements of the method include (1) Site preparation using organic amendments, ideally sourced from nearby forests combined with additional organic matter, to improve soil conditions. (2) Only planting native species (ideally as potted seedlings) that would naturally occur in that area without human intervention. (3) Planting a multi-layered structure all at once: shrub, understory, sub-canopy and canopy trees as a means to accelerate succession. (4) Planting seedlings densely (typically 2–5 per square meter). This high planting density intensifies competition for sunlight, promoting rapid vertical growth as trees allocate resources toward height rather than lateral growth [6,7,8,9]. Microforests inspired by the Miyawaki Method reportedly grow faster than conventional forests, with trees capable of reaching growth rates of approximately 1 m (3 ft) per year [7]. As a result, the ecological benefits of microforests may emerge within the first few years following establishment [10].
Originally developed to restore Japan’s temperate and subtropical forests and later applied to tropical forests throughout Southeast Asia [9], Miyawaki forests have recently inspired a global movement to establish microforests in urban areas as a means of rapidly restoring ecological function [5,11] and strengthening community connections with nature. They have emerged as a promising component of the “Urban Oasis” concept [12], which places ecological processes, biodiversity, and community engagement at the center of urban planning [13]. Despite their growing popularity, practitioners have limited access to evidence-based guidance for planning, implementing, and monitoring these projects [5,11].
The purpose of this paper is to provide communities with practical guidance for designing, planting, and monitoring microforests based on lessons learned from two case studies in the northeastern United States: a demonstration microforest at Five Rivers Environmental Education Center in Delmar, New York, and a series of microforests established by Groundwork Elizabeth in Elizabeth, New Jersey. These plantings are also referred to as “tiny forests” [8], “pocket forests” [14], and “mini forests” [7]. Although many microforests are inspired by the Miyawaki Method, we avoid referring to all such projects as “Miyawaki Forests” because many projects do not meet all criteria associated with the Miyawaki Method, including the specified planting density and the suspension of active management a few years after establishment [9].
Although microforest planting has gained popularity in recent years, empirical evidence supporting widely cited claims of rapid growth, accelerated succession, and enhanced recovery of ecological function remains limited [11]. Questions also remain regarding the performance of microforests relative to conventional afforestation approaches that have been more extensively implemented and evaluated in urban forestry projects [15,16]. Assessments of managed or created urban forests vary considerably in spatial scale, methods of design and installation, and focal metrics, often resulting in conflicting conclusions regarding biodiversity patterns in urban environments [16,17,18]. Although these urban forests provide well-documented ecosystem services [19], a critical uncertainty remains regarding whether urban trees will survive and mature sufficiently to deliver the full suite of ecological benefits associated with established forests [15]. This uncertainty is particularly relevant for microforests, as few documented examples have publicly shared long-term data on tree growth, survival, and associated ecosystem functions.
1.1. Benefits of Microforests in Urban Communities
Urbanization has intensified environmental challenges with significant consequences for human health and ecological integrity. Urban environments are increasingly experiencing severe heat island effects which elevate local maximum and minimum temperatures [20] while increasing energy consumption and worsening air pollution [21]. Cities are well established as greenhouse gas emission hotspots, driven by concentrated energy use, transportation, buildings, and industry in dense settings [22,23]. Beyond direct sequestration by urban trees, urban green infrastructure provides climate benefits through increasing carbon uptake in vegetation and soils and enhancing cooling and air quality, which can influence energy demand and emissions indirectly [24]. Additionally, green infrastructure can catalyze behavioral changes that favor connecting with nature through activities such as walking rather than relying on private vehicles, simultaneously benefiting mental health and lowering emissions [25].
As urban green spaces, microforests have the potential to help improve air quality, enhance biodiversity, manage stormwater runoff, and reduce flood risks [23,24,25,26,27,28]. Trees and vegetation established through microforest plantings increase soil infiltration and water retention capacity, thereby improving hydrologic function [10,28,29]. In addition, these green spaces can lower ambient temperatures, providing critical relief during extreme heat events and further demonstrating the multifunctional benefits of urban forests [21]. Microforests promote the restoration of native flora and fauna within densely populated areas and help to reestablish complex ecological interactions [30,31]. These types of targeted biodiversity enhancement efforts can generate positive ecological and social outcomes that benefit both people and wildlife [32,33]. By measuring the benefits they provide, communities may be able to more strongly advocate for urban planning and policy initiatives that support microforests.
1.2. The Importance of Community Connection with Microforests
Beyond ecological restoration, microforests and other forms of green spaces address important social dimensions by strengthening connections between communities and their local environments [10,34]. Community participation in the planning, planting, and stewardship of microforests not only improves environmental quality but also cultivates environmental stewardship and facilitates meaningful interactions with nature [35]. Active involvement in these projects can foster a sense of ownership, pride, and long-term commitment among participants.
The global popularity of microforests has increased dramatically over the past five years. This rapid expansion has been driven by the perceived environmental benefits of microforests and supported by a growing number of organizations dedicated to their implementation. At the time of writing, SuGi has planted 263 microforests in 62 cities worldwide, Earthwatch Europe has established more than 250 “Tiny Forests” across the United Kingdom, and organizations in India—including Afforestt, Forest Creators, and Plant Earth Foundation—as well as corporations such as Titan Company, have supported the creation of hundreds, if not thousands, of microforests. Although many of these organizations actively engage communities throughout the planning, planting, monitoring, and maintenance process, hiring a company or organization is not necessary to establish a microforest. One of the defining strengths of microforests as a restoration approach is their accessibility and capacity for community participation [7]. This critical component may be diminished when projects are fully outsourced. In contrast, grassroots organization and implementation can promote community empowerment, environmental education, and long-term investment in local ecosystems.
Narraway et al. [36] emphasize that early community engagement in tree planting initiatives supports long-term maintenance, addresses inequities in ecosystem service distribution, promotes pro-environmental behavior, strengthens social cohesion, and creates spaces that reflect community priorities. In urban planning, community engagement is often limited to consultation or partnership rather than meaningful participation in decision-making and implementation [37,38,39]. When excluded from these processes, residents may feel marginalized and disconnected from planning efforts. Conversely, participation in community-driven and democratically organized projects can increase trust between residents and planners [38]. Furthermore, greening initiatives that lack local support may become burdens rather than benefits, underscoring the importance of meaningful community participation in the design of nature-based solutions, green infrastructure, and urban forests such as microforests [40,41].
1.3. Statement of Need
A growing number of online resources provide general and non-specific guidance on planning, designing, and planting microforests. However, based on our experiences and conversations with practitioners implementing microforests across the United States, successful projects require approaches that are tailored to local environmental conditions, community priorities, and available financial and organizational resources. There is no single blueprint for establishing a successful microforest; rather, implementation requires adapting core principles to site-specific ecological, logistical, and social contexts.
To address this need, we draw upon two case studies from the northeastern United States to develop an adaptable implementation framework for community-based microforests. We present site-specific approaches to planning and preparation from our projects in New York and New Jersey, followed by broadly applicable recommendations for planting, stewardship, and long-term monitoring. Although the two projects share the same overarching framework, they required different solutions to challenges including soil contamination in New Jersey and extensive deer browsing in New York. Because microforests in both areas are less than six years old, recommendations presented here represent an adaptive framework informed by current observations, scientific evidence, and lessons learned rather than a prescriptive protocol. Continued monitoring will be essential for evaluating long-term ecological outcomes and refining best practices.
While practical guidance for establishing microforests has become increasingly documented [42,43], resources describing how to evaluate their long-term performance remain limited. As Morales et al. [11] note, evidence-based methods are essential for successful ecosystem restoration, yet empirical support for many widely cited claims associated with the Miyawaki Method remains sparse. Organizations such as Earthwatch have developed valuable citizen science resources that engage communities through accessible monitoring activities of “tiny forests” including pollinator and ground-dwelling arthropod surveys, tree carbon estimates, and infiltration measurements. These programs provide important opportunities for public participation but are not intended to provide a comprehensive framework for long-term ecological monitoring or for comparing restoration’s functional outcomes among microforests and reference sites.
The goal of this article is to present an adaptable implementation and monitoring framework for community-based microforests that can be applied across diverse environmental and social settings. Specifically, we ask what shareable, replicable practices and lessons learned from two contrasting microforest projects can support broader adoption of evidence-based microforest implementation? The goal is not to present our own data, but to show how readers can design and monitor microforests using five complementary components—forest development, soil recovery, biodiversity recovery, microclimate regulation, and community stewardship—to document ecological change, strengthen community engagement, and support adaptive management. The framework is intended to help communities, practitioners, and researchers tailor microforest implementation to local conditions while promoting standardized monitoring and enabling comparisons among projects over time.
2. Materials and Methods
2.1. General Information About Site Selection
Selecting an appropriate site is a critical first step in the successful establishment of a microforest. Site selection should be chosen in collaboration with local community members and other stakeholders, guided by accessibility, land ownership, local environmental and social priorities, existing site conditions, and the availability of sunlight and water. The chosen location should maximize opportunities to generate meaningful ecological benefits while addressing community needs and fostering long-term stewardship.
A community’s objectives for a site will influence selection criteria. For example, establishing a microforest on a vacant lot that experiences recurrent flooding due to soil compaction can improve stormwater infiltration while restoring ecological functions, including habitat provision, urban heat island mitigation, and carbon sequestration. Alternatively, when the primary goal is community engagement and strengthening connections between people and nature, highly visible and frequently visited locations such as parks, schools, libraries, community centers, or nature centers may be more appropriate.
Regardless of the primary objective, selected sites should receive adequate sunlight and have reliable access to water, particularly during the first few years following planting, when supplemental irrigation is often necessary to ensure successful establishment and survival. Once a site has been identified, microforest establishment is guided by three core principles: (1) meaningful community involvement throughout the planning, implementation, and monitoring process; (2) soil assessment, decompaction, and amendment tailored to local site conditions; and (3) dense planting of regionally appropriate native canopy and subcanopy tree species, supplemented with shrubs and subshrubs to promote structural and functional diversity.
In this Methods section, we will first describe what has been done in the two areas where we have developed and monitored microforests, and then explain that is proposed as a methodological framework for future applications.
2.2. Overview of Microforest Examples
2.2.1. New York State Department of Environmental Conservation’s Microforest—Five Rivers Environmental Education Center, Delmar, New York
In 2024, the New York State Department of Environmental Conservation (NYSDEC) began preliminary planning to plant a demonstration Miyawaki-method microforest on NYSDEC-owned property (Figure 1). A planting site was identified at NYSDEC’s Five Rivers Environmental Education Center (“Five Rivers”) in Delmar, New York, for several reasons: Five Rivers maintains a dedicated staff and maintenance crew, hosts thousands of public visitors annually, and its visitor center, a LEED Platinum-certified building, serves as a showcase for NYSDEC’s commitment to sustainable construction and infrastructure. Although NYSDEC recognizes that microforests offer the greatest potential benefits in urban areas, the agency has limited access to and ownership of urban lots. NYSDEC therefore determined that Five Rivers, despite being situated in a suburban setting without an acute need for additional tree cover, offered the greatest visibility for a demonstration project, with the expectation that visitors would carry the technique home and mobilize their own communities to plant similar forests after seeing the Five Rivers site. Funding was provided by a $42,000 grant from the AT&T Foundation.
Figure 1.
Site design of NYSDEC’s Miyawaki Mini Forest at Five Rivers Environmental Education Center in Delmar, NY. This site design was prepared using Google Earth, by NYSDEC Urban Forester Amy Mackenzie. Source Google Maps: https://www.google.com/maps.
A 2000-square-foot area (186 m2) was selected for planting. As with much of New York State, this land was historically forested, then cleared and used as farmland until the 1930s. After New York State acquired the property, it was converted first to a lawn and later to a pollinator meadow. The meadow sits along an ADA-accessible path that also features wildflower gardens and a frog pond showcasing the Education Center’s biodiversity.
Site selection, species selection, and soil treatments were determined by a NYSDEC Urban Forester in collaboration with the New York Natural Heritage Trust, NYSDEC staff at Five Rivers, NYSDEC’s Office of Sustainability, and NYSDEC’s Division of Lands and Forests.
2.2.2. Elizabeth, New Jersey Microforests Installed by Groundwork Elizabeth
Elizabeth, New Jersey, sits within the highly urbanized New Jersey–New York corridor, and its soil contamination history reflects a broader regional pattern of legacy pollution in which past industrial activity continues to shape current land-use planning, risk assessment, and remediation priorities [44]. Emerging frameworks increasingly call for more sustainable and equitable approaches to brownfield redevelopment and the integration of green infrastructure [45]. To answer this call, the non-profit organization Groundwork Elizabeth has been working to transform overburdened land into parks, community gardens, urban farms, and greenways including microforests. Groundwork Elizabeth is an affiliate of the Groundwork Network, a national network of community-focused nonprofit organizations that work at the intersection of people, places, and systems to foster healthier, more resilient neighborhoods [46]. The Elizabeth microforests were installed as a form of green infrastructure in response to intense flooding and limited biodiversity in this densely populated urban center. The first microforest that was established by Groundwork Elizabeth in 2021 coincided with Tropical Storm Ida which caused flooding that killed four people in the City of Elizabeth. This microforest is on the grounds of the Elmora Library, next to a community micro-farm that was also designed and managed by Groundwork Elizabeth (Figure 2). In the subsequent years, Groundwork Elizabeth established one microforest per year, for a total of five microforests in the area at the time of this paper. These additional microforests have been established on the grounds of housing authority buildings, a school, and a cemetery.
Figure 2.
The Elmora Library microforest in Elizabeth, NJ, photographed by unmanned aerial vehicle on 14 August 2026. The red polygon delineates the edges of the Elmora Library microforest.
The most significant site challenges for the Elizabeth microforests are historic soil contamination and severe soil compaction. At the Elmora Library site, for example, arsenic levels reached as high as 29 ppm and lead levels as high as 329 ppm, with levels of up to 632 ppm recorded approximately 20 m from the microforest. The native soils are typically classified as Urban Land or as components of the Boonton soil complex [47], reflecting extensive anthropogenic disturbance including grading, filling, and compaction that is associated with historic industrial and residential development. As a result, these soils are often highly heterogeneous, with disrupted horizons, elevated bulk density, reduced porosity, and limited biological activity: conditions that significantly restrict water infiltration, gas exchange, and root development. The clay-dominant soils common to northern and central New Jersey are also prone to compaction, exhibit low saturated hydraulic conductivity (commonly <0.5 inches/h), and undergo pronounced shrink–swell cycling. This produces seasonal extremes, including waterlogging and anaerobic conditions during colder, wetter months and desiccation and elevated soil strength during summer months. Without intervention, these physical constraints severely limit plant establishment, microbial diversity, and long-term ecosystem function.
2.3. Soil Assessment and Preparation Methods
The soil is the essential and complex foundation upon which your microforest depends. The interconnections between soil microbes, fungi, invertebrates and plant roots, are based not just on the biota but also upon the chemistry and physical properties of the soil. The first step of a soil assessment is to survey the soil type, have it analyzed for pH and nutrients, and contaminants if suspected. This assessment should also include a check for cables, irrigation or pipelines [42]. A microforest often requires breaking up and loosening hard or degraded soil to a depth of 7–40 in (20–100 cm) using tools or machinery to allow roots to penetrate easily [7,42], but the soil preparation at each site may vary based on issues of compaction, contamination, invasive plant seedbanks, and budget. Below are the steps of the soil assessment and preparation that were taken at our case study locations.
2.3.1. Five Rivers Soil Preparation and Amendments
Soil preparation at the Five Rivers site was undertaken to alleviate compaction associated with its agricultural history and the absence of long-term forest cover. Prior to site preparation, soil samples were submitted to the University of Pennsylvania Extension Service for analysis of particle size distribution, pH, and macro- and micronutrient concentrations. Soil series information was obtained from the Natural Resources Conservation Service Web Soil Survey. Results indicated that the site soil was classified as a silt loam with a pH of 7.2 (slightly alkaline). Although nutrient analyses were conducted, these results were not used to guide soil preparation or species selection.
The planting area was located within a former wildflower meadow that had previously served as a monarch butterfly monitoring site but had become dominated by invasive species, including spotted knapweed (Centaurea stoebe) and purple loosestrife (Lythrum salicaria). To reduce the risk of invasive species regeneration, the upper 10 cm (4 in) of soil was removed to collect seed and root material. Excavated soil was relocated elsewhere on site and solarized to eliminate viable propagules for potential use in future restoration projects.
Following the removal of the topsoil, the remaining compacted soil within the microforest footprint was tilled to a depth of approximately 76 cm (30 in). Compost, comprising approximately 15% of the final soil volume, was incorporated to increase porosity, improve water infiltration and aeration, and enhance habitat suitability for soil organisms. The compost was obtained from a local commercial supplier. Because the site had experienced substantial disturbance and prolonged deforestation, beneficial soil biota, including mycorrhizal fungi, were assumed to be limited. Therefore, a biostimulant containing mycorrhizal fungal inoculum was applied at planting and again approximately two months later to promote soil biological activity and support plant establishment.
2.3.2. Elizabeth NJ Soil Preparation and Amendments
Soil preparation at the New Jersey sites was designed to address severe soil compaction and contamination associated with prior urban land use. An X-Ray Fluorescence Study was conducted through the United States Department of Agriculture Natural Resources Conservation Service to determine concentrations of trace metals on site. Approximately 61 cm (24 in) of existing soil was excavated and replaced with an engineered soil profile intended to replicate key structural and functional characteristics of forest floor systems. The replacement soil was formulated to meet physical and biological performance criteria consistent with urban soil restoration best practices.
The engineered soil blend consisted of 40–50% screened organic topsoil with a loam texture (pH 6.0–6.8; organic matter content 5–8%), 25–35% coarse sand (0.5–2.0 mm particle size), and 15–25% peat moss. Coarse sand was incorporated to improve drainage and reduce compaction, while peat moss enhanced water-holding capacity and supported microbial colonization (although a more sustainable material will be used in the future). Sand and leaf litter materials were sourced, with appropriate permissions, from the New Jersey Pine Barrens, where soils are naturally acidic (pH 3.5–5.5) and nutrient poor.
Target physical and chemical properties of the installed soil profile included a bulk density of 1.1–1.3 g cm−3, total porosity of 50–60%, infiltration rates of 2.5–7.6 cm h−1 (1.0–3.0 in h−1), organic matter content of 6–10%, pH of 5.5–6.5, and a cation exchange capacity of 10–20 meq 100 g−1.
Following soil installation and planting, a 7.5–10 cm (3–4 in) layer of leaf litter mulch sourced from the New Jersey Pine Barrens was applied across the site surface. This amendment was intended to improve soil structure and moisture retention, moderate soil temperature, reduce evaporative water loss, and introduce microbial communities adapted to low-nutrient environments. The leaf litter also serves as a slow-release source of organic matter and micronutrients, supporting soil food web development and nutrient cycling.
This integrated approach, combining soil excavation, engineered soil reconstruction, organic amendments, and biological inoculation, was designed to establish a resilient soil system capable of supporting long-term vegetation health, enhancing stormwater infiltration, and restoring ecological processes within a highly urbanized landscape.
2.4. Methods of Planting
Although each site required a different approach to soil preparation, planting and monitoring practices were more consistent across sites. Here, we present the best practices implemented across our microforests, along with the monitoring approaches that have proven effective.
Species List Development
Before determining the species for a microforest, a field survey of the local native forest cover should be conducted to understand the potential types of natural vegetation that belong in your planting location [42]. Species lists for each microforest in our case study areas were developed in collaboration with foresters and restoration practitioners with expertise in native species adapted to local site conditions. For example, the species list for the Five Rivers Environmental Education Center was developed by a forester from the New York State Department of Environmental Conservation (NYSDEC) using the New York Flora Atlas [48] to identify woody tree and shrub species native to Albany County. For the Elizabeth locations, species lists were created with assistance from ecologists with the New Jersey Conservation Foundation.
The objective was to establish a diverse assemblage of plant species representative of the site’s potential natural vegetation (with an ideal species count of 30–40). Species were categorized as shrub, understory, or overstory based on expected mature height, with approximately one-third of the selected species assigned to each stratum. Shade tolerance was not considered during categorization. The preliminary species list was subsequently reviewed by community members and additional experts.
Several ecologically important native species that would otherwise meet the definition of potential natural vegetation were excluded because of persistent threats posed by introduced pests and diseases. Species that were omitted from the planting design due to these concerns include ash (Fraxinus spp.) because of concerns with the emerald ash borer, eastern hemlock (Tsuga canadensis) due to hemlock wooly adelgid, and elm species (Ulmus spp). due to Dutch elm disease. Those that were planted in moderation due to concerns about emerging diseases include American beech (Fagus grandifolia) because of beech leaf disease, and American chestnut (Castanea dentata) due to chestnut blight. In addition, black walnut (Juglans nigra) was excluded because of its allelopathic effects, which may inhibit the growth of neighboring species.
Following finalization of the species list, the number of individuals per species was determined based on plant availability and suitability to site-specific conditions. Greater numbers of species expected to perform well under existing soil and environmental conditions were ordered. Prior to planting, nursery stock was temporarily stored in a shaded, fenced area with access to irrigation to protect plants from desiccation and deer browsing.
2.5. Volunteer Recruitment and Community Engagement
Community engagement and volunteer participation are integral components of microforest establishment. Volunteer recruitment was conducted through multiple channels, including flyers containing QR codes displayed in public locations, social media announcements, and email distribution lists. Email newsletters served as the primary means of communication with prospective volunteers. Initial communications introduced the Miyawaki Method and outlined project goals, while subsequent newsletters provided updates on site preparation activities, planting plans, and volunteer expectations. Communication frequency increased as planting day approached and included logistical information, scheduling updates, and contingency plans for weather-related changes. Volunteers registered for specific planting shifts using the online platform SignUpGenius.
Experienced tree planters played an essential role in facilitating volunteer participation. For example, for the Five Rivers site, local chapters of the Master Gardener program were involved throughout project planning, implementation, and maintenance. In addition, experienced community members were invited to serve as volunteer planting guides through the registration process. During planting events, staff members, Master Gardeners, and volunteer guides were identified by green bandanas to ensure they were easily recognizable to less experienced participants. Food and refreshments, including lunch, coffee, and water, were provided to staff and volunteers.
2.6. Planting Day Protocol
Weather conditions can substantially influence volunteer participation and planting logistics. For example, heavy rainfall at the Five Rivers site required postponement of the original planting date by one week. Although rainfall also occurred on the rescheduled date, planting proceeded because additional delays could have compromised plant survival during temporary storage. Of the approximately 250 volunteers who initially registered, 80 participated on the rescheduled planting day.
Prior to volunteer arrival, project staff organized planting stock within a designated staging area referred to as the “plant buffet” (Figure 3). Plants were grouped by vegetation stratum (overstory, understory, and shrub) and clearly labeled to facilitate species selection. Planting density was standardized by assigning one overstory, one understory, and one shrub species to each 1 m2 planting area. Individual planting units were delineated in advance using spray chalk, flagging, or temporary quadrats. Upon arrival, volunteers completed a liability waiver and received gloves and planting tools. Participants were organized into small groups of approximately three individuals and assigned to a planting guide. Each group received a brief overview of project objectives and a demonstration of proper tree-planting techniques.
Figure 3.
Picture of the “plant buffet” at the Five Rivers site that facilitates volunteer involvement.
Volunteers then selected one plant from each vegetation stratum and established their planting unit adjacent to previously planted areas while maintaining approximately 61 cm (24 in) of spacing between neighboring plants. Planting guides circulated throughout the site to provide technical assistance and ensure consistent implementation of planting protocols. At the conclusion of the event, volunteers returned tools to the distribution area and were invited to keep their gardening gloves.
2.7. Maintenance Procedures
Maintenance activities during the first growing season focused on irrigation, mulching with a layer of organic material such as straw, leaves or tree bark, invasive species management (manually removing weeds without chemicals), and soil health monitoring.
Regular watering throughout the first few years of establishment is key to a microforest’s success. At the New York site, a drip irrigation system was installed and monitored throughout the growing season to maintain adequate soil moisture. Mulch was applied to inhibit weed growth, conserve moisture within the soil, and moderate soil temperatures. A mycorrhizal inoculant was applied at planting and reapplied later in the season to promote soil biological activity and support root establishment. In New Jersey, the microforests are generally watered with a hose regularly throughout the growing season.
Continued monitoring of soil moisture and periodic application of mycorrhizal inoculants are expected to improve soil health and enhance resilience to climate-related stressors as the microforest matures. Although mulch effectively suppressed many undesirable species, persistent invasive plants, including Canada thistle (Cirsium arvense) and purple loosestrife (Lythrum salicaria) in New York, and mugwort (Artemesia vulgaris) in New Jersey required regular manual removal. Community volunteers have assisted with invasive species management and received training on proper removal techniques to minimize resprouting.
2.8. Monitoring
In this section, we present the best practices for monitoring both above-ground and below-ground performance indicators that were implemented at our microforests: tree growth, arthropod diversity, temperature, pollution mitigation, and soil physical, biological and chemical properties. A list of all suggested materials is included in Table 1.
Table 1.
List of supplies recommended for monitoring microforests based on the framework in this paper.
2.8.1. Forest Development: Tree Survival and Growth
Approximately three months after trees were planted, we conducted a field survey of the trees growing within the forested area of the plots. Permanent sampling transects were established prior to vegetation monitoring with the NYS NYSDEC Bureau of Real Property Survey Team using real property survey equipment. The survey marked all existing fenceposts with GIS coordinates and mapped transects using an aerial drone and GPS. Transects were laid along N-S direction, and GPS coordinates and physical markers within the forest area were recorded, for sampling replication to be conducted each subsequent year of monitoring (Figure 4). Following planting, trees were measured along each side of the transect, within half a meter to each side, and assigned a sampling ID. They were given metal tags with engraved numbers. For each tag, we recorded tree species, its status (alive or dead), diameter at ground level (with a caliper), tree height (with a tape measure), and noted whether the tree was planted or established through natural regeneration. Tree height was measured from the soil surface to the tip of the tallest stem. For individuals with multiple stems, the tallest stem was used for the height measurement. During the first year, when trees were too small for diameter at breast height (DBH) measurements, root-collar diameter was measured with calipers at the base of the main stem at ground level.
Figure 4.
Aerial view of Five Rivers Miyawaki Forest Demo. Red lines indicate transects marked using a real survey. Camera icons indicate areas where thermal images were taken of the forest.
As the trees matured over subsequent seasons and reached chest height (specifically at the Groundwork Elizabeth sites which are a few years older than the NYSDEC site), a DBH measuring tape was used for diameter, and a clinometer was used to measure height. To measure the trees with a clinometer, one person typically stood at the base of the tree to be measured (able to gently shake the tree gently if needed to see which one is to be measured), and another stood a known horizontal distance (such as 10 m) from the tree. A digital clinometer can automatically calculate tree height based on these measurements, while an analog one requires calculations to be made once the percentage of the angle is determined.
To account for natural regeneration (volunteer trees), we calculated survivorship of the original population by defining annual mortality, Qannual, and cumulative survivorship, lt, as
where t is the number of years since planting and lt is the proportion of the original population remaining alive at time t [49,50].
Qannual = 1 − lt1/t
2.8.2. Biodiversity Recovery: Arthropods and Future Wildlife Monitoring
One year after planting, we conducted arthropod ground dweller surveys using Earthwatch’s Tiny Forest tile method and used their Ground-Dwellers-Field-sheet [51], but used equally sized split logs (0.5 m × 0.15 m) with the cut side facing down instead of tiles. Logs were put out in the microforest and left for three weeks before being rolled over to make observations of invertebrates that were using it as habitat. Logs were placed in an adjacent natural forest and open field for comparison. Volunteer(s) lifted each log and recorded its number, its condition, and how far from the closest edge of the microforest the log was located. Then, they noted their individual level of identification experience before recording which organisms were found beneath the log and on its underside. After completing their surveys, the volunteers replaced the logs where they were found.
2.8.3. Soil Recovery
Soil condition was assessed through a paired sampling design in which two contrasting sites are established at each study location: an afforested site, subject to regular disturbance associated with microforest maintenance, and an unrestored reference site with comparably intact soil and established vegetation, even if it is adjacent lawn grass. This paired approach follows the framework recommended by Pino et al. [52] and enables direct assessment of management effects on the physical, chemical, and biological properties of soil. At the time of sampling, descriptive contextual information was recorded at each site, including estimated vegetation type, degree of shading, slope aspect, visible macrofauna, and estimated rooting depth.
Soil characterization followed a multistage field and laboratory protocol designed for implementation with citizen scientists. The protocol integrates three analytical components. The physical component assesses the hydrological properties governing subsurface water movement and storage, and their influence on nutrient transport through the soil profile. The chemical component examines organic carbon content and pH as indicators of soil health and nutrient availability, reflecting the cumulative legacy of biological activity, organic matter cycling, and past land use. The biological component evaluates the decomposition capacity of the soil, measured through microbial turnover of organic matter, which is central to nutrient cycling, plant productivity, and the long-term carbon storage potential of a recovering forest system.
These three components are operationalized through four appendices. Each appendix provides complete materials lists, step-by-step procedures, calculation equations, and result interpretation tables sufficient for independent replication:
Appendix A: Soil sampling with hydraulic conductivity, bulk density, pH, and moisture analysis;
Appendix B: Determination of soil organic matter and organic carbon;
Appendix C: Assessment of microbial decomposition activity using the Tea Bag Index method;
Appendix D: Field estimation of soil texture using the ribboning technique.
Although the complete protocol provides a comprehensive assessment of soil condition, four measurements are recommended as the minimum practical set for citizen science applications where time, equipment, or laboratory access may be limited.
Gravimetric moisture content (Appendix A, Appendix A.5), requiring only a scale and an oven, provides a direct measure of soil water status at the time of sampling. With repeated measurements across seasons, it can indicate the extent to which recovering soils are rebuilding their moisture retention capacity, a property linked to plant establishment, microbial function, and hydrological resilience.
Soil pH and delta pH (Appendix A, Appendix A.6), measured on air-dried soil using a dilute calcium chloride solution and either pH strips or a basic meter, characterize soil acidity and surface charge properties. These parameters govern nutrient availability to plants and microbial communities, and their trajectory over time reflects the chemical recovery of the soil system.
Field texture assessment using the ribboning technique (Appendix D) requires only water and a ruler and provides an immediate estimate of particle size distribution. Soil texture exerts a primary control over water and nutrient dynamics, influences compaction responses, and provides essential context for interpreting variation in other soil measurements across sites.
The Tea Bag Index incubation (Appendix C) uses standardized commercial tea bags as litter inputs to estimate decomposition rates and related parameters. This method serves as a proxy for microbial activity and organic matter turnover, processes that underpin nutrient cycling and the carbon storage capacity of the developing soil system.
Collectively, these four measurements provide baseline information on the physical, chemical, and biological dimensions of soil condition while requiring minimal infrastructure and technical expertise, allowing tracking of soil recovery trajectories over time.
2.8.4. Microclimate Regulation
Traditional approaches for assessing the thermal effects of urban greening projects have relied primarily on remotely sensed land surface temperature (LST) data derived from satellite platforms such as Landsat [52], stationary weather stations or mobile air temperature and humidity data loggers [53], and geophysical models (e.g., ENVI-met, https://envi-met.com/) used to estimate cooling associated with land-cover and land-use changes resulting from small-scale greening interventions [54,55]. However, these approaches have limitations regarding spatial resolution when applied to microforests.
One of the simplest and most cost-effective methods for monitoring surface temperatures is the use of a handheld infrared thermometer that measures the temperature of the surface targeted by the device’s laser pointer. This technique is used with student groups at the New Jersey locations. Repeated measurements collected from predetermined surface types at standardized heights and locations throughout the year, particularly during periods of extreme heat, are being used to quantify changes in surface temperature associated with microforest establishment.
The NYSDEC microforest monitoring program uses an alternative approach involving the use of handheld forward-looking infrared (FLIR) thermal cameras. These relatively affordable devices capture thermal images that can be used to assess spatial patterns in surface temperature from ground level or elevated vantage points throughout the development of the microforest. To ensure meaningful comparisons over time, thermal images are collected from consistent locations, camera angles, heights, and under similar meteorological conditions. The NYSDEC microforest uses a handheld Teledyne FLIR C5 thermal imaging camera [56] equipped with a 1.9-mm lens and an image resolution of 640 × 480 pixels. Prior to data acquisition, the ground surface within the plot was scanned to establish a local temperature range for camera calibration. Consistent with manufacturer’s recommendations, sky pixels were excluded from thermal images to prevent inaccurate temperature estimates.
Thermal images were collected from multiple fixed vantage points, including (1) within the educational area facing south; (2) outside the plot near the hydraulic control station facing north; (3) from the western edge of the plot facing east; and (4) from the eastern edge of the plot facing west (Figure 1). Future monitoring efforts will replicate these viewpoints using permanent reference markers or designated “selfie stations” to ensure consistency across sampling periods.
The Groundwork Elizabeth sites are also using an emerging, but more challenging, costly, and technical practice for monitoring microforests, relying on Unmanned Aerial Vehicles (UAVs, or drones), which can be programmed to fly a predetermined route over the project site with very high spatial resolution (1.5 cm per pixel). By selecting acquisition dates and times that can capture the diurnal variation in land surface temperature (e.g., 8 AM, 3 PM, 7 PM) and selecting for meteorological conditions associated with health impacts of heat (e.g., days at or above the 85th percentile summer temperature), multiyear imagery collection can reveal how these small-scale urban greening techniques can reduce the overall heat burden in the immediate vicinity by showing changes in visible greenness, shade, and surface temperatures [57,58] (Figure 5).
Figure 5.
Aerial photographs and UAV-based thermal imagery taken of the microforest at the Elmora Library in 2024 (at three years old) demonstrating proof of concept.
Having multiple approaches for monitoring temperature demonstrates how organizations with different technical capacity can implement thermal monitoring, ranging from handheld infrared thermometers to drone-based imaging, while maintaining standardized sampling protocols. And, if the budget allows, pairing drone-based LST measurements with on-the-ground FLIR handheld thermal imagery can help tell the full story of your microforest and encourage engagement with local stakeholder groups, such as youth or resident climate action councils.
2.8.5. Air Pollution Monitoring
Monitoring air quality both within and outside the microforest provides valuable data on the ability of urban forests to improve local environmental conditions. Trees and vegetation can capture airborne particulate matter on their leaves and branches, reducing the concentration of pollutants in the surrounding air. In addition, microforests can alter airflow patterns, increase humidity, and create cooler microclimates that may influence pollutant concentrations.
To better understand the environmental benefits of urban microforests, AirBeam AQ (air quality) Monitors are being used to measure and compare air quality conditions both inside and outside of the microforest at the Elmora Library in Elizabeth. The AirBeam is a portable, low-cost air quality monitoring device that measures concentrations of fine particulate matter (PM2.5) in the air. PM2.5 refers to airborne particles at or below 2.5 micrometers in diameter, small enough to enter the bloodstream after penetrating the lungs. These particles can originate from vehicle exhaust, industry, construction, combustion sources, and other urban pollutants. Exposure to elevated levels of PM2.5 has been linked to respiratory illnesses, cardiovascular disease, asthma, and other adverse health effects.
2.9. Community Stewardship
Community stewardship was considered a core component of the implementation framework rather than an activity occurring after planting. During project planning, opportunities for public participation, environmental education, and long-term stewardship were integrated into site design to encourage continued community involvement beyond the initial planting event. Educational infrastructure was incorporated into project planning wherever feasible. Depending on site objectives and available resources, these features included interpretive signage, outdoor learning spaces, permanent photo-monitoring stations, volunteer maintenance opportunities, and partnerships with local schools and community organizations. These elements were intended to increase public understanding of urban forests while fostering long-term stewardship of the sites.
To encourage continued documentation of microforest development, projects incorporated permanent photographic monitoring stations (“selfie stands”) positioned at standardized locations adjacent to the planting area. These stations provide visitors with a consistent vantage point from which to photograph forest development over time. Images submitted by participants can supplement formal ecological monitoring while promoting continued public engagement with the project.
Long-term stewardship activities were also incorporated into project planning. Community volunteers, school groups, and local organizations were encouraged to participate in periodic maintenance activities, including invasive species removal, mulching, and monitoring. These recurring stewardship events provide opportunities to reinforce ecological concepts while maintaining community ownership of the project.
2.10. Proposed Methodological Framework for Future Applications
While each of the methods described above have been implemented in at least one of the microforests described in this study, they have not all been implemented at each of the microforests. Building upon these as a foundation, we have developed a proposed methodological framework for future applications. This framework, described in the Results section below, also includes variables that have not yet been measured by our teams. For example, at this point, we have not set up monitoring protocols for birds, mammals, flying insects/pollinators or amphibians. Future work will include installing trail cameras, sound recorders, using the Merlin app for bird identification, and adopting pollinator monitoring protocols from Earthwatch [14].
3. Results
3.1. Comparative Site Challenges and Solutions
Since there are inherent differences between the two locations described in this paper, they each have different challenges and associated costs that had to be incurred through the creation of the microforests. Table 2 summarizes the management decisions and costs associated with the two microforest regions.
Table 2.
Summary of site establishment, preparation techniques, community partners and cost for the Five Rivers and Groundwork Elizabeth.
Importantly, there is no single “correct” way to establish a microforest. Communities vary widely in their access to funding, staff capacity, volunteers, equipment, and technical expertise, and successful projects must be adapted to these realities. Rather than presenting microforest establishment as an all-or-nothing endeavor, the matrix below (Figure 6) demonstrates that projects can be implemented across a range of resource conditions.
Figure 6.
Matrix of techniques for implementing microforests along a spectrum of time and monetary investments. * For full details, please refer to the methologies described elsewhere in this paper.
3.2. Adapted Management and Monitoring Framework
One of the primary outcomes of this work is the development of a standardized yet adaptable management and monitoring framework that can be implemented by communities, nonprofit organizations, government agencies, and researchers establishing microforests (Figure 7). The framework integrates measurements of forest development, biodiversity recovery, soil function, microclimate regulation, and community engagement using methods that range from basic citizen science to more advanced ecological monitoring. It was designed around three guiding principles: (1) monitoring should be accessible to practitioners with varying levels of technical expertise; (2) protocols should be sufficiently standardized to facilitate comparisons among sites and over time; and (3) measurements should capture both ecological succession and the social benefits of community-based restoration. Recognizing that organizations differ substantially in available funding, equipment, and capacity, there is flexibility in the level of monitoring complexity, allowing users to adopt only those components that align with their project goals and available resources.
Figure 7.
Management and monitoring framework developed for community-based microforests. Arrows refer to the transfer of information from implementation through monitoring, adaptive management and ecological improvement. When successful monitoring is conducted and knowledge shared, the information gained informs the design and implementation of future microforest.
Five primary monitoring categories were incorporated into the framework. First, vegetation monitoring documents tree survival, growth, and natural regeneration through repeated measurements of species identity, height, stem diameter, and survivorship. Permanent transects, individually tagged trees, and fixed sampling locations provide a consistent basis for evaluating changes in forest structure through time.
In total, 79 species were planted and are being monitored by the two regions presented in this paper (for a total of six current microforests): 46 trees, 32 shrubs, and a species of vine (Table 3). While all of the species chosen to be planted are native to that planting zone (Delmar, NY USDA Hardiness Zone 5b Zone 7b), some that were chosen, such as the Kentucky coffee tree (Gymnocladus dioicus) for Elizabeth and eastern redbud (Cercis canadensis) for Five Rivers in Delmar, NY, were selected from other geographical regions because of community interest and their ability to adapt to warming conditions.
Table 3.
A list of species included in each of the six microforests referred to in this study across the case study locations in New York (NYSDEC) and New Jersey (Groundwork Elizabeth). Adapted from Ref [10].
Second, soil monitoring evaluates changes in the physical, chemical, and biological properties of restored soils. Recommended measurements include soil moisture, pH, texture, water infiltration, organic matter, organic carbon, and microbial decomposition. Recognizing that many community organizations have limited laboratory access, the framework identifies a minimum suite of measurements that can be completed using inexpensive equipment while still providing meaningful indicators of ecosystem recovery. Those implementing the full monitoring protocol are encouraged to begin with these four measurements before proceeding to more advanced analyses.
Third, biodiversity monitoring focuses initially on ground-dwelling arthropods as early indicators of habitat development and ecological succession. Simple sampling approaches adapted from existing citizen science programs allow volunteers to document changes in invertebrate communities while minimizing equipment requirements. As microforests mature, the framework can be expanded to include additional taxa including birds, pollinators, mammals, amphibians, and other wildlife.
Fourth, thermal monitoring is used to evaluate changes in surface temperatures associated with canopy development and increasing vegetation cover. The framework incorporates multiple approaches, ranging from handheld infrared thermometers and portable FLIR thermal cameras to unmanned aerial vehicles equipped with thermal sensors where resources permit. Repeated measurements collected from standardized locations provide an accessible means of documenting changes in microclimate that can be readily communicated to community members, municipal decision-makers, and funding organizations. Both case studies incorporated monitoring approaches that document changes in surface temperature associated with microforest establishment.
Finally, the management and monitoring framework explicitly incorporates community participation as both a means of data collection and a project outcome. Educational signage, volunteer monitoring days, photo documentation (Appendix E) and partnerships provide opportunities for residents to participate directly in long-term stewardship while simultaneously documenting changes in forest development. This emphasis on citizen science recognizes that sustained community engagement is essential for both long-term maintenance and continued ecological monitoring rather than treating public engagement as a single planting-day activity.
Collectively, these monitoring components establish a common framework that can be replicated across microforest projects while remaining flexible enough to accommodate site-specific objectives and organizational capacity. It also provides a foundation for comparing outcomes across sites and for building a broader evidence base to evaluate the effectiveness of microforests as an urban restoration strategy.
To support data sharing and site comparison efforts, we are establishing a microforest network and database that enables community members, researchers, nonprofit organizations, and government agencies involved in microforest planning, implementation, and monitoring to exchange data, lessons learned, and best practices. The network will also provide guidance on project feasibility, budgeting, and long-term monitoring. As an initial step toward this goal, we have begun developing a database of microforests throughout the northeastern United States in collaboration with researchers at Kean University, the New York State Department of Environmental Conservation, and nonprofit organizations including Groundwork USA and Biodiversity for a Livable Climate (Bio4Climate). A publicly available survey has been created to collect baseline information on newly established and planned microforests across the region and is available on the Bio4Climate website. By facilitating knowledge exchange and standardized data collection, this network has the potential to drive evidence-based adaptive management, improving project outcomes, supporting comparative research, and accelerating the adoption of microforests as a community-based approach to ecological restoration and climate resilience.
4. Discussion
As cities continue to expand and the ecological consequences of sprawl-dominant urbanization intensify, the need for accessible, hyperlocal, and community-driven restoration strategies has never been greater. Microforests represent a compelling response to this challenge that is relatively affordable, spatially flexible, and capable of delivering measurable ecological and social benefits within years rather than decades. Importantly, there are also economic benefits that can result from the installation of microforests. Estimates from Groundwork USA’s collaborations with Earth Economics suggest that microforests are cost-effective within only a few years and, across the first three microforests in Elizabeth, NJ, it was found that there is an $11.00 return for every $1.00 invested in them [59]. These estimates are largely based on benefit transfer models that assume that microforest ecosystem services benefits are a hybrid of forest landcovers on an accelerated growth period. And, despite their rapid proliferation globally, the field has lacked a rigorous, practical, and replicable framework for how to plan, plant, monitor, and report on the differences between them and more traditional forests and urban forestry.
Over the past five years of planning, planting, and maintaining microforests, several important lessons have emerged. First, with regard to soil amendments, we recognize that the peat moss that is used in the Groundwork Elizabeth sites is not sustainable as it is harvested from wetlands where it has sequestered carbon for millennia and the harvesting of peat causes intense ecological damage [60]. Therefore, alternative materials effective at improving drainage and retaining moisture in soil will be integrated into our soils in the future including coconut coir and compost.
Regarding planting days, we recognize that it is essential to account for weather variability and the impacts of a changing climate. Organizers should develop contingency plans for planting events and establish reliable communication systems to notify volunteers of schedule changes due to inclement weather. Although planting events are most successful under mild weather conditions, flexibility and preparedness are critical for long-term project success.
Volunteer recruitment strategies should align with project goals. Organizers must consider whether the primary objective is to maximize participation or to foster deeper engagement among a smaller group of volunteers. For the Five Rivers planting, NYSDEC invested substantial time in outreach efforts, including newsletters, flyers, and volunteer training, which helped generate strong community support. However, weather-related rescheduling reduced the expected number of participants. In retrospect, the smaller volunteer group was well suited to the site and allowed participants to spend more time planting trees and interacting with organizers than would have been possible with a larger crowd. Large-scale planting events can be powerful demonstrations of collective action, with some microforest projects reportedly engaging more than 500 volunteers in a single day [61]. However, managing hundreds of volunteers requires significant planning, coordination, supplies, and supervision that may exceed the capacity of many community organizations.
Another important consideration is the availability of native plant material. Even carefully developed planting lists may need to be modified due to limited availability of specific native species or locally adapted genotypes. Planting plans may also benefit from incorporating species that are currently near the northern edge of their range but are expected to shift northward in response to climate change [62]. In addition, practitioners should remain informed about current and emerging tree pests and diseases when selecting species and developing long-term management plans.
The approaches described in this study were shaped by the human and financial resources available to each partner organization through local and state government agencies and corporate sponsorship. Such resources, however, may not be available to many organizations or communities seeking to establish microforests. Consequently, project teams may need to make strategic decisions early in the planning process regarding where to allocate limited time and resources. The matrix shared in this paper will assist in that decision-making process. One investment that should not be overlooked in areas with high deer populations is protective fencing. Without adequate deer exclusion measures, newly established plantings may experience severe browsing damage that compromises project success.
Finally, although the Miyawaki Method assumes that microforests become self-sustaining after several years and no longer require human-based management such as irrigation or weed control [63], our experience suggests that this assumption may not hold in urban environments. The oldest microforest included in this study, located in Elizabeth, New Jersey, is entering its sixth growing season and continues to require invasive plant management (manual weeding). Nevertheless, we have found that mulch substantially reduces maintenance requirements. During long-term maintenance, managers should prioritize the removal of aggressive invasive species, rather than focusing limited resources on less competitive, non-native species that may pose a lower threat to ecosystem function.
5. Conclusions
The goal of this paper was to provide communities with practical guidance for designing, planting, and monitoring microforests based on lessons learned in two case studies that illustrate both the promise and the complexity of microforest implementation across varied contexts. Together, they demonstrate that there is no single template for a successful microforest. Site history, soil conditions, community capacity, available funding, and local ecological pressures all shape the process. What remains consistent across contexts, however, is the value of centering community involvement, investing in soil health, and committing to long-term monitoring.
By focusing on a practical framework for creating and monitoring microforests, this paper emphasizes methodological guidance rather than the presentation of preliminary data and analyses. While a growing body of literature documents the potential benefits of urban green infrastructure, there remains a critical gap between broad ecological claims and site-specific, evidence-based evaluation. This paper makes the science of microforest evaluation more accessible and inclusive by offering accessible, low-cost methods for tracking forest development, biodiversity recovery, soil function, microclimate regulation, and community engagement. Documentation of a microforest’s development matters not just for the integrity of individual projects, but for the broader field. Without community-accessible monitoring approaches, it is nearly impossible to compare outcomes across sites, assess the efficacy of the Miyawaki Method, or make the evidence-based case for continued investment in this form of green infrastructure.
The work documented here also speaks to questions regarding environmental justice. The microforests installed by Groundwork Elizabeth were planted in a city that has long borne a disproportionate share of industrial pollution and flood risk. The challenges encountered at these sites reflect conditions found in urban communities across the world. Demonstrating that microforests can be successfully established under these conditions and that the process itself can build community capacity and environmental awareness is a meaningful contribution to the field of community-based conservation.
Finally, this paper reinforces a point that is easy to overlook amid the enthusiasm for planting microforests: the importance of realistic expectations and honest documentation. The microforests described here are young, and their long-term trajectories remain to be seen. Rather than overstating what has been achieved, we have sought to share what we have done, what has worked, and what we are still learning. It is our hope that this transparency will encourage other practitioners to do the same and that the network and database we are building will become a living repository of shared knowledge that strengthens the field for years to come. The microforest is not a panacea, but with the right community behind it, it is a powerful tool for reclaiming ecological function, one small patch of urban land at a time.
Supplementary Materials
The following supporting information can be downloaded at: https://www.mdpi.com/article/10.3390/su18199685/s1, the python calculation scripts and the data files.
Author Contributions
Conceptualization, D.J.S., T.D. and C.T.; methodology, All Authors; investigation, All Authors; writing—review and editing, All Authors; project administration, D.J.S. All authors have read and agreed to the published version of the manuscript.
Funding
This research received no external funding.
Institutional Review Board Statement
Not applicable.
Informed Consent Statement
Not applicable.
Data Availability Statement
The original contributions presented in this study are included in the article. Further inquiries can be directed to the corresponding author.
Acknowledgments
We are grateful to the supporters of the microforests described in this paper. This includes Groundwork USA, and the New Jersey Conservation Foundation, the Schenectady Master Garders, and NYSDEC staff.
Conflicts of Interest
Authors [Tess Drauschak, Gina Jack, Amy Mackenzie, Jessie Rosenthal, Charlene Tarsa, and Elizabeth Wagner] were employed by [NYS Department of Environmental Conservation, Albany, NY, USA]. Author [John Evangelista ] was employed by [Groundwork Elizabeth, Elizabeth, NJ, USA]. The remaining authors declare that the research was conducted in the absence of any commercial or financial relationships that could be construed as a potential conflict of interest.
Appendix A
Soil Analysis Appendix A, Appendix B, Appendix C and Appendix D
This document contains four appendices that each describe a soil analysis method. The appendices are designed for use by students, teachers, and community scientists. Each appendix includes a materials list, step-by-step procedures written in accessible language, the equations required to process the collected data, and a table for interpreting results. A data-collection spreadsheet and a Python version 3.3 calculation script are provided for each appendix as companion files.
Appendix A Soil core collection, hydraulic conductivity, moisture content, dry bulk density, and soil pH.
Appendix B Soil organic matter by loss on ignition, and soil organic carbon.
Appendix C Soil microbial decomposition activity using the Tea Bag Index method.
Appendix D Soil texture using the field ribboning technique.
Each appendix is self-contained and may be used independently. Where appendices are used together, cross-references are provided to help contextualize results across methods.
Soil Core Collection, Water Flow Rate, Moisture Content, and Soil pH.
Appendix A.1. Materials Required
| Item | Quantity/Size | Where to Obtain/Notes |
| 1-in (2.5 cm) diameter copper pipe, 18 in. (45 cm). long | 1 per sample | Hardware store, plumbing section |
| Digital scale | 1 | Accurate to 0.001 g preferred; jewellery or lab scale |
| Ruler or measuring tape | 1 | To measure headspace inside pipe |
| Stopwatch or phone timer | 1 | |
| Measuring cup or graduated cylinder | 1 | To measure water volume in mL |
| Coffee filters (basket style) | Several | Supermarket |
| Fine mesh screen (approx. 200 micrometres) | Small piece | Hardware store, window screen mesh; or fine kitchen strainer mesh |
| Coarse mesh (approx. 2 mm) | Small piece | Hardware or garden store, coarse kitchen strainer mesh |
| Strong waterproof tape | 1 roll | Duct tape or plumber tape works well |
| Distilled or filtered water | 1–2 L per sample | Supermarket; avoid chlorinated tap water |
| Thermometer | 1 | Aquarium or kitchen candy thermometer |
| Aluminum baking trays (disposable) | 1 per sample | Supermarket, baking aisle |
| Household oven | 1 | Set to 110 degrees Celsius (230 degrees Fahrenheit) |
| Calcium Chloride Dihydrate powder | 147 g per liter of stock solution | Pool supply store (sold as “pool hardener” or “calcium hardener”); or hardware store as “ice melt” |
| pH meter or paper strips (range 1–12) | 1 | Aquarium supply store or garden center |
| Buffer calibration solutions (pH 4, 7, and 10) | 1 set | Aquarium or lab supply store; required only if using a pH meter |
| 2 mm kitchen sieve | 1 | Supermarket or kitchen store |
| Small clean glass jars or cups | 2 per sample | For the pH test suspensions |
Appendix A.2. Overview
This appendix describes how to collect a soil core (an undisturbed cylinder of soil), measure how quickly water drains through it (hydraulic conductivity), determine how much water the soil holds (moisture content and bulk density), and measure soil acidity (pH). Together, these measurements provide a fundamental characterization of soil physical and chemical properties.
Appendix A.3. Soil Core Collection
Soil cores are collected using a 1-inch diameter copper pipe, 18 inches long, which functions as a thin-walled sampler. Prior to use, the pipe must be cleaned and its empty weight recorded.
- Clean the copper pipe and record its empty weight (tare weight) to the nearest 0.001 g.
- Push or twist the pipe vertically into the soil until it is mostly full.
- Carefully extract the pipe, keeping the soil column inside as undisturbed as possible.
- Immediately record the combined weight of the pipe and wet soil.
- Measure the empty headspace at the top of the pipe using a ruler. The soil core length equals the total pipe length minus the headspace length.
Note: Record all measurements immediately. Soil moisture changes rapidly once the core is removed from the ground.
Appendix A.4. Hydraulic Conductivity Test (Falling Head Method)
Hydraulic conductivity measures how quickly water moves through soil. Sandy soils drain rapidly; heavy clay soils drain slowly. This test is adapted from ASTM D5084 [64].
Appendix A.4.1. Assembling the Filter Base
- 6.
- Fold a coffee filter and place it at the base of the pipe.
- 7.
- Add a layer of fine mesh (approximately 200 micrometers, such as window screen mesh) followed by a layer of coarser mesh (approximately 2 mm, such as kitchen strainer mesh).
- 8.
- Secure all layers firmly with waterproof tape so they remain in place when wet.
Appendix A.4.2. Running the Test
- 9.
- Measure and record the water temperature in degrees Celsius. The acceptable range is 15 to 24 degrees Celsius; 20 degrees is the preferred target.
- 10.
- Measure a known volume of water (for example, 200 mL) and record the initial height of the water column above the soil surface.
- 11.
- Pour the water into the top of the pipe and start the timer immediately.
- 12.
- Stop the timer when the last drop exits from the base of the pipe.
- 13.
- Record the time in seconds. Repeat this procedure at least four times per sample and use the average time for calculations.
Note: If water takes more than 30 min to drain, the soil has very high clay content. If it drains in under 30 s, the soil is likely sandy or coarse-grained.
Appendix A.5. Moisture Content and Dry Bulk Density
These measurements are adapted from ASTM D2216 and ASTM D7263.
- 14.
- Remove the filter base and carefully transfer the soil core into a pre-weighed clean aluminum tray.
- 15.
- Record the combined weight of the tray and wet soil (wet weight).
- 16.
- Place the tray in a well-ventilated area and allow the soil to air-dry until its weight no longer changes (typically 1 to 2 days).
- 17.
- Set aside approximately 12 g of the air-dried soil in a labelled container for the pH test described in Appendix A.6.
- 18.
- Transfer the remaining soil to an oven set to 110 degrees Celsius and dry for 24 h, or until a constant weight is reached.
- 19.
- Remove from the oven, allow to cool, and record the final dry weight.
Appendix A.6. Soil pH Determination
Soil pH indicates whether the soil is acidic, neutral, or alkaline. Most food crops grow best between pH 6.0 and 7.0. This procedure is adapted from ASTM D4972. The pH is measured in two suspensions: one using distilled water and one using a dilute Calcium Chloride solution. Calcium Chloride (CaCl2), sold at pool supply stores as “calcium hardener” or at hardware stores as “ice melt,” is used at a very low concentration to buffer the reading and remove interference from soil minerals, producing a more stable and reproducible result.
Appendix A.6.1. Preparing the Calcium Chloride Working Solution
Use Calcium Chloride Dihydrate (the most common commercial form, labelled CaCl2.2H2O, sold as a white granular powder).
- 20.
- Weigh 147 g of Calcium Chloride Dihydrate granules.
- 21.
- Dissolve in approximately 700 mL of distilled water in a 1-litre jug, then add distilled water to bring the total volume to exactly 1 L. This is the 1 M stock solution.
- 22.
- To prepare the working solution: measure 20 mL of the stock solution into a clean 2-litre container and add distilled water to bring the total volume to 2 L. This dilute solution is used directly in the pH test.
Note: Anhydrous Calcium Chloride (the dry form without water of crystallization, sometimes sold as “ice melt”) may also be used. In this case, weigh 111 g and dissolve as above. This reaction releases heat; allow the solution to cool fully before proceeding.
Appendix A.6.2. pH Test Procedure
- 23.
- Sieve the air-dried soil subsample through a 2 mm sieve. Use only the fraction that passes through.
- 24.
- Weigh two separate 5 g portions of the sieved soil into two clean jars.
- 25.
- Add 5 mL of distilled water to the first jar. Add 5 mL of the Calcium Chloride working solution to the second jar. Stir both and allow to stand for 1 h.
- 26.
- Insert the pH meter electrode (or dip a pH paper strip) into each suspension and record the reading to the nearest 0.1 unit. Allow the reading to stabilize before recording.
Note: If using a pH meter, calibrate it with the standard buffer solutions (pH 4, 7, and 10) before each session.
Appendix A.7. Calculations
The following equations are used to process the raw measurements. A Python calculation script (appendix_A_calculations.py) applies these equations automatically when given the data file (appendix_A_data.csv). Please refer to the supplementary materials.
Soil core length (cm): Soil length = Total pipe length minus Headspace length (convert inches to cm: multiply by 2.54)
Soil volume (cm3): Volume = pi × (pipe radius in cm) × (pipe radius in cm) × soil length in cm
Wet soil mass (g): Wet mass = (Pipe + wet soil weight) minus Empty pipe weight
Dry soil mass (g): Dry mass = (Tray + oven-dried soil weight) minus Empty tray weight
Gravimetric moisture content (%): MC = [(Wet mass minus Dry mass) divided by Dry mass] × 100
Dry bulk density (g per cm3): Bulk density = Dry soil mass divided by Soil volume
Hydraulic conductivity at test temperature (cm per s): K = (Soil length divided by Time) × ln[(Soil length + Initial water height) divided by Soil length]
Temperature-corrected hydraulic conductivity (cm per s): K20 = K × viscosity correction factor (see script for lookup table)
Delta pH: Delta pH = pH in CaCl2 solution minus pH in distilled water
Appendix A.8. Interpretation of Results
Table A1 provides guidance for interpreting the calculated values.
Table A1.
Interpretation guidelines for Appendix A results.
Appendix B
Soil Organic Matter and Soil Organic Carbon
Appendix B.1. Materials Required
| Item | Quantity/Size | Where to Obtain/Notes |
| Porcelain or ceramic crucibles | 1 per sample | Laboratory supplier or pottery supply shop |
| Muffle furnace or pottery kiln (reaching 550 degrees Celsius) | 1 | School or university laboratory; local pottery studio may allow access |
| Desiccator or airtight container with silica gel | 1 | Laboratory supplier; substitute with a sealed food container containing silica gel sachets |
| Drying oven reaching 105 to 110 degrees Celsius | 1 | Laboratory oven or calibrated household oven |
| Hydrochloric acid approximately 10% solution for cleaning (sold as “pool acid” or “muriatic acid” or “pH Down”) | Small volume | Pool supply store or hardware store; wear gloves and work in a ventilated area |
| Stainless steel tongs or crucible tongs | 1 pair | Laboratory supplier; clean BBQ tongs may be used |
| Powder-free nitrile gloves | 1 box | Pharmacy or supermarket |
| Digital scale accurate to 0.001 g | 1 | Jewelry or laboratory scale |
| Mortar and pestle | 1 | Kitchen supply or laboratory store |
| 2 mm kitchen sieve | 1 | Supermarket or kitchen store |
| Oven-dried soil from Appendix A | Approx. 10 g per sample |
Appendix B.2. Overview
Soil organic matter (OM) is the living and decomposed biological material present in soil. It provides nutrients to plants, supports microbial communities, improves water retention, and is a primary indicator of long-term soil health and fertility. Soil organic carbon (SOC) represents the carbon fraction of soil organic matter and is widely used as a quantitative index of soil condition. This appendix describes two methods for determining these quantities: the Loss on Ignition (LOI) method, which is recommended for field and citizen science applications, and the Total Carbon Analyser method, which is used where greater analytical precision is required.
Appendix B.3. Crucible Cleaning and Preparation
Crucibles must be free of all carbon contamination before use. Any residual organic material from previous use or from skin contact will produce artificially elevated results.
- 27.
- Scrub crucibles with neutral laboratory detergent and warm water. Rinse thoroughly.
- 28.
- Prepare a dilute acid cleaning bath using Hydrochloric Acid at approximately 10% concentration (sold as “pool acid,” “muriatic acid,” or “pH Down” at pool supply and hardware stores). Immerse the crucibles for a minimum of 2 h. Wear nitrile gloves and work in a well-ventilated area.
- 29.
- Rinse the crucibles three to four times with distilled water.
- 30.
- Dry in a clean oven at 105 degrees Celsius for 1 h.
- 31.
- Allow to cool in a sealed desiccator or airtight container, then record the empty weight of each crucible to the nearest 0.001 g.
Note: Crucibles must never be handled with bare hands after cleaning. Skin oils contain sufficient organic carbon to affect results. Always use tongs or wear gloves.
Appendix B.4. Sample Preparation
- 32.
- Take approximately 10 g from the oven-dried soil produced in Appendix A.
- 33.
- Pass the dried soil through a 2 mm sieve to remove gravel, coarse roots, and large debris.
- 34.
- For improved analytical precision, grind the sieved soil to a fine powder using a mortar and pestle. Apply the same cleaning procedure to the mortar and pestle as used for crucibles (Appendix B.3).
Appendix B.5. Loss on Ignition Procedure
Loss on Ignition (LOI) is the recommended method for citizen science applications. Organic matter is removed by combustion at high temperature, and the weight difference before and after combustion is used to calculate the organic matter content. This procedure follows Skjemstad and Baldock (2008) [65].
- 35.
- Weigh approximately 5.0 g of oven-dried, prepared soil into a pre-weighed clean crucible. Record the combined weight of the crucible and the dry soil.
- 36.
- Place the crucible in a cold muffle furnace or kiln. Raise the temperature slowly to 550 degrees Celsius and maintain for 4 h.
- 37.
- Switch off the furnace and allow it to cool to approximately 100 degrees Celsius before opening. Transfer the crucible to a desiccator and allow it to cool to room temperature.
- 38.
- Record the final weight of the crucible containing the ash residue.
Note: After combustion the soil color changes from dark brown or black to pale grey or reddish, indicating that all organic material has been removed.
Appendix B.6. Total Carbon Analyzer Procedure
This method uses a combustion-based analyzer to quantify total carbon, inorganic carbon (from minerals such as calcite), and by difference, total organic carbon. It provides greater precision than LOI but requires specialist equipment. This procedure follows Shimadzu Corporation (2018) [66].
- 39.
- Weigh 20 to 50 mg of dried, ground soil into a pre-cleaned ceramic boat.
- 40.
- If the soil is known or suspected to contain carbonates (inorganic calcium carbonate from limestone, shells, or calcareous parent material), wet the sample with a small volume of Phosphoric Acid (H3PO4, a food-grade acid also used as an acidulant in carbonated beverages) and heat at 200 degrees Celsius to remove inorganic carbon prior to the main combustion step.
- 41.
- Transfer the boat to the total carbon furnace at 900 degrees Celsius. All carbon is oxidized to CO2 and detected by an infrared sensor (NDIR).
- 42.
- Repeat the measurement three times per sample. Total Organic Carbon (TOC) is calculated as TOC = Total Carbon minus Inorganic Carbon.
Appendix B.7. Calculations
The following equations are applied automatically by appendix_B_calculations.py. Please refer to the supplementary materials.
Dry soil mass (g): Dry soil mass = (Crucible + dry soil weight) minus Empty crucible weight
Ash mass (g): Ash mass = (Crucible + ash weight) minus Empty crucible weight
Organic matter by LOI (%): OM (%) = [(Dry soil mass minus Ash mass) divided by Dry soil mass] × 100
Estimated soil organic carbon (%): SOC (%) = OM (%) divided by 1.724 (van Bemmelen factor; assumes organic matter is 58% carbon by mass)
Total organic carbon from analyzer (%): TOC (%) = TC (%) minus IC (%)
Appendix B.8. Interpretation of Results
Table A2 provides guidance for interpreting organic matter and organic carbon values.
Table A2.
Interpretation guidelines for Appendix B results.
Appendix C
Soil Microbial Decomposition Activity: Tea Bag Index Method.
Appendix C.1. Materials Required
| Item | Quantity/Size | Where to Obtain/Notes |
| Lipton green tea bags (Pyramid bags, EAN 8714100770542) | 10 per site | Order online from Dutch Expat Shop or equivalent. This exact product code is required for method standardization. |
| Lipton rooibos tea bags (Pyramid bags, EAN 8722700188438) | 10 per site | Order online alongside the green tea bags. |
| Seedling labels or plant stakes | 10 per site | Garden center |
| Small hand trowel | 1 | |
| Ruler | 1 | To check burial depth of 8 cm |
| Brightly colored ribbon or flagging tape | Several meters | Garden or hardware store; used to mark burial spots for retrieval 90 days later |
| Digital scale accurate to 0.001 g | 1 | This level of precision is essential for this method |
| Aluminum trays or ziplock bags | 10 per site | For drying and storing exhumed tea bags |
| Drying oven or sunny well-ventilated shelf | 1 | Set to 70 degrees Celsius for 48 h, or air-dry in direct sun for 72 h |
| Ziplock bags for soil samples | 2 per site | To collect approximately 500 g of soil at exhumation for laboratory analysis |
| Permanent marker and masking tape | 1 each | For labelling tea bags and containers clearly |
| Camera or smartphone | 1 | To photograph each burial site as a location record |
Appendix C.2. Overview and Scientific Rationale
Soil microbial decomposition is a fundamental soil ecological process that regulates carbon storage, nutrient cycling, and overall soil health (Glassman et al., 2018) [67]. It describes the breakdown of organic material by bacteria, fungi, and other soil organisms, releasing nutrients back into the soil and governing the long-term accumulation of soil organic matter. The process is sensitive to soil temperature, moisture, texture, and microbial community composition, making it a valuable early indicator of changes in soil condition (Jansson and Hofmockel, 2020) [68].
The Tea Bag Index (TBI) method, introduced by Keuskamp et al. (2013) [69], provides a standardized, low-cost approach to quantifying decomposition rates in the field using commercially available tea bags as a proxy for organic litter. Two complementary parameters are derived from the mass loss of two tea types buried in the soil for a defined period:
- -
- k: The decomposition rate constant, expressed in grams per day, calculated from the mass loss of rooibos tea.
- -
- S: The stabilization factor, a dimensionless index derived from the mass loss of green tea, representing the proportion of labile organic material that is protected from decomposition under the prevailing soil conditions.
The TBI has been applied across a wide range of environments internationally and is used in citizen science programs in Europe, North America, and Australia (Pino et al., 2021) [70]. It was selected for this methodology because of its accessibility, reproducibility, and well-documented relationship with soil physical and chemical properties.
Appendix C.3. Site Selection and Experimental Design
For each study location, two contrasting sites must be identified to allow comparison:
- -
- Managed site: an area subject to regular human disturbance, such as a cultivated garden bed, sports field, or tilled plot.
- -
- Unmanaged site: an area with comparatively intact soil and established native or semi-natural vegetation, subject to minimal disturbance.
This paired-site design allows the effect of management on soil biological activity to be assessed directly. At each site, the following descriptors must be recorded at the time of burial: degree of human impact, shading, dominant vegetation type, slope aspect, estimated soil texture class (see Appendix D), estimated rooting depth, visible macrofauna (for example, earthworms, beetles, or ants), and soil pH (see Appendix A).
Appendix C.4. Pre-Burial Weighing
- 43.
- Remove each tea bag carefully from its outer wrapping without tearing the bag or disturbing the contents.
- 44.
- Weigh each tea bag individually and record the initial weight to the nearest 0.001 g.
- 45.
- Using masking tape on the string of each bag, write the replicate number (1 to 5), the site identifier (M for managed, U for unmanaged), and the tea type (G for green, R for rooibos).
- 46.
- Pair each green tea bag with one rooibos tea bag bearing the same replicate number and site identifier. Each paired replicate must remain traceable throughout the entire incubation period (Keuskamp et al., 2013) [69].
Appendix C.5. Burial Procedure
- 47.
- Using a trowel, create a narrow hole 8 cm deep at each burial point.
- 48.
- Place the tea bag horizontally in the hole so that it is in full contact with the mineral soil. Leave the label stake above the soil surface.
- 49.
- Bury five green bags and five rooibos bags at each site, spaced approximately 15 cm apart.
- 50.
- Mark each burial point with a brightly coloured ribbon or flagging tape tied to the label stake. A reliable labelling system is essential for successful retrieval after 90 days (Pino et al., 2021) [70].
- 51.
- Photograph the burial area to provide a permanent location record.
- 52.
- Record the burial date. The standard incubation period is 90 days. A minimum of 60 days is acceptable if site access or logistical constraints prevent recovery at the standard time. All replicates at a given location must be buried on the same date (Keuskamp et al., 2013) [69].
Note: In the Southern Hemisphere school calendar, burial in September (early spring) allows recovery before the end of the school year in late November or December.
Appendix C.6. Exhumation and Post-Burial Weighing
- 53.
- Carefully excavate each tea bag using a trowel. Do not tear the bag or compress its contents.
- 54.
- Remove loose soil, roots, and adhering debris from the exterior of the bag without opening it or squeezing the contents.
- 55.
- Place each bag in a labelled aluminum tray or ziplock bag.
- 56.
- Dry the bags in an oven at 70 degrees Celsius for 48 h, or place them in a sunny, well-ventilated location for 72 h.
- 57.
- Once dry, weigh each bag to the nearest 0.001 g. Include the string and label in the weight if still attached. If the string or label has decomposed, apply a standard tare correction: 0.22 g for the label stake and 0.02 g for the string (Keuskamp et al., 2013) [69].
- 58.
- Simultaneously collect a soil sample of approximately 500 g from within 5 cm of the burial zone at each site. Store in a labelled ziplock bag for laboratory analysis of particle size distribution (clay, silt, and sand proportions), soil organic carbon, electrical conductivity, and pH.
Appendix C.7. Calculation of TBI Parameters
The following calculations are applied automatically by appendix_C_calculations.py. Please refer to the supplementary materials. The underlying equations follow Keuskamp et al. (2013) [69].
Appendix C.7.1. Stabilization Factor (S) from Green Tea
The stabilization factor S represents the proportion of the labile (easily decomposable) fraction of the green tea that has been protected from decomposition by the soil environment. It is calculated as:
where ag is the decomposable fraction of the green tea bag (calculated as the mass lost divided by the initial mass), and Hg is the hydrolysable fraction of Lipton green tea (a fixed constant of 0.842 determined by Keuskamp et al., 2013) [69]. S is constrained to the range 0 to 1.
S = 1 minus (ag divided by Hg)
Appendix C.7.2. Decomposable Fraction of Rooibos Tea (ar)
ar = Hr × (1 minus S)
Appendix C.7.3. Decomposition Rate Constant (k) from Rooibos Tea
k = minus ln[(Wr(t) divided by Wi minus (1 minus ar)) divided by ar] divided by t
Appendix C.8. Statistical Analysis
Prior to analysis, data should be assessed for normality using the Shapiro–Wilk test (Shapiro and Wilk, 1965) [71]. Where normality cannot be assumed, relationships between TBI parameters and soil properties should be assessed using the Spearman rank correlation coefficient (rs). Mean k and S values are calculated from three to five valid paired replicates. Any replicate for which either the green or rooibos bag cannot be recovered must be excluded from calculations (Pino et al., 2021) [70].
Appendix C.9. Interpretation of Results
Table A3 provides guidance for interpreting TBI parameters. It is essential that k and S are interpreted together; neither parameter is meaningful in isolation.
Table A3.
Interpretation guidelines for Tea Bag Index parameters.
Appendix D
Soil Texture Determination: Ribboning Technique.
Appendix D.1. Materials Required
| Item | Quantity/Size | Where to Obtain/Notes |
| Small spray bottle or cup of water | 1 | To moisten the soil sample |
| Ruler marked in millimeters | 1 | To measure ribbon length accurately |
| Notepad and pen | 1 | To record results in the field immediately |
| Small trowel or spoon | 1 | To collect soil from each layer of the profile |
| Damp cloth or moist wipes | Several | To clean hands between samples |
Appendix D.2. Overview and Scientific Rationale
Soil texture refers to the relative proportions of sand, silt, and clay particles in a soil sample. These three mineral fractions are defined by their particle size: sand ranges from 0.02 to 2.0 mm in diameter, silt from 0.002 to 0.02 mm, and clay below 0.002 mm (Agriculture NSW Water Unit, 2014) [72]. Texture is a fundamental soil physical property that governs water retention, hydraulic conductivity, nutrient-holding capacity, aeration, and workability. It also directly influences microbial decomposition rates: clay particles physically protect organic material from microbial attack, which is reflected in the significant negative correlation between clay content and the TBI decomposition rate constant k reported by Pino et al. (2021) [70].
The ribboning technique provides a rapid, field-based estimate of soil texture by exploiting the mechanical properties of moist soil. It requires no equipment beyond water and a ruler, produces reproducible results with practice, and is well-suited for use alongside the other methods described in this protocol. Each soil texture class corresponds to a characteristic range of ribbon lengths and tactile properties (Agriculture NSW Water Unit, 2014) [72].
Appendix D.3. Procedure
The test should be performed separately on soil collected from each identifiable layer within the soil profile. A minimum of three ribbon attempts per sample is required to produce a reliable average.
- 59.
- Collect a soil sample approximately the size of a golf ball from the layer to be tested.
- 60.
- Add water a few drops at a time and knead the soil firmly until it forms a cohesive moist ball. If the soil cannot be formed into a ball under any circumstances, classify the texture as Sand.
- 61.
- Assess the tactile properties of the ball. A predominantly gritty feel (similar to fine sandpaper) indicates a sand-dominated texture. A smooth, silky feel (similar to flour) indicates a silt-dominated texture. A sticky, plastic, or deformable feel (similar to modelling clay) indicates a clay-dominated texture. Record this observation.
- 62.
- Re-form the ball and hold it between the thumb and forefinger. Apply steady forward pressure with the thumb to extrude a ribbon of soil over the forefinger. Maintain even pressure and allow the ribbon to extend as far as possible before it fractures.
- 63.
- Measure the length of the ribbon in millimeters using a ruler. Record this length.
- 64.
- Repeat Steps 1 to 5 at least three times using the same sample. Calculate the average ribbon length.
- 65.
- Compare the average ribbon length and the recorded feel characteristics to Table A4 to determine the soil texture class.
Note: Calibration practice is recommended before field use. Modelling clay produces a ribbon in excess of 100 mm (Heavy Clay). Dry builder sand produces no ribbon (Sand). These reference materials provide a useful comparison for new practitioners.
Appendix D.4. Texture Classification
Table A4 presents the texture classification system used in this protocol, adapted from Agriculture NSW Water Unit (2014) [72]. Each class is defined by a characteristic ribbon length range and associated tactile properties.
Table A4.
Soil texture classification by ribbon length and feel characteristics.
Appendix D.5 Interpretation of Results
Table A5 summarises the practical and analytical implications of each texture group, including expected relationships with results from the other appendices.
Table A5.
Interpretation guidelines for soil texture and connections to other measured parameters.
Appendix D.6. Connections to Other Appendices
Soil texture links directly to all other measurements described in this protocol. Increased clay content reduces hydraulic conductivity (Appendix A, Appendix A.4) and increases moisture retention (Appendix A, Appendix A.5). Fine-textured soils tend to accumulate higher levels of organic matter (Appendix B) because clay physically binds and protects organic compounds from microbial breakdown. This same protective mechanism reduces the TBI decomposition rate constant k (Appendix C), meaning that soils with high clay content will typically show lower k values than sandy soils under otherwise comparable conditions (Pino et al., 2021) [70]. Recording texture class from the ribbon test therefore provides essential context for interpreting results from all other appendices and should be reported alongside all measurements.
Appendix E. Examples of Community Engagement Activity at the Five Rivers Microforest
At the Five Rivers Environmental Education Center, educational programming strongly influenced site design. Because the microforest is located within an environmental education center that hosts school groups and thousands of visitors annually, the site was designed as both a restoration project and an outdoor classroom. An ADA-accessible trail passes through the planting, providing year-round access for visitors. A designated classroom area adjacent to the trail was intentionally left unplanted to accommodate educational programming and group instruction. Interpretive signage (Figure A1 below) welcomes visitors to the microforest, explains the principles of the Miyawaki Method, and highlights the ecological benefits of afforestation. Environmental educators at Five Rivers will incorporate the microforest into existing educational programming for schools and public visitors, while community service events will provide ongoing opportunities for volunteer maintenance and stewardship.
Figure A1.
Sign at Five Rivers. Reprinted with permission from New York State Department of Environmental Conservation (2025). Copyright (2025) New York State Department of Environmental Conservation.
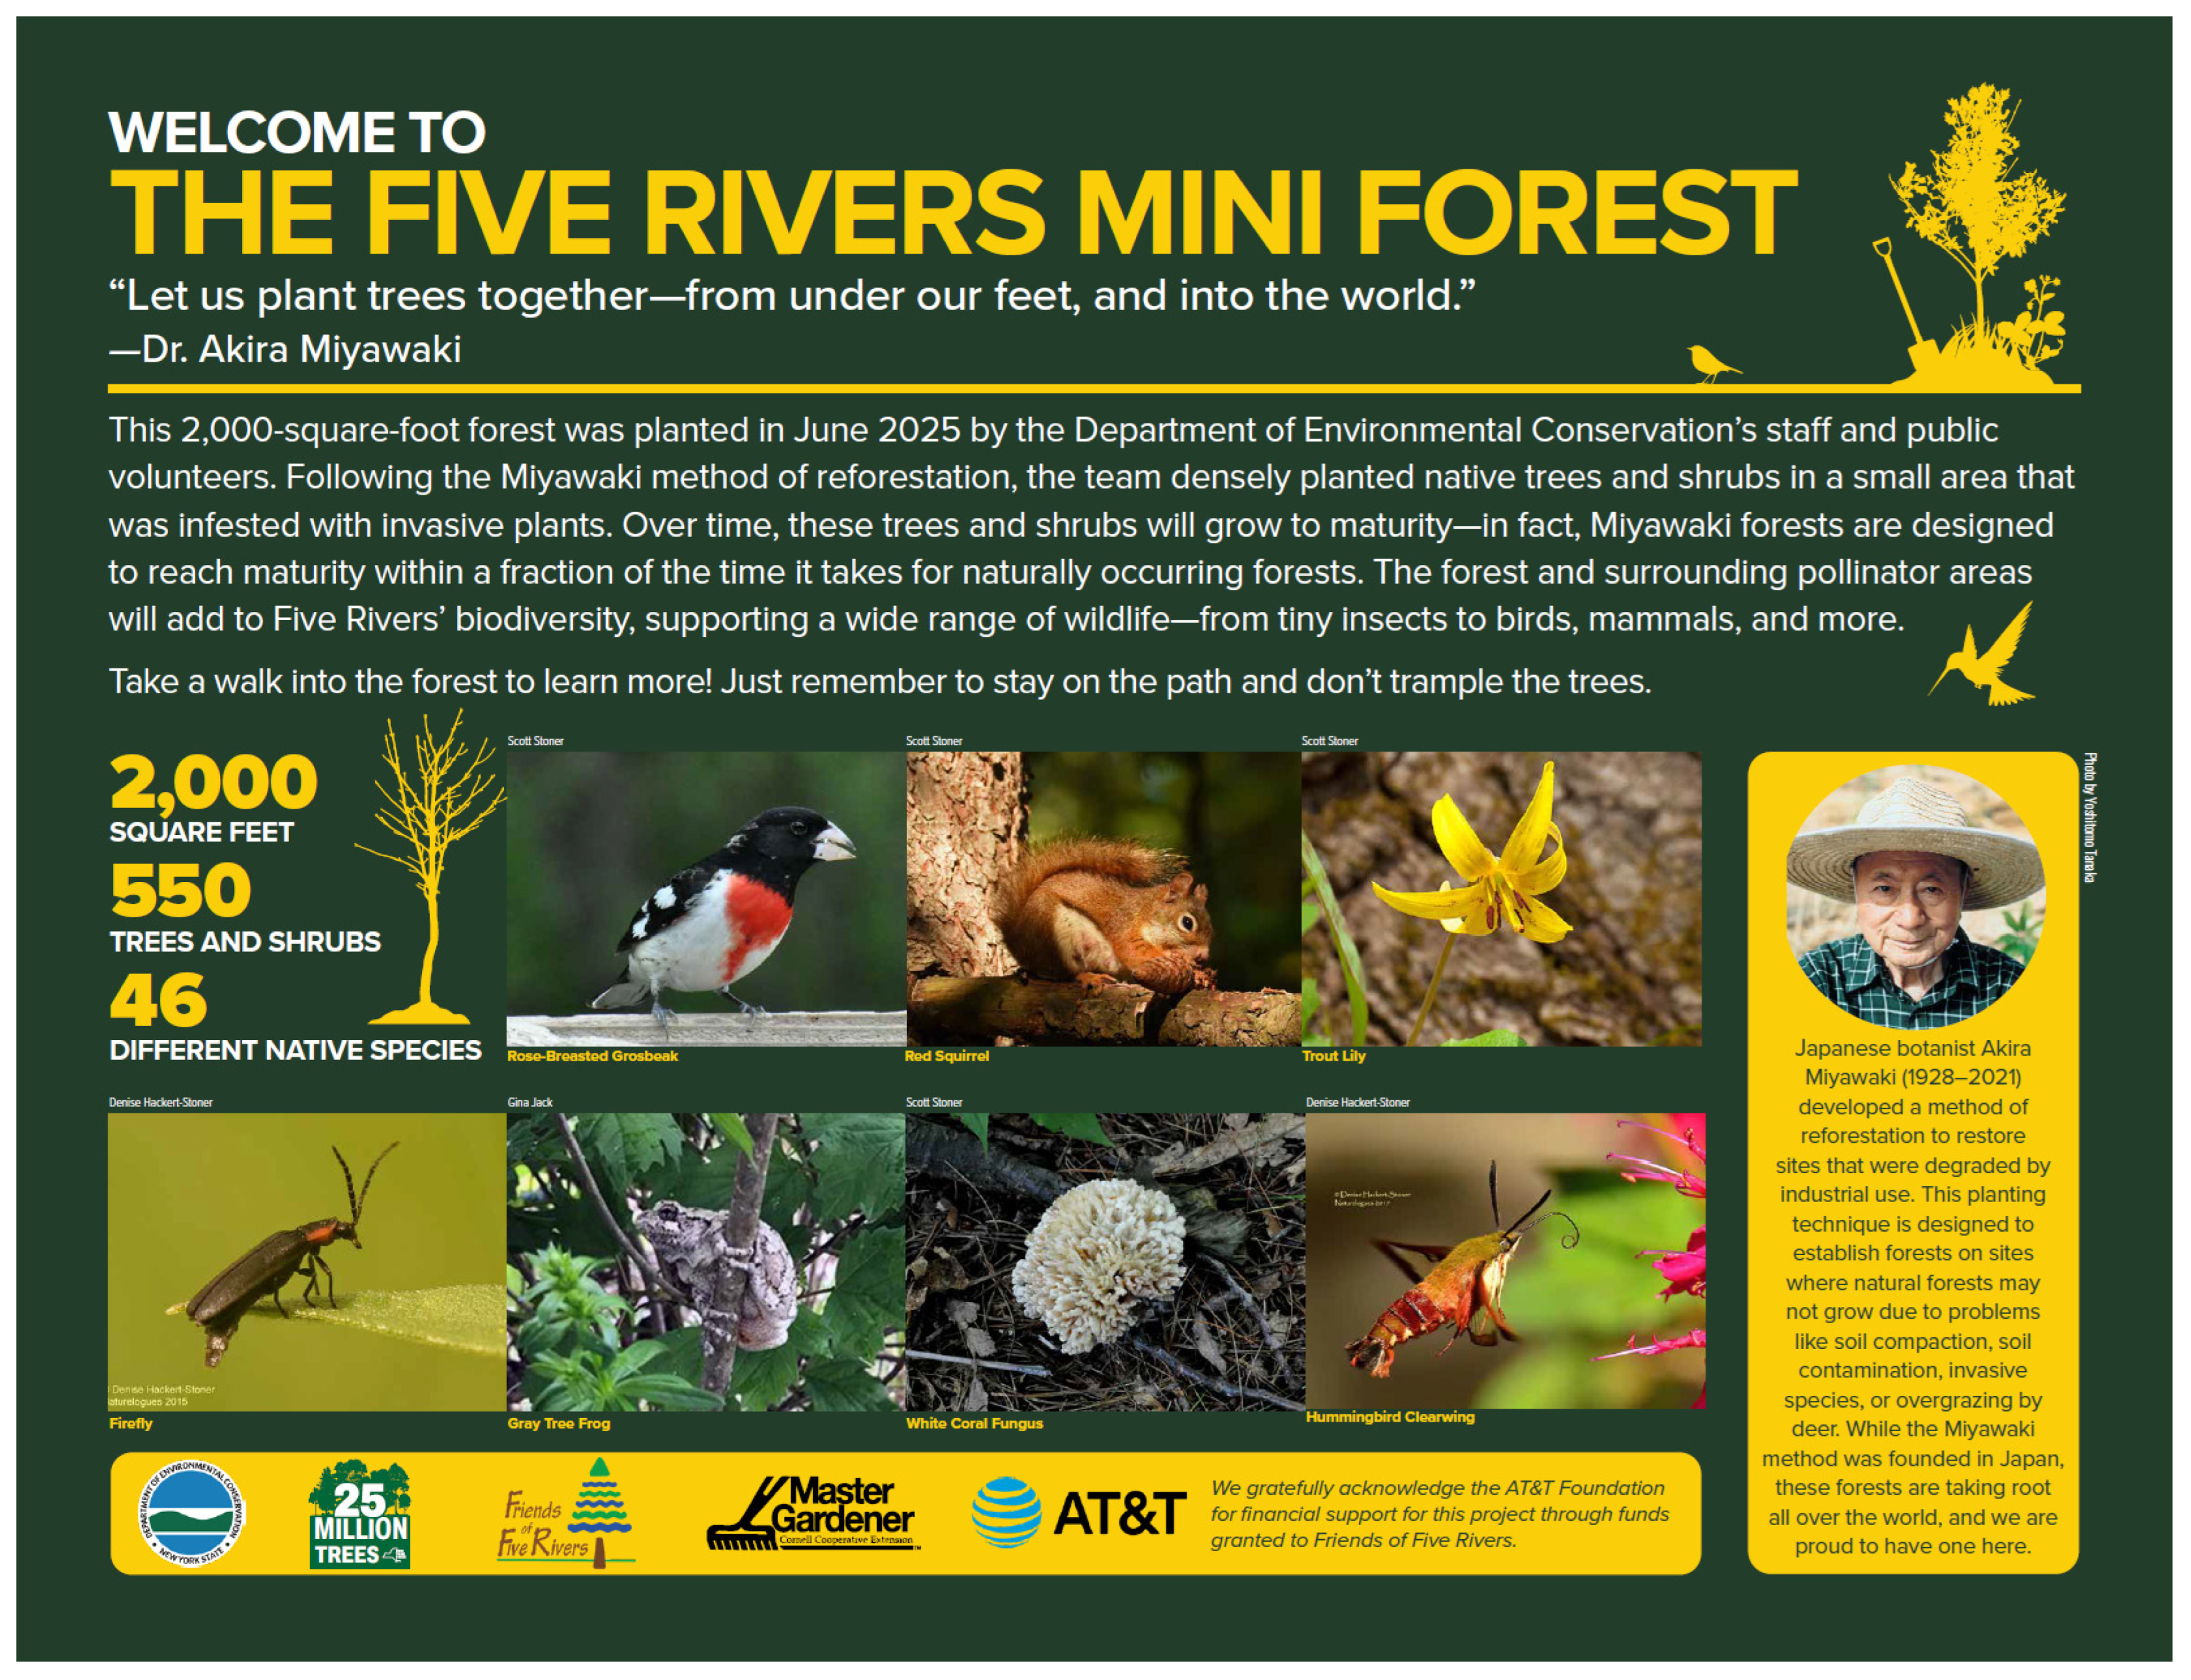
The permanent photographic monitoring stations (“selfie stands”) at the Five Rivers microforest encourages continued public participation while documenting forest development. Visitors are invited to photograph the microforest from a standardized location and submit images with the date and time of collection. These photographs will be compiled into a publicly accessible chronological archive hosted by the New York State Department of Environmental Conservation, allowing community members to visually document changes in forest structure over time. Beyond providing a visual record of ecological succession, the photo-monitoring program offers a simple form of citizen science that encourages repeated visitation and sustained engagement with the project.
Figure A2.
Shaded yellow section represents where future “outdoor classroom” will be constructed, including a large educational sign and seating. Collectively, these educational features, stewardship opportunities, and citizen science initiatives demonstrate that community engagement can be intentionally incorporated into microforest design rather than treated as a separate outreach activity following project completion.
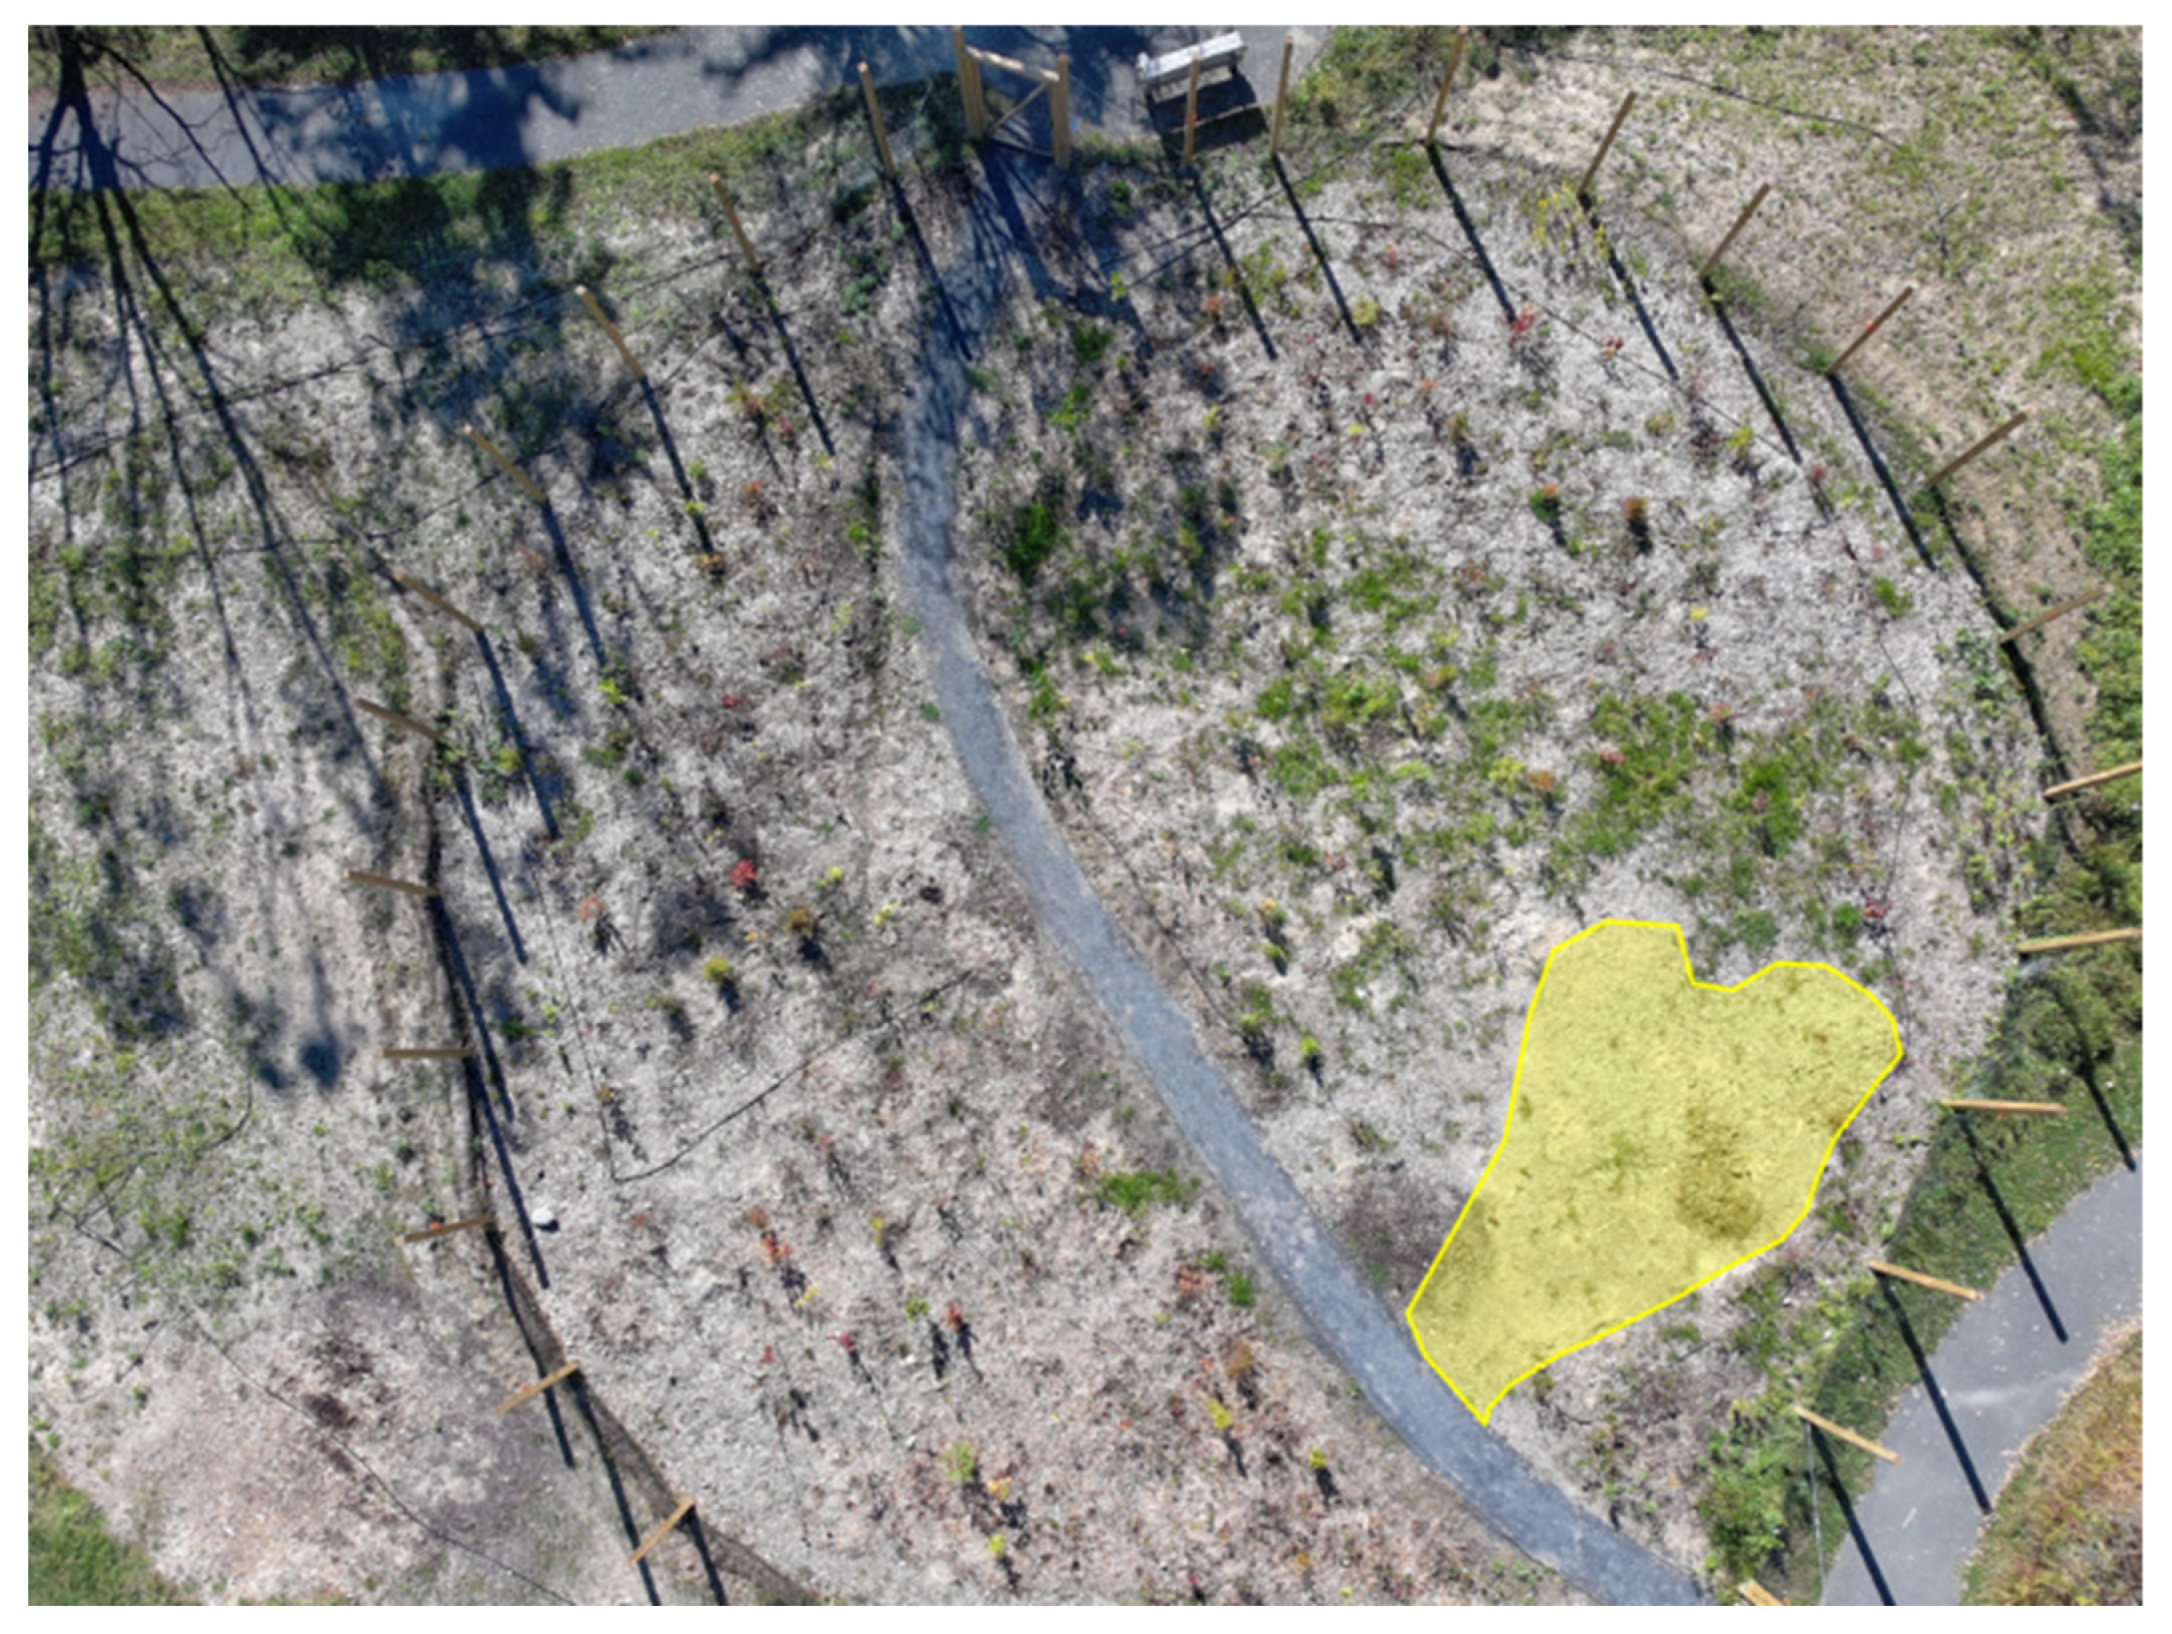
References
- Zhang, W.; Villarini, G.; Vecchi, G.A.; Smith, J.A. Urbanization Exacerbated the Rainfall and Flooding Caused by Hurricane Harvey in Houston. Nature 2018, 563, 384–388. [Google Scholar] [CrossRef] [Scilit] [PubMed]
- Ulpiani, G. On the Linkage between Urban Heat Island and Urban Pollution Island: Three-Decade Literature Review towards a Conceptual Framework. Sci. Total Environ. 2021, 751, 141727. [Google Scholar] [CrossRef] [Scilit] [PubMed]
- Chakraborty, T.; Lee, X. A Simplified Urban-Extent Algorithm to Characterize Surface Urban Heat Islands on a Global Scale and Examine Vegetation Control on Their Spatiotemporal Variability. Int. J. Appl. Earth Obs. Geoinf. 2019, 74, 269–280. [Google Scholar] [CrossRef] [Scilit]
- Simkin, R.D.; Seto, K.C.; McDonald, R.I.; Jetz, W. Biodiversity Impacts and Conservation Implications of Urban Land Expansion Projected to 2050. Proc. Natl. Acad. Sci. USA 2022, 119, e2117297119. [Google Scholar] [CrossRef] [Scilit] [PubMed]
- Qi, H.; Dempsey, N.; Cameron, R. Seeing the Forest for the Trees? An Exploration of the Miyawaki Forest Method in the UK. Arboric. J. 2024, 46, 292–304. [Google Scholar] [CrossRef] [Scilit]
- Miyawaki, A. Restoration of Living Environment Based on Vegetation Ecology: Theory and Practice. Ecol. Res. 2004, 19, 83–90. [Google Scholar] [CrossRef] [Scilit]
- Lewis, H. Mini-Forest Revolution: Using the Miyawaki Method to Rapidly Rewild the World; Chelsea Green Publishing: White River Junction, VT, USA, 2022. [Google Scholar]
- Earthwatch Europe. Available online: https://earthwatch.org.uk/ (accessed on 26 June 2026).
- Miyawaki, A.; Golley, F.B. Forest Reconstruction as Ecological Engineering. Ecol. Eng. 1993, 2, 333–345. [Google Scholar] [CrossRef] [Scilit]
- Ospina Parra, A.F.; Evangelista, J.; Shebitz, D.J. The Root of Urban Renewal: Linking Miyawaki Afforestation to Soil Recovery. Land 2025, 15, 84. [Google Scholar] [CrossRef] [Scilit]
- Morales, N.S.; Fernández, I.C.; Durán, L.; Craven, D. Tiny Forests, Huge Claims: The Evidence Gap behind the Miyawaki Method for Forest Restoration. J. Appl. Ecol. 2025, 63, e70242. [Google Scholar] [CrossRef] [Scilit]
- Clergeau, P. Biodiversité et Urbanisme. Bull. Académie Vét. Fr. 2019, 172, 63–68. [Google Scholar] [CrossRef] [Scilit]
- Fratini, F. Integrating Green and Social Infrastructure: The Microforest Social Hub in Rome. Acad. Environ. Sci. Sustain. 2026, 3. [Google Scholar] [CrossRef] [Scilit]
- Biodiverse Pocket Forests by SUGi|Urban Nature Restoration. Available online: https://www.sugiproject.com/ (accessed on 26 June 2026).
- Oldfield, E.E.; Felson, A.J.; Auyeung, D.S.N.; Crowther, T.W.; Sonti, N.F.; Harada, Y.; Maynard, D.S.; Sokol, N.W.; Ashton, M.S.; Warren, R.J.; et al. Growing the Urban Forest: Tree Performance in Response to Biotic and Abiotic Land Management. Restor. Ecol. 2015, 23, 707–718. [Google Scholar] [CrossRef] [Scilit]
- Pregitzer, C.C.; Ashton, M.S.; Charlop-Powers, S.; D’Amato, A.W.; Frey, B.R.; Gunther, B.; Hallett, R.A.; Pregitzer, K.S.; Woodall, C.W.; Bradford, M.A. Defining and Assessing Urban Forests to Inform Management and Policy. Environ. Res. Lett. 2019, 14, 085002. [Google Scholar] [CrossRef] [Scilit]
- Corona, P. Consolidating New Paradigms in Large-Scale Monitoring and Assessment of Forest Ecosystems. Environ. Res. 2016, 144, 8–14. [Google Scholar] [CrossRef] [Scilit] [PubMed]
- Nielsen, A.B.; van den Bosch, M.; Maruthaveeran, S.; van den Bosch, C.K. Species Richness in Urban Parks and Its Drivers: A Review of Empirical Evidence. Urban Ecosyst. 2014, 17, 305–327. [Google Scholar] [CrossRef] [Scilit]
- Vieira, J.; Matos, P.; Mexia, T.; Silva, P.; Lopes, N.; Freitas, C.; Correia, O.; Santos-Reis, M.; Branquinho, C.; Pinho, P. Green Spaces Are Not All the Same for the Provision of Air Purification and Climate Regulation Services: The Case of Urban Parks. Environ. Res. 2018, 160, 306–313. [Google Scholar] [CrossRef] [Scilit] [PubMed]
- Shandas, V.; Voelkel, J.; Williams, J.; Hoffman, J. Integrating Satellite and Ground Measurements for Predicting Locations of Extreme Urban Heat. Climate 2019, 7, 5. [Google Scholar] [CrossRef] [Scilit]
- Reis, C.; Lopes, A. Evaluating the Cooling Potential of Urban Green Spaces to Tackle Urban Climate Change in Lisbon. Sustainability 2019, 11, 2480. [Google Scholar] [CrossRef] [Scilit]
- Zhu, X.; Zhang, T.; Gao, W.; Mei, D. Analysis on Spatial Pattern and Driving Factors of Carbon Emission in Urban–Rural Fringe Mixed-Use Communities: Cases Study in East Asia. Sustainability 2020, 12, 3101. [Google Scholar] [CrossRef] [Scilit]
- Issa Zadeh, S.B.; Garay-Rondero, C.L. Enhancing Urban Sustainability: Unravelling Carbon Footprint Reduction in Smart Cities through Modern Supply-Chain Measures. Smart Cities 2023, 6, 3225–3250. [Google Scholar] [CrossRef] [Scilit]
- Zheng, B.; Zhao, R.; Yang, R.; Wang, Y.; Yu, R.; Wang, H.; He, F.; Kang, J. Urban Green Infrastructure Delivers Carbon Benefits Primarily through Microclimate Cooling. Resour. Environ. Sustain. 2026, 25, 100338. [Google Scholar] [CrossRef] [Scilit]
- Wolf, K.L.; Lam, S.T.; McKeen, J.K.; Richardson, G.R.A.; Van Den Bosch, M.; Bardekjian, A.C. Urban Trees and Human Health: A Scoping Review. Int. J. Environ. Res. Public. Health 2020, 17, 4371. [Google Scholar] [CrossRef] [Scilit] [PubMed]
- Zulian, G.; Marando, F.; Mentaschi, L.; Alzetta, C.; Wilk, B.; Maes, J. Green Balance in Urban Areas as an Indicator for Policy Support: A Multi-Level Application. One Ecosyst. 2022, 7, e72685. [Google Scholar] [CrossRef] [Scilit]
- Ahmad, N.; Hassan, Q. Ecosystem Services Linked to Nature-Based Solutions for Resilient and Sustainable Cities in India. Front. Water 2025, 6, 1504492. [Google Scholar] [CrossRef] [Scilit]
- Arthur, N.; Hack, J. A Multiple Scale, Function, and Type Approach to Determine and Improve Green Infrastructure of Urban Watersheds. Urban For. Urban Green. 2022, 68, 127459. [Google Scholar] [CrossRef] [Scilit]
- Guo, X.F. Effects of Different Forest Reconstruction Methods on Characteristics of Understory Vegetation and Soil Quality. Appl. Ecol. Environ. Res. 2018, 16, 7501–7517. [Google Scholar] [CrossRef] [Scilit]
- Filazzola, A.; Shrestha, N.; MacIvor, J.S. The Contribution of Constructed Green Infrastructure to Urban Biodiversity: A Synthesis and Meta-Analysis. J. Appl. Ecol. 2019, 56, 2131–2143. [Google Scholar] [CrossRef] [Scilit]
- Norton, B.A.; Evans, K.L.; Warren, P.H. Urban Biodiversity and Landscape Ecology: Patterns, Processes and Planning. Curr. Landsc. Ecol. Rep. 2016, 1, 178–192. [Google Scholar] [CrossRef] [Scilit]
- Ruangpan, L.; Vojinovic, Z.; Di Sabatino, S.; Leo, L.S.; Capobianco, V.; Oen, A.M.P.; McClain, M.E.; Lopez-Gunn, E. Nature-Based Solutions for Hydro-Meteorological Risk Reduction: A State-of-the-Art Review of the Research Area. Nat. Hazards Earth Syst. Sci. 2020, 20, 243–270. [Google Scholar] [CrossRef] [Scilit]
- Zabelskyte, G.; Kabisch, N.; Stasiskiene, Z. Patterns of Urban Green Space Use Applying Social Media Data: A Systematic Literature Review. Land 2022, 11, 238. [Google Scholar] [CrossRef] [Scilit]
- Gaudereto, G.L.; Gallardo, A.L.C.F.; Ferreira, M.L.; do Nascimento, A.P.B.; Mantovani, W. Evaluation of Ecosystem Services and Management of Urban Green Areas: Promoting Healthy and Sustainable Cities. Ambiente Soc. 2018, 21, e01203. [Google Scholar] [CrossRef] [Scilit]
- Elliott, S.; Chairuangsri, S.; Kuaraksa, C.; Sangkum, S.; Sinhaseni, K.; Shannon, D.; Nippanon, P.; Manohan, B. Collaboration and Conflict—Developing Forest Restoration Techniques for Northern Thailand’s Upper Watersheds Whilst Meeting the Needs of Science and Communities. Forests 2019, 10, 732. [Google Scholar] [CrossRef] [Scilit]
- Narraway, C.L.; van Remortel, E.; Cowling, S.B.; Kumar, D.; Mroczka, H.; Rudzinskaite, E.; Sturgeon, G.; Woods, S.; Hayhow, D.B. Saplings of Significance: Nurturing Cultural Value of New Tree Plantings through Participatory Opportunities. People Nat. 2025, 8, 1536–1555. [Google Scholar] [CrossRef] [Scilit]
- Arnstein, S.R. A Ladder of Citizen Participation. J. Am. Inst. Plan. 1969, 35, 216–224. [Google Scholar] [CrossRef] [Scilit]
- Gearin, E.; Hurt, C.S. Making Space: A New Way for Community Engagement in the Urban Planning Process. Sustainability 2024, 16, 2039. [Google Scholar] [CrossRef] [Scilit]
- Lauria, M.; Slotterback, C.S. Institutionalizing Public Engagement in Context. In Learn. Arnstein’s Ladder; Routledge: London, UK, 2020; pp. 11–12. [Google Scholar] [CrossRef] [Scilit]
- Biehler, D.; LaDeau, S.; Baker, J.; Bode-George, Y.; Pitas, J.H.; Jordan, R.C.; Leisnham, P.; Wilson, S. Segregation Histories, Wealth, and Community Engagement Shape Inequitable Burdens of Urban Greening. Ann. Am. Assoc. Geogr. 2024, 115, 513–534. [Google Scholar] [CrossRef] [Scilit]
- Lafortezza, R.; Chen, J.; van den Bosch, C.K.; Randrup, T.B. Nature-Based Solutions for Resilient Landscapes and Cities. Environ. Res. 2018, 165, 431–441. [Google Scholar] [CrossRef] [Scilit] [PubMed]
- Bruns, M.; Bleichrodt, D.; Laine, E.; van Toor, K.; Dieho, W.; Postma, L.; de Groot, M. Handbook: Tiny Forest Planting Method; IVN Natuureducatie: Amsterdam, The Netherlands, 2019. [Google Scholar]
- Calabi, P. Creating a Miyawaki Forest 2025. Available online: https://wfmchub.org/growlocal/ (accessed on 1 September 2026).
- Boehme, S.E.; Panero, M.A.; Muñoz, G.R.; Powers, C.W.; Valle, S.N. Collaborative Problem Solving Using an Industrial Ecology Approach: The New York/New Jersey Harbor Economy-Wide Substance Flow Case Studies. J. Ind. Ecol. 2009, 13, 811–829. [Google Scholar] [CrossRef] [Scilit]
- Wieczerak, T.; Lal, P.; Witherell, B.; Oluoch, S. Public Preferences for Green Infrastructure Improvements in Northern New Jersey: A Discrete Choice Experiment Approach. SN Soc. Sci. 2022, 2, 15. [Google Scholar] [CrossRef] [Scilit] [PubMed]
- Groundwork USA. Available online: https://groundworkusa.org/ (accessed on 26 June 2026).
- USDA Natural Resources Conservation Service Boonton Series. Available online: https://soilseries.sc.egov.usda.gov/OSD_Docs/B/Boonton.html (accessed on 24 June 2026).
- New York Flora Atlas|NYFA. Available online: https://nyflora.org/new-york-flora-atlas/ (accessed on 24 June 2026).
- Roman, L.A.; Pearsall, H.; Eisenman, T.S.; Conway, T.M.; Fahey, R.T.; Landry, S.; Vogt, J.; Van Doorn, N.S.; Grove, J.M.; Locke, D.H.; et al. Human and Biophysical Legacies Shape Contemporary Urban Forests: A Literature Synthesis. Urban For. Urban Green. 2018, 31, 157–168. [Google Scholar] [CrossRef] [Scilit]
- Roman, L.A.; Scatena, F.N. Street Tree Survival Rates: Meta-Analysis of Previous Studies and Application to a Field Survey in Philadelphia, PA, USA. Urban For. Urban Green. 2011, 10, 269–274. [Google Scholar] [CrossRef] [Scilit]
- Biodiversity-Ground-Dwellers-MG-AUS. Available online: https://tinyforest.earthwatch.org.uk/images/resources/Biodiversity-Ground-Dwellers-MG.pdf (accessed on 1 September 2026).
- Pino, V.; McBratney, A.; O’Brien, E.; Singh, K.; Pozza, L. Citizen Science & Soil Connectivity: Where Are We? Soil Secur. 2022, 9, 100073. [Google Scholar] [CrossRef] [Scilit]
- Almeida, C.R.d.; Teodoro, A.C.; Gonçalves, A. Study of the Urban Heat Island (UHI) Using Remote Sensing Data/Techniques: A Systematic Review. Environments 2021, 8, 105. [Google Scholar] [CrossRef] [Scilit]
- Shi, R.; Hobbs, B.F.; Zaitchik, B.F.; Waugh, D.W.; Scott, A.A.; Zhang, Y. Monitoring Intra-Urban Temperature with Dense Sensor Networks: Fixed or Mobile? An Empirical Study in Baltimore, MD. Urban Clim. 2021, 39, 100979. [Google Scholar] [CrossRef] [Scilit]
- Petri, A.C.; Wilson, B.; Koeser, A. Planning the Urban Forest: Adding Microclimate Simulation to the Planner’s Toolkit. Land Use Policy 2019, 88, 104117. [Google Scholar] [CrossRef] [Scilit]
- FLIR C5 Compact Thermal Camera. Available online: https://www.flir.com/products/c5/ (accessed on 26 June 2026).
- Sagan, V.; Maimaitijiang, M.; Sidike, P.; Eblimit, K.; Peterson, K.T.; Hartling, S.; Esposito, F.; Khanal, K.; Newcomb, M.; Pauli, D.; et al. UAV-Based High Resolution Thermal Imaging for Vegetation Monitoring, and Plant Phenotyping Using ICI 8640 P, FLIR Vue Pro R 640, and thermoMap Cameras. Remote Sens. 2019, 11, 330. [Google Scholar] [CrossRef] [Scilit]
- Gibbons, K. Combating the Heat Island Effect with Drone-Based Thermal Visualization. J. Urban Aff. 2025, 48, 1–10. [Google Scholar] [CrossRef] [Scilit]
- The Economic Case for Microforests—Groundwork USA. Available online: https://groundworkusa.org/the-economic-case-for-microforests/ (accessed on 24 June 2026).
- Karvonen, J.; Myllyviita, T. Evaluating the sustainability of Sphagnum moss harvesting or farming versus horticultural peat using a multi-criteria decision framework. Environ. Chall. 2026, 22, 101445. [Google Scholar] [CrossRef] [Scilit]
- Schumann, M. A Tree-Planting Initiative Brings Hundreds Together to Transform Underused Campus Land into a Fast-Growing Native Ecosystem. Available online: https://www.rutgers.edu/news/rutgers-forest-takes-root-where-road-once-ran (accessed on 16 August 2026).
- Arcadia News. Planting a Forest with the Climate in Mind. Mass Audubon, 20 July 2021. Available online: https://www.massaudubon.org/places-to-explore/wildlife-sanctuaries/arcadia/news/planting-a-forest-with-the-climate-in-mind (accessed on 16 August 2026).
- Miyawaki, A. Restoration of urban green environments based on the theories of vegetation ecology. Ecol. Eng. 1998, 11, 157–165. [Google Scholar] [CrossRef] [Scilit]
- ASTM D5084; Standard Test Methods for Measurement of Hydraulic Conductivity of Saturated Porous Materials Using a Flexible Wall Permeameter. ASTM International: West Conshohocken, PA, USA, 2024.
- Skjemstad, J.O.; Baldock, J.A. Total and organic carbon. In Soil Sampling and Methods of Analysis, 2nd ed.; Carter, M.R., Gregorich, E.G., Eds.; CRC Press: Boca Raton, FL, USA, 2008; pp. 225–237. [Google Scholar]
- Shimadzu Corporation. TOC Application Handbook: Sum Parameter (Release 4); Shimadzu Corporation: Kyoto, Japan, 2018. [Google Scholar]
- Glassman, S.I.; Weihe, C.; Li, J.; Albright, M.B.N.; Looby, C.I.; Martiny, A.C.; Treseder, K.K.; Allison, S.D.; Martiny, J.B.H. Decomposition responses to climate depend on microbial community composition. Proc. Natl. Acad. Sci. USA 2018, 115, 11994–11999. [Google Scholar] [CrossRef] [Scilit] [PubMed]
- Jansson, J.K.; Hofmockel, K.S. Soil microbiomes and climate change. Nat. Rev. Microbiol. 2020, 18, 35–46. [Google Scholar] [CrossRef] [Scilit] [PubMed]
- Keuskamp, J.A.; Dingemans, B.J.J.; Lehtinen, T.; Sarneel, J.M.; Hefting, M.M. Tea Bag Index: A novel approach to collect uniform decomposition data across ecosystems. Methods Ecol. Evol. 2013, 4, 1070–1075. [Google Scholar] [CrossRef] [Scilit]
- Pino, V.; McBratney, A.; O’Brien, E.; Ng, W. Boosting soil citizen-science using Tea Bag Index method towards soil security in Australia. Soil Secur. 2021, 5, 100016. [Google Scholar] [CrossRef] [Scilit]
- Shapiro, S.S.; Wilk, M.B. An analysis of variance test for normality (complete samples). Biometrika 1965, 52, 591–611. [Google Scholar] [CrossRef] [Scilit]
- Agriculture NSW Water Unit. Determining soil texture using the ribboning technique. In Primefact 1363, 1st ed.; NSW Department of Primary Industries: Sydney, Australia, 2014. [Google Scholar]
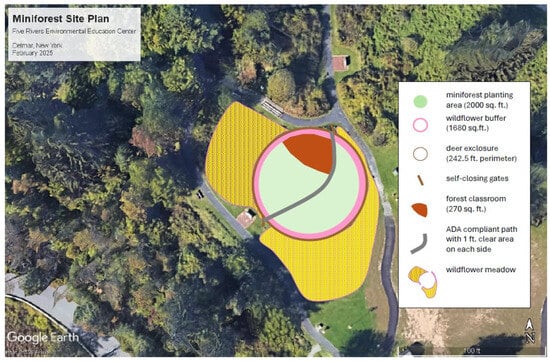
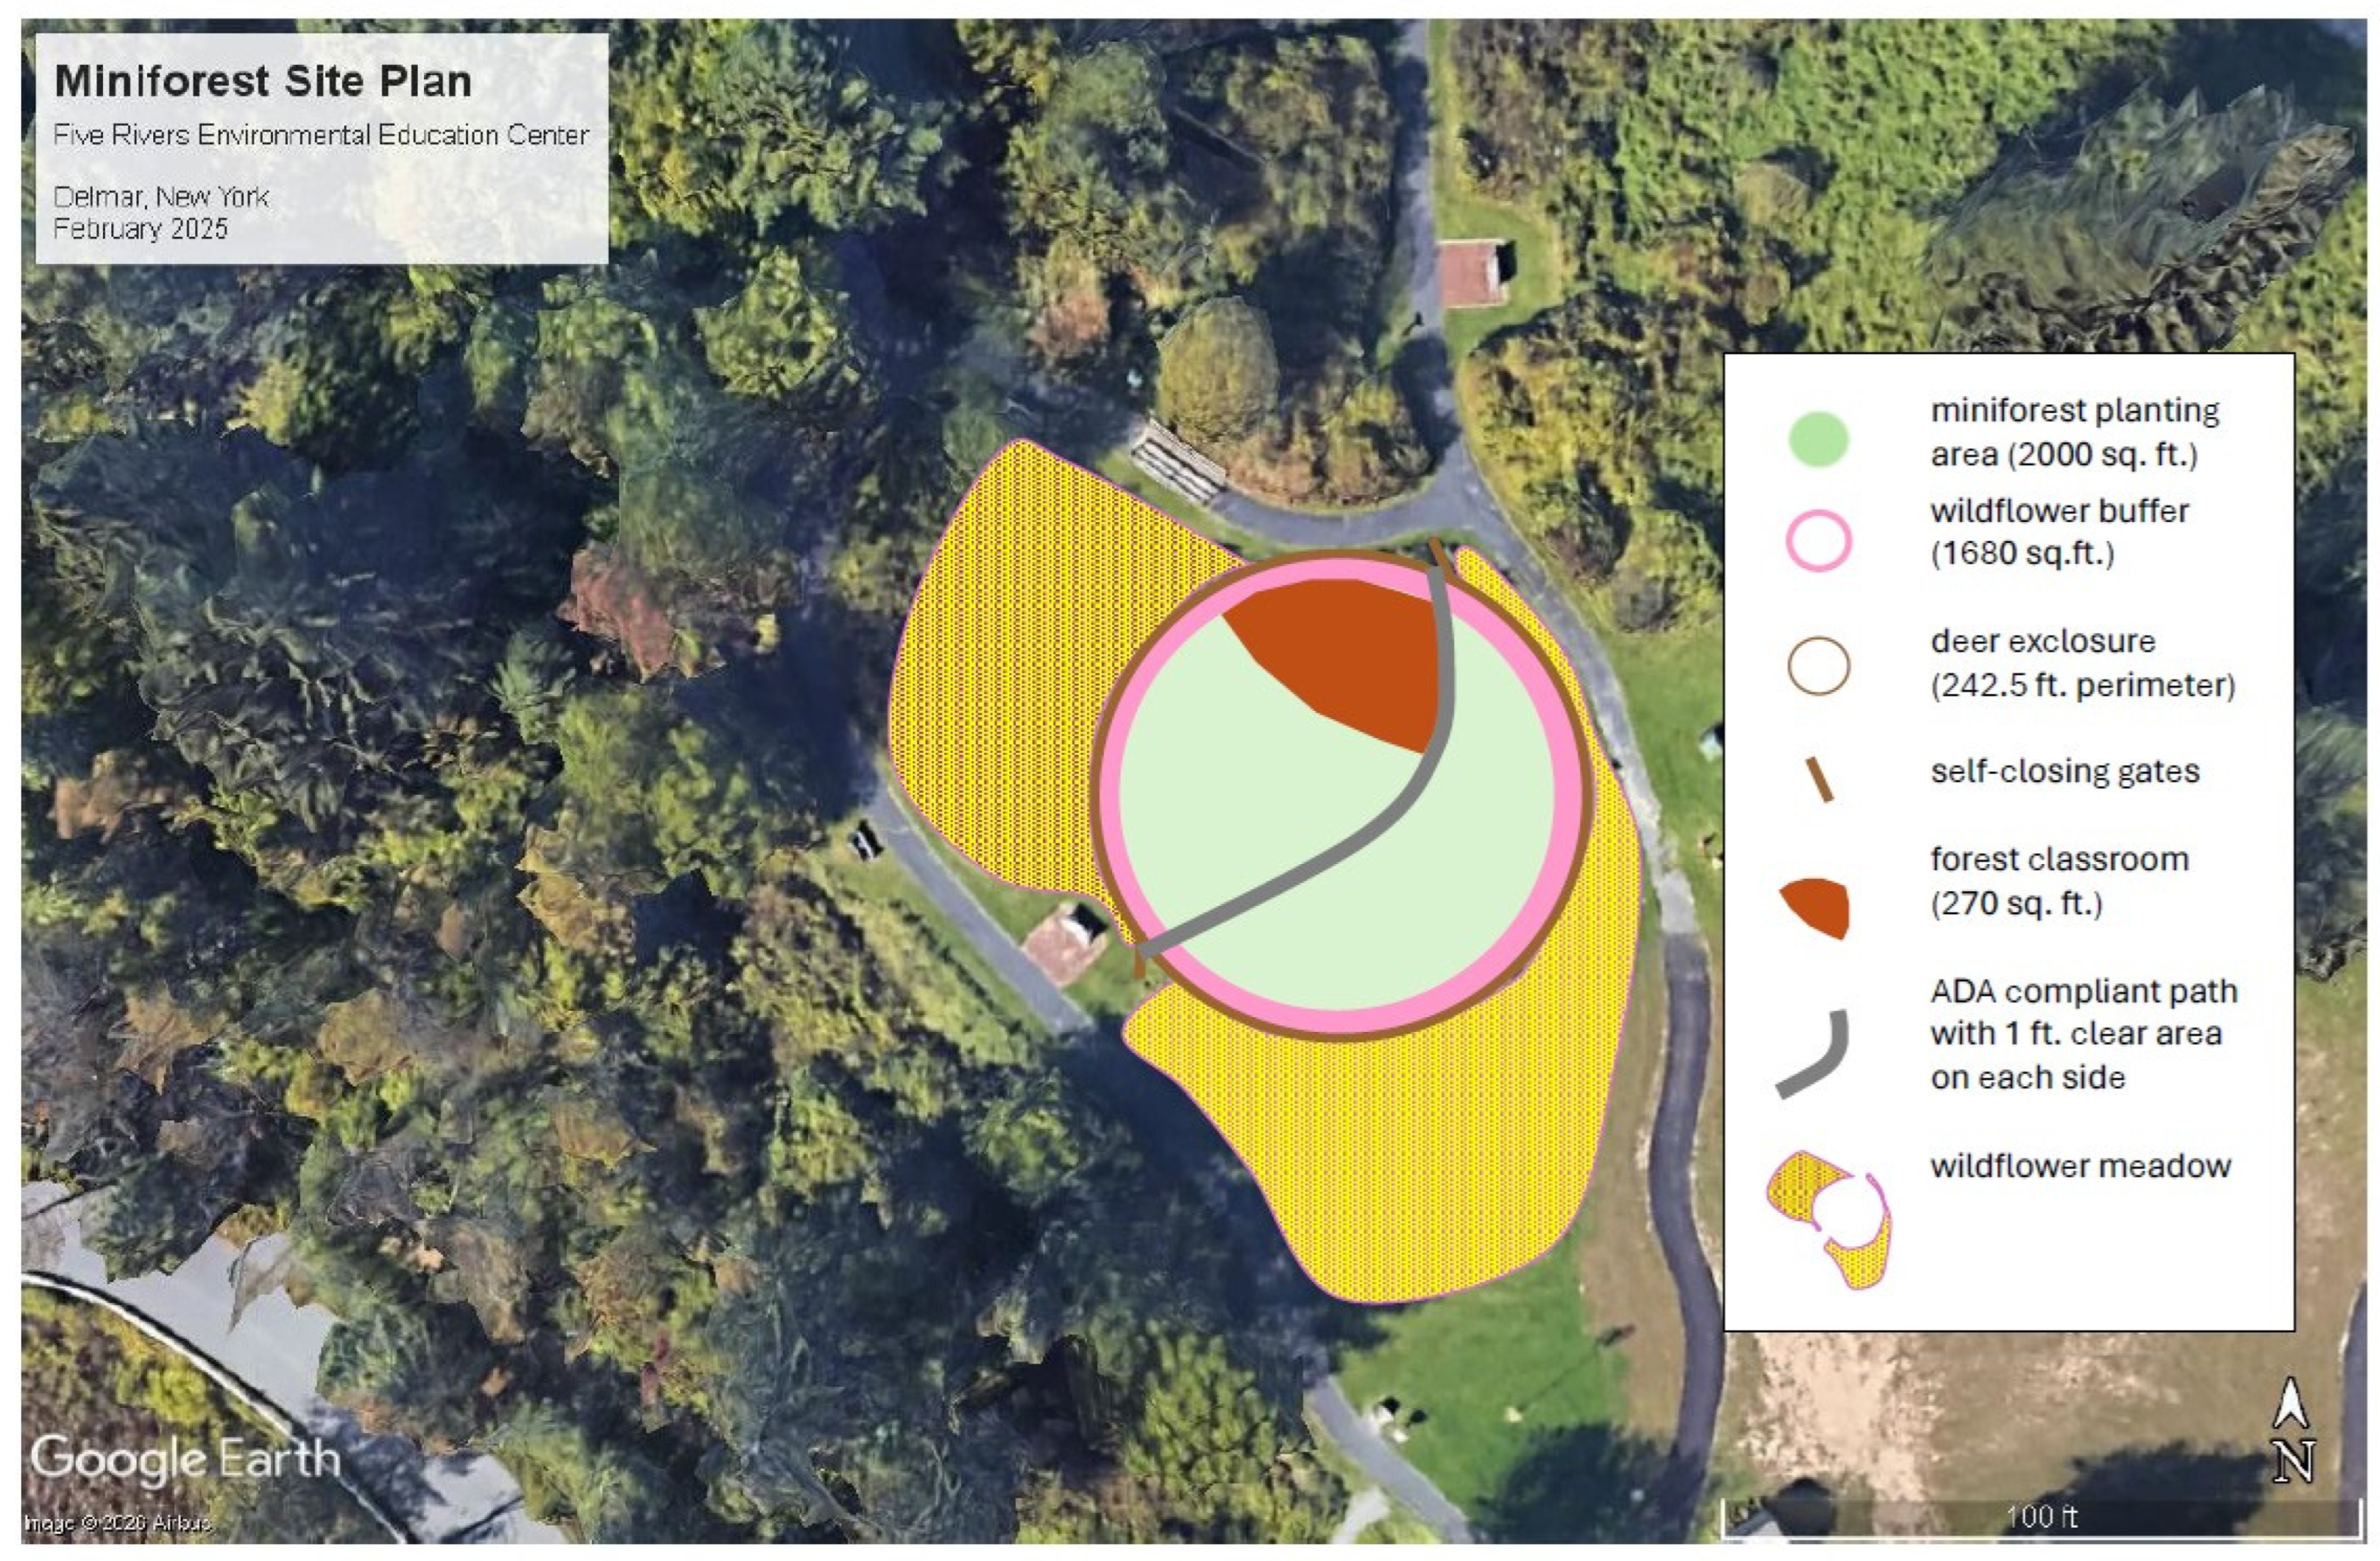
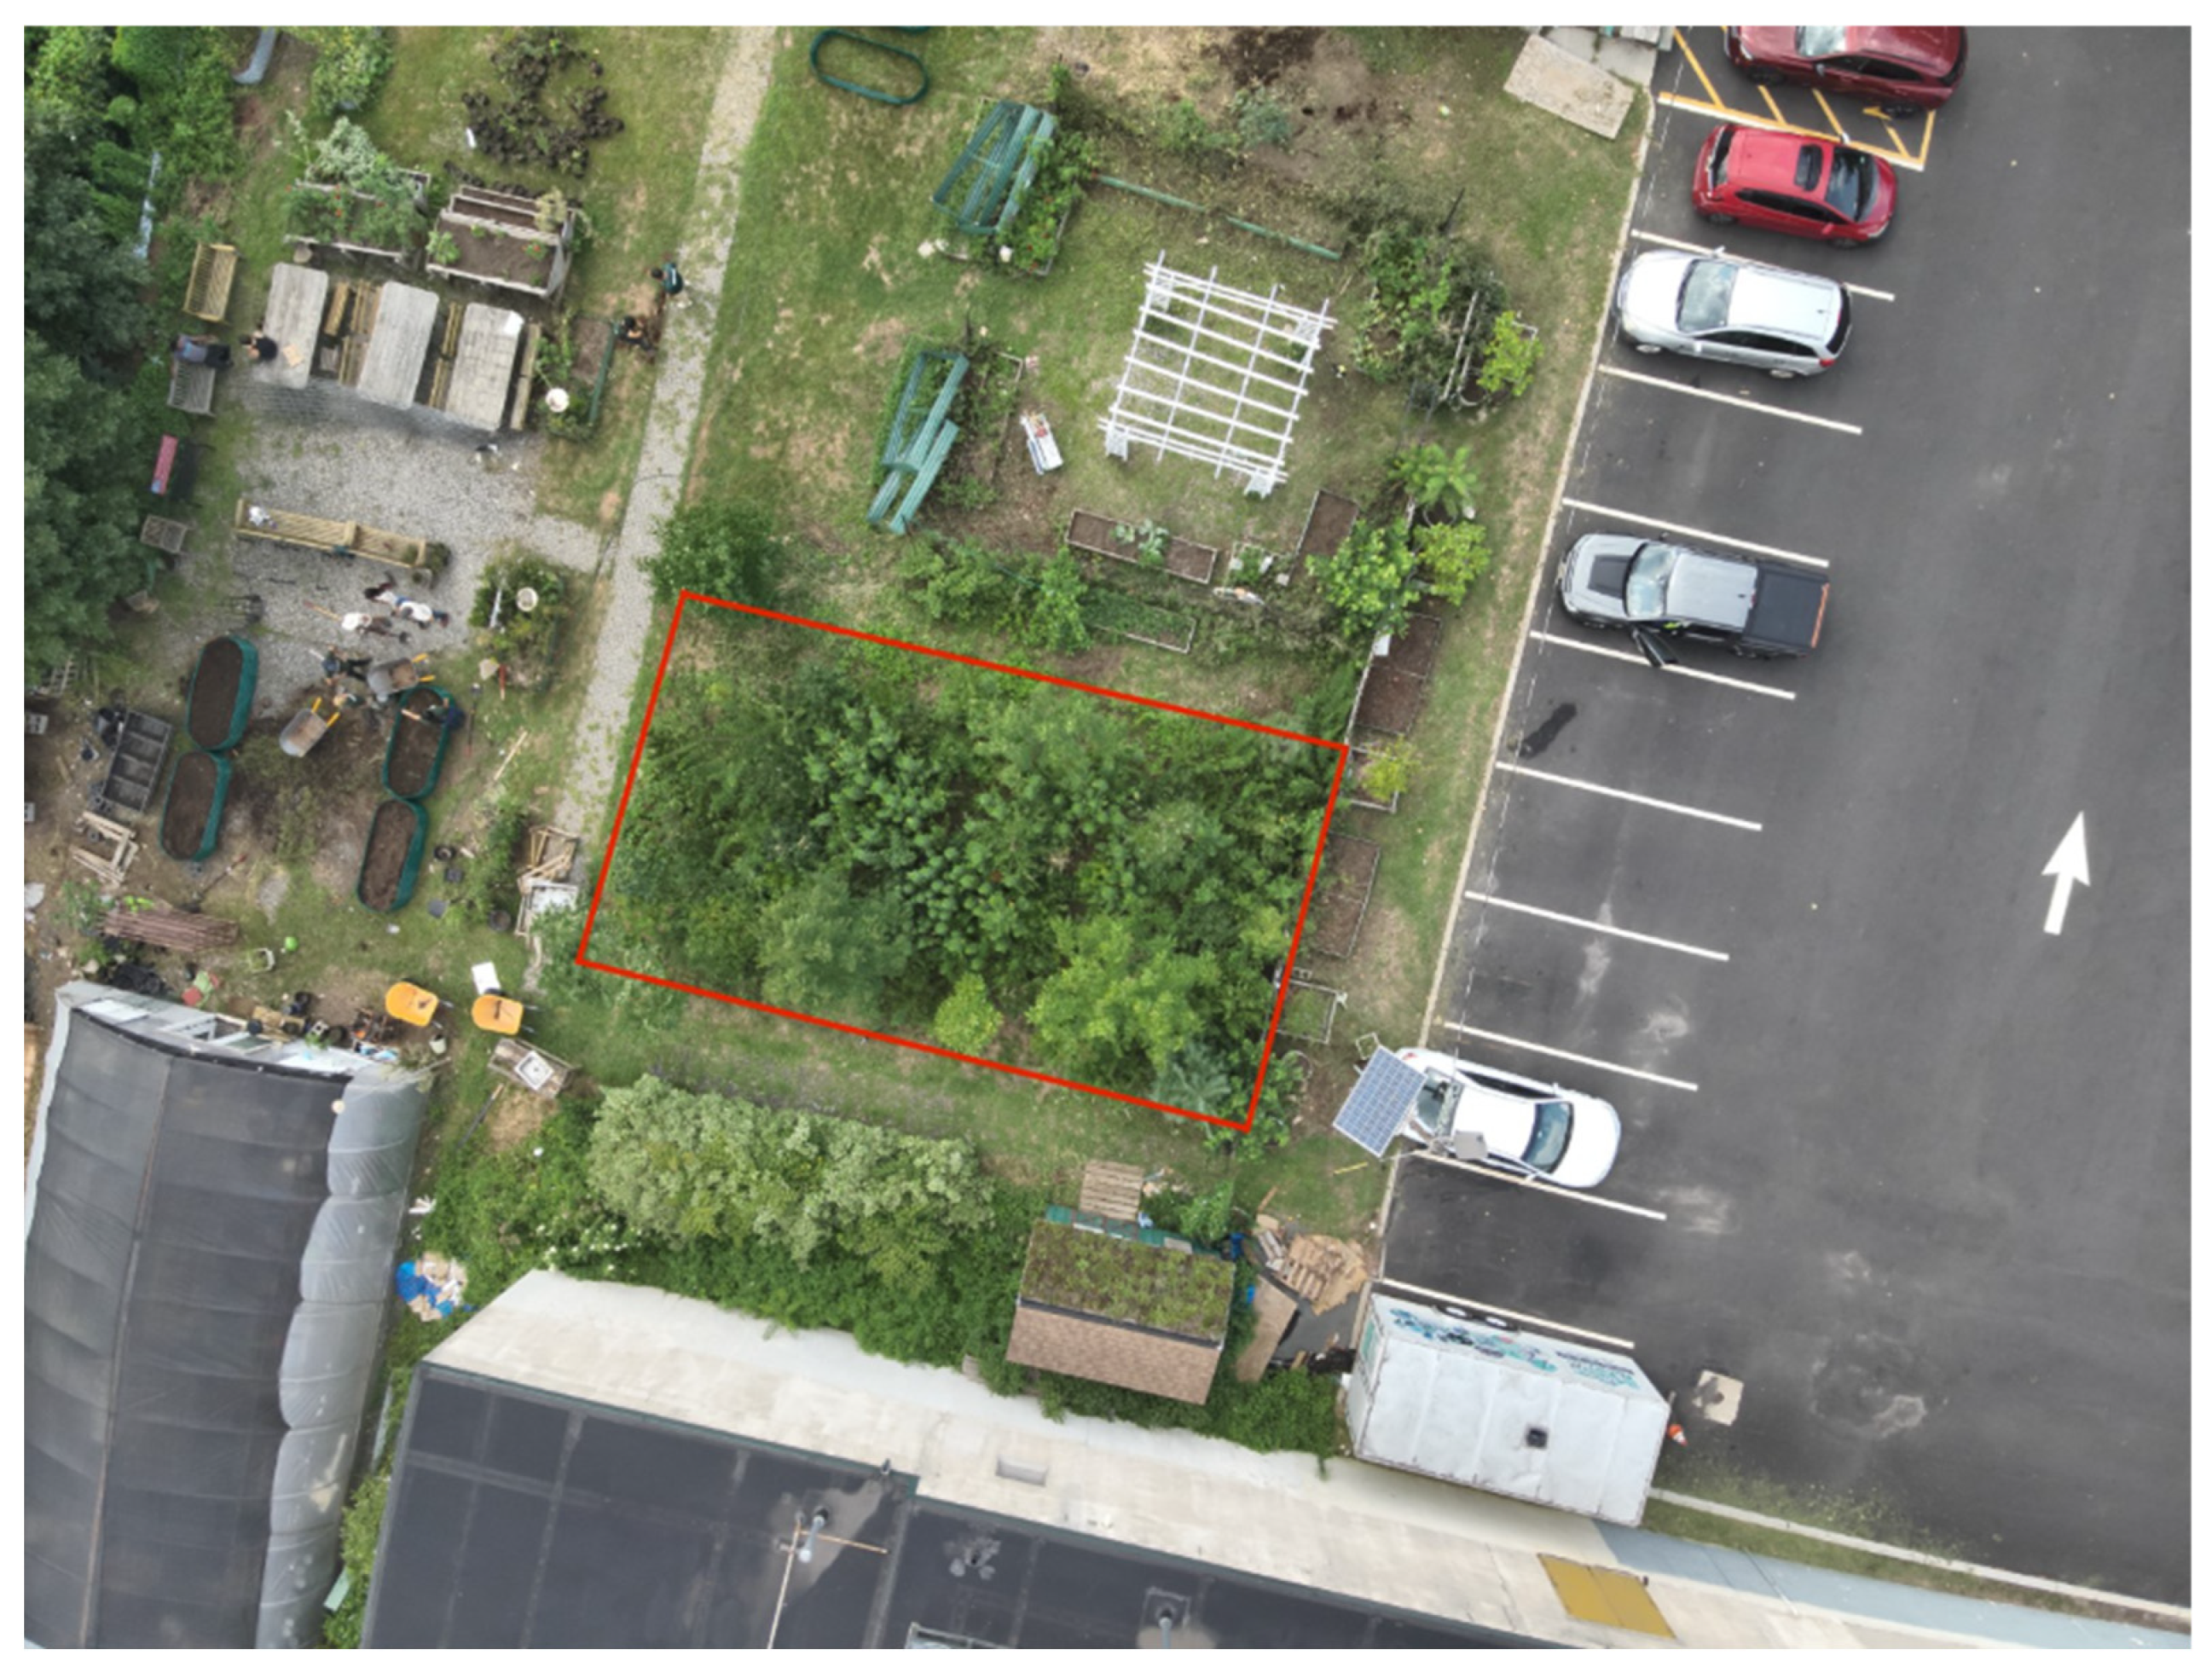
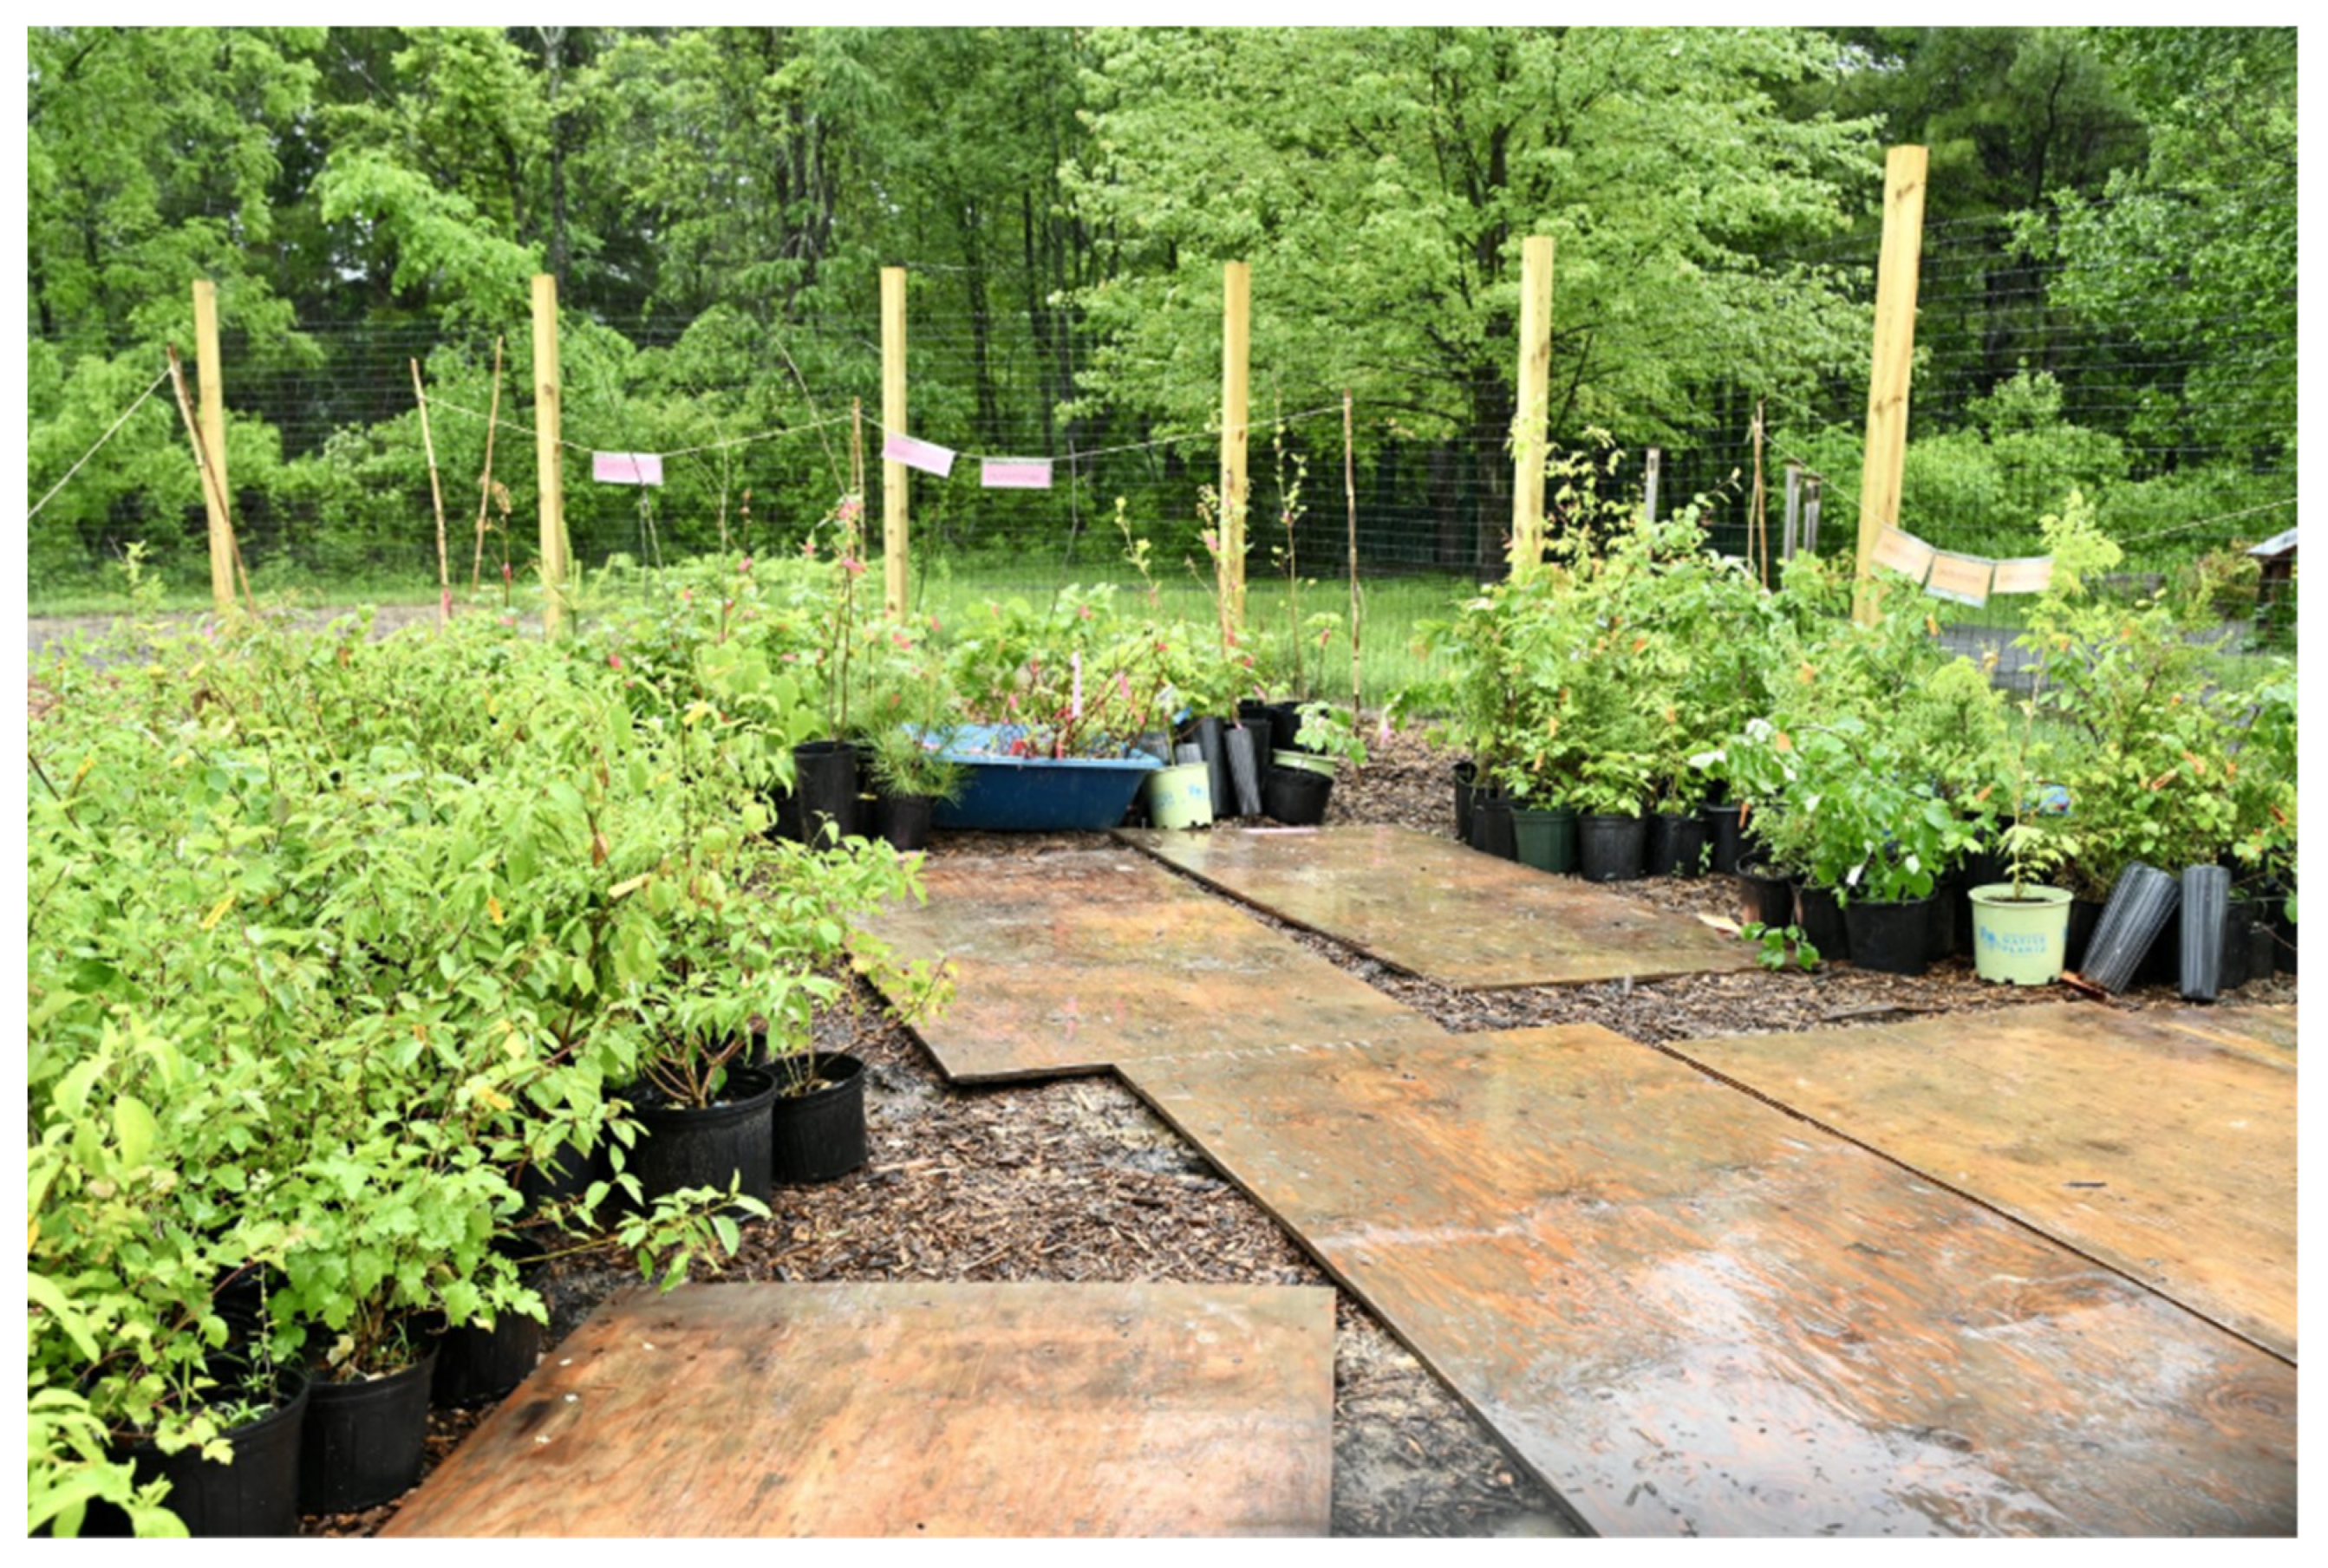
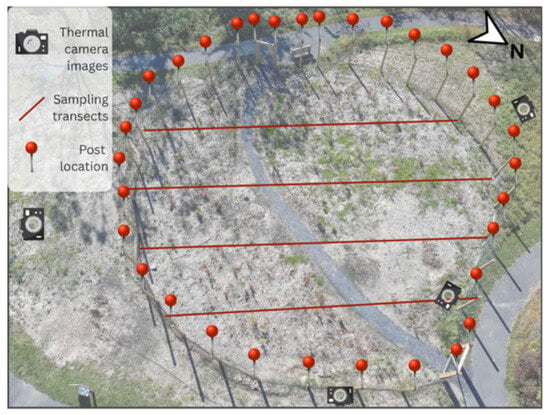
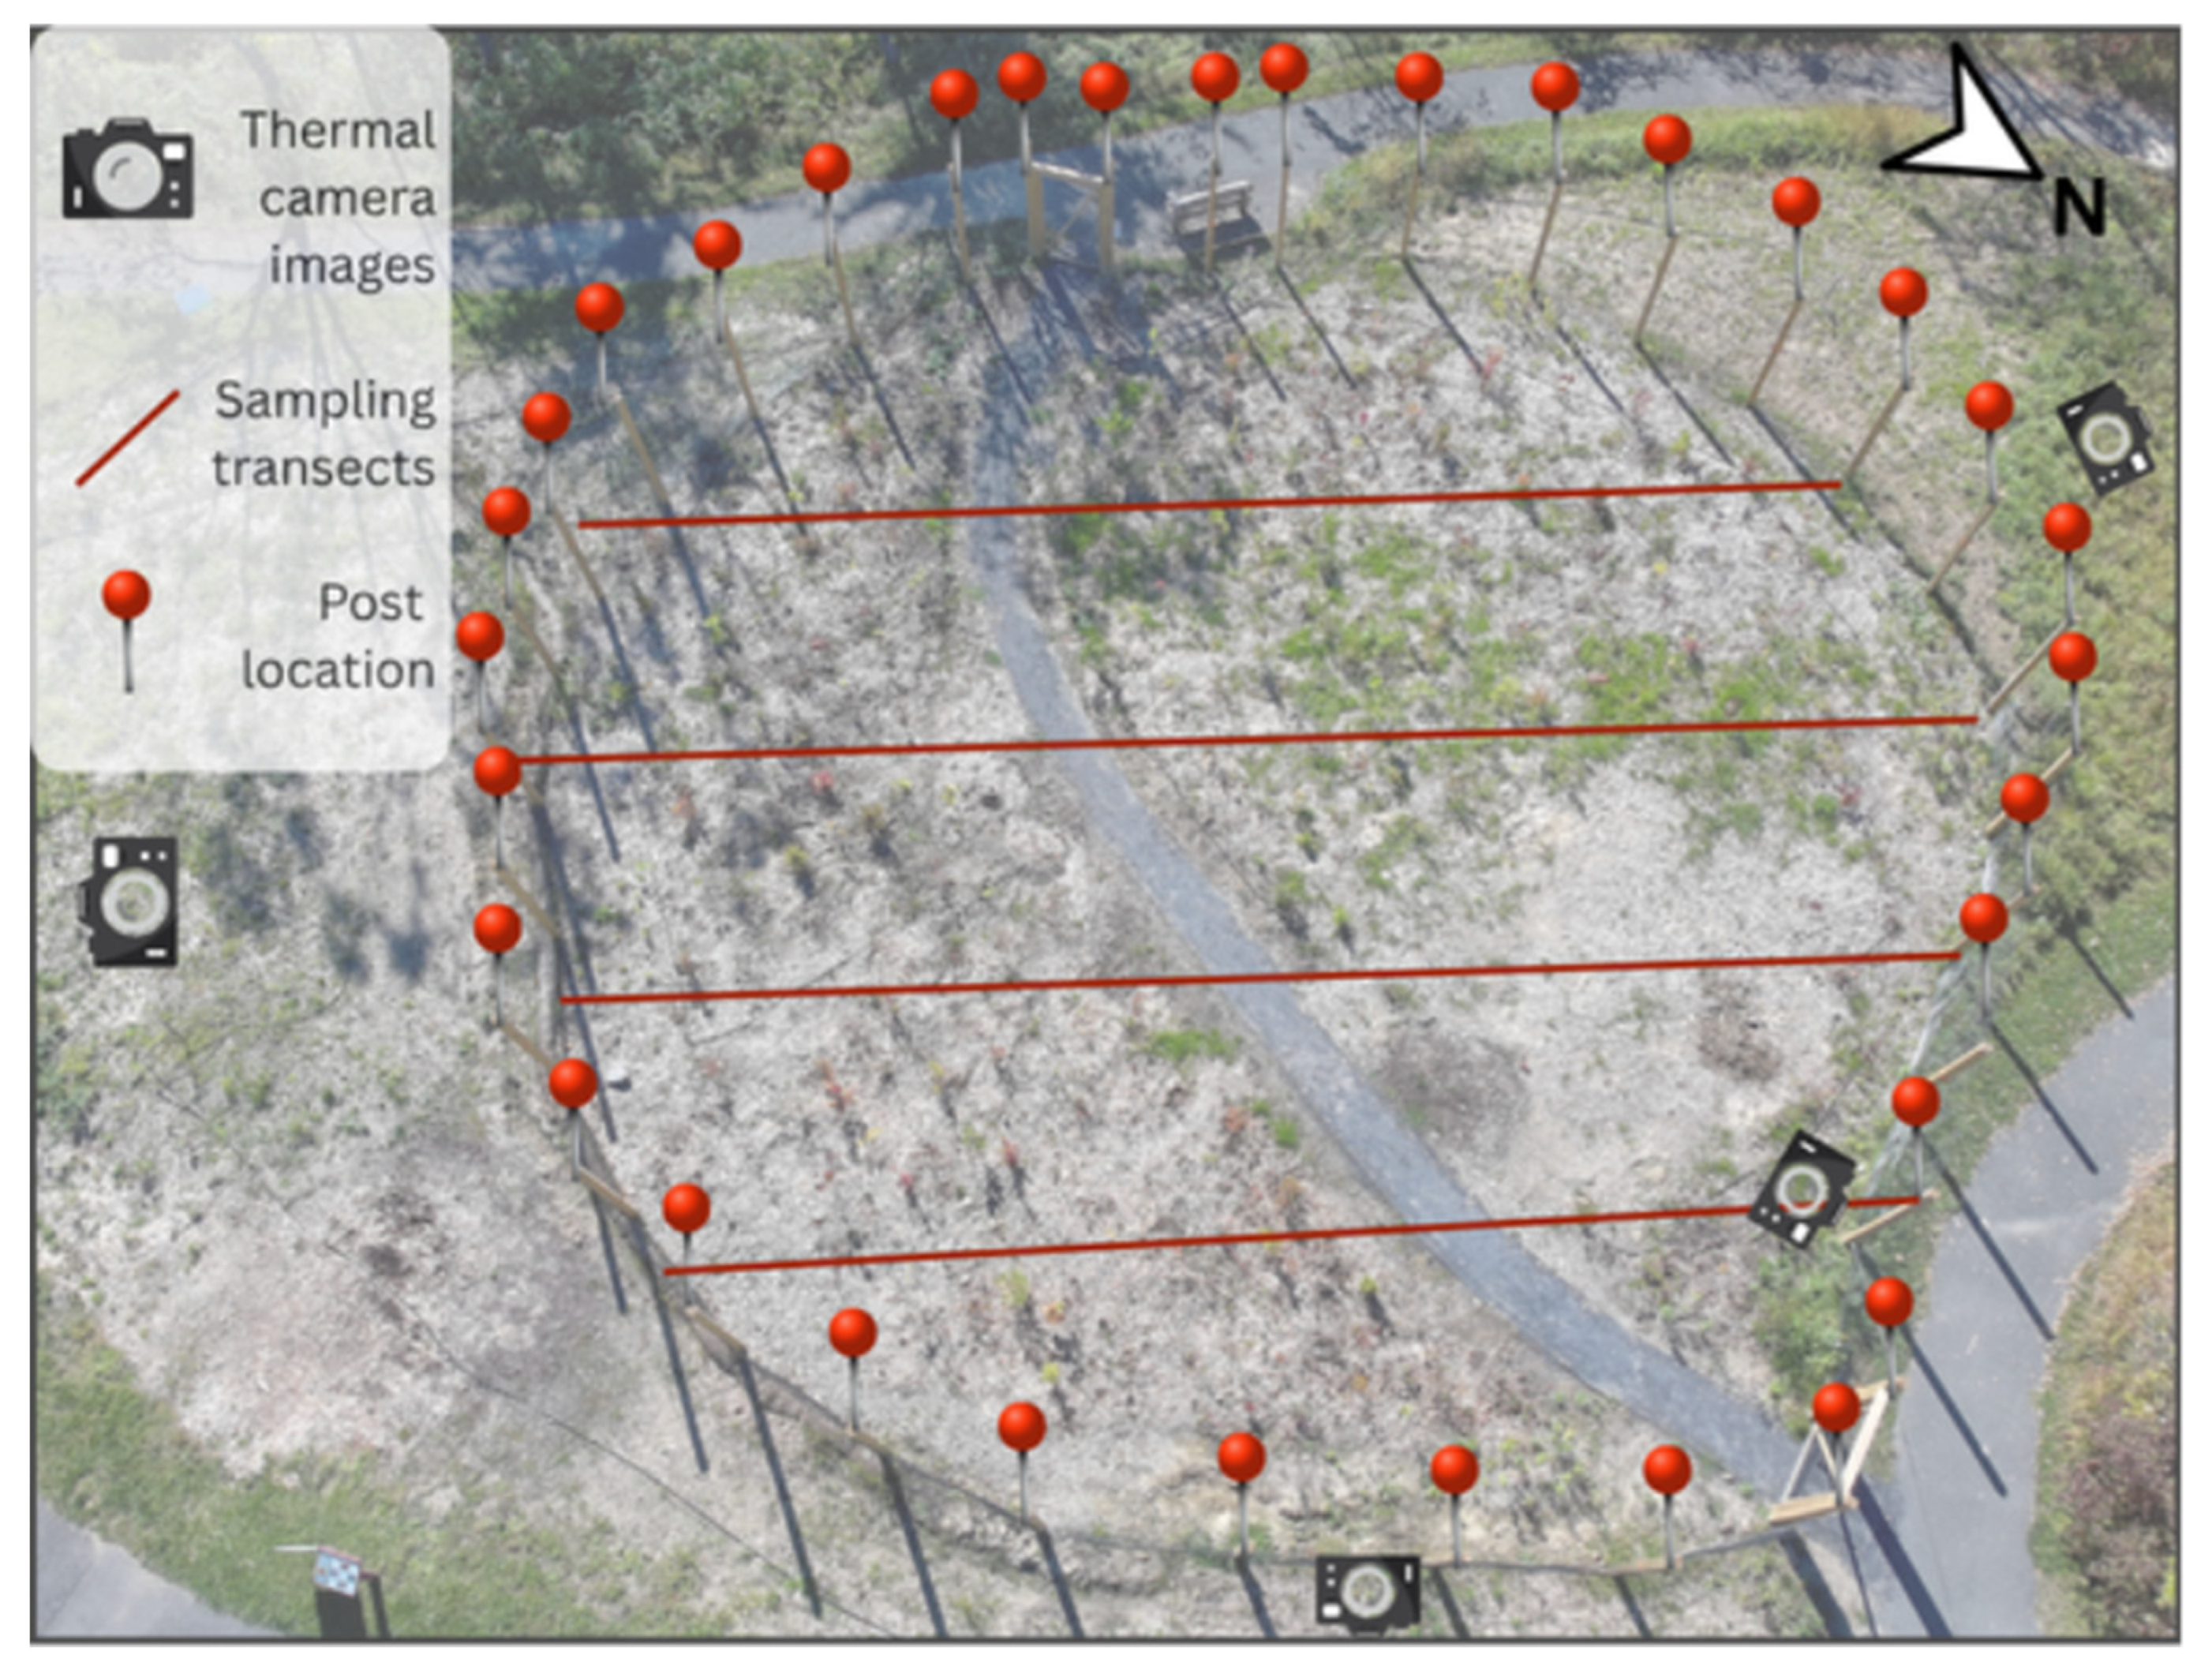
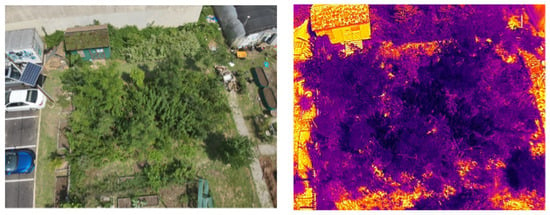
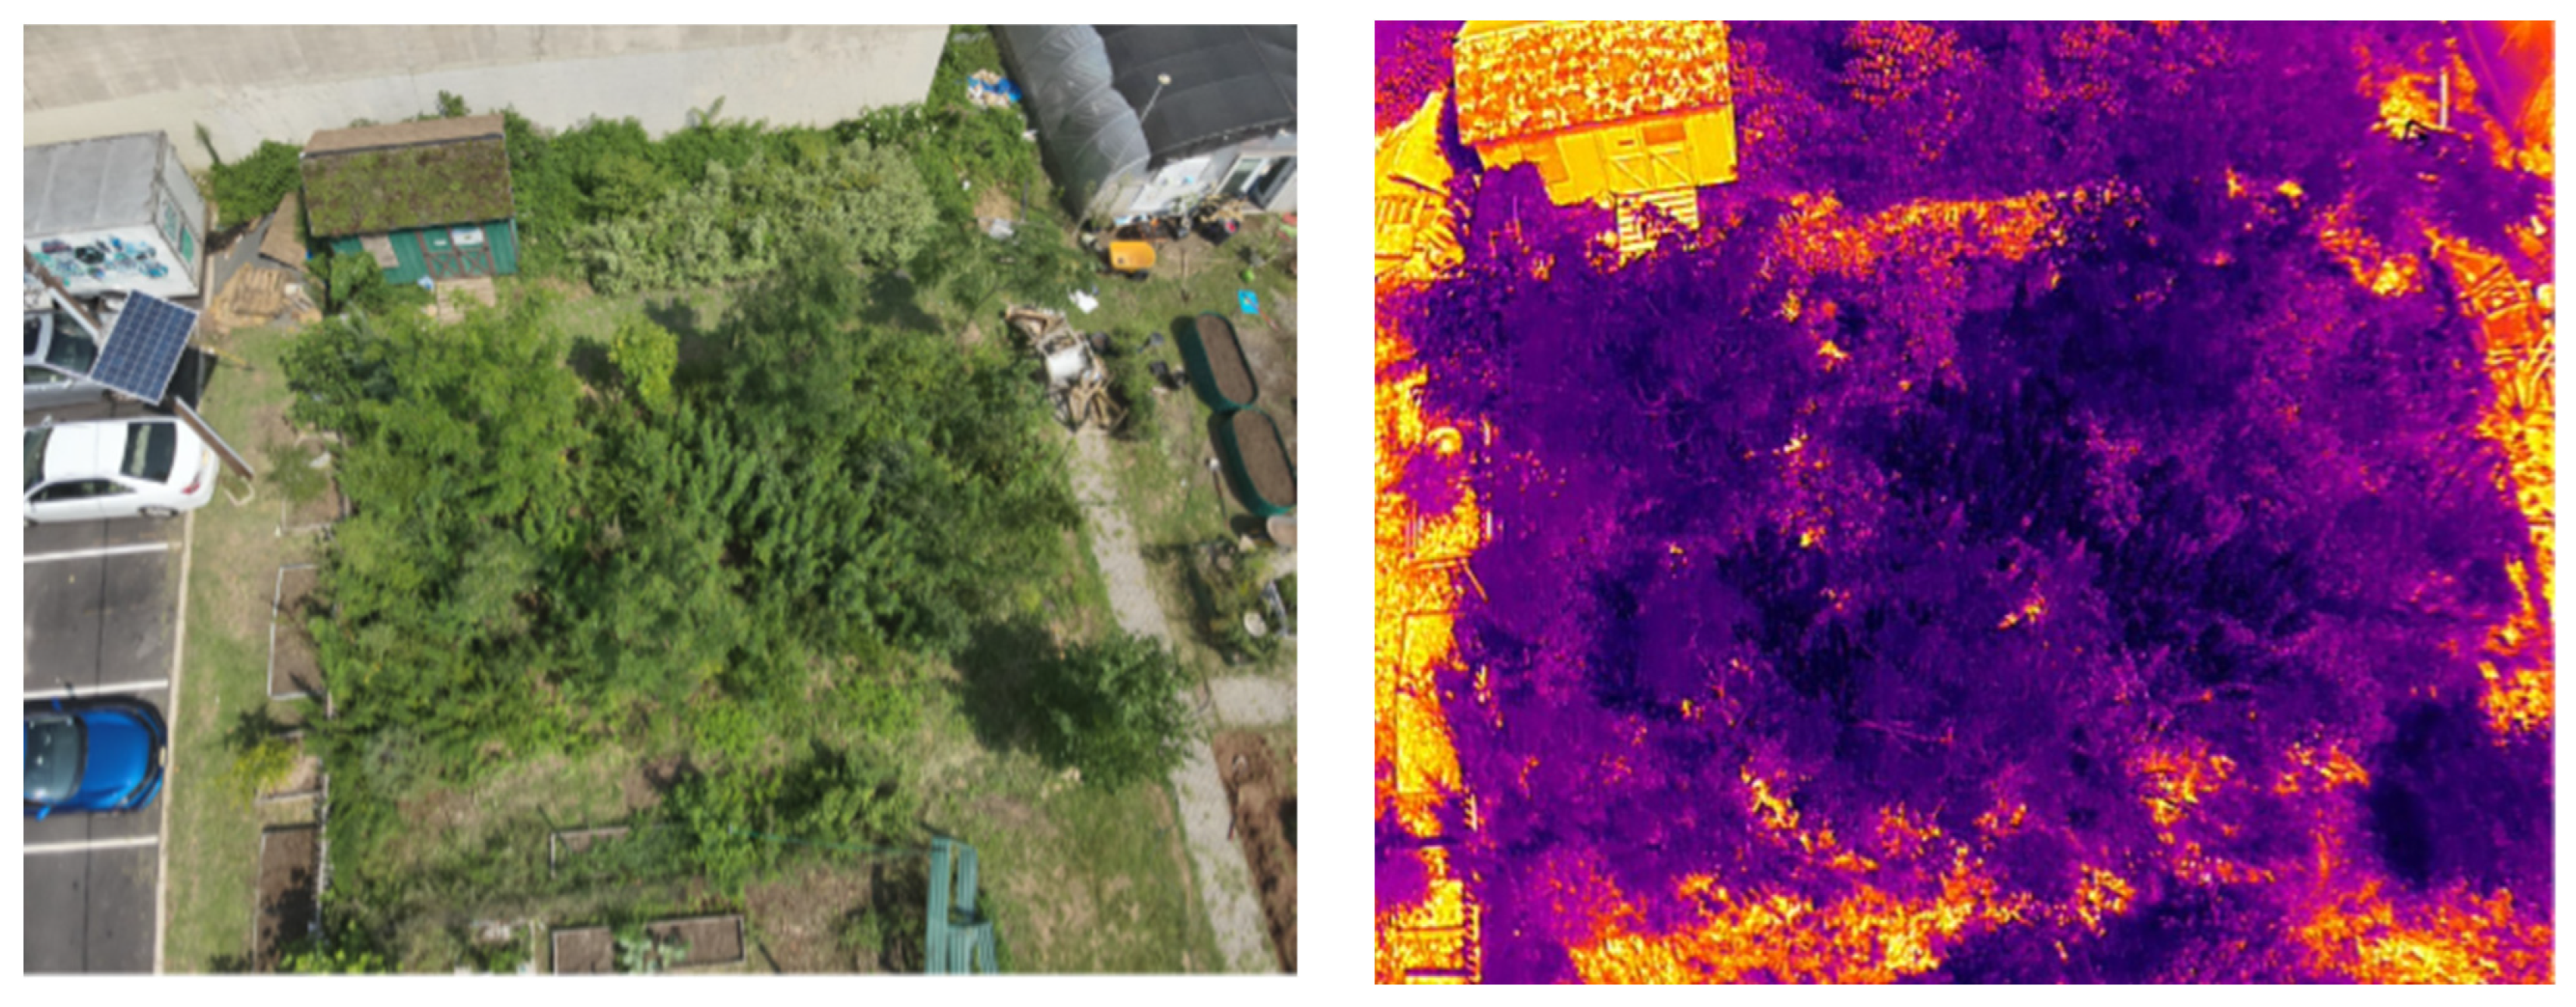
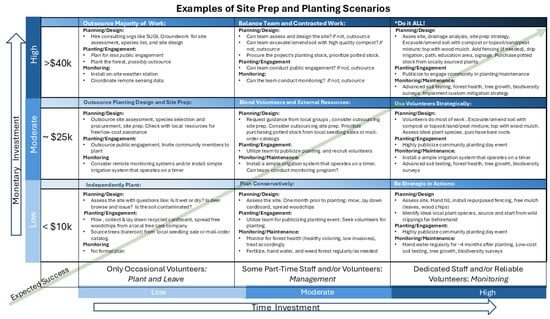
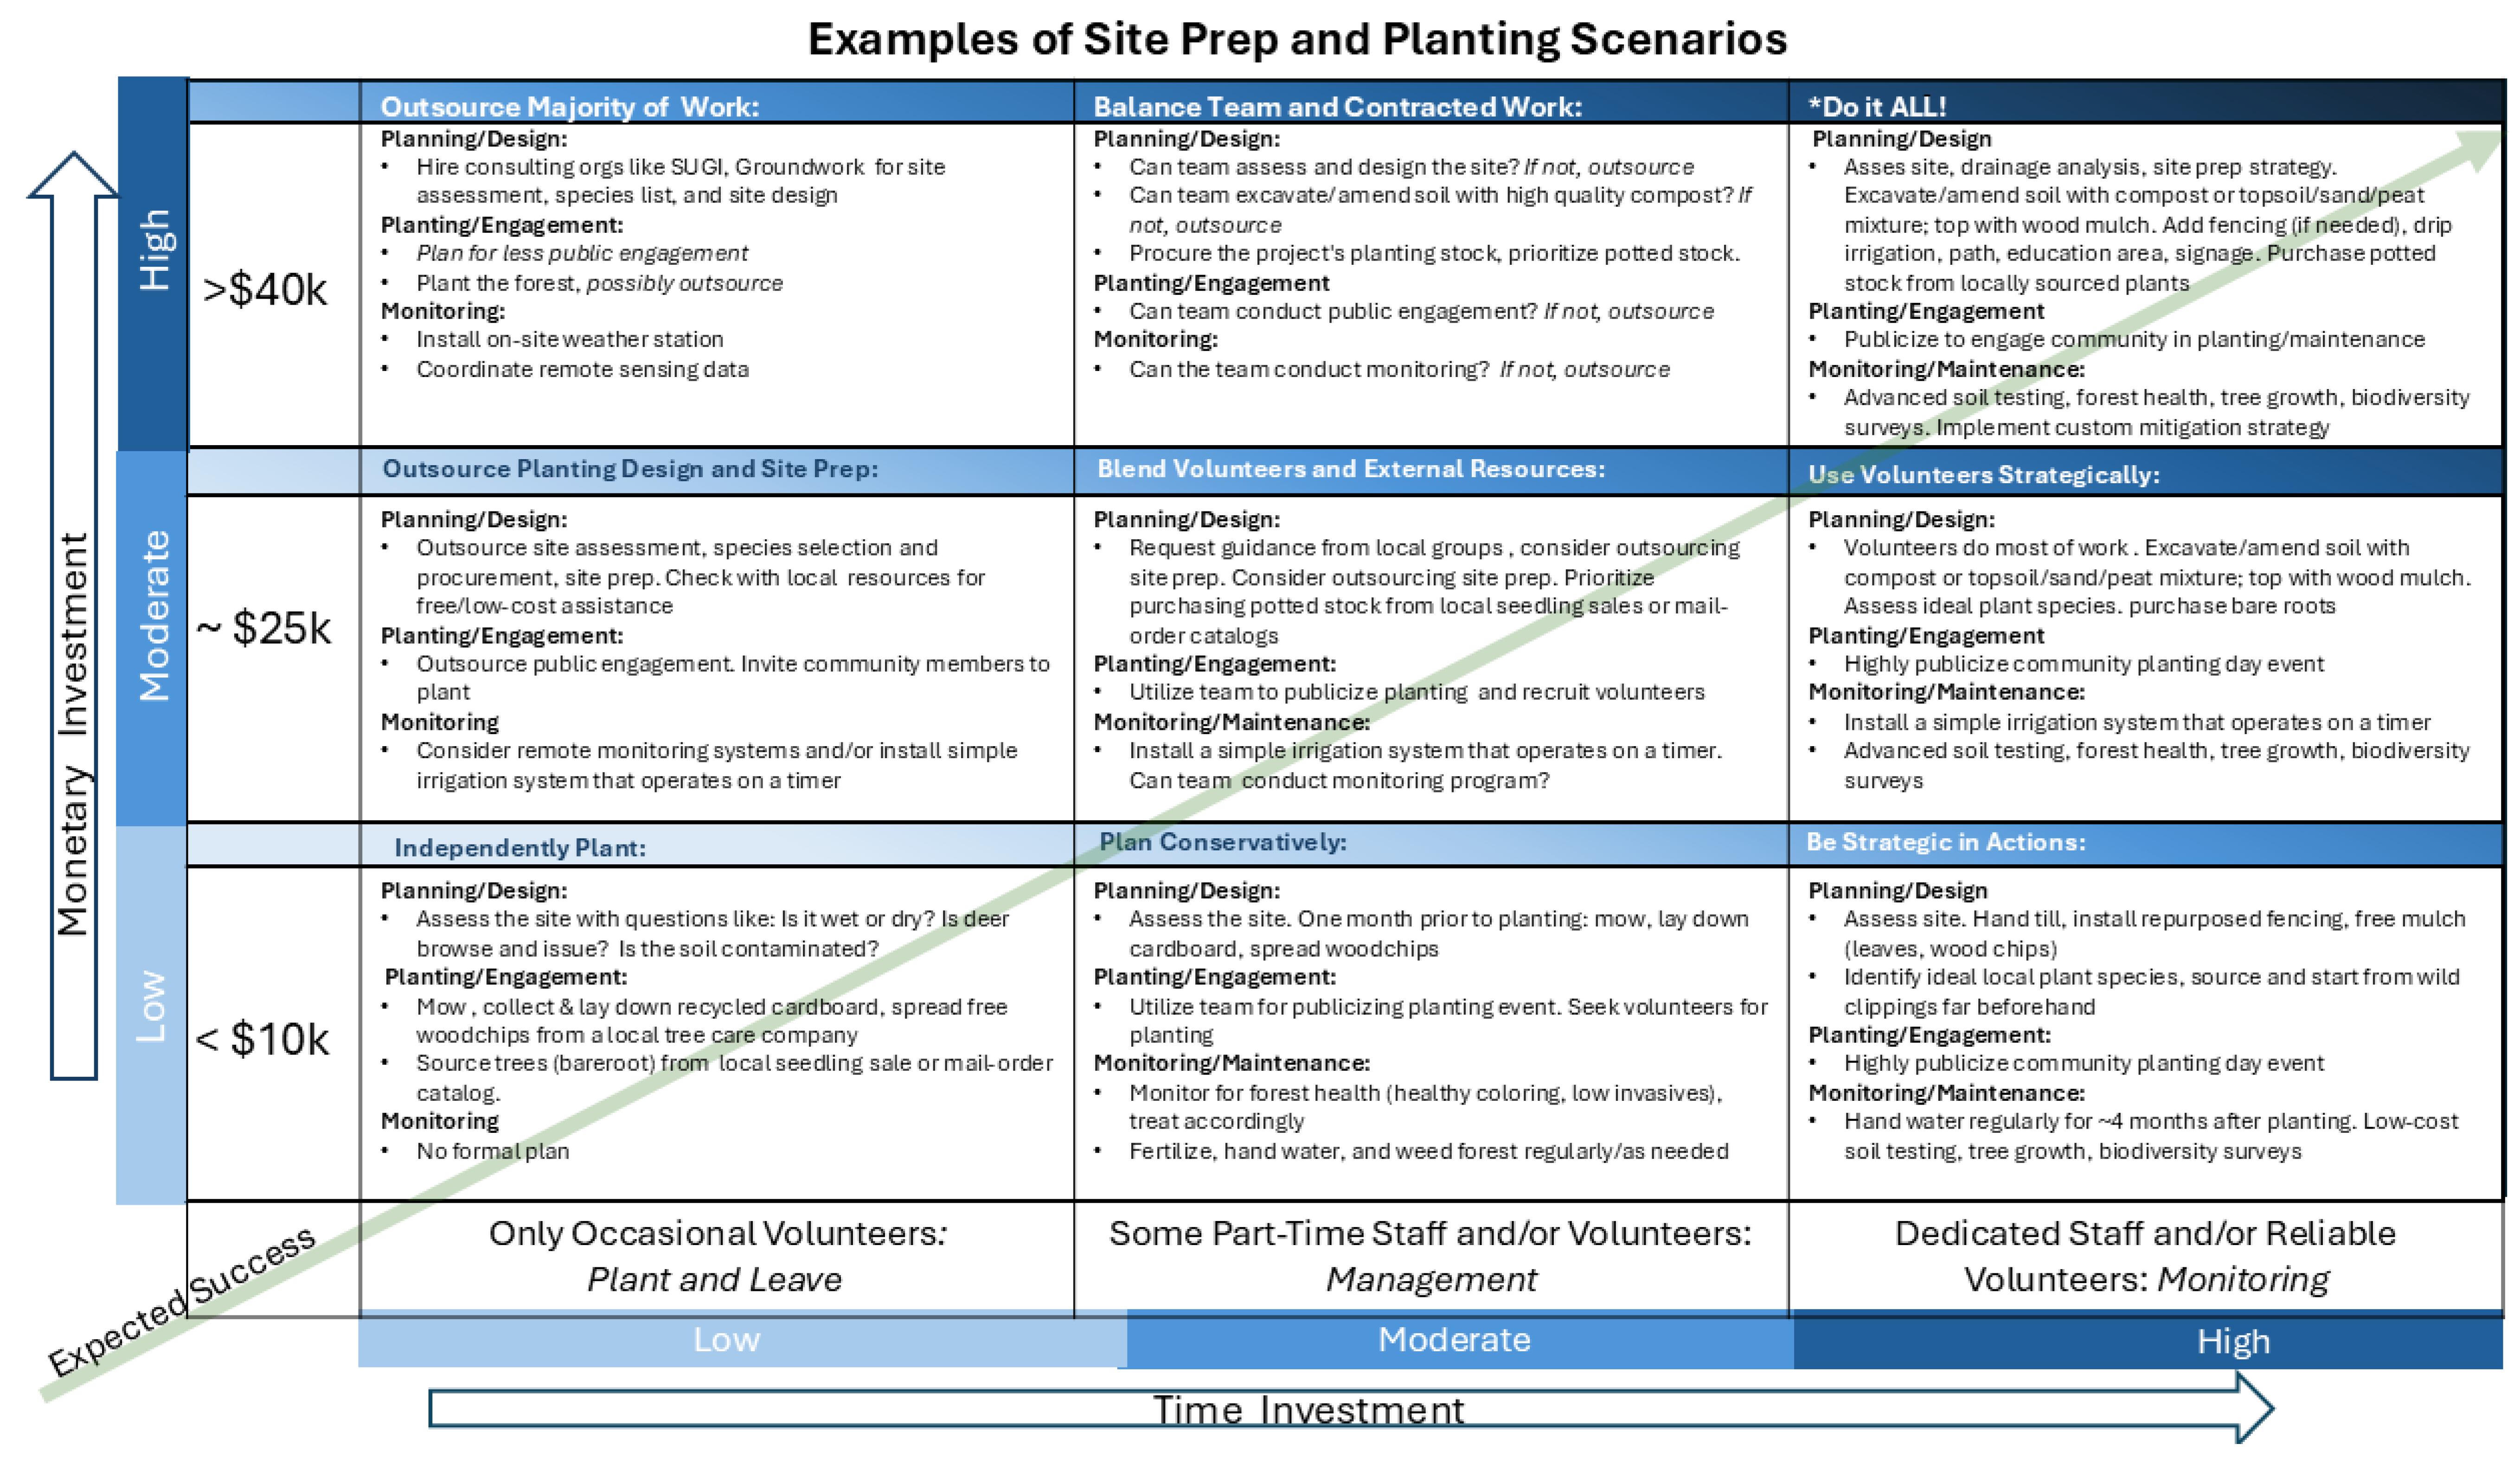
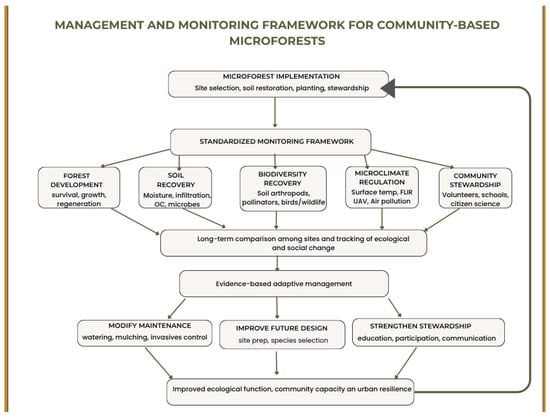
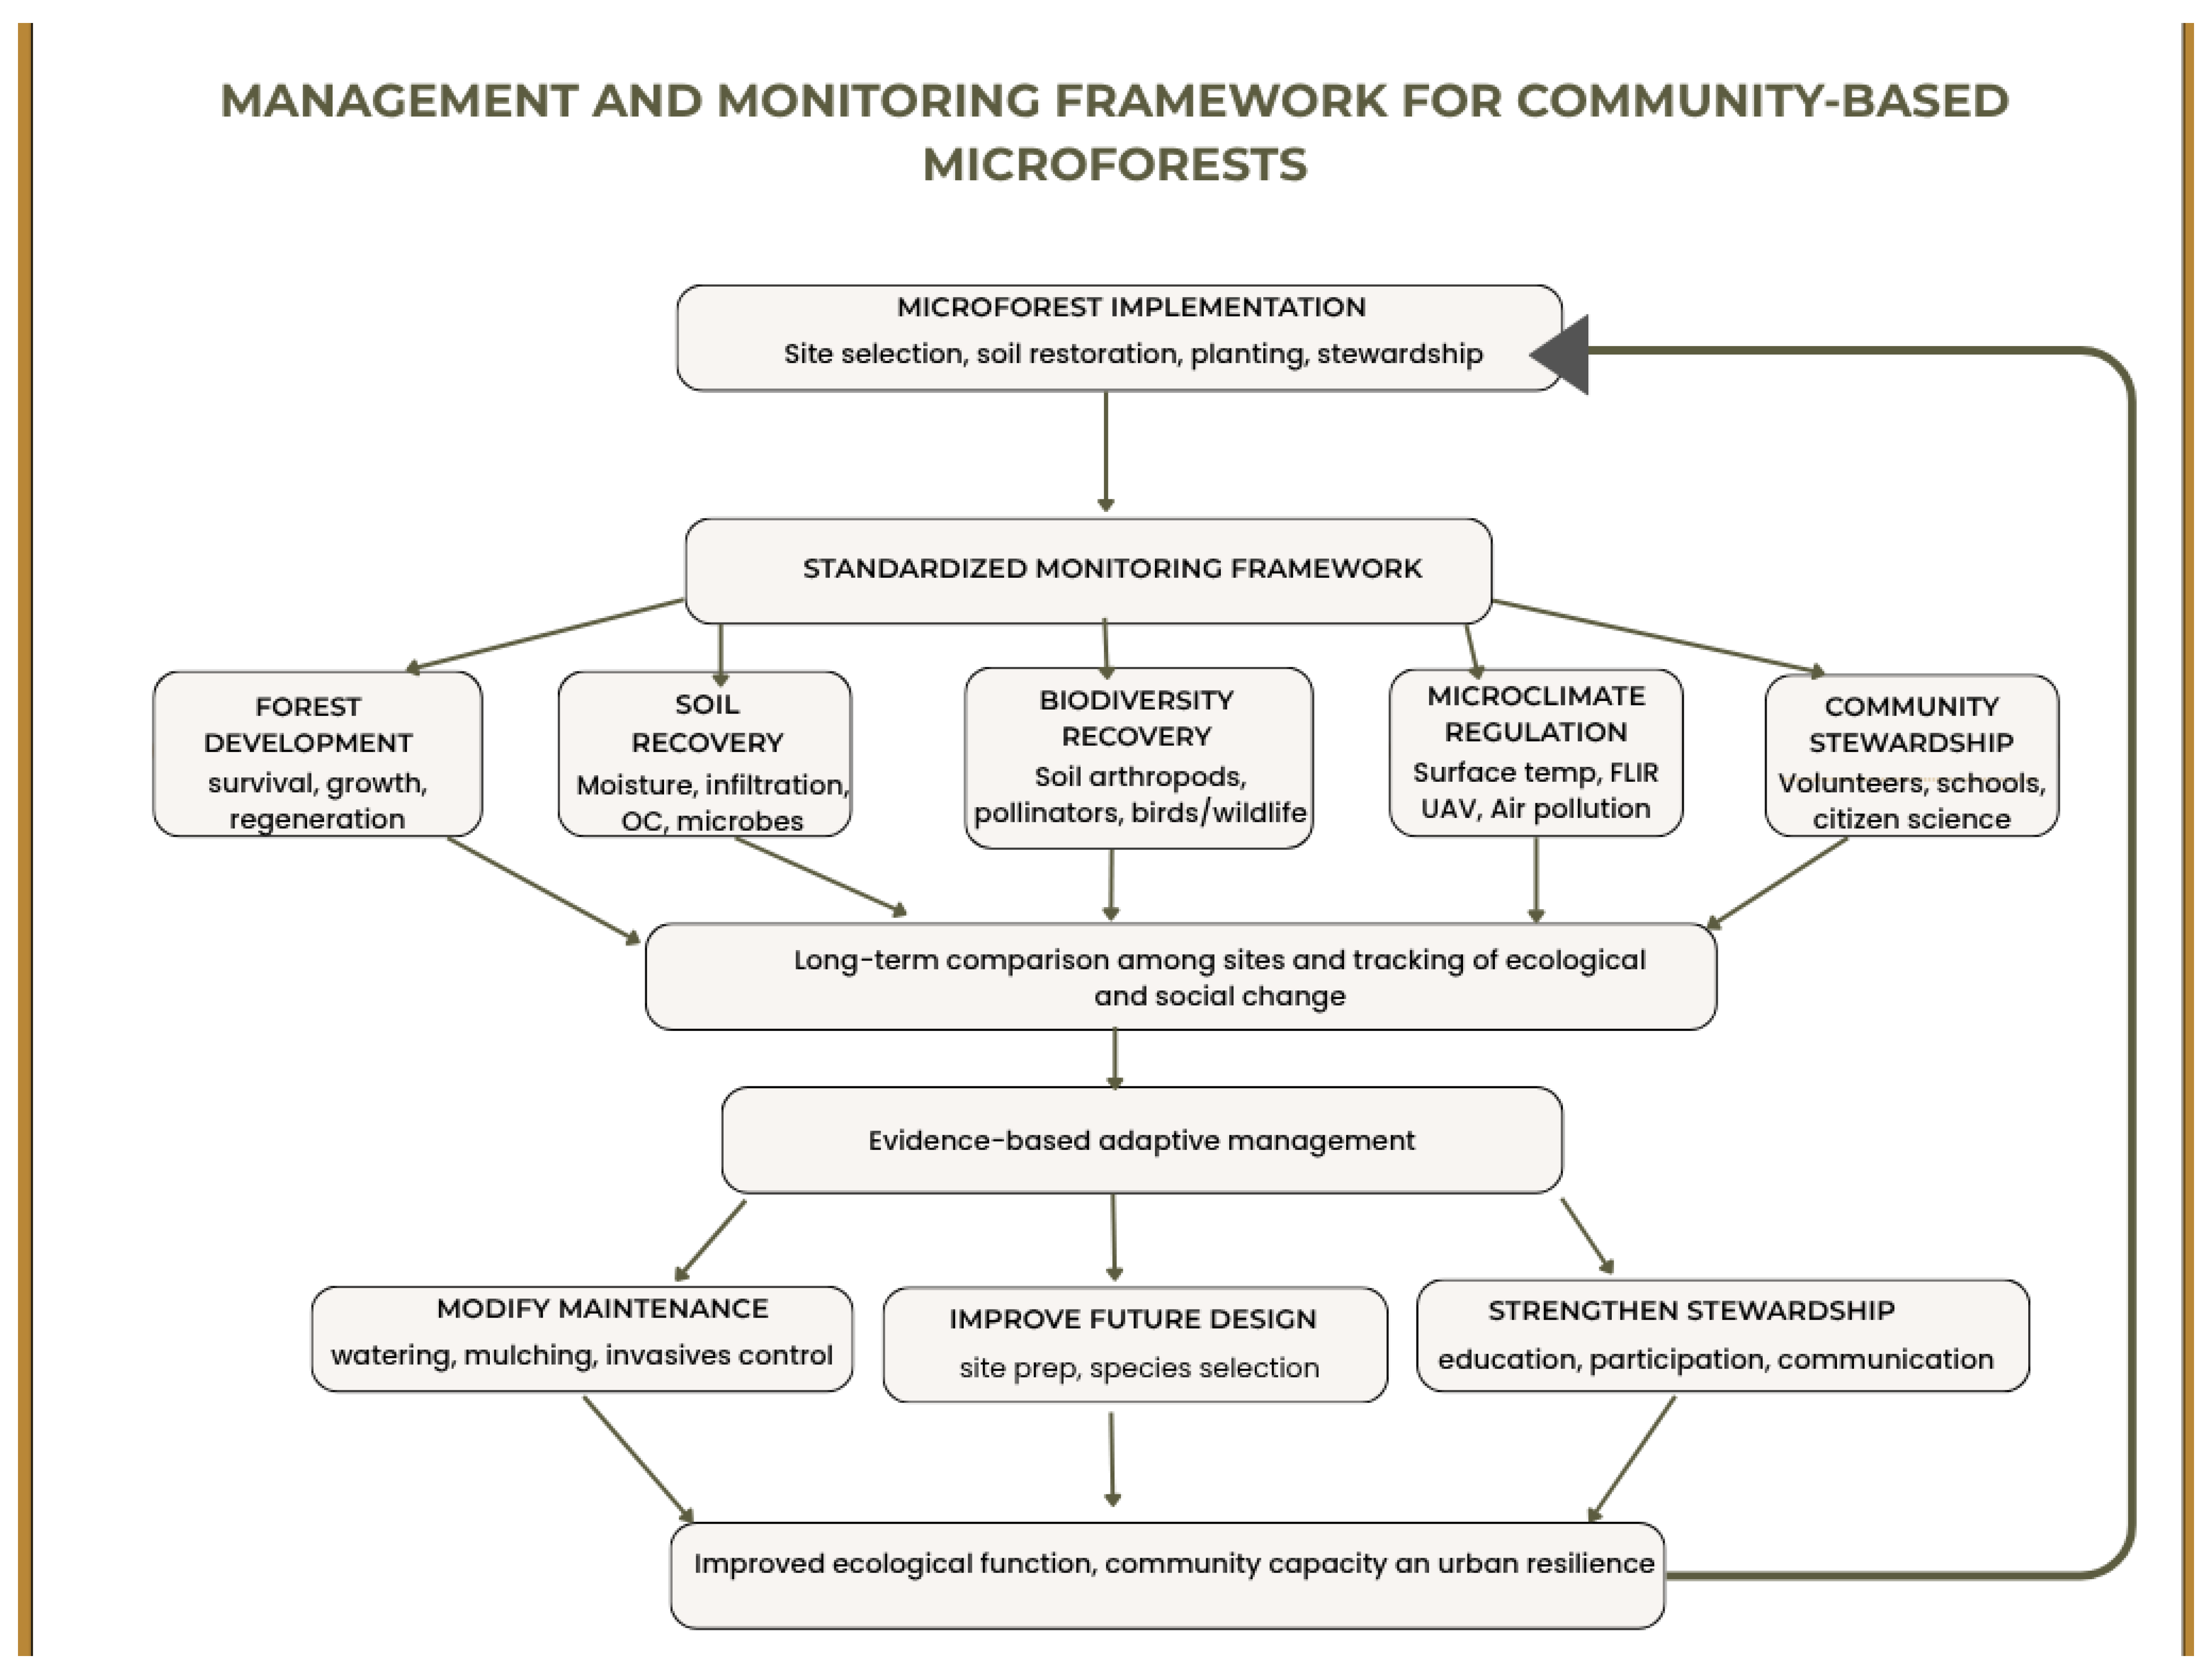

Disclaimer/Publisher’s Note: The statements, opinions and data contained in all publications are solely those of the individual author(s) and contributor(s) and not of MDPI and/or the editor(s). MDPI and/or the editor(s) disclaim responsibility for any injury to people or property resulting from any ideas, methods, instructions or products referred to in the content. |
© 2026 by the authors. Licensee MDPI, Basel, Switzerland. This article is an open access article distributed under the terms and conditions of the Creative Commons Attribution (CC BY) license.