


Abstract
Reliable rooftop photovoltaic planning requires design-stage energy predictions to be verified against actual system performance. The novelty of this study is the integration of a multi-year assessment of agreement with PV*SOL design estimates with an independent assessment of normalized productivity, interannual variability, seasonality, and meteorological effects for several rooftop systems operating under the same regional conditions. PV*SOL, a commercial photovoltaic simulation software used to estimate system energy production during the design stage, was evaluated using three years (2023–2025) of monitored data from three rooftop photovoltaic (PV) systems (17.60–75.40 kWp) in Rzeszów, south-eastern Poland. The analysis comprised 108 installation-month observations and included final yield, capacity factor, annual prediction errors, seasonal variability, Pearson correlations, and hierarchical regression. Mean annual final yield ranged from 907.4 to 966.2 kWh/kWp, while annual deviations from PV*SOL design estimates ranged from −0.80% to +7.41%. Monthly final yield was strongly associated with solar irradiation, and the final hierarchical regression model explained 96.4% of its variability. The results indicate that PV*SOL provides a useful annual design reference, but operational monitoring and local benchmark data remain essential for reliable performance assessment. The study supports United Nations Sustainable Development Goal 7 (Affordable and Clean Energy) by improving the evidence base for rooftop photovoltaic planning and monitoring.
1. Introduction
Energy-yield forecasting is an important component of photovoltaic (PV) system design because simulation tools support system sizing, expected-yield assessment, and other design decisions [1]. The reliability of such predictions depends on the assumptions, meteorological databases, component models, and loss parameters implemented in individual simulation tools. Consequently, different software packages may provide different energy-yield estimates for the same PV system [2]. Therefore, design-stage predictions should be validated using data recorded after system commissioning [1,2].
PV production simulation results from a multi-stage transformation of meteorological and technical data. It includes modeling irradiance incident on the module plane, operating temperature, the electrical characteristics of panels and inverters, and losses associated with geometry, shading, and operating conditions [1,2,3,4]. For rooftop photovoltaic systems, accurate representation of the building geometry, obstacles, and partial shading is particularly important because spatial simplifications may lead to systematic differences between predicted and actual energy production [3,5]. Prediction accuracy also depends on the quality of information on system azimuth, tilt, and location [4].
The specific characteristics of rooftop photovoltaic systems further increase prediction uncertainty. Module placement is usually constrained by the geometry of existing buildings; consequently, the array may cover several roof surfaces with different azimuths and tilt angles. Orientation and tilt affect not only annual yield but also the monthly and seasonal distribution of production [6]. At the same time, systems operating under similar climatic conditions may achieve different normalized results because of differences in configuration, mounting method, and local operating conditions. Nominal capacity alone is therefore insufficient for performance assessment, and comparisons should use final yield, capacity factor, and seasonal profiles [7]. Environmental factors that vary over time are another important source of discrepancies. Module temperature depends on weather conditions, mounting method, and heat transfer, and inaccurate temperature representation may affect calculated efficiency and energy production [8]. Soiling, albedo variability, and thermal loading are also local and seasonal in nature [9,10].
Assessment of agreement between design predictions and actual results should consider not only annual values but also monthly and seasonal variability. Agreement in total annual production does not necessarily mean that the model correctly reproduces system performance during individual periods. Underestimation in some months may be offset by overestimation in others, resulting in an apparently small annual error. This limits the identification of seasonal sources of discrepancy, including meteorological conditions, module temperature, shading, soiling, and model assumptions concerning losses. An analysis covering only one year may also be insufficient because the weather in that year may differ substantially from the long-term meteorological background and from the reference data used during design. A reliable assessment should therefore combine a comparison of annual production totals with an analysis of monthly and seasonal profiles, thereby determining both overall agreement and the stability of the direction and magnitude of deviations over time [11,12]. The use of multi-year data further reduces the risk of attributing differences caused only by an atypical weather year to system characteristics and allows better separation of the effects of meteorological variability, technical configuration, and persistent changes during operation [13,14]. Actual system productivity and prediction accuracy describe two different aspects of performance. A small difference between predicted and measured production does not necessarily indicate a high specific yield because a model may accurately represent a system whose potential is constrained by roof geometry, module orientation, or other technical conditions. Conversely, a system with a high yield may deviate from its prediction when the meteorological data or design assumptions do not correspond to actual operating conditions. Agreement between modeled and monitored results should therefore be assessed separately from normalized productivity indicators [15,16,17]. Monitoring data are the primary source of information on actual system operation because they allow seasonal and interannual changes to be tracked, weather effects to be considered, and persistent deviations from design values to be identified [18,19,20]. Comparing actual data with simulation results also enables the quality of design assumptions to be evaluated and benchmark values to be updated [11,21]. In Poland, the importance of such validation is increasing with the rapid growth of the photovoltaic market and the large share of prosumer installations [22]. Available studies show that modeled and measured results may differ depending on the software, input data, orientation, and local conditions [15,16]. Studies conducted under Polish conditions have addressed the actual productivity of rooftop photovoltaic systems, comparisons of monitored and modeled values, and multi-year production variability [13,23]. These publications emphasize the need to account for local meteorological conditions, technical configuration, and observation-period length when assessing PV performance. Polish studies have also examined the actual operation of PV systems of different scales and configurations, normalized indicators, regional comparisons, and comparisons of model results with measurements [14,24,25,26]. Together, these studies indicate that reliable PV system assessment requires consideration of both local operating conditions and longer-term changes in productivity.
Studies conducted in other countries have included both large-scale rooftop installations and smaller residential systems. Actual operation was assessed using monitoring data and included energy yield, performance indicators, losses, and seasonal variability [18,19,20]. Multi-year observations were also used to evaluate operational stability, changes in productivity, and the effects of local climatic and technical conditions [27,28,29]. Although these studies confirm the importance of monitoring actual production, they concern climatic conditions and system configurations different from those analyzed in south-eastern Poland. From the perspective of sustainable energy planning, the design prediction should provide a reference rather than replace operational measurements. Monitoring makes it possible to determine whether expected production is achieved, identify the common effect of an atypical weather year, and distinguish it from problems affecting an individual system [21,30].
The literature review identified a need to integrate several elements that have often been considered separately: assessment of agreement with archived design predictions, assessment of actual normalized yield, analysis of interannual and seasonal variability, and statistical separation of weather and system effects. Few multi-year studies have applied such a framework simultaneously to several rooftop installations operating within the same region but differing in capacity, orientation, tilt, and inverter configuration [7,12,15,17].
The aim of this study was to conduct a three-year assessment of the agreement between annual design predictions generated using PV*SOL, a commercial photovoltaic system design and simulation software, and the monitored performance of three rooftop photovoltaic systems located in one city in south-eastern Poland. The analysis compared actual and predicted energy production, assessed normalized productivity and interannual stability, characterized monthly and seasonal variability, and determined the importance of meteorological conditions, differences among systems, and seasonality. The novelty of the study lies in combining these elements within a single analytical framework while treating agreement with the design estimate and actual system productivity as related but distinct aspects. Combining archived PV*SOL reference values with three years of monitoring data, normalized indicators, error measures, and statistical analysis enables a more reliable assessment of system performance and reduces the risk of equating a small prediction error with high productivity or high absolute production with effective use of installed capacity.
The practical significance of this study includes quality control of design assumptions, development of local reference values, and support for decisions concerning system operation and the further deployment of distributed energy. The study contributes to United Nations Sustainable Development Goal 7 (SDG 7: Affordable and Clean Energy) by providing verified evidence for the planning, monitoring, and deployment of rooftop photovoltaic systems. The results may support more reliable PV system design and assessment and thereby promote the effective use of renewable energy in local energy systems.
The remainder of the paper is structured as follows. Section 2 presents the study area, PV system characteristics, monitoring data, performance indicators, and statistical procedures. Section 3 reports the meteorological conditions and the results of the annual, monthly, seasonal, and statistical analyses. Section 4 interprets these findings in the context of previous research, practical applications, and study limitations, whereas Section 5 provides the main conclusions and identifies directions for further research.
2. Materials and Methods
2.1. Study Area
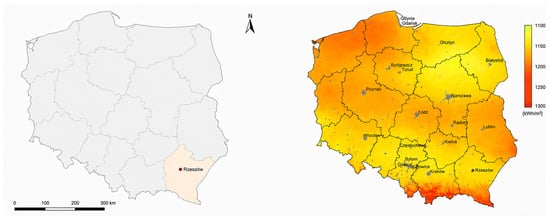
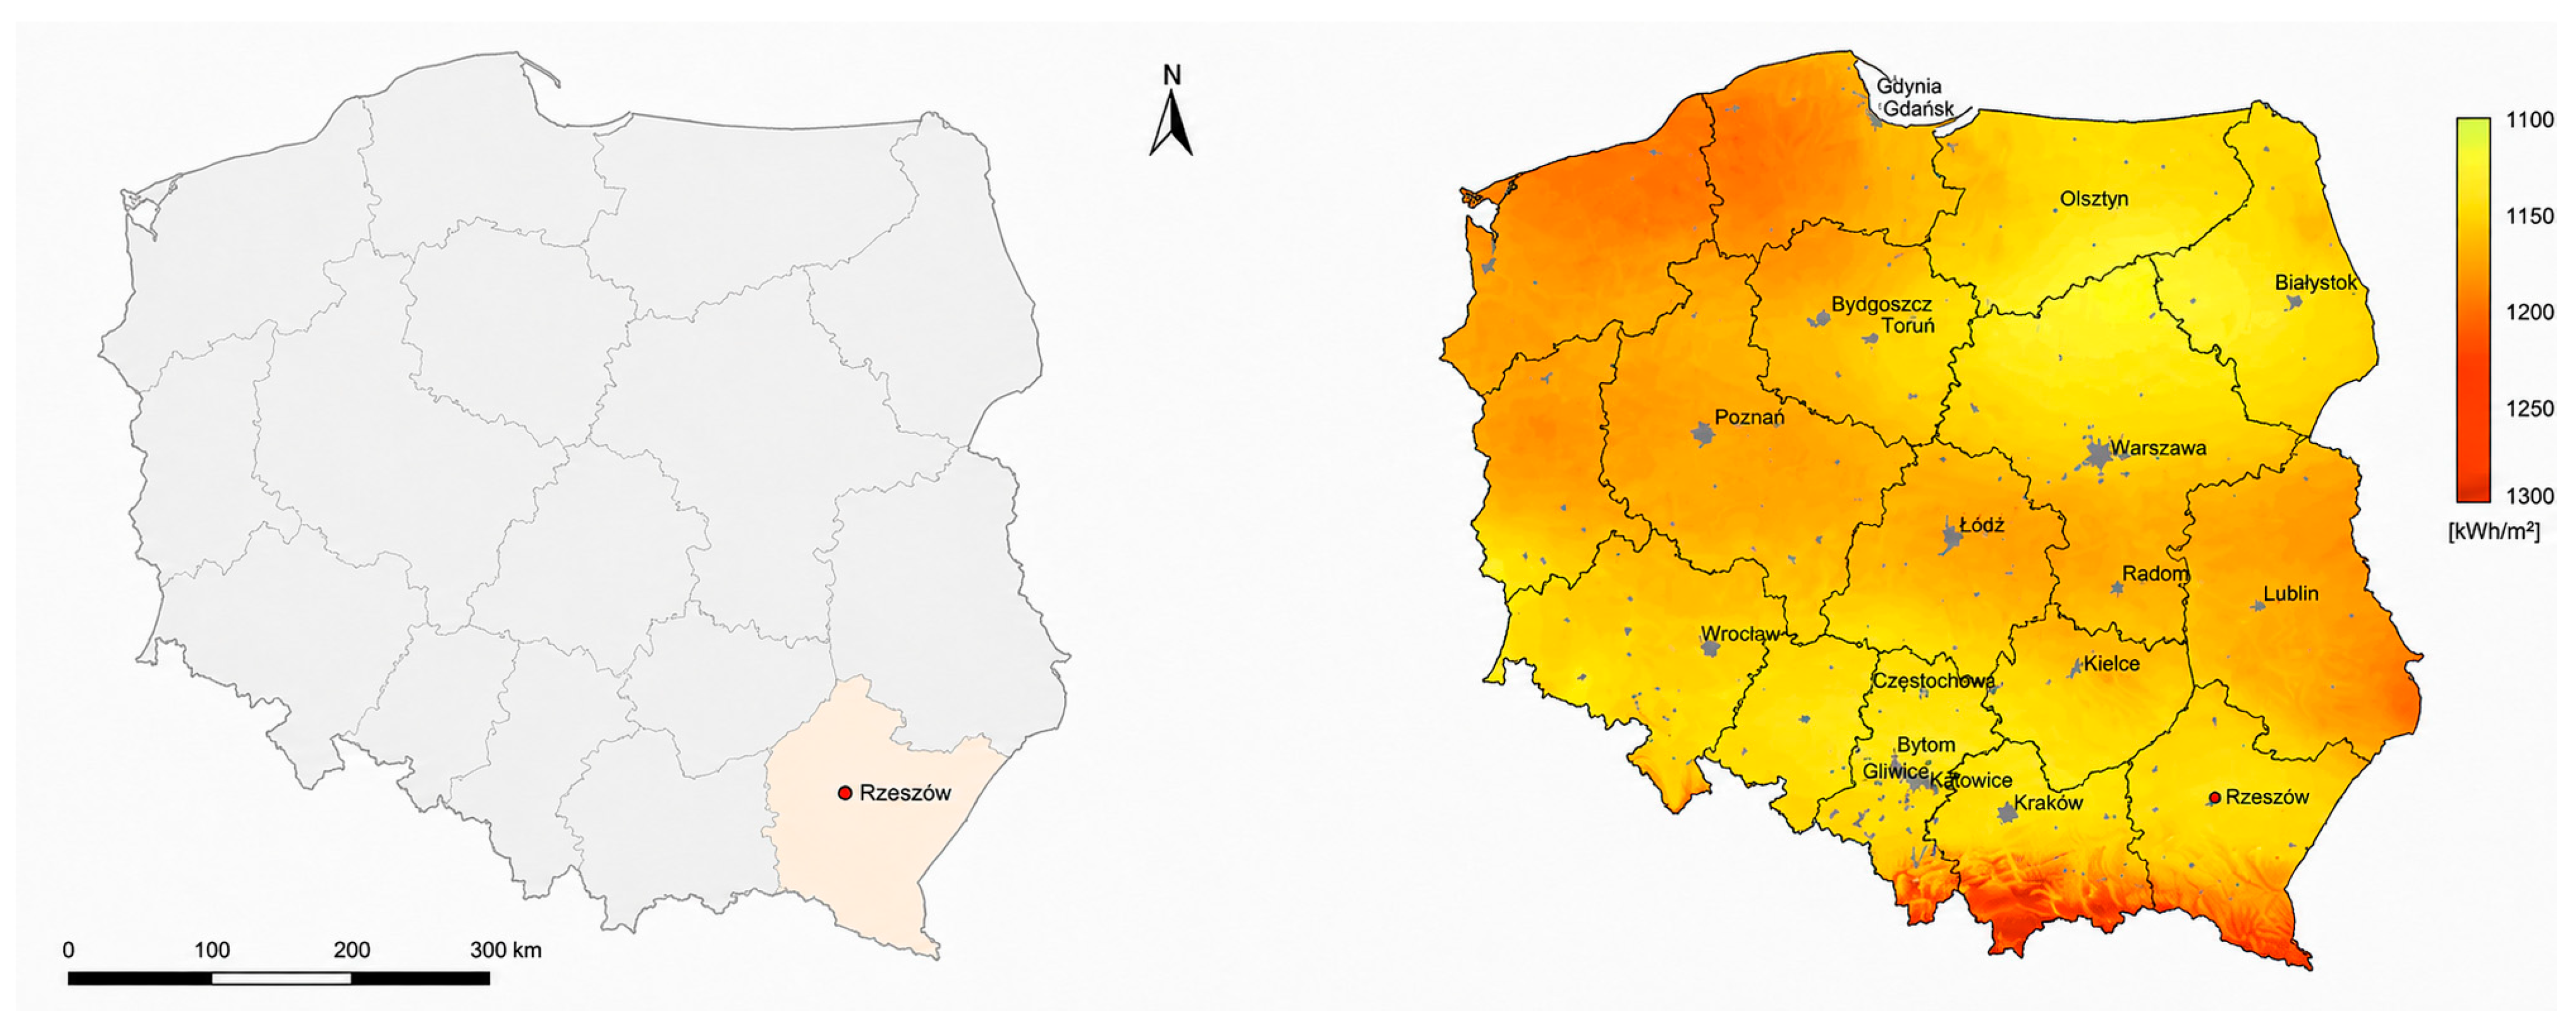
Three grid-connected rooftop PV installations located in Rzeszów, in the Podkarpackie Voivodeship of south-eastern Poland, were included in the analysis. The city was chosen because rooftop PV deployment has expanded rapidly in this part of Poland, providing a relevant setting for evaluating the operational performance of distributed photovoltaic systems. In terms of climate, the region is broadly representative of central and southern Poland while offering comparatively favorable solar-resource conditions. The systems operated under similar regional climatic conditions, and the analysis covered three complete calendar years, from January 2023 to December 2025. Meteorological data from the European Center for Medium-Range Weather Forecasts Reanalysis v5 (ERA5) [31], representative of the central part of Rzeszów, were used as a common meteorological reference for all analyzed PV systems. The meteorological variables were used to characterize the general atmospheric conditions in the study area rather than rooftop-specific microclimatic conditions or direct plane-of-array irradiance. The location of Rzeszów and the spatial distribution of annual solar irradiation across Poland are shown in Figure 1.
Figure 1.
Location of Rzeszów in south-eastern Poland (left) and spatial distribution of annual global irradiation on an optimally inclined plane across Poland (right). Source: The left panel was created by the authors; the right panel was obtained from PVGIS [32] and incorporated into the composite figure.
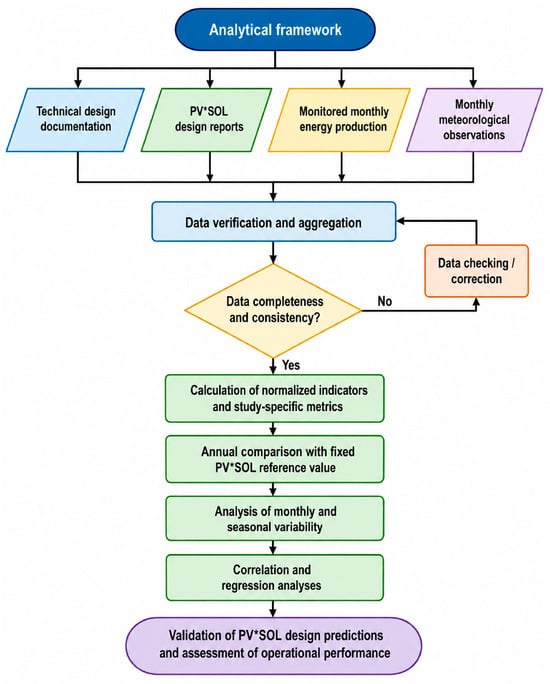
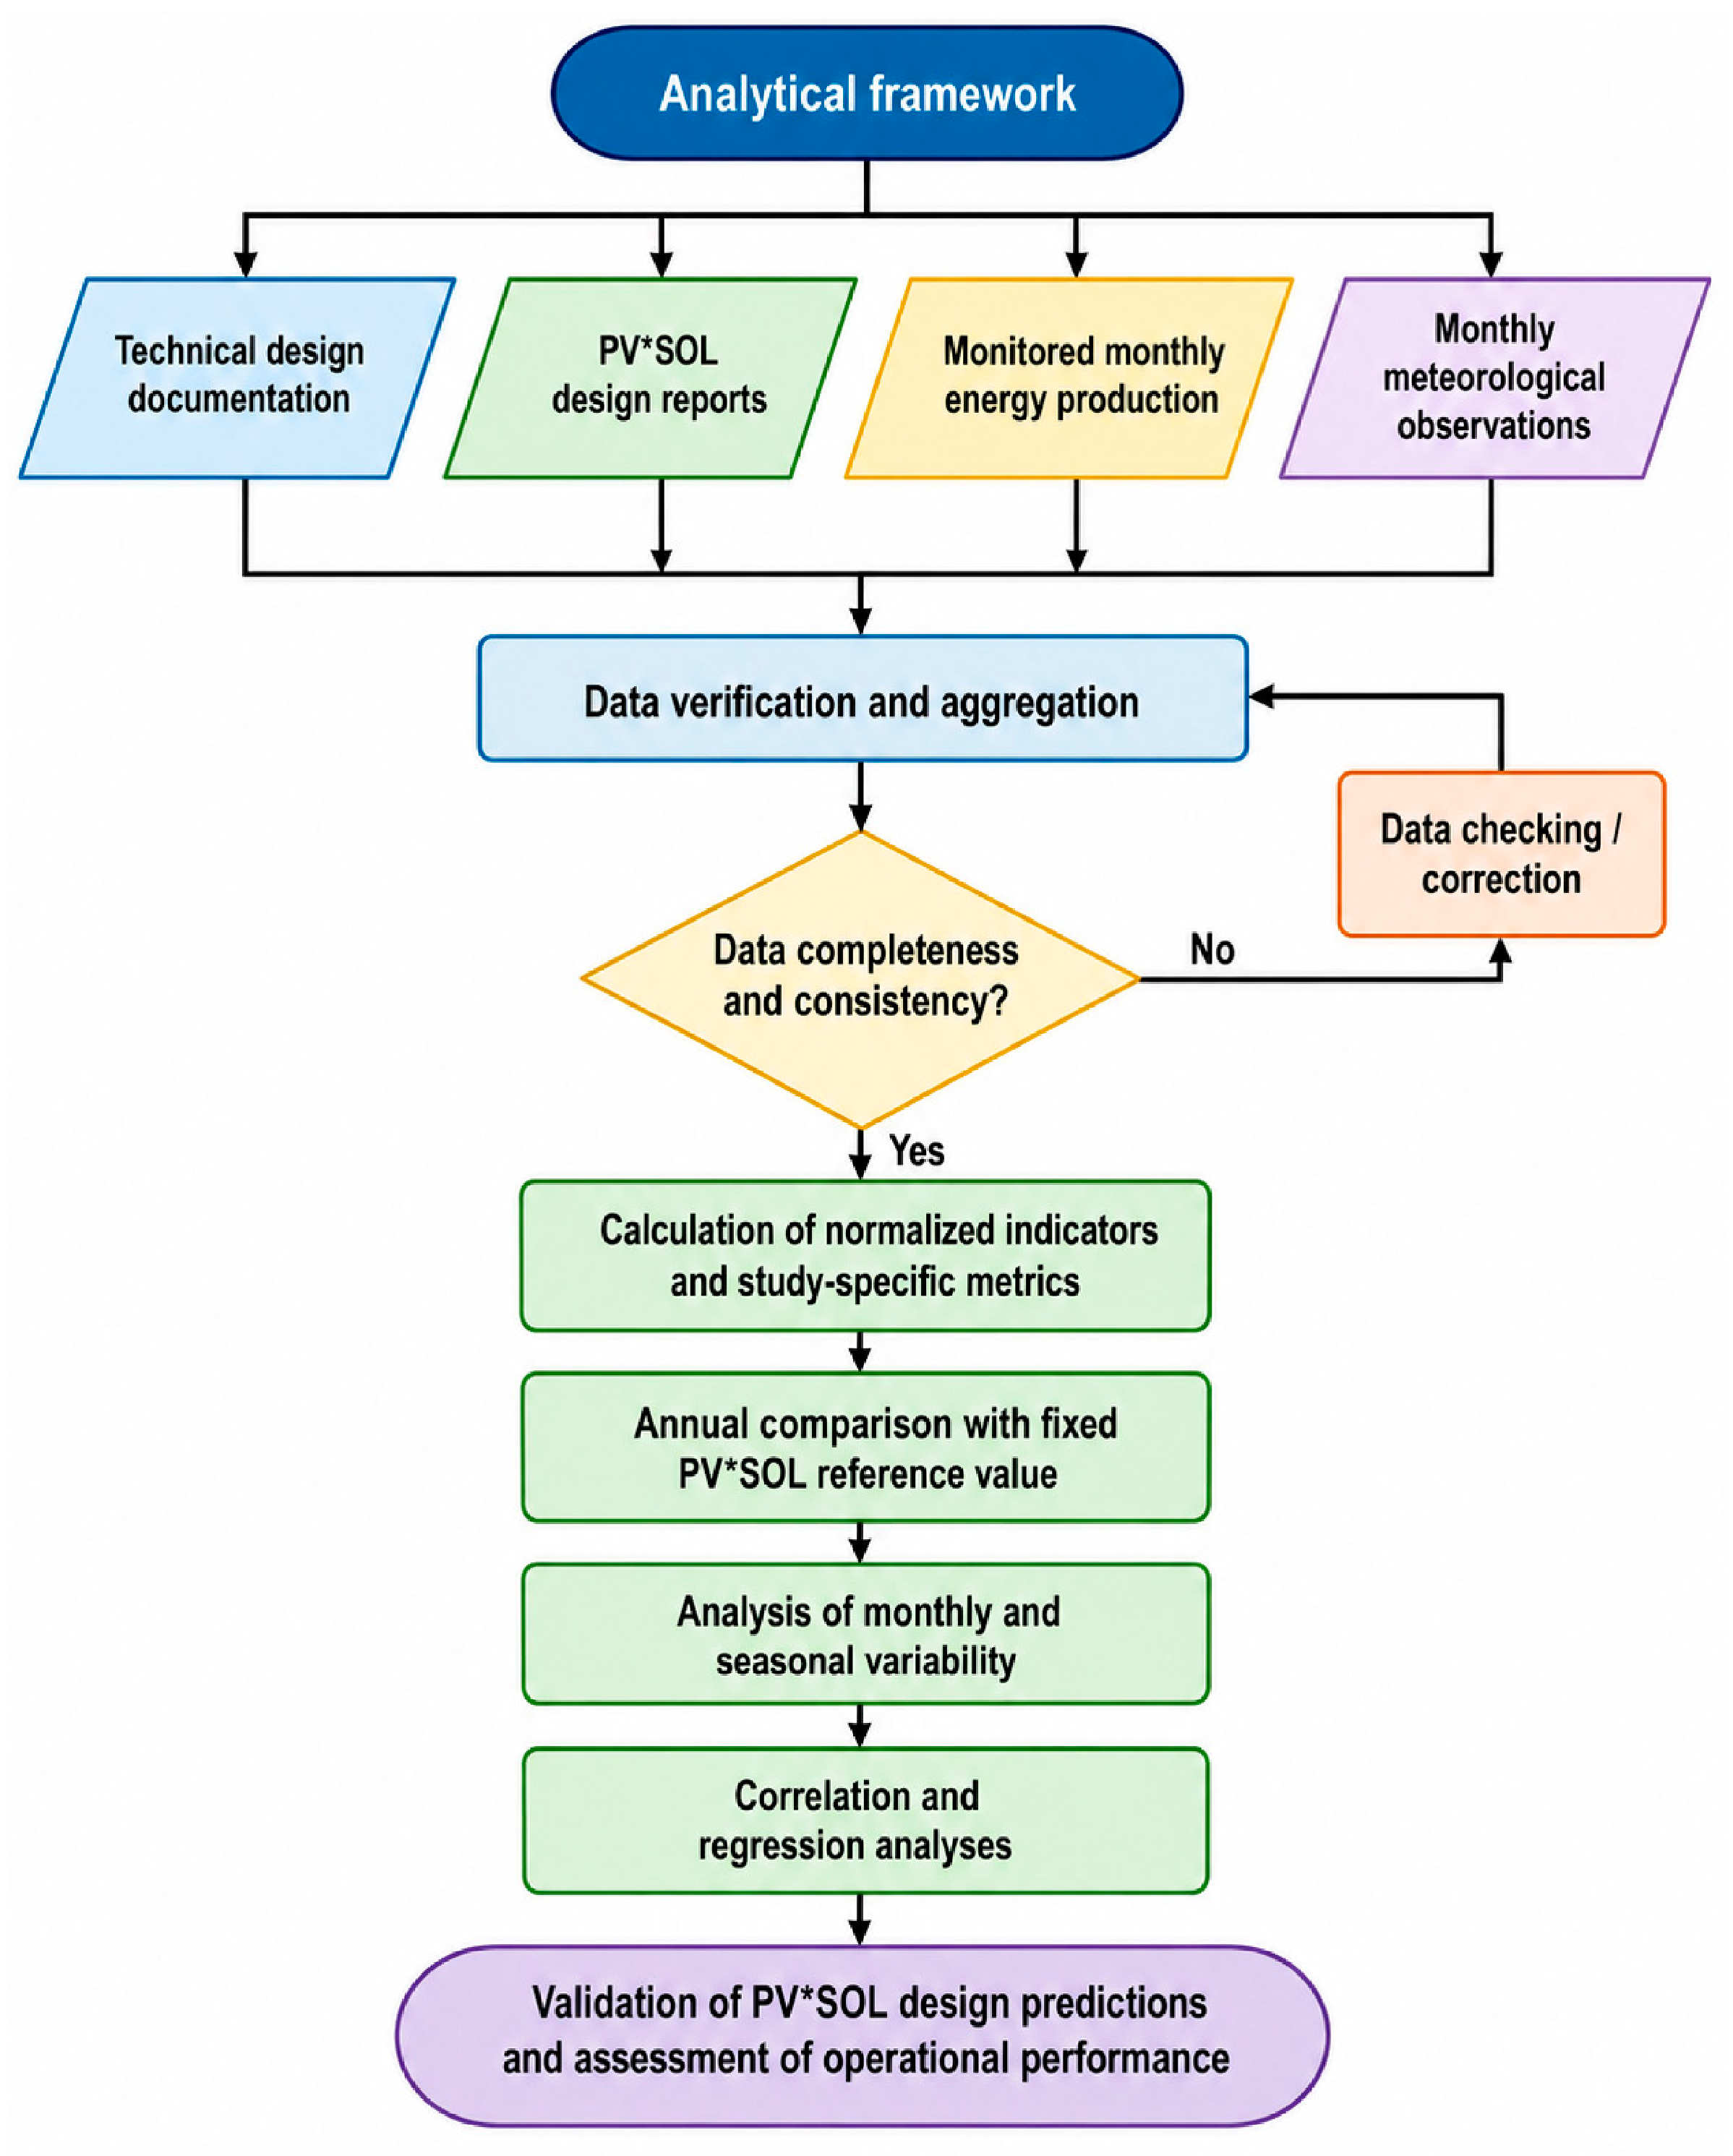
The analytical framework combined four groups of source data: technical design documentation, PV*SOL design reports, monitored monthly energy production, and monthly meteorological data. The procedure included verification and aggregation of monitoring data, calculation of normalized indicators and study-specific metrics, annual comparison with the fixed PV*SOL reference value, analysis of monthly and seasonal variability, and correlation and regression analyses. The complete workflow is presented in Figure 2.
Figure 2.
Analytical workflow used to compare PV*SOL design predictions with monitored energy production and to assess the operational performance of the analyzed rooftop photovoltaic systems. Source: authors’ own elaboration.
2.2. Characteristics and Documentation of the PV Systems
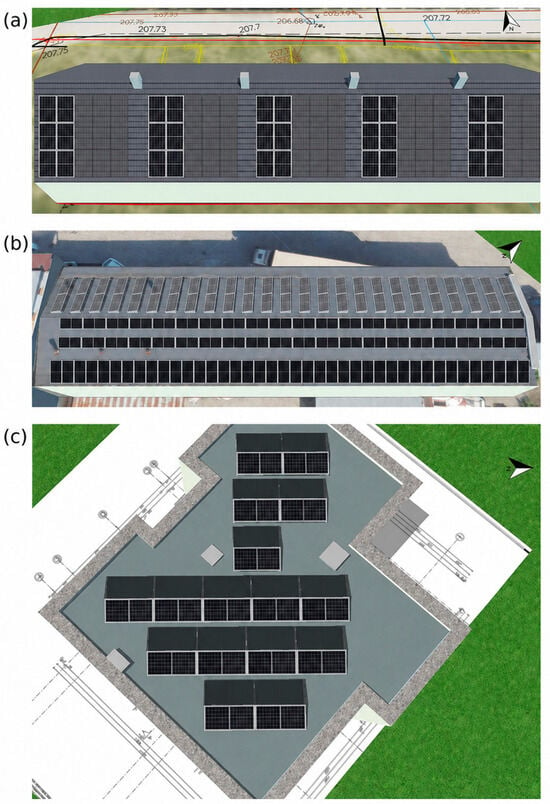
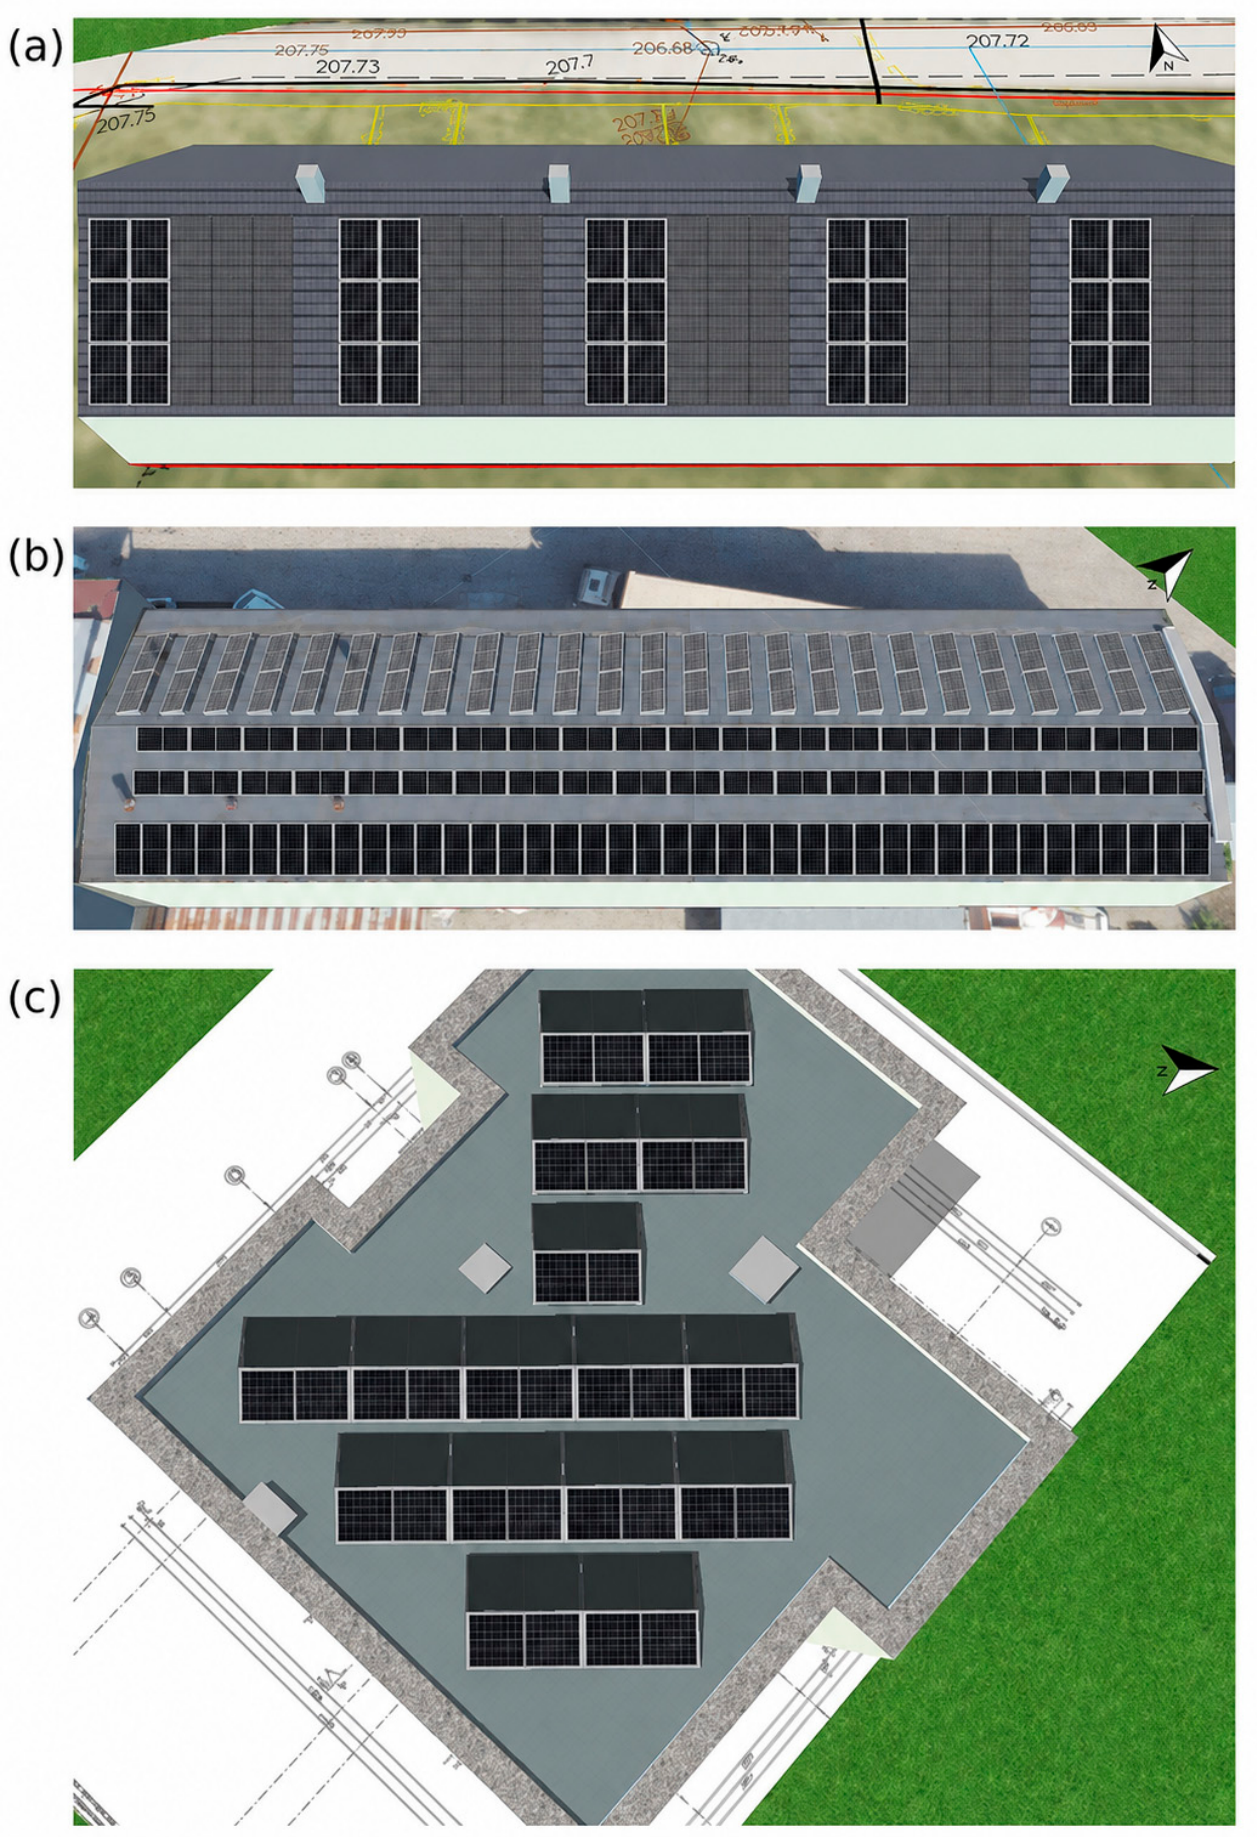
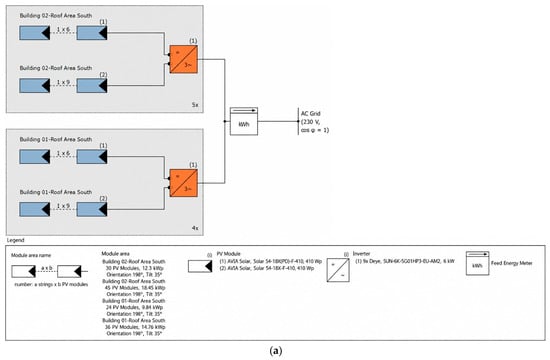
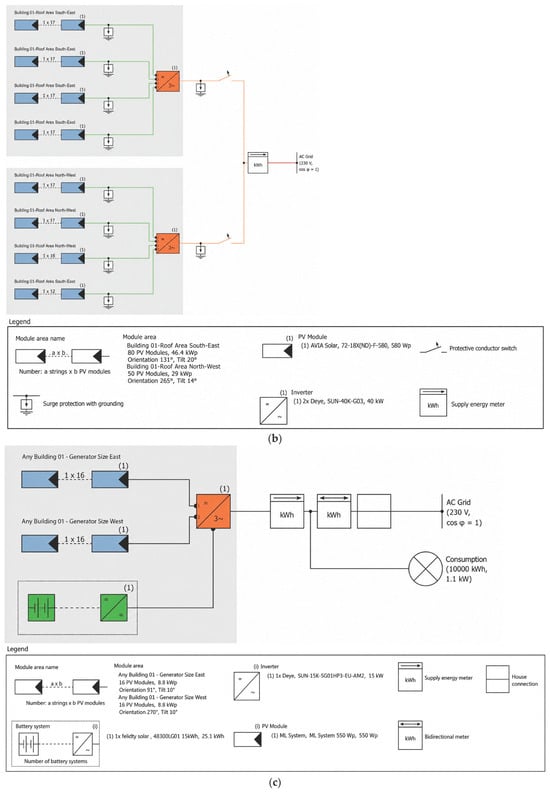
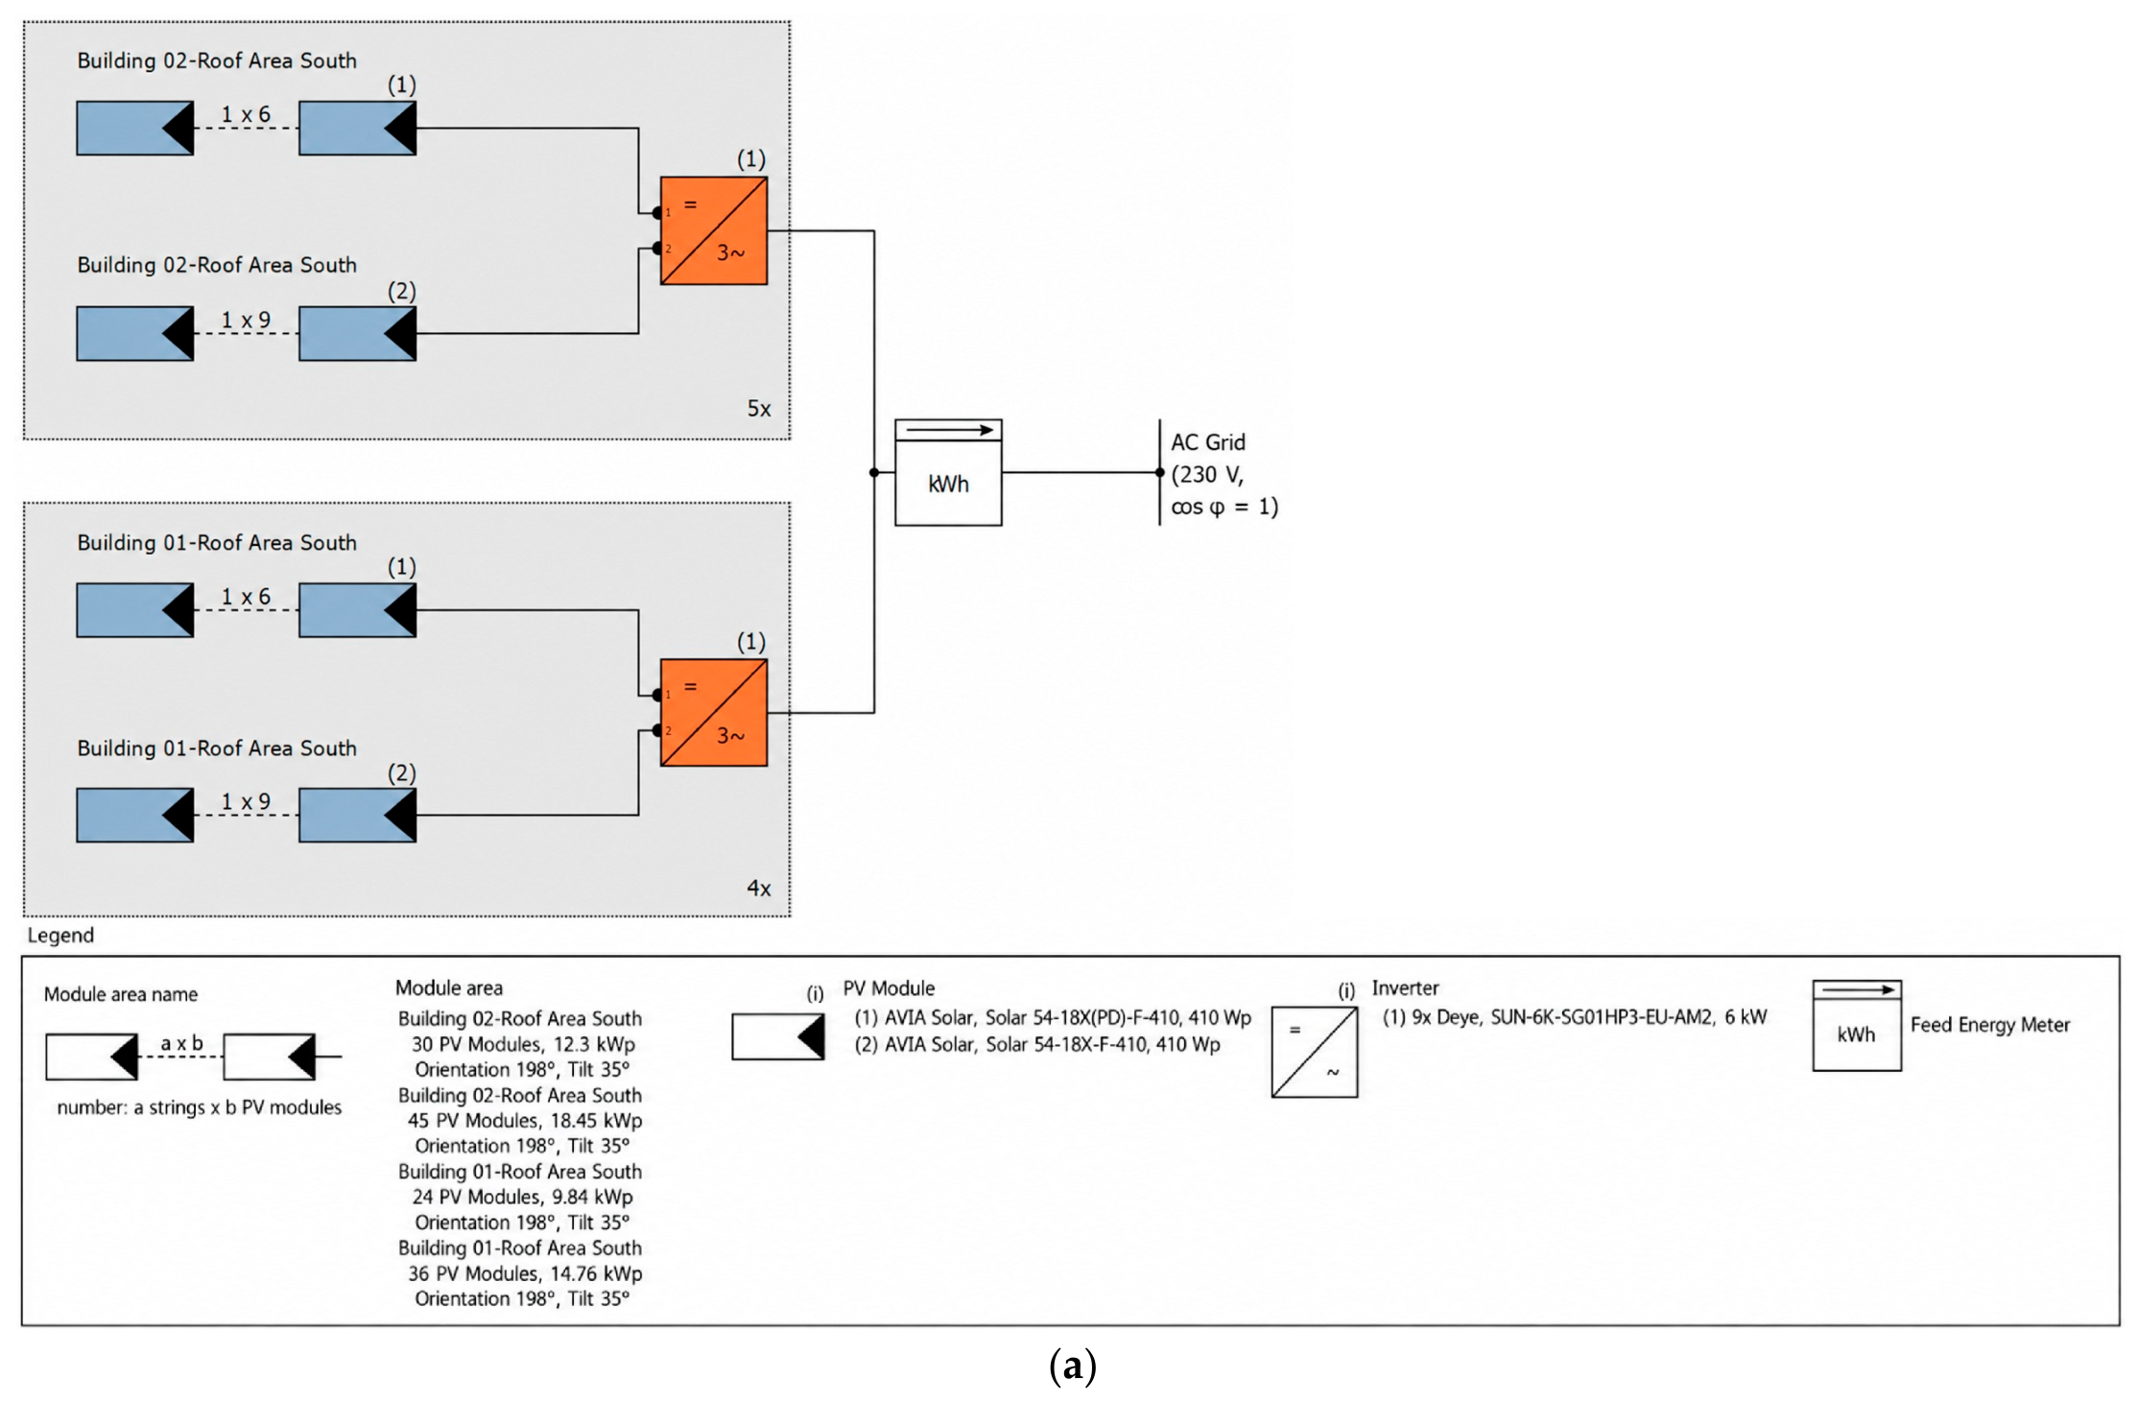
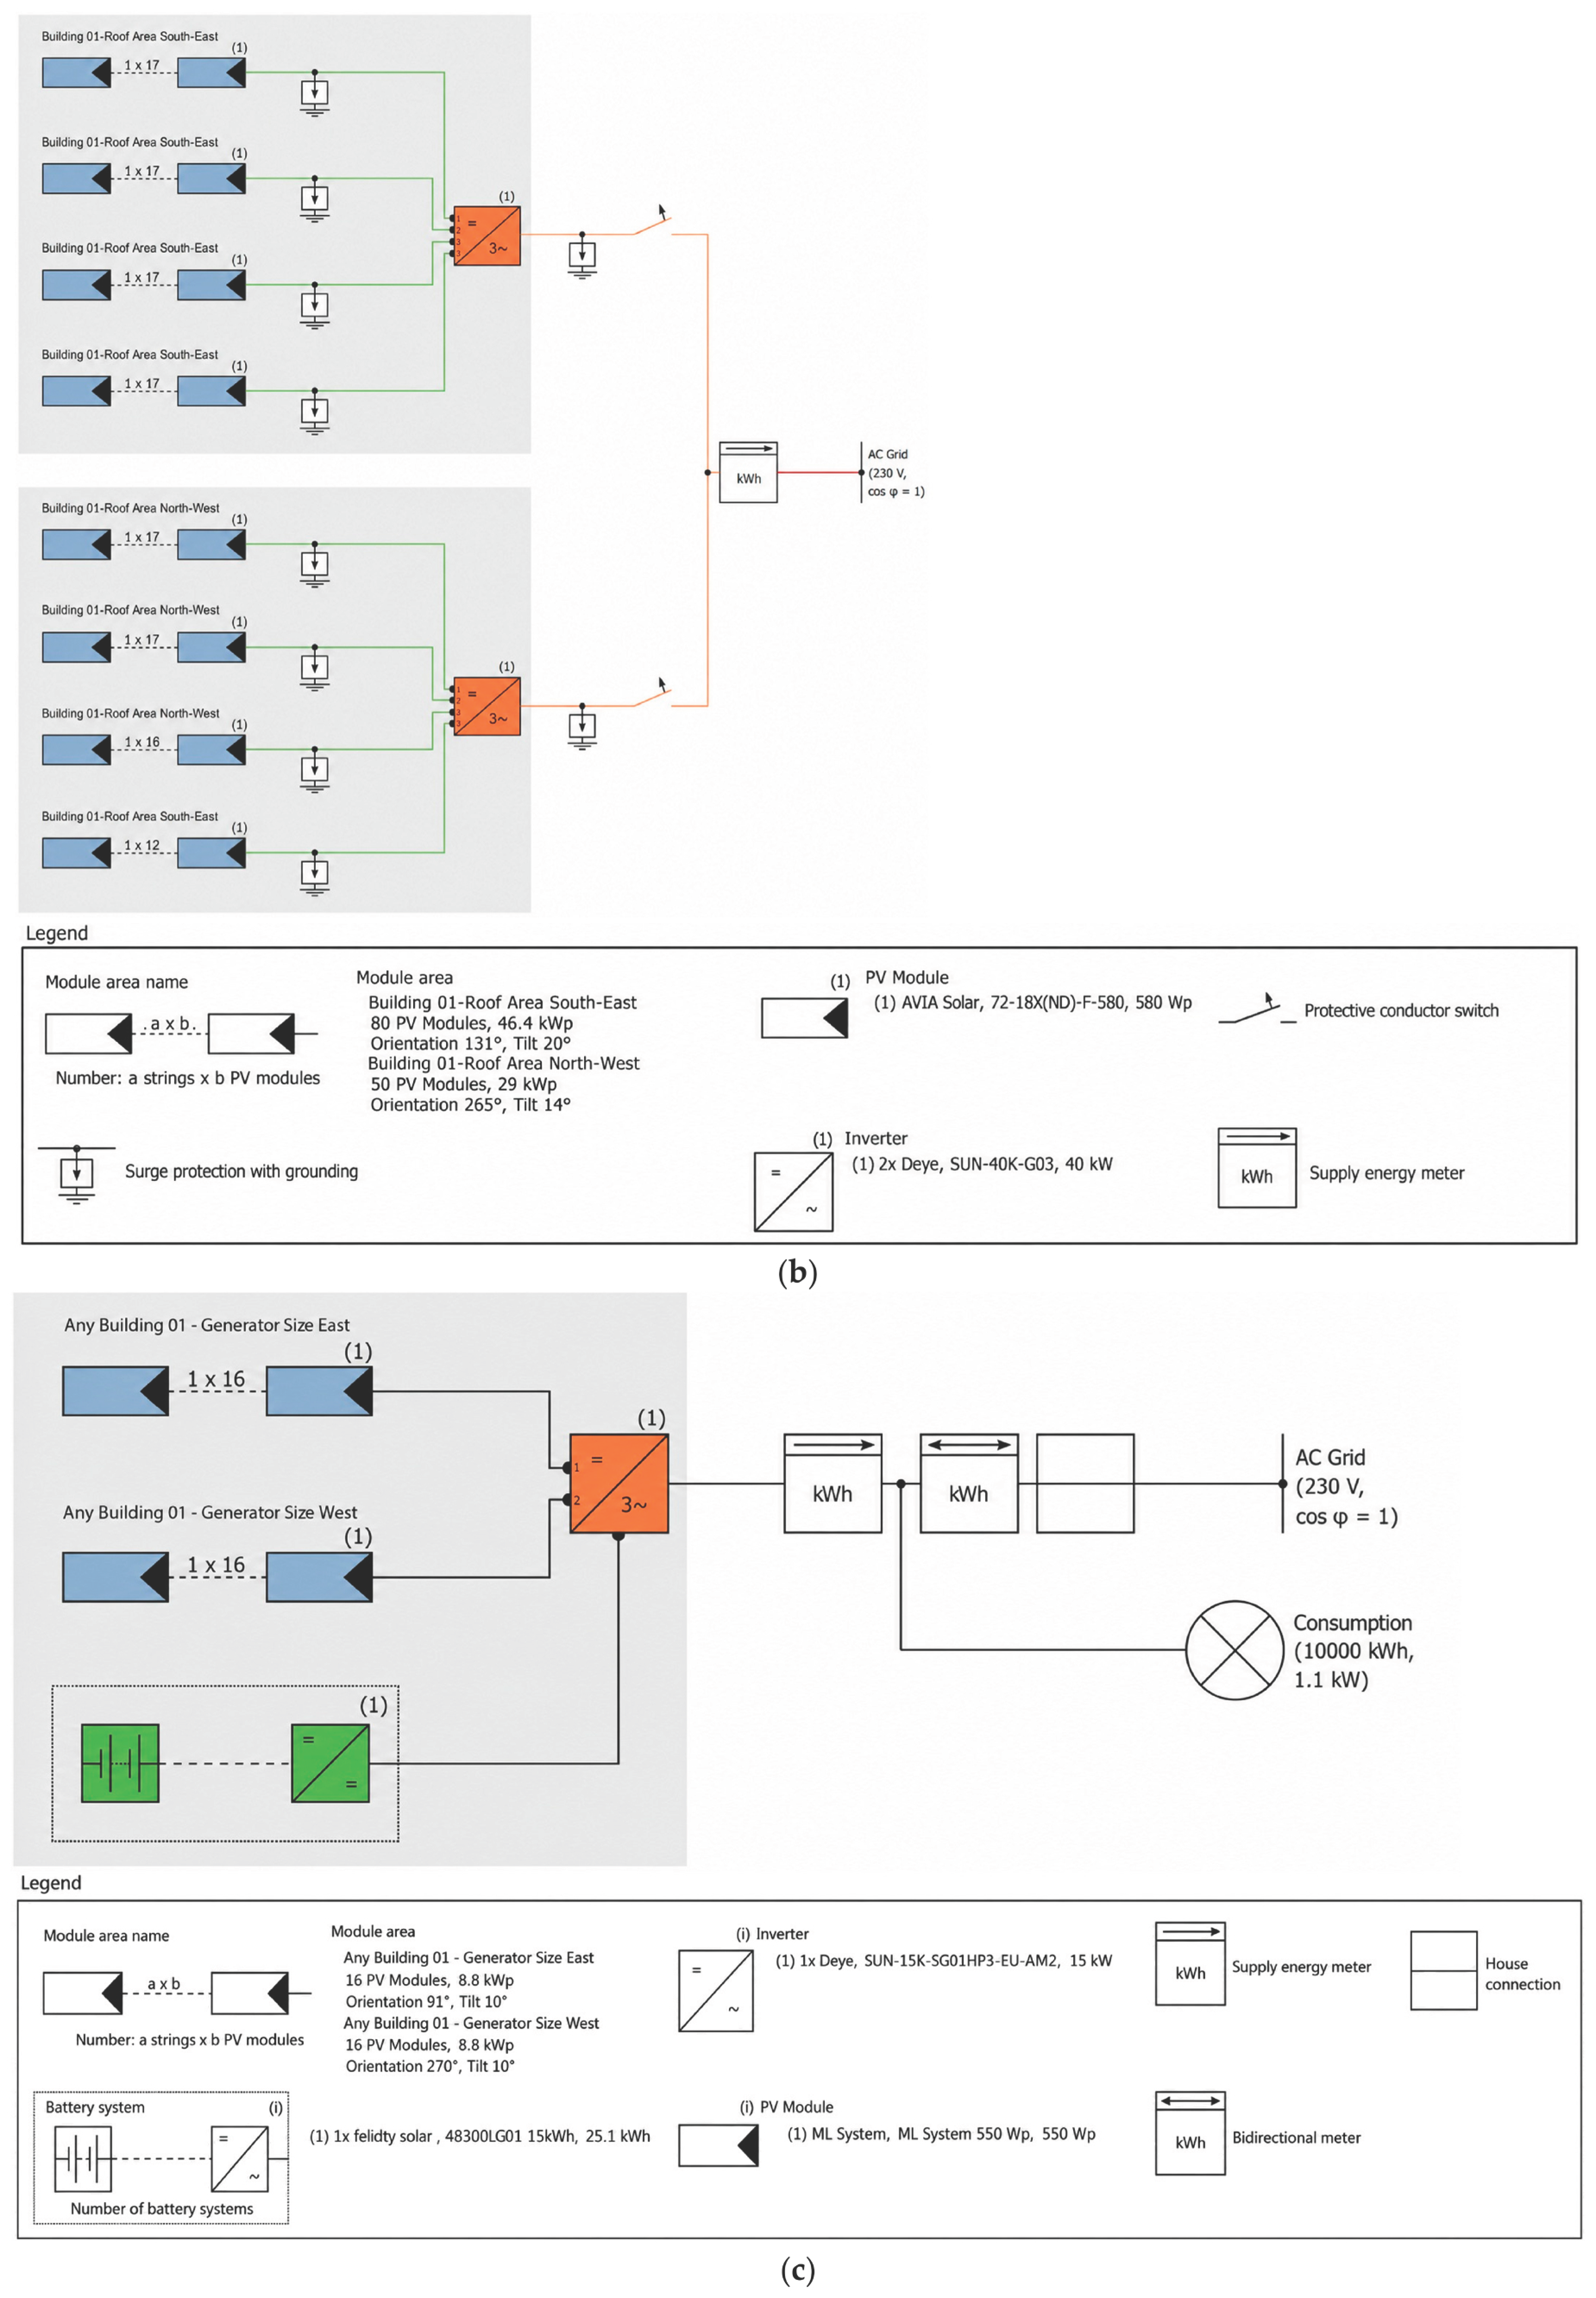
For comparative purposes, the three installations were labelled PV-I, PV-II, and PV-III throughout the manuscript. These labels are purely organizational and should not be interpreted as a ranking of technical quality or installation workmanship. Technical characteristics were extracted from the available design records, including generator capacity, module number and rating, roof-surface distribution, azimuth, tilt, inverter arrangement, and the annual reference production estimated using PV*SOL (premium version; Valentin Software GmbH, Berlin, Germany). The design documentation was also used to present roof layouts, array subdivision, and the main structural and functional differences among the systems (Figure 3 and Figure 4).
Figure 3.
Design layouts of the analyzed rooftop photovoltaic systems: (a) PV-I; (b) PV-II; and (c) PV-III. Source: technical design documentation provided by ML Dystrybucja.
Figure 4.
Electrical configuration schemes of the analyzed rooftop photovoltaic systems: (a) PV-I; (b) PV-II; and (c) PV-III. Source: technical design documentation provided by ML Dystrybucja.
The analyzed systems differed in scale, module arrangement, roof orientation, tilt angle, and inverter configuration. This diversity enabled a comparison of systems operating under similar regional conditions but representing different technical solutions. Differences among the systems were therefore interpreted as effects of the complete system configurations rather than as independent effects of a single parameter, such as orientation or nominal capacity.
PV-I had a total nominal DC capacity of 55.35 kWp, provided by 135 monocrystalline modules with a rated power of 410 W each. The modules were distributed over four roof surfaces belonging to two buildings and were predominantly south-facing, with a tilt of 35° and an azimuth of approximately 198°. The installation used nine three-phase Deye inverters (Ningbo Deye Inverter Technology Co., Ltd., Ningbo, China), each rated at 6 kW. Its archived PV*SOL design estimate was 52.775 MWh per year, equivalent to a predicted final yield of 953.5 kWh/kWp. PV-II, the largest of the three installations, had a nominal DC capacity of 75.40 kWp and consisted of 130 monocrystalline 580 W modules. Of this capacity, 46.40 kWp was installed on the south-eastern roof section (azimuth 131°, tilt 20°), while the remaining 29.00 kWp was located on the western section (azimuth 265°, tilt 14°). Two 40 kW Deye inverters were used. The annual PV*SOL design estimate was 67.676 MWh, corresponding to a predicted final yield of 897.6 kWh/kWp. PV-III had a nominal DC capacity of 17.60 kWp and comprised 32 monocrystalline modules rated at 550 W. The array was divided equally between the eastern and western roof sections, with 16 modules on each side, azimuths of 91° and 270°, and a tilt of 10°. The system operated with one 15 kW Deye inverter. PVSOL predicted an annual production of 15.517 MWh, equivalent to a final yield of 881.6 kWh/kWp. PV-III also included an energy storage system; however, storage operation was not evaluated because separate information on energy flows, state of charge, and the storage control strategy was not available. The principal differences among the installations in capacity, module arrangement, orientation, tilt, inverter configuration, and annual PVSOL reference production are summarized in Table 1.
Table 1.
Technical characteristics and annual PV*SOL reference values for the analyzed rooftop PV systems.
The archived PV*SOL design reports used meteorological datasets representative of the Rzeszów area. The simulations were based on archived Meteonorm meteorological data with hourly temporal resolution and incorporated the documented module and inverter models, array orientations and tilt angles, shading effects, and system-specific energy loss balances. The archived reports indicated yield reductions due to shading of 0.7%, 1.1%, and 0.9% for PV-I, PV-II, and PV-III, respectively. Mismatch losses based on manufacturer data were 2.00% for all three systems. Losses associated with deviation from the nominal module temperature were 1.99%, 1.02%, and 1.08%, while losses associated with conversion from DC to AC were 5.47%, 5.83%, and 6.42% for PV-I, PV-II, and PV-III, respectively. The reports also included module degradation assumptions corresponding to 85% remaining nominal module power after 30 years.
2.3. Monitoring Data
Monthly electricity production data were obtained from the monitoring systems associated with each PV installation. For PV-III, monthly electricity production data were obtained directly from the monitoring system of the hybrid inverter rather than from the bidirectional grid meter. Separate time-series data on battery charging, battery discharging, and grid-export energy were unavailable and were not analyzed as independent energy flow variables. Thirty-six monthly observations were available for each system from January 2023 to December 2025, yielding 108 installation-month observations in total. Annual energy production was calculated as the sum of the 12 monthly values recorded in each calendar year. Because of data availability, the analysis was performed at a monthly resolution; hourly data were not available.
2.4. Indicators of Energy Productivity, Seasonality, and Agreement with PV*SOL Design Estimates
Differences in nominal capacity prevent meaningful comparison of the systems based solely on absolute energy production. Therefore, the assessment was based on normalized energy productivity indicators, seasonal characteristics, interannual variability, and measures of agreement between monitored annual production and the values predicted in the PV*SOL design documentation. The terminology and definition of final yield were adopted in accordance with IEC 61724-1:2021 [33]. Capacity factor was used as a common indicator of installed-capacity utilization, whereas seasonal yield, relative deviation, CV, and nRMSE were used as auxiliary measures adopted for this study. With the exception of final yield, these indicators should not be interpreted as procedures required by IEC 61724-1. The annual PV*SOL values were treated exclusively as fixed simulation-based reference values from the design documentation, rather than as measurements of irradiance or energy production or as a conventional performance ratio.
Final yield, Yf, was calculated according to [33]:
where
Yf = EAC/P0
Yf—final yield for the analyzed period [kWh/kWp];
EAC—monitored AC electricity production [kWh];
P0—nominal generator capacity [kWp].
Final yield was calculated monthly, seasonally, and annually. The indicator allows systems of different capacities to be compared; however, without plane-of-array irradiance measurements, it is not a measure of total conversion efficiency or performance ratio.
Capacity factor, CF, was used as an additional, commonly applied indicator of installed-capacity utilization [34]. It was not treated as a substitute for final yield or as an indicator required by IEC 61724-1. It was calculated as follows:
where
CF = EAC/(P0 × t) × 100%
CF—capacity factor during the analyzed period [%];
P0—nominal generator capacity [kWp];
t—number of hours in the analyzed period [h].
For annual calculations, 8760 h was used for 2023 and 2025 and 8784 h for the leap year 2024. For the seasonal analysis, the year was divided into winter (December–February), spring (March–May), summer (June–August), and autumn (September–November). Seasonal yield represented the aggregated final yield for the months included in a given season and was not treated as a separate indicator defined in IEC 61724-1. It was calculated for each system and year as follows:
where:
Yf,s = EAC,s/P0
Yf,s—final yield in season s [kWh/kWp];
EAC,s—monitored energy produced in season s [kWh];
s—analyzed season.
The annual relative deviation of monitored production from the fixed annual PV*SOL reference value was calculated as an auxiliary agreement indicator adopted in this study:
where:
δi = [(Eobs,i − EPV*SOL)/EPV*SOL] × 100%
δi—relative deviation of monitored production from the annual PV*SOL reference value in year i [%];
Eobs,i—monitored annual production in year i [MWh];
EPV*SOL—annual production predicted in the PV*SOL design [MWh].
Positive values indicate production above the prediction, whereas negative values indicate production below it. The indicator does not correct the prediction for the actual weather conditions of a given year. Agreement of the three monitored annual production values for each system with the fixed annual PV*SOL design prediction was evaluated using mean bias error (MBE), mean absolute error (MAE), mean absolute percentage error (MAPE), and root mean square error (RMSE). MBE was used to characterize the average direction of the deviation, MAE to quantify its mean absolute magnitude, MAPE to express the average absolute error in relative terms, and RMSE to place greater emphasis on larger discrepancies. Observed production was used as the denominator in MAPE calculations. Because the design documentation contained one annual PV*SOL value for each system, the calculated measures describe the agreement of successive operating years with a fixed design prediction rather than the accuracy of monthly software outputs [35,36]:
where:
MBE [MWh/year];
MAE [MWh/year];
MAPE [%];
RMSE [MWh/year];
Eobs,i—monitored annual energy production in year i [MWh];
EPV*SOL—annual production predicted in the PV*SOL design [MWh];
i—consecutive annual observation;
n—number of annual observations for a given system, n = 3.
Interannual variability in annual production and final yield was described using the coefficient of variation, CV [37]:
where:
CV—coefficient of variation [%];
SD—standard deviation of the three annual values;
—arithmetic mean of the three years.
To compare RMSE values among systems of different scales, normalized RMSE was calculated:
where:
nRMSE—normalized root mean square error [%];
RMSE—root mean square error [MWh/year];
EPV*SOL—annual production predicted in the PV*SOL design [MWh].
2.5. Statistical Analysis
Relationships between regional meteorological conditions and monthly final yield were assessed using Pearson correlation and ordinary least-squares multiple regression. For each system, relationships between yield and solar irradiation and mean air temperature were analyzed (n = 36). Hierarchical multiple regression was then performed for the combined dataset of 108 installation-month observations by sequentially entering meteorological variables, system identifiers, and season. Unstandardized coefficients, R2, adjusted R2, and ΔR2 were reported. Statistical significance was assessed at α = 0.05. Regression diagnostics included the assessment of residual normality, heteroscedasticity, autocorrelation, multicollinearity, and influential observations. Accordingly, heteroscedasticity- and autocorrelation-consistent standard errors were used for statistical inference. To account for the common seasonal cycle, monthly anomalies of final yield, solar irradiation, and mean air temperature were calculated relative to their corresponding calendar-month means, and the regression was repeated using these anomalies.
3. Results
3.1. Meteorological Conditions
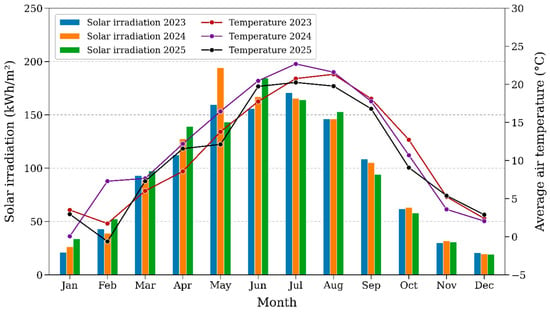
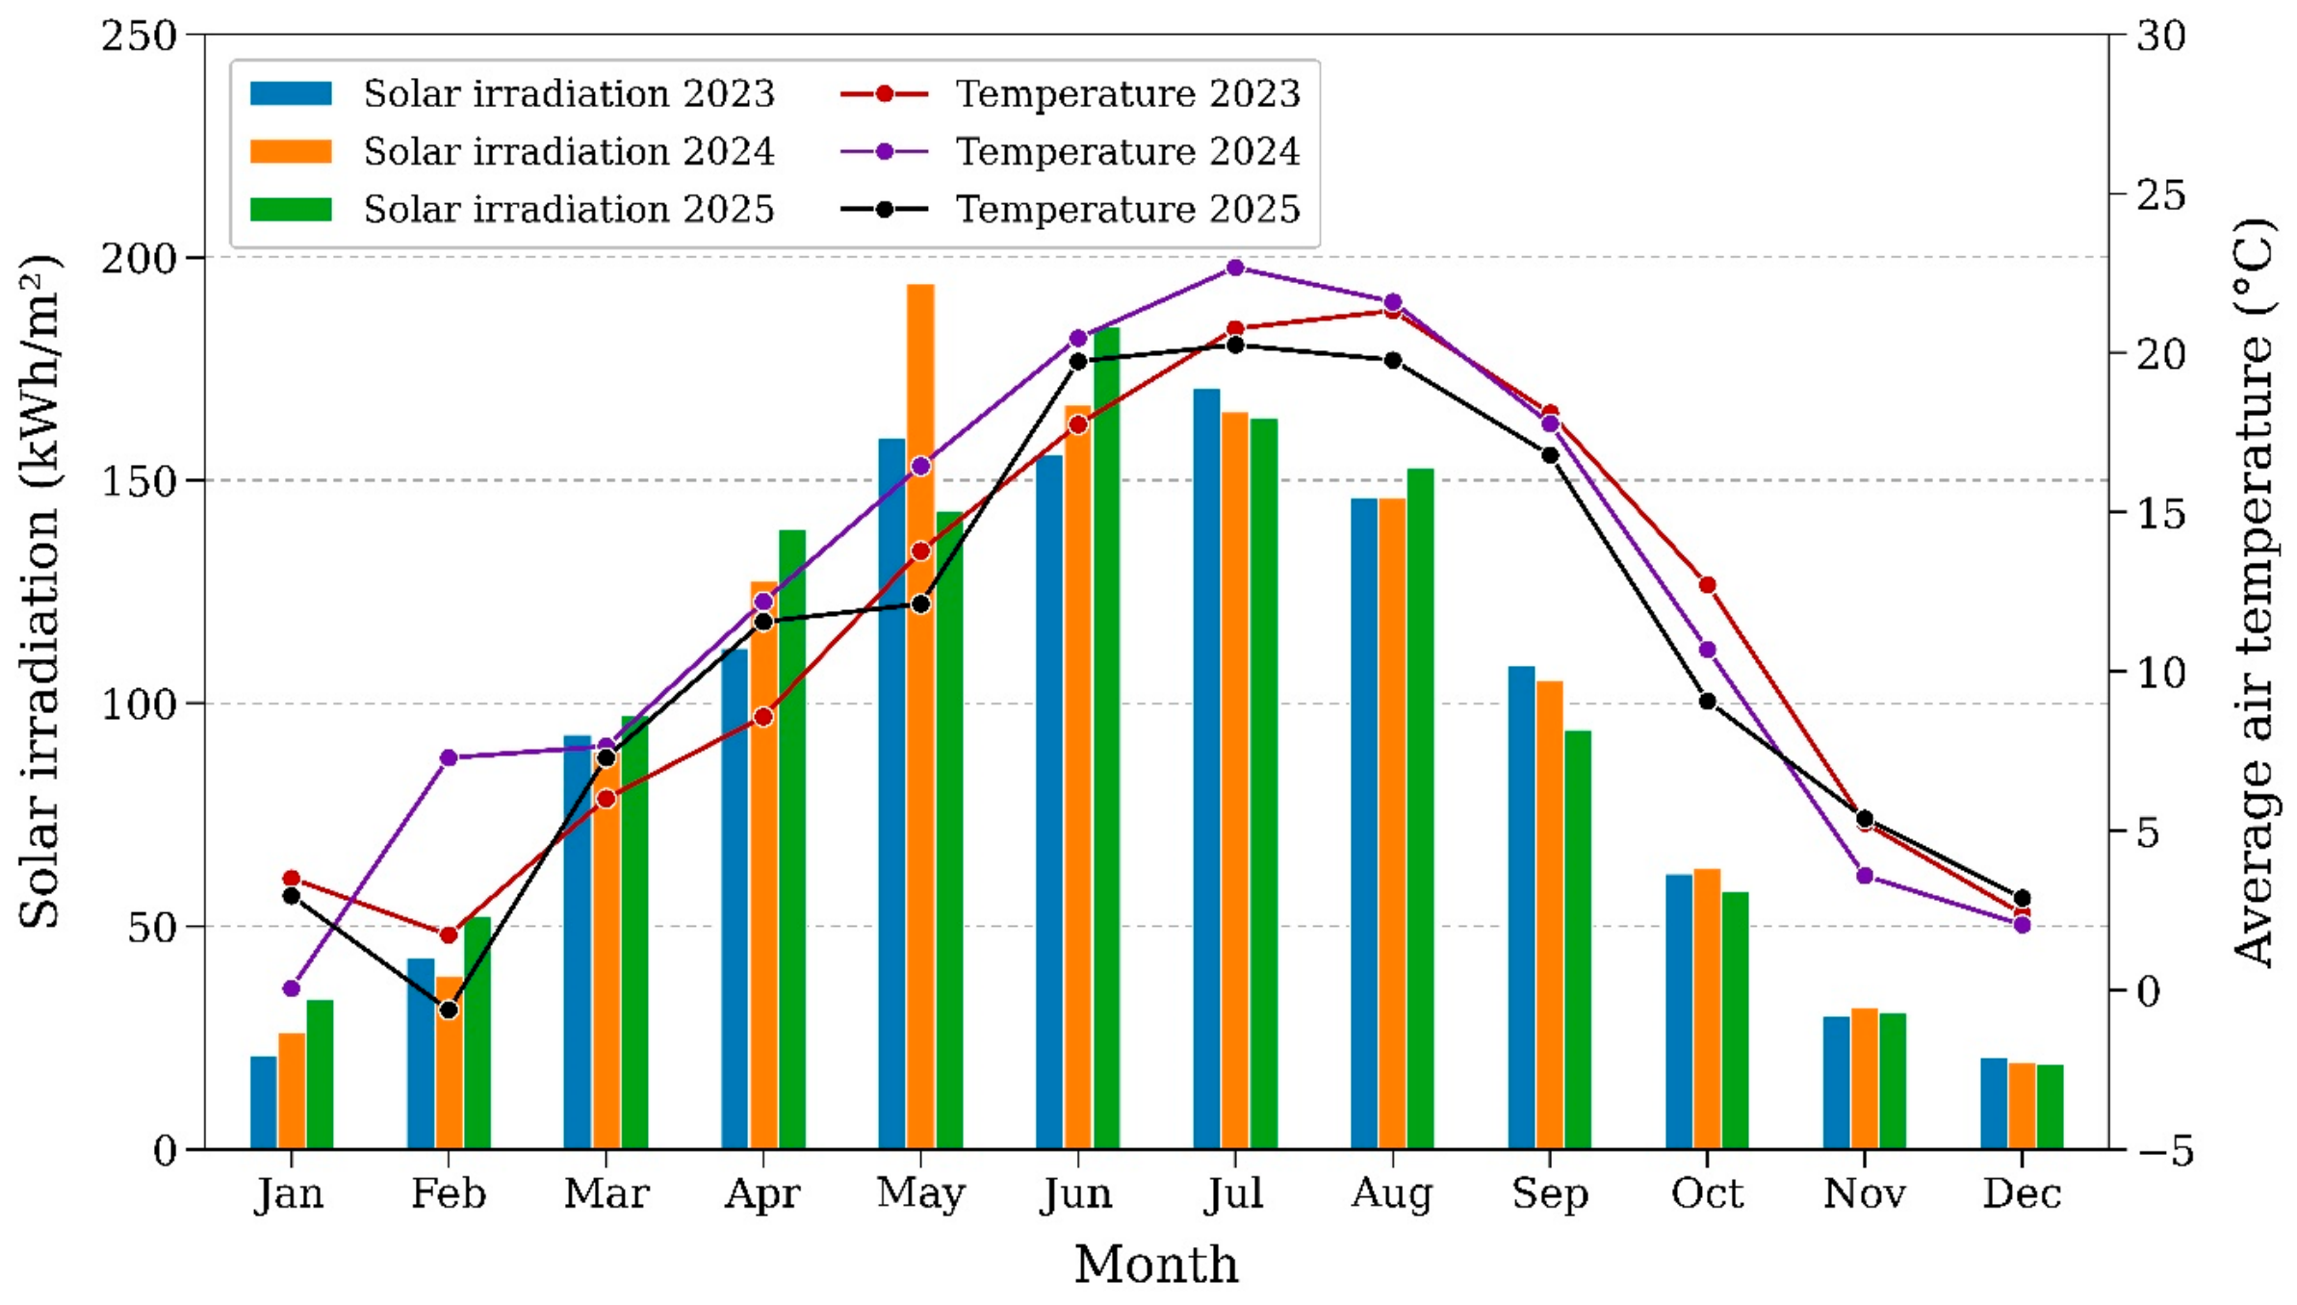
Monthly electricity production data were obtained from the monitoring systems associated with each PV installation. Thirty-six monthly observations were available for each system from January 2023 to December 2025, yielding 108 installation-month observations in total. Annual energy production was calculated as the sum of the 12 monthly values recorded in each calendar year. Because of data availability, the analysis was performed at monthly resolution; hourly data were not available. Meteorological data comprised monthly surface solar irradiation and mean monthly air temperature obtained from the European Center for Medium-Range Weather Forecasts Reanalysis v5 (ERA5) dataset. Annual meteorological characteristics are presented in Table 2, and the monthly courses of both variables are shown in Figure 5. Annual solar irradiation was 1122.88 kWh/m2 in 2023, 1173.63 kWh/m2 in 2024, and 1169.05 kWh/m2 in 2025. The highest value occurred in 2024 and was 4.5% greater than in 2023 and 0.4% greater than in 2025. Mean annual air temperature was 11.1 °C, 11.9 °C, and 10.7 °C, respectively. Thus, 2024 was both the year with the highest solar irradiation and the highest mean air temperature. The monthly course showed clear seasonality, with the highest solar irradiation and temperature generally occurring in late spring and summer and the lowest values in winter. The ERA5 data provided a common meteorological reference representative of the Rzeszów urban area for all analyzed systems.
Table 2.
Annual meteorological characteristics used in the analysis.
Figure 5.
Monthly solar irradiation and mean air temperature used in the analysis for 2023–2025.
3.2. Annual Production and Normalized Productivity
During 2023–2025, the three systems produced a total of 417.159 MWh of electricity. PV-II had the greatest total production, at 208.815 MWh, followed by PV-I at 160.435 MWh, whereas PV-III produced 47.909 MWh. All systems achieved their highest production in 2024. The lowest values for PV-I and PV-II occurred in 2025, whereas PV-III production in 2025 was only slightly lower than in 2023. Because the systems differed in nominal capacity, their actual productivity was also compared using final yield, capacity factor, and the coefficient of variation. Mean annual production, normalized indicators, and the PV*SOL reference yield are presented in Table 3.
Table 3.
Mean annual AC production, interannual variability, normalized indicators, and PV*SOL reference yield for PV-I–PV-III in 2023–2025.
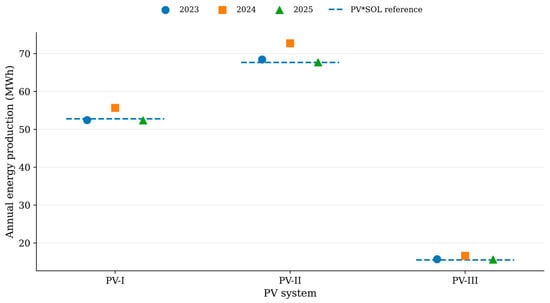
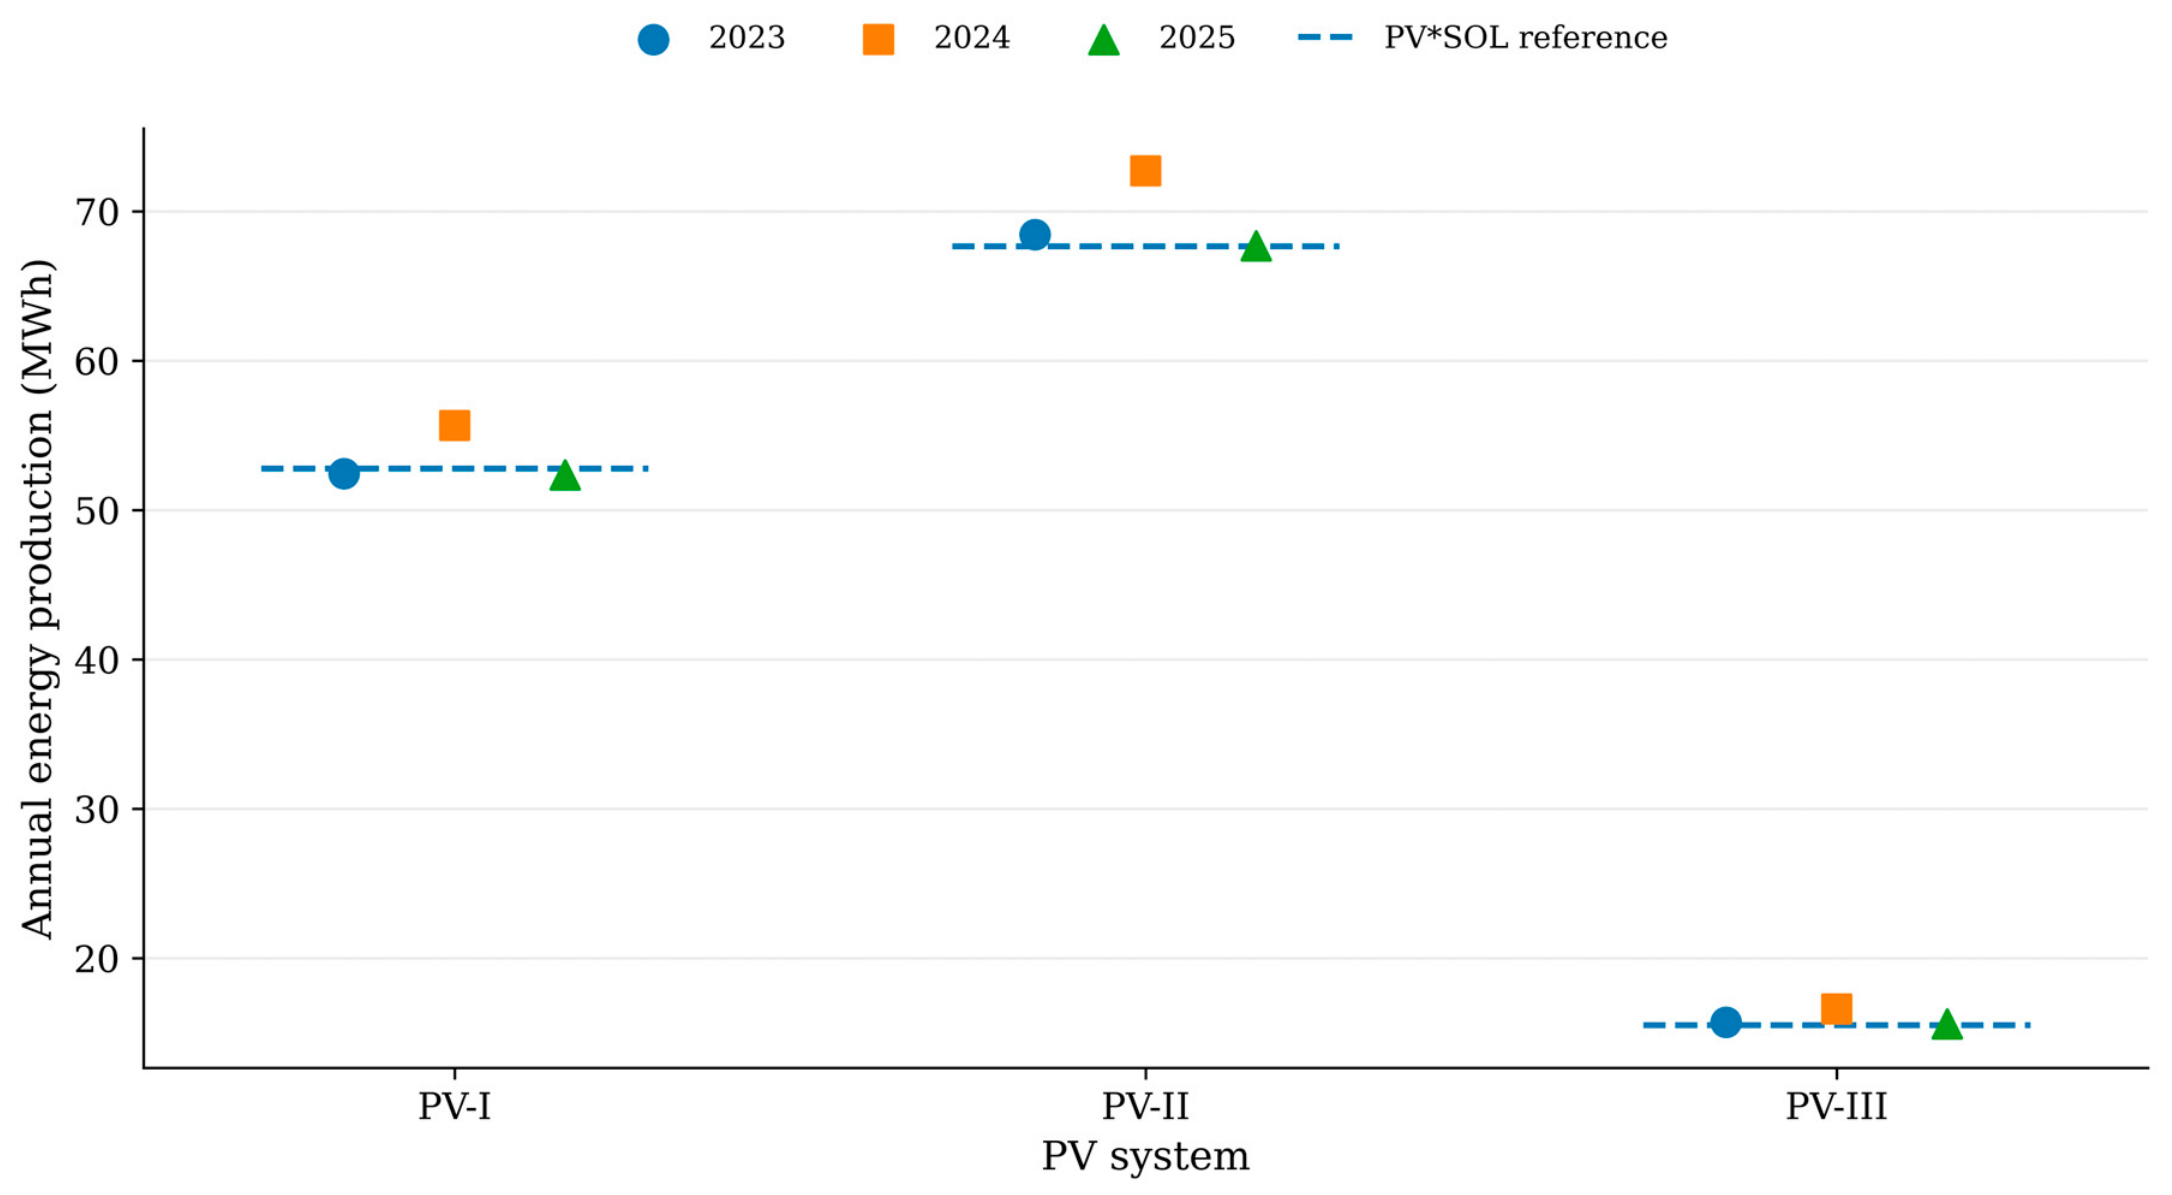
As shown in Table 3, PV-I achieved the highest mean annual final yield, 966.2 kWh/kWp/year, and the highest mean capacity factor, at 11.02%. For PV-II and PV-III, the mean final yield was 923.1 and 907.4 kWh/kWp/year, respectively, and the capacity factor was 10.53% and 10.35%, respectively. Compared with PV-I, the mean yield was 4.5% lower for PV-II and 6.1% lower for PV-III. These differences refer to the complete technical configurations of the analyzed systems and cannot be attributed solely to module orientation. The coefficients of variation for annual production were within a narrow range of 3.42–3.88%, with the lowest value for PV-III and the highest for PV-II. Annual monitored production relative to the corresponding PV*SOL reference values is presented in Figure 6. All systems achieved their highest production in 2024, whereas the values for 2023 and 2025 were lower and similar to one another.
Figure 6.
Annual monitored energy production of PV-I–PV-III in 2023–2025 compared with the corresponding annual PV*SOL reference values.
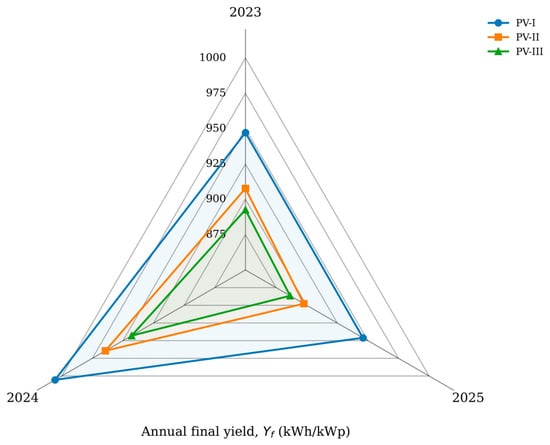
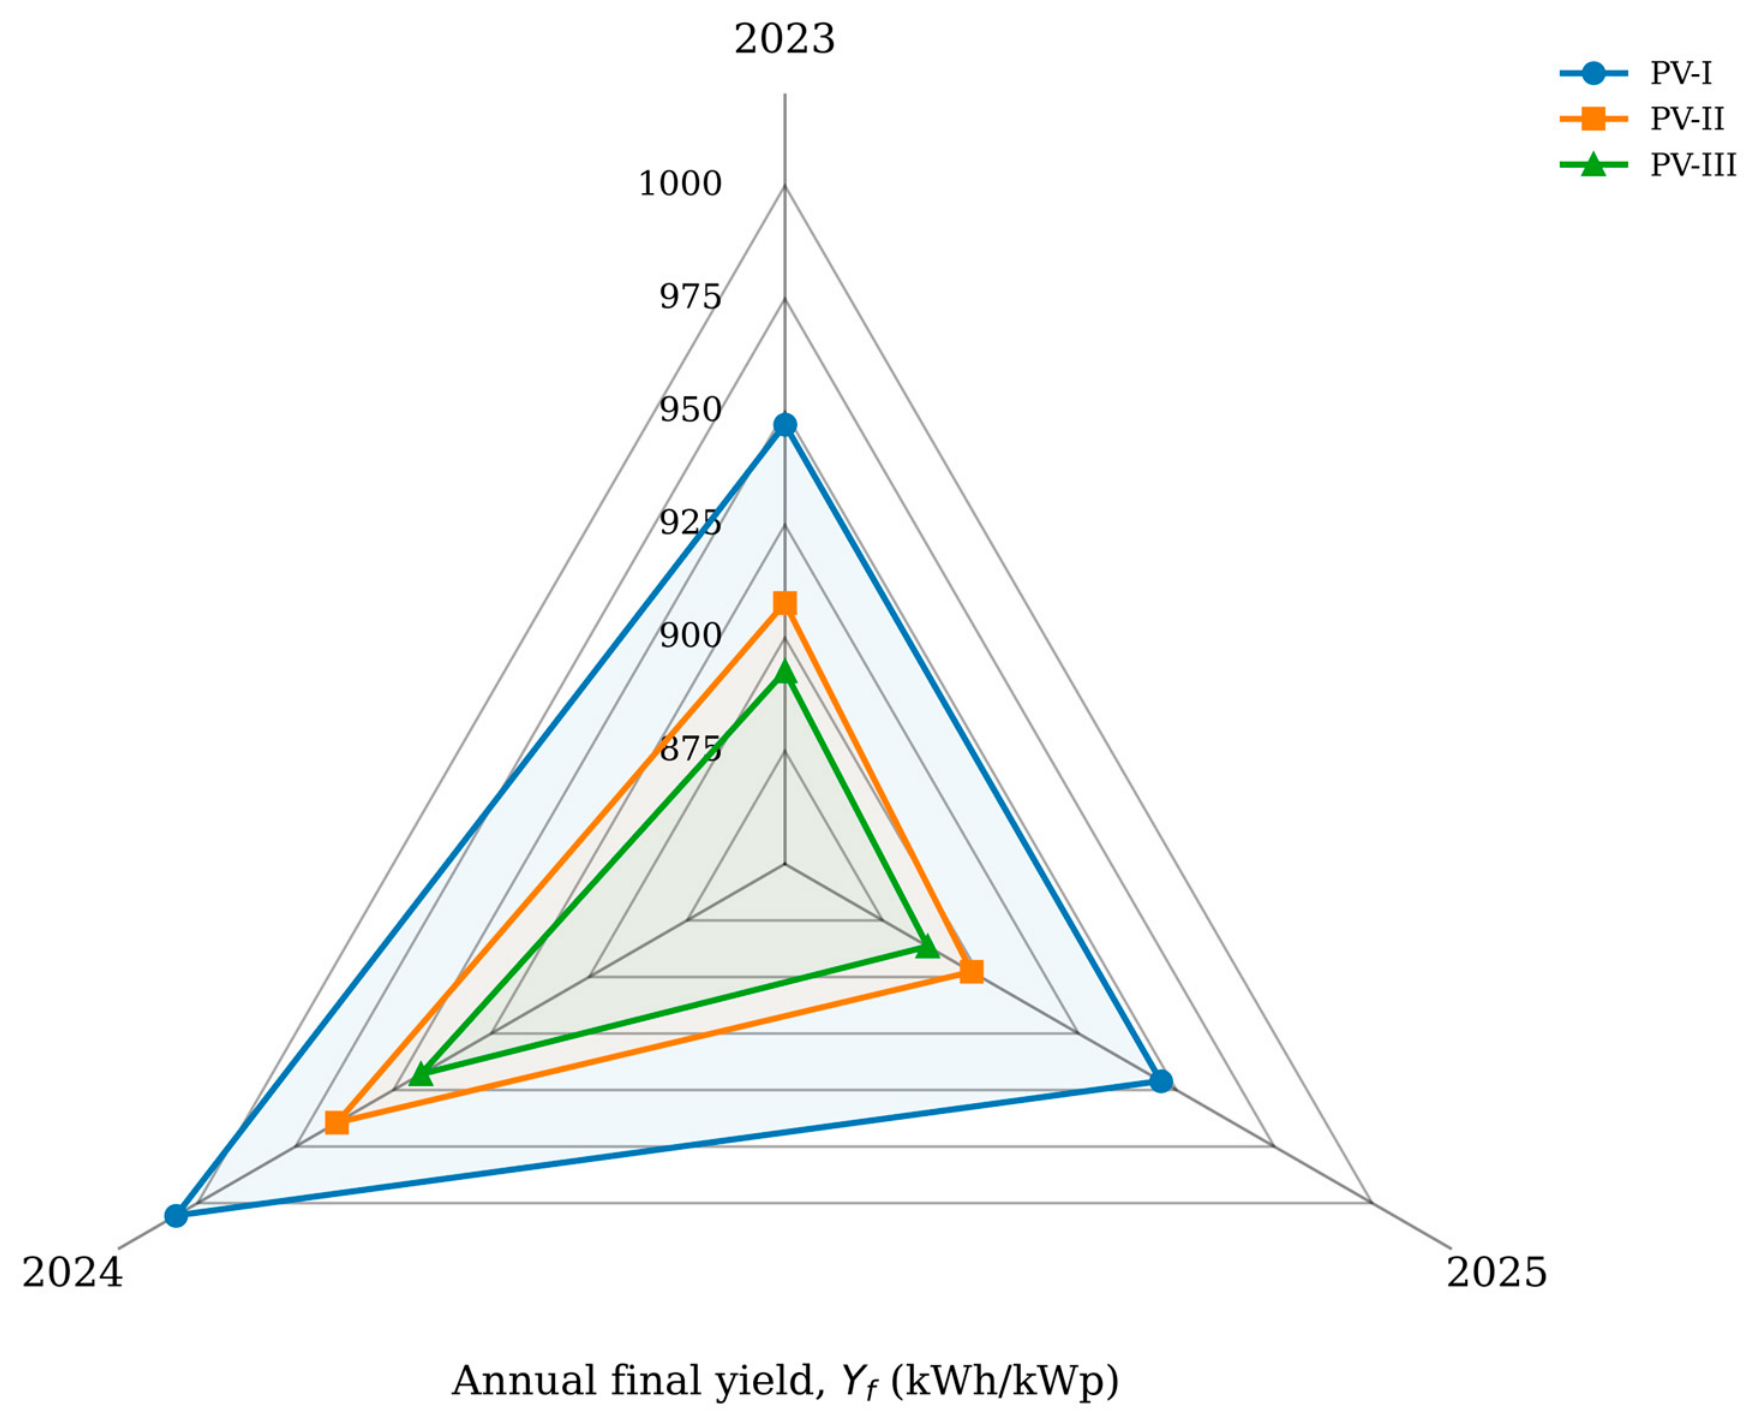
Interannual variation in annual final yield is shown in Figure 7. PV-I achieved the highest yield in each year: 947.2 kWh/kWp in 2023, 1005.5 kWh/kWp in 2024, and 946.0 kWh/kWp in 2025. For PV-II, values ranged from 897.7 to 964.4 kWh/kWp, whereas for PV-III they ranged from 886.5 to 943.0 kWh/kWp. All systems achieved their highest yield in 2024, while the values in 2023 and 2025 were similar. Interannual variation remained relatively low, consistent with the low coefficients of variation presented in Table 3.
Figure 7.
Interannual variation in annual final yield for PV-I–PV-III in 2023–2025.
3.3. Agreement Between Monitored Production and PV*SOL Design Estimates
Agreement with the annual PV*SOL reference value was generally high. PV-I production was 0.66% below the prediction in 2023, 5.45% above it in 2024, and 0.80% below it in 2025. PV-II exceeded the prediction by 1.13%, 7.41%, and 0.01%, respectively. PV-III exceeded the reference value in every year: by 1.24% in 2023, 6.96% in 2024, and 0.55% in 2025. The common positive maximum in 2024 coincided with the highest annual solar irradiation. When the three systems were aggregated, total annual production was 0.45% above the sum of the PV*SOL predictions in 2023, 6.60% above it in 2024, and 0.24% below it in 2025. The aggregated result confirms that the largest deviation was common to the entire dataset rather than specific to one installation. Detailed monitored production values, annual PV*SOL reference values, and corresponding relative deviations are presented in Table 4.
Table 4.
Monitored and predicted annual energy production and relative deviations for PV-I–PV-III in 2023–2025.
To complement the analysis of annual deviations, the overall agreement between monitored production and the annual PV*SOL design estimates was described using MBE, MAE, MAPE, RMSE, and nRMSE. MAPE values ranged from 2.21% to 2.76%, whereas nRMSE ranged from 3.20% to 4.33%. Because these metrics were calculated from only three annual observations for each system, they should be interpreted with caution when considering long-term agreement. Accordingly, the individual annual deviations presented in Table 4 were emphasized as the primary evidence of year-to-year agreement, while the aggregate error metrics in Table 5 were treated as supplementary descriptive measures.
Table 5.
Annual prediction-error measures calculated relative to the fixed PV*SOL reference value.
The greater absolute RMSE for PV-II was related to its larger scale; therefore, relative measures, particularly MAPE and nRMSE, are more informative for comparisons among systems of different sizes. Positive MBE values for all systems indicate an overall tendency for production to be slightly higher than the annual PV*SOL reference value, primarily because of the surplus recorded in 2024.
3.4. Monthly and Seasonal Variability
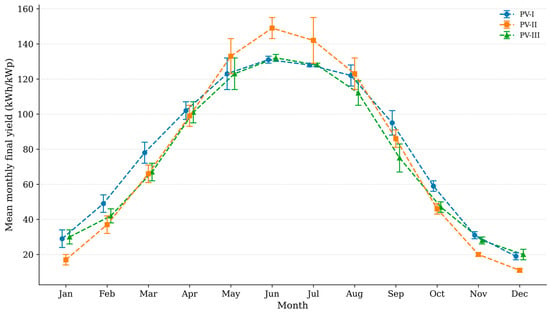
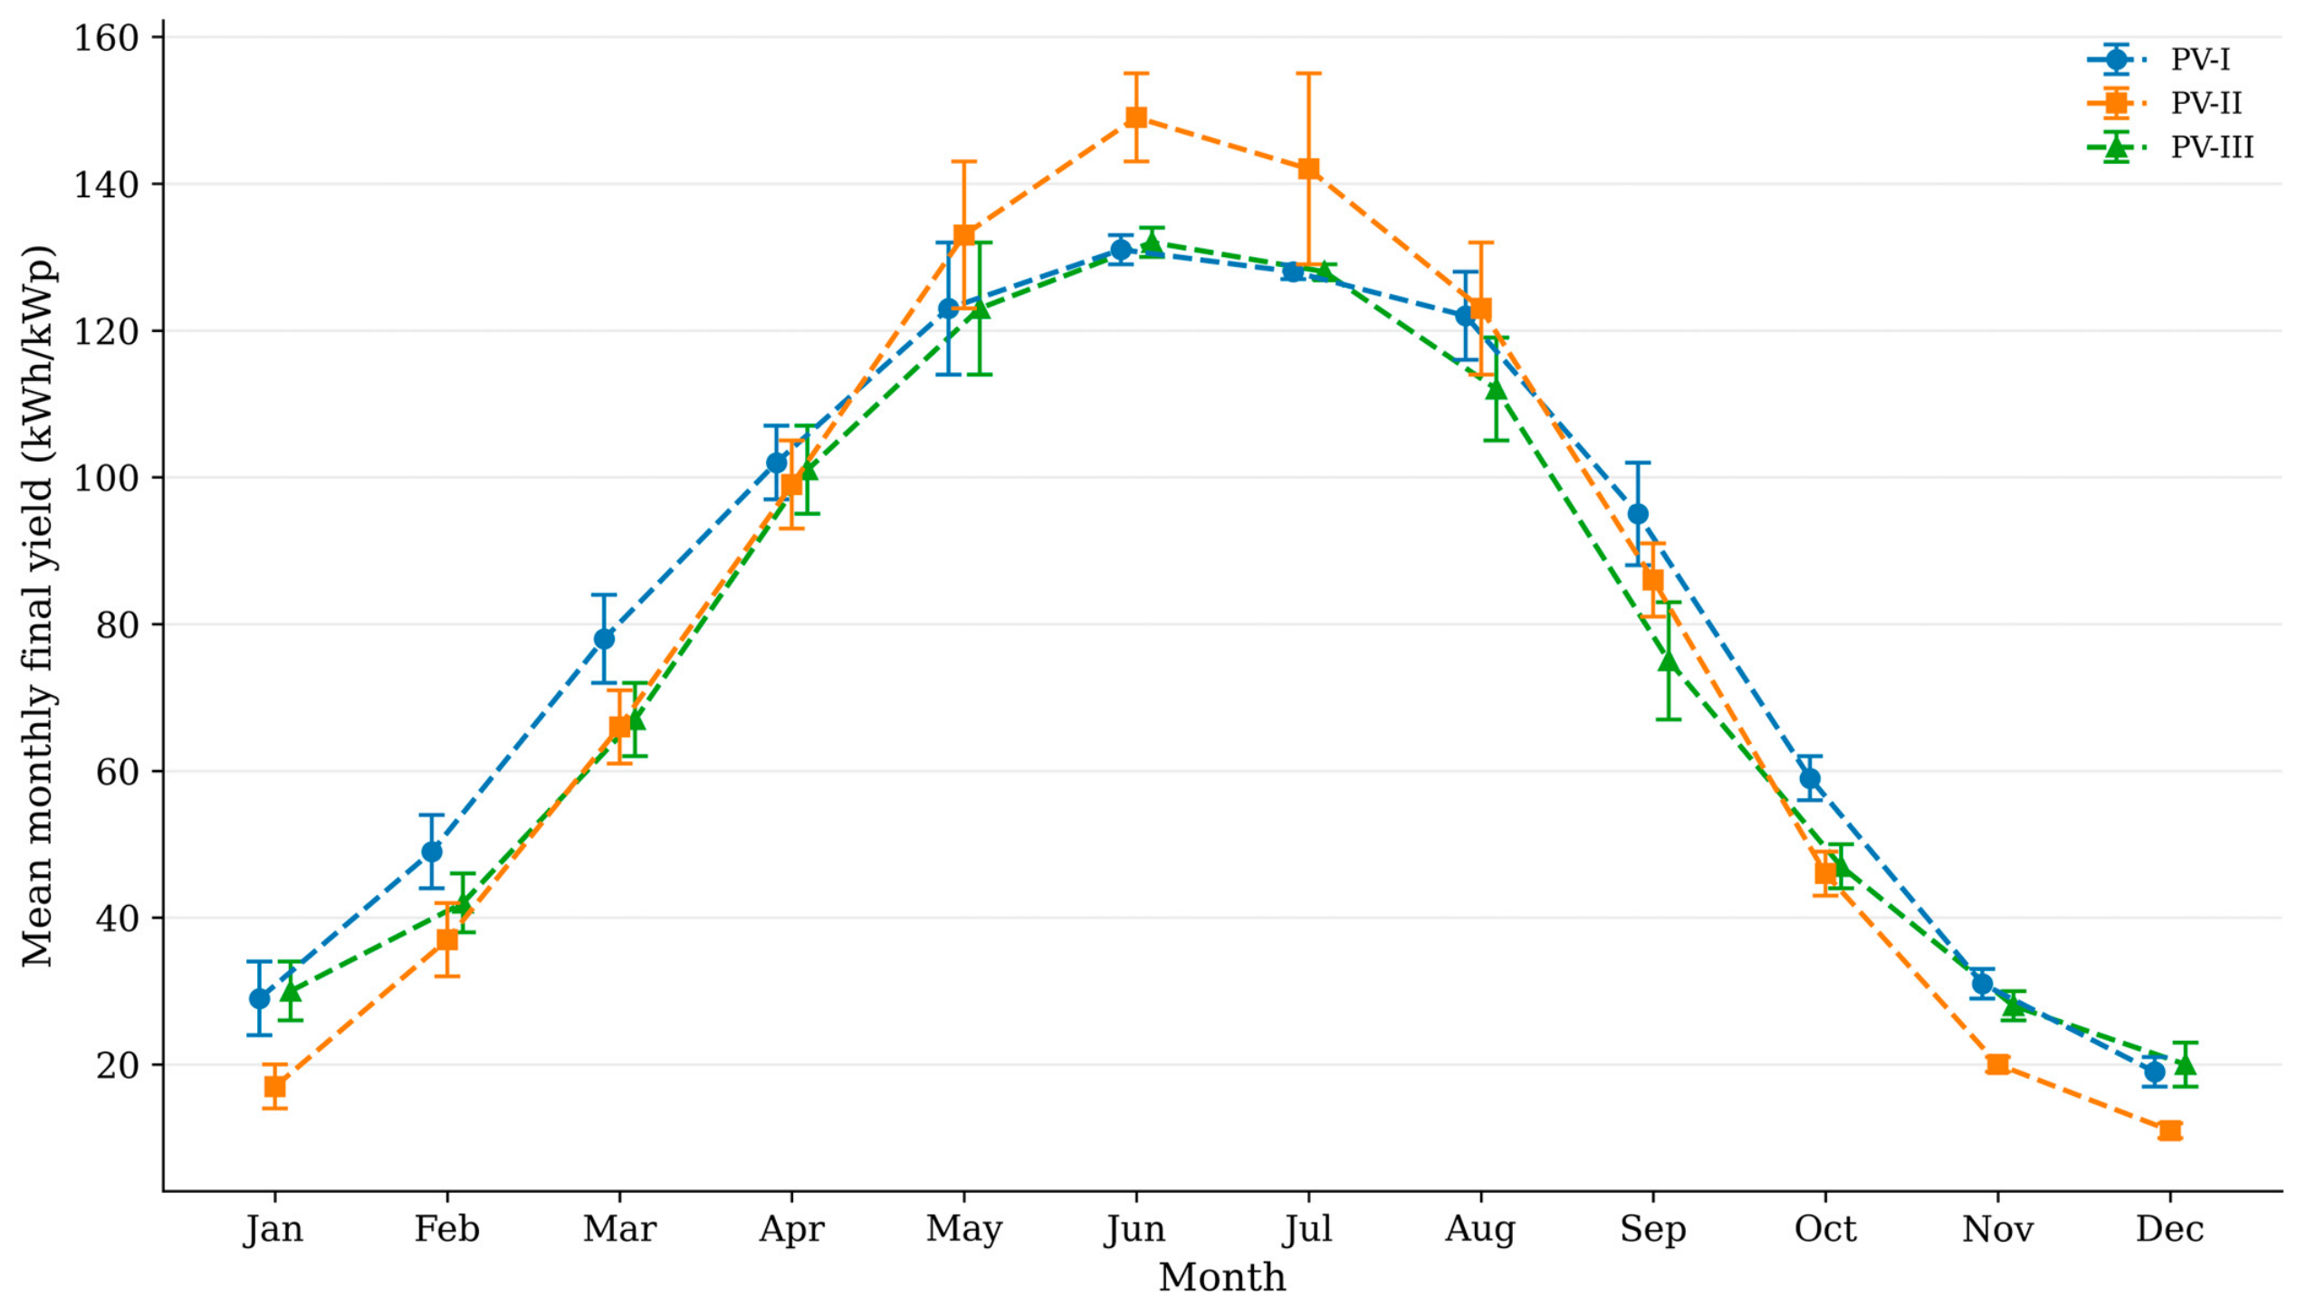
All systems showed a clear annual cycle, with a rapid increase in mean monthly final yield from February to May, sustained high values in late spring and summer, and a gradual decline in autumn. The highest mean monthly yield was recorded for PV-II in July at approximately 149 kWh/kWp, whereas maximum values for PV-I and PV-III also occurred in summer and reached approximately 132 kWh/kWp. The lowest values occurred in December and January; for PV-II they declined to approximately 10–18 kWh/kWp, whereas for PV-I and PV-III they generally ranged from approximately 17 to 30 kWh/kWp. PV-I achieved relatively higher values in autumn and winter, whereas PV-II had the highest summer yield. Mean monthly final yield together with interannual variability is shown in Figure 8. The largest standard deviations occurred mainly in months with high production, particularly from May to August, indicating greater absolute interannual variation during periods of intensive generation.
Figure 8.
Mean monthly final yield of PV-I–PV-III in 2023–2025.
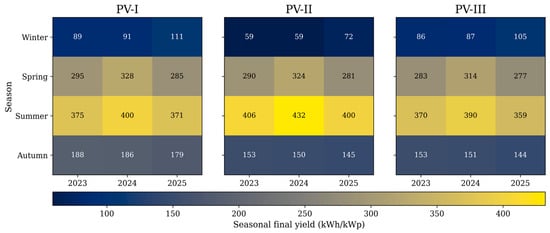
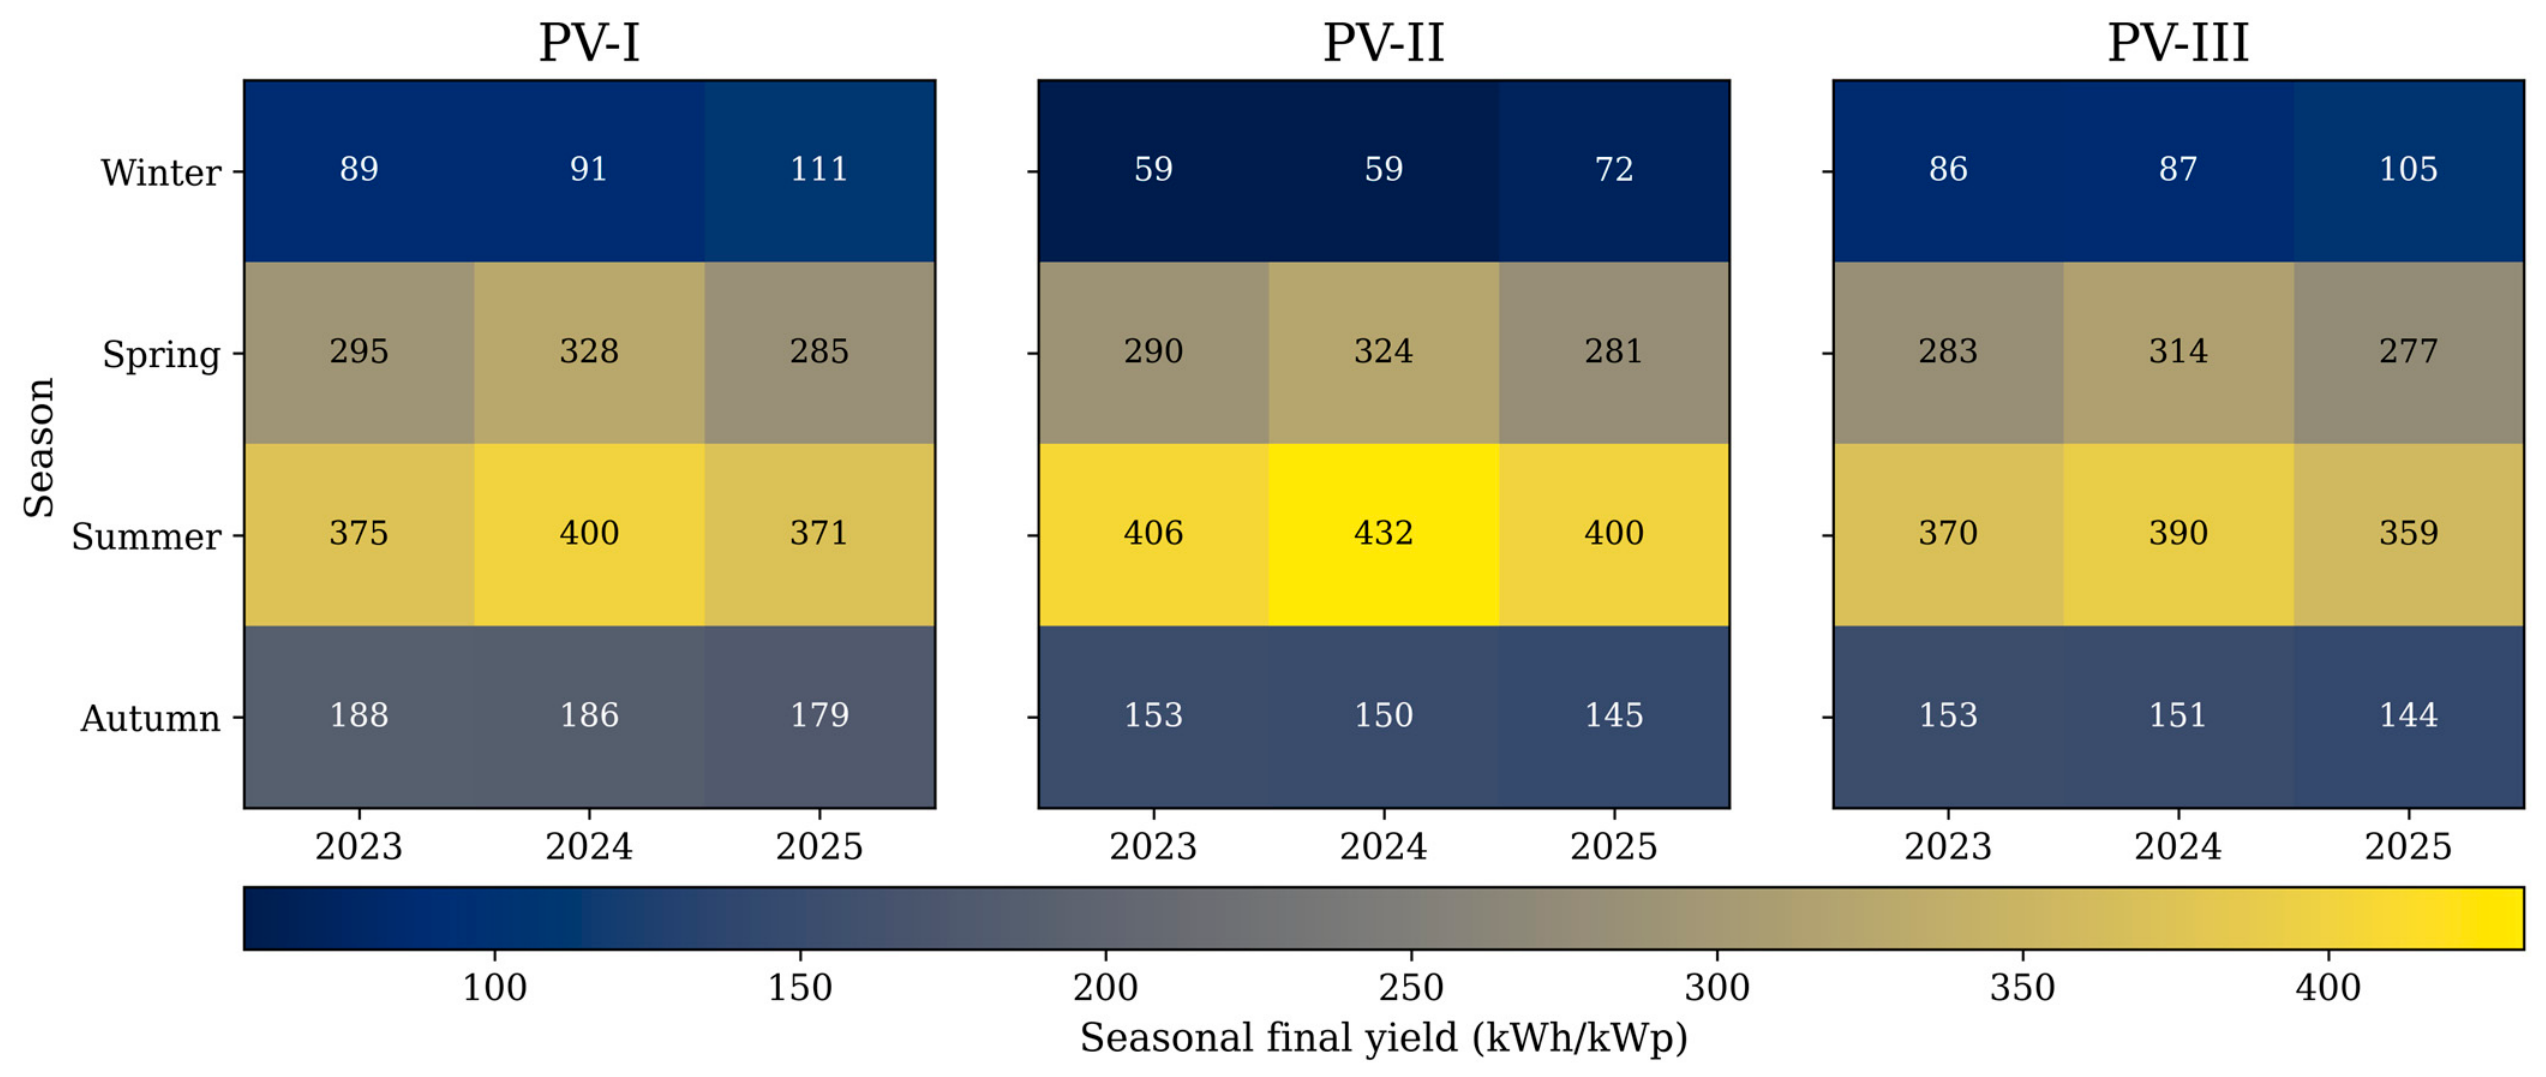
The seasonal distribution of final yield showed clear dominance of spring and summer for all systems. The highest values occurred in summer and ranged from 359 to 432 kWh/kWp, whereas the lowest values occurred in winter and ranged from 59 to 111 kWh/kWp. In 2024, all systems achieved their highest yield in both spring and summer. PV-I had the highest values in winter, spring, and autumn in each analyzed year, whereas PV-II achieved the highest summer yield: 406 kWh/kWp in 2023, 432 kWh/kWp in 2024, and 400 kWh/kWp in 2025. PV-III showed a similar seasonal pattern but generally a lower yield. Detailed seasonal final yield values are presented in Figure 9.
Figure 9.
Seasonal final yield of PV-I–PV-III in 2023–2025. Seasons are defined meteorologically.
The contribution of individual seasons to total energy production confirmed the dominant role of spring and summer. Together, these seasons accounted for 70.9% of PV-I production, 77.0% of PV-II production, and 73.2% of PV-III production. Summer had the largest share, ranging from 39.5% for PV-I to 44.7% for PV-II, whereas winter had the smallest share, ranging from 6.9% for PV-II to 10.2% for PV-III. Detailed seasonal shares of total energy production are presented in Table 6.
Table 6.
Seasonal shares of total energy production for PV-I–PV-III in 2023–2025.
3.5. Relationship Between Monthly Yield and Meteorological Conditions
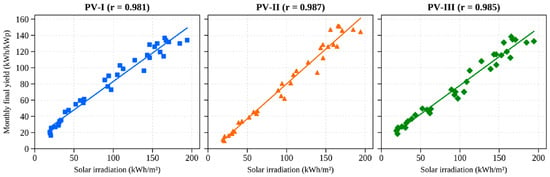
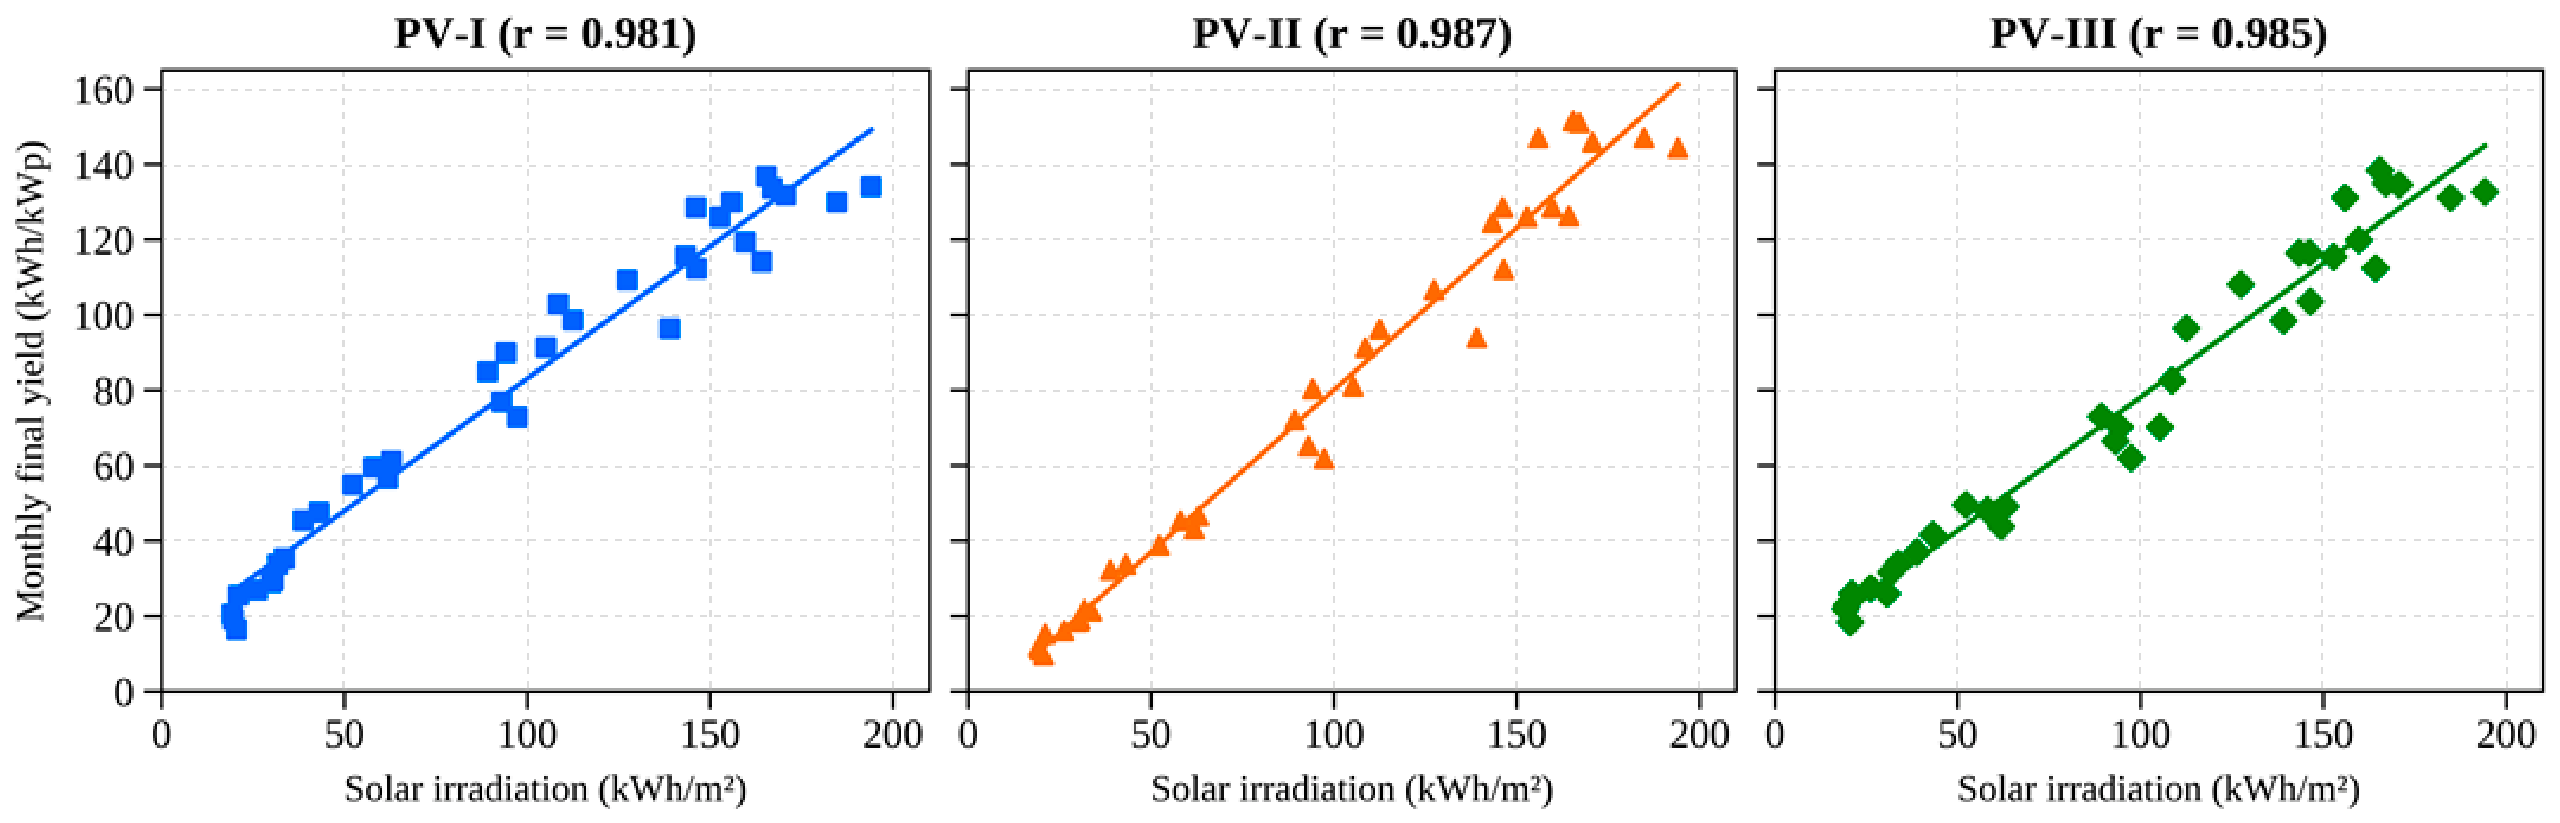
Monthly final yield was strongly and positively associated with solar irradiation for all analyzed systems. Pearson correlation coefficients ranged from 0.981 for PV-I to 0.987 for PV-II, and all relationships were statistically significant (p < 0.001). Correlations with mean air temperature were also positive and significant but weaker, ranging from 0.850 to 0.889. Separate multiple regression models including solar irradiation and mean air temperature explained 96.9–97.7% of the variability in monthly final yield. Detailed results are presented in Table 7.
Table 7.
Pearson correlations and multiple-regression model fit for monthly final yield of PV-I–PV-III (n = 36 for each system).
For all systems, increasing monthly solar irradiation was accompanied by a clear increase in final yield. The strongest relationship was observed for PV-II, whereas PV-I showed slightly greater dispersion around the regression line. The relationship between solar irradiation and monthly final yield is shown in Figure 10.
Figure 10.
Relationship between monthly solar irradiation and monthly final yield of PV-I–PV-III in 2023–2025.
3.6. Hierarchical Regression for the Combined Dataset
Hierarchical analysis was used to determine the extent to which accounting for differences among systems and seasonality improved the explanation of monthly final yield beyond the effect of regional meteorological conditions. In Model 1, solar irradiation and mean air temperature explained 96.0% of yield variability (R2 = 0.960), indicating that the common pattern of monthly productivity was largely determined by weather variability. After system identification variables were added in Model 2, R2 increased only to 0.962; the increase in explained variance was ΔR2 = 0.002 and was not statistically significant (p = 0.051). Thus, after solar irradiation and temperature were accounted for, system-level differences provided only limited additional improvement in the model’s ability to explain monthly yield. Adding seasonal variables in Model 3 increased R2 only marginally to 0.964, with an additional explained variance of ΔR2 = 0.001 (p = 0.399). Season therefore did not provide significant additional information beyond that already captured by monthly solar irradiation and mean air temperature. In the final model, solar irradiation remained a positive and statistically significant predictor, whereas mean air temperature was no longer statistically significant. Relative to winter, which was the reference category, none of the seasonal coefficients were statistically significant. The coefficient for PV-II relative to PV-I was not significant, whereas the coefficient for PV-III was negative and statistically significant, indicating a lower adjusted monthly final yield relative to PV-I. Detailed coefficients and model fit statistics are presented in Table 8. Regression diagnostics showed no significant departure from normality (p = 0.926), but indicated heteroscedasticity and some positive residual autocorrelation (Durbin–Watson = 1.51). No extreme influential observations were identified (maximum Cook’s distance = 0.070). After removing the seasonal pattern, an additional anomaly-based regression explained 19.1% of the variability in final yield anomalies (R2 = 0.191). Solar irradiation anomalies remained significant (p < 0.001), whereas temperature anomalies were not (p = 0.596).
Table 8.
Hierarchical multiple-regression models for monthly yield in the combined dataset (n = 108).
4. Discussion
The principal finding was the generally close agreement between the archived annual PV*SOL design estimates and monitored energy production, despite differences in the actual productivity of the analyzed systems. The individual annual deviations ranged from −0.80% to +7.41%. MAPE values of 2.21–2.76% and nRMSE values of 3.20–4.33% provided supplementary descriptive information on this agreement; however, because they were based on only three annual observations per system, these metrics should be interpreted with caution when drawing conclusions about long-term agreement. At the same time, mean annual final yield was 966.2 kWh/kWp for PV-I, 923.1 kWh/kWp for PV-II, and 907.4 kWh/kWp for PV-III. Thus, good agreement with a design estimate does not necessarily imply equal system productivity because each system was assessed against its own PV*SOL reference value. This distinction between agreement with the design estimate and operational performance is also relevant in other PV studies, where systems with similar nominal parameters may achieve different yields because of location, configuration, and operating conditions [38,39,40,41,42,43,44,45,46].
The final yield levels observed in this study correspond to ranges reported under Polish and Central European climatic conditions. For nine prosumer installations in south-eastern Poland, Gulkowski reported a mean yield of 990.2 kWh/kWp, with substantial variation among sites [23]. Other Polish studies reported annual yields generally around or above 1000 kWh/kWp, including values above 1000 kWh/kWp in eastern Poland [13], a mean of 1022 kWh/kWp for four rooftop systems [15], 1019.17 and 965.67 kWh/kWp in southern and central Poland [25], and approximately 1033 kWh/kWp for a 14.04 kWp installation [24]. The PV-I results are therefore close to reference values reported for the region, whereas PV-II and PV-III fall within the lower part of the range reported for south-eastern Poland. Earlier Polish studies also showed that actual yield depends on module technology, the DC-to-inverter capacity ratio, and local operating conditions [39,40].
Interannual variability remained limited for all three installations, as indicated by CV values of only 3.42–3.88%. The fact that every system reached its highest production and final yield in 2024, when annual solar irradiation was also highest, points to a strong common meteorological influence on year-to-year performance. However, differences among systems cannot be explained by weather alone. Large European datasets confirm substantial site- and system-related variability in PV yield, including 32,744 installations analyzed by Schardt and te Heesen [41] and 246 nominally identical systems studied by Meng et al. [42]. Thus, common interannual variability was mainly associated with weather, whereas differences among systems may have reflected their configurations and operating conditions.
Overall, the monitored annual production closely followed the PV*SOL design reference, with deviations between −0.80% and +7.41%. The largest positive differences occurred simultaneously in 2024 for all three installations. This pattern suggests that the design simulations captured the typical annual production level reasonably well, although they naturally did not reproduce the meteorological conditions specific to each operating year. Polish studies have likewise reported relatively good agreement between monitored and modeled production, although the results depend on the simulation tool, meteorological data source, input data quality, and model assumptions [1,2,11,12,15,16,17,26]. This is particularly important for multi-surface installations, where inaccurate representation of individual orientations may increase differences between predicted and actual production [47].
MBE values should be interpreted only as information on the average direction of deviation during the analyzed period, not as evidence that PV*SOL systematically underestimates production. The highest MAE and RMSE values were obtained for PV-II, primarily because of its greater capacity and larger scale of energy production; therefore, relative indicators such as MAPE and nRMSE are more informative for comparisons among systems of different capacities [35,36,43,44,45,46]. Leloux et al. similarly emphasized the importance of considering solar-resource conditions and individual system operating quality in PV assessment [43]. PV-I, which achieved the highest annual yield, was predominantly south-facing at a 35° tilt, whereas PV-II combined south-eastern and western roof surfaces at lower tilt angles, and PV-III had an east–west configuration at 10°. Module orientation and tilt influence both annual energy production and its temporal distribution [6,7,40,47], while inverter sizing and environmental conditions may introduce additional effects [40]. Accurate representation of individual roof orientations is therefore particularly important for multi-surface installations [47]. Because each configuration was represented by only one system and site-specific plane-of-array irradiance was unavailable, the observed differences in final yield cannot be attributed to individual configuration parameters. They may also reflect differences in shading, soiling, thermal conditions, inverter losses, curtailment, system availability, and other site-specific operating conditions. Spring and summer together accounted for 70.9–77.0% of production, with PV-II achieving the highest summer yield and PV-I higher values in winter, spring, and autumn. This pattern is consistent with the effects of tilt and orientation, because lower tilt angles favor production when the sun is high, whereas a steeper south-facing tilt may improve solar-energy use outside the summer peak. This does not imply that one configuration is universally superior, because the temporal production profile may also affect self-consumption. Polish studies have shown that self-consumption varies seasonally and depends on the match between electricity generation and demand over individual months and hours [48,49].
The relationship between monthly final yield and solar irradiation was very strong for all three systems, with Pearson correlation coefficients of r = 0.981 for PV-I, r = 0.987 for PV-II, and r = 0.985 for PV-III (p < 0.001). The relationship with mean air temperature was positive but less pronounced. This association should not be taken to mean that warmer conditions enhance module efficiency, as higher temperatures generally coincide seasonally with greater solar energy availability. Under actual operating conditions, increasing cell temperature reduces module voltage and efficiency [50,51], while PV performance is simultaneously influenced by irradiance, temperature, wind, humidity, and dust [51]. Because module temperature and site-specific plane-of-array irradiance were not measured in this study, the actual thermal effect could not be separated from other environmental and seasonal factors.
The regression results showed that meteorological conditions accounted for most of the month-to-month variation in final yield, with solar irradiation and mean air temperature jointly explaining 96.0% of the observed variability. Introducing system identity and seasonal terms into the model resulted in only very small increases in explained variance, indicating that most seasonal differences were already represented by the irradiation variable. After these effects were taken into account, PV-II did not differ significantly from PV-I, while PV-III retained a significantly lower adjusted monthly final yield. Large European datasets likewise show that PV performance depends on solar-resource availability, system configuration, and operating quality [41,42,43,44], while complete system assessment also requires consideration of irradiance, DC-side losses, inverter efficiency, and AC energy production [45]. Over longer periods, degradation and changes in component parameters may affect performance [52,53,54,55], and reliable estimation of such effects requires longer, weather-corrected datasets [56]; therefore, the three-year observation period was insufficient to determine degradation rates reliably. Consequently, the absence of a clear downward trend during 2023–2025 cannot be considered evidence of no degradation.
The findings have direct relevance to the design and operation of rooftop PV systems. A PV*SOL prediction can provide a useful reference for system performance assessment, provided that it is interpreted in the context of actual weather and operating conditions. Production assessment should be based not only on absolute values but also on final yield and relative indicators, which facilitate comparisons among systems of different capacities, technologies, and locations [44,46,57,58]. A persistent deviation of one system from the common regional pattern may indicate a need for additional system diagnostics. It should nevertheless be emphasized that the solar irradiation data represented a regional reference rather than site-specific plane-of-array irradiance; consequently, the conventional performance ratio could not be calculated, and a complete IEC-based performance assessment could not be conducted. The practical contribution of this study is the provision of local reference data that may support productivity assessment, monitoring, and planning of rooftop PV systems in south-eastern Poland. The proposed approach supports SDG 7 by providing local reference data that may reduce prediction uncertainty and support assessment of rooftop PV performance under regional conditions. Future research should extend the approach by using higher-resolution data, local measurements of system operating conditions, and a larger number of installations with similar configurations. Multi-year analyses of different PV technologies indicate that such data are needed to distinguish more accurately the effects of climate, system configuration, and changes in performance over time [59,60,61,62]. The scope of the present analysis was limited primarily by the monthly data resolution and the lack of monthly PV*SOL predictions. Future studies using higher-resolution monitored data and temporally resolved design predictions would enable a more accurate assessment of seasonal differences and long-term changes in system performance.
5. Conclusions
The three-year analysis of the actual operation of three rooftop photovoltaic systems showed generally close agreement between monitored energy production and the archived annual PV*SOL design estimates. Mean annual final yield was 966.2 kWh/kWp for PV-I, 923.1 kWh/kWp for PV-II, and 907.4 kWh/kWp for PV-III. Annual deviations from the reference values ranged from −0.80% to +7.41%. The corresponding MAPE and nRMSE values ranged from 2.21% to 2.76% and from 3.20% to 4.33%, respectively, and should be viewed in light of the limited number of annual observations available for each system. For the three systems analyzed, these results indicate that the archived PV*SOL design predictions provided a useful reference for annual energy production. At the same time, good agreement with a prediction does not imply equal actual productivity among systems because each system was assessed against its own design value.
PV-I achieved the highest mean annual yield, while lower values were recorded for PV-II and PV-III. These differences should be interpreted as system-level differences that cannot be separated into the effects of configuration, solar exposure, shading, soiling, thermal conditions, inverter losses, or other operating factors. Despite these differences, all systems showed relatively low interannual variability, with coefficients of variation of 3.42–3.88%, indicating fairly stable productivity during the analyzed period. All systems achieved their highest production in 2024, which was also the year with the highest annual solar irradiation. Monthly final yield was strongly associated with solar irradiation, with Pearson correlation coefficients ranging from 0.981 to 0.987 (p < 0.001). Regression analysis showed that solar irradiation and mean air temperature explained 96.0% of monthly yield variability. Adding system identity and season produced only marginal improvements in model fit, indicating that solar irradiation captured most of the seasonal variation in PV productivity. After adjustment for meteorological conditions and season, PV-II did not differ significantly from PV-I, whereas PV-III showed a significantly lower adjusted monthly final yield.
The adopted approach combined a multi-year assessment of agreement with archived PV*SOL design estimates with an assessment of actual productivity, interannual variability, and seasonality. This enabled prediction accuracy to be distinguished from operational performance, which is important when systems of different capacities and configurations are evaluated. The results provide local benchmark data for rooftop PV installations operating in south-eastern Poland and may support their design and operational assessment. The findings should be interpreted within the scope of the study, which included three PV systems, monthly monitoring data, and regional meteorological data, and therefore should not be generalized to all rooftop PV configurations. Future research should include higher-resolution data and a larger number of systems with comparable configurations to enable a more detailed assessment of operating conditions and performance changes over time.
Author Contributions
Conceptualization, B.S.; methodology, B.S., C.P. and M.H.; validation, B.S.; formal analysis, B.S. and C.P.; investigation, B.S. and M.H.; resources, M.H.; data curation, B.S. and M.H.; writing—original draft preparation, B.S.; writing—review and editing, B.S., M.H. and C.P.; visualization, B.S.; supervision, C.P.; project administration, B.S. All authors have read and agreed to the published version of the manuscript.
Funding
This research received no external funding.
Institutional Review Board Statement
Not applicable.
Informed Consent Statement
Not applicable.
Data Availability Statement
The raw data supporting the conclusions of this article will be made available by the authors on request.
Conflicts of Interest
The authors declare no conflicts of interest.
Abbreviations
The following abbreviations are used in this manuscript:
| AC | Alternating current |
| CF | Capacity factor |
| CV | Coefficient of variation |
| DC | Direct current |
| ERA5 | European Center for Medium-Range Weather Forecasts Reanalysis v5 |
| IEC | International Electrotechnical Commission |
| MAE | Mean absolute error |
| MAPE | Mean absolute percentage error |
| MBE | Mean bias error |
| nRMSE | Normalized root mean square error |
| POA | Plane of array |
| PR | Performance ratio |
| PV | Photovoltaic |
| PVGIS | Photovoltaic Geographical Information System |
| RMSE | Root mean square error |
| R2 | Coefficient of determination |
| SD | Standard deviation |
| SDG 7 | Sustainable Development Goal 7 |
References
- Kaleshwarwar, A.; Bahadure, S. Validating the Credibility of Solar Simulation Tools Using a Real-World Case Study. Energy Build. 2023, 301, 113697. [Google Scholar] [CrossRef] [Scilit]
- Raji, L.; Razak, A.A.; Sharol, A.F. Comparative Assessment of PV Simulation Tools for a Megawatt-Scale Rooftop Solar Photovoltaic System in Tropical Climate. Next Energy 2025, 9, 100452. [Google Scholar] [CrossRef] [Scilit]
- McCarty, J.; Waibel, C.; Leow, S.W.; Schlueter, A. Towards a High-Resolution Simulation Framework for Building-Integrated Photovoltaics under Partial Shading in Urban Environments. Renew. Energy 2024, 236, 121442. [Google Scholar] [CrossRef] [Scilit]
- Kasmi, G.; Touron, A.; Blanc, P.; Saint-Drenan, Y.-M.; Fortin, M.; Dubus, L. Remote-Sensing-Based Estimation of Rooftop Photovoltaic Power Production Using Physical Conversion Models and Weather Data. Energies 2024, 17, 4353. [Google Scholar] [CrossRef] [Scilit]
- Usta, Y.; Carioni, G.; Mutani, G. Modeling and Mapping Solar Energy Production with Photovoltaic Panels on Politecnico di Torino University Campus. Energy Effic. 2024, 17, 53. [Google Scholar] [CrossRef] [Scilit]
- Hegedűsné Baranyai, N.; Esses, N.; Vincze, A.; Zsiborács, H. The Effect of Orientation and Tilt Angle on PV System Energy Production in Hungary: Regional Comparison and Optimization Possibilities. Discov. Sustain. 2025, 6, 1192. [Google Scholar] [CrossRef] [Scilit]
- Christopoulos, K.; Zafirakis, D.; Kavadias, K.A.; Kaldellis, J.K. Data-Driven Energy Analysis for a Set of Rooftop Photovoltaic Systems Featuring Different Installation Characteristics: A Pairwise, Early-Life Performance Comparison. Energies 2025, 18, 1677. [Google Scholar] [CrossRef] [Scilit]
- Keddouda, A.; Ihaddadene, R.; Boukhari, A.; Atia, A.; Arıcı, M.; Lebbihiat, N.; Ihaddadene, N. Photovoltaic Module Temperature Prediction Using Various Machine Learning Algorithms: Performance Evaluation. Appl. Energy 2024, 363, 123064. [Google Scholar] [CrossRef] [Scilit]
- Jain, S.; Abdelrahim, M.; Abdallah, A.A.; Pillai, D.S.; Bayhan, S. Performance Modeling of Rooftop PV Systems in Arid Climate, a Case Study for Qatar: Impact of Soiling Losses and Albedo Using PVsyst and SAM. Energies 2025, 18, 5876. [Google Scholar] [CrossRef] [Scilit]
- Uykan, O.; Çelik, G.; Birgül, A. Quantifying the Impact of Soiling and Thermal Stress on Rooftop PV Performance: Seasonal Analysis from an Industrial Urban Region in Türkiye. Sustainability 2025, 17, 8038. [Google Scholar] [CrossRef] [Scilit]
- Caglayan, N.; Celik, H.K.; Öktüren Asri, F.; Rennie, A.E.W. Experimental Validation and Performance Benchmarking of a Grid-Connected Rooftop Photovoltaic System Using Measured and Simulated Data. Energies 2026, 19, 1468. [Google Scholar] [CrossRef] [Scilit]
- De Masi, R.F.; Gigante, A.; Ruggiero, S.; Vanoli, G.P. Experimental and Numerical Approach for the Evaluation of PV-System Performance on Energy and Environmental Behavior of Nearly Zero Energy Buildings: Case Study in Mediterranean Climate. Renew. Energy 2024, 227, 120609. [Google Scholar] [CrossRef] [Scilit]
- Gulkowski, S.; Krawczak, E. Long-Term Energy Yield Analysis of the Rooftop PV System in Climate Conditions of Poland. Sustainability 2024, 16, 3348. [Google Scholar] [CrossRef] [Scilit]
- Olczak, P. Evaluation of Degradation Energy Productivity of Photovoltaic Installations in Long-Term Case Study. Appl. Energy 2023, 343, 121109. [Google Scholar] [CrossRef] [Scilit]
- Krawczak, E. A Comparative Analysis of Measured and Simulated Data of PV Rooftop Installations Located in Poland. Energies 2023, 16, 5975. [Google Scholar] [CrossRef] [Scilit]
- Olczak, P. Comparison of Modeled and Measured Photovoltaic Microinstallation Energy Productivity. Renew. Energy Focus 2022, 43, 246–254. [Google Scholar] [CrossRef] [Scilit]
- Hołota, E.; Życzyńska, A.; Dyś, G. Analysis of Real and Simulated Energy Produced by Photovoltaic Installations Located in Poland. Energies 2025, 18, 5279. [Google Scholar] [CrossRef] [Scilit]
- Govindarajan, L.; Batcha, M.F.B.M.; Abdullah, M.K.B. Performance Assessment of Large-Scale Rooftop Solar PV System: A Case Study in a Malaysian Public University. Discov. Appl. Sci. 2024, 6, 328. [Google Scholar] [CrossRef] [Scilit]
- Mohamed, K.A.A.; Shareef, H.; Nizam, I.; Esan, A.B.; AlAhmad, A.K. Assessment of Overall and Module-Specific Performance Comparisons for Residential Grid-Tied Photovoltaic Systems in the Maldives. Energies 2025, 18, 6272. [Google Scholar] [CrossRef] [Scilit]
- Singh, T.S.D.; Shimray, B.A.; Meitei, S.N. Performance Analysis of a Rooftop Grid-Connected Photovoltaic System in North-Eastern India, Manipur. Energies 2025, 18, 1921. [Google Scholar] [CrossRef] [Scilit]
- Shukla, A.; Yadav, S.K.; Yadav, D.; Singh, J.; Singh, R.B.; Hasnain, S.M.M.; Zairov, R. Measured and Simulated Energy, Economics and Environmental (3E) Performance of a Building Applied Solar PV System Using Advanced Open-Source Simulation Software. Unconv. Resour. 2025, 7, 100199. [Google Scholar] [CrossRef] [Scilit]
- Hysa, B.; Mularczyk, A. PESTEL Analysis of the Photovoltaic Market in Poland—A Systematic Review of Opportunities and Threats. Resources 2024, 13, 136. [Google Scholar] [CrossRef] [Scilit]
- Gulkowski, S. Specific Yield Analysis of the Rooftop PV Systems Located in South-Eastern Poland. Energies 2022, 15, 3666. [Google Scholar] [CrossRef] [Scilit]
- Zdyb, A.; Sobczyński, D. An Assessment of a Photovoltaic System’s Performance Based on the Measurements of Electric Parameters under Changing External Conditions. Energies 2024, 17, 2197. [Google Scholar] [CrossRef] [Scilit]
- Kazanecka, E.; Olczak, P. A Specific Yield Comparison of Two Photovoltaic Installations—Polish Case Study. Polityka Energ.—Energy Policy J. 2023, 26, 129–148. [Google Scholar] [CrossRef] [Scilit]
- Gulkowski, S. Modeling and Experimental Studies of the Photovoltaic System Performance in Climate Conditions of Poland. Energies 2023, 16, 7017. [Google Scholar] [CrossRef] [Scilit]
- Sharma, R.; Goel, S. Performance Analysis of a 11.2 kWp Roof Top Grid-Connected PV System in Eastern India. Energy Rep. 2017, 3, 76–84. [Google Scholar] [CrossRef] [Scilit]
- Yadav, S.K.; Bajpai, U. Performance Evaluation of a Rooftop Solar Photovoltaic Power Plant in Northern India. Energy Sustain. Dev. 2018, 43, 130–138. [Google Scholar] [CrossRef] [Scilit]
- Ayompe, L.M.; Duffy, A.; McCormack, S.J.; Conlon, M. Measured Performance of a 1.72 kW Rooftop Grid-Connected Photovoltaic System in Ireland. Energy Convers. Manag. 2011, 52, 816–825. [Google Scholar] [CrossRef] [Scilit]
- Galevien, A.P.; Ridwan, M.K.; Wardana, A.N.I. Assessing the Viability of Rooftop Solar PV in Energy-Intensive Industries: A Techno-Economic and Safety Framework for the Indonesian FMCG Sector. Energies 2025, 18, 5859. [Google Scholar] [CrossRef] [Scilit]
- Copernicus Climate Change Service (C3S). ERA5 Hourly Data on Single Levels from 1940 to Present. Climate Data Store (CDS). Available online: https://cds.climate.copernicus.eu/datasets/reanalysis-era5-single-levels (accessed on 21 August 2026).
- European Commission, Joint Research Centre. Photovoltaic Geographical Information System (PVGIS). Available online: https://joint-research-centre.ec.europa.eu/photovoltaic-geographical-information-system-pvgis_en (accessed on 21 August 2026).
- IEC 61724-1:2021; Photovoltaic System Performance—Part 1: Monitoring. International Electrotechnical Commission: Geneva, Switzerland, 2021.
- Sharma, V.; Chandel, S.S. Performance Analysis of a 190 kWp Grid Interactive Solar Photovoltaic Power Plant in India. Energy 2013, 55, 476–485. [Google Scholar] [CrossRef] [Scilit]
- Willmott, C.J.; Matsuura, K. Advantages of the Mean Absolute Error (MAE) over the Root Mean Square Error (RMSE) in Assessing Average Model Performance. Clim. Res. 2005, 30, 79–82. [Google Scholar] [CrossRef] [Scilit]
- Hyndman, R.J.; Koehler, A.B. Another Look at Measures of Forecast Accuracy. Int. J. Forecast. 2006, 22, 679–688. [Google Scholar] [CrossRef] [Scilit]
- Nicolosi, C.F.; Tina, G.M. Impacts of Climate Change on the Wind Power Potential of an Offshore Wind Turbine: Three Case Studies from Sicily. In Proceedings of the 2025 AEIT International Annual Conference (AEIT); IEEE: Piscataway, NJ, USA, 2025. [Google Scholar]
- Pietruszko, S.M.; Gradzki, M. Performance of a Grid Connected Small PV System in Poland. Appl. Energy 2003, 74, 177–184. [Google Scholar] [CrossRef] [Scilit]
- Zdyb, A.; Gulkowski, S. Performance Assessment of Four Different Photovoltaic Technologies in Poland. Energies 2020, 13, 196. [Google Scholar] [CrossRef] [Scilit]
- Sarniak, M.T. Researches of the Impact of the Nominal Power Ratio and Environmental Conditions on the Efficiency of the Photovoltaic System: A Case Study for Poland in Central Europe. Sustainability 2020, 12, 6162. [Google Scholar] [CrossRef] [Scilit]
- Schardt, J.; te Heesen, H. Performance of Roof-Top PV Systems in Selected European Countries from 2012 to 2019. Sol. Energy 2021, 217, 235–244. [Google Scholar] [CrossRef] [Scilit]
- Meng, B.; Loonen, R.C.G.M.; Hensen, J.L.M. Performance Variability and Implications for Yield Prediction of Rooftop PV Systems—Analysis of 246 Identical Systems. Appl. Energy 2022, 322, 119550. [Google Scholar] [CrossRef] [Scilit]
- Leloux, J.; Narvarte, L.; Trebosc, D. Review of the Performance of Residential PV Systems in Belgium. Renew. Sustain. Energy Rev. 2012, 16, 178–184. [Google Scholar] [CrossRef] [Scilit]
- Reich, N.H.; Mueller, B.; Armbruster, A.; van Sark, W.G.J.H.M.; Kiefer, K.; Reise, C. Performance Ratio Revisited: Is PR > 90% Realistic? Prog. Photovolt. Res. Appl. 2012, 20, 717–726. [Google Scholar] [CrossRef] [Scilit]
- Ghiani, E.; Pilo, F.; Cossu, S. Evaluation of Photovoltaic Installations Performances in Sardinia. Energy Convers. Manag. 2013, 76, 1134–1142. [Google Scholar] [CrossRef] [Scilit]
- Marion, B.; Adelstein, J.; Boyle, K.; Hayden, H.; Hammond, B.; Fletcher, T.; Canada, B.; Narang, D.; Shugar, D.; Wenger, H.; et al. Performance Parameters for Grid-Connected PV Systems. In Proceedings of the 31st IEEE Photovoltaic Specialists Conference, Lake Buena Vista, FL, USA, 3–7 January 2005; pp. 1601–1606. [Google Scholar] [CrossRef] [Scilit]
- Zator, S.; Osuchowski, J.; Kasana, S.S.; Shelke, N.A.; Tomaszewski, M. Energy Generation in a Multi-Sided Photovoltaic System: Analysis of the Prediction Effectiveness. Renew. Energy 2025, 251, 123325. [Google Scholar] [CrossRef] [Scilit]
- Goryl, W. Real-World Performance and Economic Evaluation of a Residential PV Battery Energy Storage System Under Variable Tariffs: A Polish Case Study. Energies 2025, 18, 4090. [Google Scholar] [CrossRef] [Scilit]
- Pater, S.; Zdyb, A.; Gulkowski, S. Increasing Energy Self-Consumption in Residential Photovoltaic Systems with Heat Pumps in Poland. Energies 2023, 16, 4003. [Google Scholar] [CrossRef] [Scilit]
- Skoplaki, E.; Palyvos, J.A. On the Temperature Dependence of Photovoltaic Module Electrical Performance: A Review of Efficiency/Power Correlations. Sol. Energy 2009, 83, 614–624. [Google Scholar] [CrossRef] [Scilit]
- Hasan, K.; Yousuf, S.B.; Tushar, M.S.H.K.; Das, B.K.; Das, P.; Islam, M.S. Effects of Different Environmental and Operational Factors on the PV Performance: A Comprehensive Review. Energy Sci. Eng. 2022, 10, 656–675. [Google Scholar] [CrossRef] [Scilit]
- Jordan, D.C.; Kurtz, S.R. Photovoltaic Degradation Rates—An Analytical Review. Prog. Photovolt. Res. Appl. 2013, 21, 12–29. [Google Scholar] [CrossRef] [Scilit]
- Jordan, D.C.; Kurtz, S.R.; VanSant, K.; Newmiller, J. Compendium of Photovoltaic Degradation Rates. Prog. Photovolt. Res. Appl. 2016, 24, 978–989. [Google Scholar] [CrossRef] [Scilit]
- Dhimish, M. Performance Ratio and Degradation Rate Analysis of 10-Year Field Exposed Residential Photovoltaic Installations in the UK and Ireland. Clean Technol. 2020, 2, 170–183. [Google Scholar] [CrossRef] [Scilit]
- Roumpakias, E.; Stamatelos, A. Performance Analysis of a Grid-Connected Photovoltaic Park after 6 Years of Operation. Renew. Energy 2019, 141, 368–378. [Google Scholar] [CrossRef] [Scilit]
- Gulkowski, S.; Muñoz Díez, J.V.; Aguilera Tejero, J.; Dragan, P.; Nofuentes, G. A Study on Long-Term Operation and Performance Loss Rates of Various PV Technologies in Eastern Poland. Renew. Energy 2026, 256, 124548. [Google Scholar] [CrossRef] [Scilit]
- Kumar, M.; Kumar, A. Performance Assessment and Degradation Analysis of Solar Photovoltaic Technologies: A Review. Renew. Sustain. Energy Rev. 2017, 78, 554–587. [Google Scholar] [CrossRef] [Scilit]
- Khalid, A.M.; Mitra, I.; Warmuth, W.; Schacht, V. Performance Ratio—Crucial Parameter for Grid Connected PV Plants. Renew. Sustain. Energy Rev. 2016, 65, 1139–1158. [Google Scholar] [CrossRef] [Scilit]
- Atsu, D.; Seres, I.; Farkas, I. The State of Solar PV and Performance Analysis of Different PV Technologies Grid-Connected Installations in Hungary. Renew. Sustain. Energy Rev. 2021, 141, 110808. [Google Scholar] [CrossRef] [Scilit]
- Bianchini, A.; Gambuti, M.; Pellegrini, M.; Saccani, C. Performance Analysis and Economic Assessment of Different Photovoltaic Technologies Based on Experimental Measurements. Renew. Energy 2016, 85, 1–11. [Google Scholar] [CrossRef] [Scilit]
- Visa, I.; Burduhos, B.; Neagoe, M.; Moldovan, M.; Duta, A. Comparative Analysis of the Infield Response of Five Types of Photovoltaic Modules. Renew. Energy 2016, 95, 178–190. [Google Scholar] [CrossRef] [Scilit]
- Sharma, V.; Chandel, S.S. Performance and Degradation Analysis for Long Term Reliability of Solar Photovoltaic Systems: A Review. Renew. Sustain. Energy Rev. 2013, 27, 753–767. [Google Scholar] [CrossRef] [Scilit]

Disclaimer/Publisher’s Note: The statements, opinions and data contained in all publications are solely those of the individual author(s) and contributor(s) and not of MDPI and/or the editor(s). MDPI and/or the editor(s) disclaim responsibility for any injury to people or property resulting from any ideas, methods, instructions or products referred to in the content. |
© 2026 by the authors. Licensee MDPI, Basel, Switzerland. This article is an open access article distributed under the terms and conditions of the Creative Commons Attribution (CC BY) license.