


Abstract
As critical minerals required for the production of new energy batteries, the demand forecasts and trends for Li, Co, Ni, and Mn are of crucial importance for ensuring the energy transition and China’s sustainable development. This study has developed a comprehensive analytical framework, combining dynamic material flow analysis, stock-driven forecasting, and scenario analysis to conduct a life-cycle assessment of the critical mineral resources (2010–2060). (1) Retrospective estimates show that in 2024, demand for Li, Co, Ni, and Mn reached 117 kt, 79 kt, 78 kt, and 45 kt, respectively. By 2060, the maximum demand for these minerals is projected to rise to 651 kt, 1090 kt, 1080 kt, and 757 kt, respectively. (2) Li is the mineral with the highest demand. Under different recovery scenarios, the lithium substitution rates reach 55.4%, 68.3%, and 85.3%, respectively. Given that the demand in cascade utilisation is far lower than the volume of retired new energy vehicle batteries, a cascade utilisation rate exceeding 23% would theoretically suffice to meet the entire relevant market demand. To secure the supply of critical minerals for energy batteries, this study suggests accelerating the construction of standardised recycling systems and implementing strict entry approvals to prevent overcapacity.
1. Introduction
In order to achieve the goal of limiting global warming to 1.5 °C, as proposed by IPCC in 2018 [1], the energy transition has become a shared choice for sustainable development across nations. As a major global energy consumer, China faces an urgent need for an energy transition. To achieve its energy transition targets, China has introduced policies aimed at vigorously developing the renewable energy sector. Under the guidance of these policies, industries such as EVs, WP, PV, and ESI have expanded rapidly, further driving demand for new energy batteries. By the end of 2025, demand for new energy batteries in China reached 1700.5 GWh [2]. Lithium (Li), cobalt (Co), nickel (Ni), and manganese (Mn) are critical materials required for the production of new energy batteries, with demand in 2025 expected to reach 328 kt, 89 kt, 546 kt, and 213 kt, respectively. In the future, as the new energy industry continues to develop, demand for new energy batteries will increase rapidly [3]. Ensuring a stable supply of the critical minerals required for the production of new energy batteries is of significant strategic importance [4,5,6].
The academic community has conducted extensive research into the calculation and forecasting of demand for critical minerals used in new energy batteries. In terms of the subjects of study, the research focuses primarily on four strategically scarce critical minerals: Li [7], Co [8], Ni [9] and Mn [10], with particular emphasis on analysing their strategic importance [11,12,13], supply and demand dynamics [14,15], and the situation across the supply chain [16]. With regard to application scenarios, as EVs were developed earlier and have the largest market share, they have become a primary focus of academic research [17,18]. For instance, Dong et al. [19] calculated the historical supply and demand of key metals in China’s new energy vehicle industry, and assessed the balance between supply and demand, whilst Ying et al. [20], from the perspective of EVs, analysed the demand for Li, Co and Ni resources in the context of the energy transition, and assessed the resource security challenges facing China in relation to these metals.
In terms of research methods, material flow analysis (MFA) and stock-driven modelling are well-suited to analysing the flow of critical minerals for new energy batteries across all stages of the supply chain, thereby providing a theoretical basis for historical accounting [21,22]. Forecasting future demand for critical minerals used in new energy batteries is influenced by a range of factors, including economic growth [23], the energy transition [24], industrial structure [25], and technological progress [26,27]; currently, such forecasts are primarily made using a combination of macroeconomic drivers and scenario modelling. For example, Xu et al. [28] examined the demand for new energy vehicles across five geographical regions in 2050, forecast the demand for critical minerals, and subsequently assessed the resource criticality of key metals—such as Co, Li, Ni, Nd, and Dy—in global new energy passenger vehicles. Regarding the analysis of uncertainty in forecast results, uncertainty in stock-driven models stems primarily from the settings of exogenous parameters (such as battery life, metal strength, and recovery rates).
To ensure a stable supply of critical minerals for new energy batteries, the development of a circular economy has become a key pathway for promoting the sustainable development of the energy sector. The lifespan of new energy batteries generally ranges from 5 to 15 years. The widespread adoption of new energy batteries in China began in 2010. From 2014 onwards, China began large-scale development of new energy power generation sectors such as WP and PV, driving demand for new energy batteries for applications such as SSS. The demand for critical minerals in the new energy industry accelerated further after the announcement of the Dual Carbon targets in 2020. The country is now entering a wave of battery retirement [10]. According to forecasts, the volume of retired EV batteries will reach 52.4 GWh by 2025 [4]. The recycling of new energy batteries not only alleviates supply pressures on key minerals for these batteries [5,6], but also reduces, to a certain extent, environmental pollution and carbon emissions associated with the production of primary mineral resources [7,29]. Consequently, in recent years, the recycling of new energy batteries has attracted widespread attention from researchers and industry both domestically and internationally [30,31,32]. Research has focused on historical assessments and forecasts of the volume of retired new energy batteries [33,34,35]. Wu et al. [36] and Qian et al. [37] have assessed the potential for recycling and secondary use of new energy batteries in China [38,39]. Although recycling technologies are continuously advancing, these cannot fully replace the demand for primary minerals [40]; simultaneously, the development of the recycling industry is constrained by various factors, including technology and cost. Xu Qing et al. [39] formulated a multi-scenario joint optimisation model for the allocation of cascade utilisation and payback period, with annual net profit as the objective function, and calculated the costs of cascade utilisation.
The above literature has laid the theoretical foundations for this study, but it also has certain limitations (Table S1). Firstly, the research perspective currently focuses primarily on EVs, whilst there is relatively little research on the ESI—which is growing rapidly and represents the main application area for retired batteries. Secondly, in terms of research methodology, existing studies predominantly employ either MFA or scenario analysis in isolation to conduct single-dimensional research; MFA is often confined to historical static flow accounting, whilst stock-driven models lack sufficient dynamic predictive capability. Thirdly, about recycling, most existing studies assess the supply-side potential based on the number of retired batteries but fail to systematically forecast the actual demand for cascade utilisation scenarios. Consequently, it is impossible to determine the extent to which the recycling industry actually supports the sustainable development of the new energy battery sector, let alone identify the potential risks of overcapacity in cascade utilisation.
To address these gaps, this study asks three questions: (1) How did the demand, in-use stocks, and retirement flows of Li, Co, Ni, and Mn in China’s new energy batteries evolve during 2010–2024? (2) How will battery and mineral demand change during 2025–2060 under alternative energy policy and battery technology pathways? (3) To what extent can recycling substitute for primary minerals, and can the potential supply of cascade utilisation batteries exceed downstream demand?
This study makes three marginal contributions to the existing literature. Firstly, the study expands the scope of analysis from EVs—which have been the focus of mainstream research—to encompass six major battery application scenarios, thereby providing a more comprehensive picture of China’s battery material flows. Secondly, this research aims to develop a systematic framework for sequential integration, combining dynamic MFA, stock-driven forecasting, and scenario assessment. This framework offers the traceability capabilities lacking in studies that rely on a single method. Thirdly, the study systematically compares the supply of recycled materials with market demand for cascade utilisation, identifies potential risks of overcapacity, and draws conclusions that are of value for policy-making—conclusions that cannot be obtained by relying solely on forecasts of end-of-life volumes.
2. Methods and Data
This paper establishes a comprehensive analytical process covering three aspects of critical minerals for new energy batteries: historical accounting, multi-scenario forecasting, and assessment of recycling potential. (This study focuses on forecasting demand for key minerals used in new energy batteries and assessing their recycling potential; it does not construct a comprehensive model of the supply side for these minerals.)
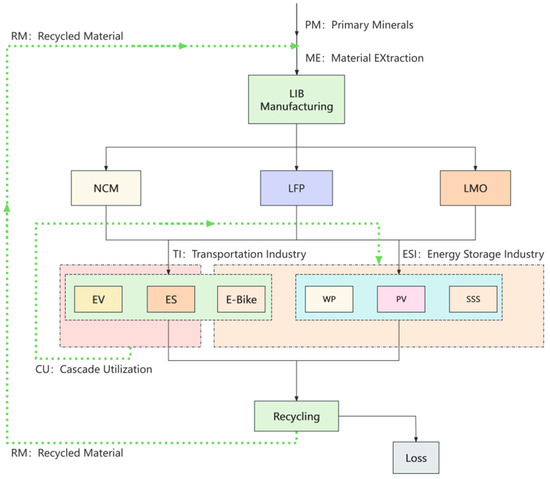
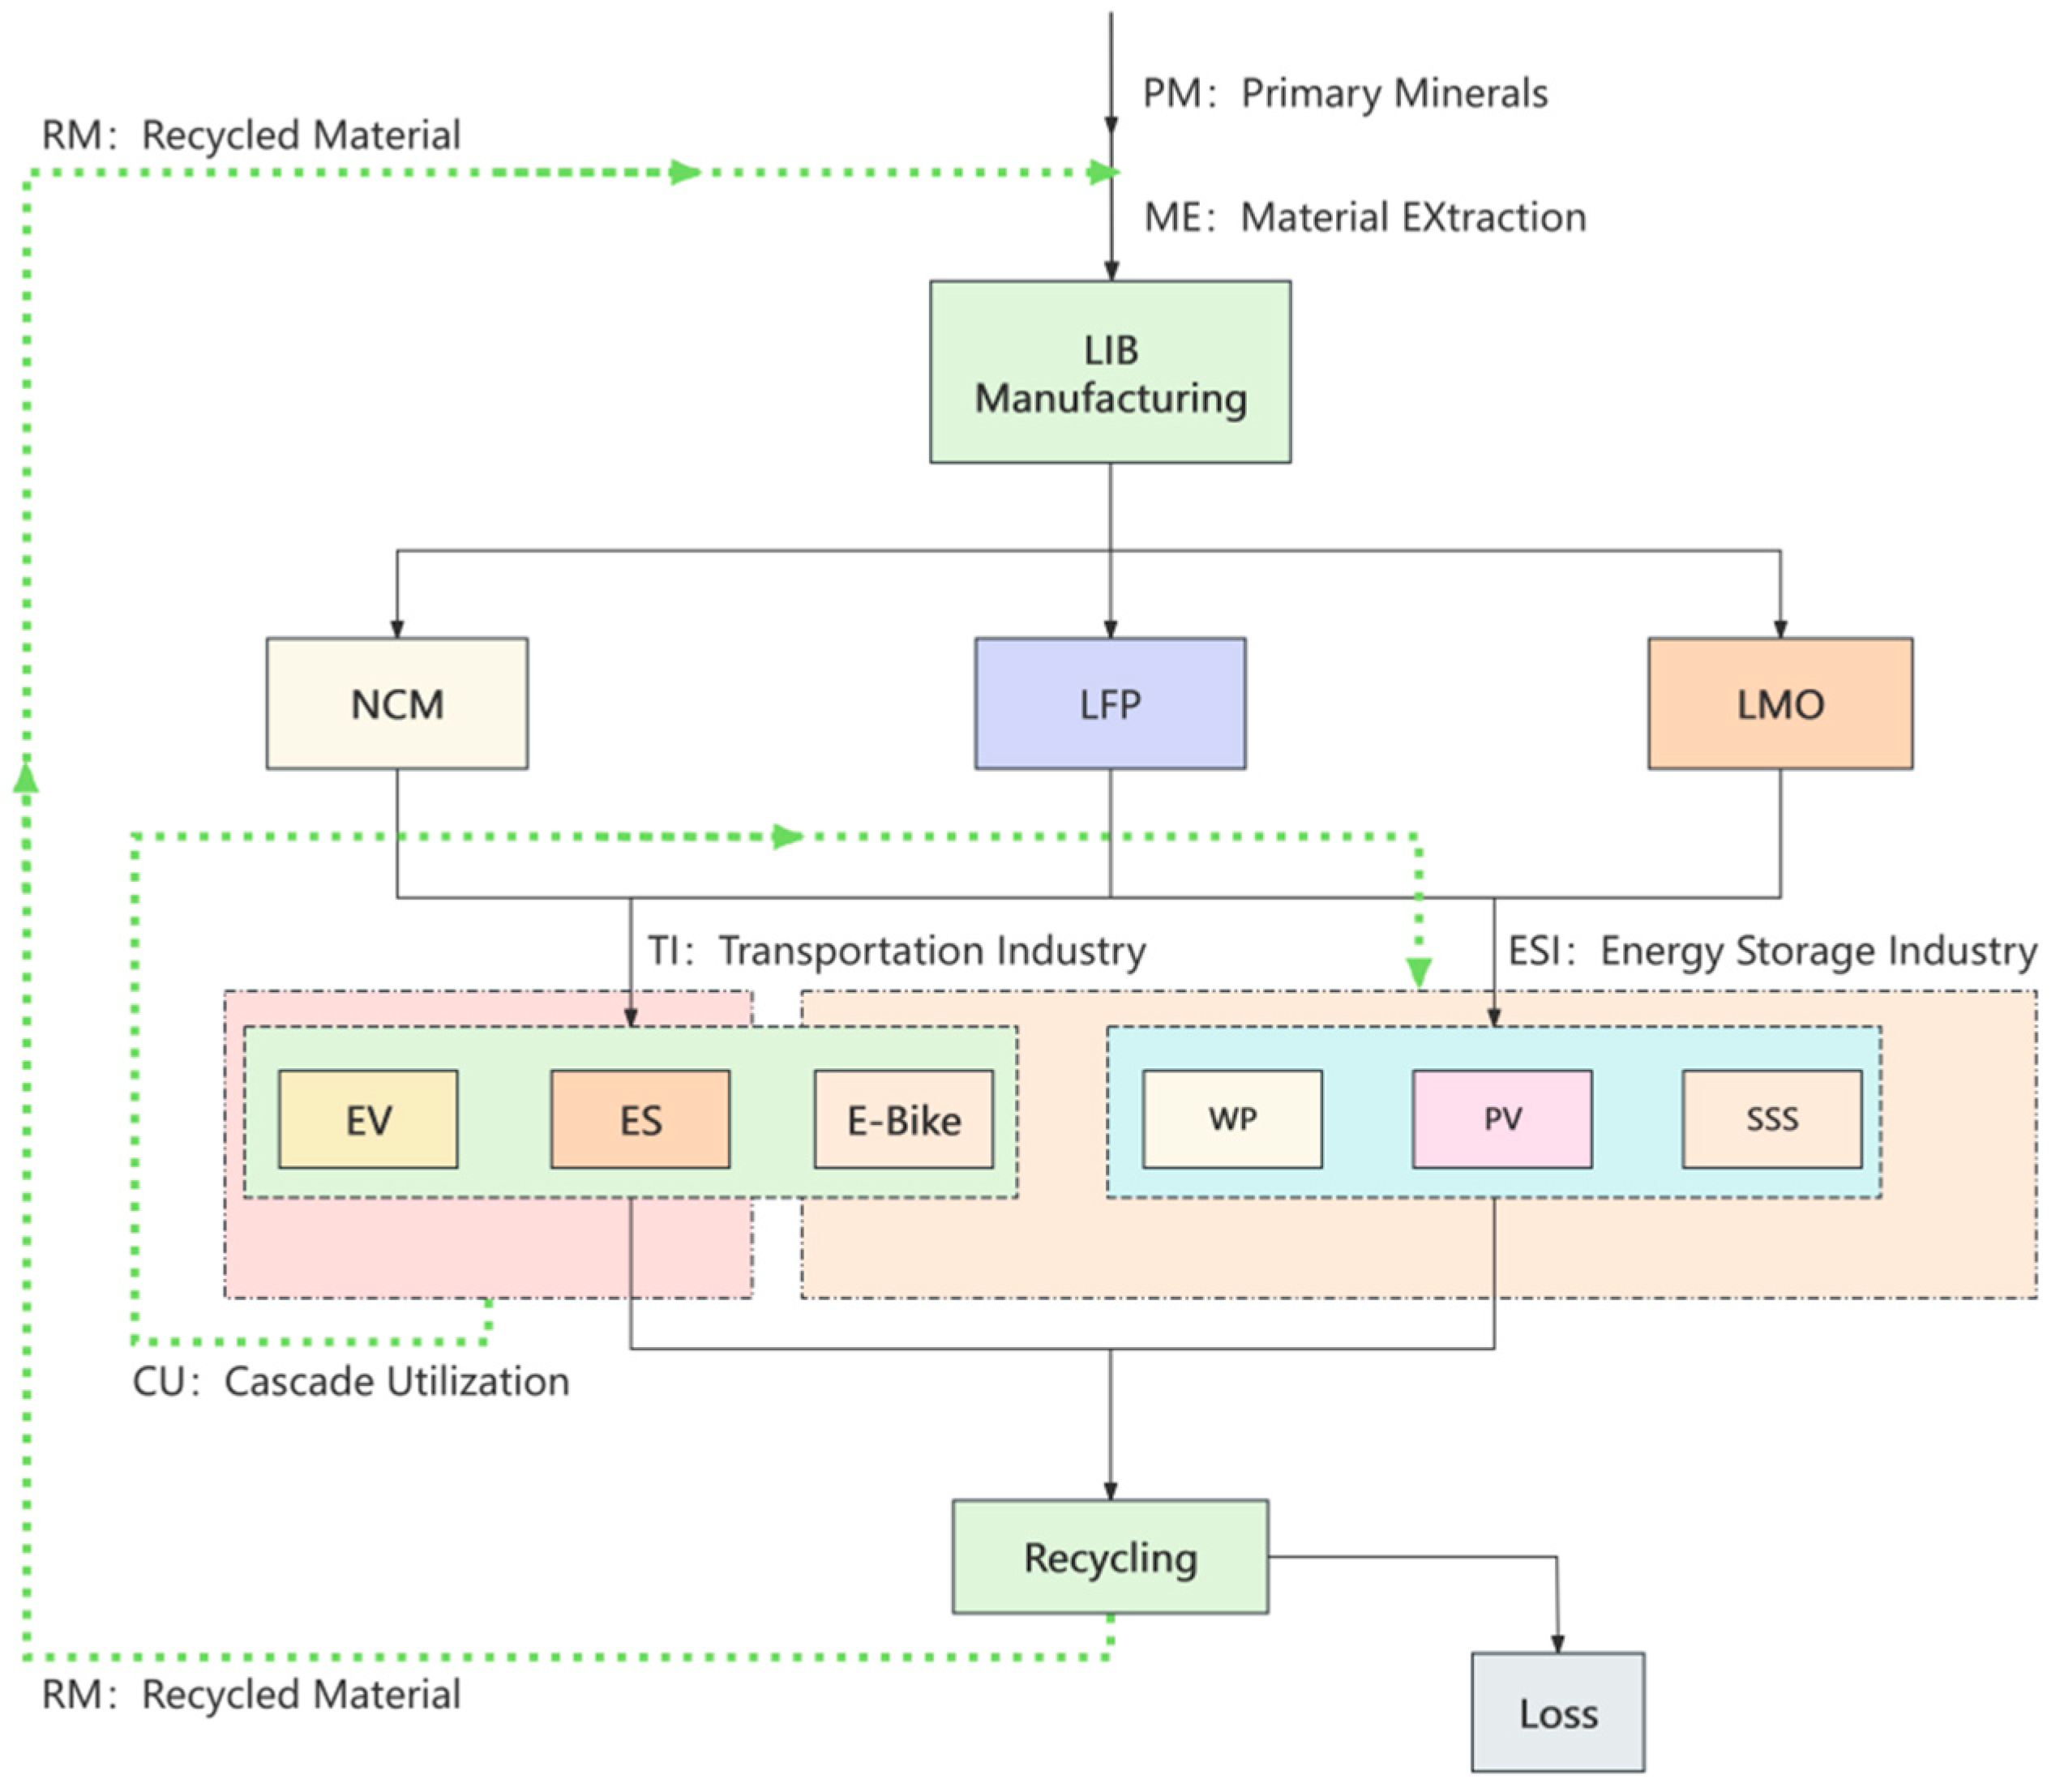
Firstly, using a dynamic MFA approach and based on the law of conservation of mass, the study systematically traces the full life-cycle flow paths of four critical minerals between 2010 and 2024, covering battery manufacturing, usage scenarios and end-of-life recycling. Secondly, a stock-driven model is introduced. Based on future socio-economic and policy scenarios (three energy policy scenarios multiplied by four battery technology scenarios), this model calculates the annual inflow of critical minerals by forecasting future societal stock levels for different battery application scenarios. Finally, by setting different recovery rates and cascade utilisation rates, this paper quantifies the actual contribution of the circular economy to alleviating pressure on the supply of virgin minerals, examining both the recyclable volume of retired batteries on the supply side and the actual demand (in the context of cascade utilisation scenarios) on the demand side. Figure 1 summarises the system boundaries; Section 2.2 and Section 2.3 provide a detailed explanation of the equations, scenario assumptions and data sources.
Figure 1.
Flowchart of critical minerals for new energy batteries.
2.1. MFA Model
This paper begins by establishing a MFA framework that encompasses the entire life cycle of new energy batteries, as shown in Figure 1. The figure illustrates the complete life cycle of a new energy battery, from the production of raw materials through to its manufacture, use, decommissioning, recycling and disposal. The geographical scope covers mainland China; the time frame is 2010–2024; the study focuses on four metals—Li, Co, Ni, and Mn; application scenarios include new EVs, E-bikes, ES, and WP, PV, and SSS; recycling methods include both cascade utilisation and recovery; and the material flow processes are clearly illustrated in the figure. At the upstream stage, primary minerals are processed before entering the battery manufacturing process; at the midstream stage, battery products are deployed across six major end-use applications, thereby forming the stock of batteries currently in use across society; downstream, retired batteries are no longer simply regarded as waste, but instead follow two circular pathways: recycling (recovering secondary materials) and cascade utilisation (downcycling for applications with lower energy density requirements, such as low-speed EVs and backup power supplies for communication base stations). This framework not only tracks the inflows, outflows and losses of materials, but also provides a clearer picture of how the circular economy is embedded within the new energy battery supply chain, offering a comprehensive conceptual basis for subsequent accounting and forecasting.
2.1.1. Basic Equation of Conservation of Mass
Based on the framework outlined above, this paper employs a bottom-up dynamic material flow approach to calculate the historical demand for new energy batteries between 2010 and 2024. During the flow of substances within a system, regardless of any changes in their form, the law of conservation of mass applies; that is, the total inflow equals the total outflow. In this paper, the elements in question are Li, Co, Ni, and Mn. The basic equation for the conservation of mass is as follows [41]:
where i represents different elements (Li, Co, Ni, and Mn); j represents different usage scenarios in the material flow. △Si,j(t) represents the stock net change at the end of the year t at stage j. InFi,j(t), RecFi,j(t), CuFi,j(t), OutFi,j(t), represents the inflow, recycling, cascade utilisation, and outflow of element i in usage scenario j in year t.
2.1.2. Inflow, Outflow and Recycling
The inflow InFi,j(t) is calculated using the quantity of product fed into stage i and the mineral content coefficient of that product; the outflow OutFi,j(t) is calculated using the inflow to stage i and the recovery rate of usage scenario j. The calculation formulas are as follows:
In the above formulas, Oj(t) represents the quantity of product invested in stage j in year t; Qi,j(t) represents the product coefficient for usage scenario j in year, Di,j(t’)w denotes the consumption of critical mineral i in domestic utilisation scenario j in year t’; fj is the probability density function of the lifetime distribution for usage scenario j, which in this paper follows a Weibull distribution, where u and α are the relevant parameters of the Weibull distribution.
The methods for calculating the corresponding amounts for recycling and cascade utilisation are as follows:
In the equation, represents the recycling rate of element i from end-of-life batteries in usage scenario j in year t. represents the secondary utilisation rate of element i from end-of-life batteries in usage scenario j in year t.
2.1.3. Analysis of Current Inventory
The stock of a substance during the use phase is defined as the in-use stock, which refers to the total quantity of the substance present in all end-products in use within the system under study. From a methodological perspective, the introduction of the concept of ‘in-use stock’ and its calculation methods represents one of the key contributions of MFA. Once these in-use stocks reach the end of their service life, they are either recycled to enter the next life cycle or discarded, becoming waste batteries. The method for accounting for in-use stocks of critical mineral elements is as follows [19]:
where j represent distinct categories of application scenarios; Si(t) denotes the total installed base in year t; Si,j(t) denotes the installed base of application scenario j in year t; InFi,j(t) denotes the inflow for application scenario k in year t; OutFi,j(t) denotes the outflow for application scenario j in year t; Si,j(t − 1) denotes the installed base of application scenario j in the previous year. Assume that China’s installed base was 0 at the beginning of 2010.
2.1.4. Calculated Using Existing Stock
When forecasting future demand for new energy batteries, it is difficult to predict the exact volume for any given scenario; however, by combining scenario analysis with relevant socio-economic factors, policies, and technological pathways, it is possible to estimate the specific market size and capacity, and thereby work backwards to calculate the annual volume. This paper, therefore, uses a stock-driven model to forecast demand for critical minerals. The core logic of the stock-driven model is that, given the target stock levels for each year, the inflows for each year are calculated retrospectively. The specific calculation steps are as follows:
(1) The recursive calculation for the stock-driven model begins in the first year of the model. Calculation of the outflow from decommissioning in the current year, OutFi,j(t): based on the lifetime distribution function
represents the lifetime distribution function; t represents the actual time, and represents the time of material input.
(2) Assuming the initial stock is 0, calculate the difference between the future stock Sfut(t) and the current stock S(t).
(3) The future inflow InFi,j(t) is calculated using the stock difference △S(t) obtained in Equation (9) and the model year T.
Then repeat the steps above, starting with Equation (8), until the inflow for each future year has been calculated.
2.1.5. Demand Forecasting
In order to further forecast the demand for critical minerals in the new energy battery sector up to 2060, and in line with the development trends of the new energy battery industry, this paper employs a logistic function to forecast the demand for critical minerals in new energy batteries under different scenarios.
Ssat(t) is the saturated target stock, k is the growth rate parameter, t0 is the initial year of the forecast.
2.2. Scenario Assumption
The industries associated with new energy batteries are predominantly in the field of emerging technologies, characterised by late inception, rapid development, and a high degree of uncertainty. Consequently, when forecasting demand for new energy batteries, existing frameworks struggle to analyse them effectively. This paper develops scenario-based assumptions based on current social and economic conditions, the intensity of policy measures, and the direction of technological progress.
2.2.1. Energy Policy Scenarios
To achieve China’s energy transition goals, the government has, in recent years, issued several key policies to accelerate the development of the new energy industry. Taking into account the energy policy outlooks set out in various reports, this paper proposes three distinct energy transition scenarios: Stated Energy Policies Scenario (STEPS, low scenario), Announced Pledges Scenario (APS, medium scenario) and Net Zero Emissions by 2050 Scenario (NZE, high scenario), representing low, medium and high levels of critical minerals for new energy batteries. The development objectives and assumptions for different sectors under specific policy scenarios are set out in Table S2. Forecasts of future demand for new energy batteries under different scenario assumptions are provided; the specific analytical process is shown in Text S1 and Figure S1.
2.2.2. Battery Technology Scenarios
The proportion of critical minerals used in new energy batteries is closely linked to battery technology and the market share of different battery types. Lithium iron phosphate (LFP) batteries offer a long service life, chemical stability, and relatively low costs. Whilst Ternary lithium (NCM) batteries offer high-energy density, these batteries exhibit poor high-temperature performance and a relatively short life cycle. Table S3 provides historical statistics on the market share of different battery types. Based on the current state of development of new energy batteries, four different battery technology development scenarios have been established: the baseline scenario, the LFP batteries dominated scenario [41], the NCM batteries dominated scenario [34,42,43], and the new technology breakthrough scenario. The forecast assumptions for the various scenarios are set out in Table 1, and the resulting projections for the future market share of batteries under different battery technology scenarios are shown in Table S4. This provides the projected demand for critical minerals used in various types of renewable energy batteries under different combinations of energy policies and renewable energy market share scenarios.
Table 1.
Market share forecast for new energy batteries: 2025–2060.
2.3. Data Sources
Before proceeding with the specific calculations, it is first necessary to clarify the sources of the data (Table 2). This paper draws primarily on authoritative literature, industry reports, and statistical data from government bodies and trade associations. The specific values for the metal material intensity coefficients (the mass of Li, Co, Ni, and Mn contained per unit of battery capacity) for different battery types (LFP, NCM, LMO) are shown in Table S5. The lifetime distribution functions for each battery type are fitted using the Weibull distribution. The specific parameters are shown in Table S6. Sales figures and the number of new EVs in circulation are sourced from the China Association of Automobile Manufacturers; data on E-bikes and ES are taken from annual industry reports; and figures for WP, PV, and ESI installed capacity are sourced from the National Energy Administration’s Report on the Development of New Energy Storage in China. The relevant data can be found in Table S7. The historical proportions of recycling and second-life utilisation are shown in Supplementary Tables S8 and S9. A dynamic material flow calculation workflow for critical minerals is shown in Figure S2.
Table 2.
Summary of model parameter data sources.
3. Historical Accounting Results
Historical accounting for 2010–2024 establishes the baseline for the forecasts in Section 4 and Section 5. This section quantifies mineral demand, in-use stocks, and retirement flows and uses the resulting 2024 stocks and retirement patterns to initialise and calibrate the stock-driven model.
3.1. Historical Demand Calculation
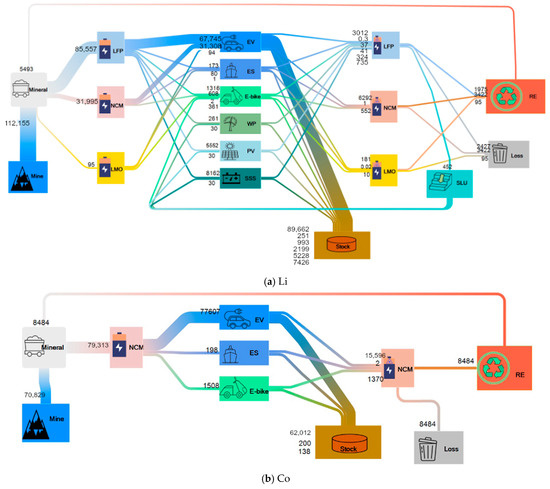
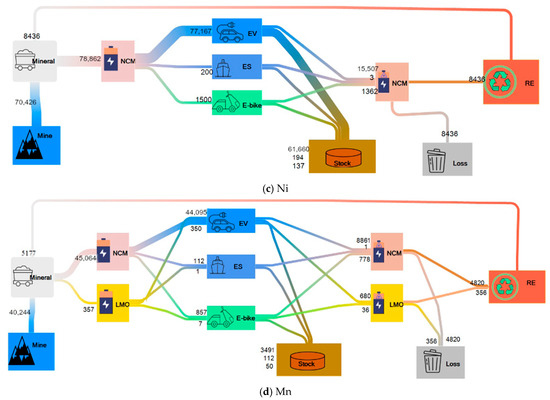
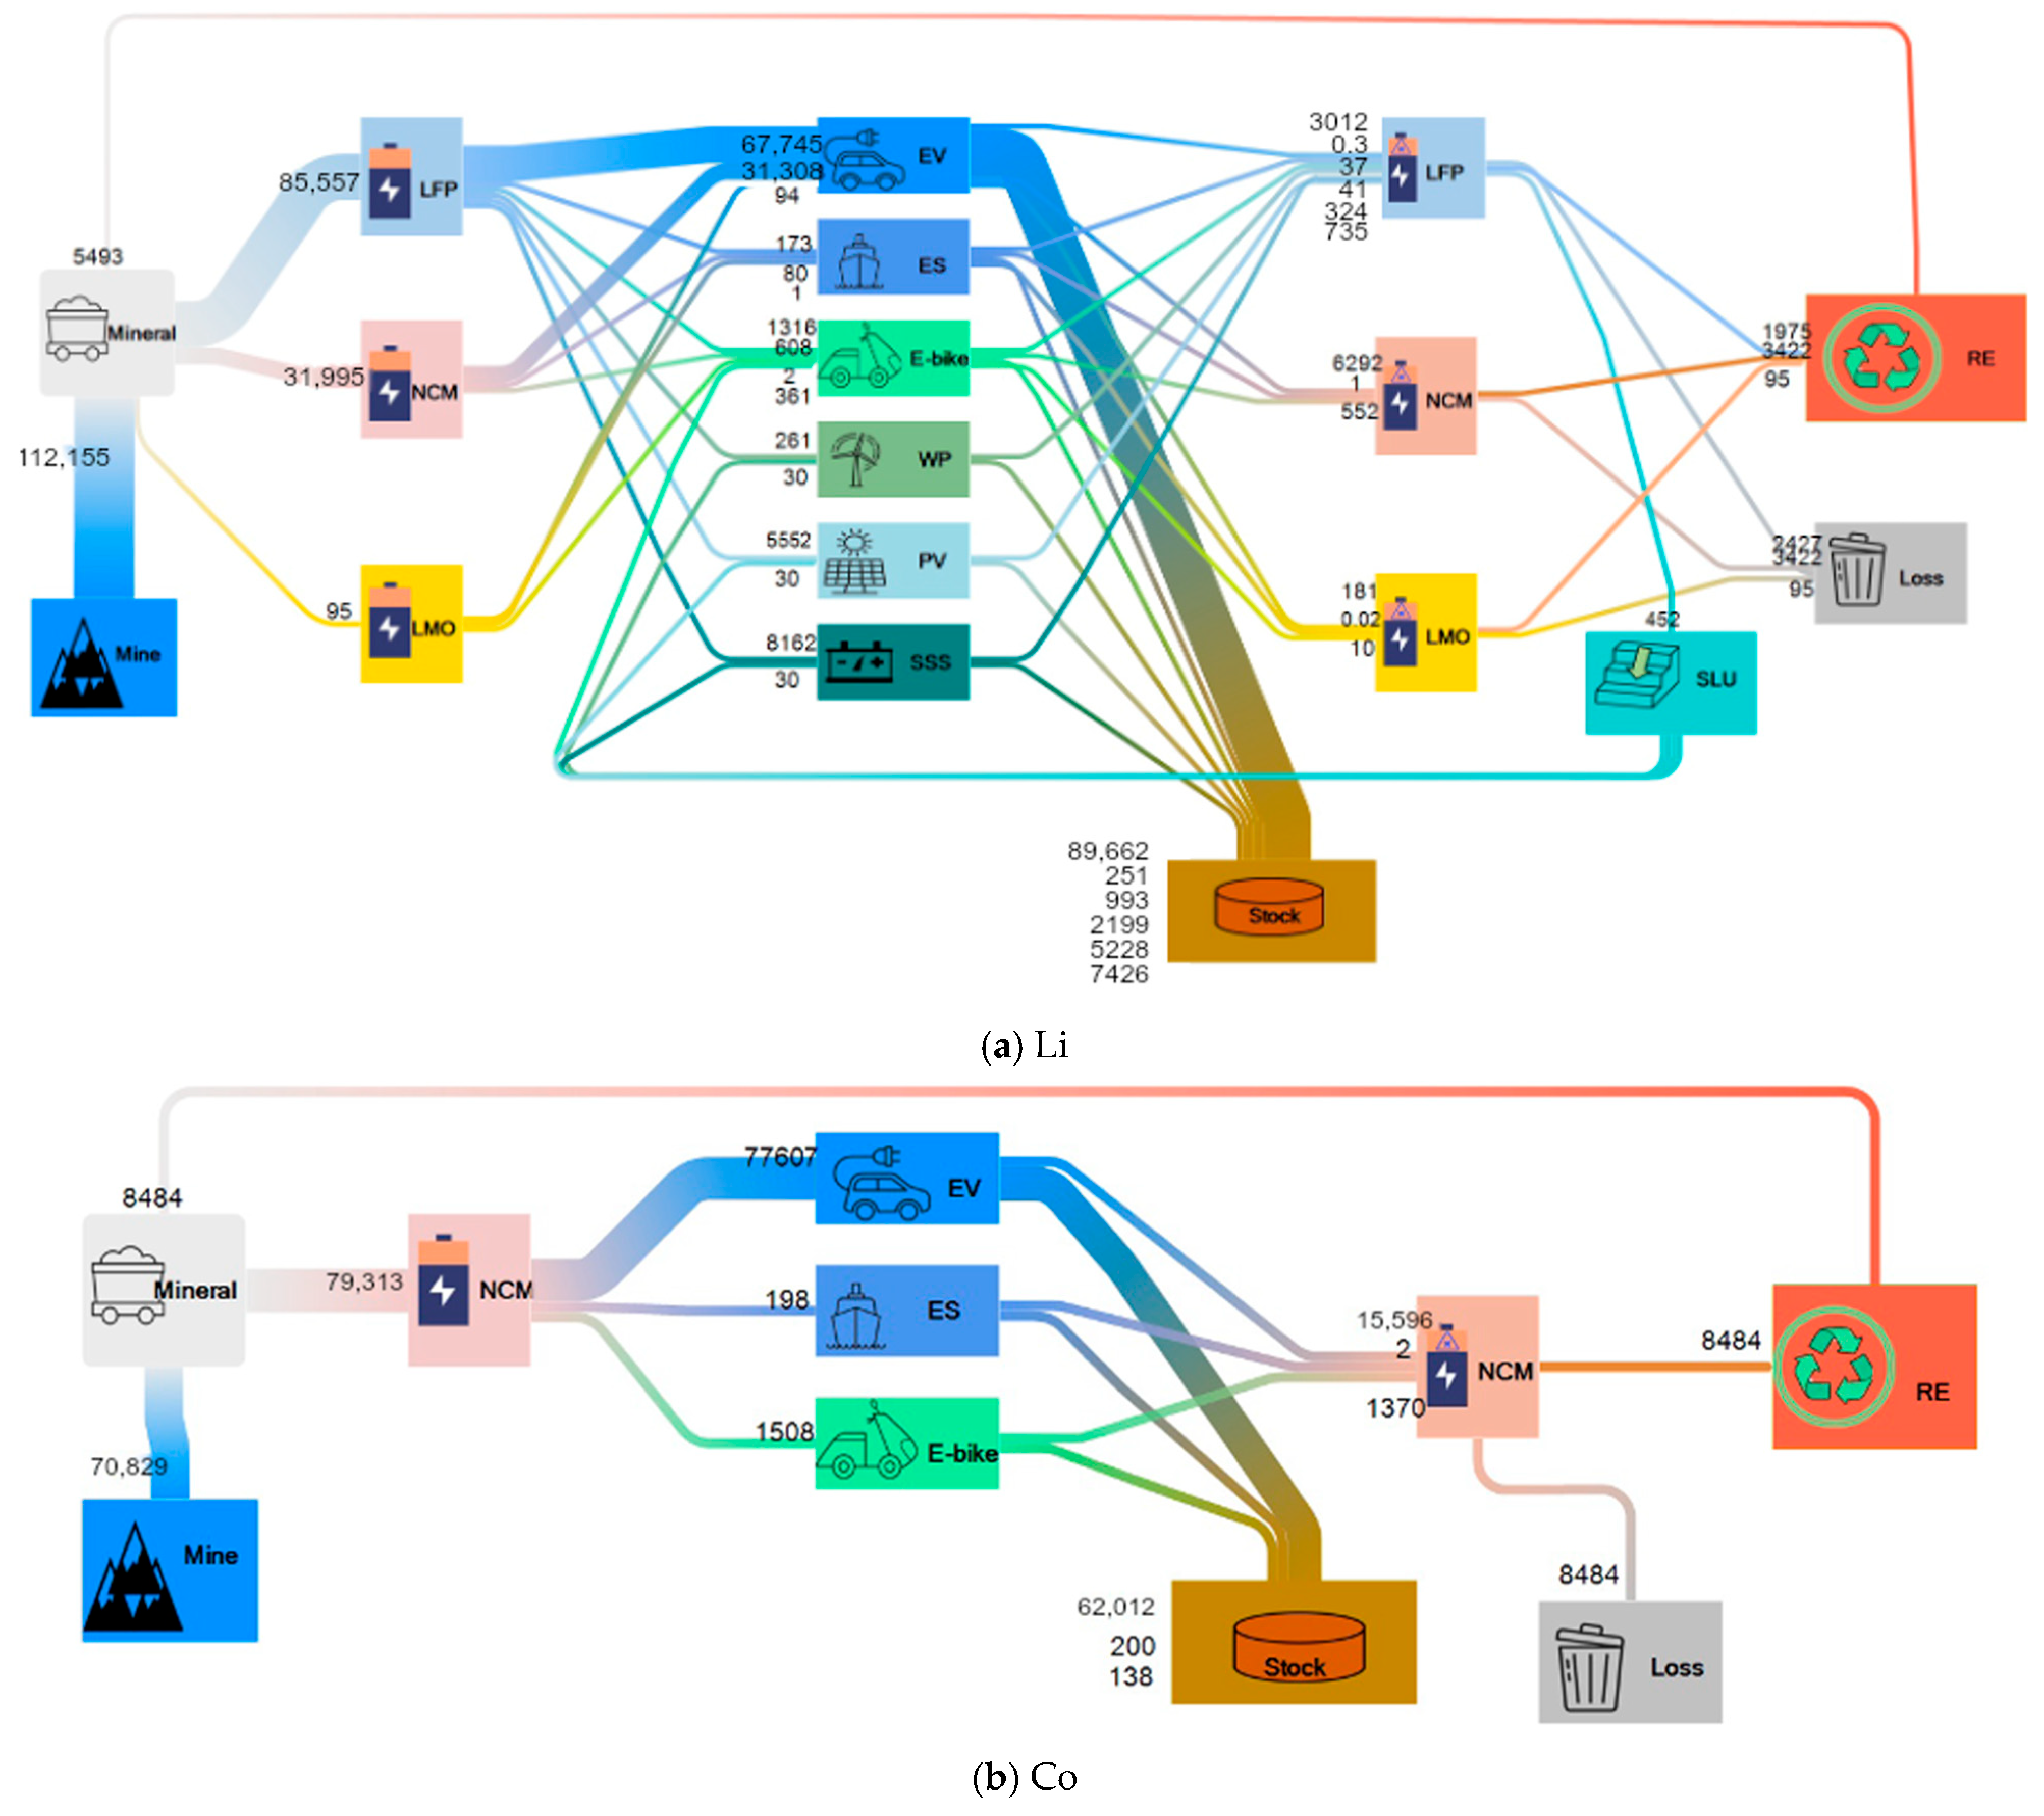
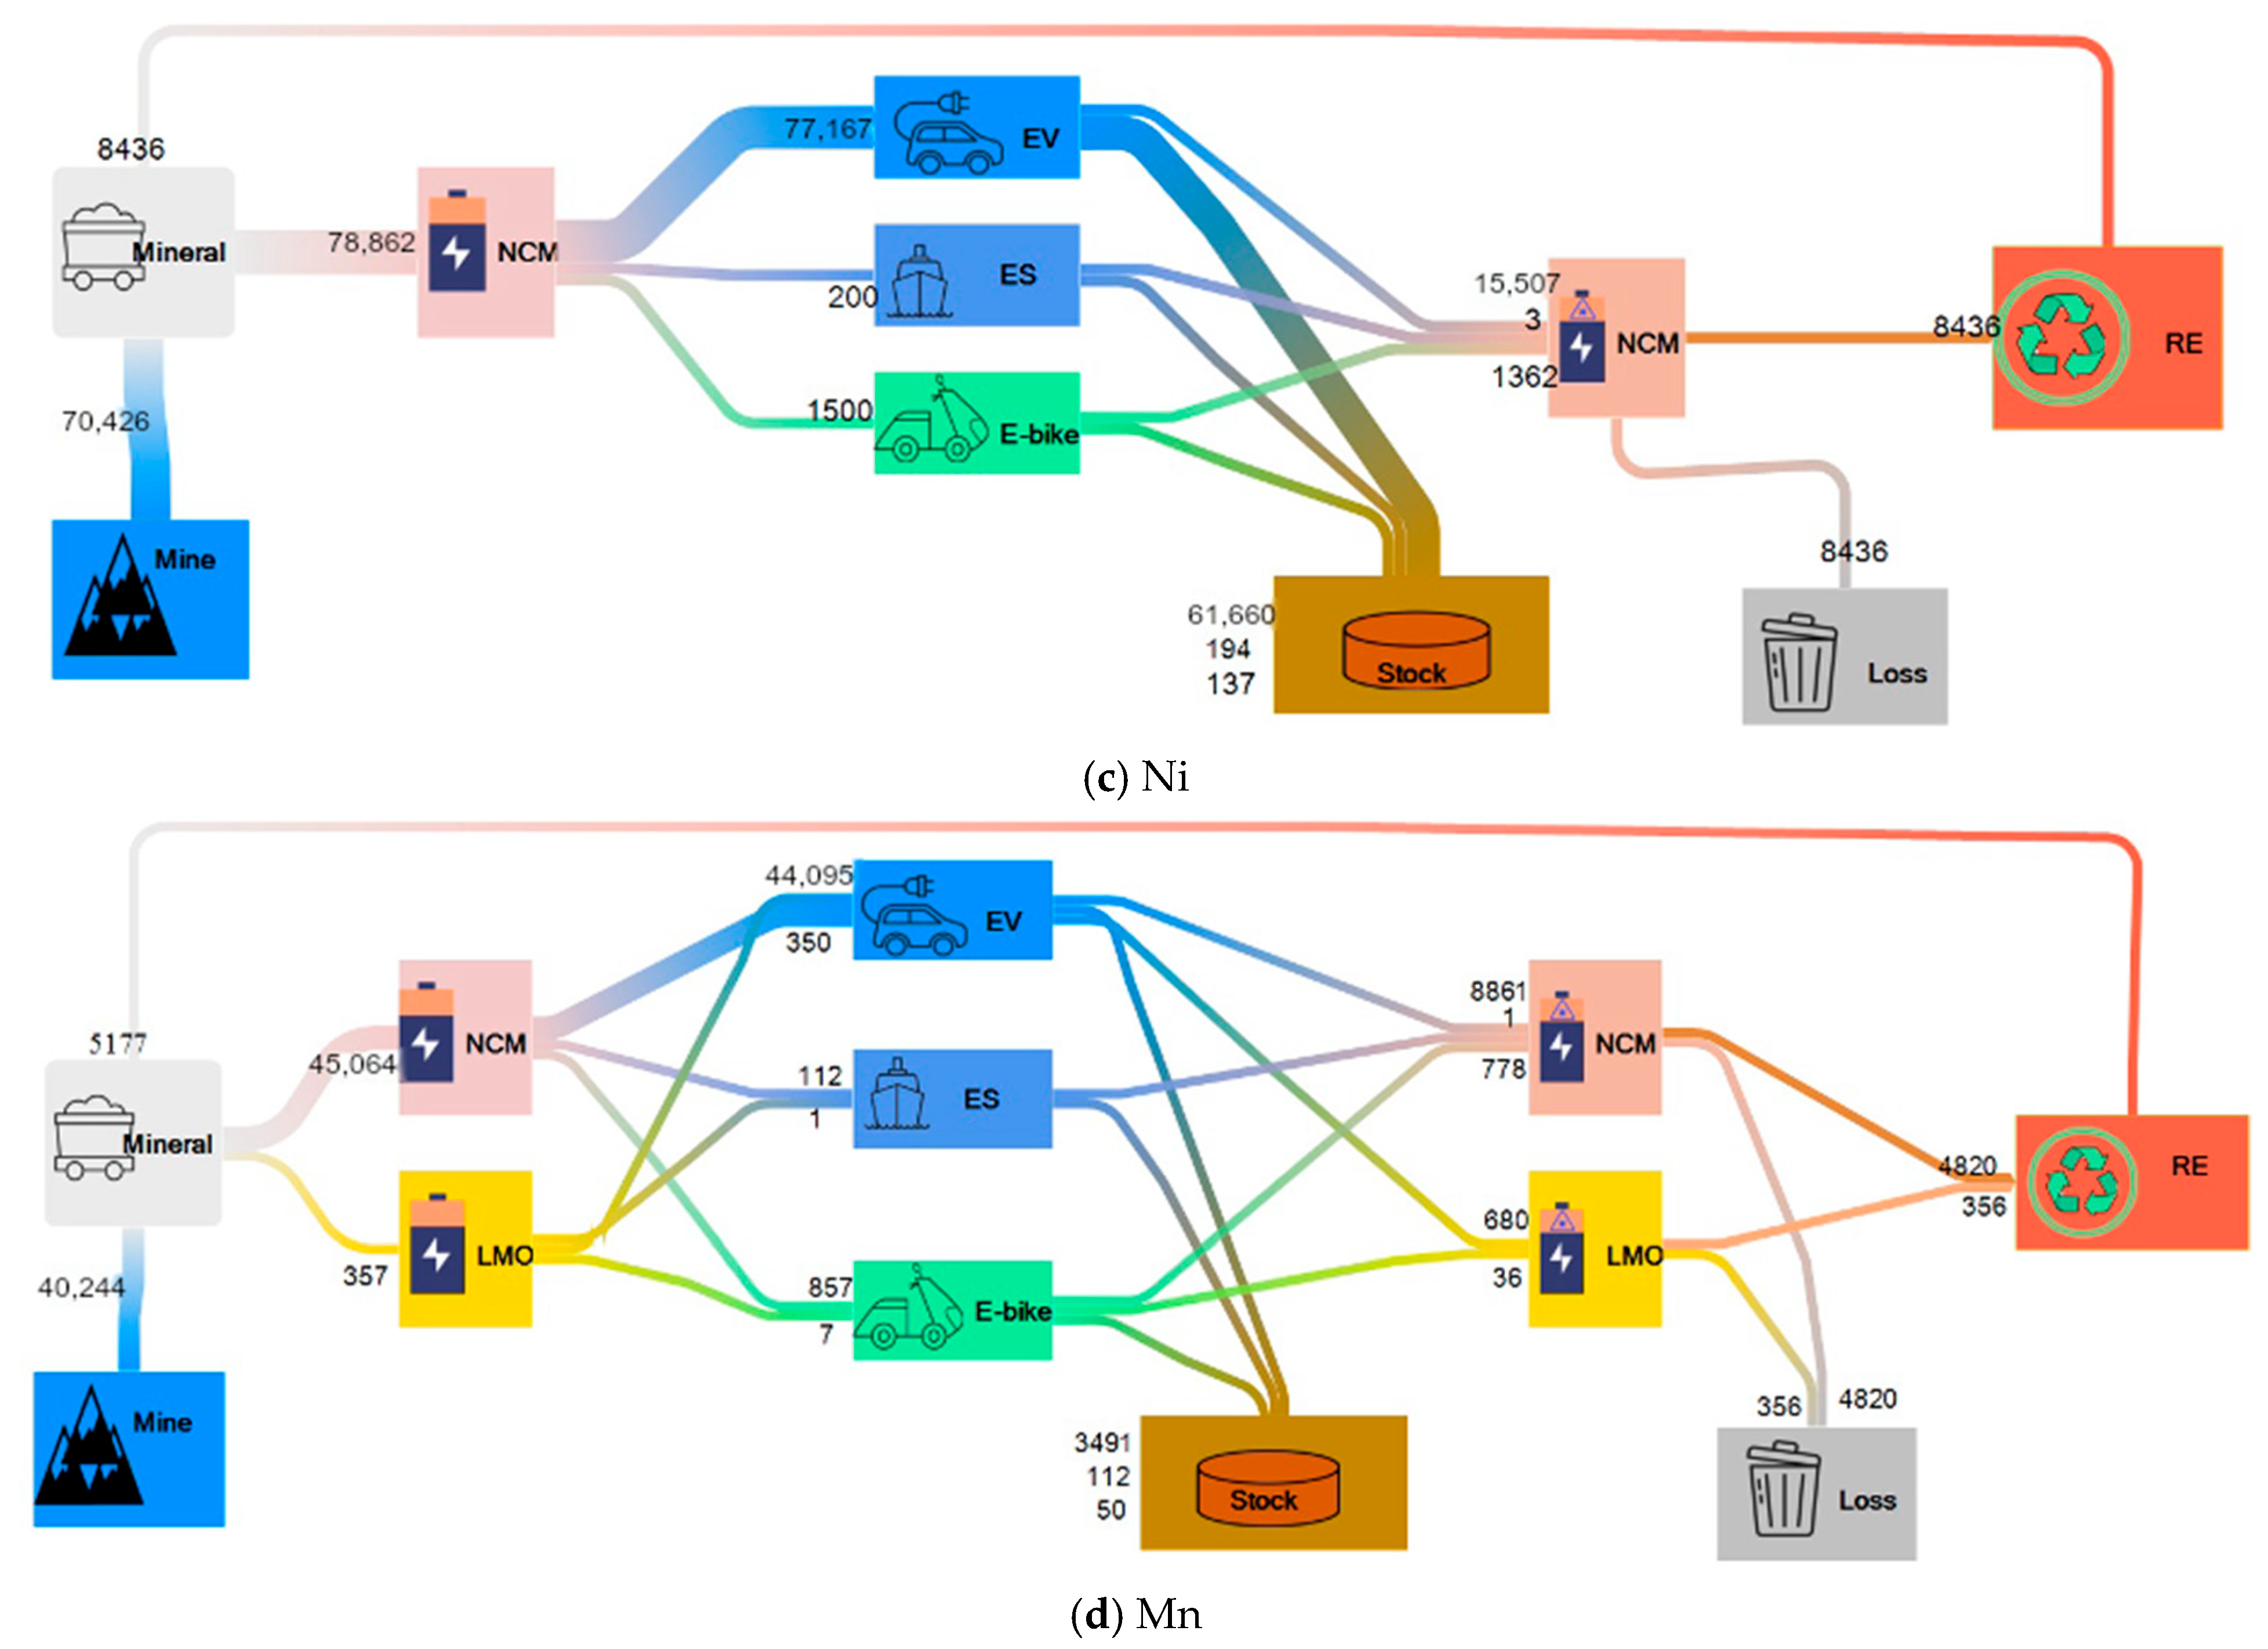
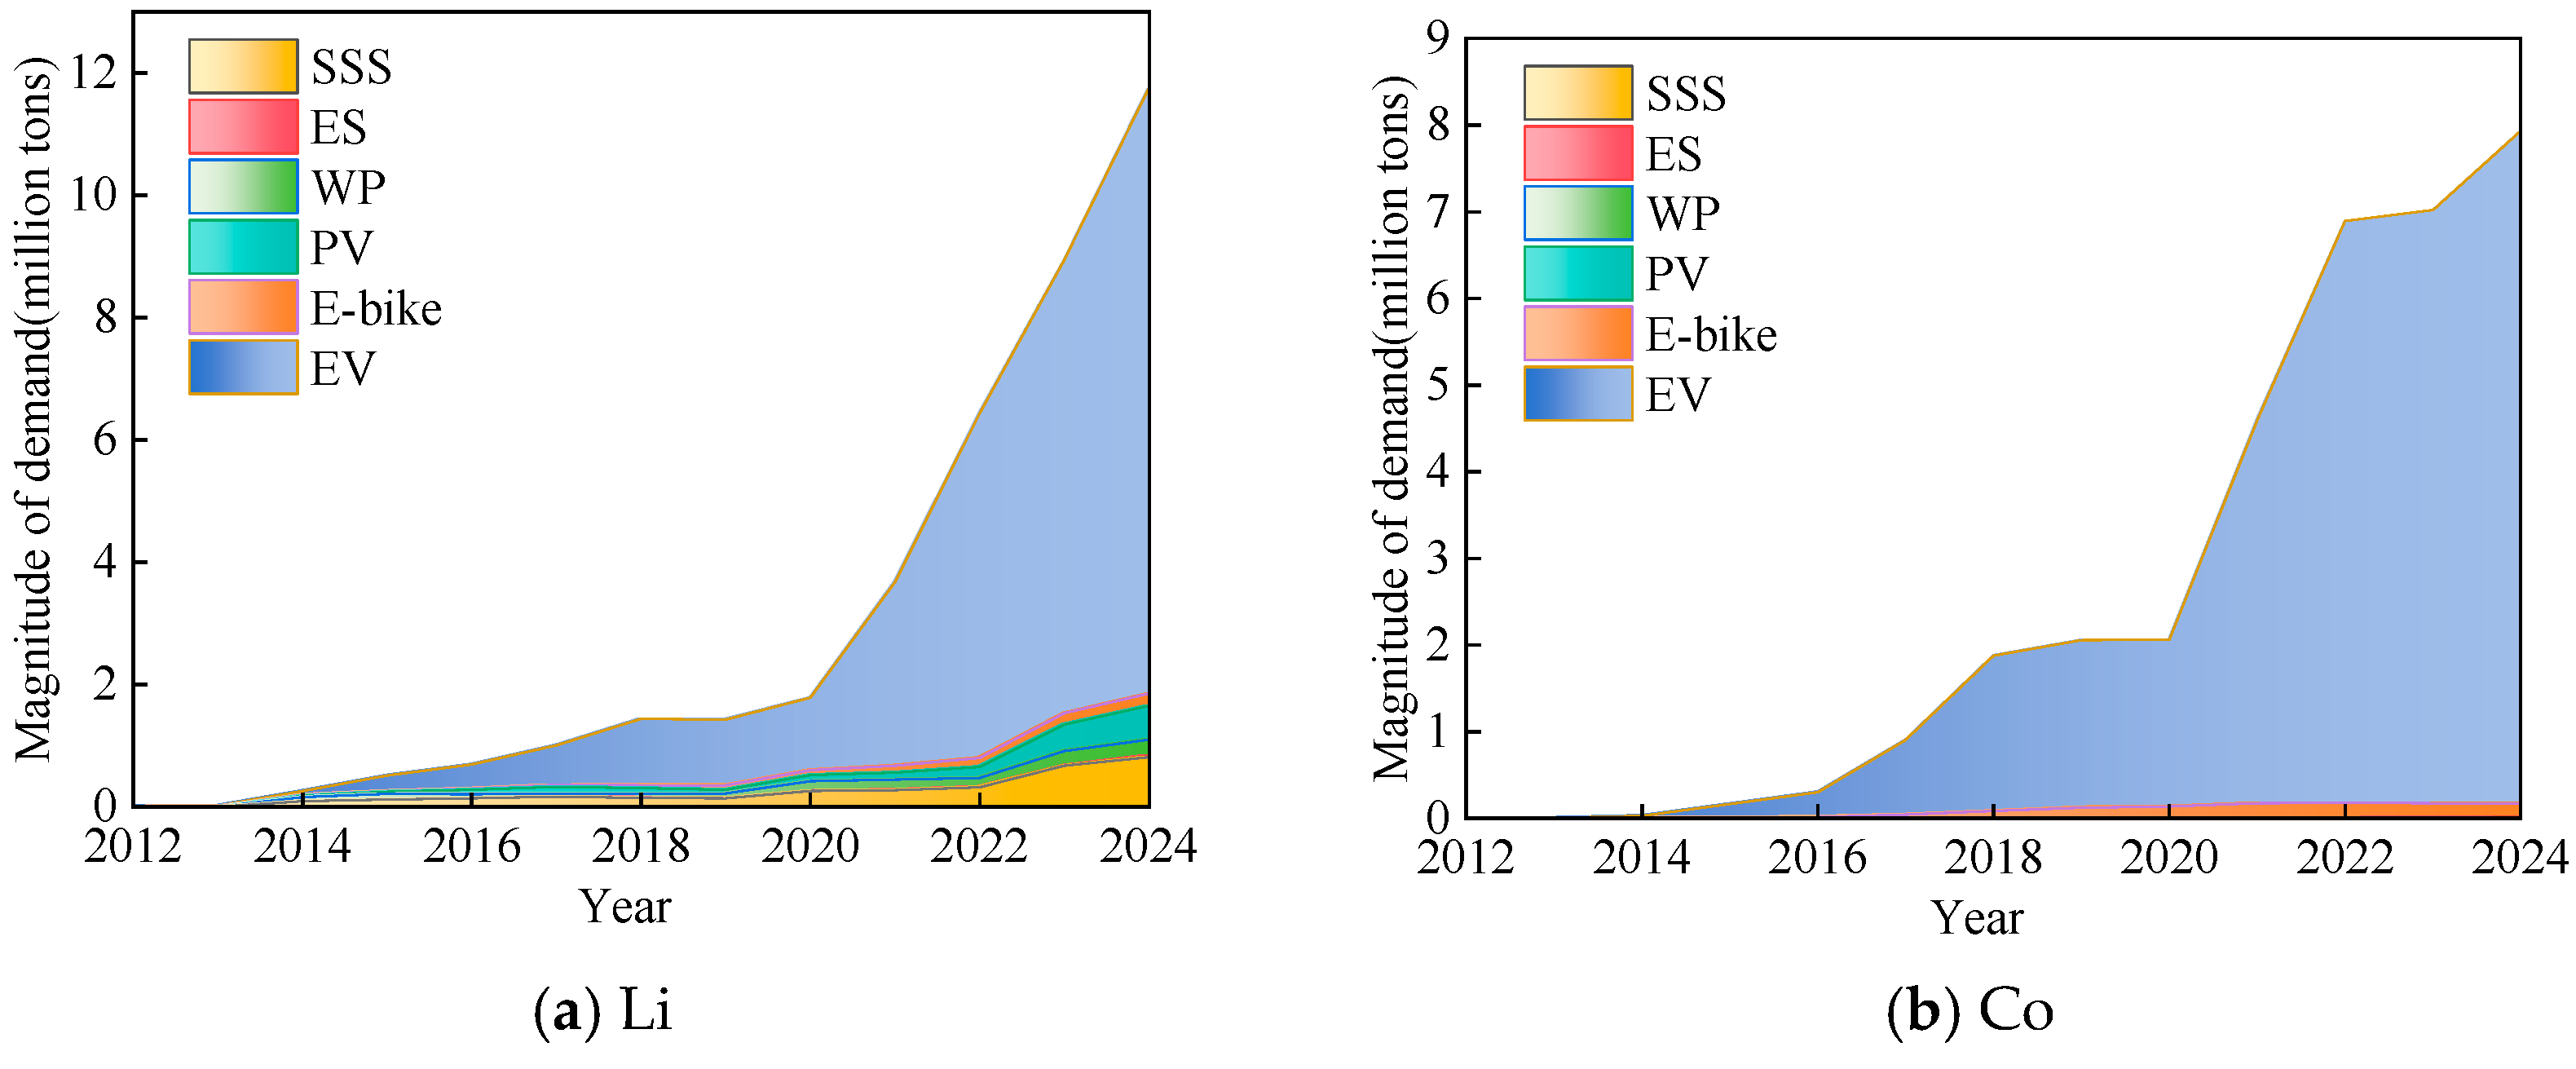
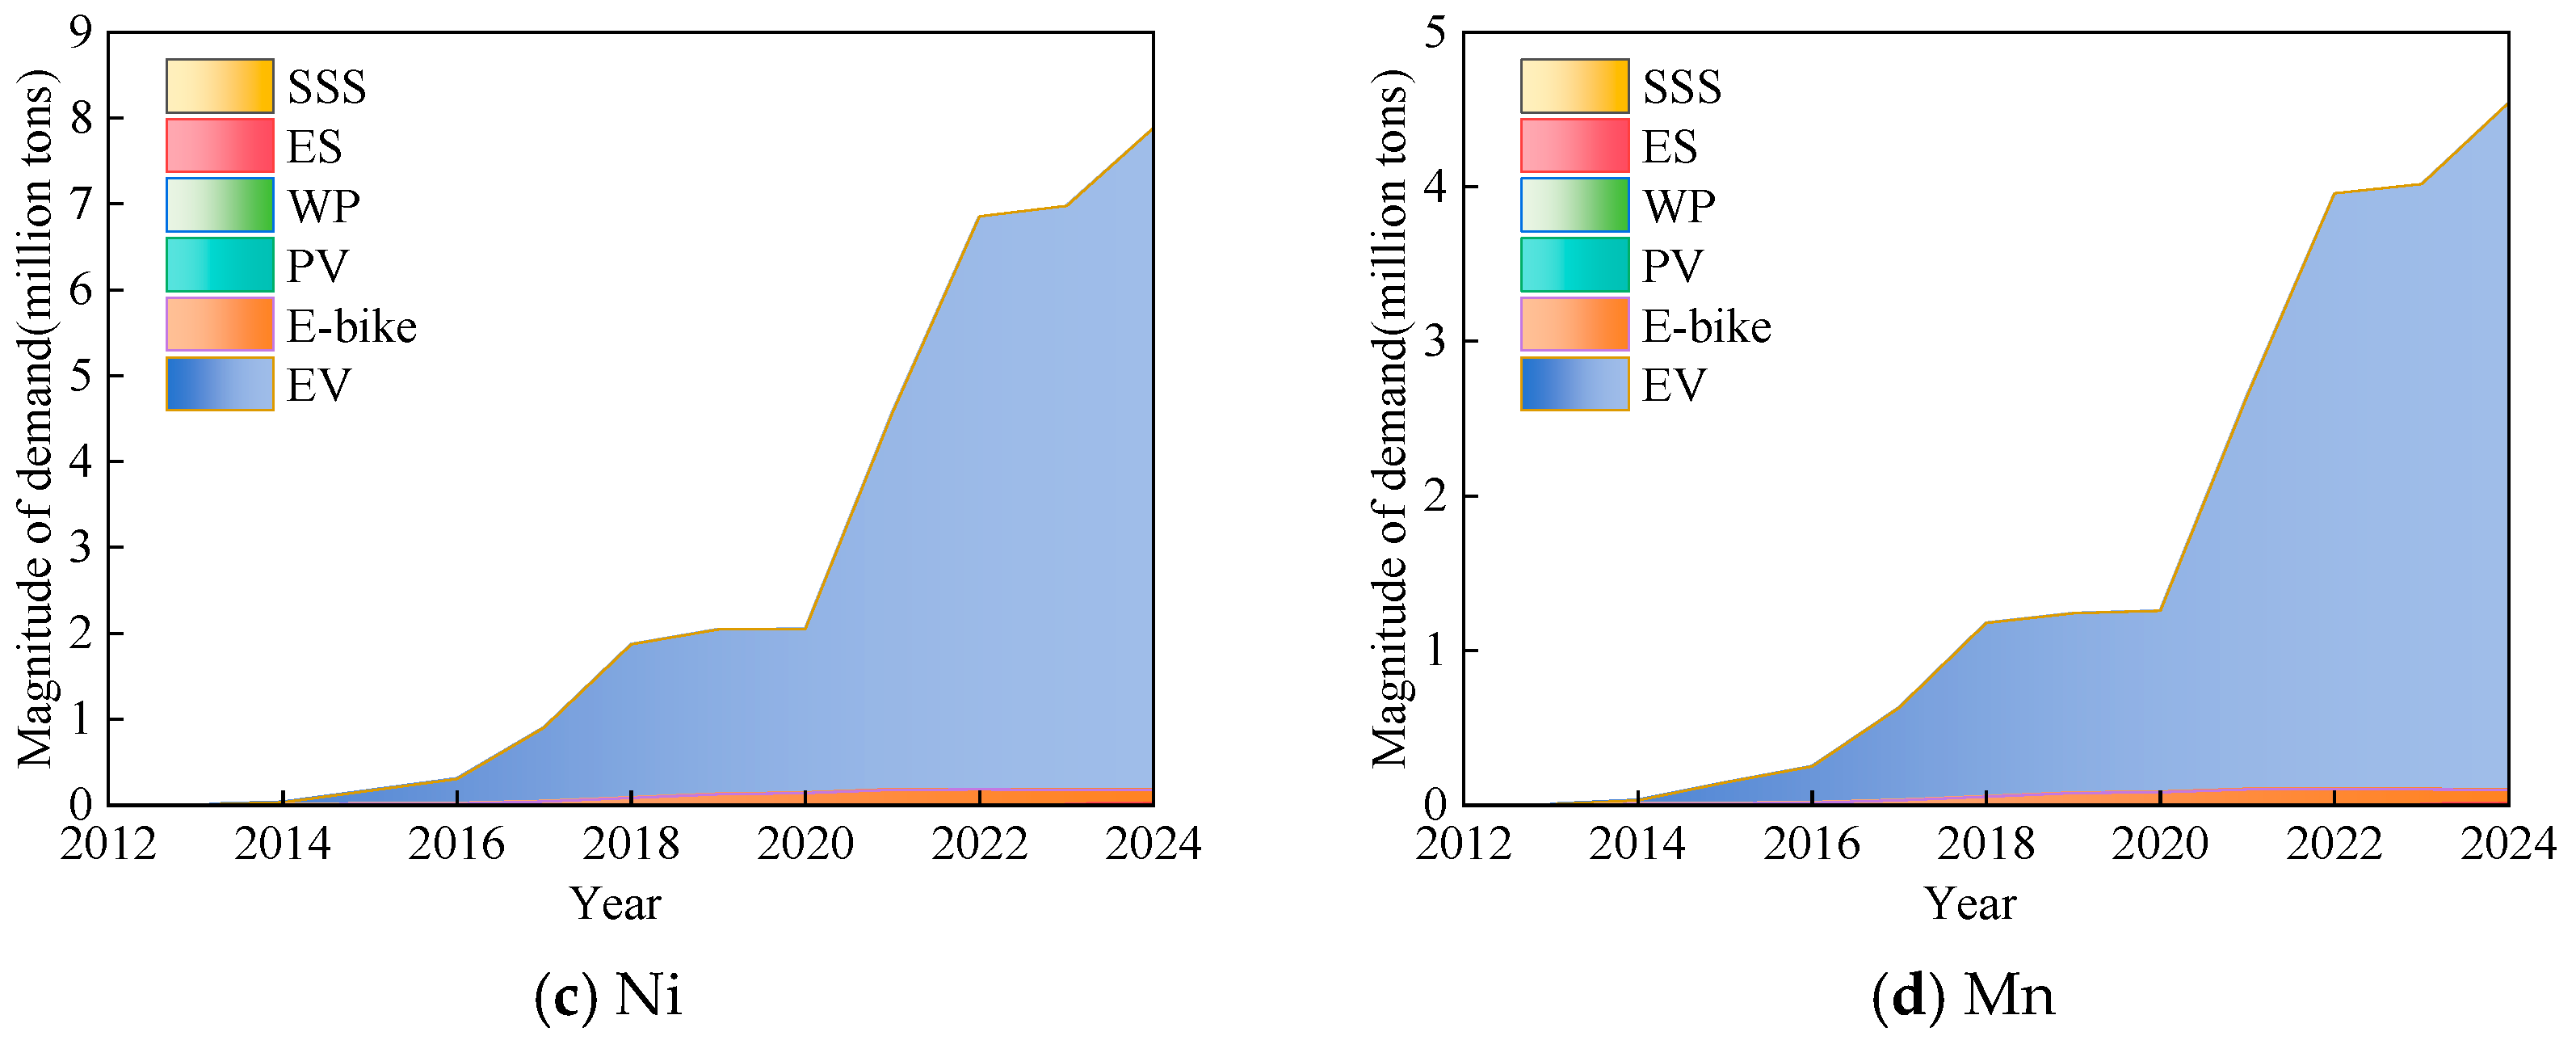
Based on the material flow model described above, this paper has calculated the annual demand for four key minerals for the period 2010–2024 (Figure 2). The results show that demand for Li stood at 0.78 kt in 2010. By 2015, demand for Li, Co, Ni, and Mn had reached 5.1 kt, 1.7 kt, 1.6 kt and 5.1 kt, respectively. Thereafter, demand entered a phase of accelerated growth; by 2024, demand for the four minerals had reached 117 kt, 79 kt, 78 kt and 45 kt, respectively, representing increases of 6.5-fold, 3.84-fold, 3.84-fold and 3.61-fold compared with 2020. In terms of demand structure, new EVs will consume 99 kt of Li in 2024, accounting for 84% of total Li consumption; the ESI will consume 8.2 kt of Li, accounting for 6.9%.
Figure 2.
Critical mineral material flows for new energy batteries (2010–2024; unit: tonnes).
The market share distribution across different new energy battery types also significantly influences demand for critical mineral elements. In the power battery market, before 2011, the Chinese market exclusively utilised LFP batteries. NCM batteries, characterised by their high-energy density, entered the EV market from 2012 onwards [25], and have since become the prevailing power battery technology. In recent years, LFP battery technology has undergone continuous refinement, gradually reclaiming market share. As of 2023, NCM batteries accounted for 126.2 GWh of installed power battery capacity, representing 31.6% of the total and marking a year-on-year increase of 14.3%. LFP batteries reached an installed capacity of 261.0 GWh, reflecting a year-on-year growth of 42.1%.
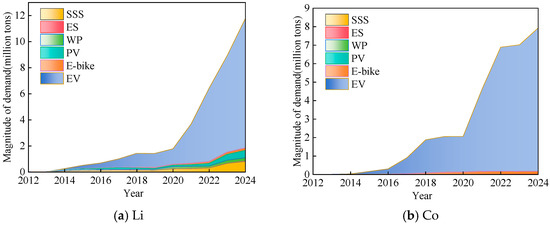
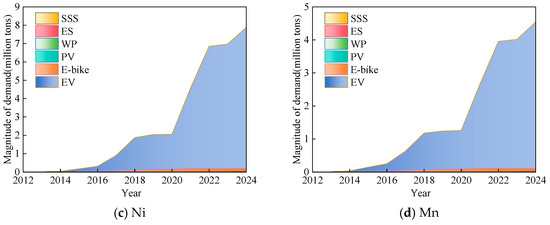
Figure 3 illustrates the demand for various elements between 2010 and 2024. It is evident from the chart that demand for four critical minerals has surged over the past 15 years, whilst the market share of different battery types markedly influences the demand for elements. Between 2016 and 2020, the market share of LFP batteries declined, while that of NCM batteries gradually expanded, driving a surge in demand for Ni and Co. Since 2020, demand for LFP batteries has surged once more, driven by soaring sales of new energy vehicles and continuous advancements in battery technology. Consequently, when forecasting future demand for critical minerals, it is essential to consider both the pace of development across different application scenarios and the market share of various battery types.
Figure 3.
Changes in demand for Li, Co, Ni, and Mn from 2010 to 2024.
3.2. Current Inventory Calculation
Currently, in China, the stock of critical minerals used in new energy batteries is growing rapidly. As shown in Figure S3, by 2024, the social stockpiles of the four elements Li, Co, Ni, and Mn had reached 62 kt, 106 kt, 35 kt, and 62 kt, respectively. The majority of lithium’s social stockpile is concentrated in new energy vehicles, accounting for approximately 85%. The ESI represents the second largest application scenario for Li, collectively accounting for around 14%. Owing to the performance differences between LFP batteries and NCM batteries, the ESI currently employs LFP batteries almost exclusively, whilst NCM batteries are primarily utilised in new energy vehicle applications. Consequently, societal reserves of Ni and Co are concentrated primarily in the new energy vehicle sector. As the first batch of new energy vehicles retires, a significant volume of new energy batteries is entering the end-of-life phase. The appropriate utilisation of retired batteries can help alleviate shortages in critical mineral supplies to some extent and reduce carbon emissions during battery production.
3.3. Retired Battery Flow Calculation
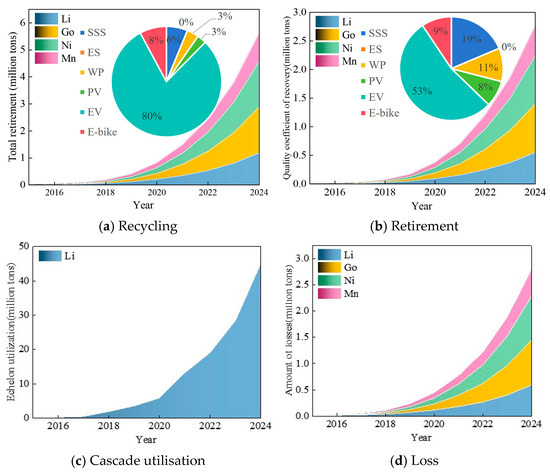
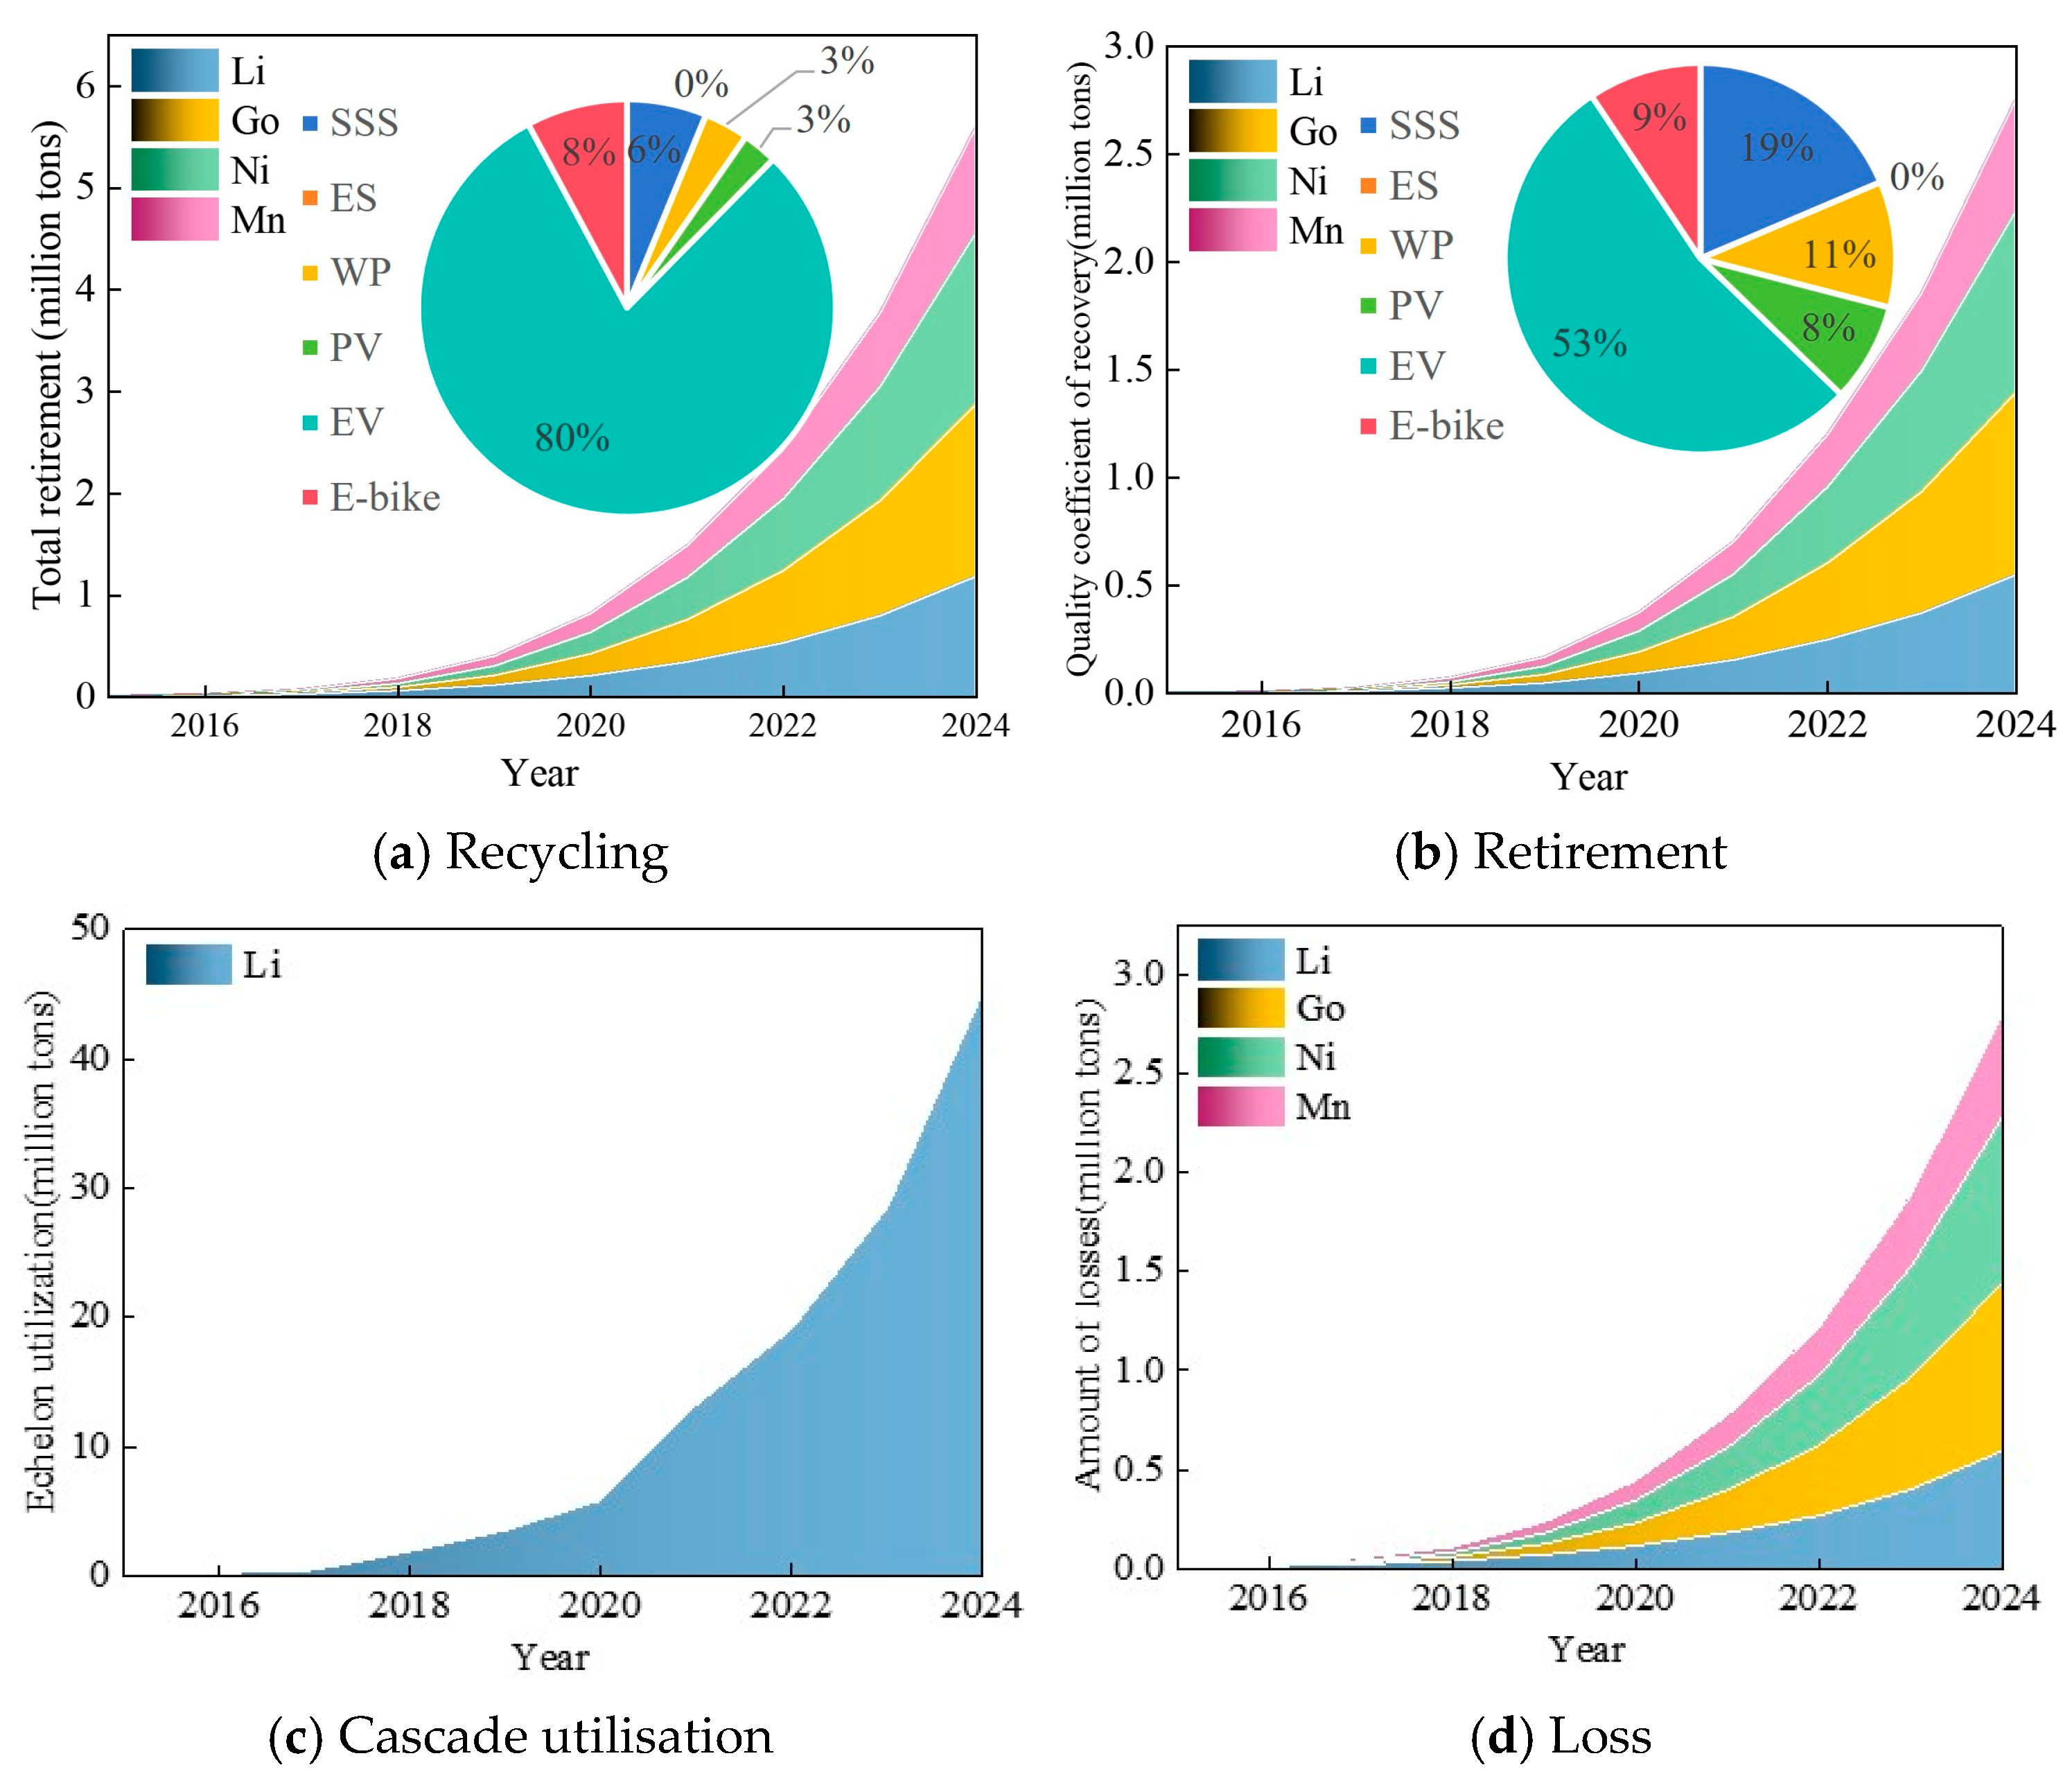
This study estimated the volume of end-of-life new energy batteries in China for the period 2010–2024, using the battery lifetime distribution function (Table S6). As new energy batteries introduced to the market between 2010 and 2015 gradually reach the end of their service life, the volume of end-of-life new energy batteries in China has been growing rapidly since 2018. On the recycling side, before 2016, the volume of end-of-life batteries was limited; coupled with high recycling costs and insufficient economic returns, large-scale recycling had not yet taken hold. Since 2016, however, the volume of retired batteries has continued to rise, whilst prices for key minerals such as Li and Co have surged significantly, driving the rapid expansion of the recycling industry, with many companies establishing battery recycling operations. This paper quantifies the quantities of four key minerals that have been decommissioned, recovered, and reused in cascade. About decommissioned quantities, the quantities of these four minerals have increased rapidly since 2018. The retired Li volume increased from 0.64 kt in 2018 to 11.89 kt in 2024; the retired Co volume rose from 0.36 kt to 16.97 kt; the retired Ni volume rose from 0.36 kt to 16.87 kt; and the retired Mn volume rose from 0.47 kt to 10.35 kt. In terms of the source structure of retired materials, 80% of the Li recovered comes from new EV batteries, 8% from E-bikes, and 9% from the ESI. As NCM batteries are rarely used in the ESI, the Co, Ni, and Mn recovered mainly originate from the power battery industry.
About recycling and cascade utilisation (Figure 4b,c), the amount of Li recovered increased from 0.2 kt in 2018 to 5.4 kt in 2024; over the same period, the volume of secondary use rose from 18.9 t to 0.4 kt, with all cascade utilisation originating from LFP batteries. By 2024, the total volume of recycled materials had reached approximately half of that of retired materials, with 53% originating from new energy vehicles and 19% from the ESI. Taking the demand for 2024 as a benchmark, the key minerals contributed by recycling could substitute 10.6%, 5%, 11.4%, and 10.7% of the primary demand for Li, Co, Ni, and Mn, respectively.
Figure 4.
Changes in the allocation of retirement volumes for different critical minerals from 2010 to 2024.
Historical accounting data for the period 2010–2024 indicate that demand for key minerals used in China’s new energy batteries has undergone a rapid expansion, progressing from its infancy to a period of explosive growth. By 2024, demand for Li, Co, Ni, and Mn had reached 117 kt, 79 kt, 78 kt, and 45 kt respectively, with new energy vehicles being the dominant driver; Li accounted for as much as 84% of total consumption. In the metal sector, fluctuations in the market share of different battery technologies have a significant impact on the structure of element demand—the expansion of NCM batteries’ market share between 2016 and 2020 directly drove growth in demand for Co, Ni, and Mn, whilst the resurgence of LFP batteries led to a relative increase in the share of Li demand. Regarding the recycling sector, the volume of retired batteries has increased rapidly since 2018; however, the current rate at which recycling substitutes primary minerals remains limited (approximately 5–11% in 2024). As the wave of retired batteries begins to emerge in the future, this substitution potential will gradually be realised. The historical baseline described above provides a basis for calibration and initial parameters for subsequent predictive models. Specifically, the 2024 in-use stocks and historical retirement patterns derived here serve as the starting point and calibration targets for the stock-driven model applied in Section 4.
4. Forecast of Critical Mineral Demand
4.1. Forecast of Demand for New Energy Batteries
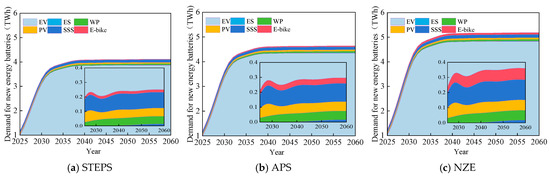
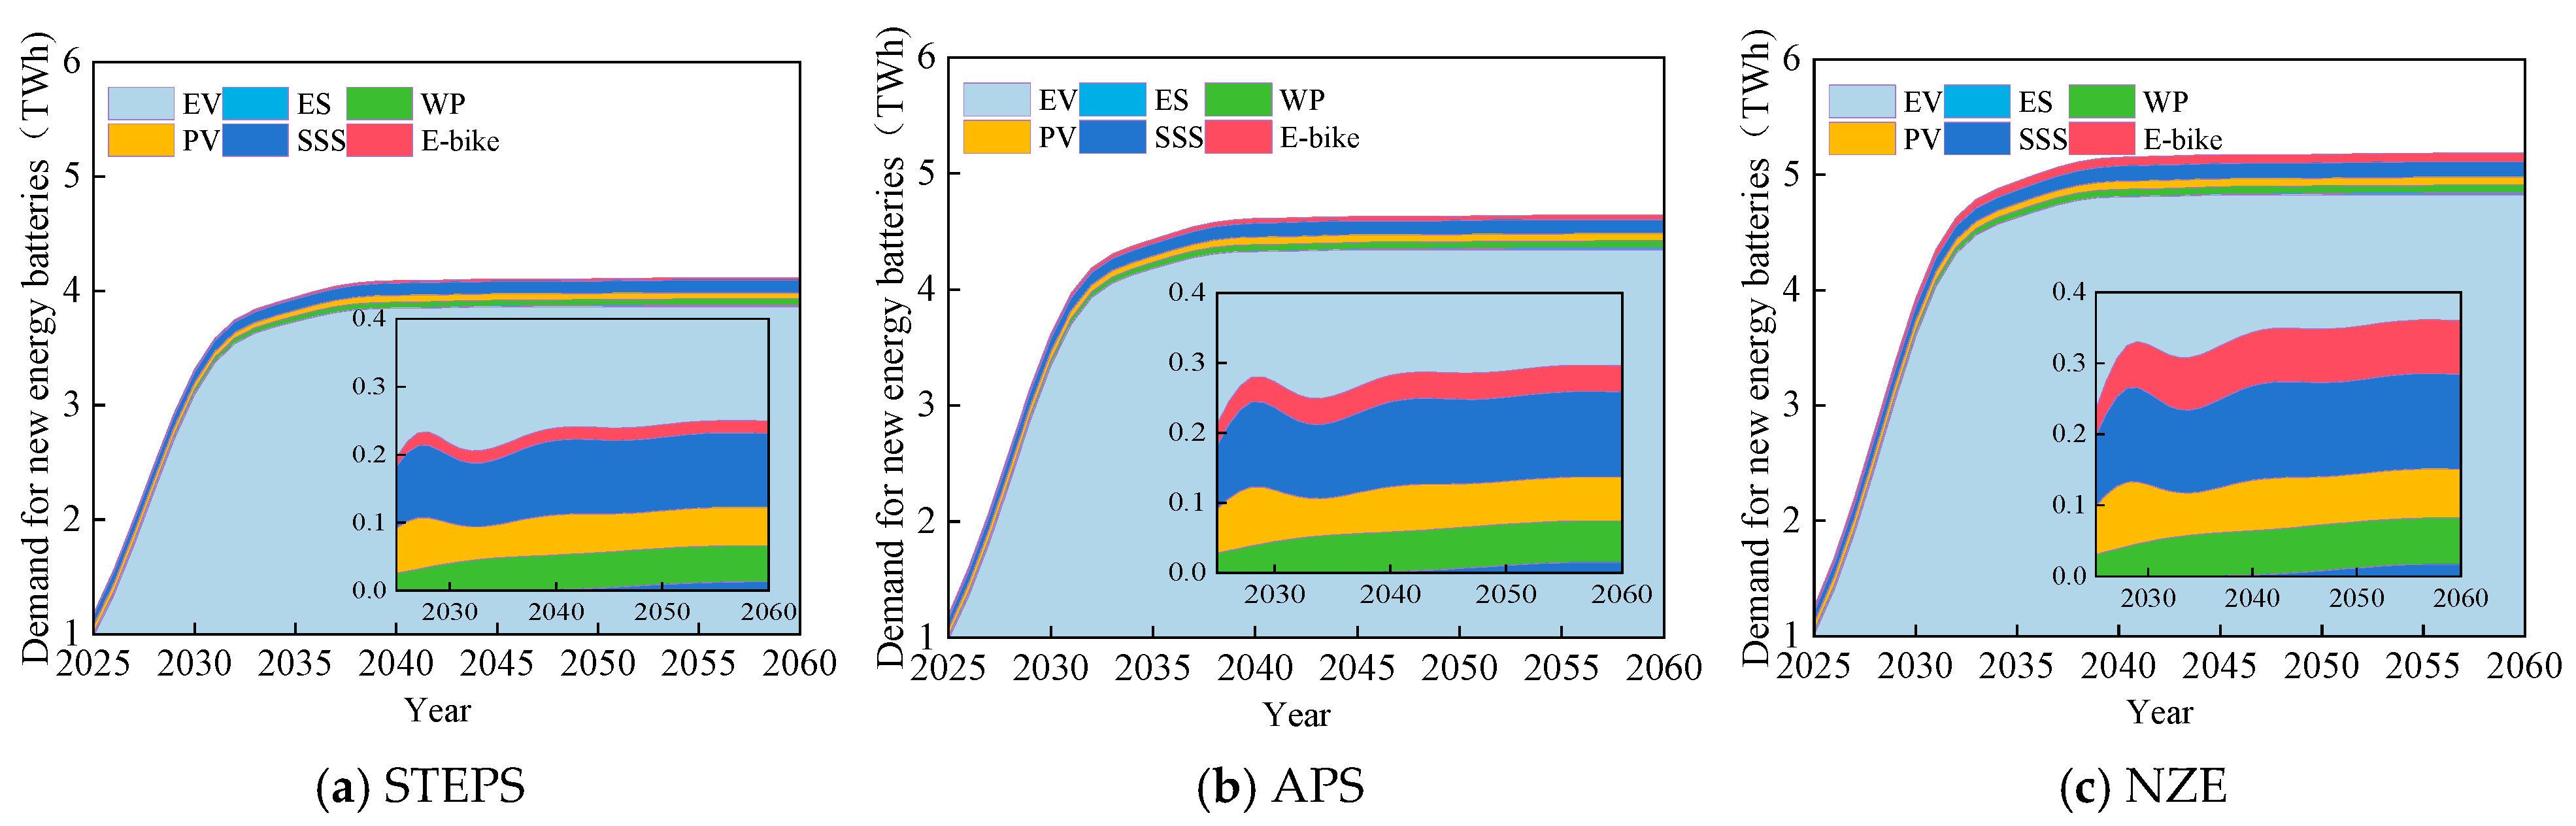
Figure 5 illustrates the projected demand for new energy batteries across various scenarios under different policy frameworks. In terms of growth trends, except for E-bikes, which have already reached saturation, demand growth across other sectors follows an S-curve pattern, characterised by rapid expansion followed by stabilisation. For most industries, the period of rapid growth will occur between 2025 and 2040, after which demand levels will gradually stabilise. Three different energy policy scenarios exert a relatively minor influence on the growth tendency of new energy batteries, while having a pronounced effect on the ultimate demand for such batteries. In 2024, the aggregate demand for new energy batteries across various scenarios totals 1080 GWh. By 2060, demand under the STEPS, APS, and NZE scenarios is projected to reach 4110 GWh, 4638 GWh, and 5182 GWh, respectively, representing growth factors of 3.8, 4.2, and 4.8 times. Regardless of the policy scenario, demand for new energy vehicles significantly outstrips that of other sectors. Taking the new energy policy scenario as an example, battery demand for new energy vehicles in 2024 will reach 980 GWh, accounting for 90.7% of total demand. By 2060, with total demand rising to 4825 GWh, this proportion will increase to 93%. The market for ES remains relatively small and is in its nascent stages, thus accounting for the smallest share of demand among other industries. Within the ESI, the rapid expansion of WP and PV industries in recent years has driven a significant surge in demand for supporting ESI batteries. By 2060, total battery demand in the ESI is projected to reach 267 GWh, a 135% increase from 197 GWh in 2024. This growth rate is markedly slower than that of the new energy vehicle sector. In summary, EVs remain the primary driver of future growth in demand for new energy batteries.
Figure 5.
Demand for new energy batteries from 2025 to 2060 under different policy scenarios .
4.2. Critical Mineral Demand Forecast
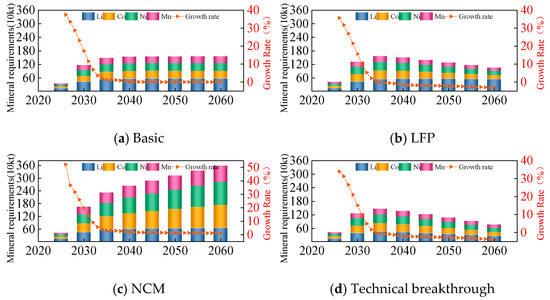
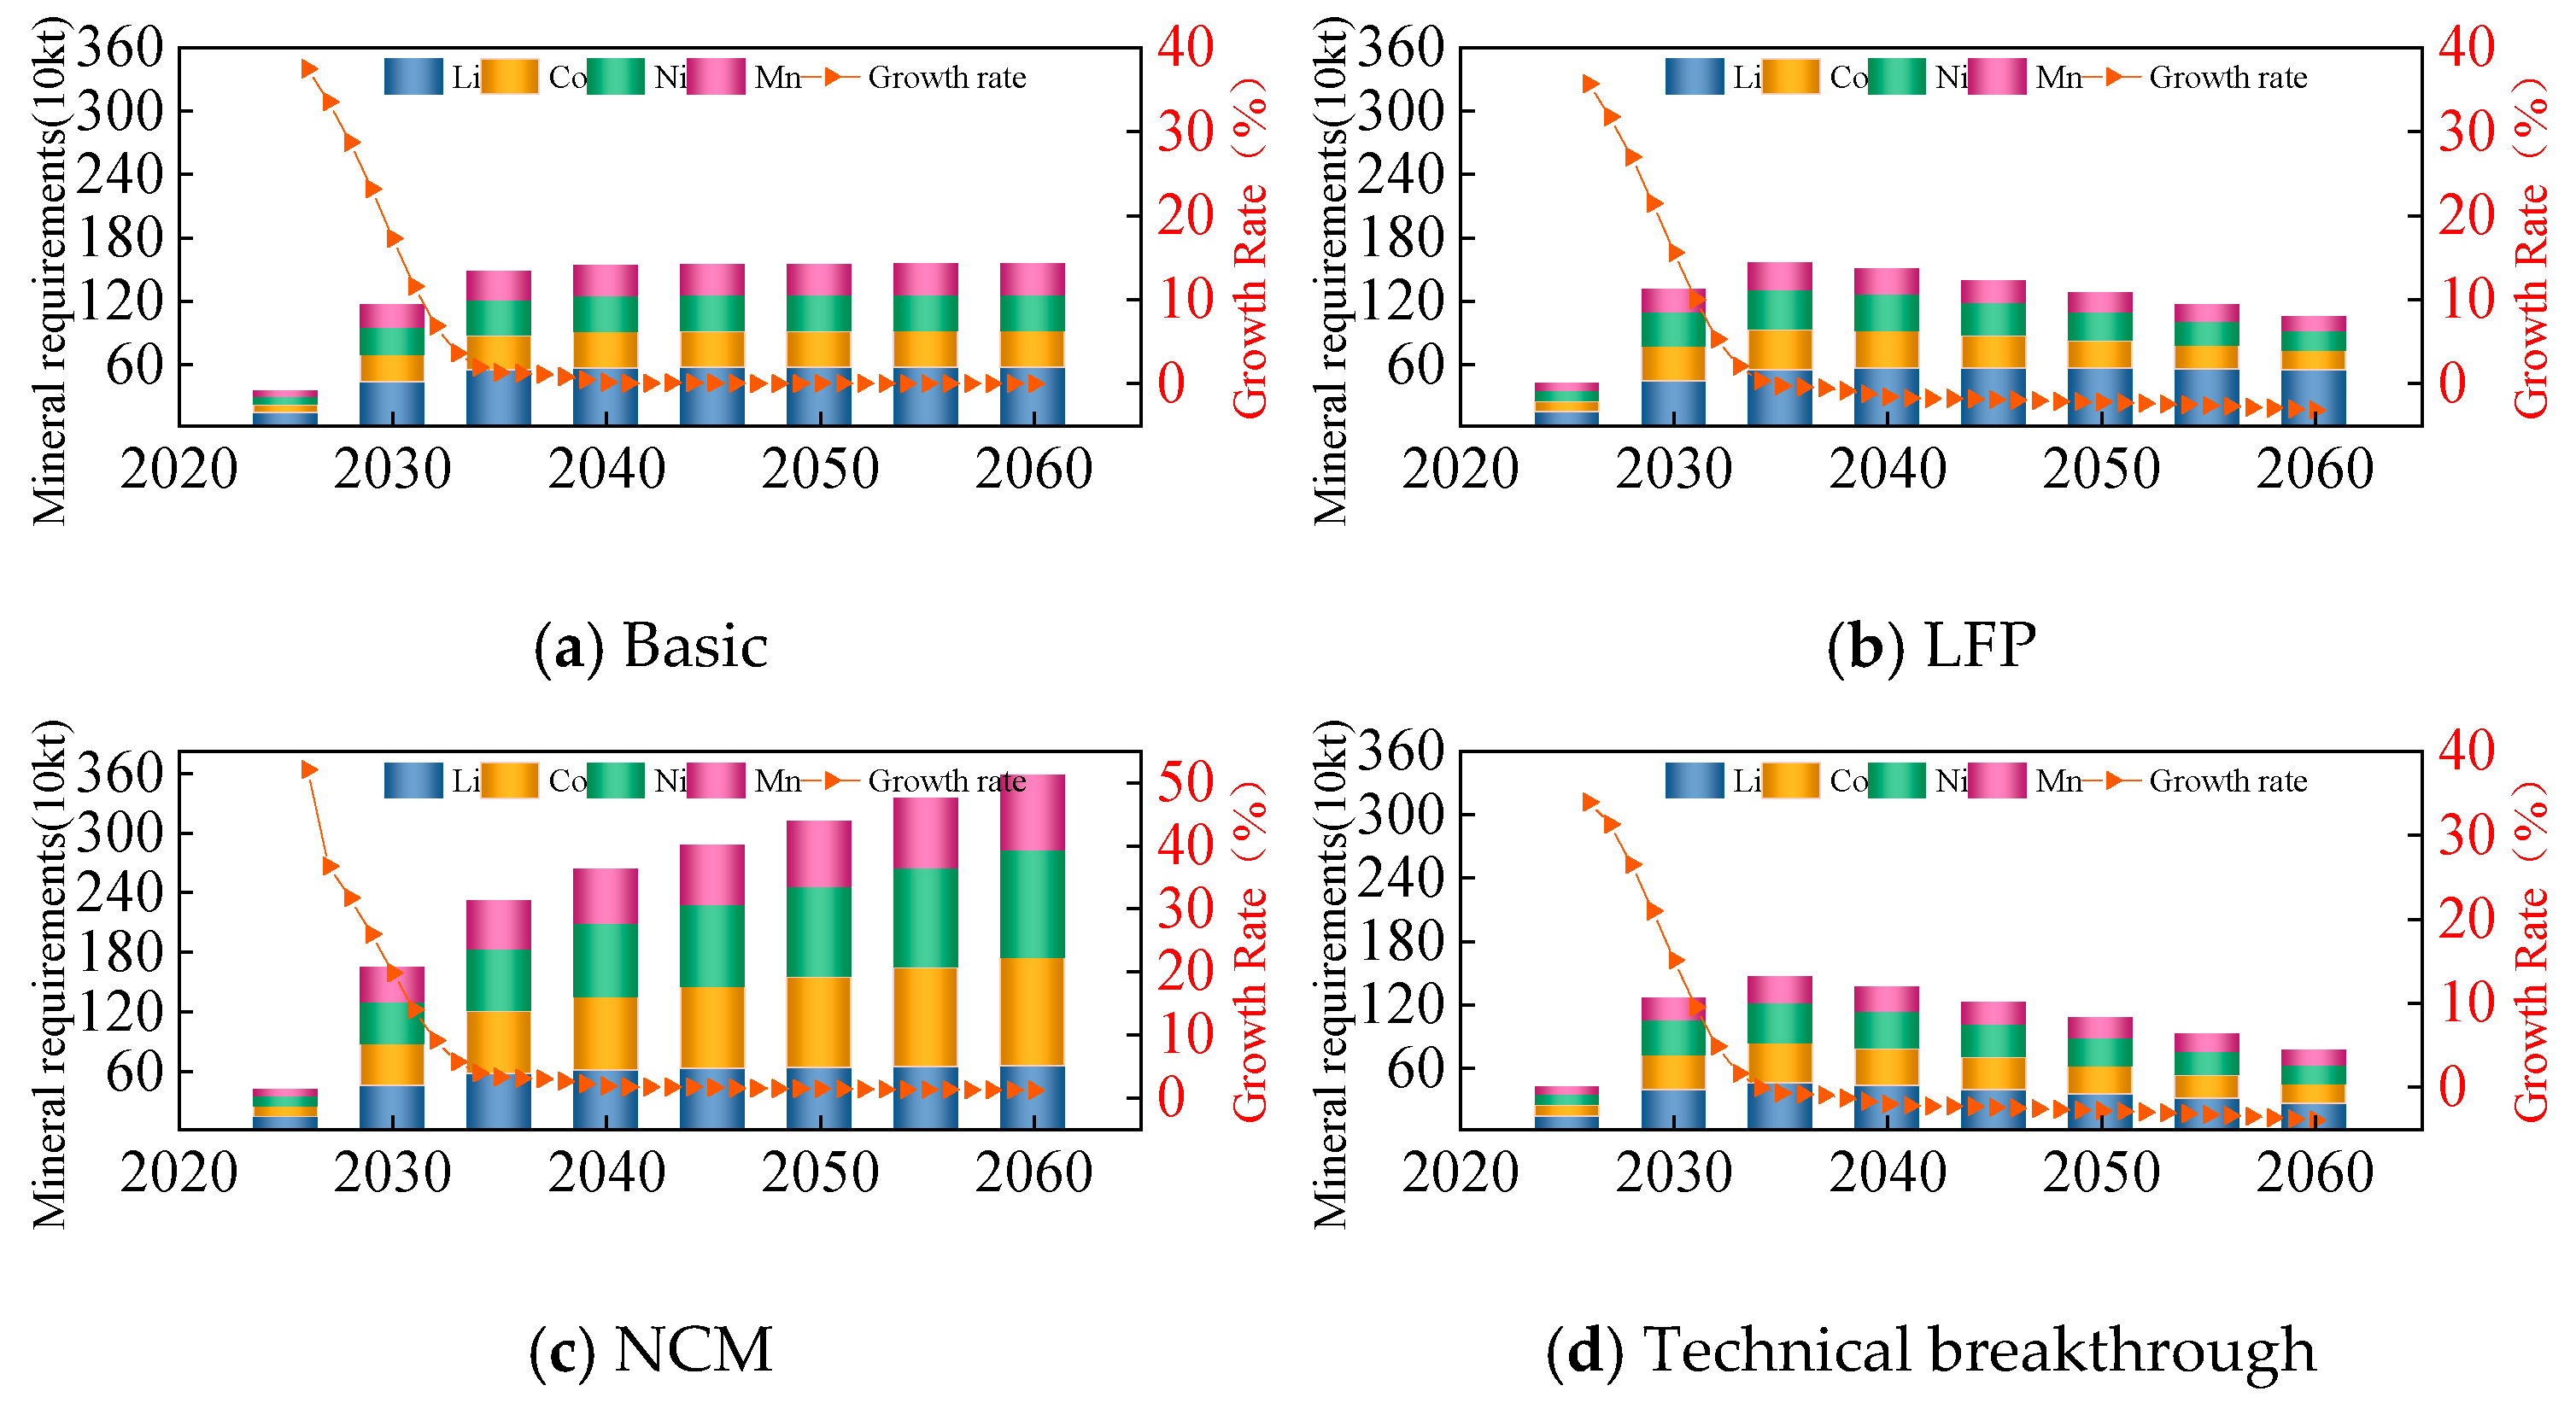
The results are shown in Figure 6. By 2060, Li demand is projected to rise to 445 kt, 502 kt, and 561 kt, respectively, under three energy policy scenarios. These figures represent 3.5, 3.9, and 4.4 times the demand levels recorded in 2025. Under the NZE scenario, demand for Co, Ni, and Mn is projected to reach 346 kt, 342 kt, and 295 kt, respectively, by 2060. These figures represent a 4.6-fold increase over 2025 demand levels. In terms of growth rates, demand is forecast to exceed 30% by 2025, indicating a period of rapid expansion for the new energy battery sector. As the industry approaches saturation, growth rates will gradually decline. From 2040 onwards, with most market sectors nearing saturation and only partial replacement demand arising from retired batteries, growth rates will progressively approach zero.
Figure 6.
Demand for critical mineral elements in new energy batteries (2025–2060 under the NZE policy scenario).
In the LFP-dominant scenario, assuming LFP batteries share increases from the current 70% to 90% and gradually regains the new energy battery market, Li demand growth is projected to decelerate after 2035. Subsequently, demand and market share gradually increased. By 2060, Li demand under the three distinct energy policy scenarios would reach 428 kt, 483 kt, and 540 kt, respectively. Under a high market-demand scenario, the gradual decline in NCM battery market share will cause demand for the other three elements to peak around 2035, reaching maximum requirements of 380 kt, 370 kt, and 253 kt, respectively. Subsequently, driven by the declining market share of NCM batteries, battery demand decreased year on year, reaching 181 kt, 180 kt, and 142 kt, respectively, by 2060.
In the NCM-dominant scenario, it is assumed that the proportion of NCM batteries will increase from the current 35% to 70%. The widespread adoption of NCM batteries has led to a steady increase in demand for Ni, Co, and Mn. Under a high-demand scenario, by 2060, the demand for the three elements will reach 1090 kt, 1080 kt, and 757 kt, respectively, representing 10.4, 10.6, and 11.3 times the 2025 demand levels. Demand for Li is growing gradually as the market share of LFP batteries declines, reaching 651 kt by 2060. Under the NCM-dominant scenario, particular attention must be paid to the supply of Ni, Co, and Mn.
In a scenario of technological advancement, it is assumed that future advancement in lithium–sodium battery technology and cost efficiency will rapidly capture market share. This has led to both LFP batteries and NCM batteries seeing their market share decline to around 10%. Sodium possesses abundant reserves and does not utilise elements such as Li, Co, Ni, or Mn. Consequently, demand for these four elements will decline rapidly after reaching peak levels in 2035. Under the highest-demand scenario, peak demand levels reached 446 kt, 380 kt, 378 kt, and 253 kt, respectively, declining to 258 kt, 181 kt, 180 kt, and 143 kt by 2060. In this scenario, the supply of critical minerals would cease to be a prominent issue. See attached Figures S4 and S5 for the result diagrams of the STEPS scenario and APS scenario.
The overall analysis indicates that, except for scenarios involving breakthroughs in new technologies, the demand trend for Li resources remains relatively stable across other scenarios. During the study period, demand is projected to grow steadily, with final consumption ranging between 561 kt and 651 kt, representing four to five times the current demand level. To achieve China’s energy transition goals, securing an adequate supply of Li resources has become an urgent priority. Battery technology scenarios significantly influence Co, Ni, and Mn. Should NCM batteries come to dominate the market in the future, the supply of Co, Ni, and Mn must be accorded equal consideration. The projected retirement flows generated in this section will serve as the primary input for the recycling and cascade utilisation assessment in Section 5.
5. Critical Mineral Recycling Forecast
Projected retirement flows are evaluated under low, standard, and high circularity scenarios. Under three distinct scenarios, the recovery rates achieved were 65%, 85%, and 100%, with the cascade utilisation rates for LFP reaching 40%, 60%, and 80%, respectively. Therefore, this paper analyses projected demand, recycling volumes, and substitution rates for different future years. To reflect China’s maximum demand for critical minerals, this section focuses solely on high-energy policies. LFP batteries possess characteristics rendering them suitable for a utilisation model involving cascade utilisation followed by recycling. NCM batteries are directly recycled to recover precious metals. LMO batteries contain minimal precious metals, entail high recycling costs, and afford poor recycling margins. Consequently, this paper assumes that LMO batteries are not recycled.
5.1. Recycling Forecast Results
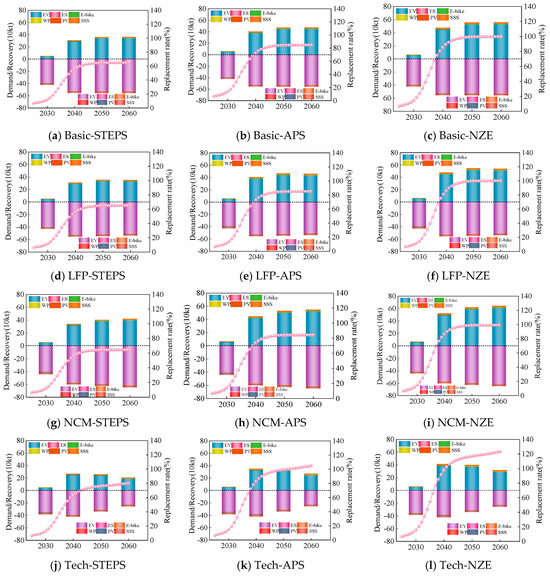
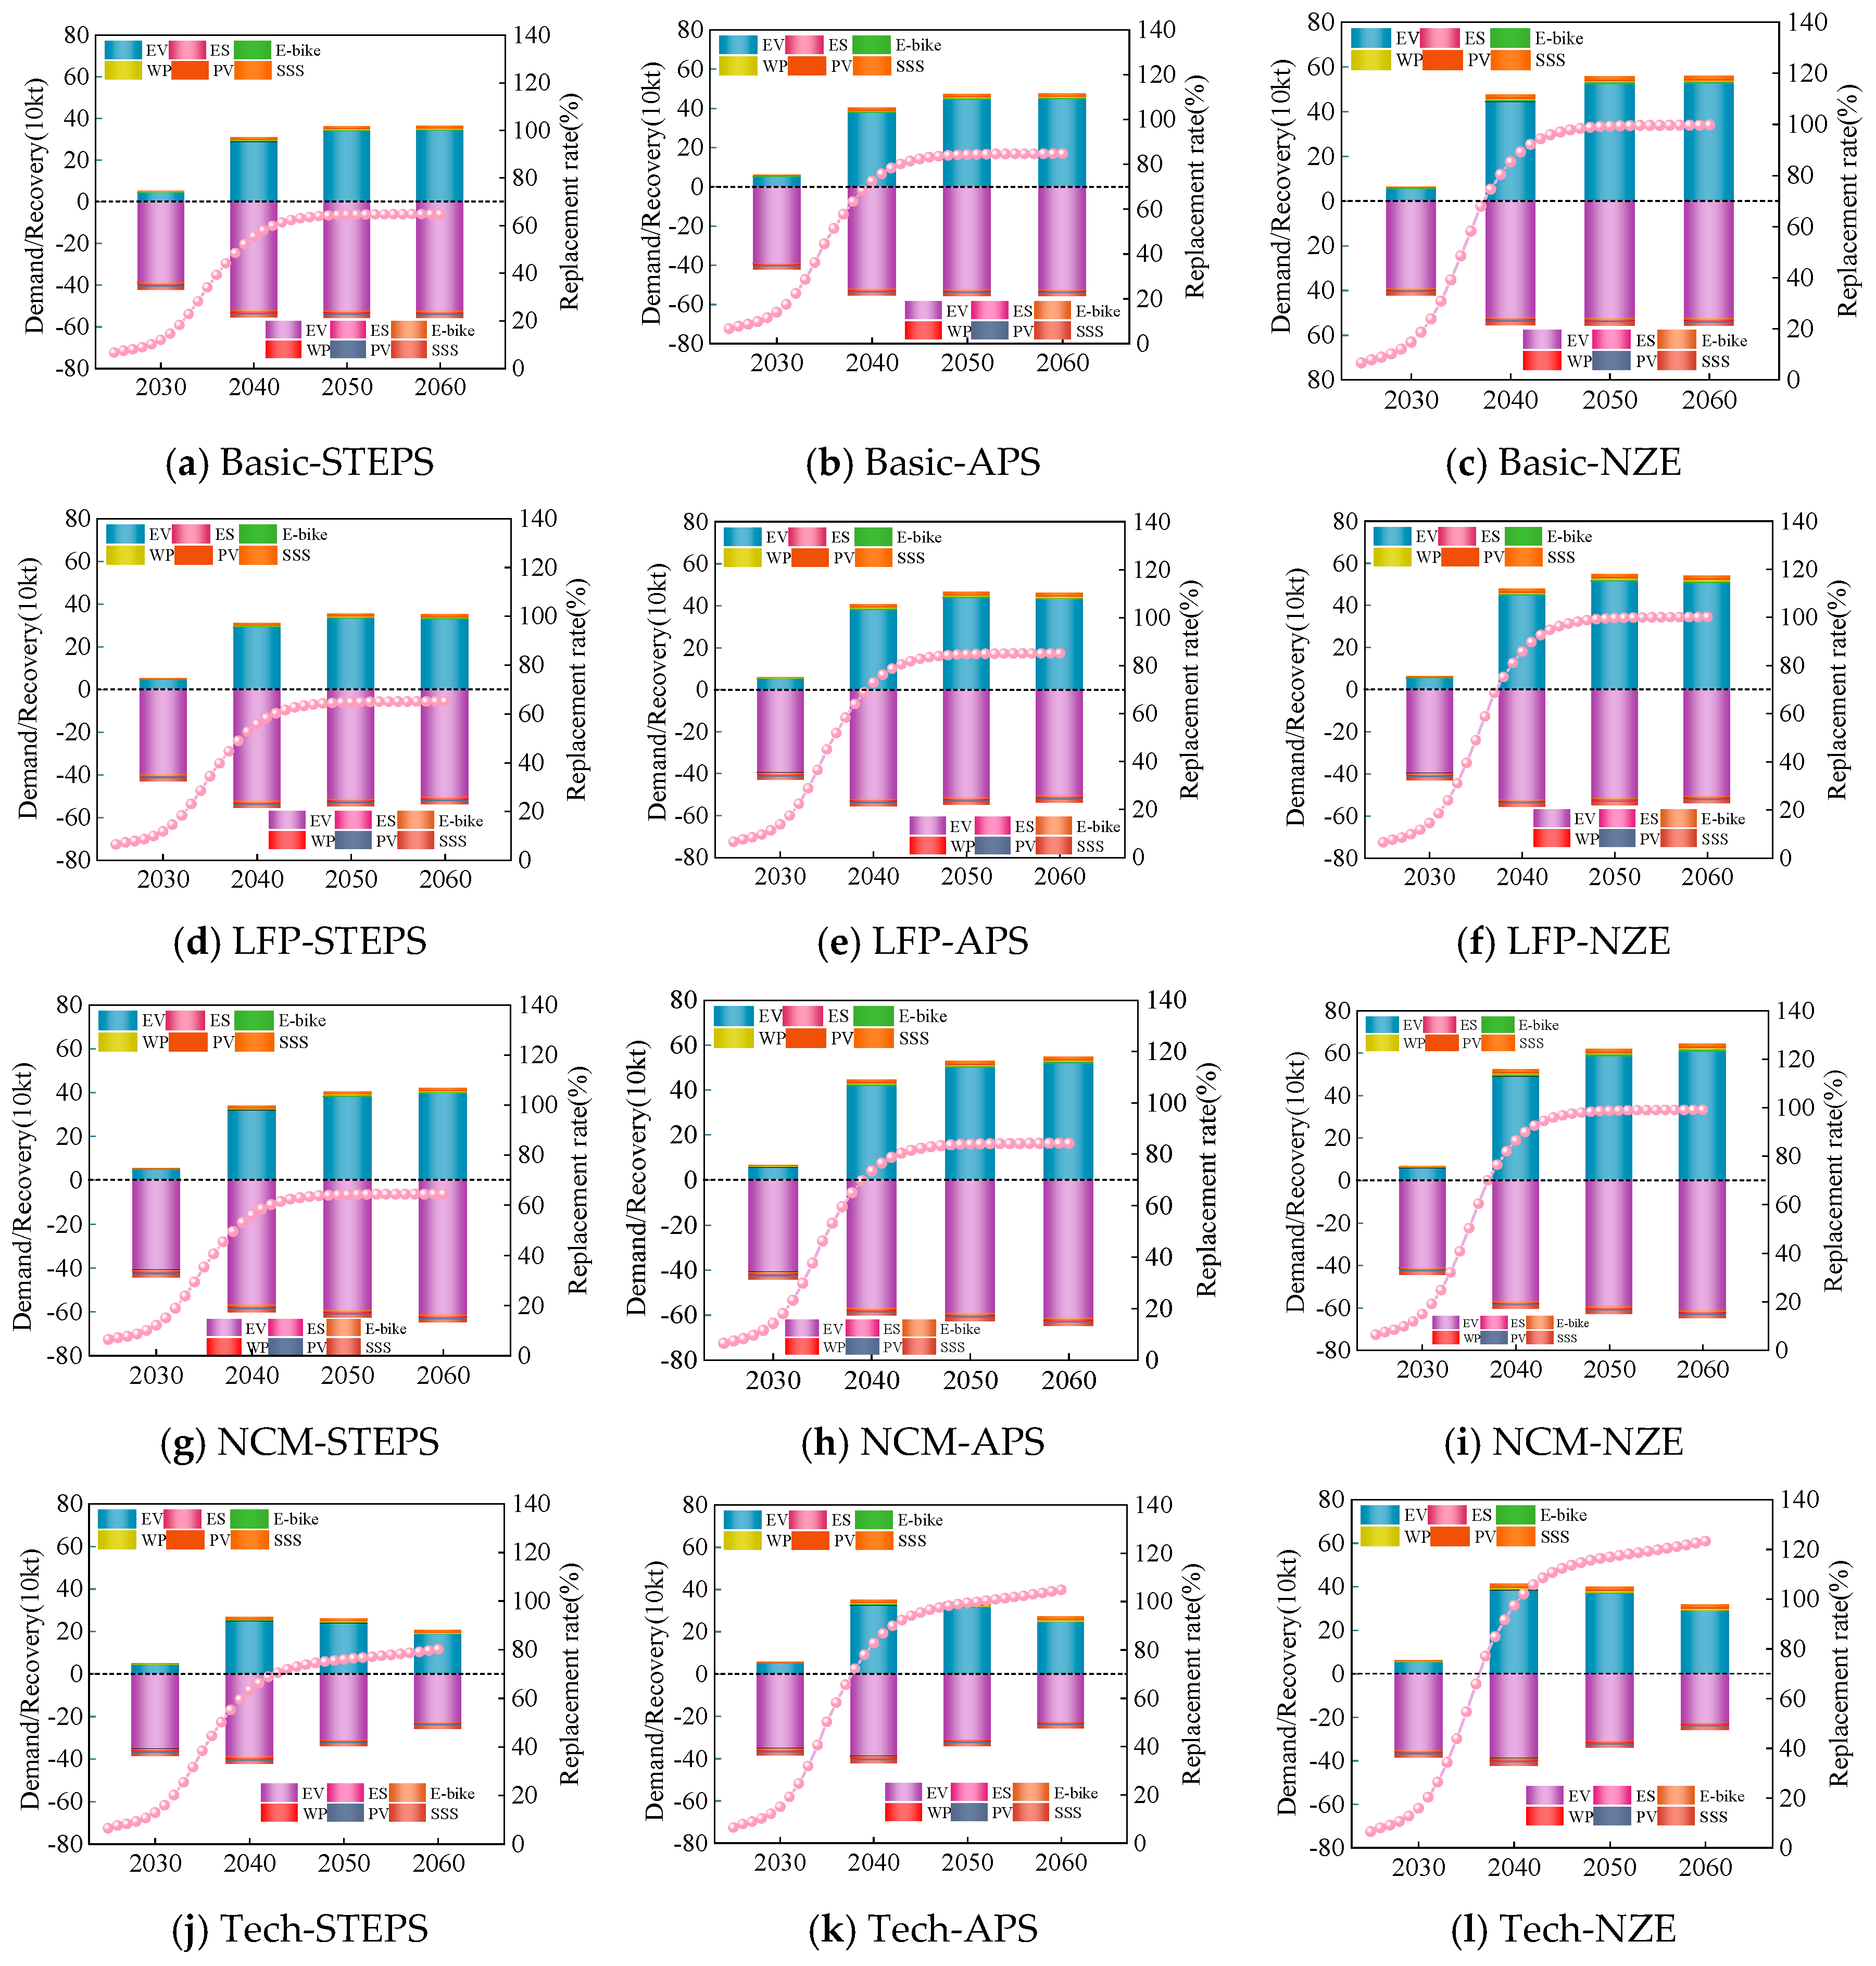
Figure 7 illustrates the demand, recovery, and substitution rate of Li (negative values indicate demand). Under the baseline policy scenario, by 2040, under low, standard and extreme recycling scenarios, recycling volumes will increase to 309 kt, 404 kt, and 476 kt respectively. The recovery rates reached 55.4%, 68.3%, and 85.3%, respectively, after which the growth in recycling volume gradually slowed. Around the year 2048, the recycling substitution rate reached its maximum value. By 2060, recycling volumes under different recovery rates will reach 364 kt, 476 kt, and 560 kt, respectively. Under both the LFP-dominated and NCM-dominated scenarios, the pattern of growth in recycling volumes mirrors that of the baseline scenario. Under the high-recycling-rate scenario, Li element recovery volumes by 2060 would reach 542 kt and 645 kt, respectively. Owing to the higher Li content in NCM batteries compared to LFP batteries, both Li demand and recovery volumes are higher under the NCM-dominated scenario than under the LFP-dominated scenario. Under the new technology breakthrough scenario, Li recovery volumes increase rapidly between 2025 and 2040. Subsequently, demand gradually declines as the market shares of both LFP batteries and NCM batteries decline. With the phasing out of historical inventories, the high-recovery scenario sees the Li demand substitution rate exceed 100% (129%). This will significantly reduce reliance on Li imports.
Figure 7.
Forecast for Li element demand/recovery volume and substitution rate (The pink dots represent the replacement rates) (Figures (a–c): Basic scenario; Figures (d–f): LFP scenario; Figures (g–i): LFP scenario; Figures (j–l): LFP scenario. In each figure, the upper part shows the projected recycling volume, and the lower part shows the projected demand volume).
The forecast charts of Co, Ni, and Mn for the recycling volumes/demand and substitution rates of the remaining three elements can be found in Figures S6–S8. Under four distinct battery scenarios, the maximum Co recovery volumes projected for 2060 are 345 kt, 235 kt, 981 kt, and 234 kt, respectively. The recycling substitution rate will increase rapidly before 2040, followed by a gradual decline thereafter. By 2060, the substitution rates will be 99.8%, 129.6%, 89.9%, and 129.6%, respectively. The variation in Ni content will be similar to that of Co. Under the NCM battery-dominated scenario, demand for these three elements also peaks at 1091 kt, 1084 kt, and 757 kt, respectively. Calculated using the minimum recovery rate, annual shortages of 452 kt, 450 kt, and 305 kt will persist by 2060. Therefore, under the prevailing NCM battery scenario, the supply risks associated with Co, Ni, and Mn must be given due consideration.
5.2. Results of the Cascading Utilisation Forecast
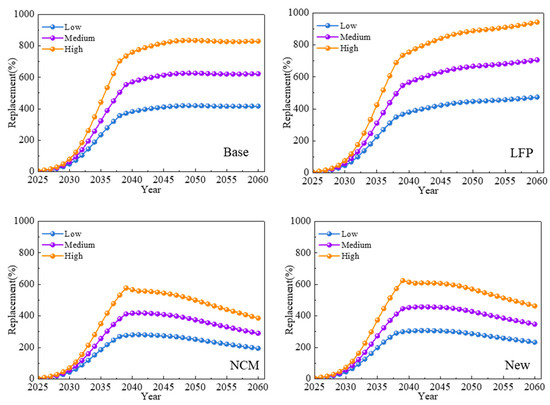
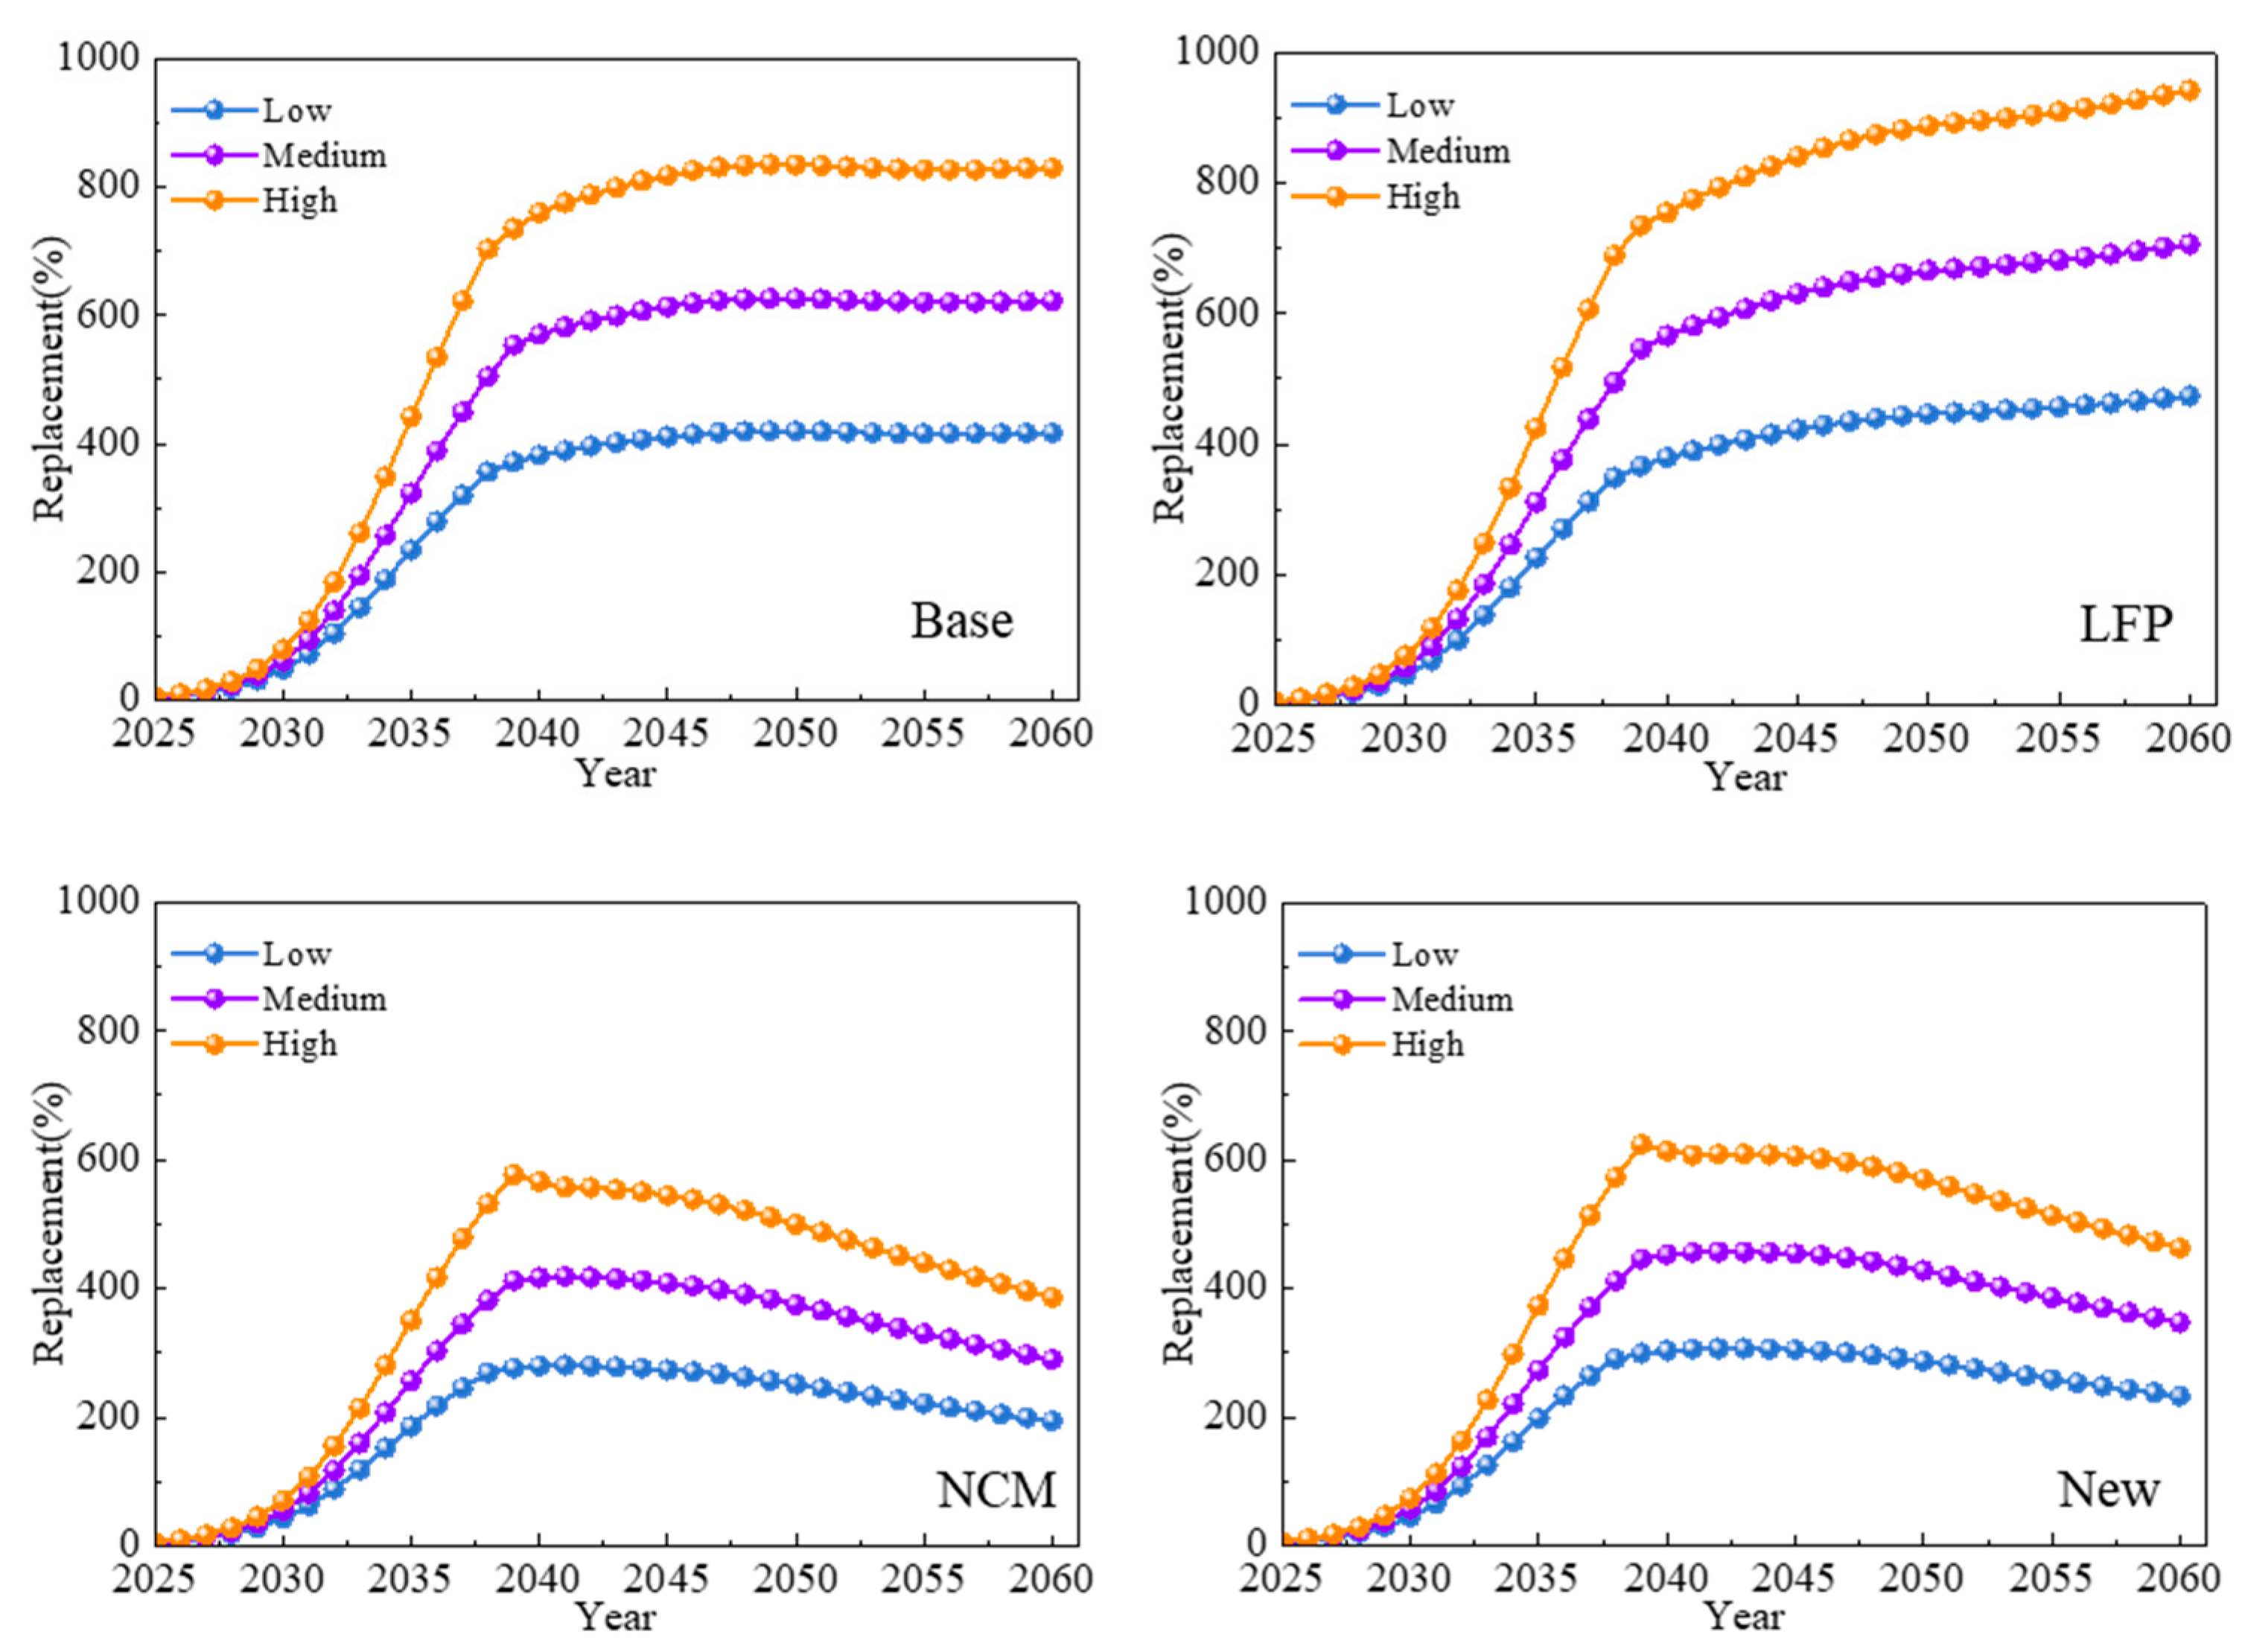
Figure 8 presents the predicted substitution rates for cascading utilisation across different battery scenarios. The cascade utilisation ratios in this paper are based on data from the Research Report on the Full-Chain Solution for Recycling and Processing Retired EV Power Batteries in Hainan Province, China. This paper assumes that by 2035, the proportion of cascading utilisation will reach 40%, 60%, and 80% under low, standard and extreme scenarios, respectively. Thereafter, the proportion of retired batteries utilised in secondary applications will remain unchanged until 2060. Under the baseline scenario, by around 2030, the volume of Li utilised through cascading applications will reach 22 kt, thereby meeting the Li demand of both the ESI and the E-bike. As the new energy vehicle market continues to expand, the replacement rate for cascade utilisation scenarios under low, standard and extreme tiers could reach 400%, 600%, and 800%, respectively, by 2060. Under the dominant scenario of NCM batteries and the scenario of new technological breakthroughs, the number of cascade utilisation NCM batteries will decline rapidly after 2040; however, it will still be sufficient to meet the demand for energy storage and E-bikes. Calculations indicate that, under these three battery scenarios, if the rate of cascade utilisation exceeds 23%, it would theoretically be sufficient to meet the battery demand for all future cascade utilisation scenarios. Therefore, while cascading utilisation technology can maximise the value of battery usage, the expansion of the cascade utilisation industry should be comprehensively evaluated based on downstream market demand to avoid creating an oversupply in the cascade utilisation market.
Figure 8.
Prediction of substitution rates for battery cascade utilisation across different scenarios.
6. Discussion and Policy Suggestions
6.1. Findings
The key findings of this section can be summarised in three aspects (Table 3): the structure of demand is determined by the battery technology pathway; the recycling substitution rate undergoes phased changes; and there is an upper limit to the market capacity for cascade utilisation.
Table 3.
Summary of the principal results, the analyses, and literature comparison.
6.2. Uncertainty Analysis
6.2.1. Uncertainty in Model Assumptions
This paper establishes three energy policy scenarios (STEPS, APS, NZE) and four battery technology scenarios (baseline, LFP-dominated, NCM-dominated, and technological breakthrough) to analyse how changes in external scenario assumptions affect the results. If actual policy implementation proves more robust than assumed in the NZE scenario, battery demand will exceed the upper limit of the forecast presented in this paper; conversely, if the penetration rate of new energy falls short of expectations, demand will be closer to the STEPS range. Across the three policy scenarios, the total battery demand in 2060 spans approximately 1000 GWh. In terms of technological pathways, should technological breakthroughs occur before 2035—the year specified in this paper—the inflexion point marking the decline in demand for these minerals will arrive earlier; if, however, no such breakthroughs are achieved, the market landscape will revert to a long-term competitive dynamic between LFP and NCM batteries.
6.2.2. Uncertainty in Key Parameters
Monte Carlo analysis of uncertainties in metal strength coefficients. Based on differences in metal content across batteries (Table S5), we used a triangular distribution as the probability model and ran 3000 independent simulation iterations under the NZE scenario to obtain 95% confidence intervals for demand for the four mineral types (Figure S9). In 2060, the relative widths of the confidence intervals for the various metals were as follows: lithium ±11.9%, cobalt ±11.4%, nickel ±11.4%, and manganese ±6.7%; the model structure remained robust throughout the forecast period. The range of variation in the above parameters is far smaller than the range of demand across the 12 scenario combinations (lithium 258–651 kt), demonstrating that the primary uncertainty stems from external scenario assumptions rather than fluctuations in internal parameters.
6.2.3. Model Validation and Result Robustness
To validate the model’s reliability, we compared our 2040 recovery substitution rates under the general recycling scenario with benchmark studies (Table S11). Our results (68.3–101.8%) are consistent with Schuster et al. [61] and Zhang et al. [34], with minor deviations attributable to differences in parameter assumptions (e.g., recovery participation rates, battery lifetimes, NCM sub-model composition). This confirms the robustness of our model framework. For forecast accuracy, Table S12 reports MAPE and R2 values. R2 values for electric vehicles and energy storage are excellent; electric ships show lower R2 due to limited early-stage data, but their small scale makes their impact on overall conclusions negligible. RMSE-to-mean ratios are reasonable for most scenarios, except for photovoltaic and shared energy storage where recent explosive growth slightly elevates the ratio.
6.3. Policy Suggestions
(1) Optimise the distribution of recycling capacity and improve capacity utilisation rates. Calculations in this paper indicate that retired batteries will require about 5 million metric tonnes per annum of processing capacity by 2040. China’s current capacity stands at 4.23 million metric tonnes per annum, but the actual volume recycled is only 650,000 metric tonnes, resulting in a capacity utilisation rate of less than 20%. The core issue is not a shortage of total capacity, but rather a spatial mismatch: production capacity is concentrated in the central regions, whilst retired batteries are mainly distributed in the eastern coastal areas. In the short term, streamline approval procedures for inter-provincial transport and introduce transport subsidies to ease local supply–demand imbalances; in the long term, promote ‘localised allocation’ by prioritising new production capacity for the core retirement areas in the eastern coastal regions.
(2) Scientific planning of production capacity for the cascade utilisation of batteries is required to prevent overcapacity. The calculations in this paper indicate that a cascade utilisation rate exceeding 23% would be sufficient to meet the battery demand across all downstream applications. It is recommended that the pace of expansion in cascade utilisation capacity be linked to the actual growth rate of demand in downstream applications (15–20% annual growth), rather than to the growth rate of end-of-life batteries. At the same time, establish a quality certification system for cascade batteries with minimum thresholds such as a capacity retention rate of ≥70% and a cycle life of ≥1000 cycles.
(3) Establish an early-warning and stockpiling system to secure the supply of critical minerals. China’s reliance on imports for Li, Co, and Ni stands at 58–71%, 92–98%, and 86%, respectively, and its supply chains are highly concentrated in a small number of countries. It is recommended that a supply security early-warning mechanism be established (with a yellow alert triggered when imports from a single source country exceed 70% and a red alert triggered when they fall below 50%); that the strategic mineral reserve system be improved, with reserves amounting to no less than 3–6 months’ consumption; and that domestic resource exploration and development be accelerated, with the aim of increasing the share of domestic lithium supply to over 40% by 2030.
7. Conclusions
This study integrates dynamic material flow analysis (MFA), stock-driven forecasting, and scenario analysis to systematically quantify demand trajectories and recycling potential for key minerals used in new energy batteries in China from 2010 to 2060. The main conclusions are as follows:
(1) Policy objectives determine the size of the battery installed base, whilst the technological pathway determines the intensity of mineral consumption. If NCM batteries become dominant, supply risks for Co, Ni, and Mn will be at their highest; when LFP or emerging technologies gain market share, demand for these three minerals will decline.
(2) A circular supply chain can significantly reduce demand for virgin minerals, but it requires careful timing and effective management. Under different recycling scenarios, recycled Li can meet 55.4% to 85.3% of market demand; when more than 23% of qualified retired batteries are used for cascade utilisation, the supply from such applications can meet projected downstream demand.
(3) Establish an early-warning and stockpiling system for the security of supply of critical minerals. China is highly dependent on imports for Li, Co, and Ni, with supply chains heavily concentrated in a small number of countries. It is recommended that an early-warning mechanism for supply security be established; the strategic stockpiling system be improved, with stockpiles amounting to no less than 3–6 months’ consumption; and the development of domestic resources be accelerated, with the aim of increasing the share of domestic lithium supply to over 40% by 2030.
Supplementary Materials
The following supporting information can be downloaded at: https://www.mdpi.com/article/10.3390/su18179005/s1, Table S1: Comparison of the scope and coverage between previous studies and this study; Table S2: Forecast of the scale of new energy battery applications; Table S3: Historical statistics on the market share of different battery types (%); Table S4: Changes in battery composition across different battery types; Table S5: The strength of Li, Co, Ni and Mn as battery metal materials in different battery chemistries (kg/kWh); Table S6: Different battery lifetime functions; Table S7: Historical stock data for the main application scenarios of new energy batteries; Table S8: Proportion of cascaded utilisation of new energy batteries; Table S9: Recycling rates for new energy batteries; Table S10: Confidence intervals for various metals; Table S11: Sensitivity analysis; Table S12: Model performance evaluation metrics across different application scenarios; Figure S1: Historical demand and forecast figures for new energy batteries across different scenarios; Figure S2: Dynamic material flow calculation workflow for critical minerals; Figure S3: Evolution of social stocks of critical minerals (2010–2024); Figure S4: Evolution of social stocks of critical minerals (2010–2024 in STEPS); Figure S5: Evolution of social stocks of critical minerals (2010–2024 in STEPS); Figure S6: Forecasts for Co demand, recycling volumes, and replacement rates; Figure S7: Forecasts for Ni demand, recycling volumes, and replacement rates; Figure S8: Forecasts for Mn demand, recycling volumes, and replacement rates; Figure S9: Analysis of uncertainties in demand forecasts for critical minerals. References [62,63,64,65,66,67] are cited in the Supplementary Materials.
Author Contributions
X.T. contributed to conceptualization, supervision and validation. X.T. and X.X. were responsible for methodology, resources, writing—review and editing, visualisation. H.L. performed software development, investigation, data curation, and writing—original draft preparation. X.T. contributed to writing—review, editing, and visualisation. All authors have read and agreed to the published version of the manuscript.
Funding
This research received no external funding.
Institutional Review Board Statement
Not applicable.
Informed Consent Statement
Not applicable.
Data Availability Statement
The original contributions presented in this study are included in the article/Supplementary Materials. Further inquiries can be directed to the corresponding author.
Conflicts of Interest
The authors declare no conflicts of interest.
Abbreviations
The following abbreviations are used in this manuscript:
| STEPS | Stated Energy Policies Scenario |
| APS | Announced Pledges Scenario |
| NZE | Net Zero Emissions |
| LFP | Iron Phosphate battery |
| NCM | Ternary lithium battery |
| LMO | Lithium Manganese Oxide |
| Li | Lithium |
| Co | Cobalt |
| Ni | Nickel |
| Mn | Manganese |
| MFA | Material Flow Analysis |
| PM | Primary minerals |
| ME | Material Extraction |
| RM | Recycled Material |
| TI | Transportation Industry |
| ESI | Energy Storage Industry |
| CU | Cascade Utilisation |
| EV | Electric Vehicle |
| ES | Electric Ship |
| E-Bike | Electric Bicycle |
| WP | Wind Power |
| PV | Photovoltaic |
| SSS | Solid-State Storage |
References
- IPCC. Special Report on Global Warming of 1.5 °C; Cambridge University Press: Cambridge, UK, 2018. [Google Scholar]
- China Automotive Power Battery Industry Innovation Alliance (CAPBIIA). Operation Data of Power and Energy Storage Batteries from January to December 2025; CAPBIIA: Beijing, China, 2026; Available online: http://www.caam.org.cn/index.html (accessed on 26 August 2026).
- Gao Gong Li Dian (GGII). 2025 China Lithium Battery Industry Chain Raw Material Demand Report; Gao Gong Li Dian (GGII): Shenzhen, China, 2026. [Google Scholar] [CrossRef] [Scilit]
- Chen, C.; Zhang, Y.; Sun, C.; Cao, T. International Comparative Study on the Concept and Catalogue of Strategic Minerals. J. Cent. South Univ. (Soc. Sci.) 2024, 30, 87–98. [Google Scholar]
- Wu, Q.; Zhou, N.; Cheng, J.; Bi, Z. Evolution of lithium trade patterns in the entire supply chain for lithium products and the status of China. J. Cent. South Univ. (Soc. Sci.) 2023, 29, 102–112. [Google Scholar]
- Liang, S.; Yang, D. Empirical study on typical facts and decoupling of industrialization and mineral resource consumption of great powers from the perspective of evolution. J. Cent. South Univ. (Soc. Sci.) 2023, 29, 66–81. [Google Scholar]
- Yi, X.; Wang, X.; Cheng, J.; Hu, S. Supply-demand forecast and supply-securing measures of clean energy mineral processing products: Based on a case study on lithium, cobalt and nickel. Resour. Ind. 2025, 27, 63–76. [Google Scholar]
- Mineral Commodity Summaries 2023 | U.S. Geological Survey. Available online: https://www.usgs.gov/publications/mineral-commodity-summaries-2023 (accessed on 16 April 2026).
- Shao, P.; Wang, Y. Evolution of nickel and articles thereof trade pattern and analysis of China’s trade network. China Min. Mag. 2022, 31, 1–9. [Google Scholar]
- Jones, B.; Elliott, R.J.R.; Viet, N.T. The EV revolution: The road ahead for critical raw materials demand. Appl. Energy 2020, 280, 115072. [Google Scholar] [CrossRef] [Scilit] [PubMed]
- DNV. Global Energy Transition Outlook 2025; DNV: Høvik, Norway, 2025; Available online: https://www.dnv.com/energy-transition-outlook/ (accessed on 26 August 2026).
- Wang, H.; Feng, K.; Wang, P.; Yang, Y.; Sun, L.; Yang, F.; Chen, W.-Q.; Zhang, Y.; Li, J. China’s Electric Vehicle and Climate Ambitions Jeopardized by Surging Critical Material Prices. Nat. Commun. 2023, 14, 1246. [Google Scholar] [CrossRef] [Scilit] [PubMed]
- National Development and Reform Commission. National Mineral Resources Plan (2016–2020). Available online: http://www.ndrc.gov.cn/xxgk/202109/t20210930_1298886_ext.html (accessed on 14 November 2025).
- Ruan, W.; Zou, B. Optimal Strategies of Critical Mineral Depletion and Recycling. Resour. Conserv. Recycl. 2024, 209, 107793. [Google Scholar] [CrossRef] [Scilit]
- Dai, L.; Tang, P.; Zhang, L. Analysis of demand for strategic rare metal resources. China Met. Bull. 2025, 7, 115–117. [Google Scholar]
- Liu, J. Research on countermeasures for supply chain security of critical mineral resources. China Min. Mag. 2024, 33, 21–24+35. [Google Scholar]
- Zhou, H.; Yang, Y.; Li, W.; McKechnie, J.; Thiede, S.; Wang, P. EU’s Recycled Content Targets of Lithium-Ion Batteries Are Likely to Compromise Critical Metal Circularity. One Earth 2024, 7, 1288–1300. [Google Scholar] [CrossRef] [Scilit]
- Daigo, I.; Hashimoto, S.; Matsuno, Y.; Adachi, Y. Material Stocks and Flows Accounting for Copper and Copper-Based Alloys in Japan. Resour. Conserv. Recycl. 2009, 53, 208–217. [Google Scholar] [CrossRef] [Scilit]
- Dong, X.S. Research on Forecast of Critical Metal Demand and Sustainable Supply Guarantee in China’s New Energy Vehicle Industry. Ph.D. Thesis, Central South University, Changsha, China, 2023. [Google Scholar]
- Ying, X.; Wang, S.; Yang, Y. Analysis of demand and recycling potential of lithium, cobalt, and nickel under energy transition—From perspective of electric vehicles. Bull. Chin. Acad. Sci. 2024, 39, 1226–1234. [Google Scholar] [CrossRef]
- Zhu, X.; Lane, R.; Werner, T.T. Modelling In-Use Stocks and Spatial Distributions of Household Electronic Devices and Their Contained Metals Based on Household Survey Data. Resour. Conserv. Recycl. 2017, 120, 27–37. [Google Scholar] [CrossRef] [Scilit]
- Guo, J.; Wen, B.; Han, Z.; Dai, T. Analysis of lithium secondary supply potential in China based on dynamic material flow. China Min. Mag. 2025, 34, 9–17. [Google Scholar]
- Chen, W.-Q.; Graedel, T.E.; Nuss, P.; Ohno, H. Building the material flow networks of aluminum in the 2007 US economy. Environ. Sci. Technol. 2016, 50, 3905–3912. [Google Scholar] [CrossRef] [Scilit] [PubMed]
- Ren, S.; Fu, X.; Chen, X. Regional variation of energy-related industrial CO2 emissions mitigation in China. China Econ. Rev. 2012, 23, 1134–1145. [Google Scholar] [CrossRef] [Scilit]
- Langkau, S.; Espinoza, L.A.T. Technological change and metal demand over time: What can we learn from the past? Sustain. Mater. Technol. 2018, 16, 54–59. [Google Scholar] [CrossRef] [Scilit]
- Izatt, R.M.; Izatt, S.R.; Bruening, R.L.; Izatt, N.E.; Moyer, B.A. Challenges to achievement of metal sustainability in our high-tech society. Chem. Soc. Rev. 2014, 43, 2451–2475. [Google Scholar] [CrossRef] [Scilit] [PubMed]
- Cheng, J.; Zhang, Z.; Zhang, Y.; Song, Y. Mitigation effects of battery substitution and circulation on resource shortages in electrochemical energy storage systems. Resour. Sci. 2025, 47, 963–976. [Google Scholar] [CrossRef] [Scilit]
- Xu, C.; Dai, Q.; Gaines, L.; Hu, M.; Tukker, A.; Steubing, B. Future Material Demand for Automotive Lithium-Based Batteries. Commun. Mater. 2020, 1, 99. [Google Scholar] [CrossRef] [Scilit]
- Lai, X. Opinions on the reuse of retired power batteries. Energy Storage Sci. Technol. 2020, 9, 598–602. [Google Scholar]
- Han, L.; He, D.; Liu, A.; Ma, D. Advances in secondary use research of power Li-ion battery. Chin. J. Power Sources 2014, 38, 548–550. [Google Scholar]
- Ma, R.; Tao, S.; Sun, X.; Ren, Y.; Sun, C.; Ji, G.; Xu, J.; Wang, X.; Zhang, X.; Wu, Q.; et al. Pathway Decisions for Reuse and Recycling of Retired Lithium-Ion Batteries Considering Economic and Environmental Functions. Nat. Commun. 2024, 15, 7641. [Google Scholar] [CrossRef] [Scilit] [PubMed]
- Liu, M.; Liu, W.; Liu, W.; Chen, Z.; Cui, Z. To What Extent Can Recycling Batteries Help Alleviate Metal Supply Shortages and Environmental Pressures in China? Sustain. Prod. Consum. 2023, 36, 139–147. [Google Scholar] [CrossRef] [Scilit]
- Jiang, R.; Wu, C.; Feng, W.; You, K.; Liu, J.; Zhou, G.; Liu, L.; Cheng, H.-M. Impact of Electric Vehicle Battery Recycling on Reducing Raw Material Demand and Battery Life-Cycle Carbon Emissions in China. Sci. Rep. 2025, 15, 2267. [Google Scholar] [CrossRef] [Scilit] [PubMed]
- Zhang, B.; Xin, Q.; Chen, S.; Wang, B.; Li, H.; Wang, Z.; Bansal, P. Lithium-Ion Battery Recycling Relieves the Threat to Material Scarcity amid China’s Electric Vehicle Ambitions. Nat. Commun. 2025, 16, 6661. [Google Scholar] [CrossRef] [Scilit] [PubMed]
- Nurdiawati, A.; Agrawal, T.K. Creating a Circular EV Battery Value Chain: End-of-Life Strategies and Future Perspective. Resour. Conserv. Recycl. 2022, 185, 106484. [Google Scholar] [CrossRef] [Scilit]
- Wu, Y.; Yang, L.; Tian, X.; Li, Y.; Zuo, T. Temporal and Spatial Analysis for End-of-Life Power Batteries from Electric Vehicles in China. Resour. Conserv. Recycl. 2020, 155, 104651. [Google Scholar] [CrossRef] [Scilit]
- Qiao, D.; Wang, G.; Gao, T.; Wen, B.; Dai, T. Potential Impact of the End-of-Life Batteries Recycling of Electric Vehicles on Lithium Demand in China: 2010–2050. Sci. Total Environ. 2021, 764, 142835. [Google Scholar] [CrossRef] [Scilit] [PubMed]
- Yang, H. Resource Potential of Traction Batteries for New Energy Vehicles Based on Material Stock Analysis. Master’s Thesis, Shanghai Polytechnic University, Shanghai, China, 2021. [Google Scholar]
- Xu, Q.; Teng, J. Multi-scene cascade utilization optimization of retired power battery. Acta Energ. Sol. Sin. 2023, 44, 541–549. [Google Scholar] [CrossRef]
- Zeng, A.; Chen, W.; Rasmussen, K.D.; Zhu, X.; Lundhaug, M.; Müller, D.B.; Tan, J.; Keiding, J.K.; Liu, L.; Dai, T.; et al. Battery Technology and Recycling Alone Will Not Save the Electric Mobility Transition from Future Cobalt Shortages. Nat. Commun. 2022, 13, 1341. [Google Scholar] [CrossRef] [Scilit] [PubMed]
- Zhang, H.Y. Dynamic Material Flow Analysis and Recovery Potential of Nickel in China. Ph.D. Thesis, China University of Geosciences (Beijing), Beijing, China, 2023. [Google Scholar]
- Dunn, J.; Slattery, M.; Kendall, A.; Ambrose, H.; Shen, S. Circularity of Lithium-Ion Battery Materials in Electric Vehicles. Environ. Sci. Technol. 2021, 55, 5189–5198. [Google Scholar] [CrossRef] [Scilit] [PubMed]
- China Industrial Energy Conservation and Clean Production Association. China New Energy Battery Recycling Industry Development Report; Mechanical Industry Press: Beijing, China, 2024. [Google Scholar]
- Reuters. Tesla Seeks China Nod to Build Model 3 Vehicles with LFP Batteries. Reuters, 2020. Available online: https://www.reuters.com/article/us-tesla-china-batteries-idUSKBN22Z0G8 (accessed on 26 August 2026).
- Colthorpe, A. CATL Batteries Energise Powin’s New ‘Long Duration, Long Life’ Li-Ion Systems. Energy-Storage. News, 2020. Available online: https://www.energy-storage.news/catl-batteries-energise-powins-new-long-duration-long-life-li-ion-systems/ (accessed on 26 August 2026).
- Wang, C.; Sun, F.Q.; Xu, Y. Development Status and Enlightenment of Global Key Clean Energy Technologies in the Context of Carbon Neutrality. Stud. Sci. Sci. 2023, 41, 1604–1614. [Google Scholar]
- Hu, S.R. Independent Shared Energy Storage: Exploring the Future Application Blue Ocean with Challenges and Opportunities Coexisting. China Strateg. Emerg. Ind. 2024, 36, 79–81. [Google Scholar]
- Song, J.; Zhang, M.H. Promotion Strategies for High-Quality Development of New Energy Storage Based on Price Conduction and Incentives in the Context of Carbon Neutrality. Enterp. Manag. 2024, S1, 396–397. [Google Scholar]
- CHN Energy Technology and Economics Research Institute. China Energy Outlook 2025–2060; China Energy Investment Corporation: Beijing, China, 2025; Available online: https://www.ceic.com/gjnyjtwwEn/xwzx/202509/95c2f8bf1cd64e4ca38123b4d4cfcf9e.shtml (accessed on 26 August 2026).
- National Development and Reform Commission; National Energy Administration. Guiding Opinions of the National Development and Reform Commission and the National Energy Administration on Accelerating the Development of New Energy Storage; National Development and Reform Commission: Beijing, China, 2021. Available online: https://www.gov.cn/xinwen/2021-04/22/5601283/files/592d8c75bfa2421a9941db7baf1f6961.pdf (accessed on 26 August 2026).
- National Energy Administration Department of Energy Conservation and Science & Technology Equipment; Power Planning & Engineering Institute. China New Energy Storage Development Report 2025; People’s Daily Press: Beijing, China, 2025. [Google Scholar]
- iResearch. 2025 China Two-Wheeled Electric Vehicle Industry Research Report; iResearch Consulting Group: Beijing, China, 2025; Available online: https://report.iresearch.cn/report/202504/4713.shtml (accessed on 26 August 2026).
- China Waterborne Transport Research Institute. China New Energy and Clean Energy Ship Development Report (2024); China Waterborne Transport Research Institute: Beijing, China, 2026. [Google Scholar]
- Elshkaki, A. Long-Term Analysis of Critical Materials in Future Vehicles Electrification in China and Their National and Global Implications. Energy 2020, 202, 117697. [Google Scholar] [CrossRef] [Scilit]
- Lu, Y. Risk Assessment and Early Warning of Critical Mineral Resources Supply in China’s Photovoltaic Industry. Master’s Thesis, China University of Geosciences, Wuhan, China, 2023. [Google Scholar]
- China Automotive Data Co. Statistics on Market Share of NCM and LFP Batteries (2016–2019); China Automotive Data Co.: Beijing, China, 2023. [Google Scholar]
- China Electric Vehicle Industry Technology Innovation Strategic Alliance. Market Share of Power Batteries for New Energy Vehicles (2010–2019); China Electric Vehicle Industry Technology Innovation Strategic Alliance: Beijing, China, 2026. [Google Scholar]
- China Association of Automobile Manufacturers. Industry Statistical Database. Available online: http://www.caam.org.cn/tjsj (accessed on 26 August 2026).
- Boesch, M.E.; Vadenbo, C.; Saner, D.; Huter, C.; Hellweg, S. An LCA Model for Waste Incineration Enhanced with New Technologies for Metal Recovery and Application to the Case of Switzerland. Waste Manag. 2014, 34, 378–389. [Google Scholar] [CrossRef] [Scilit] [PubMed]
- Liu, W. Dynamic Material Flow Analysis of Metals in China’s Lithium-Ion Battery System. Master’s Thesis, Shandong University, Jinan, China, 2021. [Google Scholar]
- Schuster, V.; Ciacci, L.; Passarini, F. Mining the in-use stock of energy-transition materials for closed-loop e-mobility. Resour. Policy 2023, 86, 104155. [Google Scholar] [CrossRef] [Scilit]
- Barlock, T.A.; Mansour, C.; Riddle, M.; Crisostomo, N.; Keyles, G.; Gohlke, D.; Zhou, Y.; Polzin, B.; Weigl, D. Securing Critical Materials for the U.S. Electric Vehicle Industry; ANL-24/06; Argonne National Laboratory: Argonne, IL, USA, 2024. [Google Scholar]
- Li, E.; Bieker, G.; Sen, A. Electrifying Road Transport with Less Mining: A Global and Regional Battery Material Outlook; ICCT: Washington, DC, USA, 2024. [Google Scholar]
- O’Donnell, E.; McGrath, E. Green Metals: Demand Arising from Decarbonisation of Energy and Transport Sectors; Geological Survey Ireland: Dublin, Ireland, 2023. [Google Scholar]
- Simas, M.S.; Silva, T.L.; Aponte, F.R.; Haaskjold, K.; Myhre, S.F. Costs and Material Requirements for the Norwegian Battery Demand. In SINTEF Report; SINTEF Academic Press: Oslo, Norway, 2025; p. 00801. [Google Scholar]
- Kresse, C.; Bookhagen, B.; Andrade, L.B.; Frenzel, M. Global Supply of Secondary Lithium from Lithium-Ion Battery Recycling. Recycling 2024, 10, 122. [Google Scholar] [CrossRef] [Scilit]
- Liu, W.; Liu, W.; Li, X.; Liu, Y.; Ogunmoroti, A.; Li, M.; Bi, M.; Cui, Z. Dynamic Material Flow Analysis of Critical Metals for Lithium-Ion Battery System in China from 2000–2018. Resour. Conserv. Recycl. 2021, 164, 105122. [Google Scholar] [CrossRef] [Scilit]

Disclaimer/Publisher’s Note: The statements, opinions and data contained in all publications are solely those of the individual author(s) and contributor(s) and not of MDPI and/or the editor(s). MDPI and/or the editor(s) disclaim responsibility for any injury to people or property resulting from any ideas, methods, instructions or products referred to in the content. |
© 2026 by the authors. Licensee MDPI, Basel, Switzerland. This article is an open access article distributed under the terms and conditions of the Creative Commons Attribution (CC BY) license.