1. Introduction
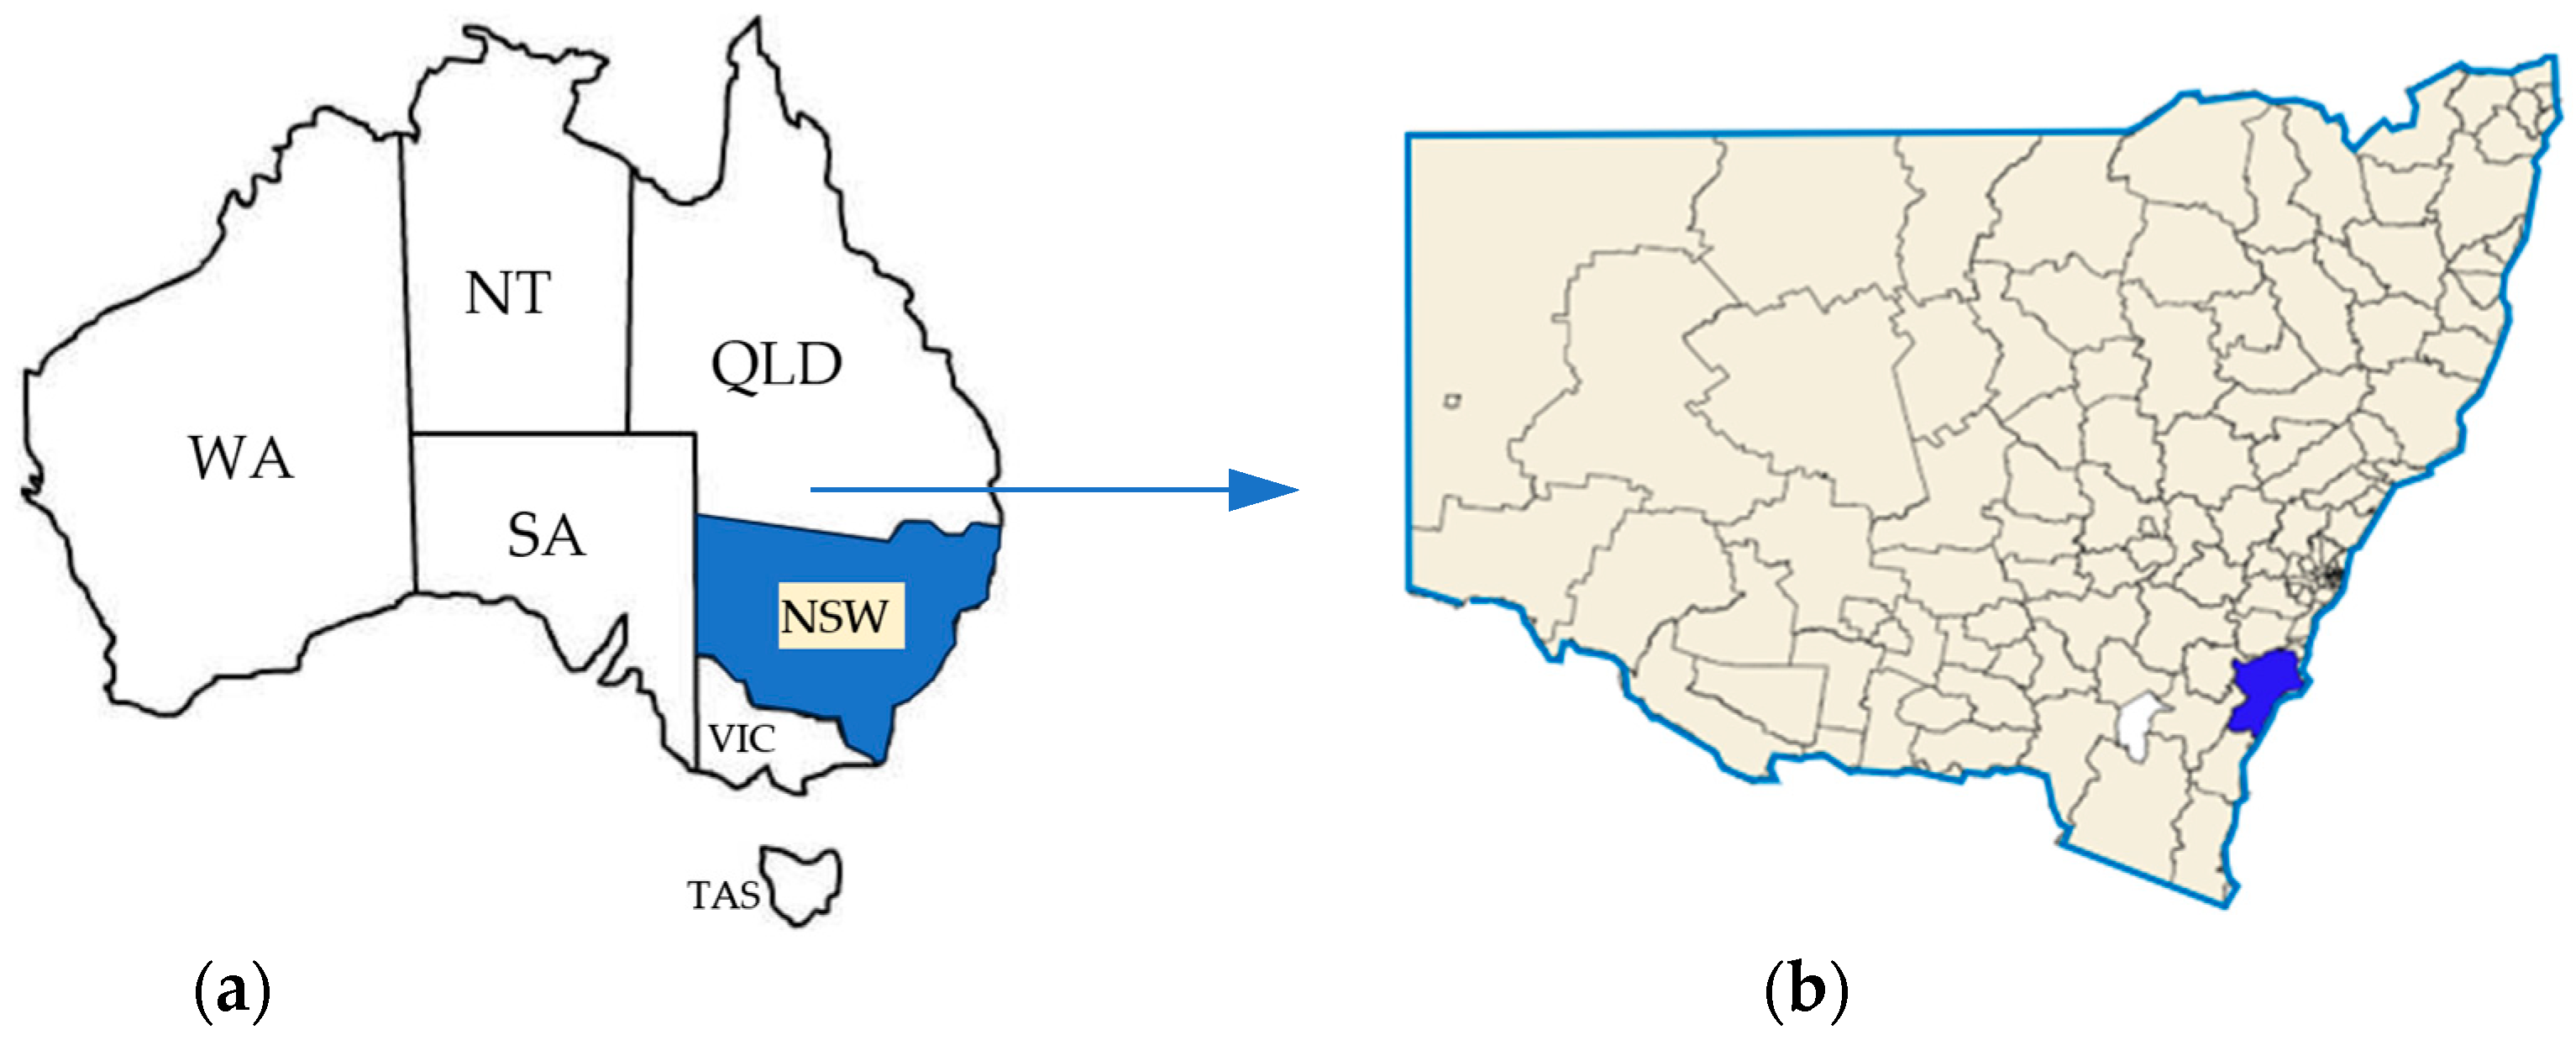
The Shoalhaven (see
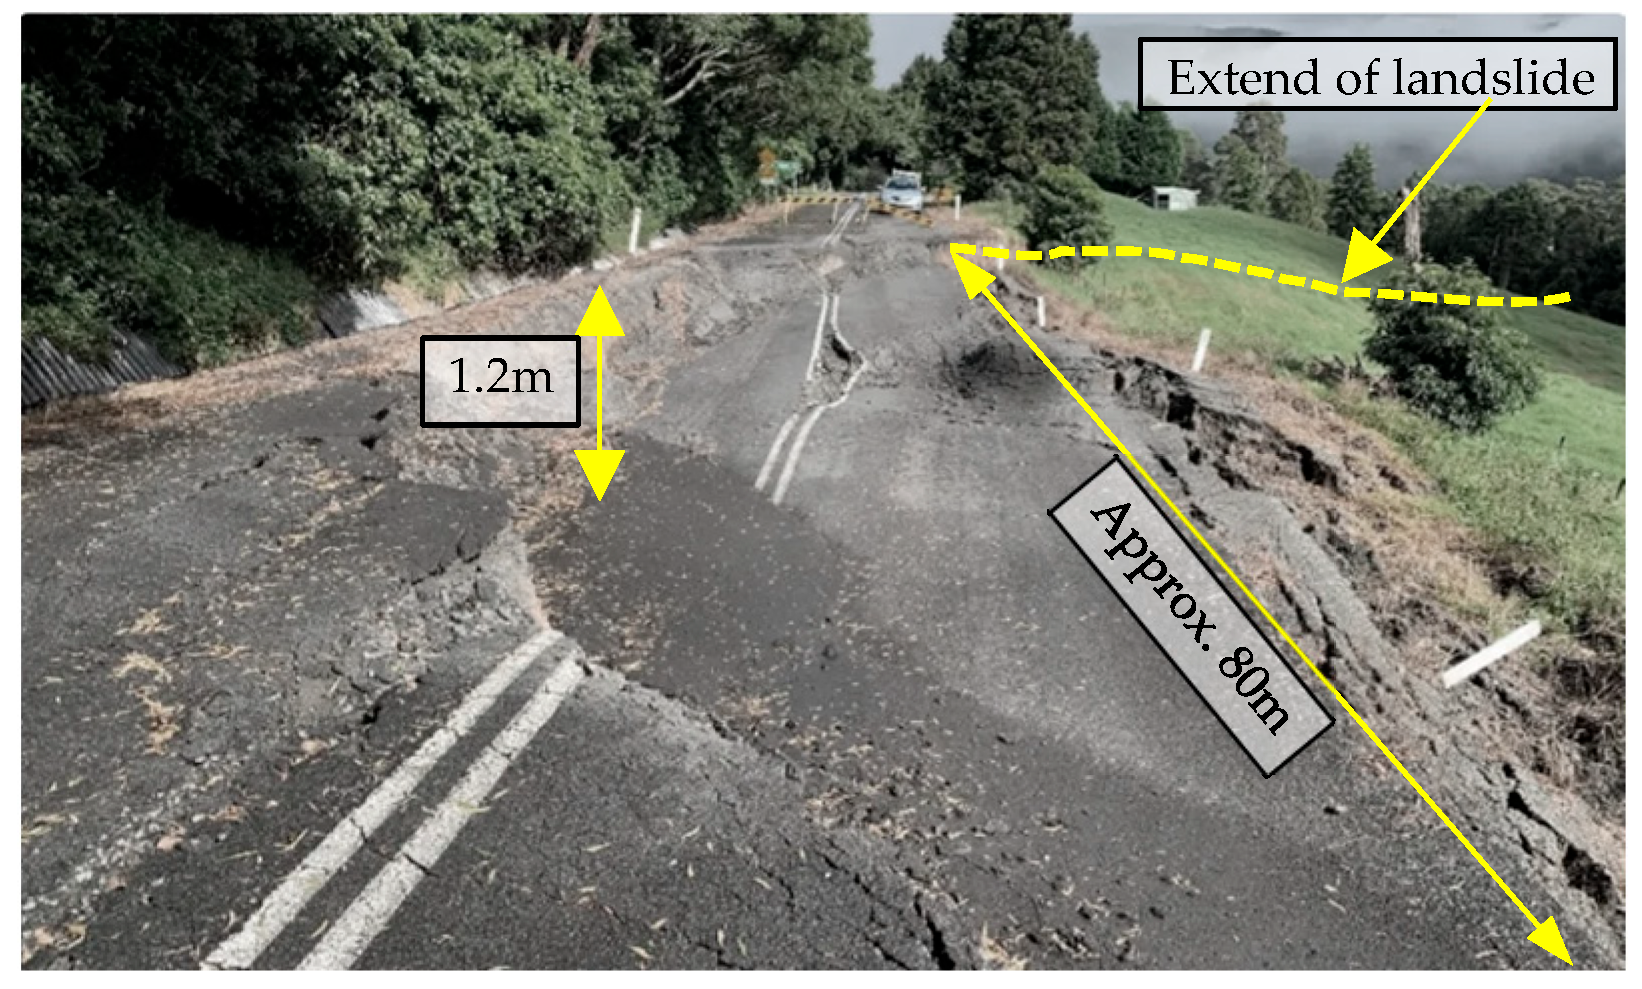
Figure 1) community experienced severe disruption in 2022 following an exceptionally wet year, during which rainfall exceeded 2000 mm in Kangaroo Valley alone. This record-breaking precipitation resulted in widespread damage to critical infrastructure, with 98 documented landslides damaging 23 roads and causing significant isolation of local communities from nearby towns and essential services. One notable example of this damage occurred along Wattamolla Road (Berry Mountain), where a major slope failure developed as a direct consequence of the intense and prolonged rainfall events that affected the NSW east coast during February and March 2022.
The Wattamolla Road embankment underwent substantial deformation and loss of stability. Preliminary assessment of the failure indicated that instability was driven by the combined influence of two primary factors: (i) a reduction in shear strength within previously disturbed or historically failed embankment materials, and (ii) elevated pore water pressures associated with a rising groundwater table during the prolonged wet period. These conditions likely resulted in a significant decrease in effective stress, thereby reducing the shear resistance along critical slip surfaces.
The failure mechanism comprised three interrelated components. These include: (i) extensive scour erosion and localised slumping occurring along the downslope shoulder, contributing to progressive loss of support; (ii) a relatively deep-seated rotational landslide involving the embankment fill, underlying colluvium, and residual soil, with the inferred failure surface developing along the soil–rock interface immediately above extremely weathered bedrock; and (iii) the contribution of long-term creep deformation, which is considered to have progressively weakened the slope over time, preconditioning the embankment to failure under extreme hydrological loading [
1].
Collectively, these mechanisms highlight the complex, multi-stage nature of the failure, where both short-term triggering factors (i.e., intense rainfall and rapid pore pressure buildup) and long-term conditioning processes (i.e., historical instability and creep) combined to produce a critical loss of stability. This case illustrates the importance of considering both transient hydrological effects and pre-existing ground conditions when assessing slope performance in high-rainfall environments.
2. Rainfall Assessment
A previous study by Flentje [
2] utilised a network of forty-three rainfall stations, sourced from the Bureau of Meteorology (BoM) and supplemented by fourteen stations from industry partner condition monitoring systems (
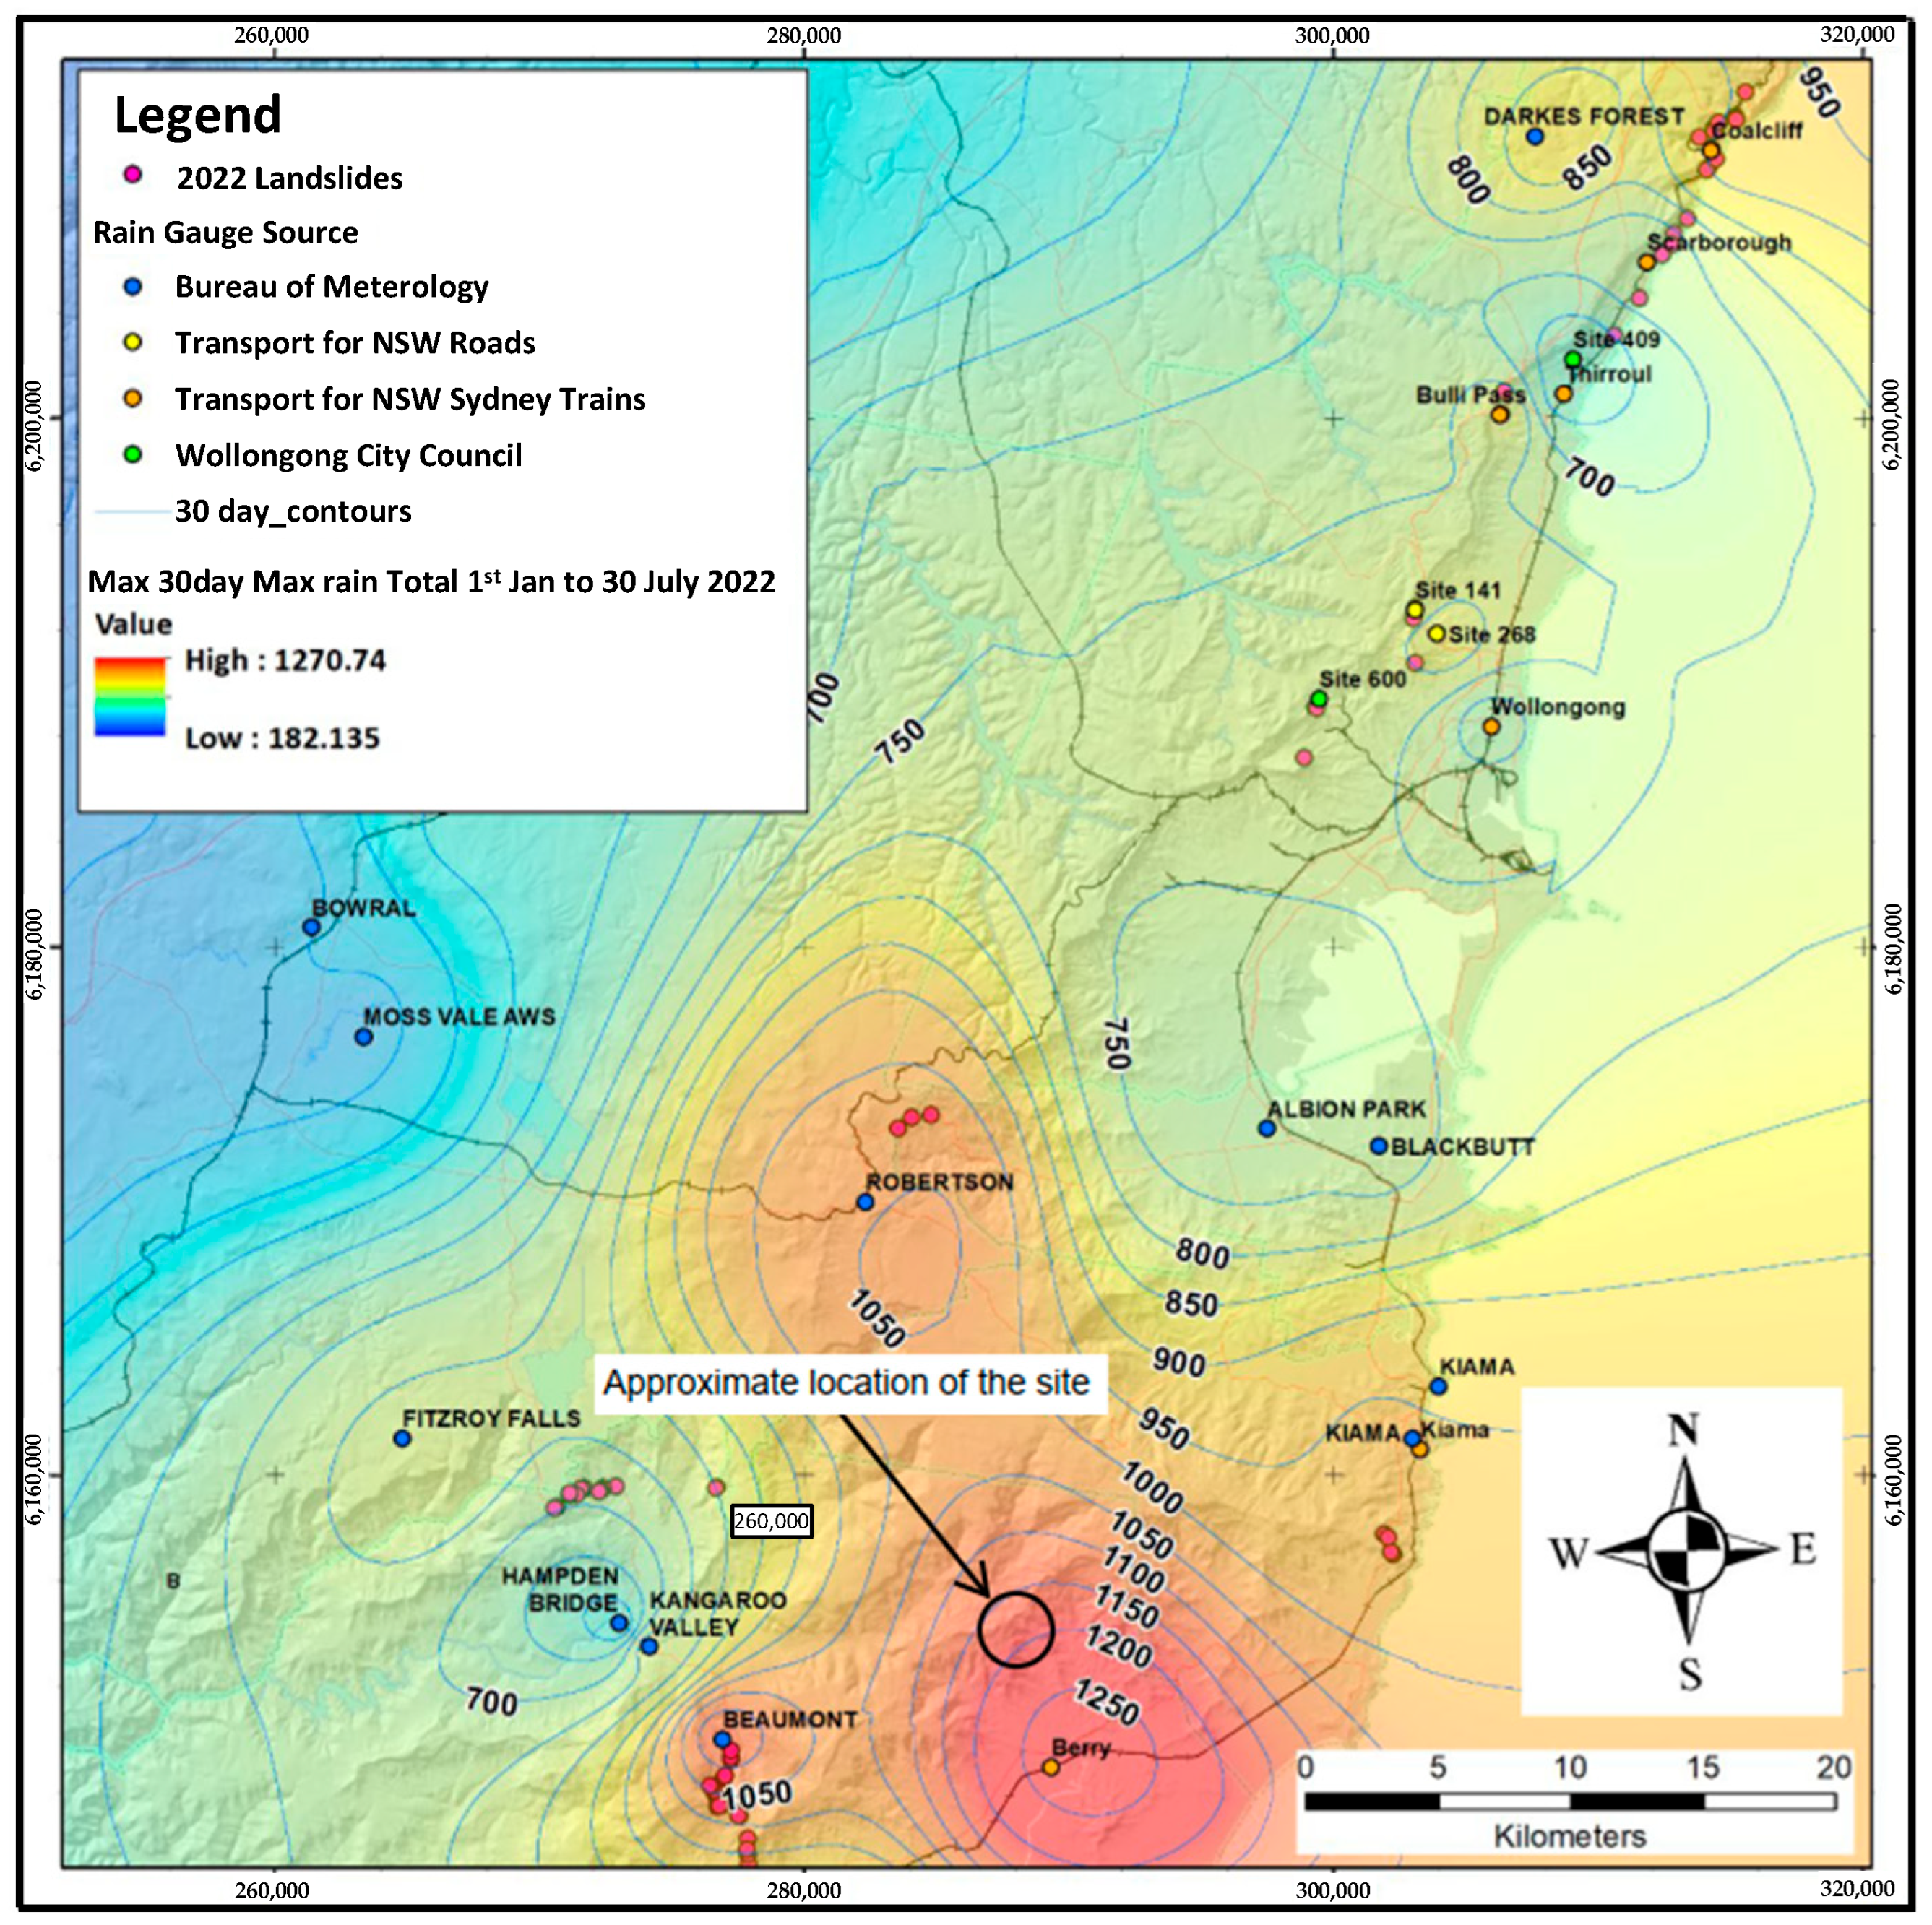
Figure 2). This dataset provided relatively dense spatial coverage across the study area and was used to interpolate rainfall distribution surfaces.
Figure 2 presents a map of maximum 30-day rainfall over the study period, alongside an initial inventory of 84 mapped landslides. While the figure illustrates cumulative rainfall depths and is therefore useful for identifying spatial patterns, the rainfall amounts recorded up to the specific times of slope instability are of greater relevance where such temporal information is available.
Despite this limitation,
Figure 2 highlights several important features. There is a pronounced spatial variation in rainfall across the study area, strongly influenced by orographic effects associated with the escarpment. Enhanced rainfall totals are evident along the escarpment between Bulli and Mt Keira, where moist onshore airflow is forced to rise, resulting in increased precipitation. Areas of consistently elevated rainfall are also observed inland across the elevated plateau, with the highest accumulations occurring in Kangaroo Valley and near Robertson, Wattamolla as well as extending toward coastal areas near Berry.
The landslide inventory presented in
Figure 2 comprises 84 mapped landslides included within the regional rainfall study dataset developed by Flentje et al. [
2]. This differs from the 98 landslides subsequently reported by Shoalhaven City Council following the February–March 2022 rainfall event, reflecting differences in data sources, mapping extent, and the timing of inventory compilation.
The distribution of mapped landslides broadly coincides with these zones of elevated rainfall, suggesting a strong correlation between prolonged rainfall accumulation and slope instability. In particular, clusters of landslides are observed in regions where 30-day rainfall totals exceed approximately 900–1100 mm, indicating that sustained antecedent wetness likely played a critical role in reducing shear strength and increasing pore water pressures within susceptible soil and rock masses. However, some spatial discrepancies are also evident, reflecting the influence of additional controlling factors such as local geology, slope angle, drainage conditions, and land use.
Overall, the figure demonstrates that the rainfall event was highly heterogeneous, with localised maxima reflecting topographic controls. This variability is important when assessing landslide hazard, as it highlights that regional rainfall totals alone may not adequately capture site-specific triggering conditions. More detailed temporal rainfall analysis, combined with site-based geotechnical assessment, is therefore required to better understand the mechanisms of driving slope failure during the study period.
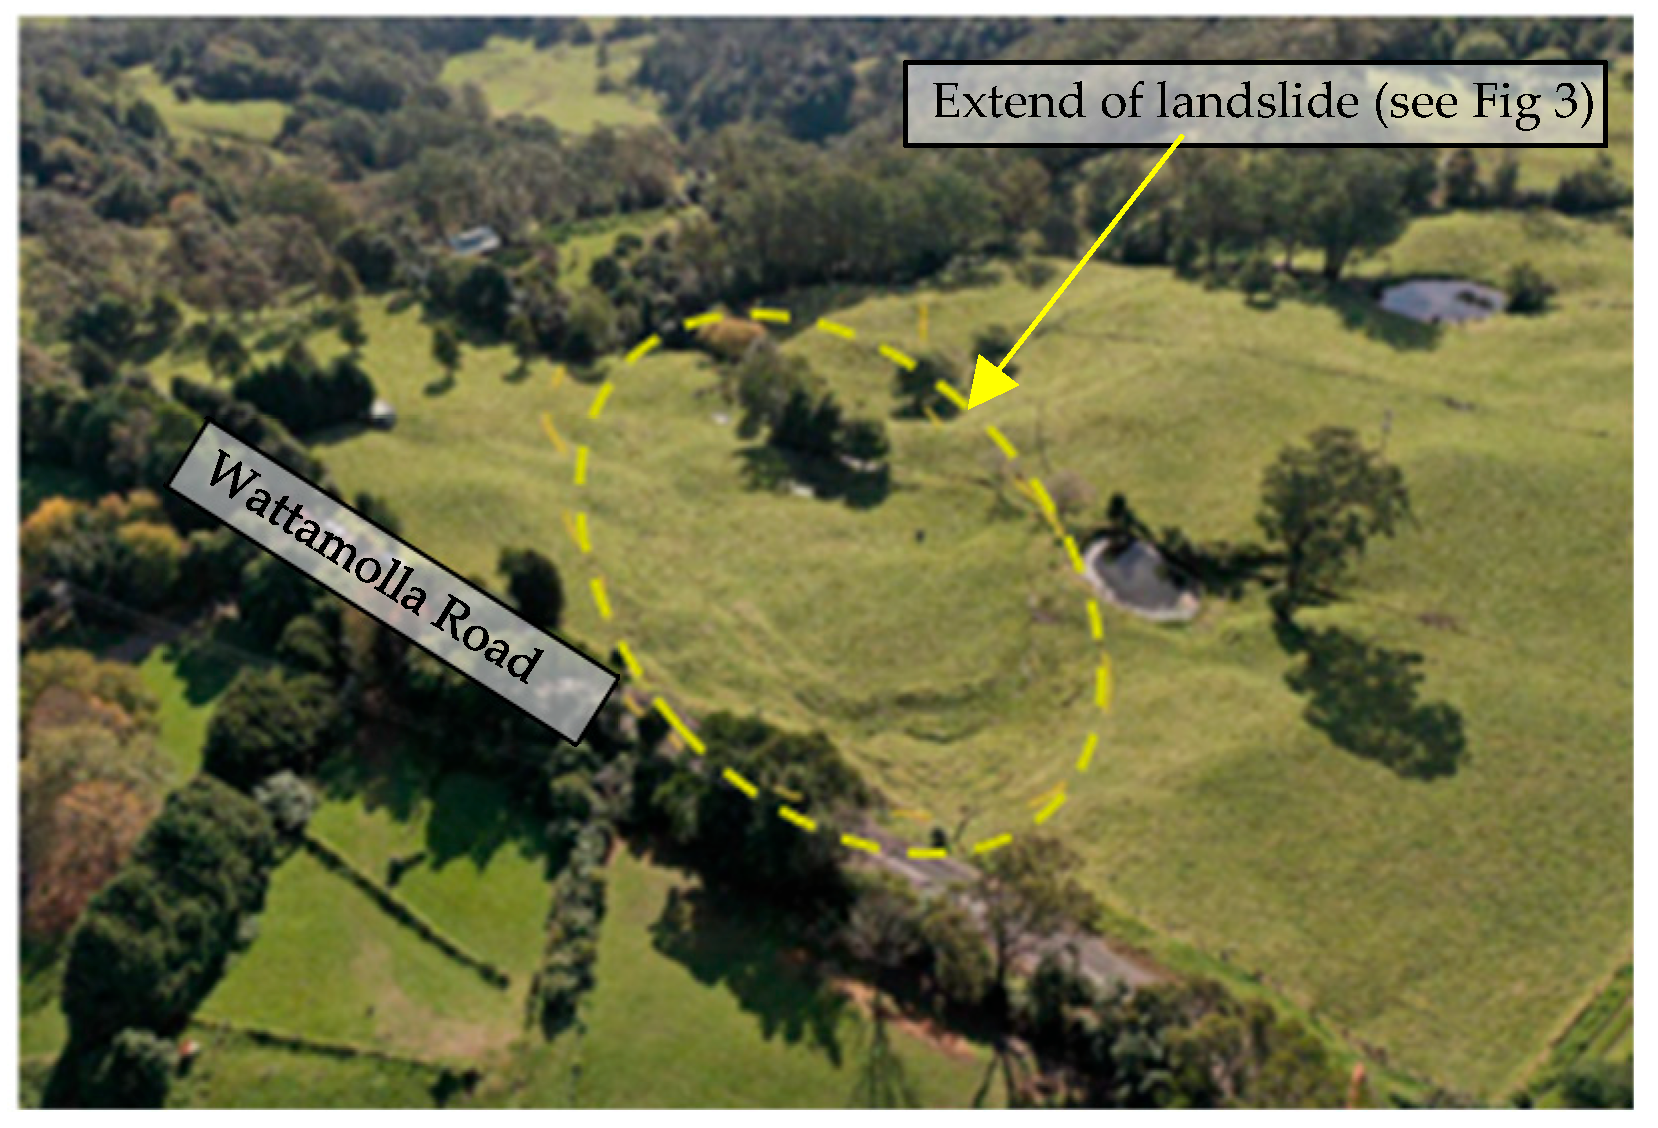
Figure 3 and
Figure 4 show aerial view of Wattamolla Road, and approximate extent of landslide affected embankment.
3. Temporary Remediation Solution
In response to the slope failure, the local authority mandated a rapid, cost-effective solution to restore road access. Geocell reinforcement was therefore adopted as the preferred interim remediation measure. The design comprised a multi-layered geosynthetic cellular confinement system, consisting of six layers of geocell mattress overlain by a single geogrid layer, to provide a stable temporary running surface. This approach is based on the established principle that geocells enhance the performance of granular infill through three-dimensional confinement. The honeycomb structure generates substantial additional confining pressure, which reduces lateral spreading and limits vertical settlement under load, thereby improving the load-bearing capacity of the weakened embankment [
3,
4].
The geocell system also offers two key engineering advantages. Firstly, it behaves as a flexible mattress that can accommodate differential settlements without loss of its structural integrity, which is critical for stabilising recently failed ground. Secondly, it provides significant design flexibility, allowing adaptation to variable site topography and geotechnical conditions.
From a hydrological perspective, the geocell mattress also improves drainage capacity within the embankment. The combination of permeable infill and open cellular structure facilitates both vertical infiltration and lateral drainage of pore water. This integrated drainage capacity promotes pore pressure dissipation, particularly on sloping terrain or where underlying soil has low permeability, thereby contributing to improved overall slope stability.
4. Previous Studies
The theoretical foundation for quantifying the additional confining pressure provided by geocell reinforcement is rooted in the early application of hoop tension theory [
5]. This concept, which models the geocell mattress as an elastic material, has been subsequently adopted by numerous researchers to calculate the confinement offered to infill materials [
4,
6]. Building upon this foundation, various analytical models have since been developed using Hooke’s law and hoop tension theory to predict this induced confining pressure, a critical parameter for design [
6,
7]. Understanding this reinforcement mechanism is essential for the effective design and application of geocell systems.
Extensive research has been devoted to evaluating the performance of geocell-reinforced soil under both monotonic and cyclic loading conditions [
8,
9,
10,
11,
12]. The observed improvement in performance is widely attributed to the development of apparent cohesion between the geocell walls and the infill material. A significant body of this work has specifically examined geocell applications within transportation infrastructure, including railways and road networks [
1,
13,
14,
15,
16,
17,
18,
19].
Of particular relevance to temporary embankment repairs are studies investigating low confining pressures. For instance, large-scale cubical triaxial tests have been conducted to assess the behaviour of geocell-reinforced subballast under cyclic loading at confining pressures ranging from 5 to 30 kPa [
20,
21]. A key finding from this research is that geocell reinforcement can enable the use of lower-quality, locally available infill materials while still maintaining performance, a critical advantage in remote or cost-sensitive projects.
The current study investigates the impact of confining pressure (hoop stress) on the overall performance of a geocell system deployed to stabilise a landslide-affected section of the Wattamolla Road embankment. The results demonstrate that even at low confining pressures (σ′3 ≤ 15 kPa), the geocell effectively confines the unbound aggregate, thereby mitigating excessive lateral and axial deformations and stabilising the road embankment under repetitive traffic loading.
4.1. Equivalent Composite Approach
The equivalent composite approach represents a conventional and simplified method for modelling geocell-reinforced soil within a two-dimensional framework, a technique widely adopted in previous studies [
22,
23]. This method conceptualises the geocell and its infill material as a single, homogeneous soil layer with enhanced strength and stiffness characteristics.
The improved mechanical properties assigned to the equivalent composite material, including its strength and stiffness parameters, have been validated through large-scale triaxial testing [
24,
25]. A consistent finding from such experimental work is a significant increase in the apparent cohesion of the soil–geocell composite. Seminal research by Rajagopal [
26], involving large-scale triaxial tests on granular soils confined by single and multiple geocells, demonstrated that while the reinforced and unreinforced samples maintained an identical friction angle, the reinforced specimens exhibited a substantial increase in apparent cohesion (C
r).
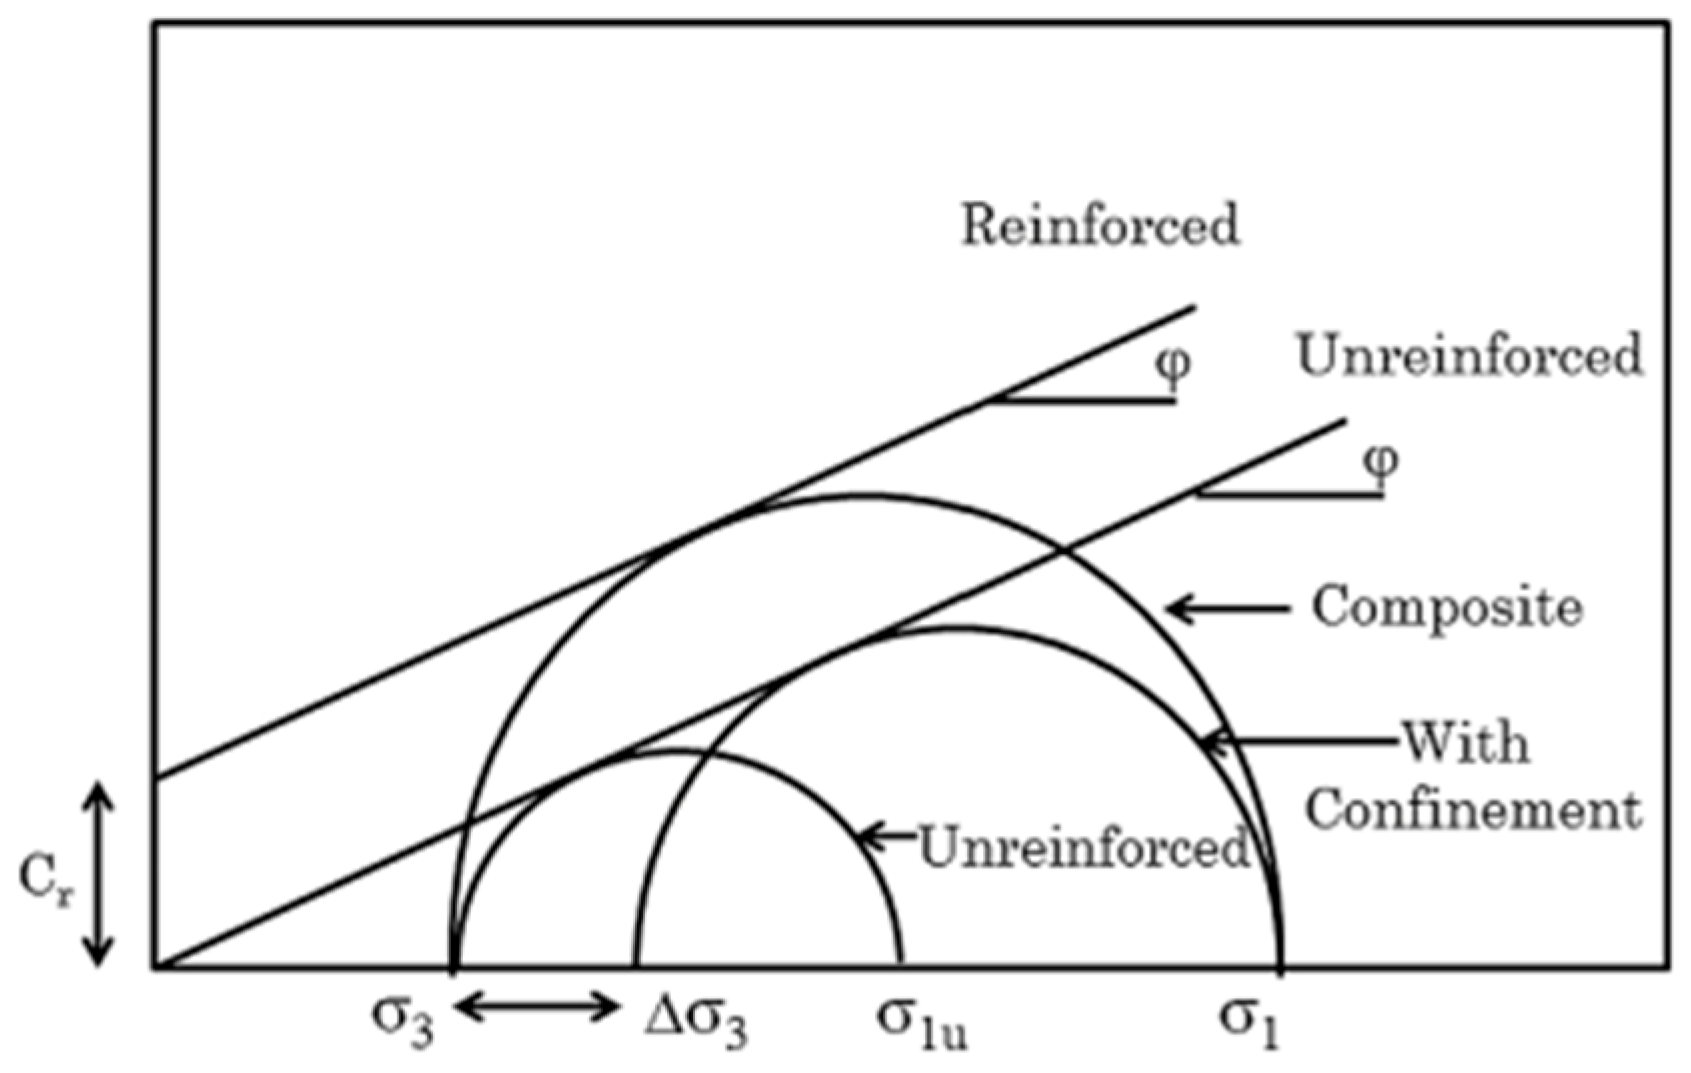
The improved behaviour of geocell-reinforced soil is primarily attributed to the additional confinement pressure (Δσ
3) generated by the geocell reinforcement [
27]. This confinement increases the minor principal stress from σ
3 to σ
3 + Δσ
3, enabling the soil to sustain a higher ultimate deviatoric stress (σ
1) than the corresponding unreinforced material (σ
1u). As illustrated by Pokharel [
17], this effect can be represented by an enlargement of the Mohr circle at failure, where the increased confinement is reflected through a combination of the original confining stress (σ
3) and an apparent cohesion (C
r). Consequently, geocell reinforcement provides a pseudo-cohesive effect, allowing otherwise cohesionless granular materials to exhibit enhanced strength and deformation resistance, as illustrated in
Figure 5.
4.2. Development of Additional Confinement Model
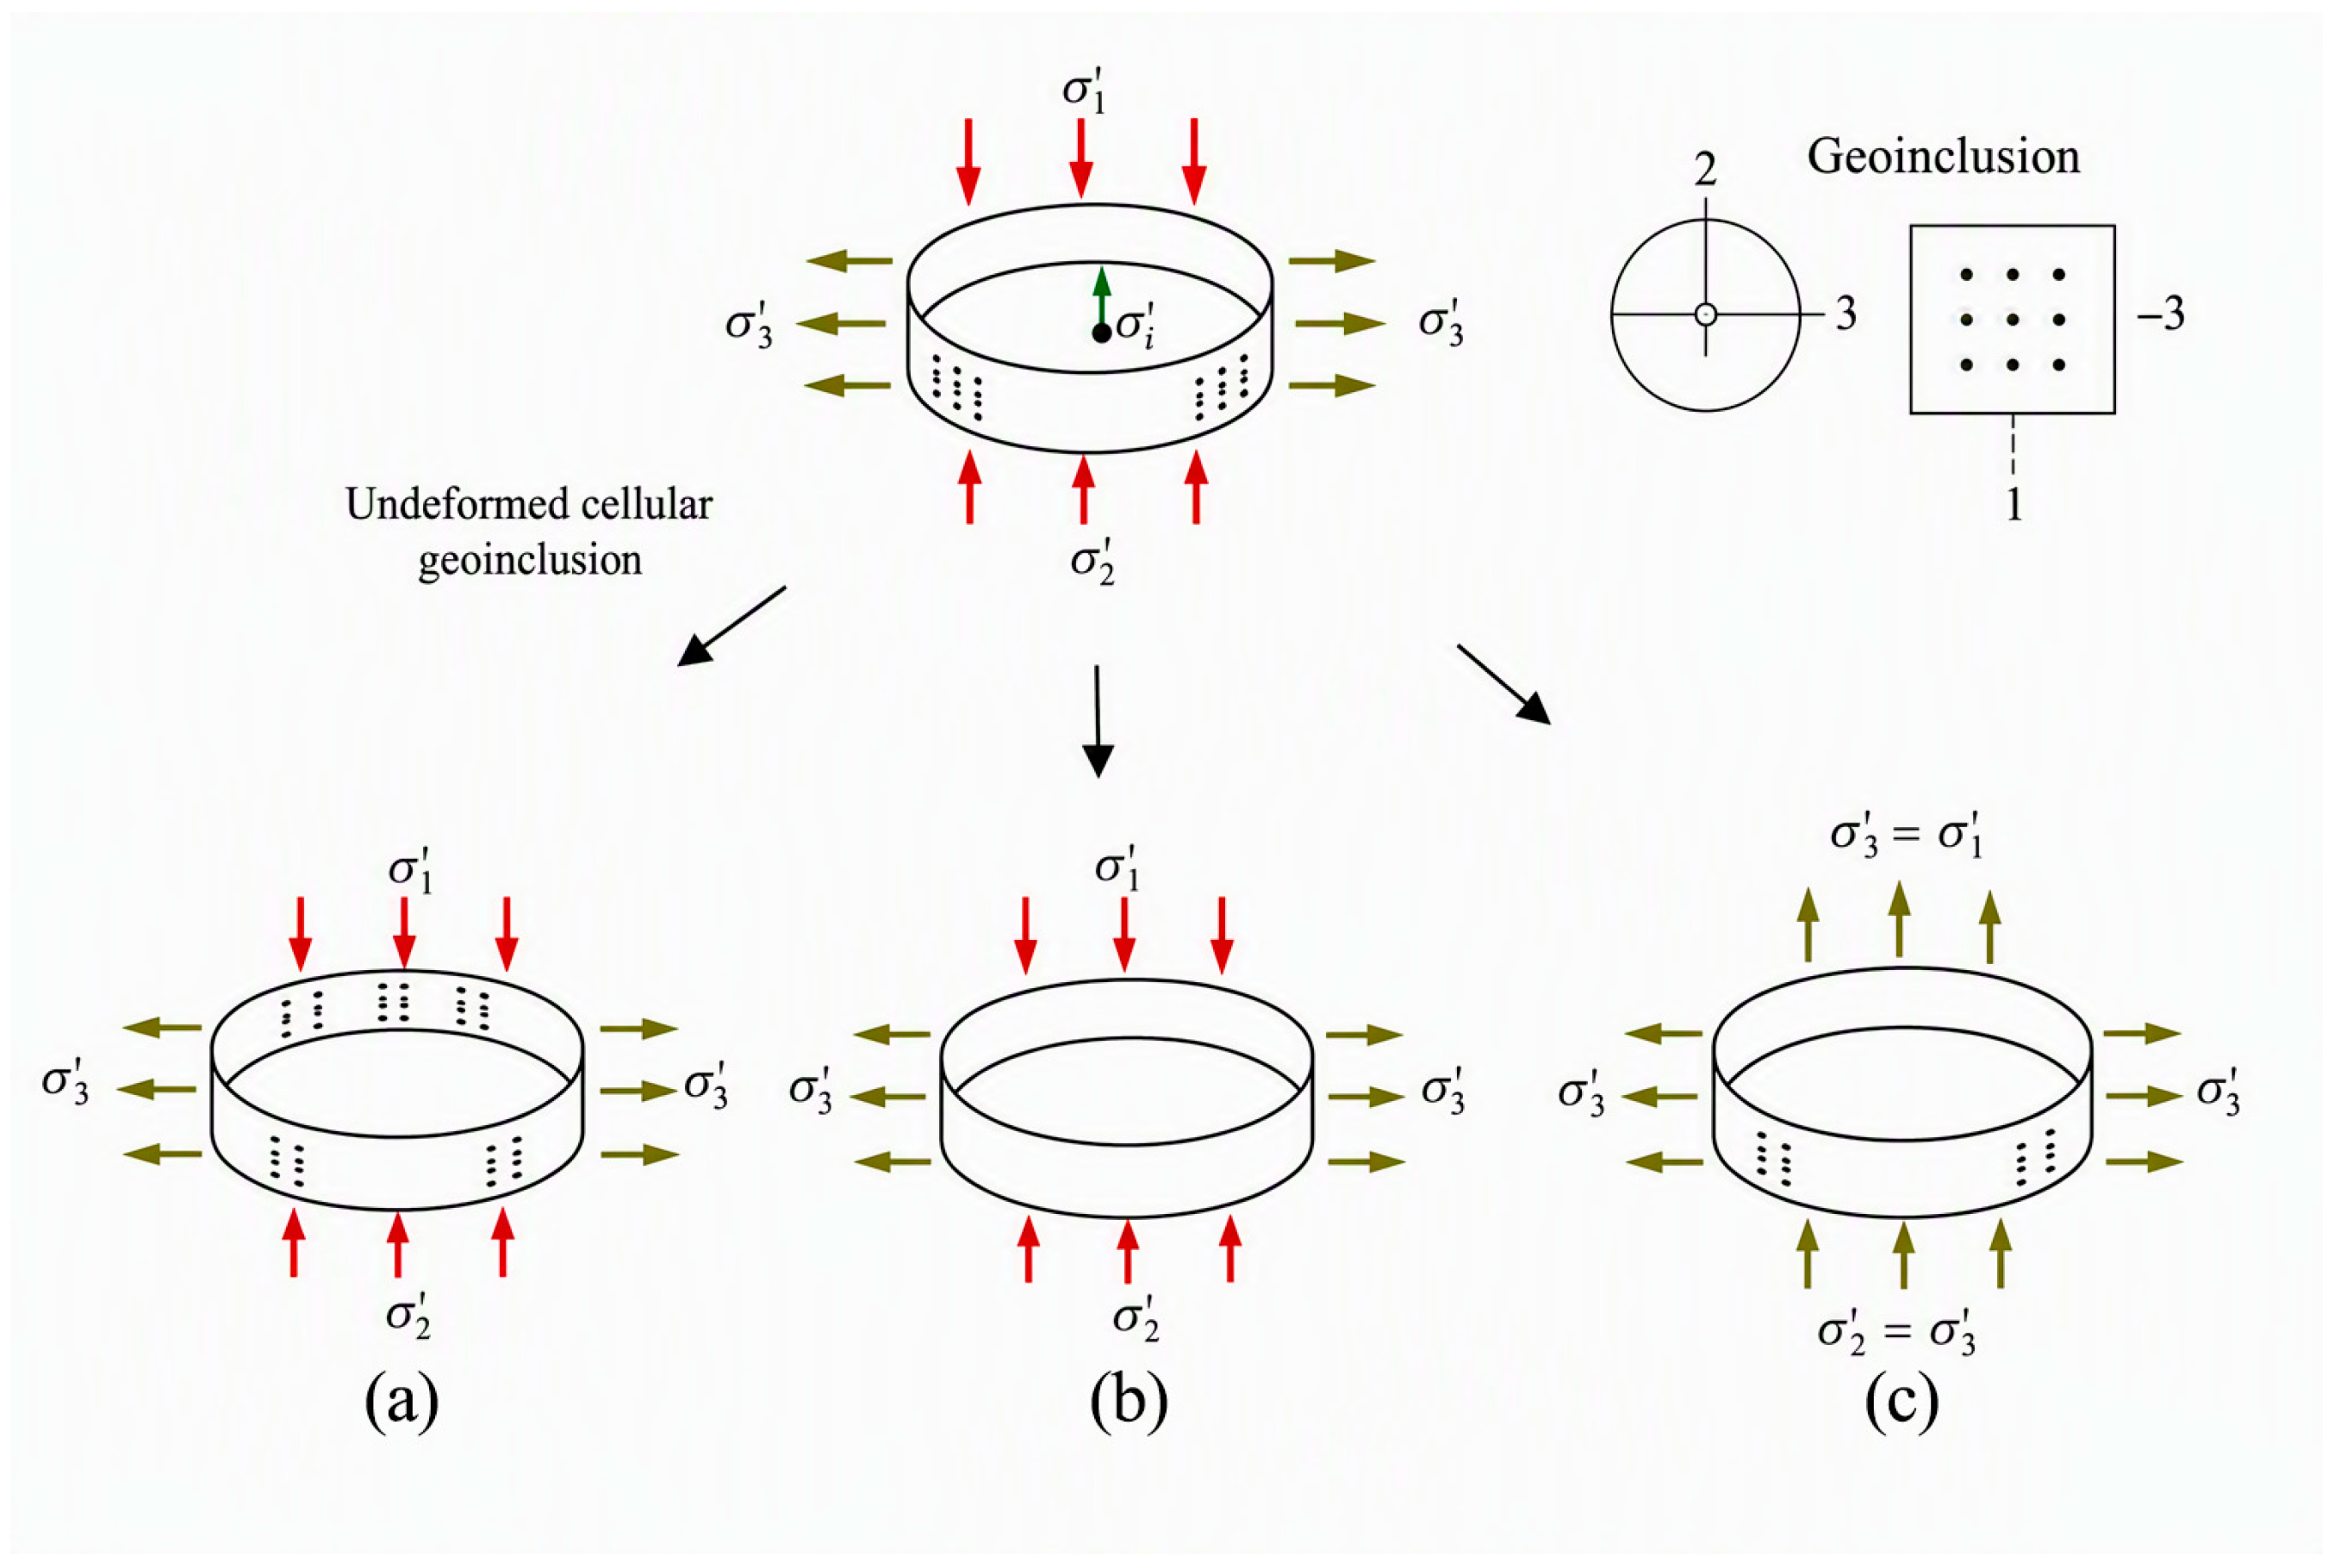
The reinforcement mechanism of the geocell is activated upon vertical loading of the composite system. While the infill material experiences compression and tends to deform laterally, the geocell’s cellular structure provides restraint. This restraint against lateral spreading generates circumferential tensile stress, or hoop tension, within the geocell walls. The resulting deformation profiles for the composite under generalised, plane-strain, and triaxial stress states (σ′
1: major principal stress, σ′
2: intermediate principal stress and σ′
3: minor principal stress) are depicted in
Figure 6a,
Figure 6b and
Figure 6c, respectively.
The analytical formulations presented in this section are included to provide the theoretical basis of geocell-induced confinement and to summarise the confinement mechanisms reported in the literature. These formulations were not directly applied in the finite element analyses undertaken in the current study, however are presented to establish the theoretical context for interpretation of the numerical results.
4.2.1. General Stress State
For a general loading condition, the geocell–soil composite is subjected to an anisotropic three-dimensional stress state where the principal stresses are unequal (σ′
1 ≠ σ′
2 ≠ σ′
3). To quantify enhanced performance under cyclic loads, a model proposed by Punetha [
7] can be employed. This model is based on the premise that the geocell deforms into an elliptical shape, developing a uniform tensile stress along its height. This deformation mechanism allows for the calculation of the additional confining pressures (Δσ′
2 and Δσ′
3) imparted by the geocell. Consequently, after a limiting number of load cycles (N
lim), the total supplemental confinement provided by the geosynthetic inclusions can be evaluated using the following formulations:
where b is the intermediate principal stress ratio [
b = (σ′
2 − σ′
3)/(σ′
1 − σ′
3)]. The analytical model by Punetha [
7] comprises thirteen input parameters, which can be categorised as follows:
Geocell Properties: Mm (mobilised modulus of the geocell), Dg (diameter of an equivalent circular area of the geocell pocket), and vg is Poisson’s ratio of the geocell.
Loading Condition: Parameter (b), which is dependent on the external loading configuration.
Soil Resilient Properties: The resilient modulus (MR), Young’s modulus (E), and Poisson’s ratio (vs) of the infill soil, which can be obtained from conventional laboratory tests.
Empirical Constants: The parameters k1, k2, k3 and k4 are determined by calibrating the model against experimental data, specifically by fitting the curve of irrecoverable vertical strain versus the number of load cycles (N) under various stress states.
Soil Strength Parameters: The ultimate friction angle (φ’f) and the soil dilatancy angle (D) require characterisation through true-triaxial tests capable of simulating the general stress condition (σ′1 ≠ σ′2 ≠ σ′3).
Punetha [
7] applied this model to evaluate the additional confinement provided by five distinct geoinclusion materials: High Density Polyethylene (HDPE) geocell, woven coir fibre geotextile, nonwoven polypropylene (PP) geotextile, rubber membrane (0.1–0.5 mm thickness), and rubber tyre. The specific parameters for the geocell–soil composite under plane-strain, triaxial, and general stress states are summarised in
Table 1.
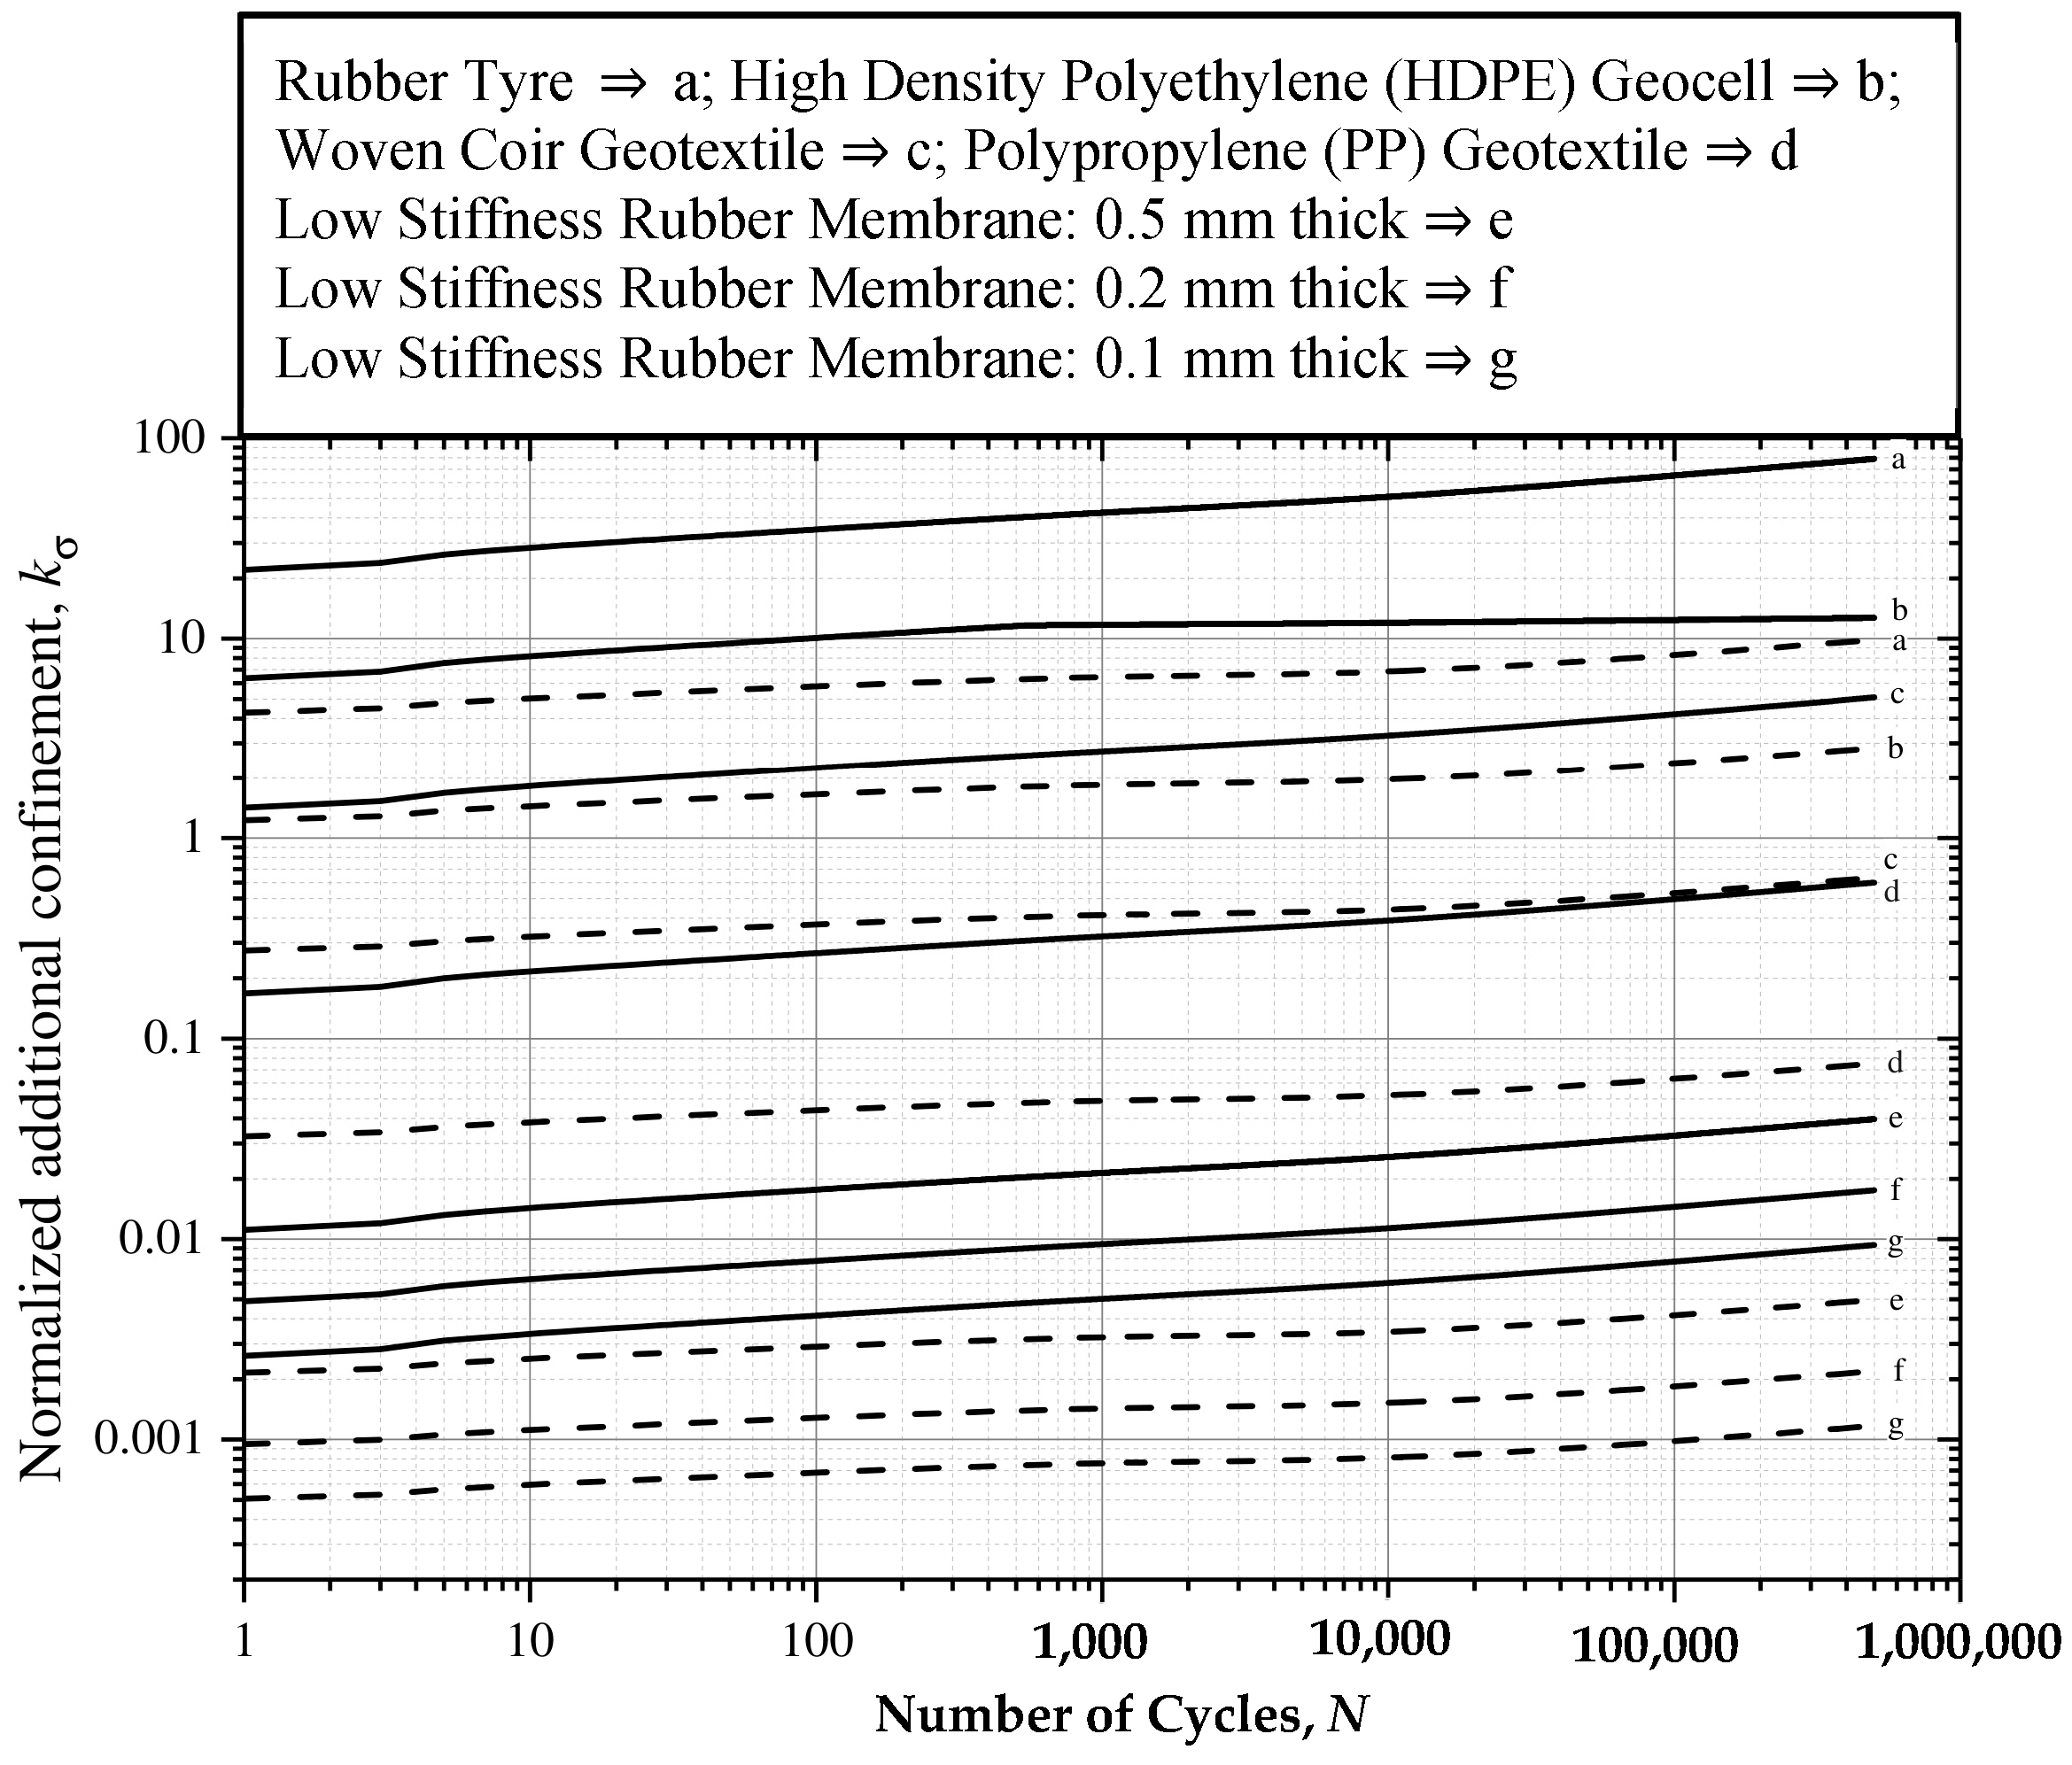
Figure 7 illustrates the variation in normalised additional confinement with the number of load cycles (N) for five geoinclusion materials, under a constant confining pressure (σ′
3 = 15 kPa) and with parameters
b = 0.1,
D = −0.2 and φ′
f = 50°. The results demonstrate that the rubber tyre provides the highest magnitude of additional confinement in the direction of the minor principal stress σ′
3. This superior performance is primarily attributed to its high secant modulus at a given strain level relative to the other materials. Conversely, polypropylene geotextile and rubber membranes exhibit substantially less confinement due to their comparatively lower stiffness. A similar trend is observed for the confinement coefficient in the intermediate principal stress direction (k
σ,2), which follows the descending order: rubber tyre> HDPE geocell > woven coir geotextile > polypropylene geotextile > rubber membranes. Therefore, the study conclusively shows that the efficacy of the additional confinement is highly dependent on the secant modulus of the constituent geoinclusion material.
4.2.2. Plane-Strain Stress State
Indraratna [
14] proposed an equation for determining the additional confinement due to the provision of a geocell subjected to cyclic loading in a rail track environment. The additional confinement offered by the geocell was computed using the hoop tension theory, which can be assessed based on the following equation:
Additional confining pressure can now be determined by integrating Equation (2) by considering properties of infill material (i.e., and ε1,p) along and D for the geocell at the desired number of load cycles, confining pressure and frequency. M is the mobilised modulus of the geocell; νg is the Poisson’s ratio of the geocell; k is the ratio between εc and ε3; ε3 is the percentage radial strain; and εc is the percentage circumferential strain. However, it should be noted that due to very limited data captured during construction of the geocell-reinforced embankment, this study does not intend to validate the outcome of the current assessment with the existing analytical studies.
The Δσ′
3 for the plane-strain condition can thus be expressed as [
7]
4.2.3. Triaxial Stress State
Additional confinement induced by geocell ∆σ
3, during repeated loading, can be determined by [
7]
where
D is the diameter of the sample;
1 is the vertical stress in the triaxial test;
3 is the confining stress in the triaxial test;
ψ is the dilation angle; and
Mr1 is the resilient modulus during the stage at which confining stress was increased from σ
3 + ∆σ
3.
Mr2 is the resilient modulus during the stage at which confining stress was increased to σ
3 + ∆σ
3; (
ε0/
εr),
ρ and
β are the permanent deformation parameters of the granular material, and
Nlimit is the limiting number of cycles.
Punetha [
7] proposed the formulation for Δσ′
3 relevant for the triaxial stress state as
where σ
oct is the octahedral normal stress; τ
oct is the octahedral shear stress;
N is the number of load cycles; σ
atm is the atmospheric pressure; and
k1,
k2,
k3,
k4 are the empirical parameters.
K is the coefficient representing the internal friction [
K = (1 + sin φ′
f)/(1 − sin φ′
f)]; and φ′
f is the interparticle friction angle.
R is the stress ratio (σ′
1/σ′
3).
5. Objective of Current Assessment
It is well established that the improved performance of geocell-reinforced layers is primarily attributed to the additional confining pressure (Δσ
3) mobilised within the infill material. This effect may be conceptually represented by an enlargement of Mohr’s circle at failure, where the reinforced system exhibits an apparent increase in confinement characterised by the in-situ confining pressure (σ′
3) and an apparent cohesion intercept (
Cr) [
17]. The development of this pseudo-cohesive behaviour is commonly associated with the three-dimensional confinement provided by the geocell structure, which restricts lateral deformation and enhances interlocking of the infill material.
However, several experimental and analytical studies conducted under relatively low confining stress conditions (σ′3) have indicated that the magnitude of additional confinement generated by geocell reinforcement may be relatively modest. This suggests that while the reinforcement mechanism is effective, its contribution is highly dependent on stress level, material properties, and boundary conditions, and may not always translate into substantial increases in shear strength under all loading scenarios.
Accordingly, the objective of the present assessment is to utilise advanced numerical modelling techniques, specifically finite element analysis (FEA), to quantify the magnitude and spatial distribution of the additional confining pressure mobilised within the reinforced layer under representative road loading conditions. The numerical approach enables a more rigorous evaluation of stress–strain behaviour within the geocell–soil composite system, including the interaction between the geocell geometry, infill material stiffness, and applied loading. This allows for assessment of both localised confinement effects and the overall structural response of the reinforced layer.
The outcomes of this analysis are intended to provide insight into the mechanisms governing geocell performance, and to establish whether the additional confinement generated under realistic field conditions is sufficient to produce meaningful improvements in bearing capacity, deformation resistance, and long-term stability of the pavement structure. Furthermore, the modelling results will support the calibration of simplified design approaches and contribute to a more rational basis for incorporating geocell reinforcement into engineering design frameworks.
6. Limit Equilibrium Analysis
The geotechnical model adopted in the present study was derived from a previously completed geotechnical assessment of the Wattamolla Road landslide [
1]. As part of that assessment, a series of limit equilibrium analyses (LEAs) were undertaken using the Morgenstern–Price method [
29] to establish representative ground conditions, evaluate the influence of groundwater conditions on stability, and derive geotechnical parameters consistent with the observed failure mechanism. The outcomes of the LEAs, including the interpreted ground model, material parameters and representative geometry, were subsequently adopted as input for the finite element analyses presented in this paper. Accordingly, the purpose of
Section 6 is not to present a new slope stability assessment, but rather to describe the basis of the geotechnical model used for the investigation of geocell confinement mechanisms.
While the present paper focuses on the confinement mechanism of geocell reinforcement rather than a detailed slope stability assessment, a summary of the key LEA results and corresponding factors of safety is presented herein to provide context for the adopted geotechnical model and remediation strategy. The LEA was used solely to establish representative geometry, groundwater scenarios and material parameters for the finite element analyses.
The groundwater conditions adopted in this study were based on representative scenarios developed during the original geotechnical assessment of the Wattamolla Road landslide. A “high groundwater level” condition was used to represent the elevated pore water pressures and near-saturated ground conditions inferred to have developed following the prolonged rainfall events of 2022, while a “low groundwater level” condition was adopted to represent typical long-term groundwater conditions. These groundwater scenarios were used to assess the sensitivity of embankment behaviour to changes in subsurface water conditions and should be considered conceptual analytical conditions rather than measured piezometric surfaces. No groundwater monitoring or piezometric records were available to the authors during preparation of this study.
Subsequently, the following sequential stages were analysed to comprehensively evaluate the stability of the road embankment under various critical conditions:
Stage 1—Back analysis considering a high groundwater level with no traffic load.
Stage 2—Forward analysis (geocell reinforced) considering a low groundwater level with no traffic load.
Stage 3—Forward analysis (geocell reinforced) considering a low groundwater level with a 15 kPa traffic load.
Stage 4—Forward analysis (geocell reinforced) considering a high groundwater level with no traffic load.
Stage 5—Forward analysis (geocell reinforced) considering a high groundwater level with a 15 kPa traffic load.
Stage 6—Forward analysis (unreinforced) considering a high groundwater level with no traffic load.
Stage 7—Forward analysis (unreinforced) considering a high groundwater level with a 15 kPa traffic load.
The original geotechnical assessment included a series of limit equilibrium analyses undertaken using the Morgenstern–Price method [
29] to evaluate the stability of the failed embankment and the proposed geocell-reinforced remediation option. The assessment adopted a minimum target Factor of Safety (FoS) of 1.30 for low groundwater conditions with no traffic surcharge loading and 1.20 for high groundwater conditions with traffic surcharge loading. The back analysis of the landslide indicated a Factor of Safety (FoS) of approximately 0.97, consistent with the observed instability. Subsequent forward analyses of the geocell-reinforced embankment indicated FoS values of approximately 1.34 under low groundwater conditions with no traffic loading, 1.30 under low groundwater conditions with traffic surcharge, 1.33 under high groundwater conditions with no traffic loading and 1.28 under high groundwater conditions with traffic surcharge. As summarised in
Table 2, all geocell-reinforced scenarios satisfied the adopted design criteria, demonstrating that the proposed geocell reinforcement provided an acceptable level of stability for the temporary access road. These results subsequently formed the basis of the finite element analyses presented in this study.
Geotechnical Design Parameters
The engineering geological model adopted for the current study was based on the interpreted ground conditions developed during the original geotechnical assessment of the Wattamolla Road landslide, which incorporated available borehole information, including borehole BH01 located within the landslide-affected area, together with site observations and geotechnical back analysis undertaken during design of the remediation works.
The model comprises a road embankment constructed of sandy clayey fill overlying a sequence of colluvial and residual soil deposits developed from the weathering of the underlying bedrock. The colluvium generally consists of heterogeneous clayey soils containing gravel, cobbles and occasional boulders derived from historical slope movement and weathering processes, while the residual soils comprise stiff sandy clay to clayey sand formed in situ from the weathering of the parent rock. The soil profile is underlain by extremely weathered (EW) rock, transitioning at depth to highly weathered to moderately weathered (HW–MW) rock. Consistent with observations made during the original assessment, the inferred failure mechanism was interpreted to extend through the embankment fill, colluvium and residual soils, with the critical failure surface developing near the soil–rock interface immediately above the extremely weathered bedrock.
The geotechnical parameters adopted in the numerical analyses were derived from the original geotechnical assessment and subsequent back analysis of the landslide. Strength and stiffness parameters were selected to be consistent with the observed failure mechanism, site geomorphology and inferred subsurface conditions. Reduced strength parameters were adopted for the post-failure colluvium and residual soils to represent the loss of effective stress associated with elevated groundwater conditions during the 2022 rainfall event. Parameters assigned to the weathered rock units reflected their comparatively higher shear strength and stiffness, while the properties adopted for the geocell-reinforced layer were based on the equivalent composite soil approach commonly reported in the literature. The adopted parameter set was subsequently used to establish representative material behaviour within both the limit equilibrium and finite element analyses.
A summary of the material properties and derived geotechnical parameters obtained from the back analysis [
1] and adopted in the current study is presented in
Table 2 and
Table 3.
The outcomes of the limit equilibrium assessment were used to establish representative material properties, groundwater conditions and embankment geometry for subsequent numerical analyses. The assessment also confirmed that the proposed geocell-reinforced remediation option satisfied the target design criteria adopted for the temporary access road.
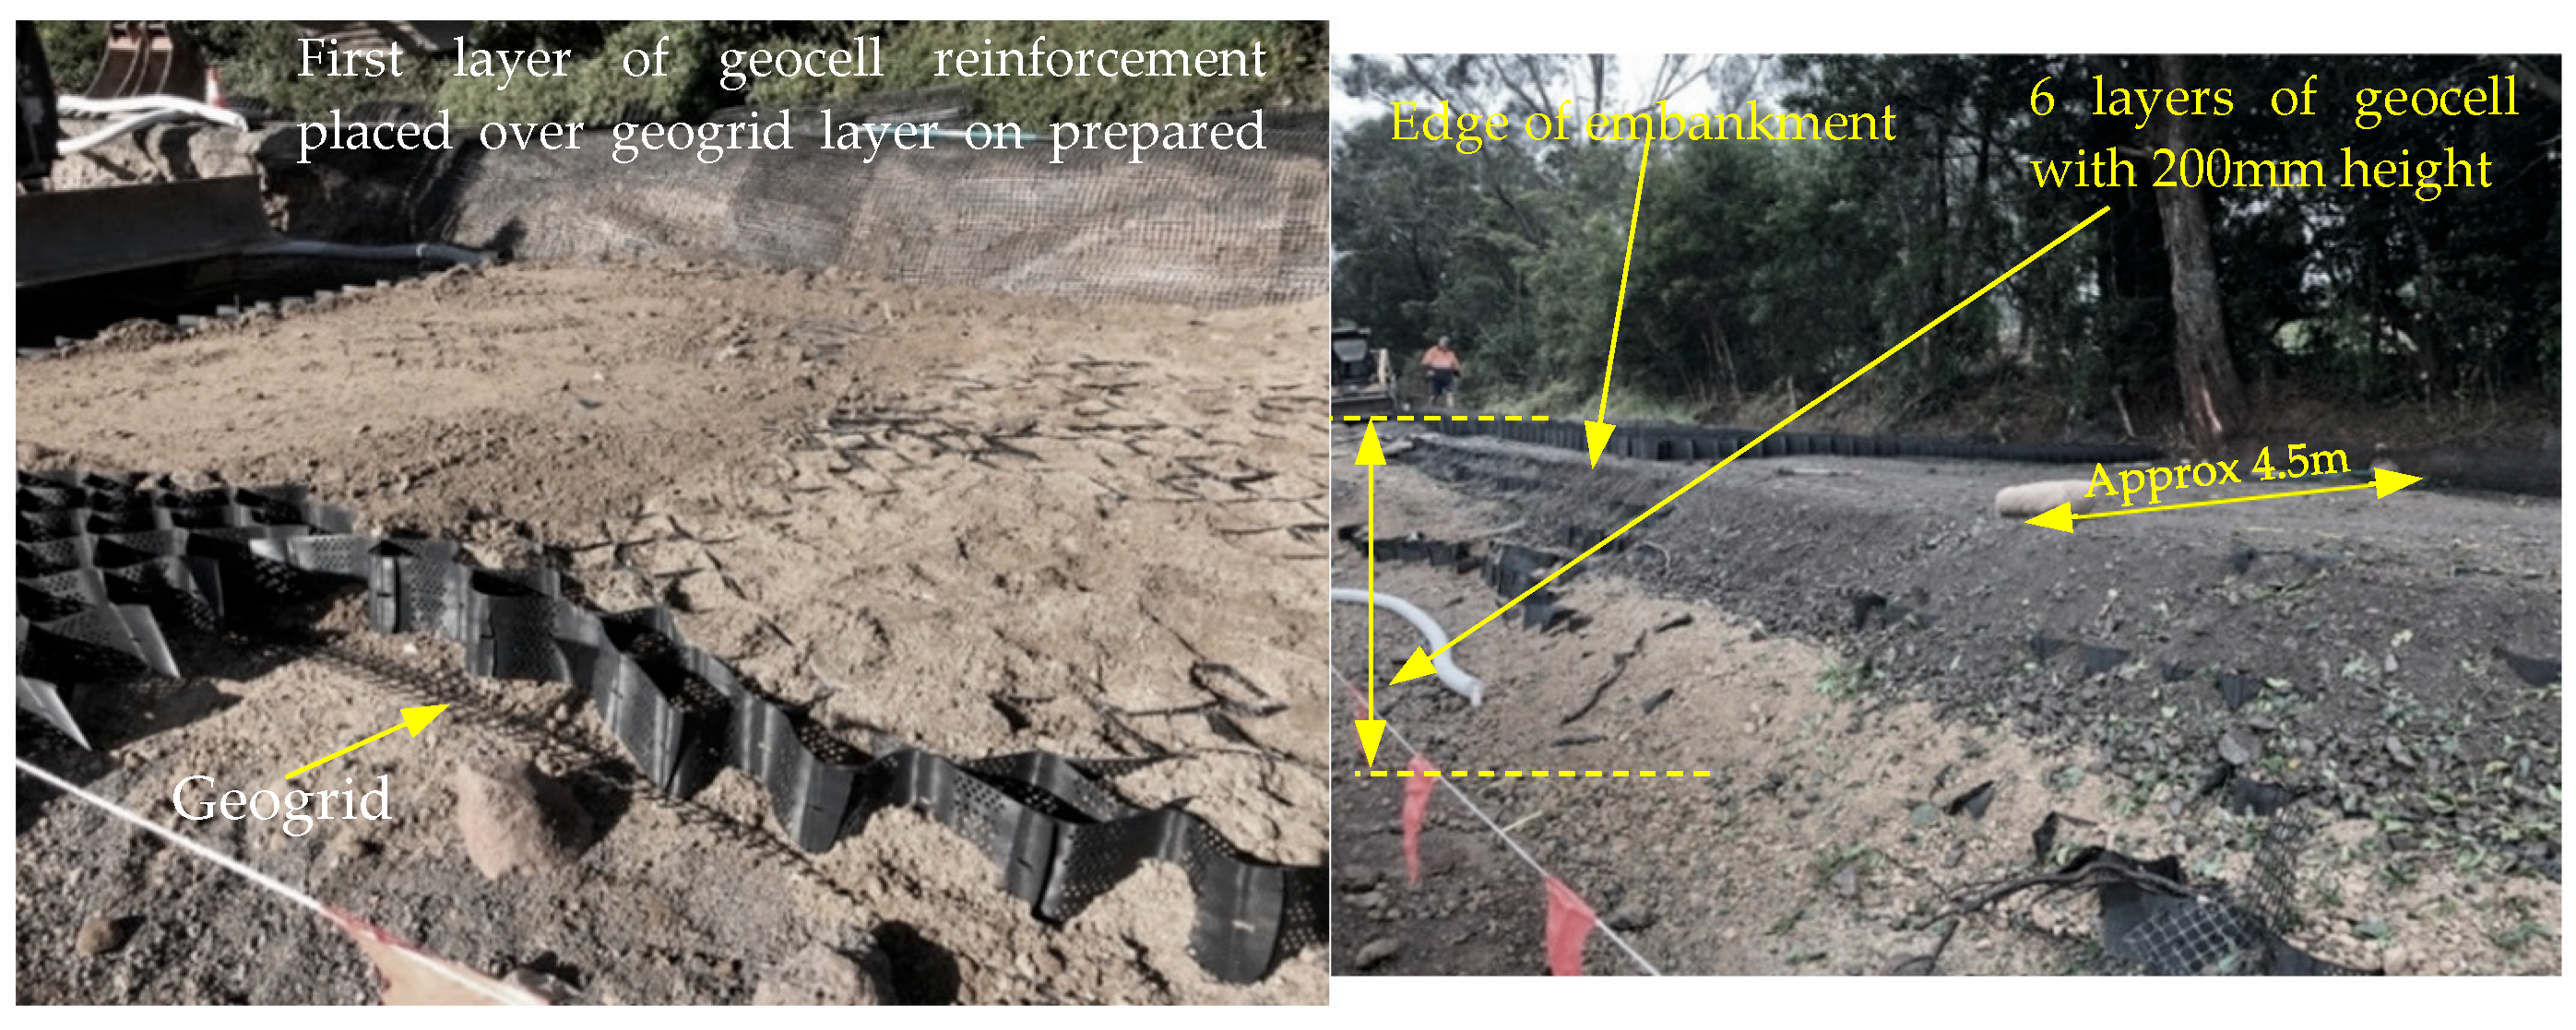
Having established representative geometry, groundwater conditions and material properties through the geotechnical assessment and limit equilibrium analyses, finite element analyses were subsequently undertaken to evaluate embankment deformation behaviour and investigate the confinement mechanism provided by the geocell reinforcement. A typical temporary Wattamolla Road embankment using a six-layer geocell mattress system are shown in
Figure 8.
7. Finite Element Analysis
A finite element model was developed to simulate the temporary road embankment, utilising material properties and geometry established from a prior back analysis [
1]. A two-dimensional (plane strain condition, intermediate principal stress (σ′
1, σ′
2, σ′
3 ≠ 0,
ε1,
ε3 ≠ 0 and
ε2 = 0) finite element analysis (FEA) was conducted using PLAXIS 2D [
30] to investigate the role of confining pressure on the embankment’s performance. The finite element model represented the full geometry of the landslide-affected embankment and underlying foundation profile. The upper 1.2 m of the embankment, corresponding to the six-layer geocell mattress, was modelled as the reinforced zone. The model geometry and material properties were adopted from the original geotechnical assessment.
The Mohr–Coulomb constitutive model with a linear elastic, perfectly plastic formulation was adopted under plane-strain conditions, with the groundwater level maintained at a high position throughout the analysis. The temporary road embankment was simulated using the finite element method (FEM) adopting the geometry and material properties established during the original geotechnical assessment and subsequent back analysis [
1].
To quantify the additional confining pressure provided by the geocell reinforcement, two distinct numerical models were constructed: one with a geocell-reinforced section and one with unreinforced material. For the geocell-reinforced case, an equivalent composite approach was employed, wherein the reinforced layer was modelled as a single homogeneous material with enhanced apparent cohesion, while the internal friction angle of the infill material was held constant. To calibrate this approach, different external confining pressures (external pressures, σ′
3 = 3, 6, 9, 12 kPa) were applied to the upper 1.2 m of the unreinforced embankment, simulating the effect of the geocell’s confinement. The geotechnical parameters used are listed in
Table 2 and
Table 3.
The impact of traffic surcharge was assessed by applying different surface surcharges (σ′
1 = 15, 20, and 30 kPa) to both the unreinforced and reinforced models. The lateral and vertical deformations from both model sets were then measured and compared under these varied loading and confinement scenarios (σ′
3 = 3, 6, 9, 12, 15 kPa). It should be noted that the groundwater level was maintained high (elevated groundwater) during the current assessment. Then, lateral and vertical deformations of unreinforced (subjected to lateral pressure) and reinforced geocell strips were measured. A summary modelling schedule adopted during current assessment is provided in
Table 4.
Limitations and Assumptions
The authors acknowledge that the pressure distribution over the height of geocell strips may not be a uniform distribution, as the middle of the geocell strip is expected to be subjected to the highest confinement pressure. Based on results of studies carried out by others [
13], it is understood that the middle of the geocell strip experiences the highest degree of mobilised tensile strength. In the current assessment, a uniform confining pressure was applied to the material, but this might slightly differ from the actual confinement induced by geocell in the field. In a typical road embankment, the magnitude of σ′3 might change slightly at a different height, so in the field, a uniform lateral displacement of the material may not occur.
The authors acknowledge that the current study is based on a two-dimensional plane-strain finite element model and therefore does not fully capture the complex three-dimensional stress state that develops within geocell-reinforced soil systems. In practice, the reinforcement mechanism is governed by stress interactions in all three principal directions, and the magnitude of confinement may be influenced by the geometry of the reinforced zone, loading configuration, and boundary conditions. Nevertheless, the plane-strain assumption provides a practical and widely adopted approach for evaluating the behaviour of reinforced transportation infrastructure and allows a direct comparison with previous studies reported in the literature. The purpose of the present study was not to replicate the full three-dimensional response, but rather to investigate the equivalent confinement effect of geocell reinforcement under representative field conditions. Future research should consider advanced three-dimensional numerical modelling and field monitoring data to better quantify the distribution of confinement stresses within the reinforced layer and further validate the mechanisms identified in this study.
The current assessment assumes that the additional confinement generated by the geocell is uniformly distributed over the height of the reinforced layer. In reality, laboratory and numerical investigations have demonstrated that hoop stresses and tensile strains are not uniformly mobilised throughout the geocell wall, with peak confinement generally occurring near the mid-height of the geocell pockets. Consequently, the confinement pressures adopted in this study should be interpreted as equivalent average confinement pressures acting on the reinforced layer. While this simplification is considered appropriate for the objectives of the present study, it may not fully capture localised stress concentrations and deformation patterns within the geocell–soil composite. Future investigations incorporating explicit geocell geometry and three-dimensional numerical analyses are recommended to better quantify the influence of non-uniform confinement on the performance of geocell-reinforced embankments.
Another limitation of the present study is the absence of field monitoring data for calibration and validation of the finite element model. The temporary remediation works were completed as part of an emergency response programme, and no instrumentation data, such as settlement measurements, lateral deformation monitoring, or pore pressure records, were available to the authors. Accordingly, the analysis should be interpreted as a comparative numerical investigation of geocell confinement mechanisms rather than a direct prediction of measured field performance. Future studies incorporating field monitoring and long-term performance data would be valuable for validating the numerical approach and improving confidence in the derived confinement pressures.
8. Results and Discussions
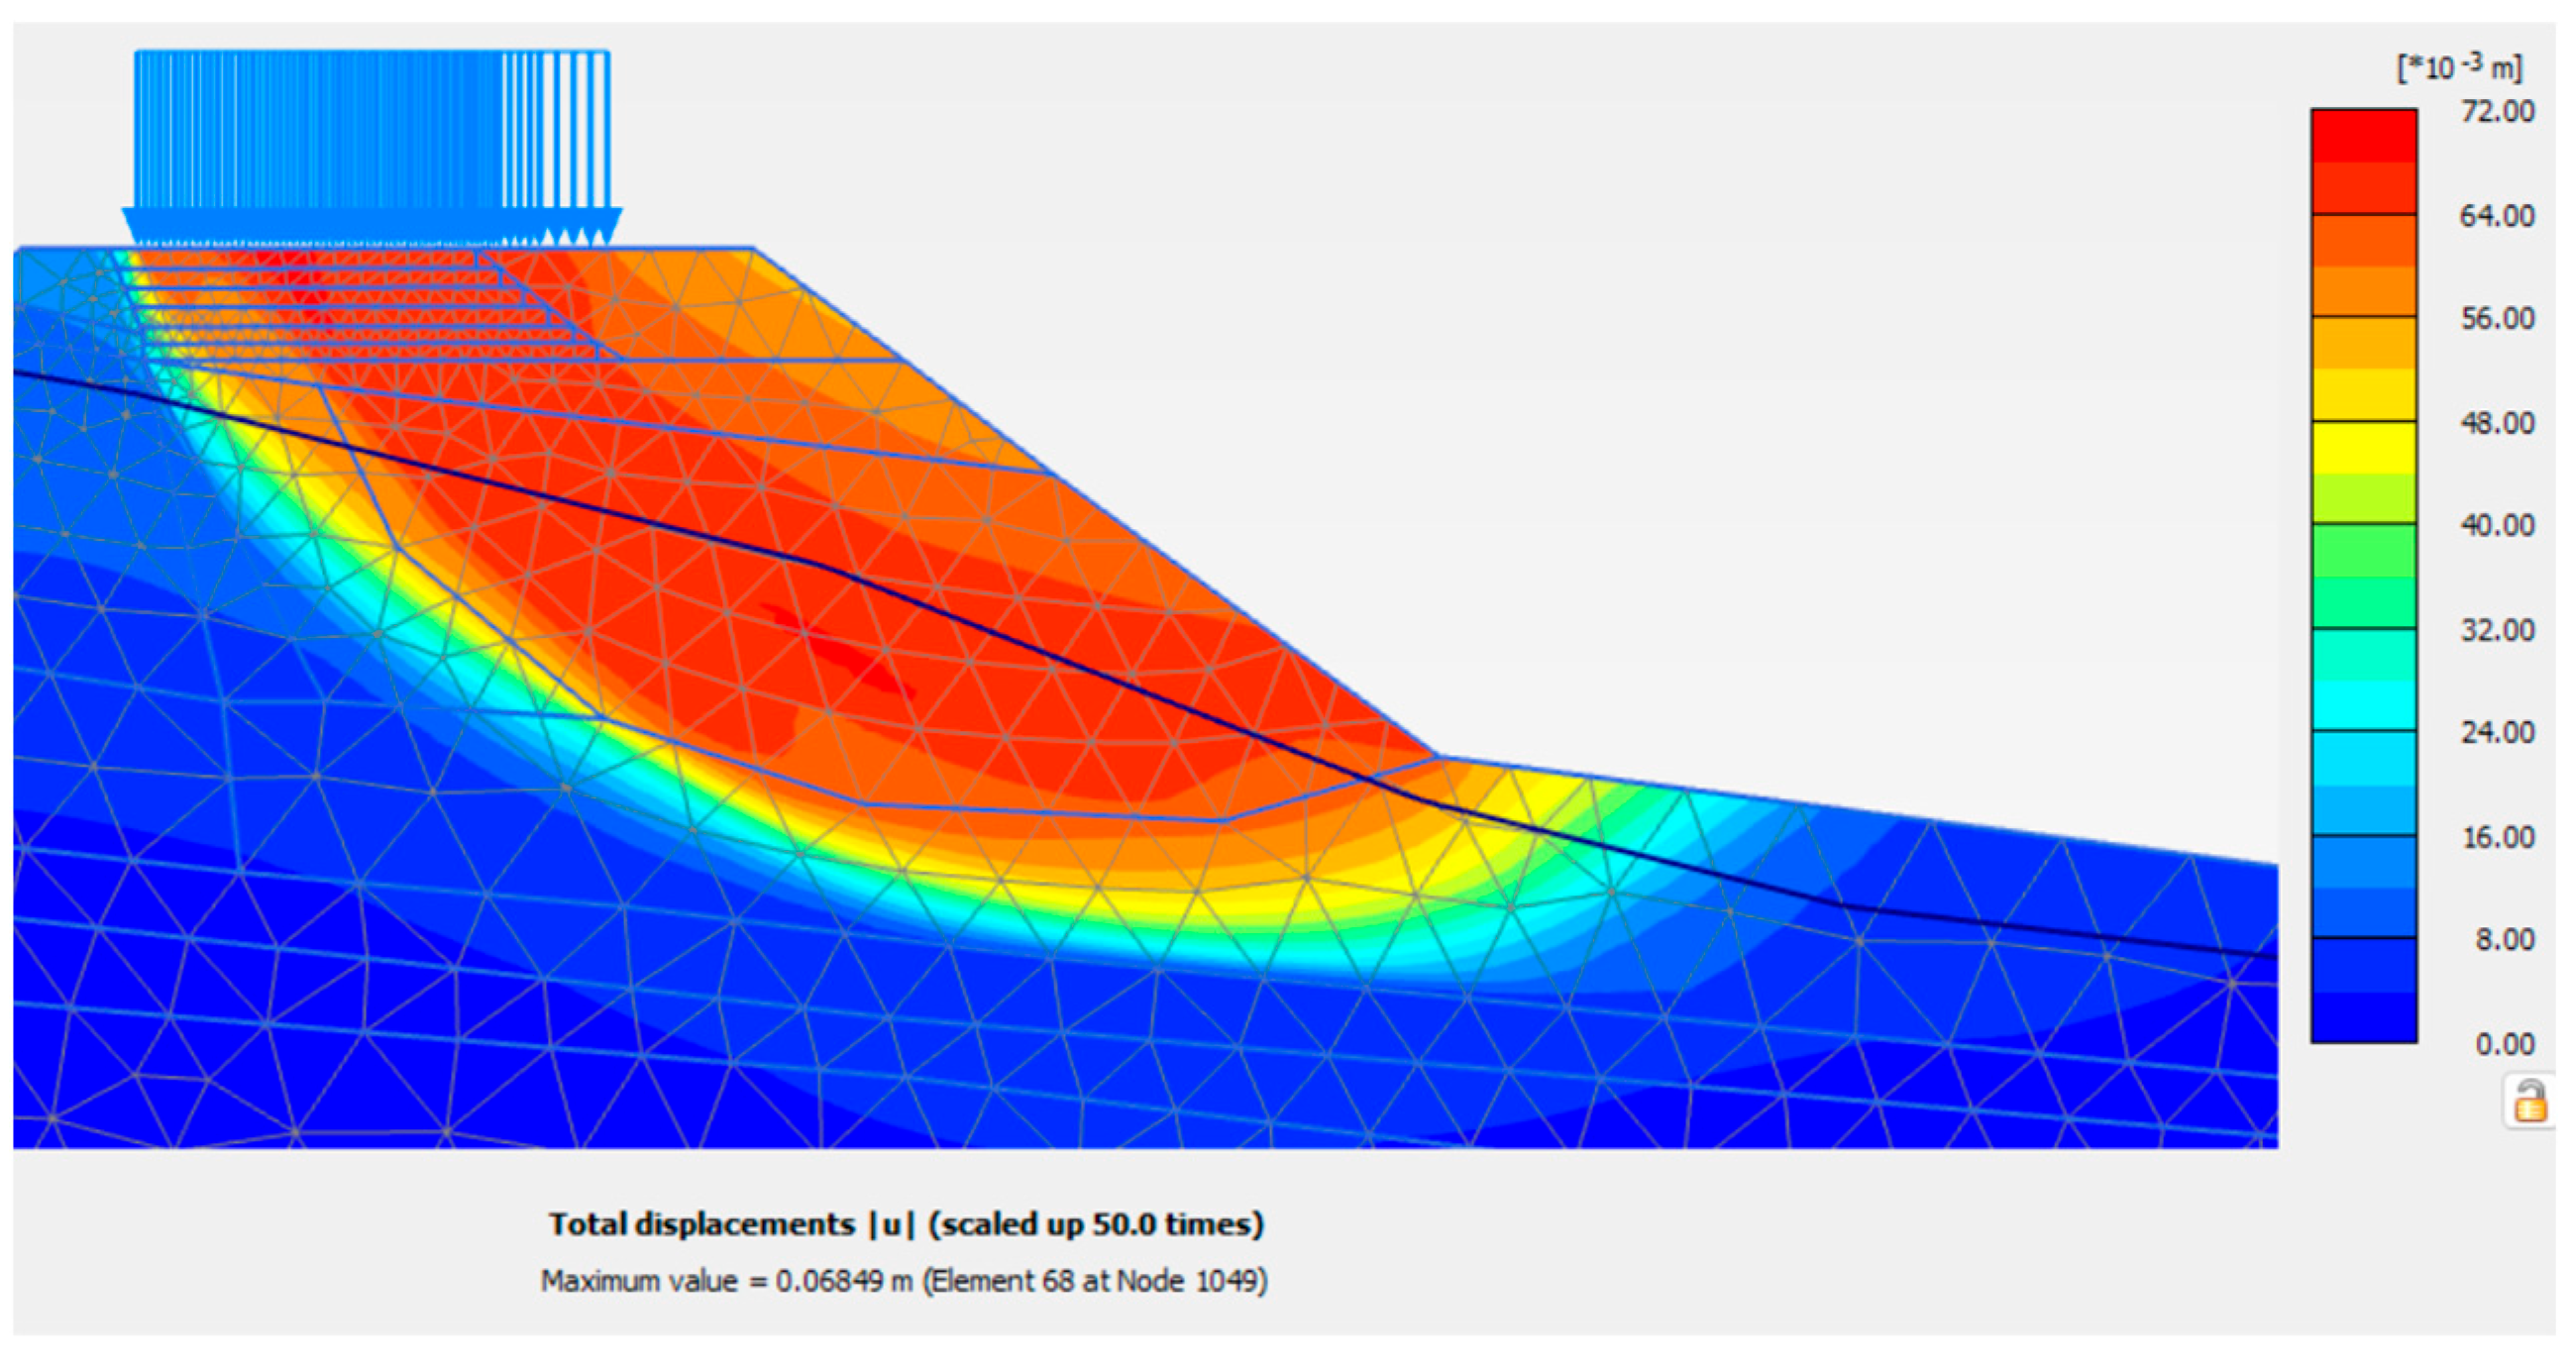
Figure 9 shows a typical deformation profile of the embankment predicted by FEM at the onset of landslide. Finite element analyses indicated the road embankment experienced excessive lateral and vertical deformations, which could be attributed to a significant decrease in shear strength of the underlying soil as a result of high groundwater level caused by wet conditions.
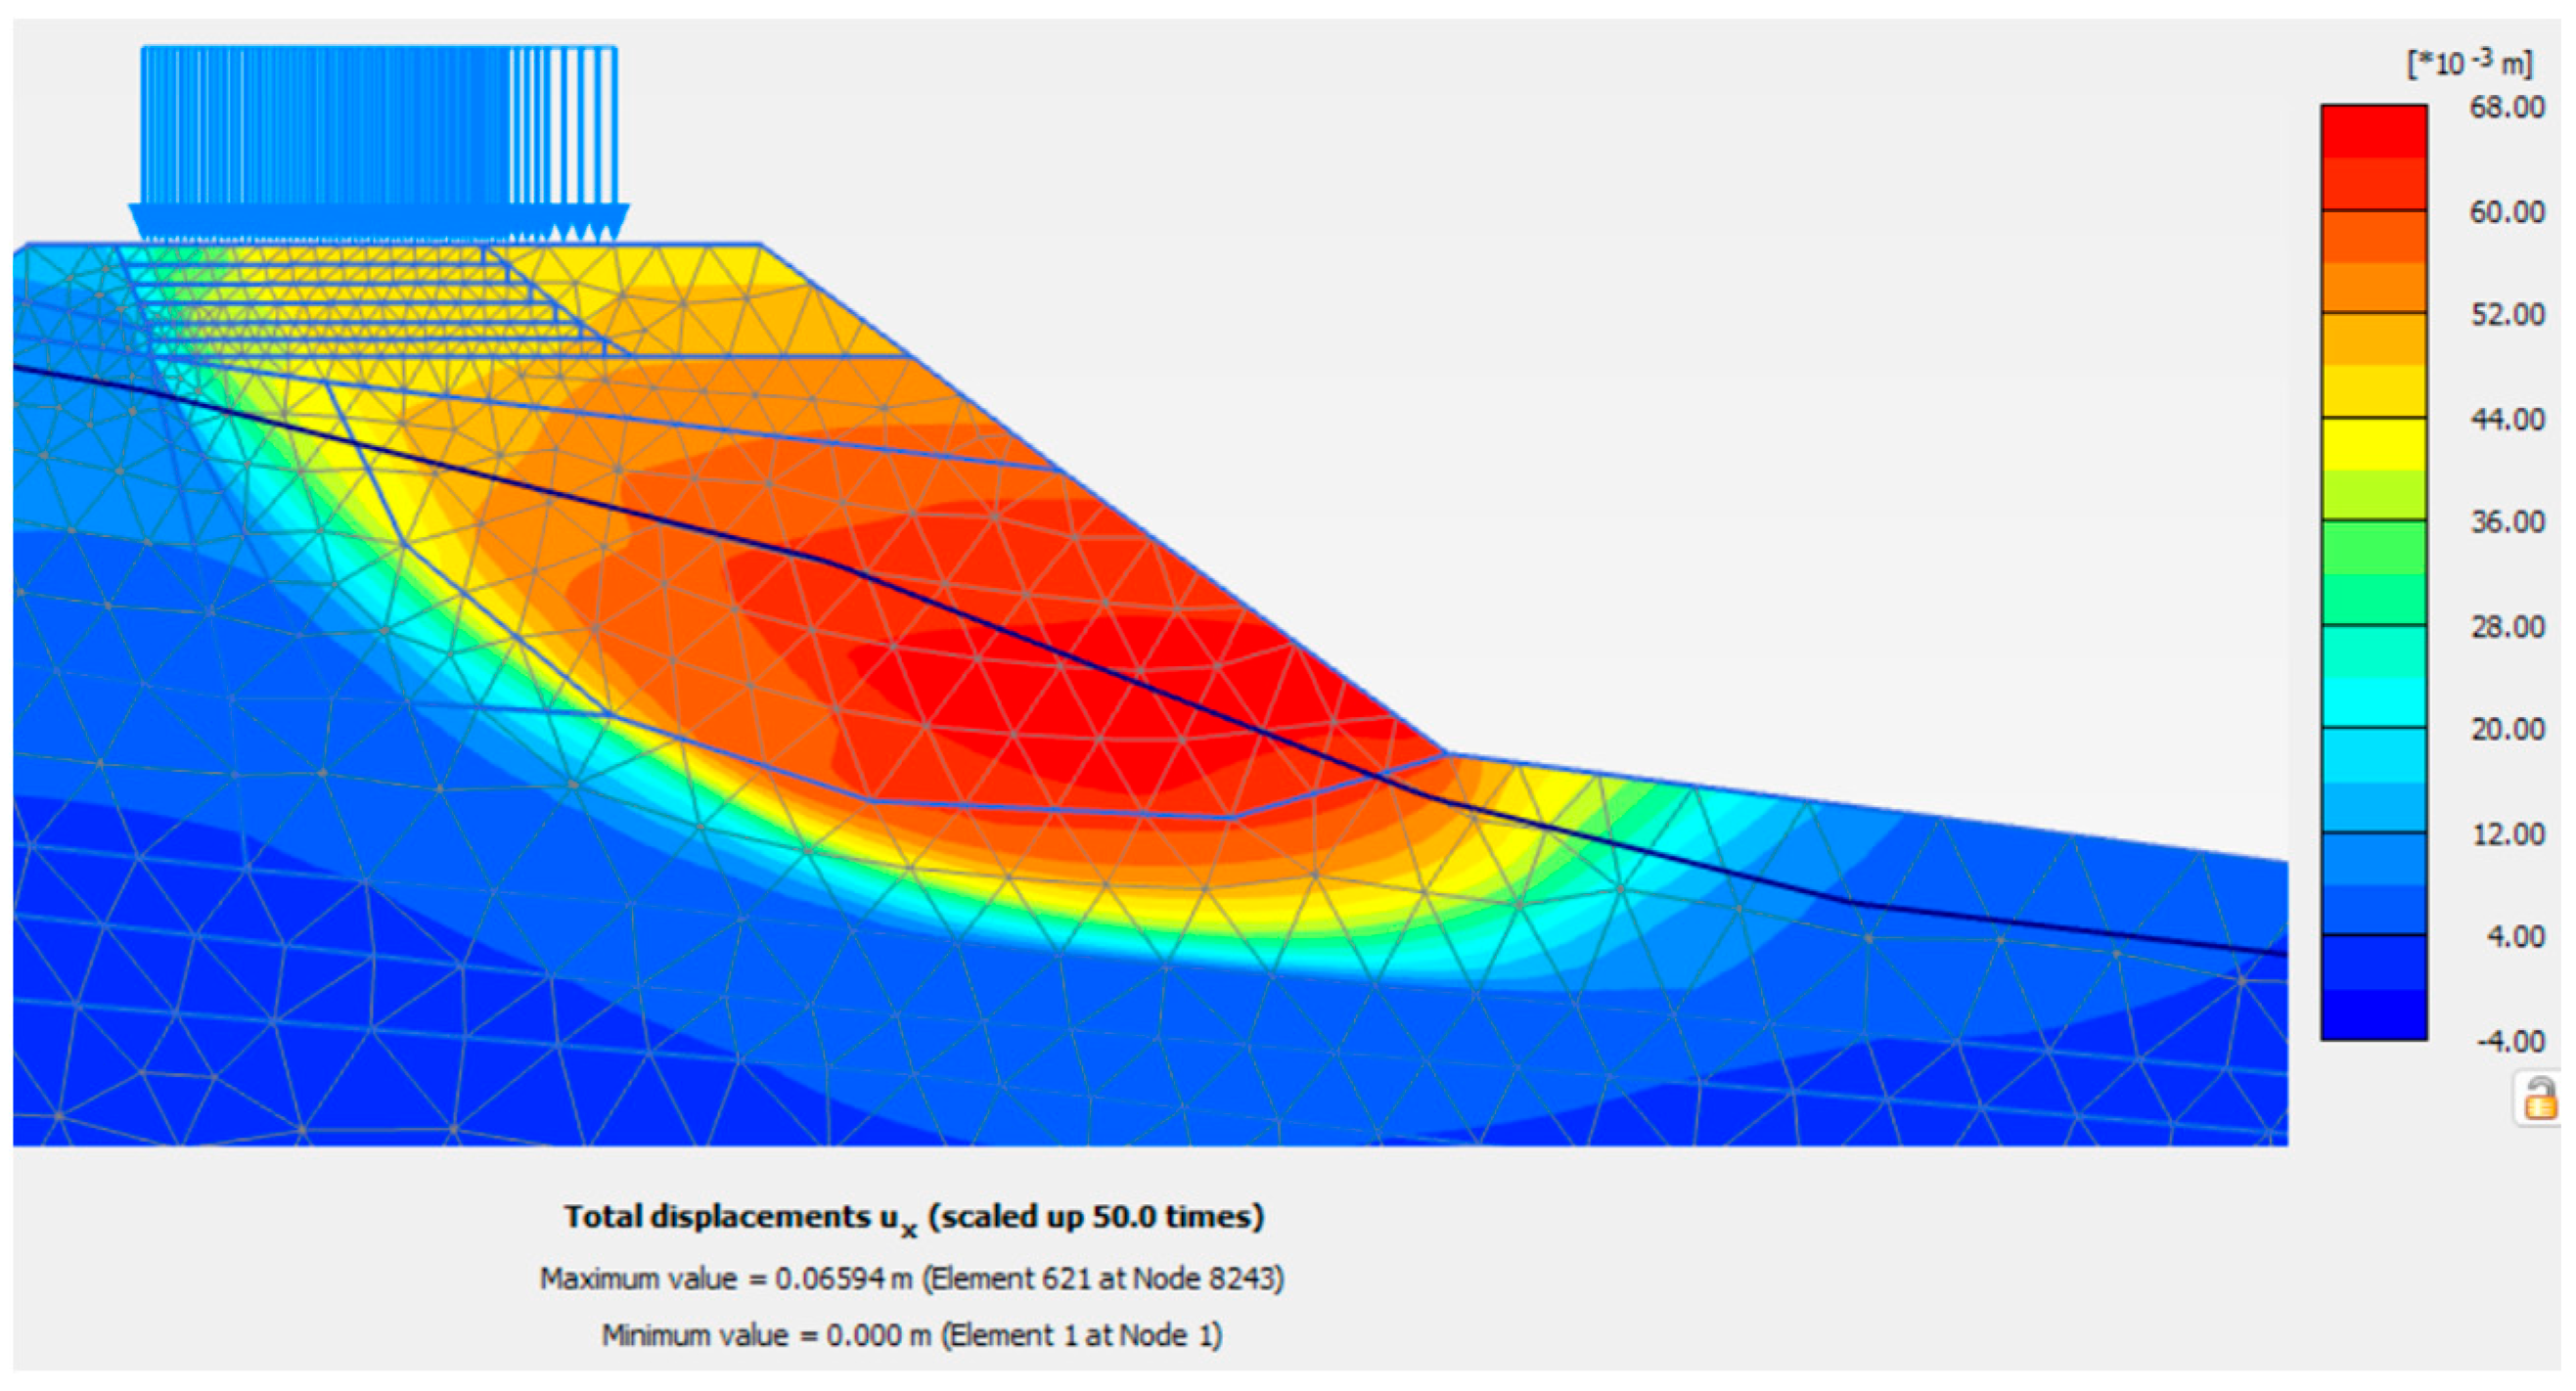
Figure 10 shows the typical lateral deformations of the embankment at the onset of the landslide. Excessive lateral deformations at the toe of the embankment appear to have accelerated at the road embankment toe.
Additional assessment was carried out, while the upper 1.2 m of the road embankment was modelled as a geocell-reinforced layer (equivalent composite soil layer).
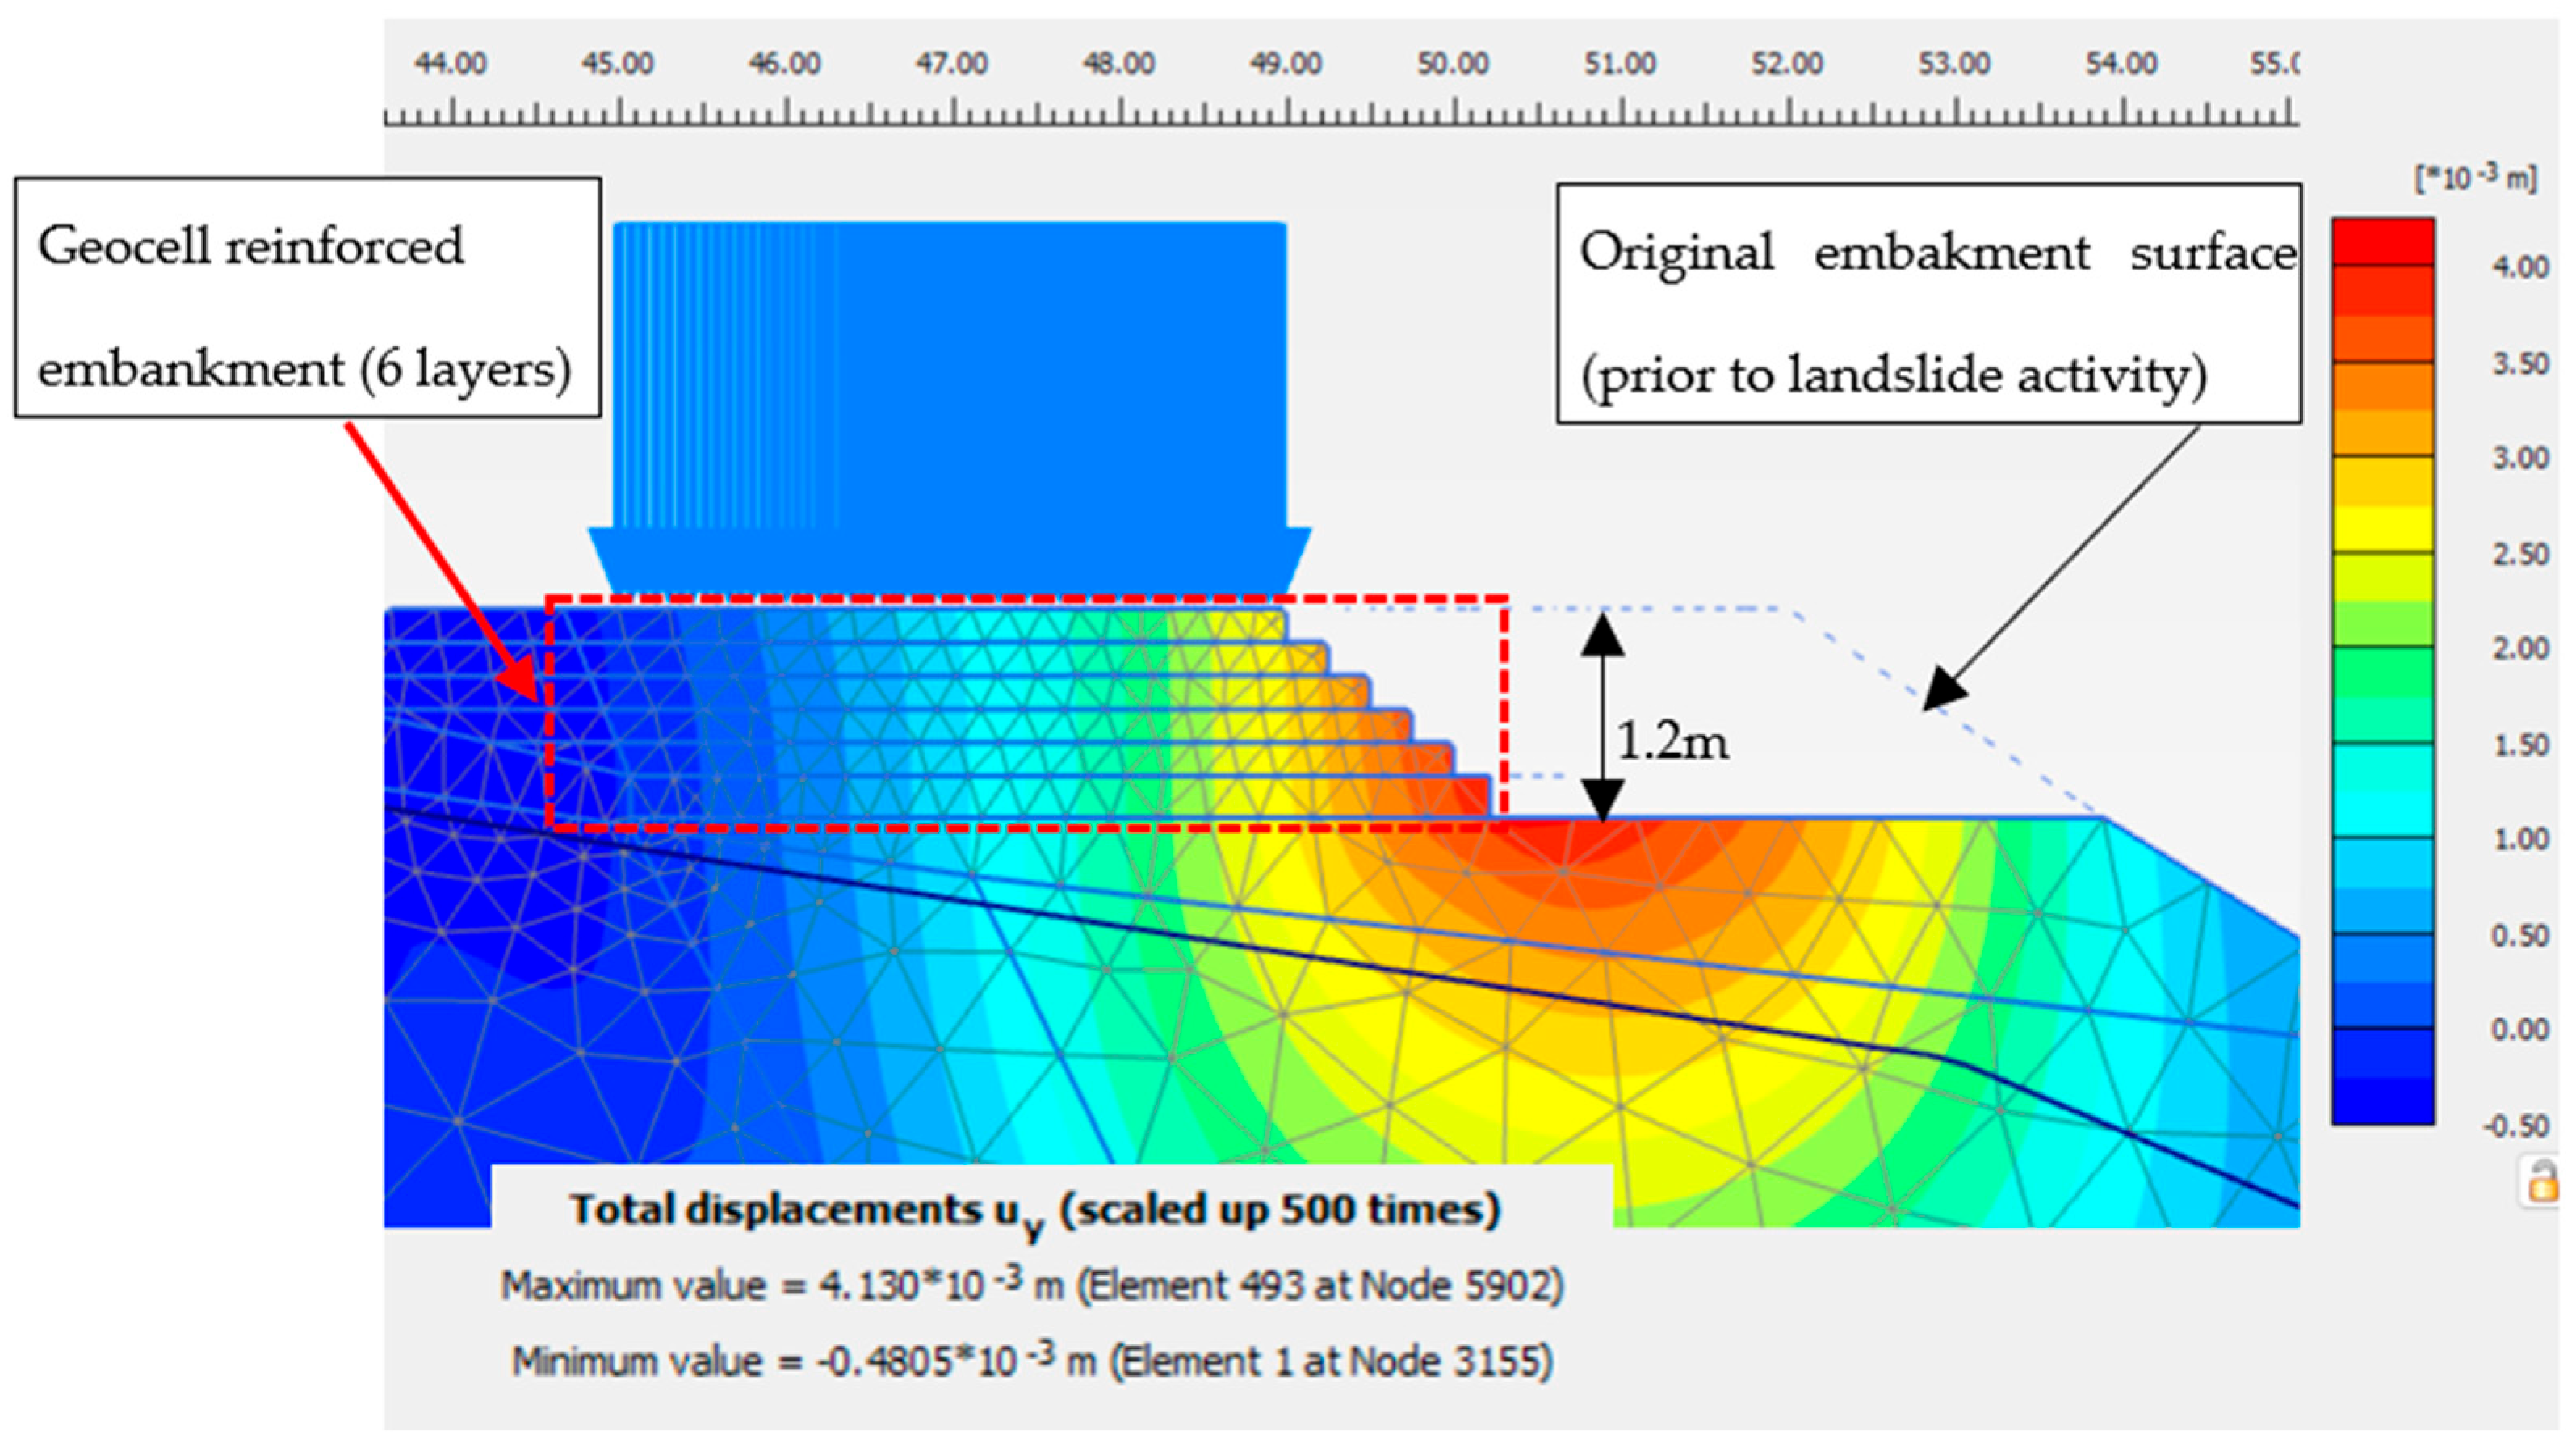
Figure 11 shows the general deformation of the road embankment after construction of geocell-reinforced layers, with a high groundwater level, and the road embankment being subjected to a 15 kPa traffic surcharge.
Finite element analyses demonstrated that geocell reinforcement reduced lateral deformation and improved load distribution within the landslide-affected zone. It should be noted that the majority of the road embankment is constructed over the saturated soil layers with relatively very low shear strength (i.e., failure plane). Marginal heaving was noted at the toe of the geocell-reinforced embankment. However, by introducing additional confinement, the geocell effectively arrests lateral spreading and reduces axial deformations of the in-fill materials.
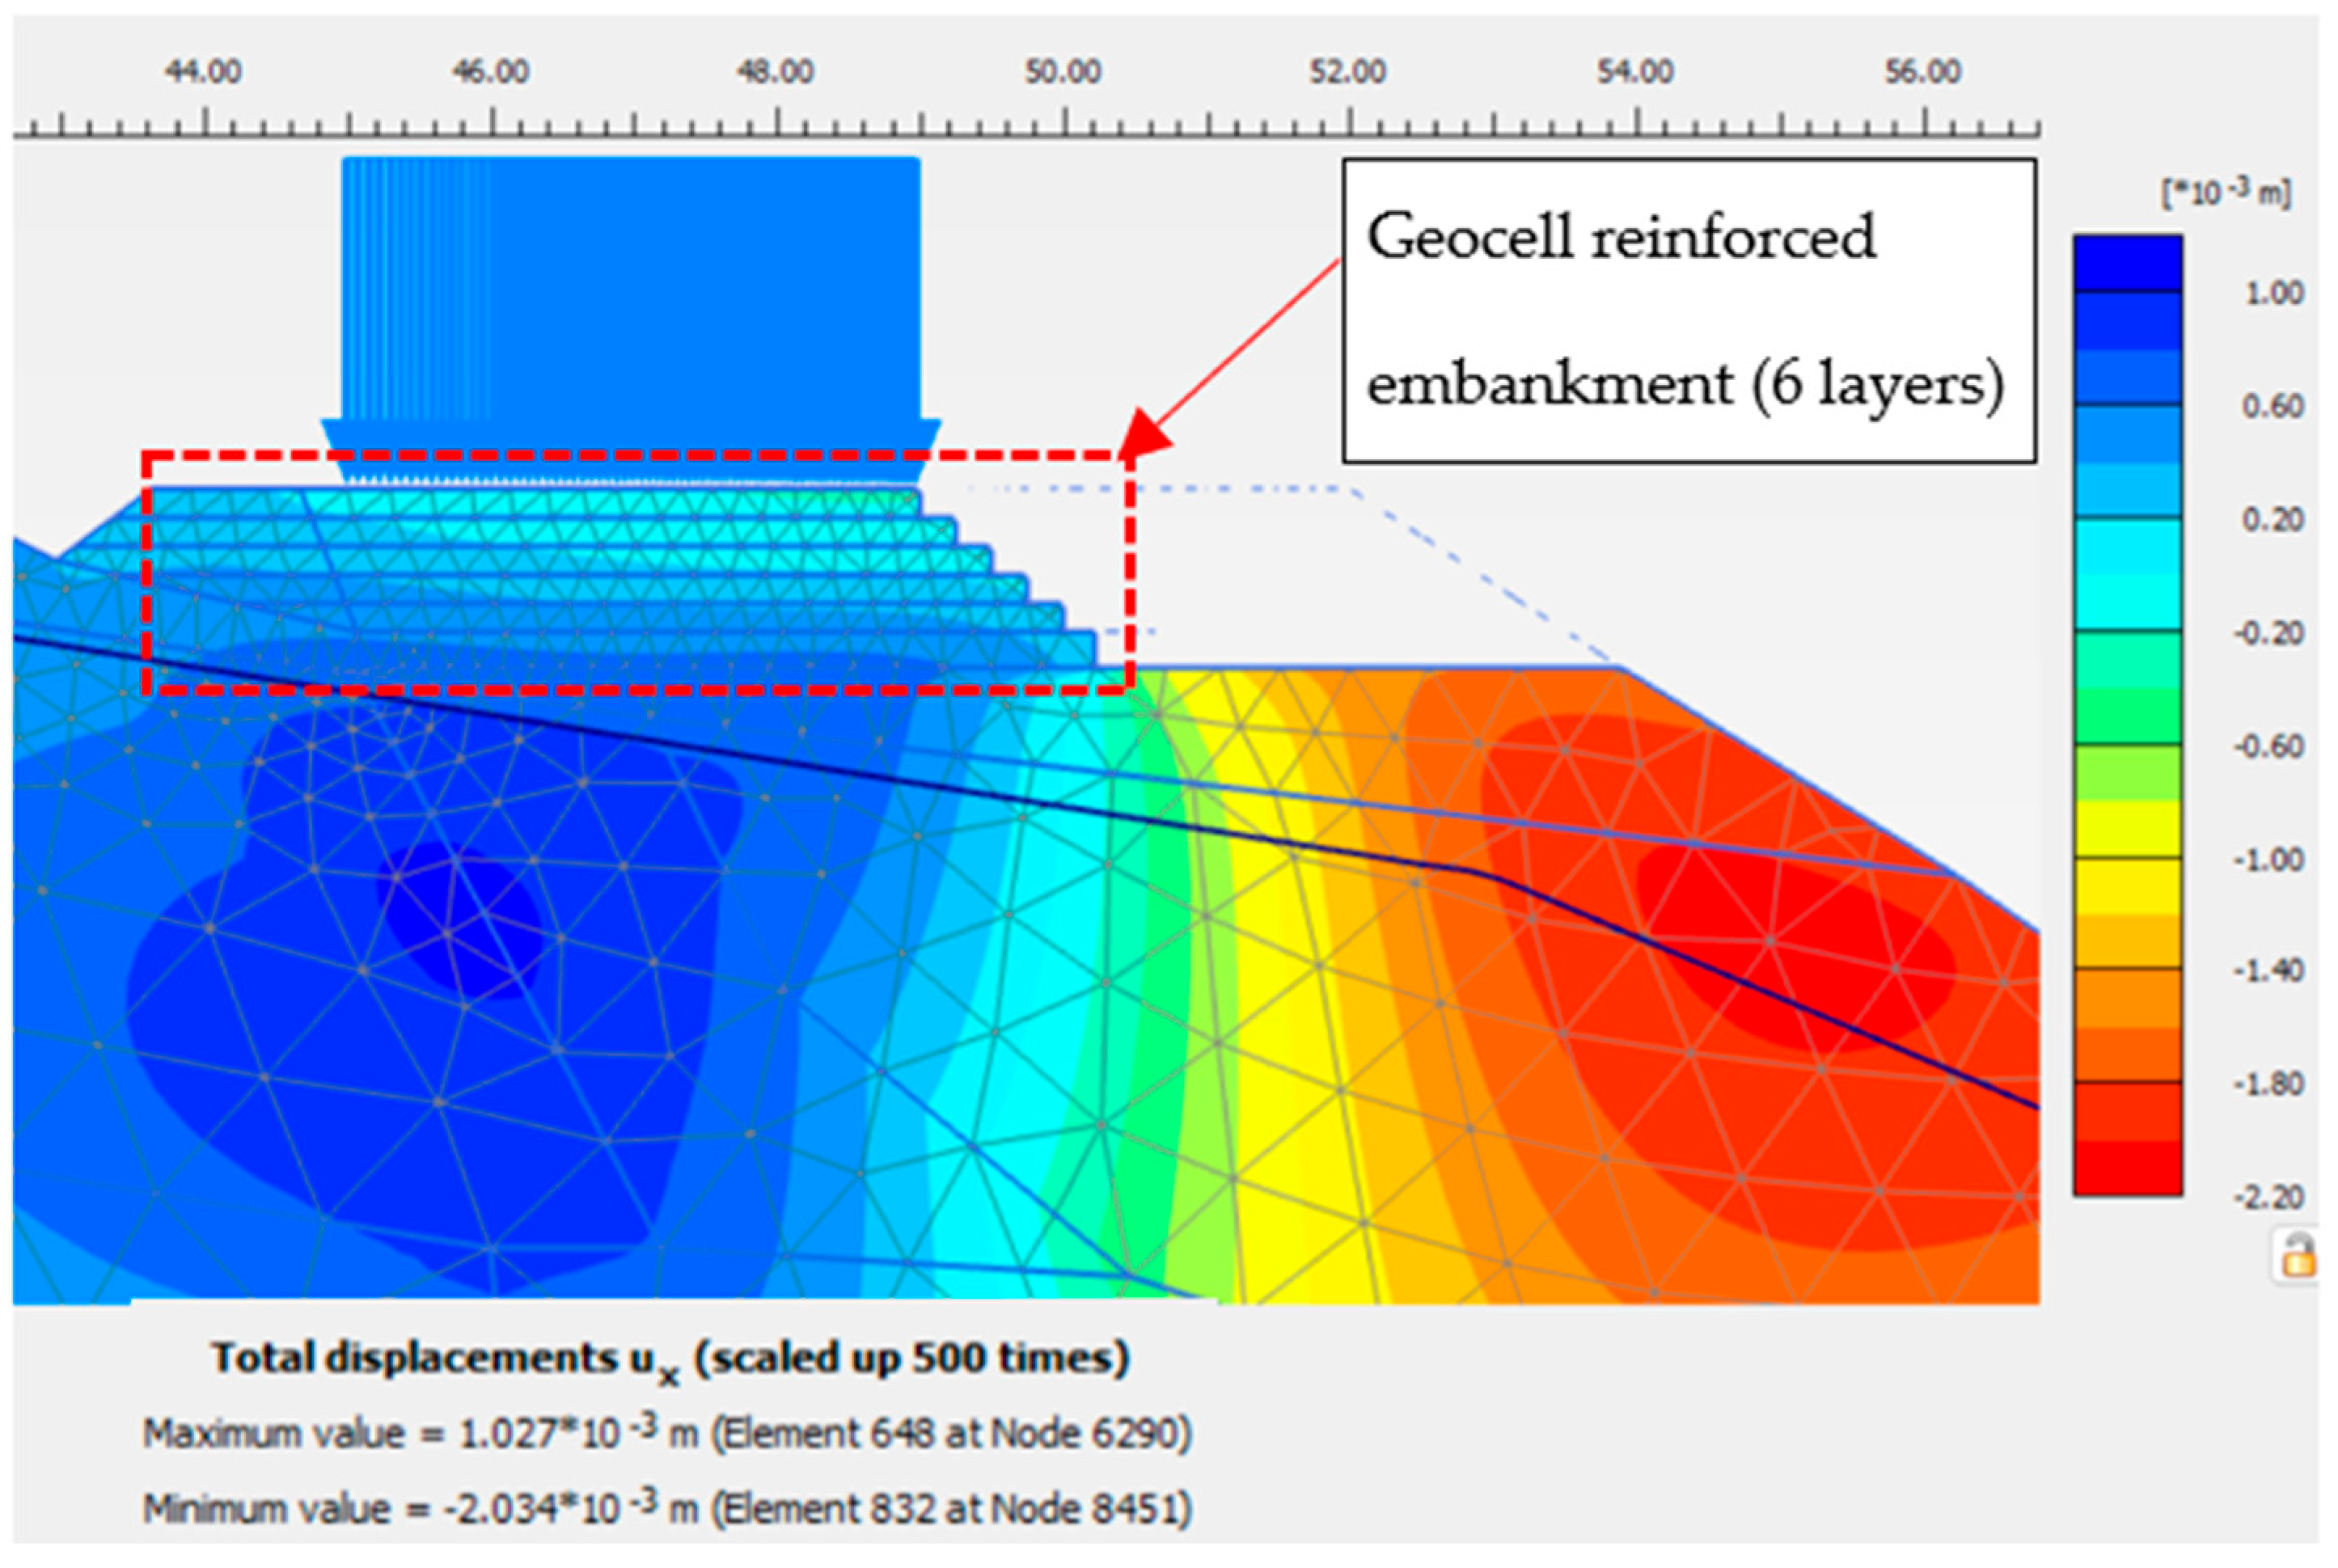
As shown in
Figure 12, except for marginal heaving at the toe of the temporary road embankment, no significant lateral deformations are observed along the embankment batter when the embankment is constructed using geocell reinforcement. These results indicate that the geocell confines the infill material and forms a quasi-rigid mattress, thereby increasing the stiffness of the reinforced layer and reducing lateral deformations.
9. Unreinforced Embankment: Baseline Analysis and Confinement Calibration
A baseline finite element model was established for a section of the temporary road embankment, measuring 1.2 m in height and 8 m in width, comprising only fill material without reinforcement. The material properties used in this analysis are provided in
Table 3. To quantify the confining effect equivalent to that of a geocell, a series of simulations were conducted where different magnitudes of external lateral pressure (σ′
3 = 3, 6, 9, and 12 kPa) were applied to the upper 1.2 m of the unreinforced embankment. A uniform surcharge of 15 kPa was applied to the surface to simulate traffic loading. The lateral and vertical deformations of the unreinforced embankment under these varying confining pressures were then recorded.
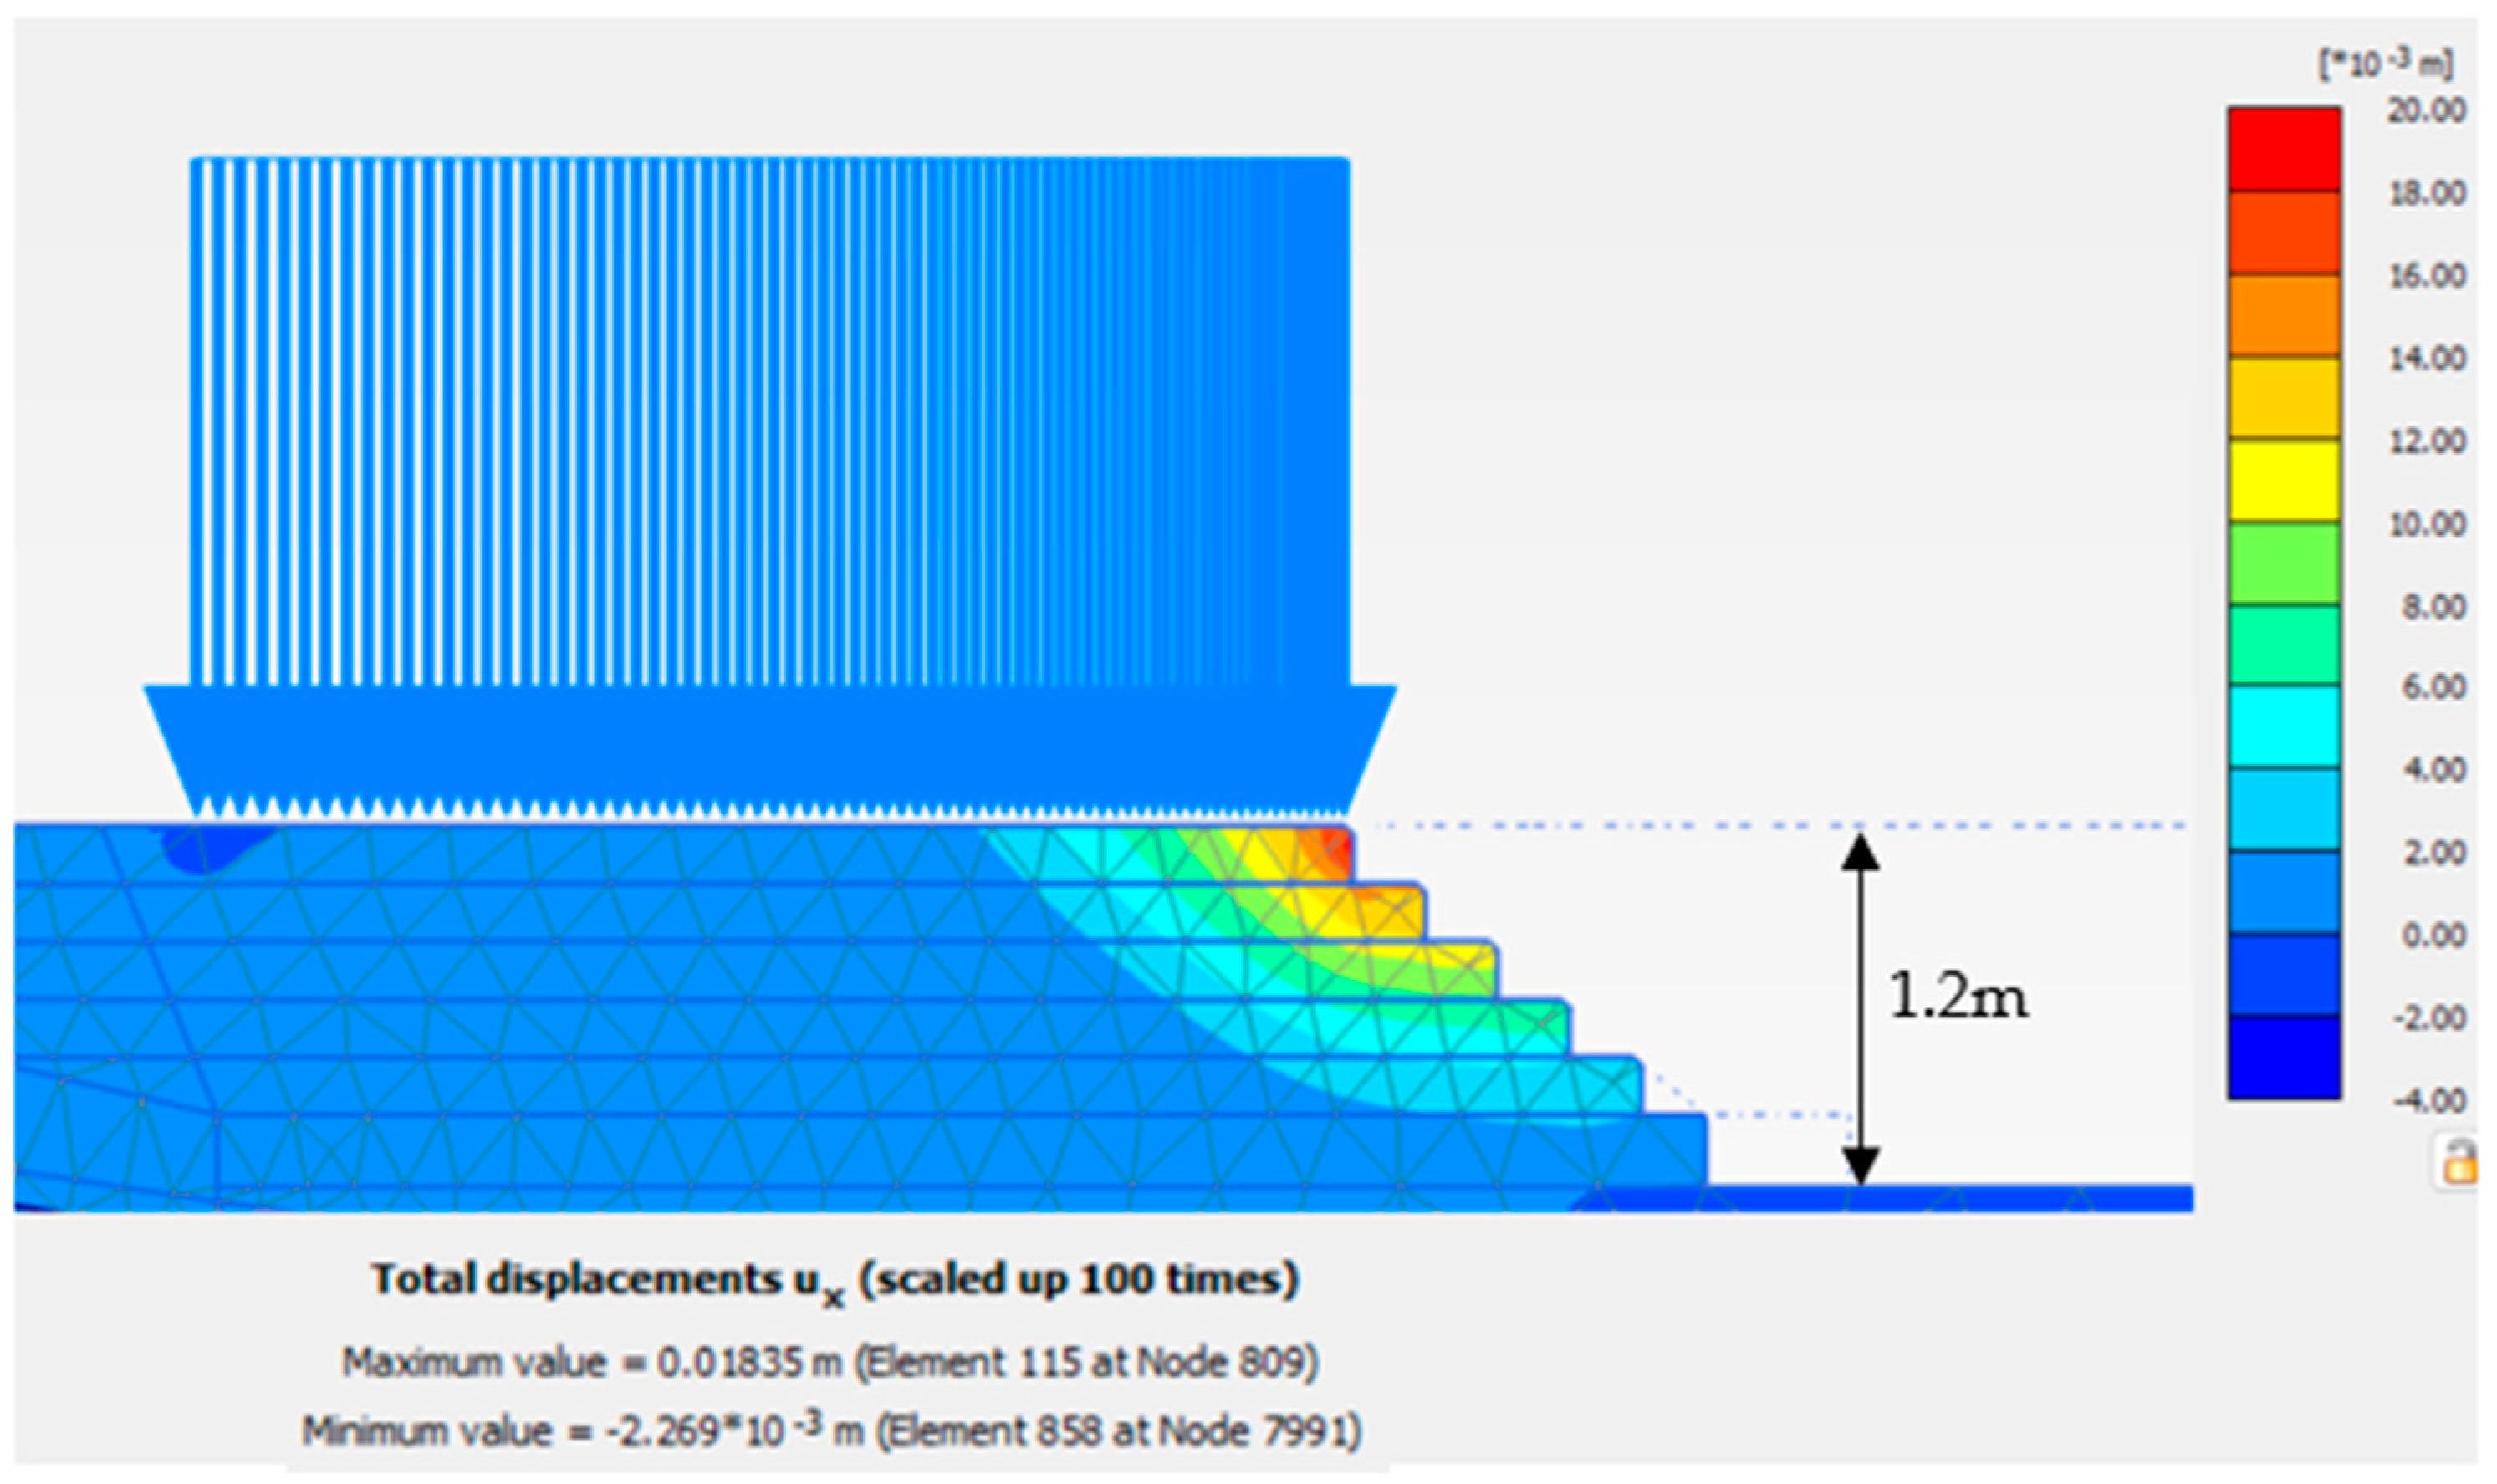
The finite element analysis of the unreinforced embankment with no applied lateral pressure revealed a distinct failure surface, exhibiting significant lateral deformations of approximately 20 mm towards the embankment edge.
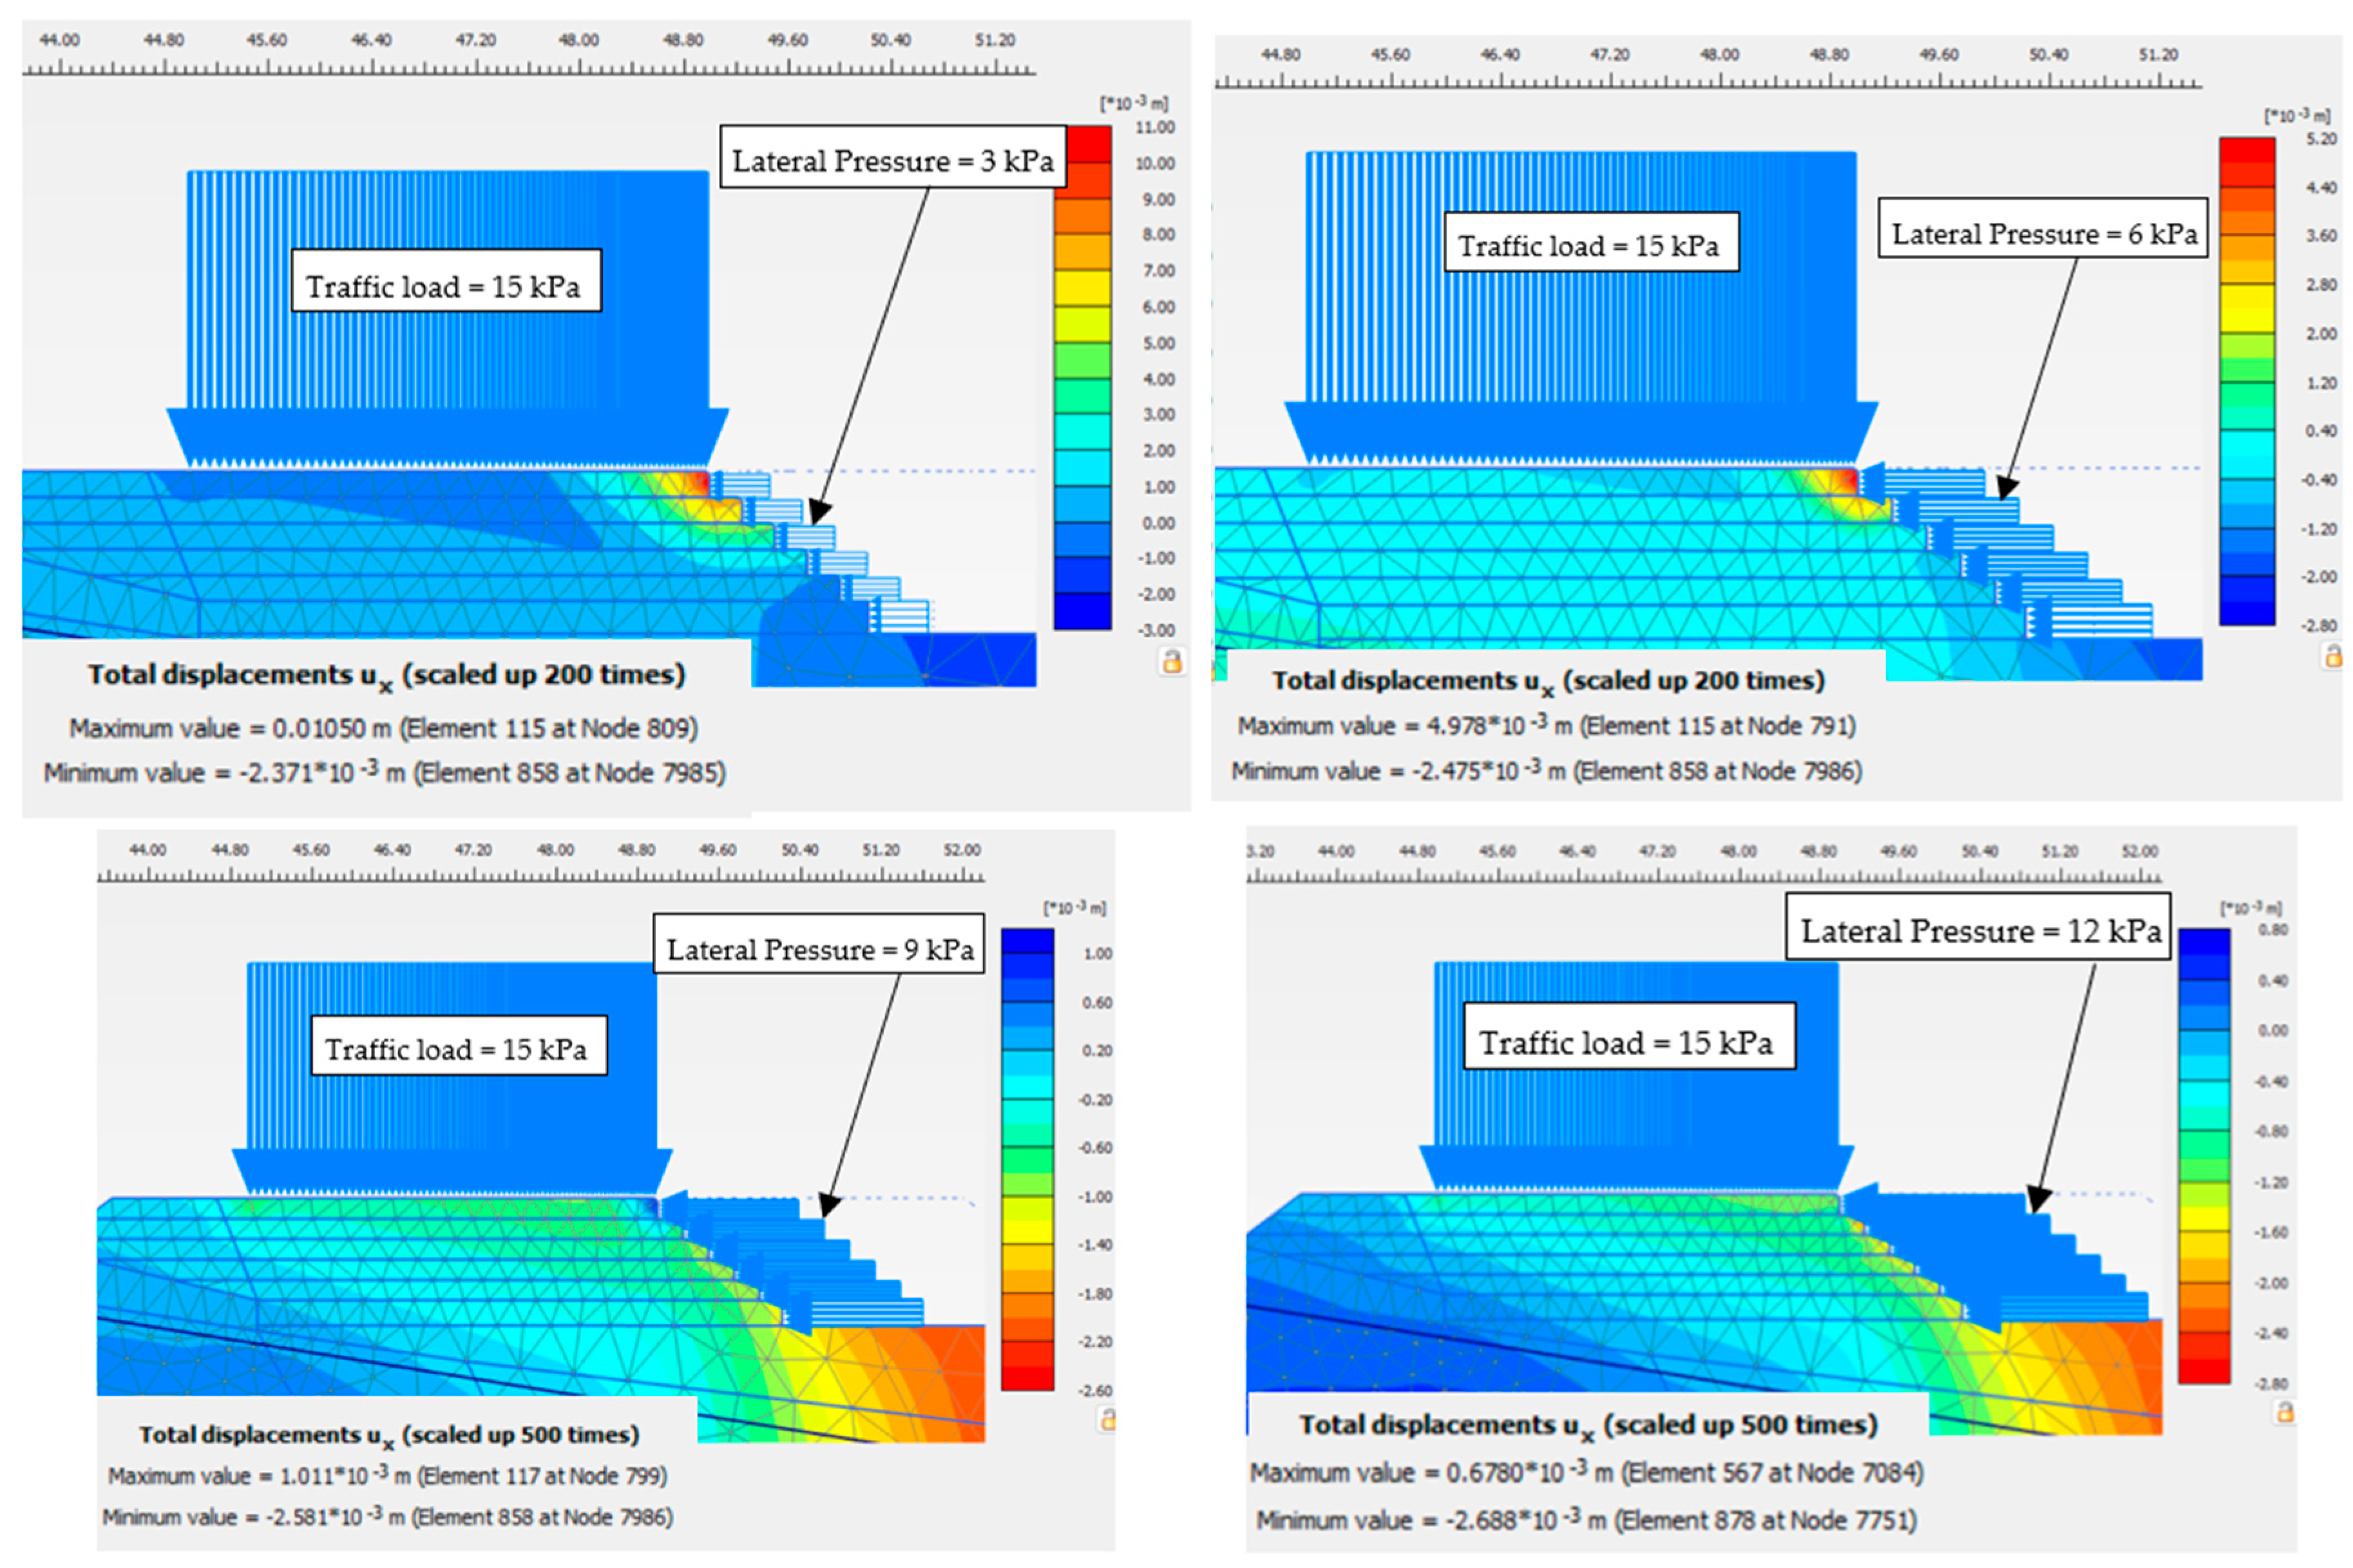
Figure 13 illustrates the typical deformation contours from the FEM for the unreinforced road embankment under different lateral pressures.
The application of external lateral confinement markedly reduced these deformations. As shown in
Figure 14, results demonstrate that lateral spreading was effectively mitigated, with deformations reduced to approximately 1 mm when a confining pressure (σ′
3) of 9 kPa was applied. A marginal further reduction in deformation was observed at a higher pressure (σ′
3 = 12 kPa), indicating that the beneficial effect of confinement begins to plateau beyond an optimal threshold.
The results indicate that the deformation response of the geocell-reinforced embankment is comparable to that of an unreinforced embankment subjected to approximately 9 kPa of lateral confinement. This finding suggests that the geocell reinforcement mobilised an equivalent confinement pressure of approximately 9 kPa under a traffic surcharge of 15 kPa.
9.1. Higher Traffic Load
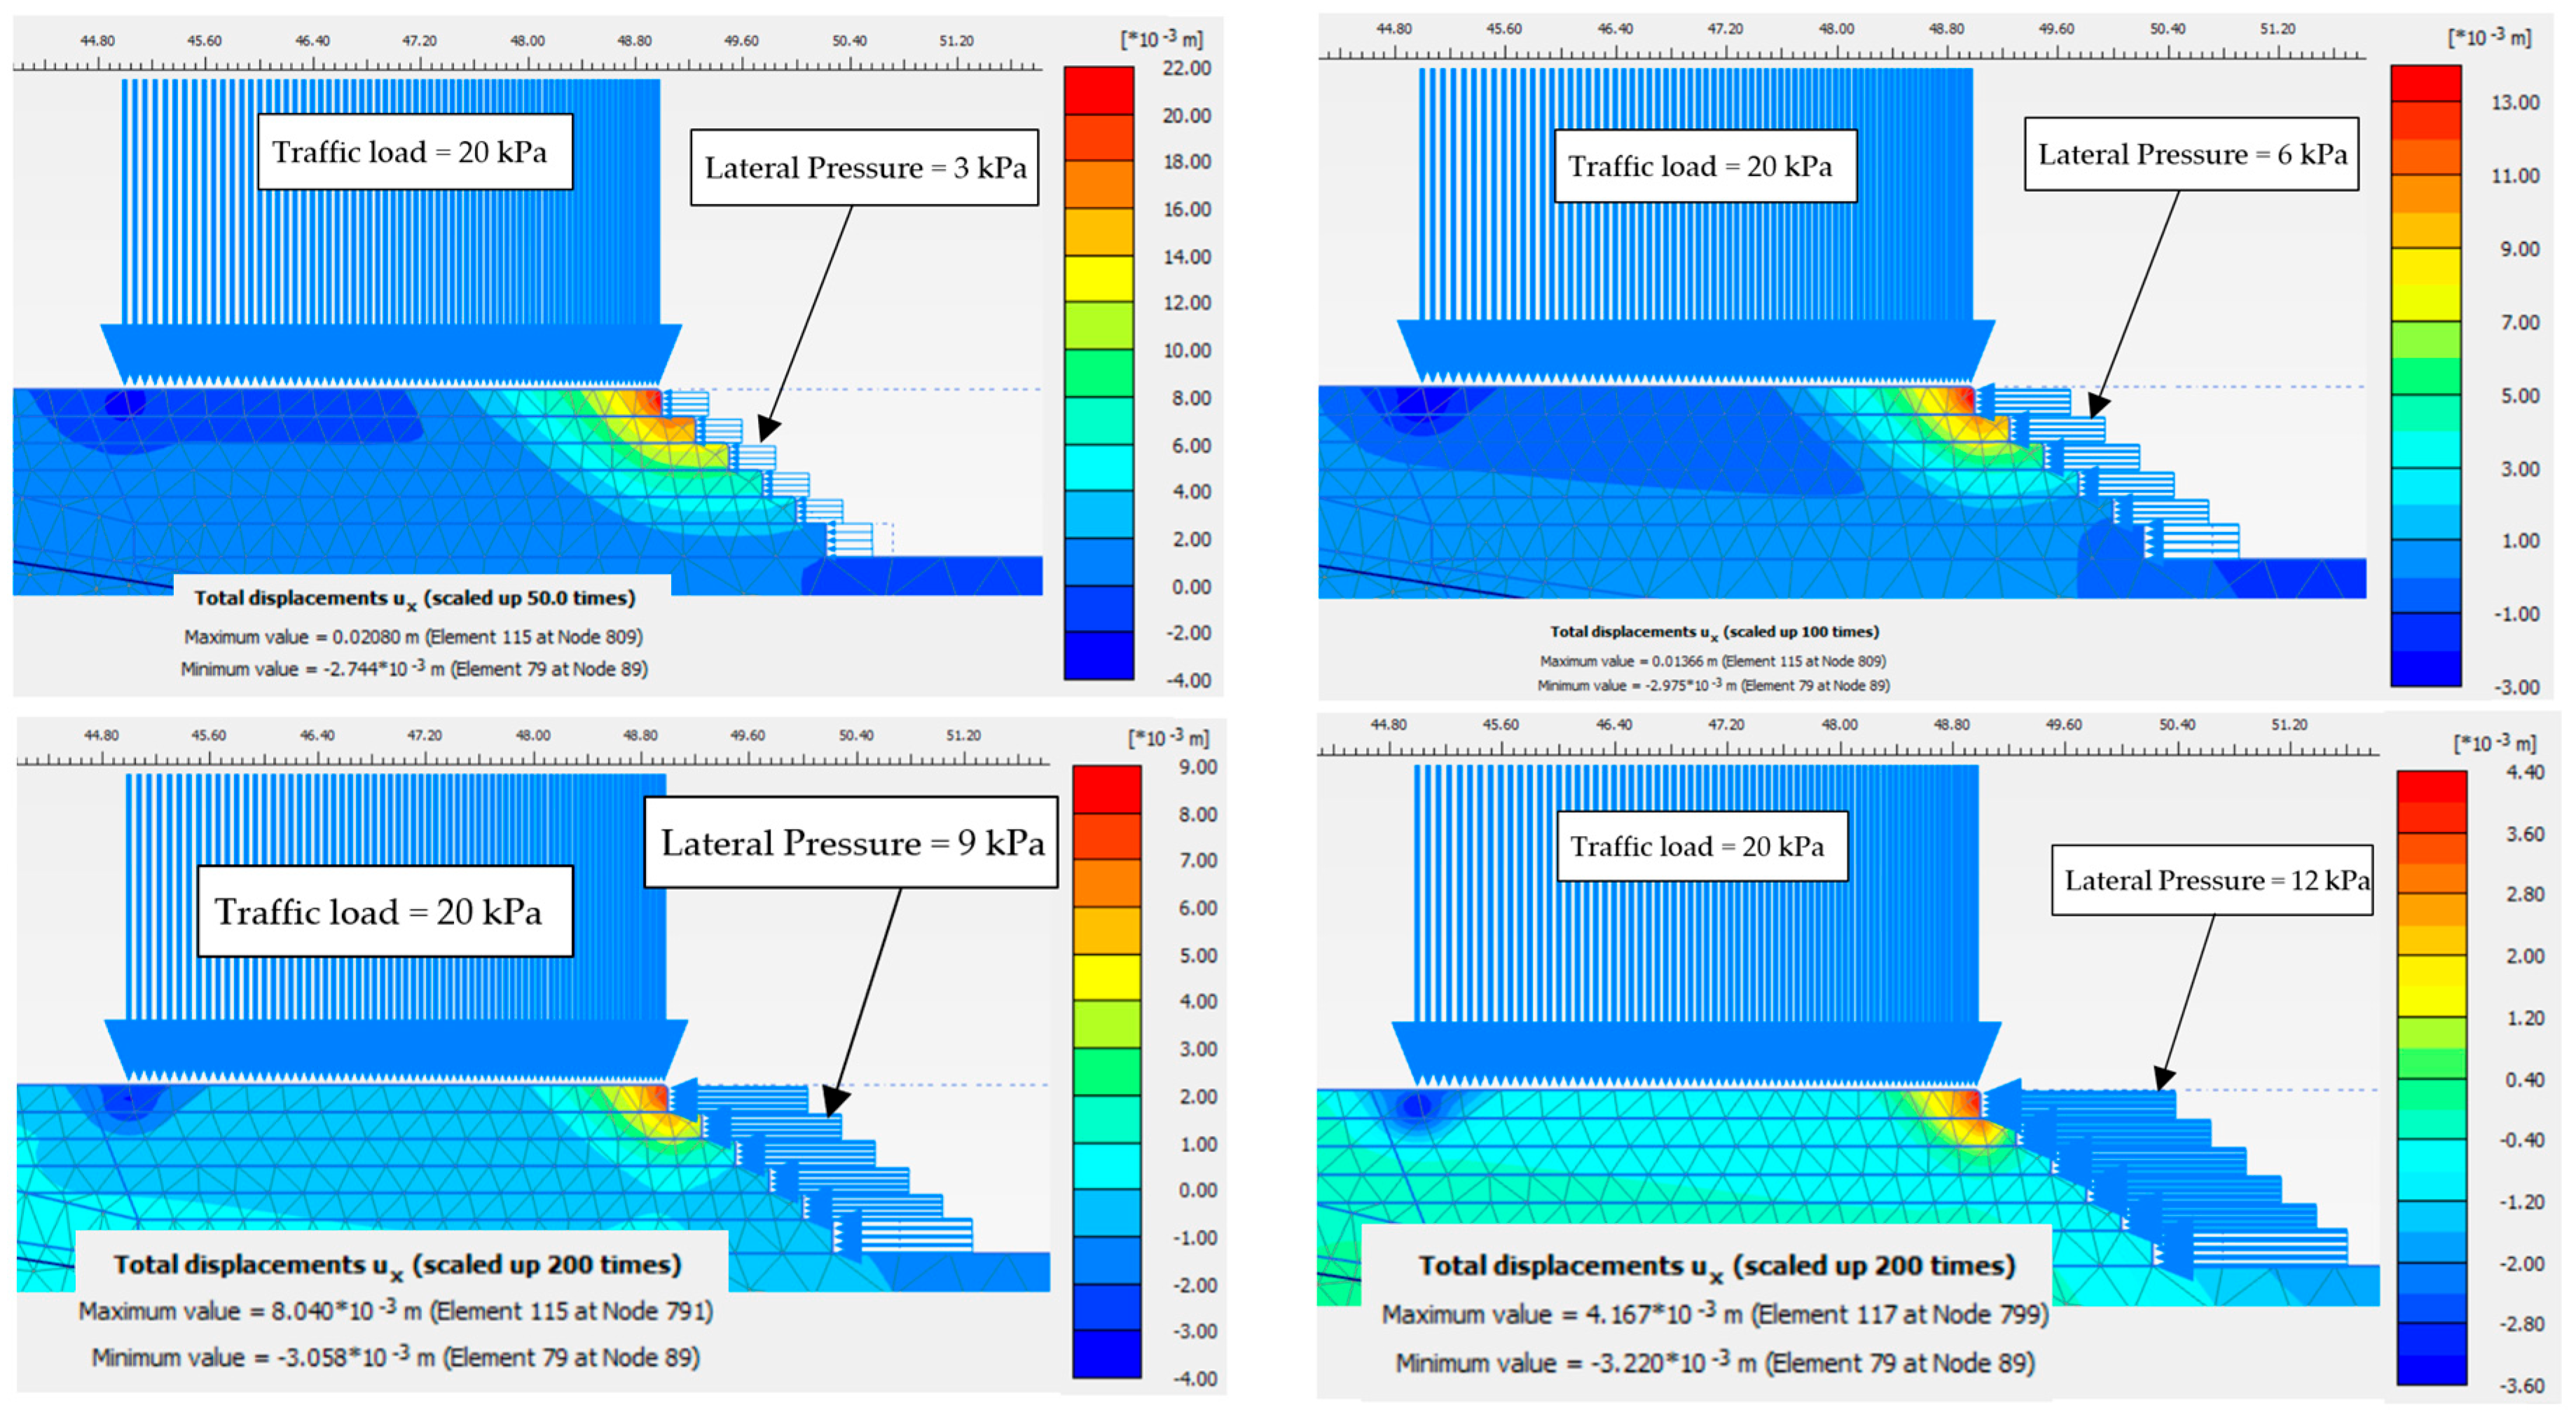
To investigate the impact of traffic load on the overall performance of the road embankment and to assess degrees of additional confinement at different rates of surcharge, a series of FEM simulations were carried out with higher traffic loads. In these assessments, different simulations were conducted at different traffic loads, including 20 and 30 kPa. Different rates of lateral (external) pressures (i.e., σ′3 = 3, 6, 9, 12 kPa and 15 kPa) were applied to the upper section (1.2 m height) of unreinforced embankment. Also, in these simulations, an elevated (high) groundwater level was maintained.
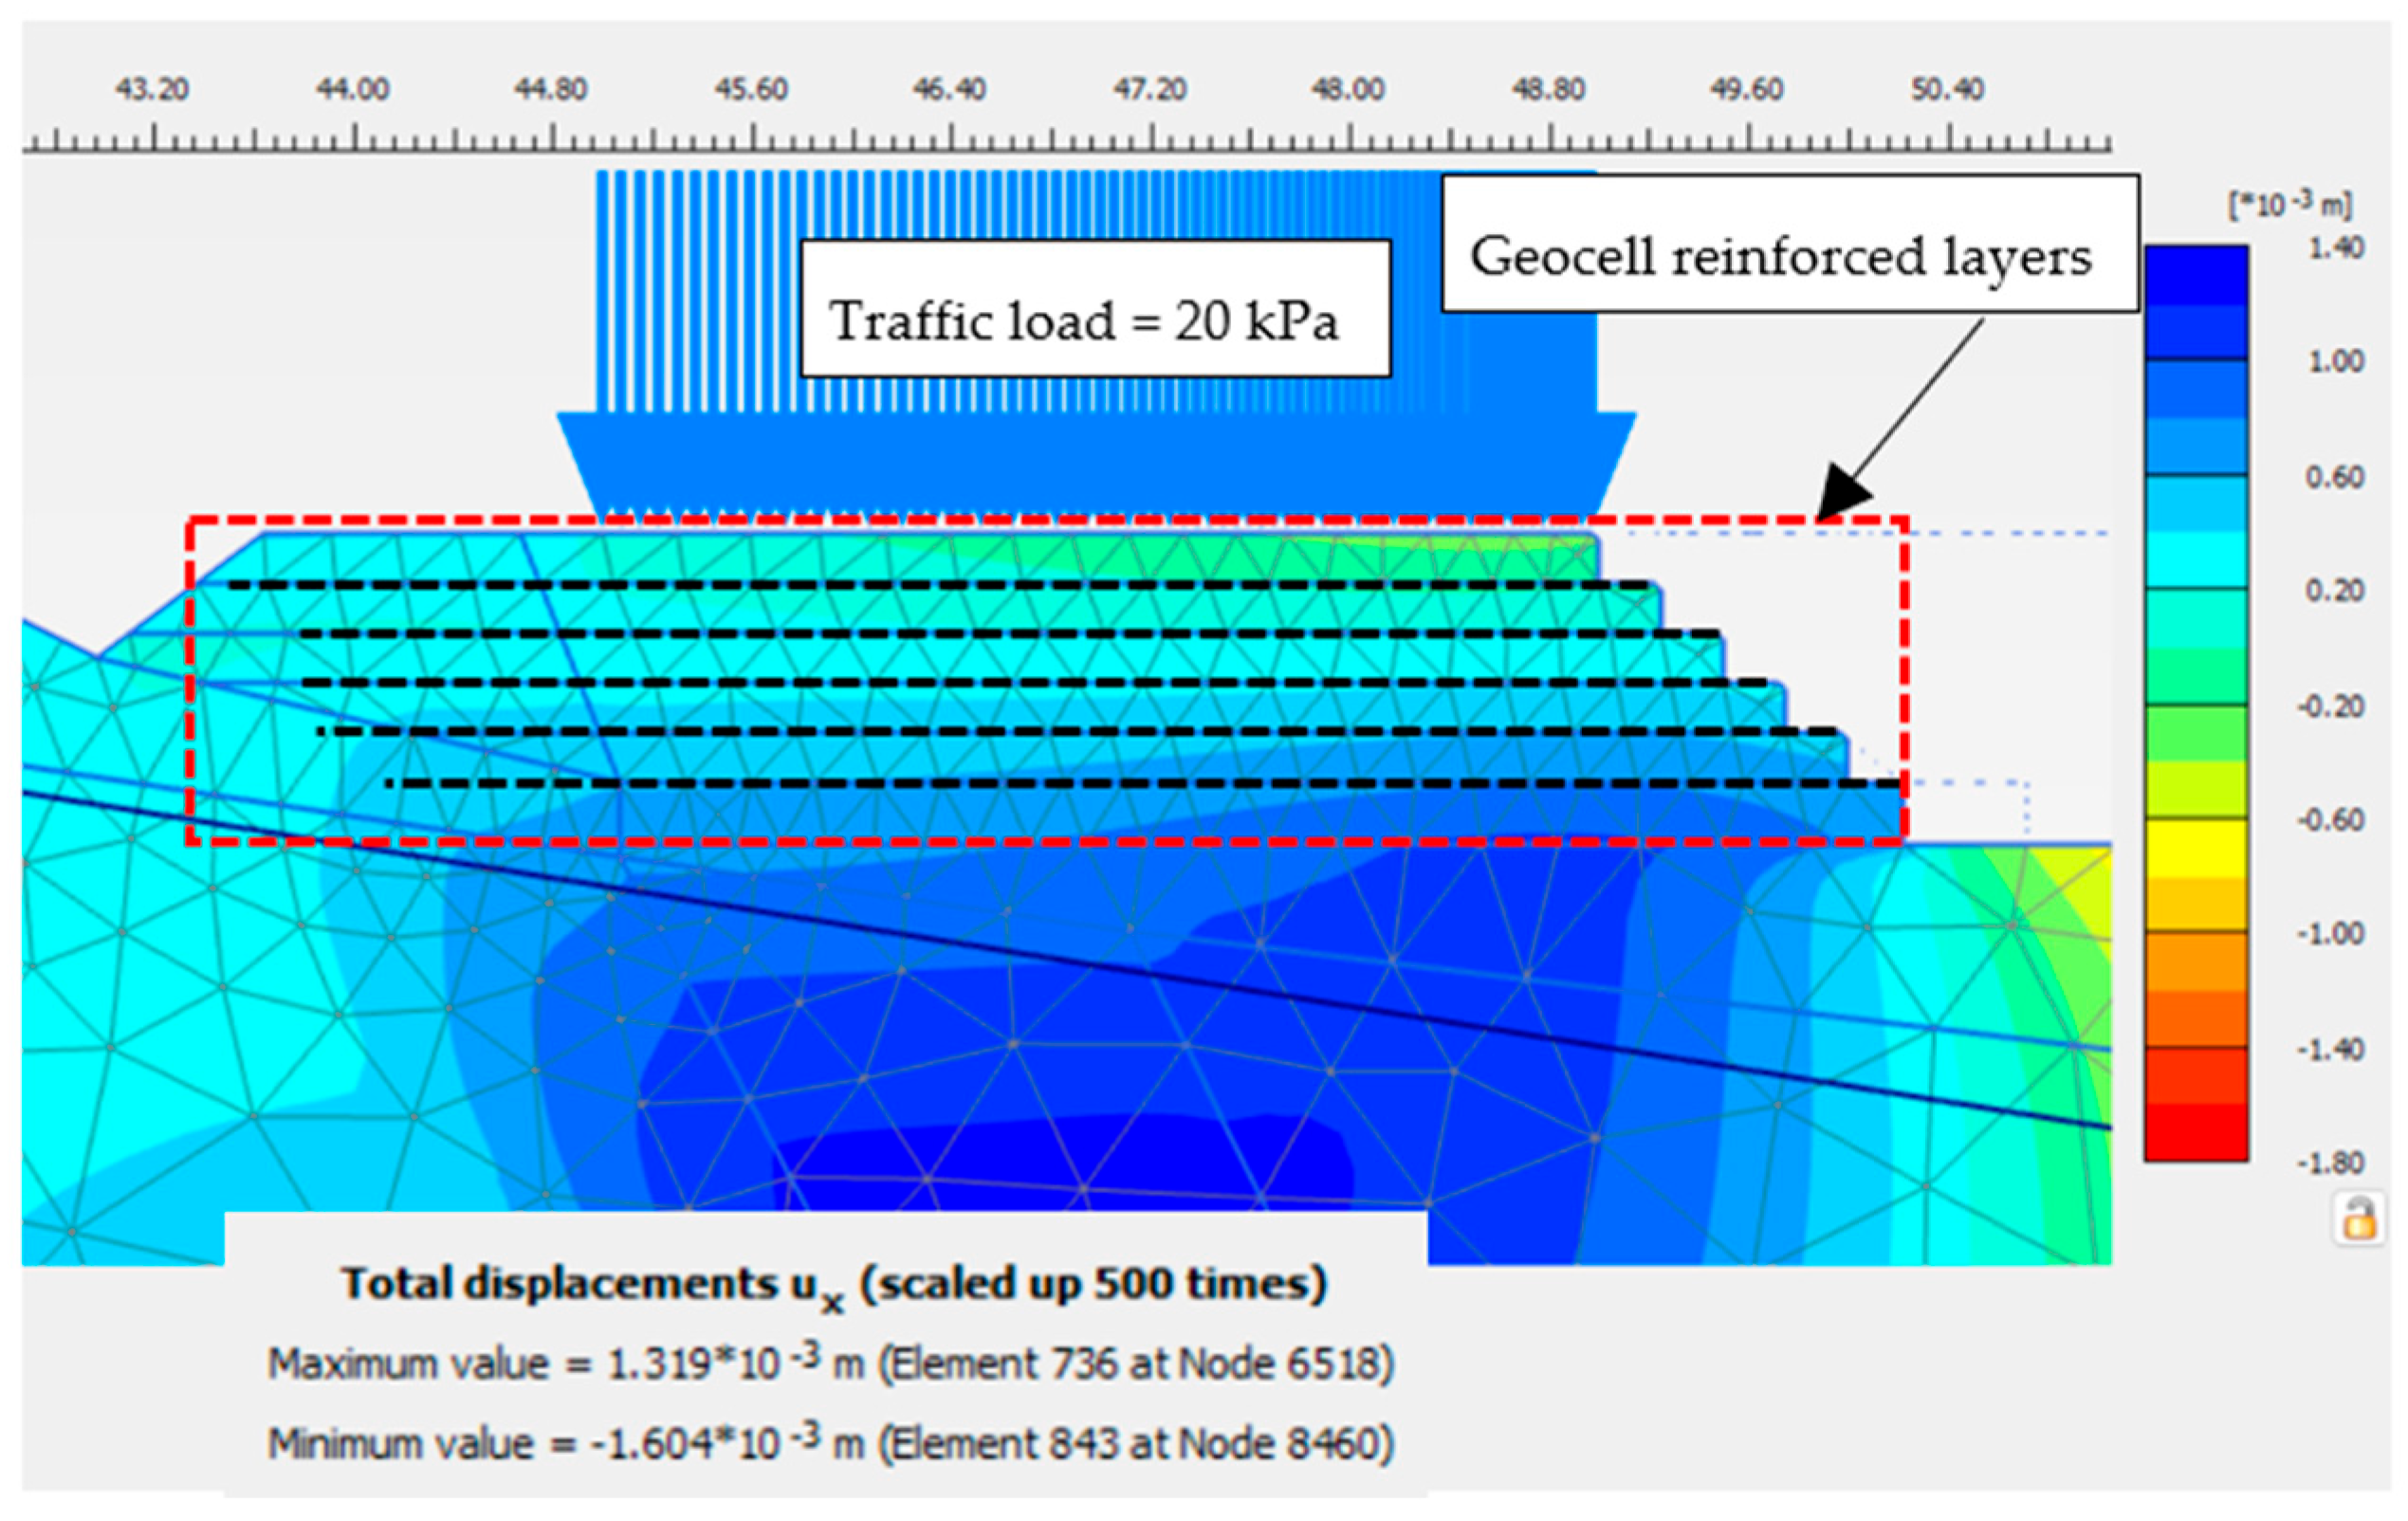
Results of the FEA revealed that geocell layers effectively prevent lateral spreading, even when higher surcharge (traffic load) is applied over the road surface. Lateral deformations of the geocell-reinforced section of the road embankment are shown in
Figure 15. As shown in this figure, the majority of lateral deformations caused by traffic load (20 kPa) are accommodated within by geocell reinforced layer.
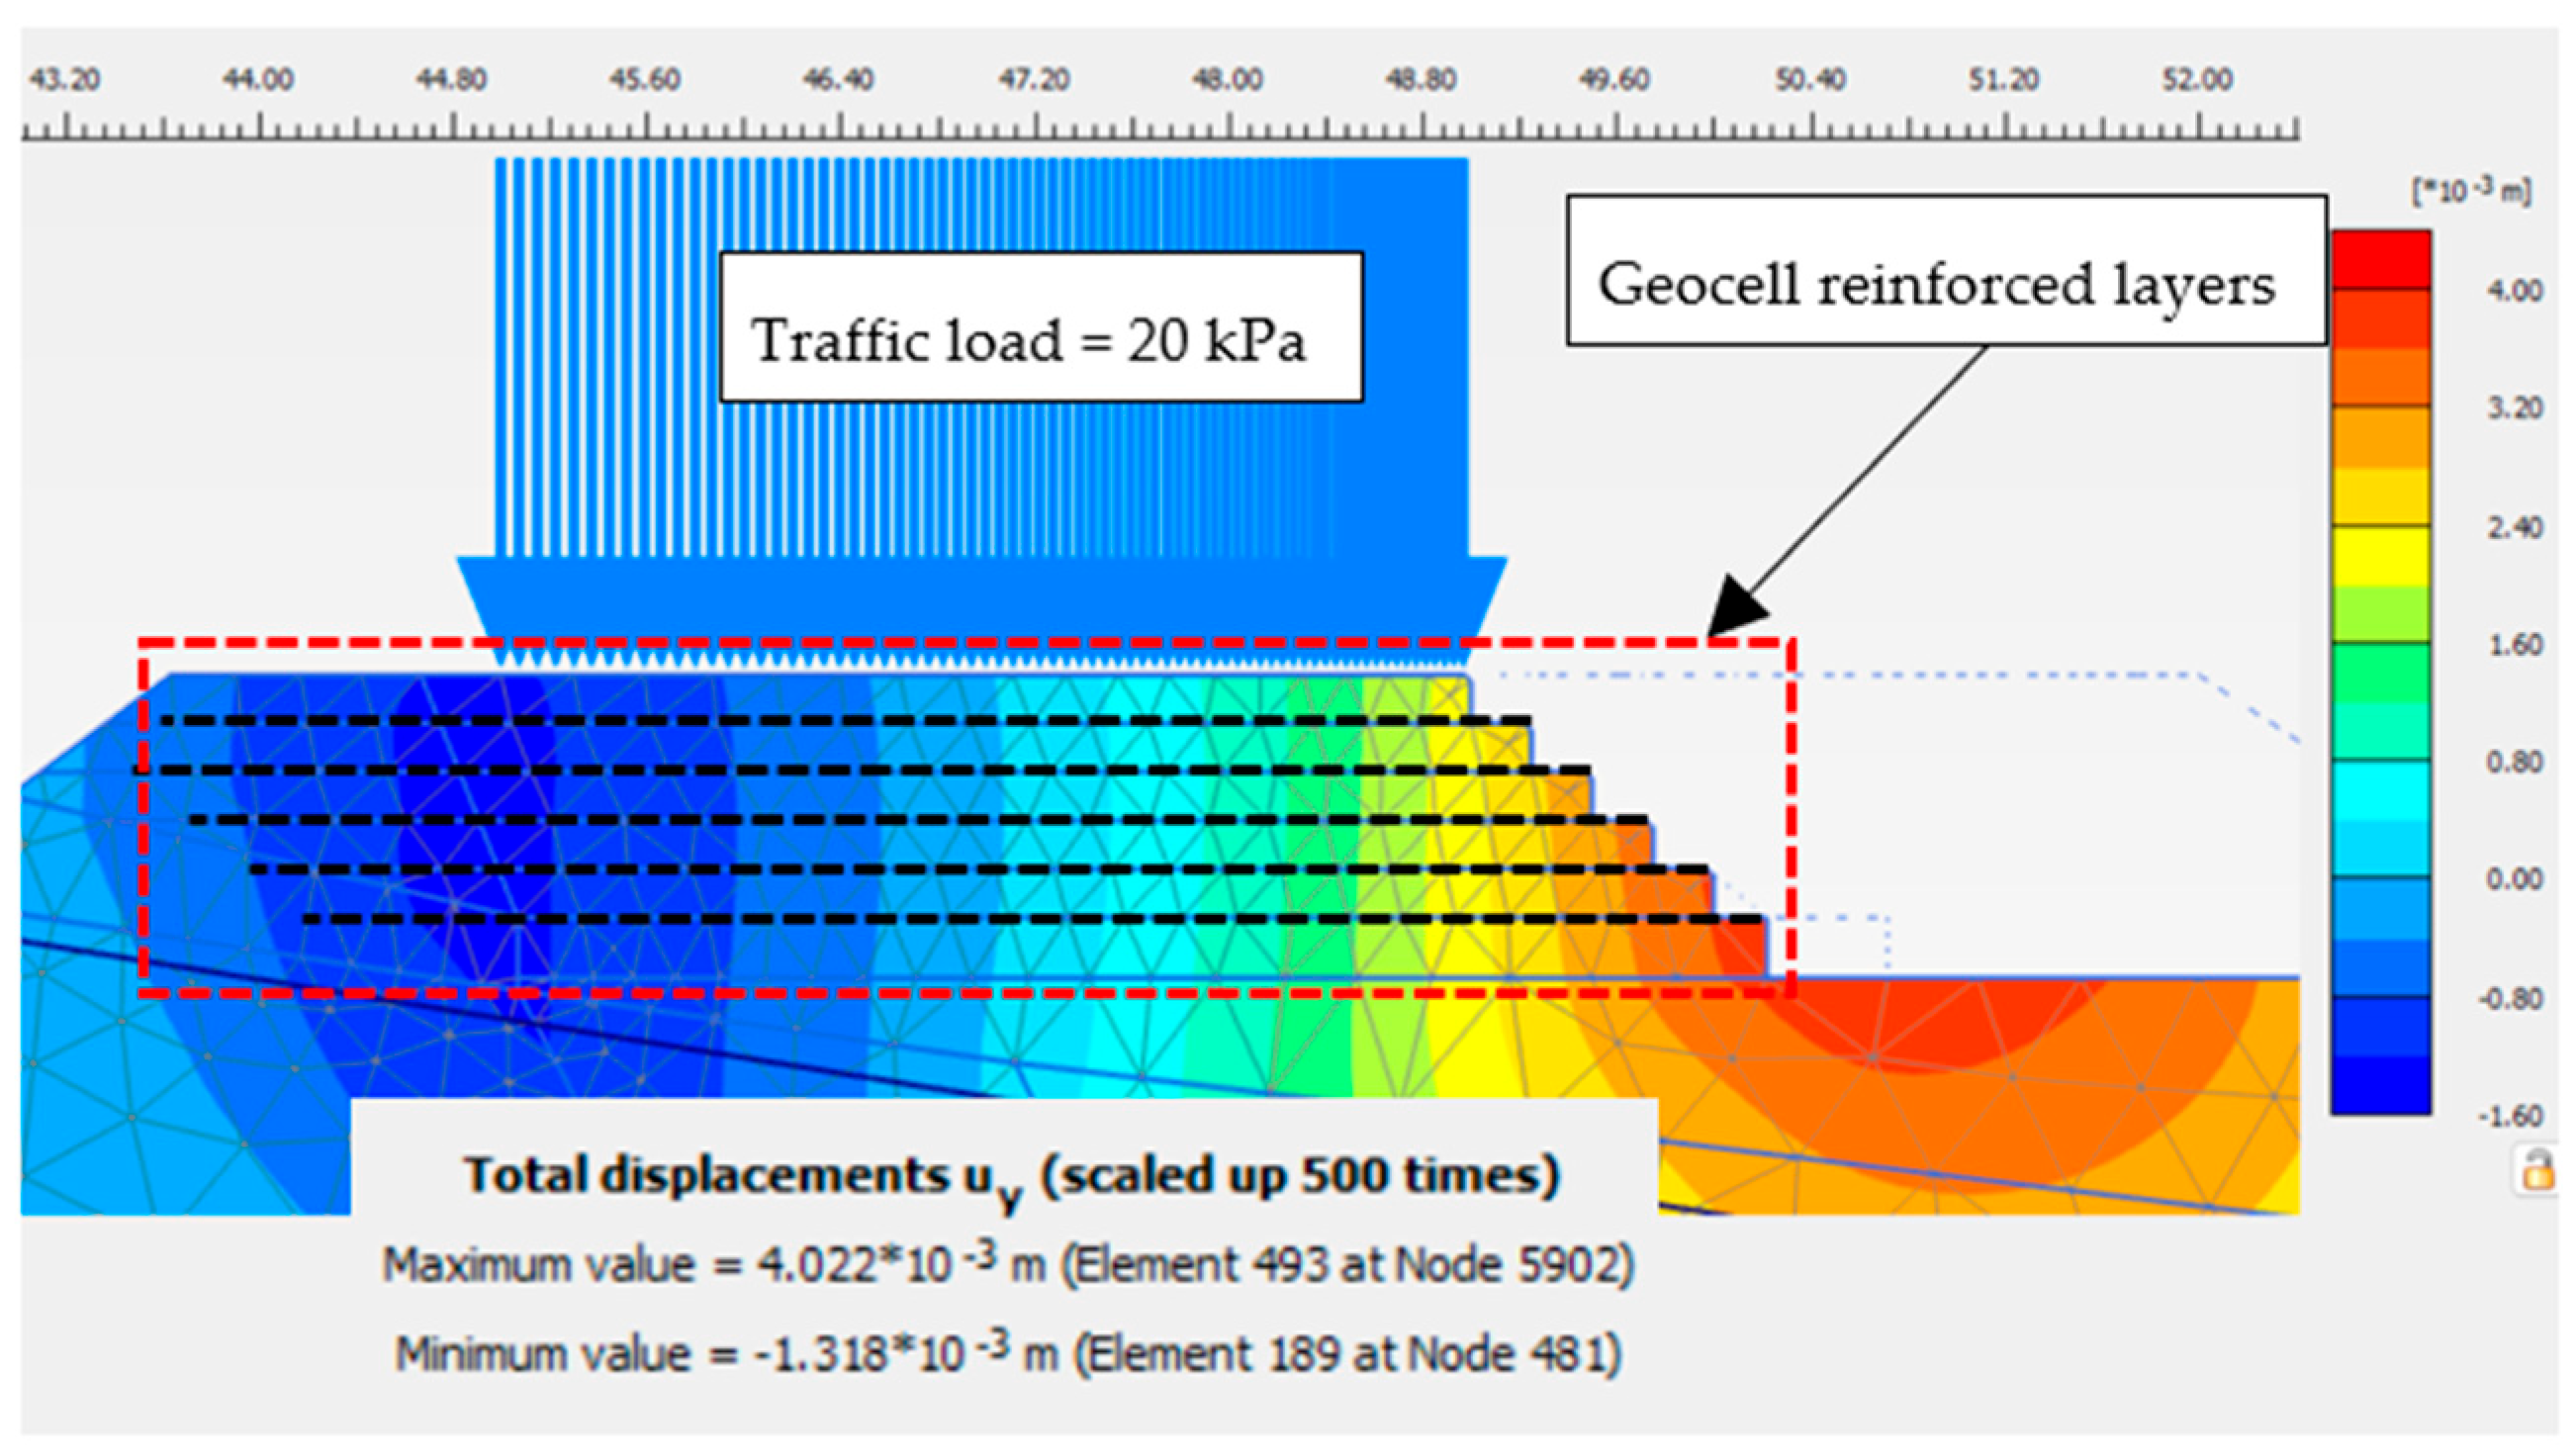
Marginal deformations were observed underneath reinforced layers, indicating that geocell reinforcement successfully reduces the intensity of pressure transferred to the underlying embankment. As shown in
Figure 16, except for marginal heaving at the toe of the temporary road embankment, no significant vertical deformations are observed along the batter when the embankment is constructed using geocell reinforcement, indicating that by applying geocell reinforcement, vertical settlements are maintained at an acceptable level when traffic load is increased from 15 to 20 kPa.
Results were compared with the unreinforced embankment when it is subjected to lateral (external) pressures.
Figure 17 shows lateral deformations predicted by FEM for the unreinforced embankment when it is subjected to a 20 kPa traffic load and different degrees of lateral pressure (3, 6, 9 and 12 kPa). As shown in this figure, notable lateral spreading (shown as a failure surface) of the road embankment was observed toward the edge of the road embankment when very low lateral pressure was applied to the embankment. As shown in this figure, lateral spreading was significantly reduced when lateral pressure was increased to 12 kPa. Marginal improvements (in terms of further reduction in lateral deformations) were observed at higher lateral pressures (σ′
3 = 15 kPa). Based on these results, it can be inferred that approximately not less than a 12 kPa lateral pressure is required to minimise lateral spreading of the road embankment when it is subjected to a 20 kPa traffic load.
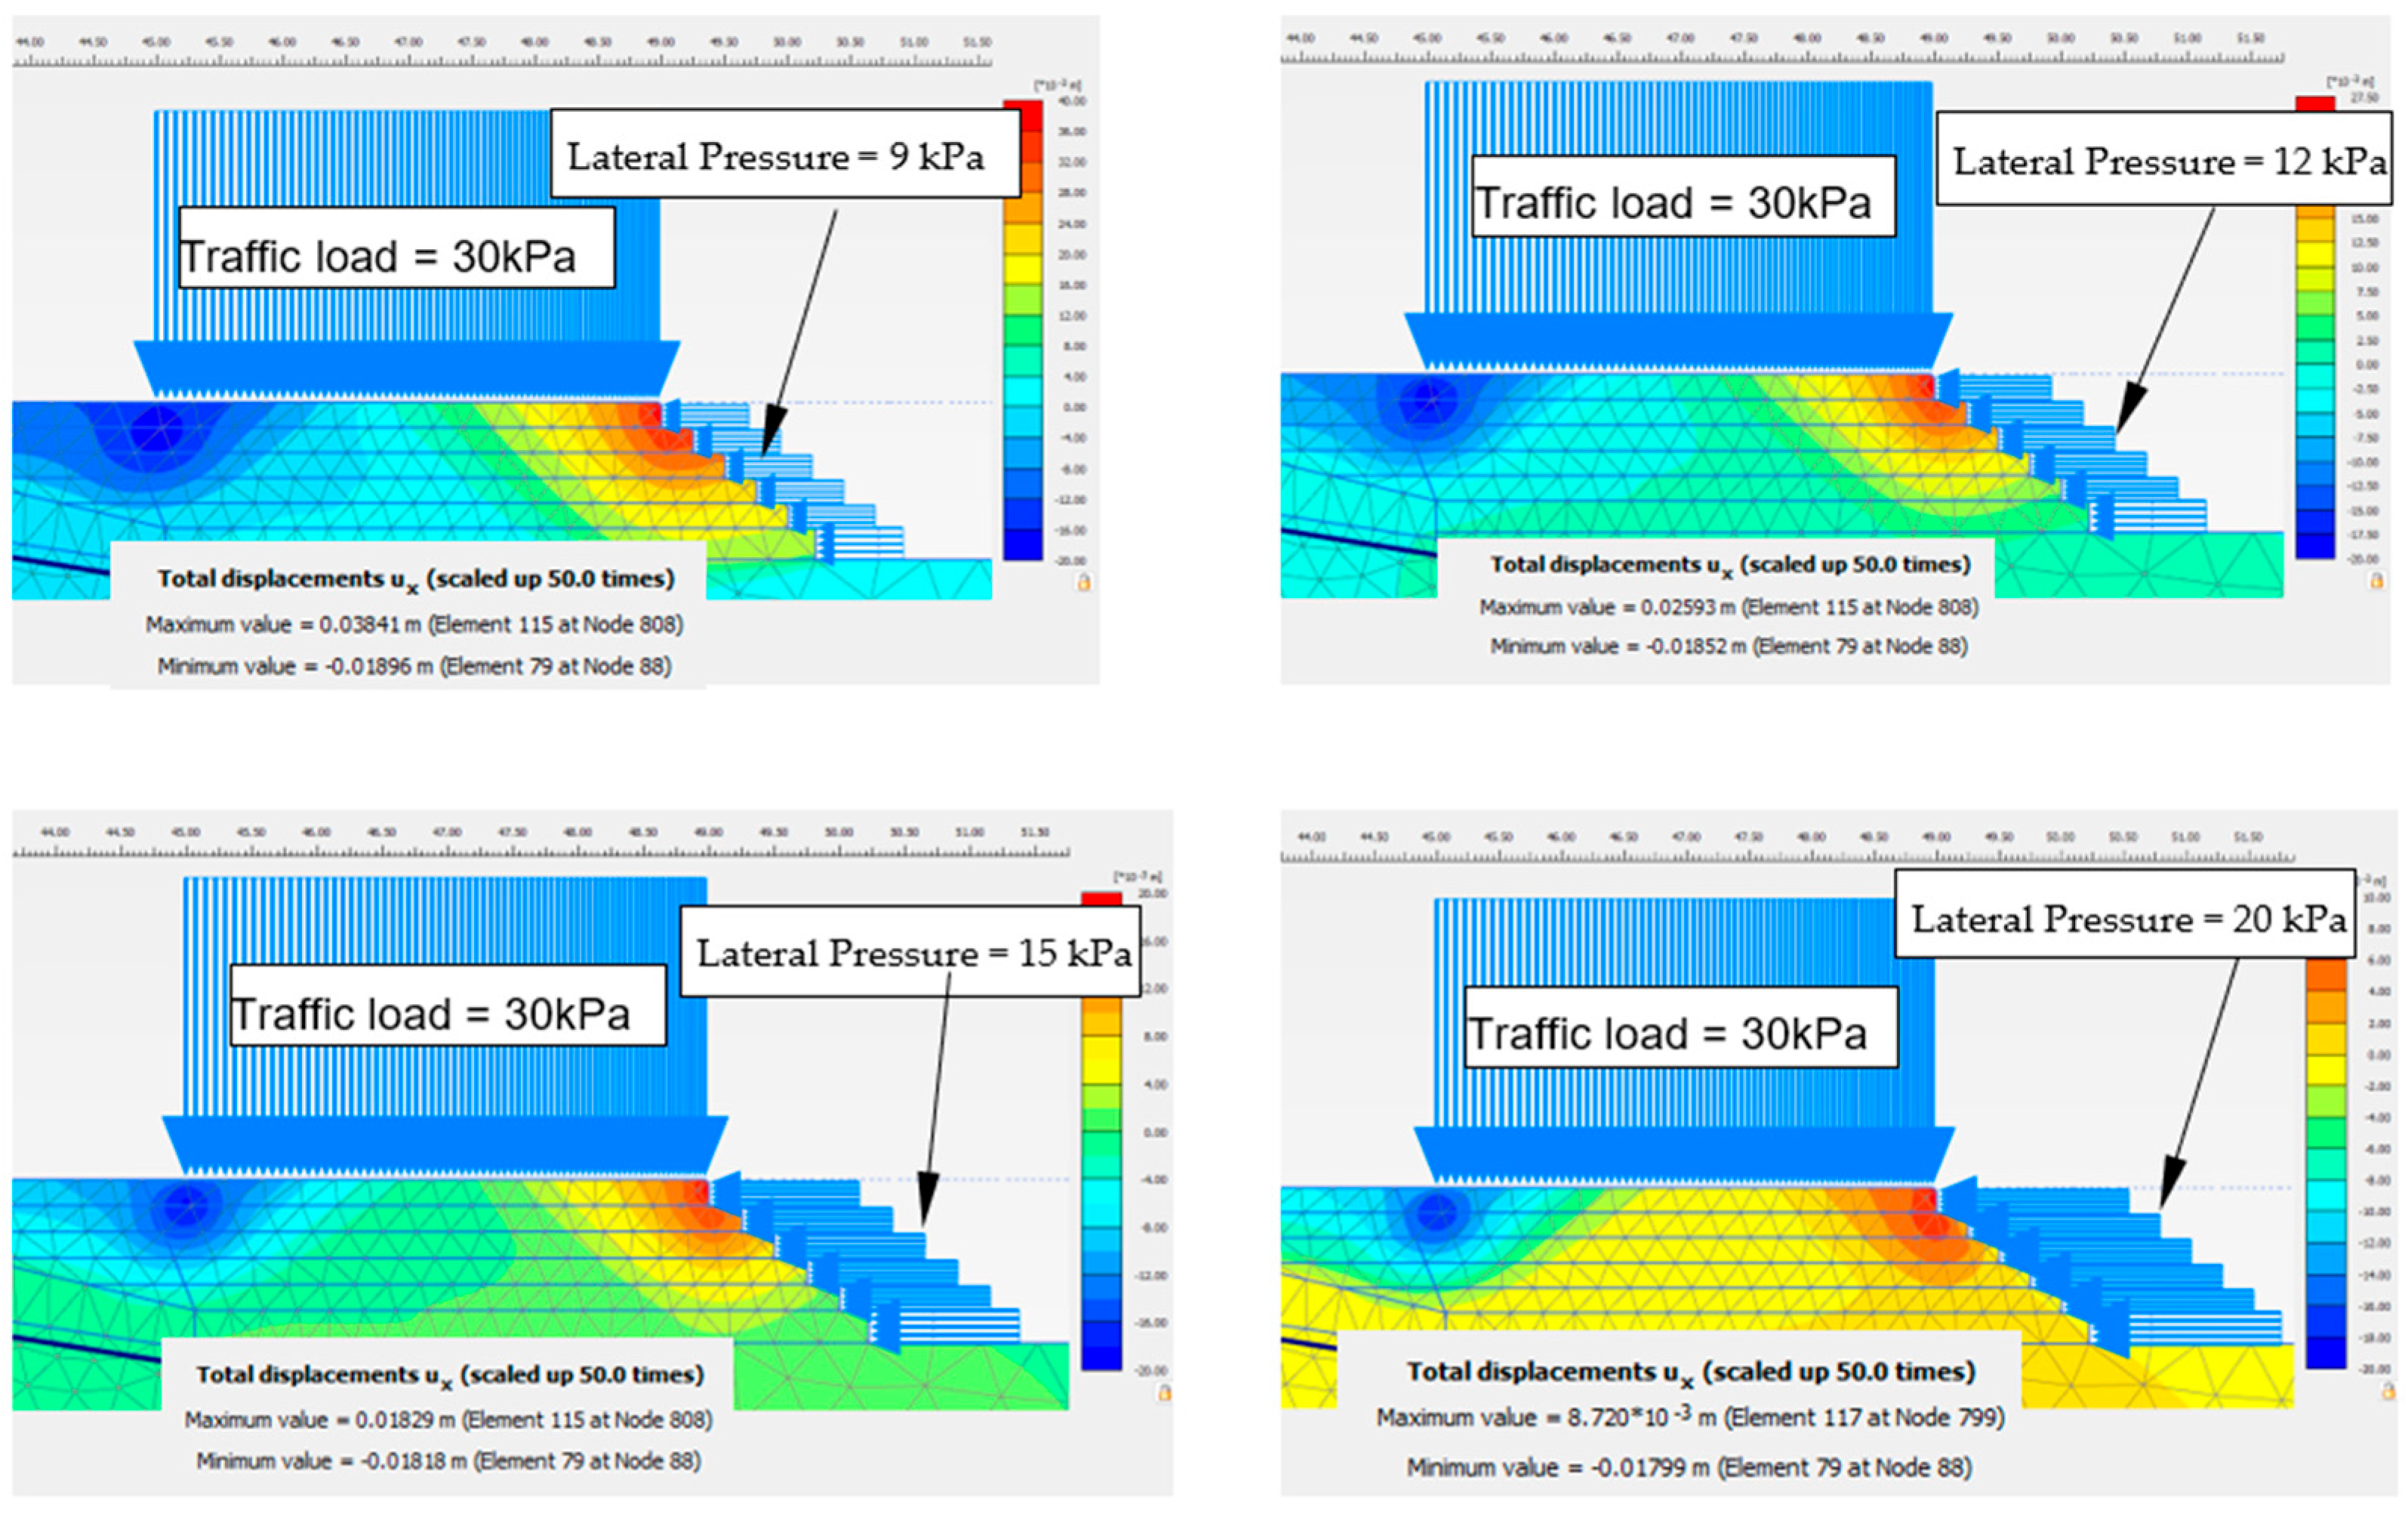
Figure 18 shows lateral deformations, predicted by FEM, of the unreinforced embankment when subjected to a 30 kPa traffic load and different degrees of lateral pressure (σ′
3 = 9, 12, 15 and 20 kPa). As shown in this figure, at lower lateral pressure (i.e., 9 kPa), the failure surface was extended toward to approximately middle of the road embankment when the traffic load applied to the road was increased from 20 kPa to 30 kPa. As shown in this figure, lateral spreading was remarkably decreased when lateral pressure was increased to 20 kPa. Based on these results, it can be inferred that approximately 20 kPa lateral pressure is required to minimise lateral spreading of the road embankment when it is subjected to a 30 kPa traffic load. Also, it can be observed that the magnitude of lateral pressure that is required to prevent lateral spreading has increased from 9 to 12 kPa and 20 kPa when traffic load is increased from 15 kPa to 20 kPa and 30 kPa.
To better illustrate the relationship between traffic surcharge, confinement pressure and embankment deformation,
Table 5 summarises the key finite element analysis results obtained in this study. The presented results show the influence of increasing confinement pressure on reducing vertical settlement and lateral deformation of the embankment and provide the basis for determining the equivalent confinement pressures associated with traffic surcharge of 15 kPa, 20 kPa and 30 kPa.
Equivalent confinement pressure refers to the lateral pressure applied to the unreinforced embankment required to reproduce a deformation response comparable to that predicted for the geocell-reinforced embankment.
Table 5 summarises the key finite element analysis results for the various traffic surcharge and equivalent confinement pressure scenarios considered in this study. The results demonstrate that increasing confinement pressure significantly reduces lateral deformation of the embankment and, to a lesser extent, vertical settlement at the crest of the embankment. For a traffic surcharge of 15 kPa, an equivalent confinement pressure of approximately 9 kPa was sufficient to reduce lateral deformation to a level comparable with that predicted for the geocell-reinforced embankment. Similarly, equivalent confinement pressures of approximately 12 kPa and 20 kPa were required for traffic surcharges of 20 kPa and 30 kPa, respectively. These findings indicate that the confinement demand increases with increasing traffic loading and provide a quantitative basis for interpreting the reinforcement mechanism provided by the geocell system.
9.2. Influence of Geocell Stiffness on Confinement Efficiency
The confinement mechanism provided by geocell reinforcement is primarily governed by the tensile stiffness of the geocell walls. When traffic loading is applied to the reinforced layer, the infill material tends to deform laterally. This deformation mobilises circumferential tensile forces (hoop tension) within the geocell walls, generating additional confinement that restricts lateral spreading of the granular material.
The magnitude of the additional confinement is directly influenced by the secant modulus of the geocell material. Geocells with higher stiffness can mobilise greater tensile forces for a given deformation level, resulting in larger hoop stresses and therefore higher confinement pressures. Conversely, geocells manufactured from lower stiffness materials deform more readily, reducing the confinement effect and limiting their ability to improve load distribution within the reinforced layer.
Previous studies by Punetha [
7] demonstrated that the magnitude of confinement generated under cyclic loading varies significantly depending on the stiffness of the geosynthetic inclusion. Their results showed that rubber tyre inclusions generated the highest confinement, followed by HDPE geocells, woven geotextiles, nonwoven geotextiles and rubber membranes. This trend was attributed primarily to differences in secant modulus and tensile rigidity.
The findings of the current study are consistent with these observations. The FEM analyses indicate that additional confinement pressures in the order of 9 kPa, 12 kPa and 20 kPa were required to reproduce the behaviour of the geocell-reinforced embankment subjected to traffic loads of 15 kPa, 20 kPa and 30 kPa, respectively. These results suggest that the reinforcing mechanism is stress-dependent, whereby increasing surcharge mobilises greater lateral deformation of the infill material and, consequently, larger hoop stresses within the geocell system.
For practical design applications, the stiffness of the geocell should therefore be considered a key design parameter. Increasing cell stiffness can potentially improve confinement efficiency and reduce lateral spreading of the infill material. However, the selection of higher stiffness materials must also consider constructability, durability, installation requirements and project cost.
9.3. Relationship Between Apparent Cohesion and Additional Confinement
It should be recognised that the additional confinement pressure (Δσ′3) derived from the current finite element analyses and the apparent cohesion (Cr) adopted in the equivalent composite soil approach represent different modelling concepts. The equivalent composite approach accounts for the geocell reinforcement by assigning an apparent cohesion to the reinforced soil layer while maintaining the friction angle of the infill material. In contrast, the stress-based approach represents the reinforcement mechanism through an increase in lateral confining stress acting on the granular material. Consequently, the back-calculated confinement pressure of approximately 9 kPa should not be interpreted as being directly equivalent to the apparent cohesion value of 20 kPa assigned to the equivalent composite layer. Rather, the confinement pressure represents the additional lateral stress required to achieve a comparable deformation response within the reinforced layer under the specified loading conditions.
While both approaches attempt to represent the same reinforcement mechanism, they do so through different stress paths within the Mohr–Coulomb framework. The apparent cohesion approach modifies the shear strength envelope by introducing a cohesion intercept, whereas the confinement approach increases the minor principal stress and consequently enlarges the Mohr circle at failure. Therefore, identical apparent cohesion and confinement values should not be expected, even when both approaches produce similar deformation behaviour.
10. Conclusions
This study employed finite element modelling (using PLAXIS 2D) to evaluate the performance of a geocell-reinforced, landslide-affected road embankment under traffic loading. From a practical design perspective, the analyses indicate that the magnitude of additional confinement required to control lateral spreading increases with increasing traffic surcharge. For the conditions assessed in this study, confinement pressures of approximately 9 kPa, 12 kPa and 20 kPa were associated with traffic surcharges of 15 kPa, 20 kPa and 30 kPa, respectively. These results may assist practitioners in understanding the relationship between surcharge loading and confinement demand within geocell-reinforced layers. However, these values are specific to the Wattamolla Road embankment and reflect the adopted geometry, material properties, groundwater conditions and reinforcement configuration. Accordingly, they should be considered indicative rather than prescriptive and should not be directly applied to other projects without project-specific assessment.
The numerical simulations successfully predicted the post-construction behaviour, leading to the following primary conclusions:
Effective Confinement and Deformation Control: The geocell reinforcement effectively confined the infill material, significantly mitigating both lateral spreading and vertical deformation of the temporary access road founded on low shear-strength soil. The geocell system functions as a semi-rigid mattress, distributing traffic loads and reducing the pressure transferred to the weak subgrade, thereby controlling settlement.
Quantitative Lateral Pressure Requirements: The analysis quantified the lateral pressure required to stabilise the embankment. The analyses indicated that the equivalent confinement pressure required to reproduce the performance of the geocell-reinforced embankment increased with increasing traffic surcharge. Equivalent confinement pressures of approximately 9 kPa, 12 kPa and 20 kPa were associated with traffic surcharge of 15 kPa, 20 kPa and 30 kPa, respectively.
Stress-Dependent Confinement Mechanism: The additional confining pressure (∆σ3) provided by the geocell is directly correlated to the magnitude of the applied traffic surcharge. Higher traffic surcharge loads mobilise greater confinement within the geocell mattress, resulting in improved resistance to lateral spreading and deformation.
Comparison between Equivalent Composite Model and Stress-Based Approach: The numerical model, which simulated the geocell as an equivalent composite layer with improved properties, yielded deformation results comparable to those predicted for an unreinforced soil mass subjected to a small lateral confining pressure (3–15 kPa). The results demonstrate reasonable consistency between the equivalent composite approach and the stress-based confinement representation adopted in the study.
Design Implications and Material Selection: This study provides a valuable framework for designing geocell-reinforced embankments. While confinement efficiency increases with the stiffness (modulus) of the geoinclusion, the final material selection must balance performance with project-specific constraints and function. The model demonstrates its utility in selecting optimal material parameters to maximise the benefits of geosynthetic reinforcement.
Recommendation for Future Work: In practice, the geoinclusion-stabilised soil is more likely to be subjected to a complex 3D stress state. Future research should incorporate advanced 3D modelling to more accurately capture the complex stress states (σ′1 ≠ σ′2 ≠ σ′3) inherent in geocell-stabilised soil systems, further refining the prediction of confining pressures in all principal stress directions. Although the present study demonstrates the engineering mechanisms that underpin these sustainability benefits, it does not quantify environmental performance through life-cycle assessment or carbon accounting. Future studies should therefore evaluate embodied carbon, material transportation, construction energy, maintenance frequency, and whole-of-life costs to provide a quantitative comparison between geocell reinforcement and conventional embankment stabilisation techniques.