


Abstract
Rapid urban expansion reshapes urban morphology and the spatial organization of regional city systems. However, provincial-scale studies rarely integrate expansion dynamics, morphological change, and the evolution of morphological polycentricity, while stage-specific shifts in associated factors remain insufficiently understood. This study examines 16 prefecture-level cities in Shandong, China, from 2000 to 2020 to quantify urban expansion and morphological change, assess morphological polycentricity and the city-size hierarchy, and evaluate stage-specific factors associated with newly added built-up land. Built-up land was extracted from the Prolonged Artificial nighttime-light Dataset of China (PANDA-China) using a statistics-constrained bisection threshold method and evaluated against independent land-cover products, followed by complementary spatial, morphological, rank–size, and GeoDetector analyses. The results show that the built-up area increased from 1912.10 to 5646.04 km2 in Shandong, while the annualized expansion rate declined from 7.09%/yr to 4.14%/yr despite persistently high absolute expansion after 2010. The dominant northeast–southwest axis remained stable, while urban forms became less compact and more complex. Secondary built-up nodes strengthened, whereas Jinan and Qingdao retained their dominant positions, indicating strengthening morphological polycentricity within a persistent dual-core structure. GeoDetector revealed a temporal shift from greater GDP prominence in 2000–2010 toward stronger population and road associations in 2010–2020. Initial built-up density remained the strongest explanatory factor, and factor interactions consistently exceeded individual explanatory power. These findings clarify the stage-dependent evolution of urban expansion and support differentiated land management and coordinated regional development.
1. Introduction
Urban expansion not only increases the extent of built-up land but also reshapes urban morphology and regional urban structure. These changes are closely related to land-use efficiency and the spatial organization of urban development [1]. Globally, rapid urban expansion continues to convert agricultural and natural land and intensify competition for limited land resources [2,3]. In China, built-up land has expanded substantially over recent decades, but its pace, spatial pattern, and land-use efficiency vary markedly among regions and cities [4,5]. As China’s urbanization increasingly shifts from rapid land expansion toward higher-quality and more efficient development, measuring the amount of built-up land growth alone is insufficient. Greater attention is needed to how long-term expansion changes urban form and the spatial organization of regional city systems.
Remote sensing provides an important basis for monitoring urban expansion over long periods and across large regions. Medium- and high-resolution optical imagery can delineate built-up land in considerable detail, but long-term comparisons may be affected by cloud contamination, sensor differences, and inconsistent classification procedures. Nighttime-light (NTL) imagery is particularly useful for regional comparisons because it provides spatially continuous observations of human activity and urban development. It has been widely applied to urban extent mapping and long-term urbanization analysis. The integration of DMSP-OLS and VIIRS observations has further improved the temporal consistency of long-term NTL records [6]. In China, the Prolonged Artificial NTL Dataset of China (PANDA-China) extends annual NTL observations to 1984–2020 and shows strong temporal consistency and close relationships with built-up area and socioeconomic indicators [7]. The dataset has also been used to examine long-term urbanization, metropolitan expansion, and changes in city-size distributions [8]. These advances make NTL increasingly suitable for long-term comparisons across cities and years. Nevertheless, NTL is an indirect representation of physical urban land, and the delineation of built-up areas remains sensitive to the extraction procedure [6,7]. Transparent and consistent threshold selection is therefore important for comparative studies.
Recent urban expansion research has increasingly moved from measuring land growth toward examining changes in urban form and spatial structure. Expansion modes describe how newly developed patches are added to existing built-up land, whereas morphological indicators characterize the cumulative spatial form produced by successive periods of growth. The two dimensions are closely related but are not equivalent [1]. At a broader spatial scale, morphological polycentricity provides another perspective on how built-up development is distributed among multiple urban nodes. Remote-sensing and geospatial studies have demonstrated that such physical concentrations can be used to characterize morphological polycentric patterns [9,10]. This morphological dimension should be distinguished from functional polycentricity based on commuting, employment, or other interurban flows [11,12]. Rank–size relationships provide a complementary measure by describing changes in the relative size hierarchy of cities, and long-term NTL data have recently been used for this purpose [8]. However, these dimensions are often examined separately. Less attention has been paid to how city-level expansion processes and cumulative morphological change are related to longer-term shifts in morphological polycentricity and the city-size hierarchy at the provincial scale.
Urban expansion is also shaped by multiple socioeconomic, transport, environmental, and pre-existing development conditions. Population and economic growth, transport accessibility, planning and institutional conditions, and the existing urban base are among the factors most frequently associated with urban land expansion [13]. Their influence, however, is neither spatially nor temporally uniform. Studies across Chinese cities have shown that the relative importance of urban expansion factors changes among regions and over time [14,15]. Recent research further suggests that urban growth reflects interactions among multiple factors and that these relationships may vary with urban morphology [1]. Yet, how the explanatory structure of newly added built-up land changes between successive development stages remains less clear. Comparing the same set of factors across different periods can therefore provide further insight into the changing conditions associated with urban expansion.
Shandong Province provides a suitable setting for examining these issues. It experienced rapid urbanization and substantial built-up land expansion between 2000 and 2020. The province also exhibits pronounced spatial differences in economic development, population distribution, and physical conditions between coastal and inland areas. Previous studies have reported marked spatial heterogeneity in urban growth and regional development across Shandong [16,17,18]. This combination of sustained urban growth and strong internal heterogeneity makes Shandong suitable for examining long-term changes in urban form and regional spatial organization.
To this end, this study examines the long-term evolution of urban expansion and morphological polycentricity in Shandong Province from 2000 to 2020. It has three objectives. First, it quantifies changes in built-up land expansion, spatial direction, expansion modes, and urban morphology. Second, it assesses the evolution of morphological polycentricity and the city-size hierarchy. Third, it evaluates the explanatory power and interactions of factors associated with the spatial differentiation of newly added built-up land during 2000–2010 and 2010–2020. Built-up land is first extracted from PANDA-China using a statistics-constrained bisection threshold method. Complementary spatial and statistical analyses are then applied to address the three objectives. Here, polycentricity refers specifically to morphological polycentricity inferred from the spatial distribution of built-up concentrations and the relative size of cities, rather than functional linkages based on commuting, employment, or intercity flows [19,20]. The study links city-level expansion dynamics with changes in the provincial urban structure and provides evidence for differentiated land management and coordinated regional development.
2. Materials and Methods
2.1. Study Area
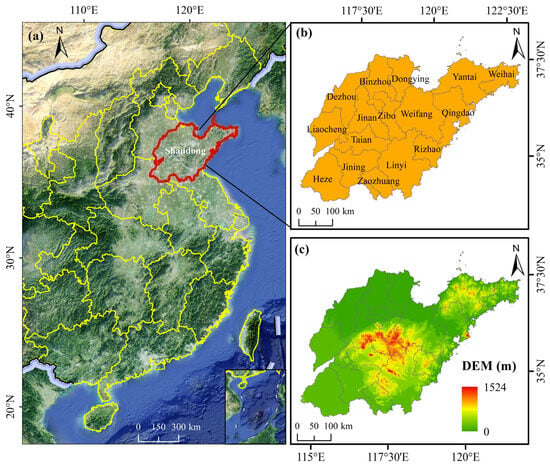
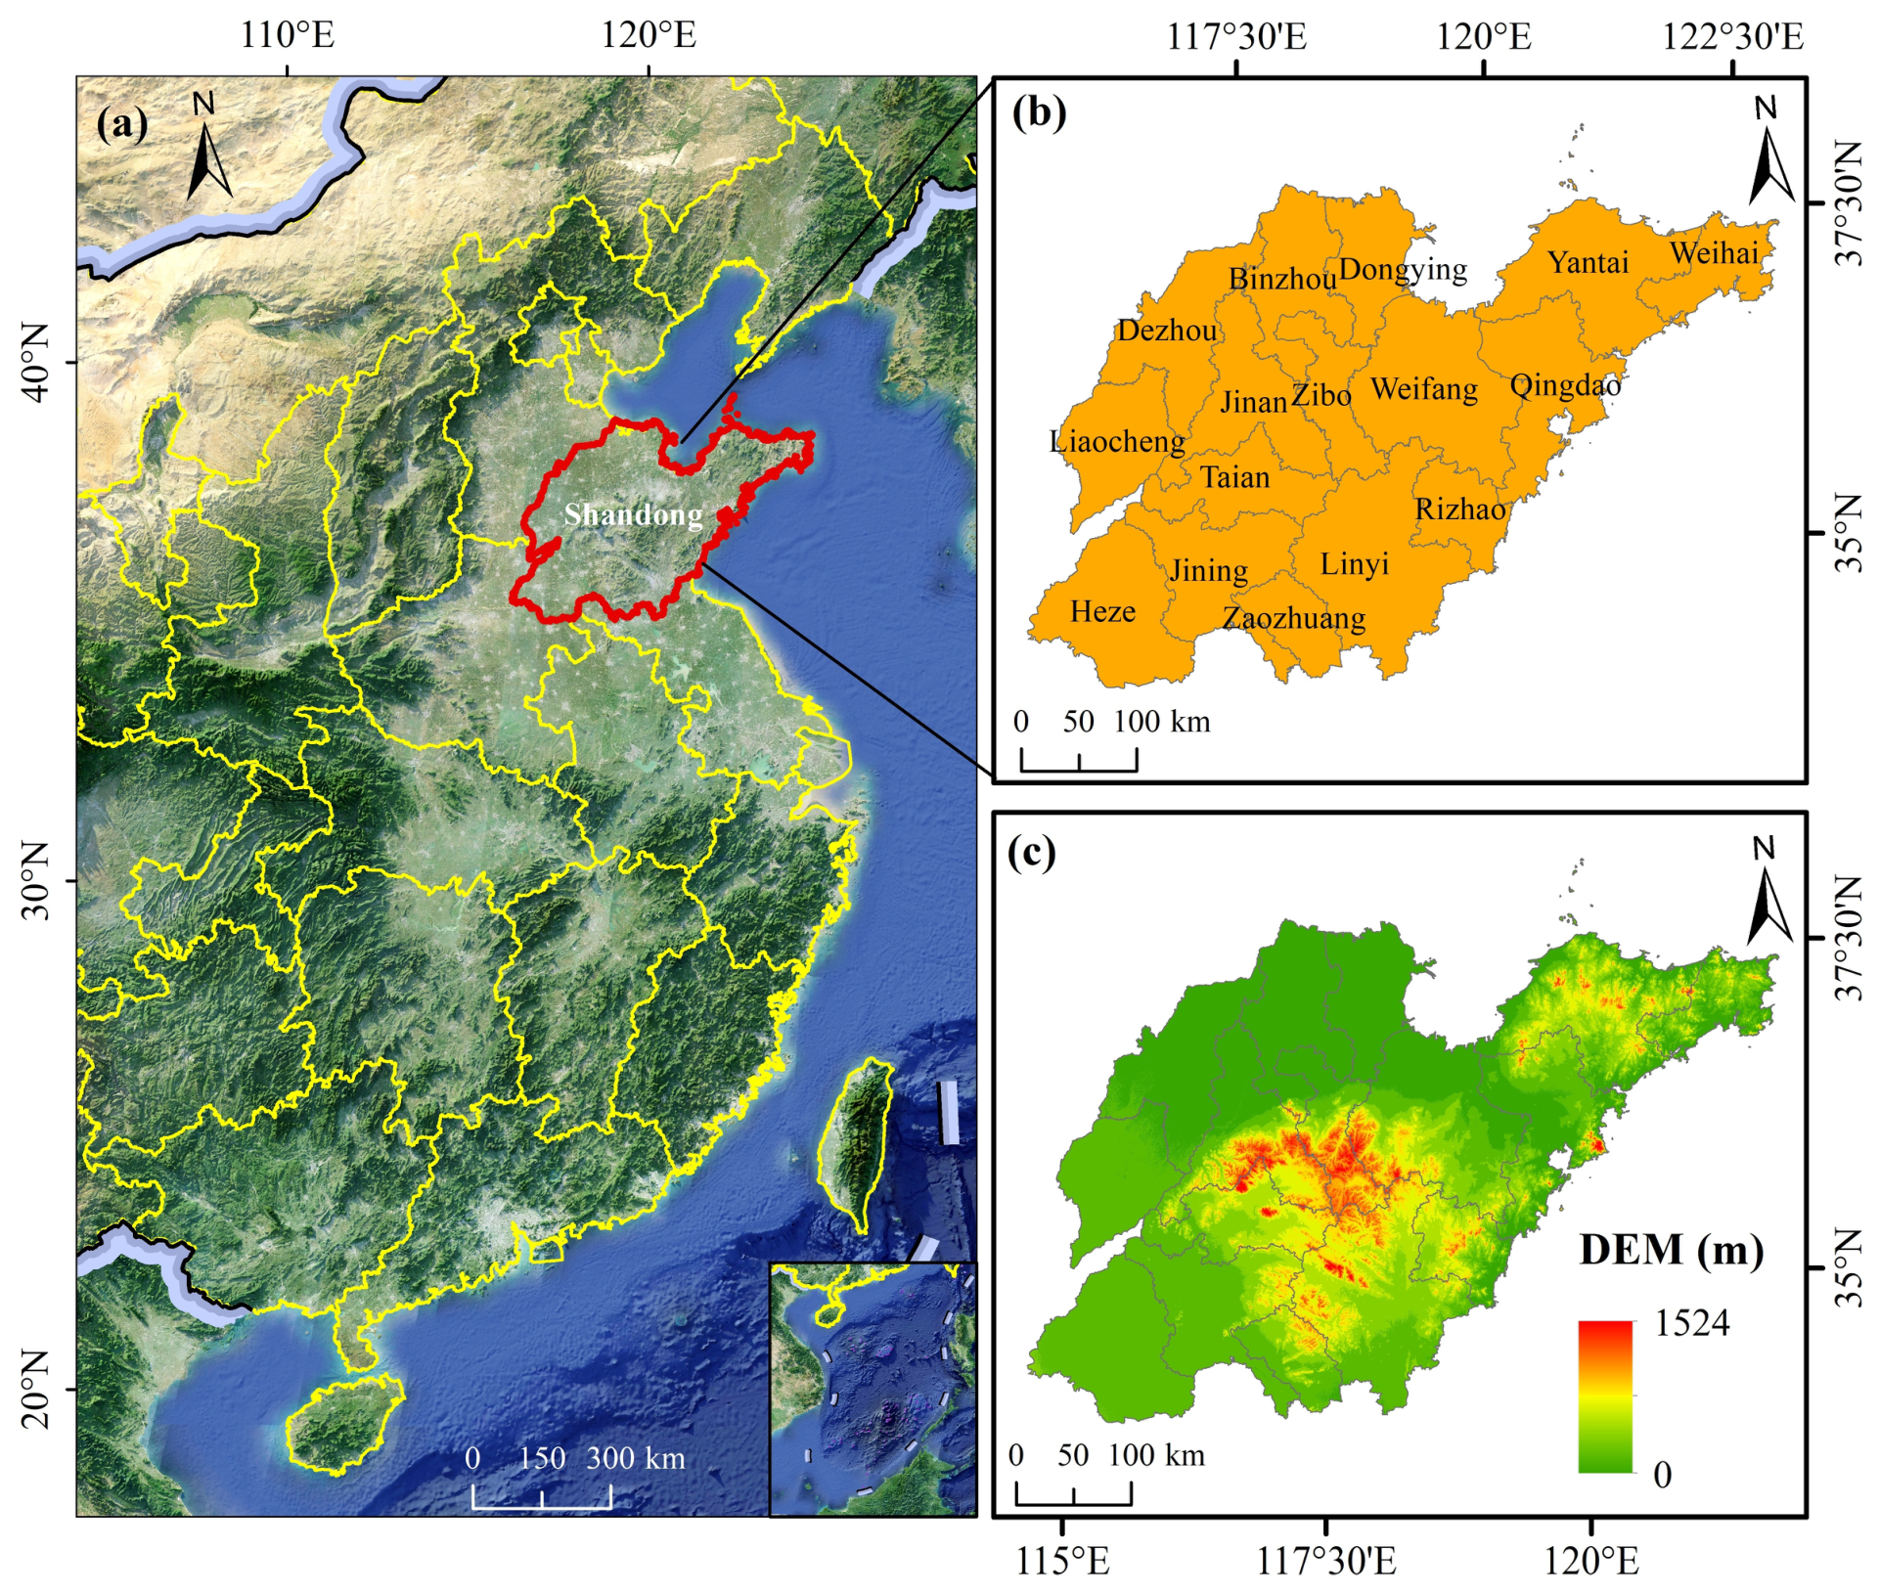
Shandong Province is located on the eastern coast of China and in the lower reaches of the Yellow River, extending from 34°22′ to 38°24′ N and 114°47′ to 122°42′ E [21] (Figure 1). The province covers approximately 158,000 km2 and borders the Bohai Sea to the north and the Yellow Sea to the east. Its terrain shows pronounced regional contrasts. Mountains and hills dominate central and southern Shandong, whereas the Jiaodong Peninsula in the east is characterized mainly by low mountains and rolling hills. In contrast, northwestern and southwestern Shandong consist largely of low-lying alluvial plains. The Yellow River Delta forms an extensive coastal plain in northern Shandong. Together, these topographic differences create marked spatial variation in land availability and influence patterns of urban development.
Figure 1.
Overview of the study area: (a) geographic location of Shandong Province in China, (b) prefecture-level administrative divisions, and (c) topographic conditions represented by the digital elevation model (DEM).
Shandong comprises 16 prefecture-level cities and experienced rapid urbanization and substantial socioeconomic growth during 2000–2020. Its permanent resident population reached approximately 101.53 million in 2020, while the urbanization rate increased from 38.15% in 2000 to 63.05% in 2020 [22]. The province also exhibits marked coastal–inland differences in population distribution, economic development, and transport accessibility [23]. These characteristics provide a suitable setting for examining long-term urban expansion, morphological change, and their spatial differentiation across cities [24].
2.2. Data Sources and Preprocessing
This study integrates nighttime-light data, official built-up area statistics, socioeconomic and environmental variables, administrative boundaries, and independent land-cover products. Five benchmark years, 2000, 2005, 2010, 2015, and 2020, were used to characterize long-term urban expansion. Data for the explanatory-factor analysis were compiled mainly for 2000, 2010, and 2020. The datasets supported three main tasks: built-up land extraction, analysis of urban expansion and morphological change, and examination of the spatial differentiation of newly added built-up land. Table 1 summarizes the data sources, temporal coverage, spatial characteristics, and applications.
Table 1.
Data sources, spatial characteristics, and applications in this study.
The primary dataset was the PANDA-China NTL dataset, which provides annual nighttime light (NTL) observations from 1984 to 2020 at a spatial resolution of 1 km [7]. The dataset integrates DMSP/OLS and NPP/VIIRS observations and shows high temporal consistency. The original validation reports an RMSE of 0.73, an R2 of 0.95, and a pixel-level regression slope of 0.99. NTL data for 2000, 2005, 2010, 2015, and 2020 were selected for subsequent analysis.
Official built-up area statistics for the 16 prefecture-level cities were obtained from the China Urban Construction Statistical Yearbook [25]. According to the official statistical definition, built-up area refers to areas within the administrative territory of a city that have been substantially developed in a contiguous manner and are basically provided with municipal utilities and public facilities. For each prefecture-level city, the reported value represents the total area satisfying this definition within the entire prefecture-level administrative territory, rather than only the central urban area or municipal districts. Therefore, the spatial coverage of the statistical constraint is consistent with the prefecture-level administrative unit used for NTL-based extraction.
Three independent land-use/land-cover datasets were used to assess the spatial consistency of the NTL-derived built-up land: CLCD, GlobeLand30, and CNLUCC. These datasets provide independent representations of developed or artificial surfaces and were used for comparisons in 2000, 2010, and 2020. Detailed procedures for the spatial consistency assessment are described in the corresponding methodological section.
Additional socioeconomic, transport, topographic, and built-up land data were used for the GeoDetector analysis. The dependent variable was the proportion of newly added built-up land within the effective area of each grid cell. Seven explanatory variables were included: road density, population density, gridded GDP, initial built-up density, slope, the share of secondary industry, and fiscal expenditure intensity. Road density was derived from the road-network data, while slope was calculated from the 30 m digital elevation model (DEM). Initial built-up density was derived from the NTL-based built-up land at the beginning of each analysis period. The socioeconomic and accessibility variables were compiled for 2000, 2010, and 2020, and period-average values were calculated for the 2000–2010 and 2010–2020 analyses. Detailed procedures are described in Section 2.5.5.
2.3. Methodological Framework
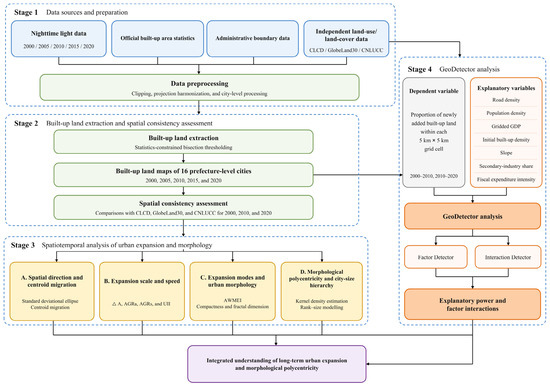
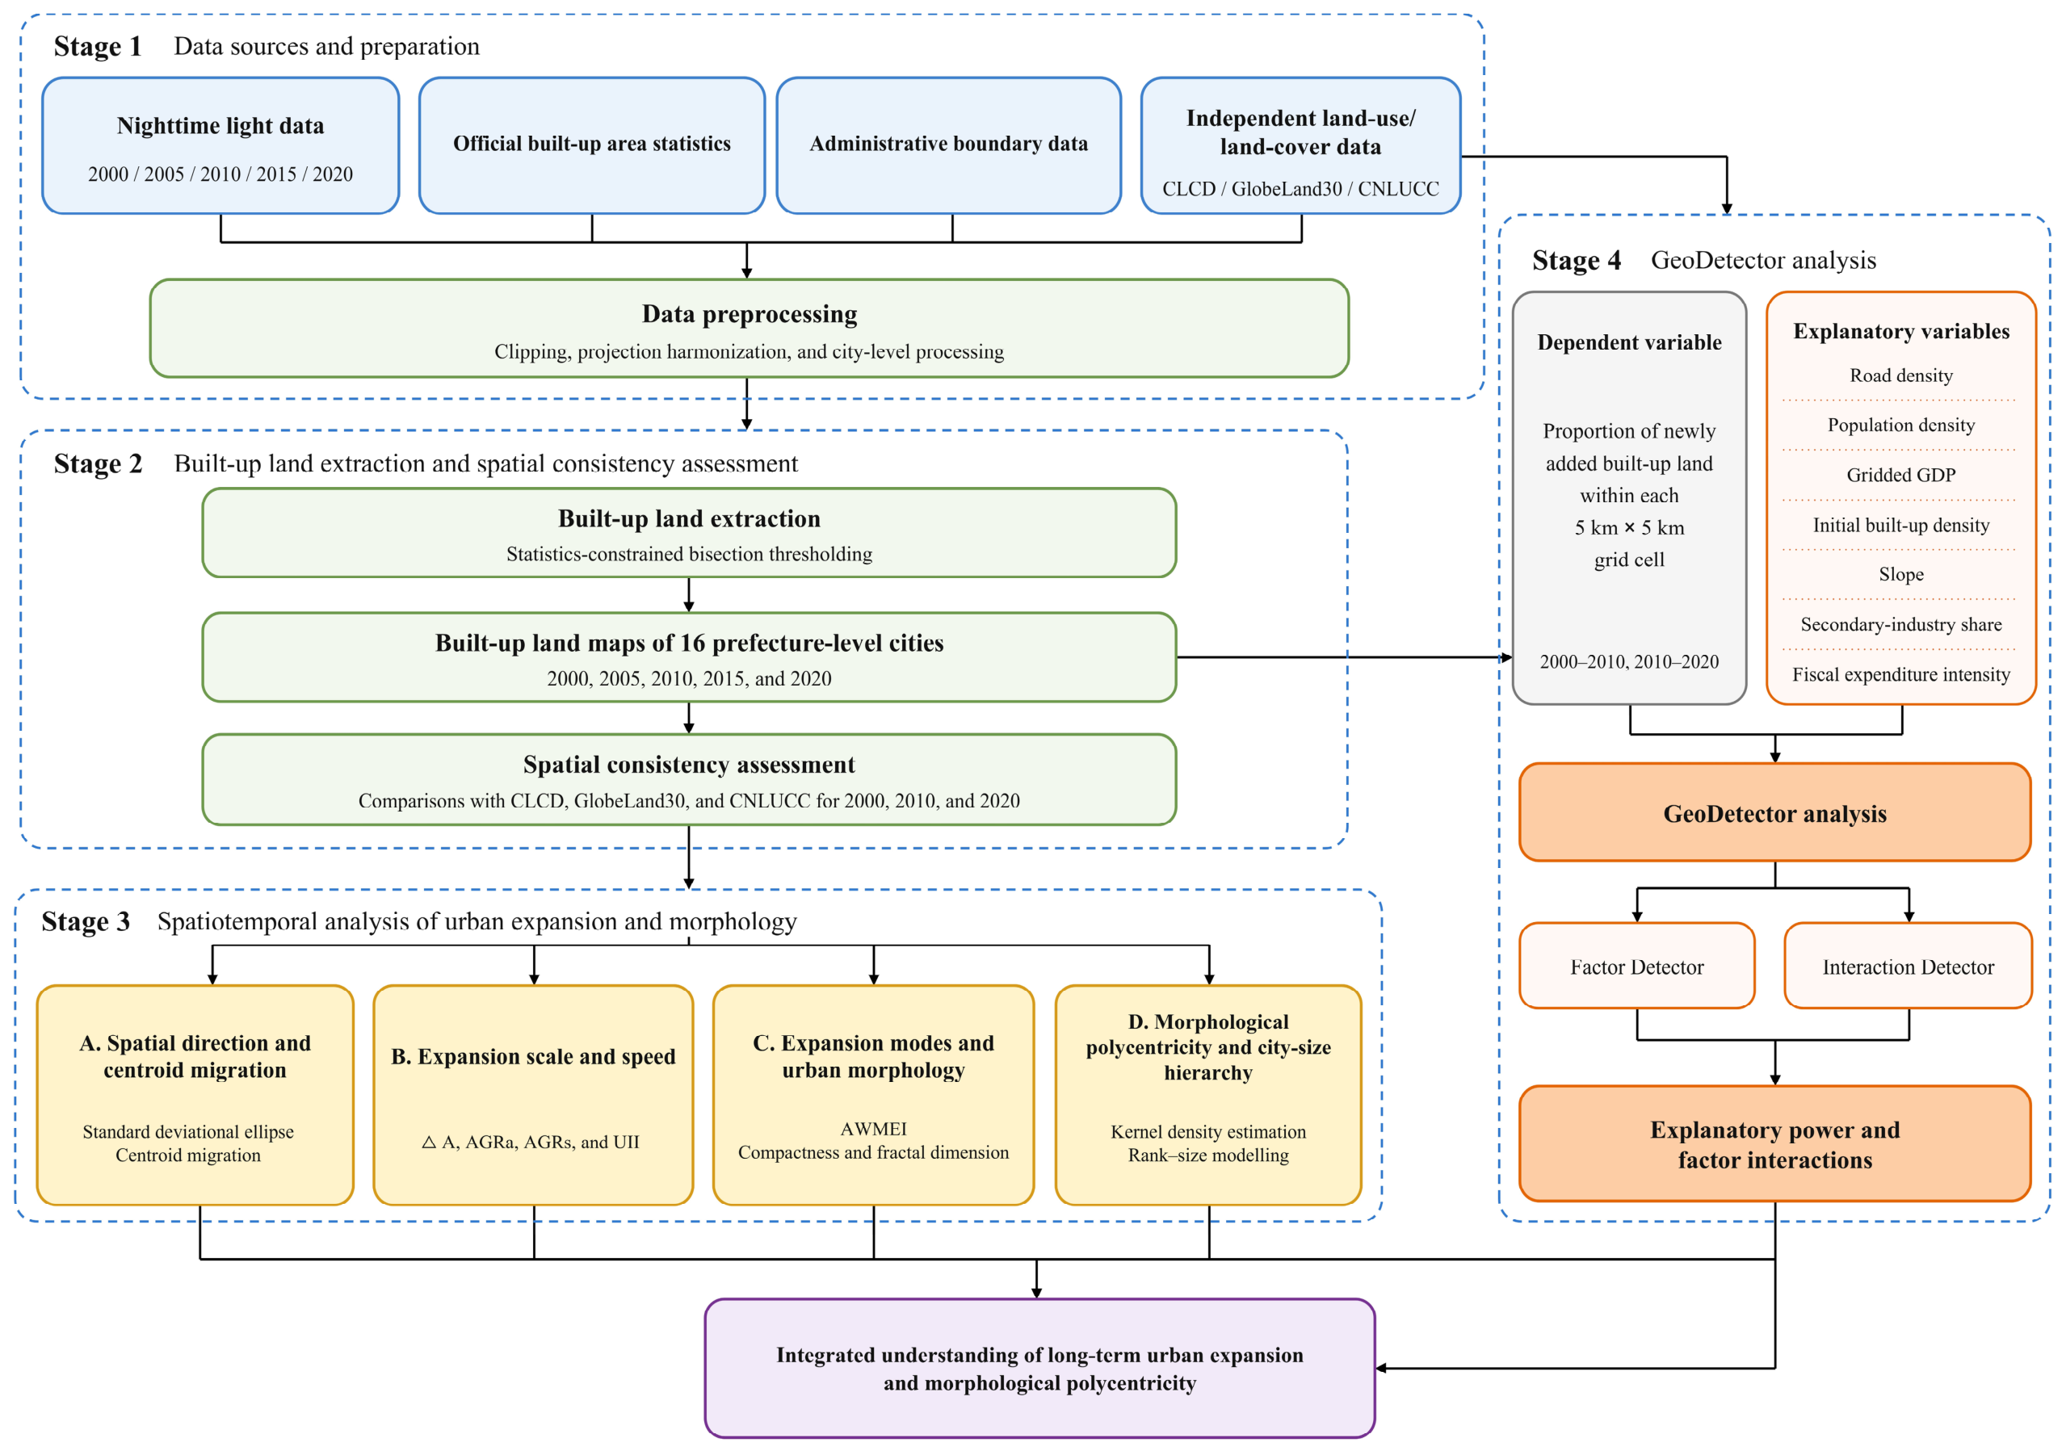
The methodological framework comprised four sequential stages (Figure 2). First, the nighttime-light, statistical, administrative, land-use/land-cover, socioeconomic, transport, and topographic data were prepared and spatially harmonized. Second, built-up land for 2000, 2005, 2010, 2015, and 2020 was extracted using the statistics-constrained bisection threshold method. The spatial consistency of the extracted results for 2000, 2010, and 2020 was then assessed using CLCD, GlobeLand30, and CNLUCC. Third, the long-term evolution of urban expansion was examined from four complementary dimensions: spatial direction and centroid migration, expansion scale and speed, expansion modes and urban morphology, and morphological polycentricity and city-size hierarchy. Finally, GeoDetector was applied to newly added built-up land during 2000–2010 and 2010–2020 to evaluate the explanatory power of seven factors and their interactions. Together, these analyses linked city-level expansion processes with changes in urban morphology and provincial urban structure.
Figure 2.
Methodological framework for analyzing urban expansion, morphological polycentricity, and associated factors in Shandong Province.
2.4. Statistics-Constrained Built-Up Land Extraction and External Consistency Assessment
Built-up land was extracted separately for each prefecture-level city and benchmark year using a statistics-constrained bisection threshold method [35,36,37,38]. Official built-up area statistics were used as the area constraint to reduce the subjectivity associated with manual threshold selection and to maintain comparability across cities and years. For each extraction unit, let and denote the maximum and minimum NTL pixel values, respectively. The initial threshold was calculated as:
Pixels with DN values greater than or equal to the current threshold T were classified as NTL-derived built-up land. Let A(T) denote the built-up area extracted using threshold T, and let S denote the corresponding statistical built-up area. When A(T) < S, the extracted area was smaller than the statistical area, indicating that the threshold was too high. The threshold was therefore reduced according to:
Conversely, when A(T) > S, the extracted area exceeded the statistical area, indicating that the threshold was too low. The threshold was therefore increased according to:
The updated threshold was used in the next iteration, and the search interval was progressively narrowed until the integer threshold remained unchanged between two consecutive iterations. The resulting city- and year-specific thresholds were then applied to generate built-up land maps for 2000, 2005, 2010, 2015, and 2020. The extracted rasters were subsequently converted into polygon features for the calculation of built-up area, perimeter, expansion characteristics, and morphological indicators.
The reliability of the extracted built-up land was further assessed from two complementary dimensions: area consistency and spatial overlap consistency. At the provincial scale, the relative differences between the NTL-derived and statistical built-up areas were only −0.126%, 0.013%, and −0.011% in 2000, 2010, and 2020, respectively, indicating close quantitative agreement with the statistical constraints. Spatial consistency was independently evaluated against CLCD, GlobeLand30, and CNLUCC. The proportions of their intersections with the NTL-derived built-up land ranged from 69.03% to 79.68% across the three benchmark years (Table 2). All overlap proportions exceeded 69%, and most increased or remained relatively high over time, indicating broad agreement in the spatial extent of developed land despite differences in data sources and land-cover definitions. Taken together, the close area agreement and consistent spatial overlap with three independent land-use/land-cover products provide additional support for the spatial consistency of the NTL-derived built-up land and its suitability for subsequent provincial- and prefecture-level comparative analyses.
Table 2.
Province-Level Area and Spatial Consistency of NTL-Derived Built-Up Land in 2000, 2010, and 2020.
2.5. Spatial Analytical Methods
2.5.1. Spatial Direction and Centroid Migration
The standard deviational ellipse (SDE) was used to characterize the centroid coordinates, dominant orientation, and spatial dispersion of the extracted built-up areas [39]. The binary built-up raster was used as the analytical input, and each built-up raster cell was weighted by the built-up area it represented. The area-weighted centroid coordinates were calculated as follows:
where and are the coordinates of raster cell i, is the built-up area represented by cell i, and n is the total number of built-up raster cells. Because all built-up rasters had the same spatial resolution, the raster cells had equal weights. The orientation of the spatial distribution was represented by the ellipse azimuth θ, calculated as:
The azimuth was measured clockwise from north (0°) to the major axis of the ellipse following the ArcGIS 10.8 software rule. A decrease in azimuth therefore indicates an anticlockwise rotation, whereas an increase indicates a clockwise rotation. The major and minor axes describe spatial dispersion along the primary and secondary directions, respectively. Centroid migration between consecutive benchmark years was further calculated from changes in centroid location to identify shifts in the spatial balance of built-up land. The SDE parameters and centroid migration were calculated consistently for 2000, 2005, 2010, 2015, and 2020.
2.5.2. Expansion Scale and Speed
Urban expansion was quantified using four complementary indicators: expansion amount (), annual average expansion amount (AGRa), annualized expansion rate (AGRs), and the urban expansion intensity index (UII) [40]. These indicators describe different dimensions of built-up land growth. and measure the absolute magnitude and annual amount of expansion, respectively. measures the relative annual growth of built-up land from its initial level, while expresses the annual expansion relative to the administrative area of each city. The four indicators were calculated for each prefecture-level city over the periods 2000–2005, 2005–2010, 2010–2015, and 2015–2020:
where and are the built-up areas at the beginning and end of each period, respectively; and denote the corresponding years; and is the administrative area of prefecture-level city i. is expressed in km2, in km2/yr, and and in %/yr. Together, these indicators distinguish absolute expansion from relative growth and facilitate comparison among cities with different initial built-up areas and administrative sizes.
2.5.3. Expansion Modes and Urban Morphology
Expansion modes and urban morphology were examined from two complementary perspectives. First, newly added built-up patches were identified by differencing the built-up land maps of two consecutive benchmark years. The Landscape Expansion Index (LEI) was then used to characterize the spatial relationship between each newly added patch and the pre-existing built-up land [41]:
where Ao,i is the area within the surrounding zone of newly added patch i that overlaps the pre-existing built-up land, and Av,i is the non-overlapping area. To summarize expansion characteristics at the prefecture-level city scale while accounting for differences in patch size, the Area-Weighted Mean Expansion Index (AWMEI) was calculated as:
where ai is the area of newly added patch i, and m is the total number of newly added patches. AWMEI ranges from 0 to 100 and was treated as a continuous city-level indicator. Higher values indicate stronger spatial adjacency between newly added and pre-existing built-up land. AWMEI was calculated for the four expansion periods: 2000–2005, 2005–2010, 2010–2015, and 2015–2020.
Second, fractal dimension and compactness were used to characterize the morphology of built-up areas at the prefecture-level city scale. Fractal dimension reflects boundary complexity, with higher values indicating more irregular and complex built-up boundaries [42]. Compactness measures the degree to which built-up land approximates a compact spatial form, with higher values indicating greater spatial concentration [43]. However, neither indicator should be interpreted independently as a direct measure of land-use efficiency or urban sustainability. The two indicators were calculated as follows:
where D is fractal dimension, CI is the compactness index, A is built-up area, and P is the perimeter of the built-up area. Both indicators were calculated for 2000, 2005, 2010, 2015, and 2020. Together, AWMEI and the two morphological indicators distinguish the spatial organization of recent expansion from the cumulative form produced by long-term built-up land growth.
2.5.4. Morphological Polycentricity and City-Size Hierarchy
Morphological polycentricity was assessed from two complementary dimensions, including the spatial distribution of built-up concentrations and the relative size hierarchy of prefecture-level cities. Kernel density estimation (KDE) was first used to characterize the spatial concentration and continuity of built-up land and to identify changes in major and secondary built-up nodes [20]. For each benchmark year, the centers of all 1 km raster cells classified as NTL-derived built-up land were converted into unweighted points, with each point representing one built-up cell and contributing equally to the density estimation. The kernel density at location x was calculated as:
where is the kernel density at location x, r is the search radius, k is the kernel function, is the location of point i, and n is the total number of built-up points. KDE was implemented in ArcGIS 10.8 using the standard quartic kernel, a fixed search radius of 50 km, and an output cell size of 1 km. The 50 km radius was selected as the baseline setting to balance the identification of major and secondary built-up concentrations with regional spatial continuity. To evaluate the sensitivity of the KDE results to the search radius, additional analyses were conducted using radii of 30 and 70 km while keeping the point-generation method, weighting scheme, output cell size, analysis extent, and other settings unchanged. The 50 km results were used for the main analysis, while the 30 and 70 km results were used for sensitivity comparison. The same KDE settings were applied consistently across all benchmark years to ensure temporal comparability.
The rank–size rule was then used to examine the relative size hierarchy of the 16 prefecture-level cities [44,45]. City size was represented by the extracted built-up area rather than population, GDP, or other measures of urban influence. The rank–size relationship was expressed as:
After logarithmic transformation, the model becomes:
where is the built-up area of the city ranked r, is the fitted built-up area of the first-ranked city, and q is the Zipf exponent. A larger q indicates a steeper size hierarchy and stronger dominance of higher-ranked cities, whereas a smaller q indicates a flatter and more balanced distribution of built-up land across the provincial urban system. Differences among the year-specific rank–size regression slopes were further tested using a pooled regression model that included interaction terms between year and ln(rank).
KDE and rank–size analysis therefore provide complementary evidence of morphological polycentricity by describing, respectively, the spatial distribution of built-up nodes and the relative size hierarchy among cities. This interpretation refers specifically to morphological polycentricity and does not represent functional relationships among cities.
2.5.5. GeoDetector Analysis
GeoDetector is a spatial statistical method used to quantify the explanatory power of spatially stratified factors for the spatial differentiation of a geographical phenomenon [46,47,48]. In this study, GeoDetector was used to quantify the explanatory power of selected factors for the spatial differentiation of newly added built-up land and to examine their pairwise interactions. A regular 5 km × 5 km grid was constructed within Shandong Province, and the study period was divided into 2000–2010 and 2010–2020. For each period, the dependent variable was defined as the proportion of newly added built-up land within the effective area of each grid cell. Seven explanatory variables were considered: road density, population density, gridded GDP, initial built-up density, slope, the share of secondary industry, and fiscal expenditure intensity. For temporally varying explanatory variables, period-average values were used to represent the socioeconomic and accessibility conditions of each analysis period. Specifically, the mean values for 2000 and 2010 were used for the 2000–2010 analysis, while those for 2010 and 2020 were used for the 2010–2020 analysis. Initial built-up density was treated differently because it represents the pre-existing urban development context and was therefore derived from built-up land at the beginning of each period, namely 2000 and 2010, respectively. All continuous explanatory variables were classified into five categories using the same equal-frequency rank method to maintain comparability between the two periods.
The factor detector measures the explanatory power of each factor for the spatial differentiation of newly added built-up land using the statistic:
where denotes a stratum of explanatory variable X; is the number of strata; and are the number of grid cells and the variance of the dependent variable within stratum h, respectively; and and are the corresponding values for the entire study area. The value ranges from 0 to 1, with a larger q value indicating greater explanatory power for the spatial differentiation of newly added built-up land.
The interaction detector was further used to evaluate whether two factors jointly provided greater explanatory power than either factor individually. Let and denote the individual explanatory power of two factors and their joint explanatory power. Bivariate enhancement was identified when:
whereas nonlinear enhancement was identified when:
Factor and interaction detection were conducted separately for 2000–2010 and 2010–2020. The results were used to compare temporal changes in factor explanatory power and interactions associated with the spatial differentiation of urban expansion, rather than to infer direct causal relationships.
3. Results
3.1. Expansion Direction and Centroid Migration
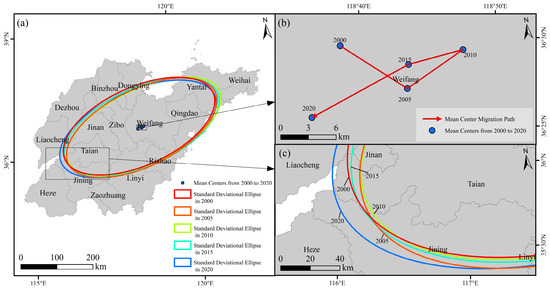
The spatial distribution of built-up land in Shandong maintained a northeast–southwest orientation throughout 2000–2020 (Figure 3 and Table 3). The SDE azimuth varied within a narrow range of 63.93–66.37°, with a total variation of 2.44°. The major-axis length increased from 225.40 to 232.56 km, whereas the minor-axis length changed from 108.25 to 106.79 km. These results show that the dominant orientation of built-up land remained consistent over the study period, while spatial dispersion increased mainly along the major axis.
Figure 3.
Spatial evolution of the standard deviational ellipse and centroid of NTL-derived built-up land in Shandong Province from 2000 to 2020: (a) standard deviational ellipses and centroid locations for the five benchmark years; (b) centroid migration path; and (c) enlarged view of the standard deviational ellipses.
Table 3.
Temporal changes in centroid coordinates, migration characteristics, and standard deviational ellipse parameters of nighttime-light-derived built-up land in Shandong Province, 2000–2020.
The centroid showed alternating directional shifts across the four periods. It moved 8.60 km southeastward during 2000–2005 and 7.35 km northeastward during 2005–2010, followed by southwestward shifts of 6.11 km during 2010–2015 and 11.92 km during 2015–2020. The 2020 centroid was located approximately 8.23 km southwest of its 2000 position. Taken together, the SDE and centroid results indicate a persistent northeast–southwest spatial structure, accompanied by a net southwestward shift in the spatial balance of built-up land.
3.2. Spatiotemporal Differentiation in Expansion Scale and Speed
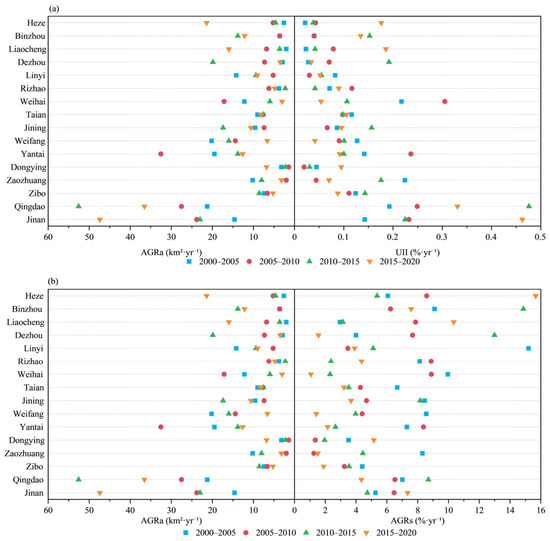
As shown in Figure 4, between 2000 and 2020, the built-up area of Shandong increased from 1912.10 to 5646.04 km2, representing a cumulative increase of 3733.94 km2 and a 2.95-fold expansion relative to 2000. The AGRa values for the four periods were 156.30, 174.75, 208.63, and 207.11 km2/yr, respectively, showing that absolute annual expansion remained above 207 km2/yr after 2010. In contrast, AGRs declined from 7.09%/yr in 2000–2005 to 4.14%/yr in 2015–2020. UII increased from 0.1003%/yr in 2000–2005 to 0.1339%/yr in 2010–2015 and was 0.1329%/yr in 2015–2020. These results show that Shandong maintained a high absolute expansion scale after 2010, while the relative growth rate continued to decrease.
Figure 4.
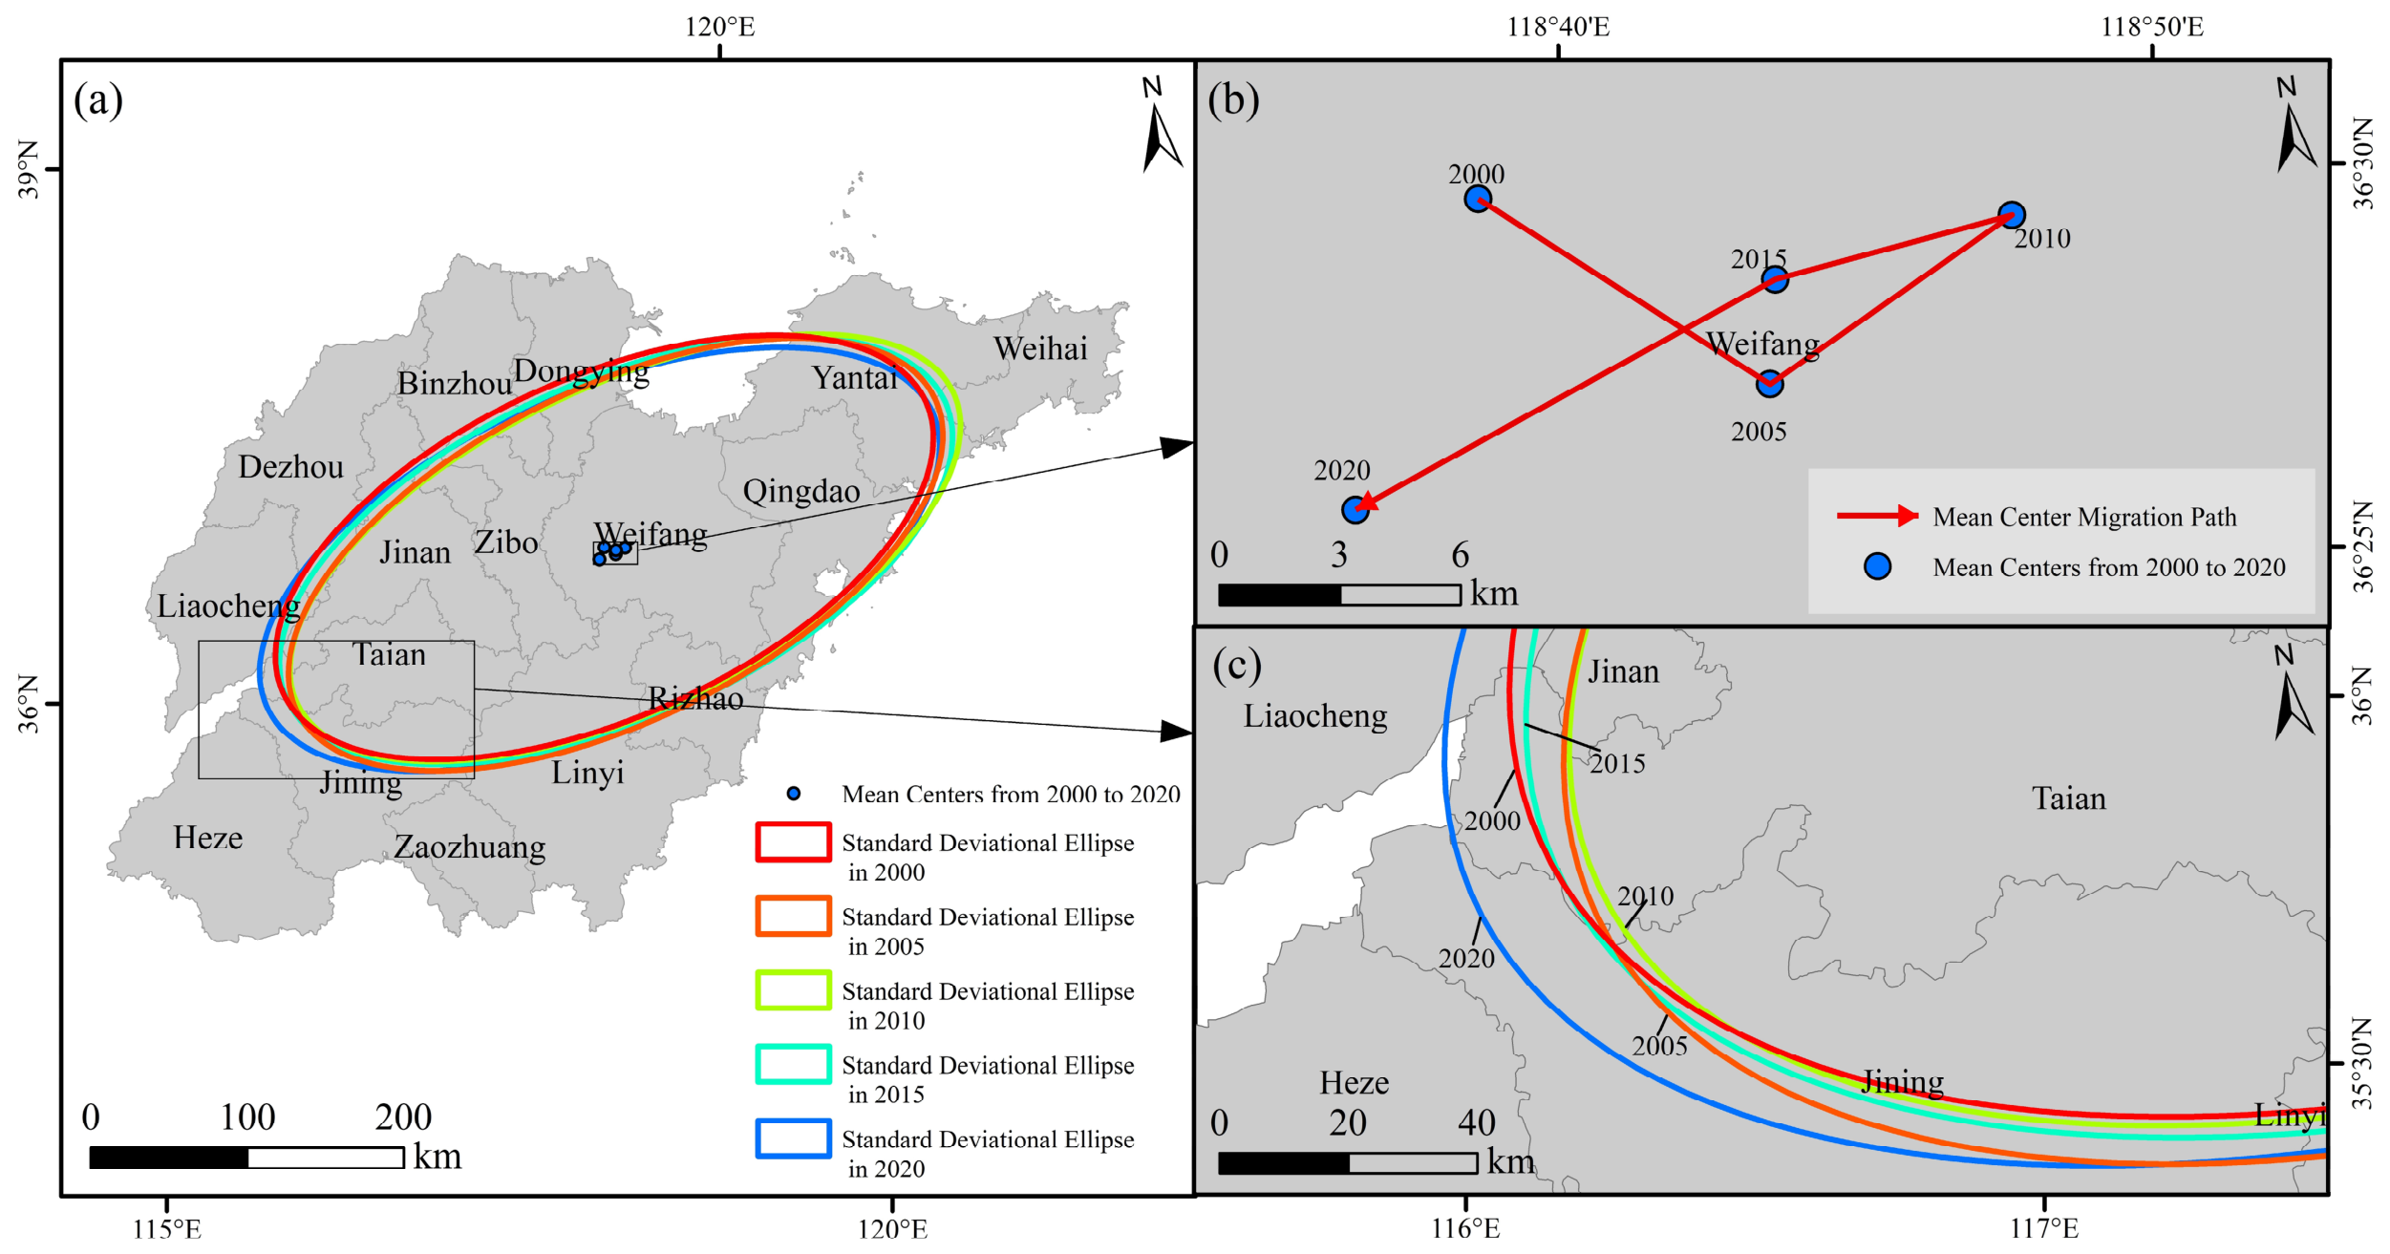
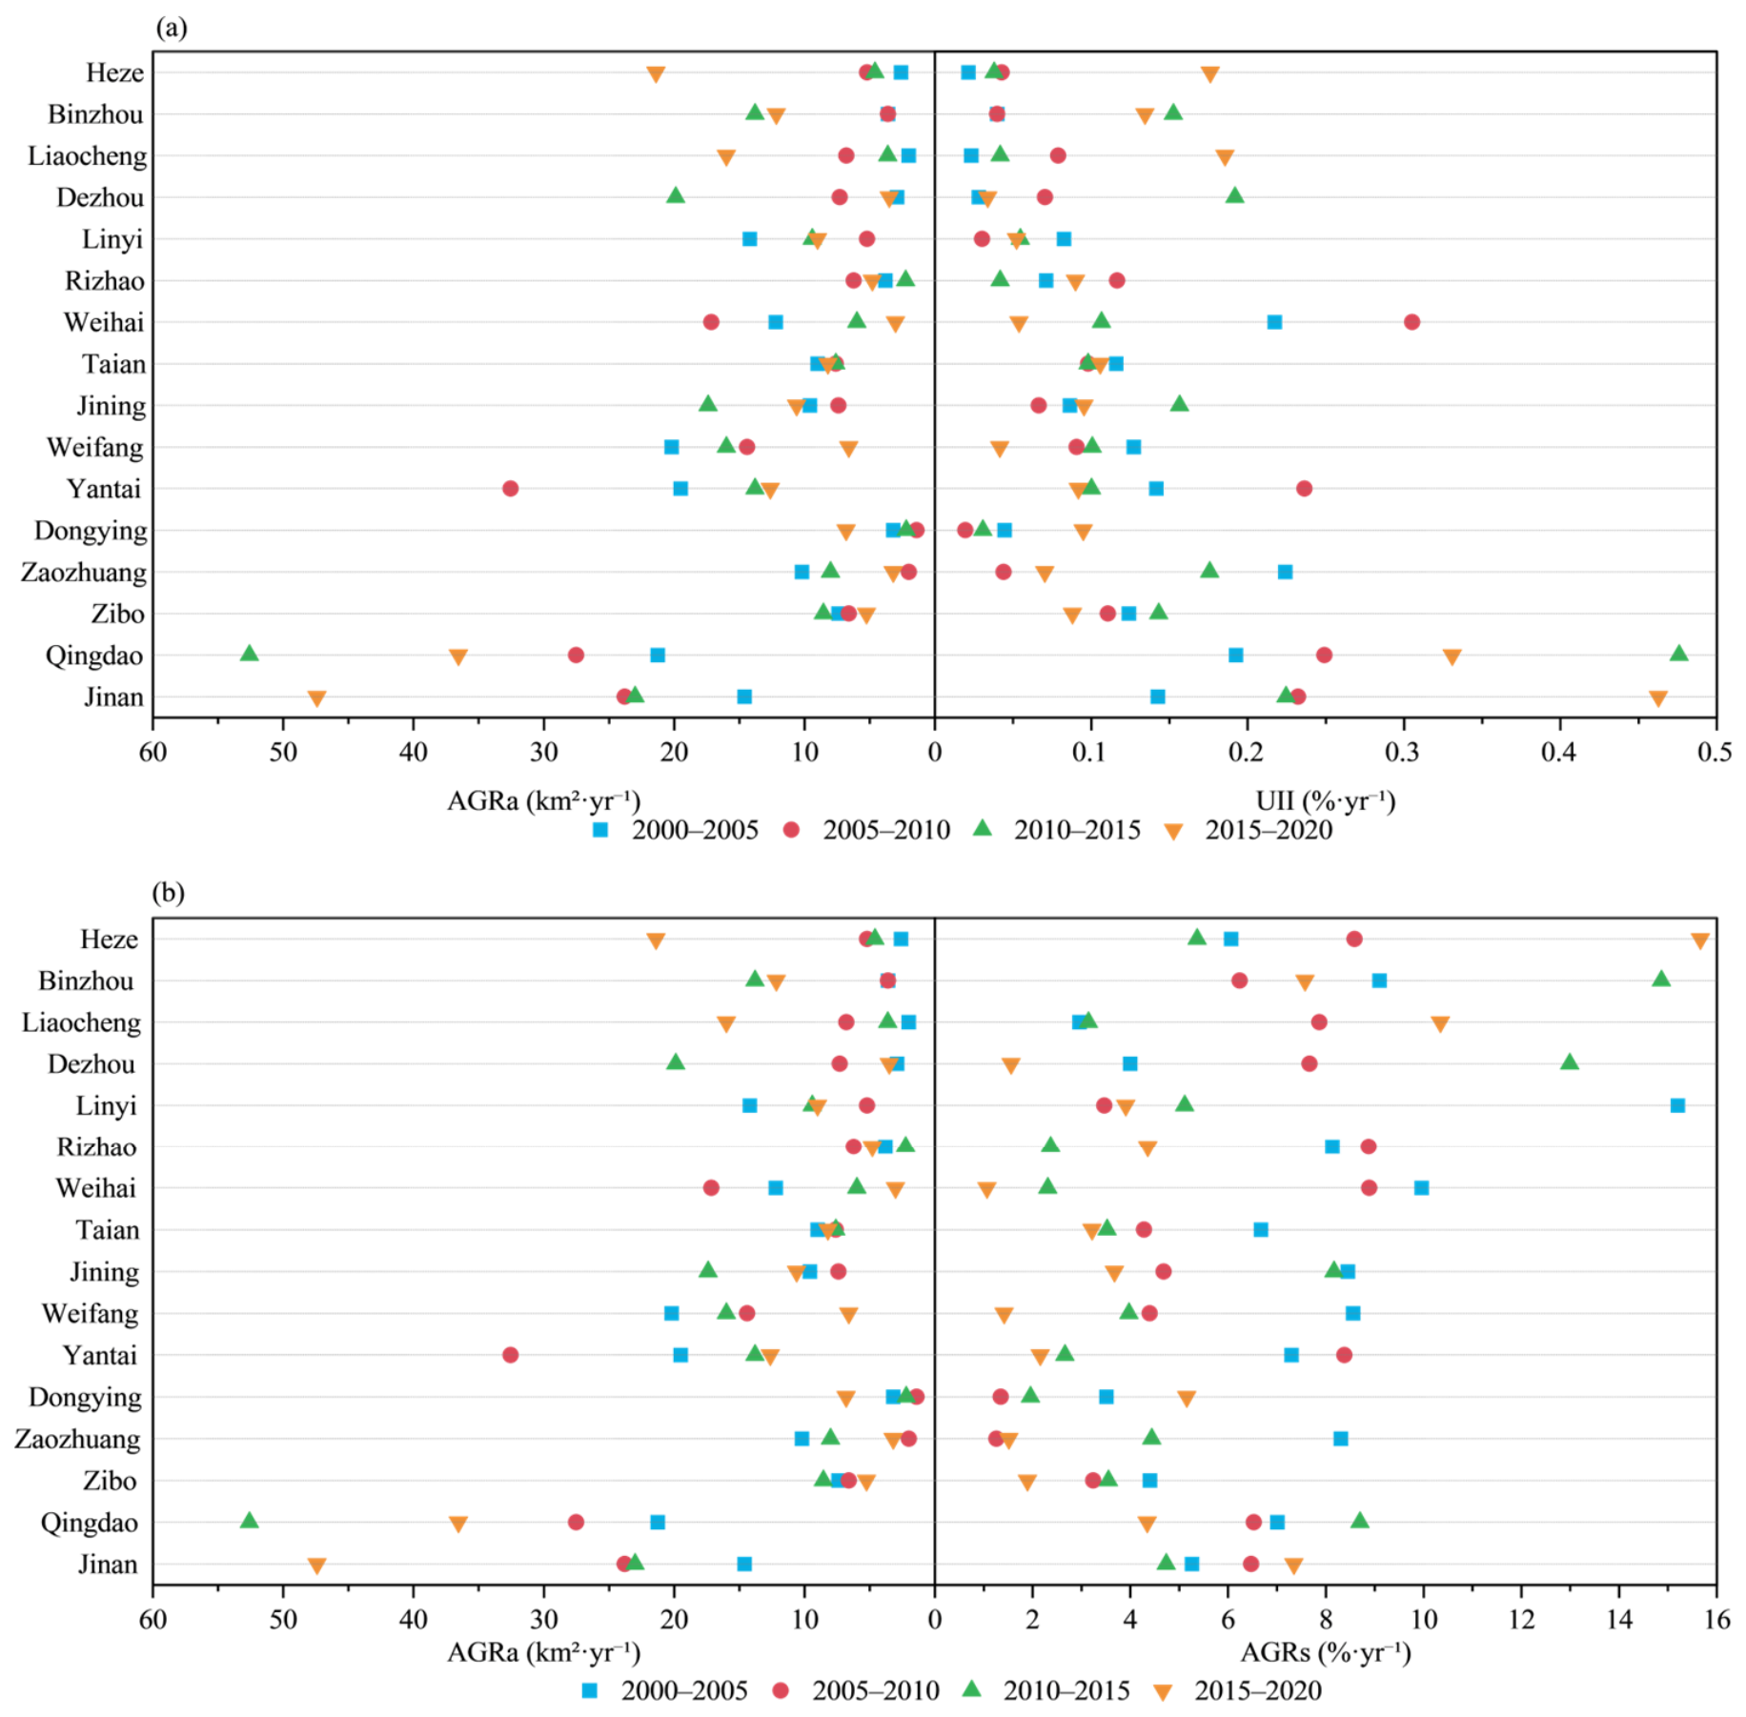
Intercity differentiation in built-up land expansion scale, rate, and intensity in Shandong Province during 2000–2020: (a) annual average expansion amount (AGRa) and urban expansion intensity index (UII), and (b) AGRa and annualized expansion rate (AGRs). Symbols represent the four expansion periods.
Intercity differences in expansion were pronounced across the four periods. During 2000–2005, Qingdao, Weifang, and Yantai recorded the largest increases, at 106.36, 101.00, and 97.55 km2, respectively. During 2005–2010, Yantai, Qingdao, and Jinan had AGRa values of 32.56, 27.53, and 23.80 km2/yr and together accounted for 48.00% of the provincial increment. Qingdao reached an AGRa of 52.58 km2/yr during 2010–2015 and contributed 25.20% of the province-wide increase in that period. During 2015–2020, Jinan ranked first with an AGRa of 47.40 km2/yr, while expansion also strengthened in Heze, Liaocheng, and Binzhou. Over the full 2000–2020 period, Qingdao, Jinan, and Yantai remained the three largest contributors, jointly accounting for 43.55% of the total increase in built-up land.
The city rankings based on AGRa, AGRs, and UII differed substantially (Figure 4). Jinan and Qingdao repeatedly ranked high in both AGRa and UII, reflecting their large absolute increments and high expansion intensity relative to administrative area. By comparison, several cities recorded high AGRs without corresponding high AGRa or UII values. For example, AGRs reached 14.87%/yr in Binzhou during 2010–2015 and 15.66%/yr in Heze during 2015–2020, whereas Jinan ranked first in both AGRa and UII in the final period. The combined indicators therefore distinguish cities characterized by large absolute expansion from those characterized primarily by rapid relative growth.
3.3. Evolution of Expansion Modes and Urban Morphology
AWMEI showed substantial temporal and intercity variation in the spatial relationship between newly added and pre-existing built-up land (Table 4). The mean value across the 16 cities increased from 32.06 in 2000–2005 to 35.33 in 2005–2010, decreased to 32.23 in 2010–2015, and rose again to 34.67 in 2015–2020, indicating no monotonic provincial trend. Intercity differences were also pronounced. Qingdao increased from 20.39 in 2000–2005 to 50.85 in 2015–2020, the highest value among all cities and periods. In the final period, Yantai, Zaozhuang, and Taian also recorded values above 42, whereas Binzhou, Linyi, Weihai, and Heze remained below 27. These results indicate that the spatial adjacency of new development to existing built-up land varied markedly across both cities and periods.
Table 4.
Area-weighted mean expansion index (AWMEI) of built-up land expansion across the 16 prefecture-level cities of Shandong Province, 2000–2020.
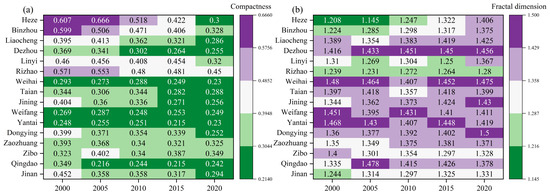
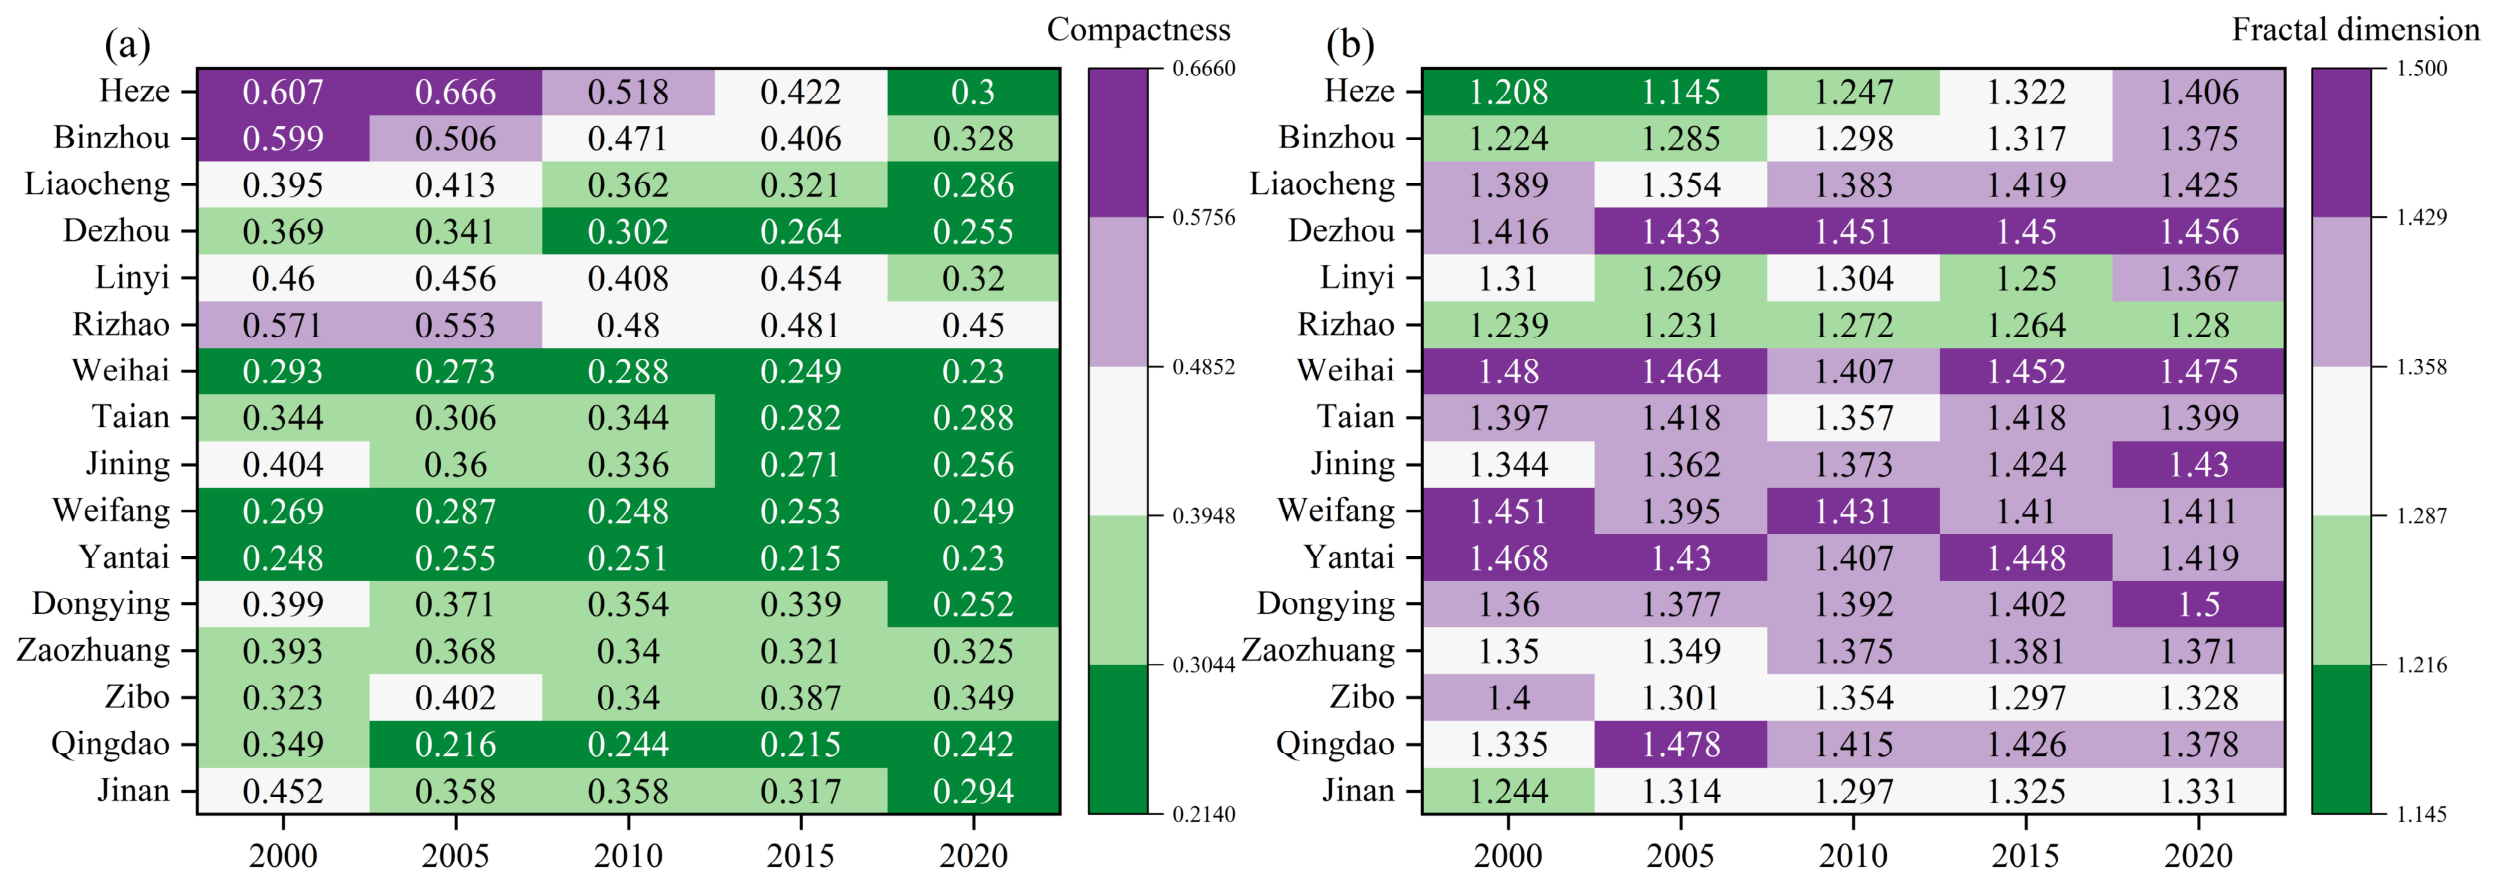
Whereas AWMEI fluctuated across periods, the cumulative morphology of built-up land exhibited a clearer long-term trajectory (Figure 5). Mean compactness across the 16 cities declined from 0.405 in 2000 to 0.291 in 2020, a decrease of 28.11%, and 15 of the 16 cities recorded lower compactness at the end of the study period. Over the same period, mean fractal dimension increased from 1.351 to 1.397. Heze, Binzhou, and Dongying showed the largest increases in fractal dimension, while Zibo followed a contrasting trajectory, with compactness increasing from 0.323 to 0.349 and fractal dimension decreasing from 1.400 to 1.328. The province-wide pattern therefore points to a general decline in compactness accompanied by increasing boundary complexity.
Figure 5.
Temporal variation in the compactness (a) and fractal dimension (b) of nighttime-light-derived built-up land across prefecture-level cities in Shandong Province from 2000 to 2020.
The contrast between AWMEI and the two morphological indicators further shows that the spatial organization of recent expansion did not always translate directly into changes in the accumulated urban form. During 2015–2020, Qingdao recorded an AWMEI of 50.85, while compactness increased from 0.215 to 0.242 and fractal dimension decreased from 1.426 to 1.378. Jinan also recorded a higher AWMEI in the final period, rising from 30.61 to 39.04, but its compactness continued to decline and its fractal dimension increased. These contrasting trajectories show that stronger adjacency between newly added and pre-existing built-up land can occur alongside different long-term morphological responses. Overall, Shandong combined strong intercity variation in expansion mode with a general shift toward lower compactness and greater boundary complexity over 2000–2020.
3.4. Morphological Polycentricity and Evolution of the City-Size Hierarchy
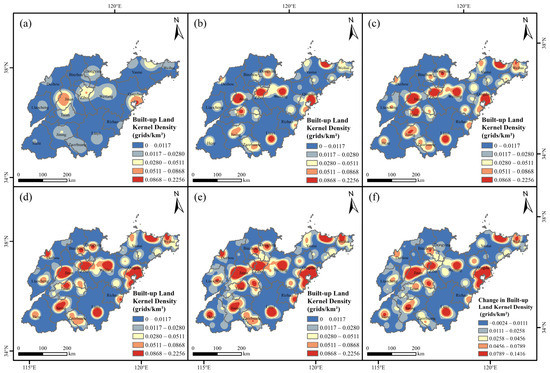
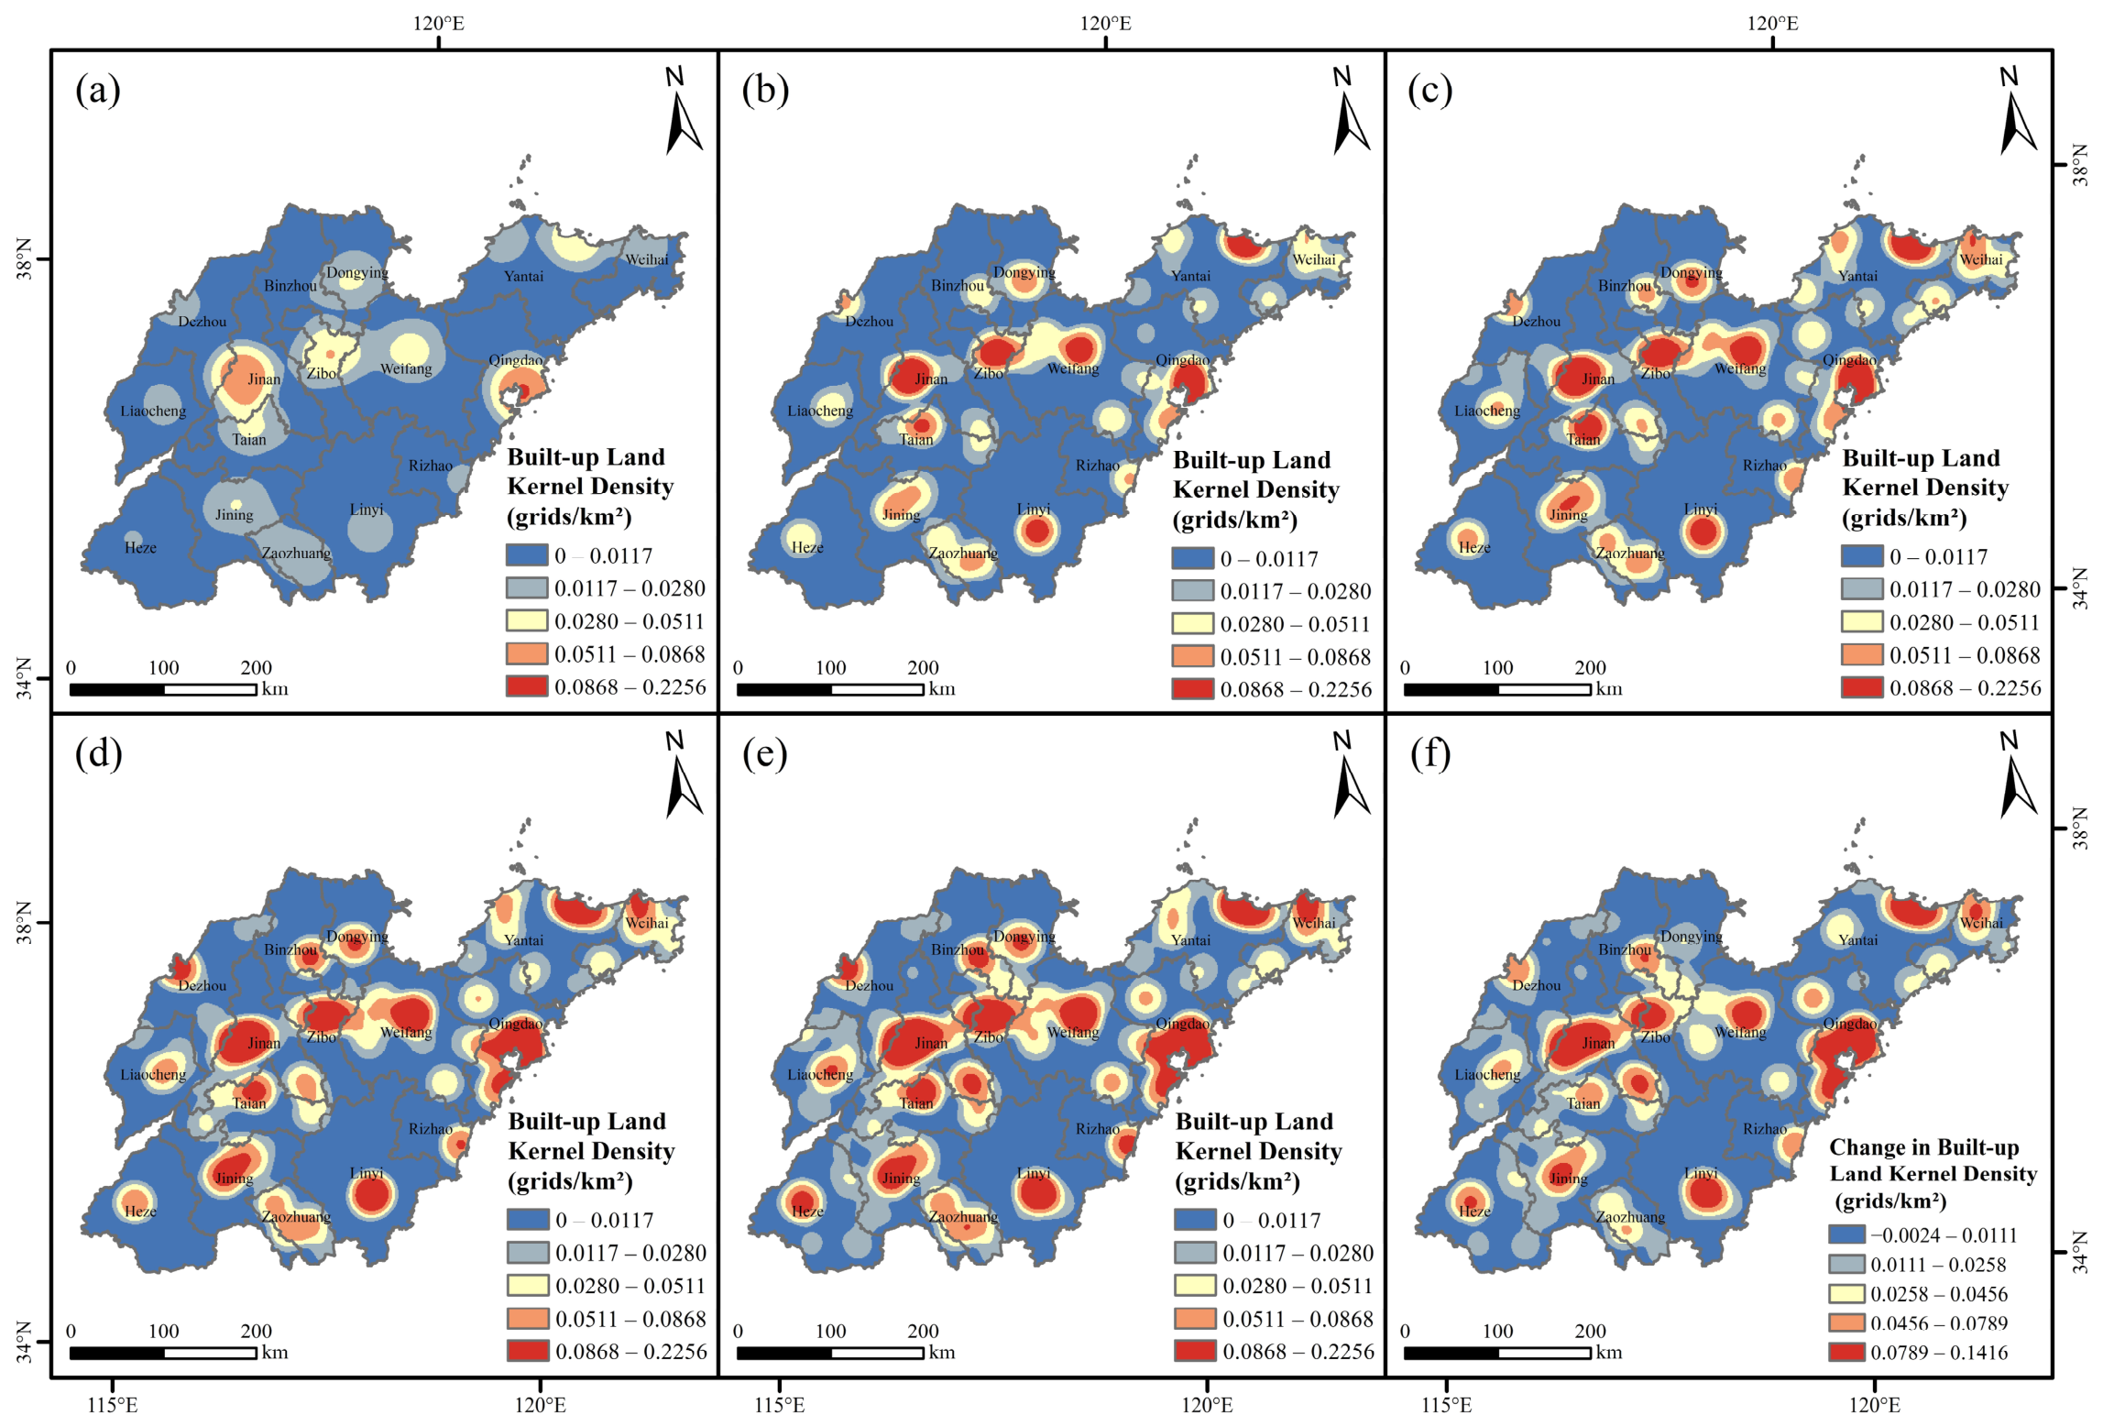
The spatial concentration of built-up land in Shandong evolved from a dual-core pattern toward a more pronounced multinodal structure between 2000 and 2020 (Figure 6). In 2000, the highest-density areas were concentrated around Jinan and Qingdao, with smaller secondary concentrations around Zibo, Weifang, and Yantai. By 2010, the Zibo–Weifang concentrations had strengthened, and clearer secondary nodes had emerged around Yantai, Jining, and Linyi. The multinodal pattern became more evident by 2020. Spatial continuity increased along the Jinan–Zibo–Weifang–Qingdao axis, while secondary nodes became more distinct in northern Jiaodong, southwestern Shandong, and southern Shandong. Despite these changes, Jinan and Qingdao remained the two principal built-up centers throughout the study period. The search-radius sensitivity analysis showed that varying the radius from 30 to 70 km primarily affected local detail and the degree of spatial smoothing. The 30 km radius retained more localized high-density peaks, whereas the 70 km radius produced stronger smoothing and merged some adjacent peaks. Nevertheless, the principal high-density cores and the overall spatial configuration remained stable across all three radii (Figure 6; Figures S1 and S2), supporting the robustness of the KDE-based spatial interpretation.
Figure 6.
Kernel-density patterns of NTL-derived built-up land in Shandong Province in (a) 2000, (b) 2005, (c) 2010, (d) 2015, and (e) 2020, and (f) changes in kernel density between 2000 and 2020.
A complementary pattern was identified in the city-size hierarchy (Table 5). The rank–size relationships were statistically significant in all five benchmark years (p < 0.001), with R2 values ranging from 0.8345 to 0.9532. The Zipf exponent remained relatively stable between 0.7684 and 0.7853 from 2000 to 2015 and decreased to 0.7075 in 2020, indicating a tendency toward a flatter city-size gradient in the later stage of the study period. A direct comparison of the year-specific regression slopes did not identify statistically significant differences among the five benchmark years (F (4,70) = 0.205, p = 0.935), suggesting overall continuity in the underlying rank–size structure rather than an abrupt restructuring. Nevertheless, the lower estimated exponent in 2020 was consistent with the relative strengthening of several middle- and lower-ranked cities, including Jining, Linyi, Heze, and Binzhou, while Qingdao, Jinan, and Yantai generally remained at the upper end of the hierarchy.
Table 5.
Rank–size parameters of NTL-derived built-up land among prefecture-level cities in Shandong Province, 2000–2020.
Taken together, the KDE and rank–size results indicate a gradual strengthening of morphological polycentricity within a persistent dual-core structure. Secondary built-up nodes became more distinct and spatially continuous, while the city-size hierarchy showed a modest tendency toward a more balanced distribution. At the same time, Jinan and Qingdao retained their dominant positions throughout the study period. These combined patterns suggest that the evolution of morphological polycentricity in Shandong was driven primarily by the strengthening of secondary centers and increasing spatial continuity among built-up concentrations, rather than by a statistically abrupt change in the overall city-size hierarchy. This interpretation refers specifically to the spatial distribution and relative size of built-up land and does not imply functional polycentricity based on intercity flows.
3.5. Temporal Shifts in the Explanatory Structure of Urban Expansion
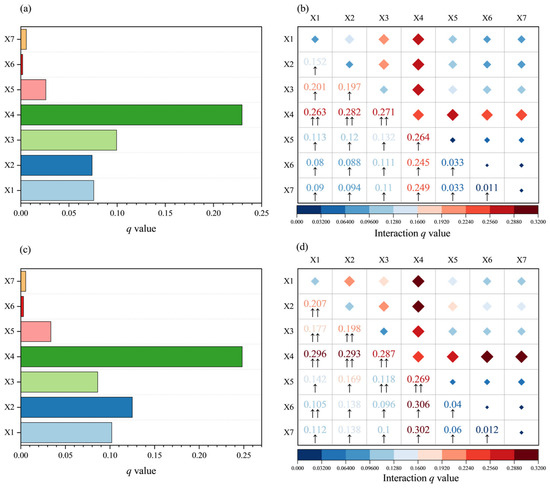
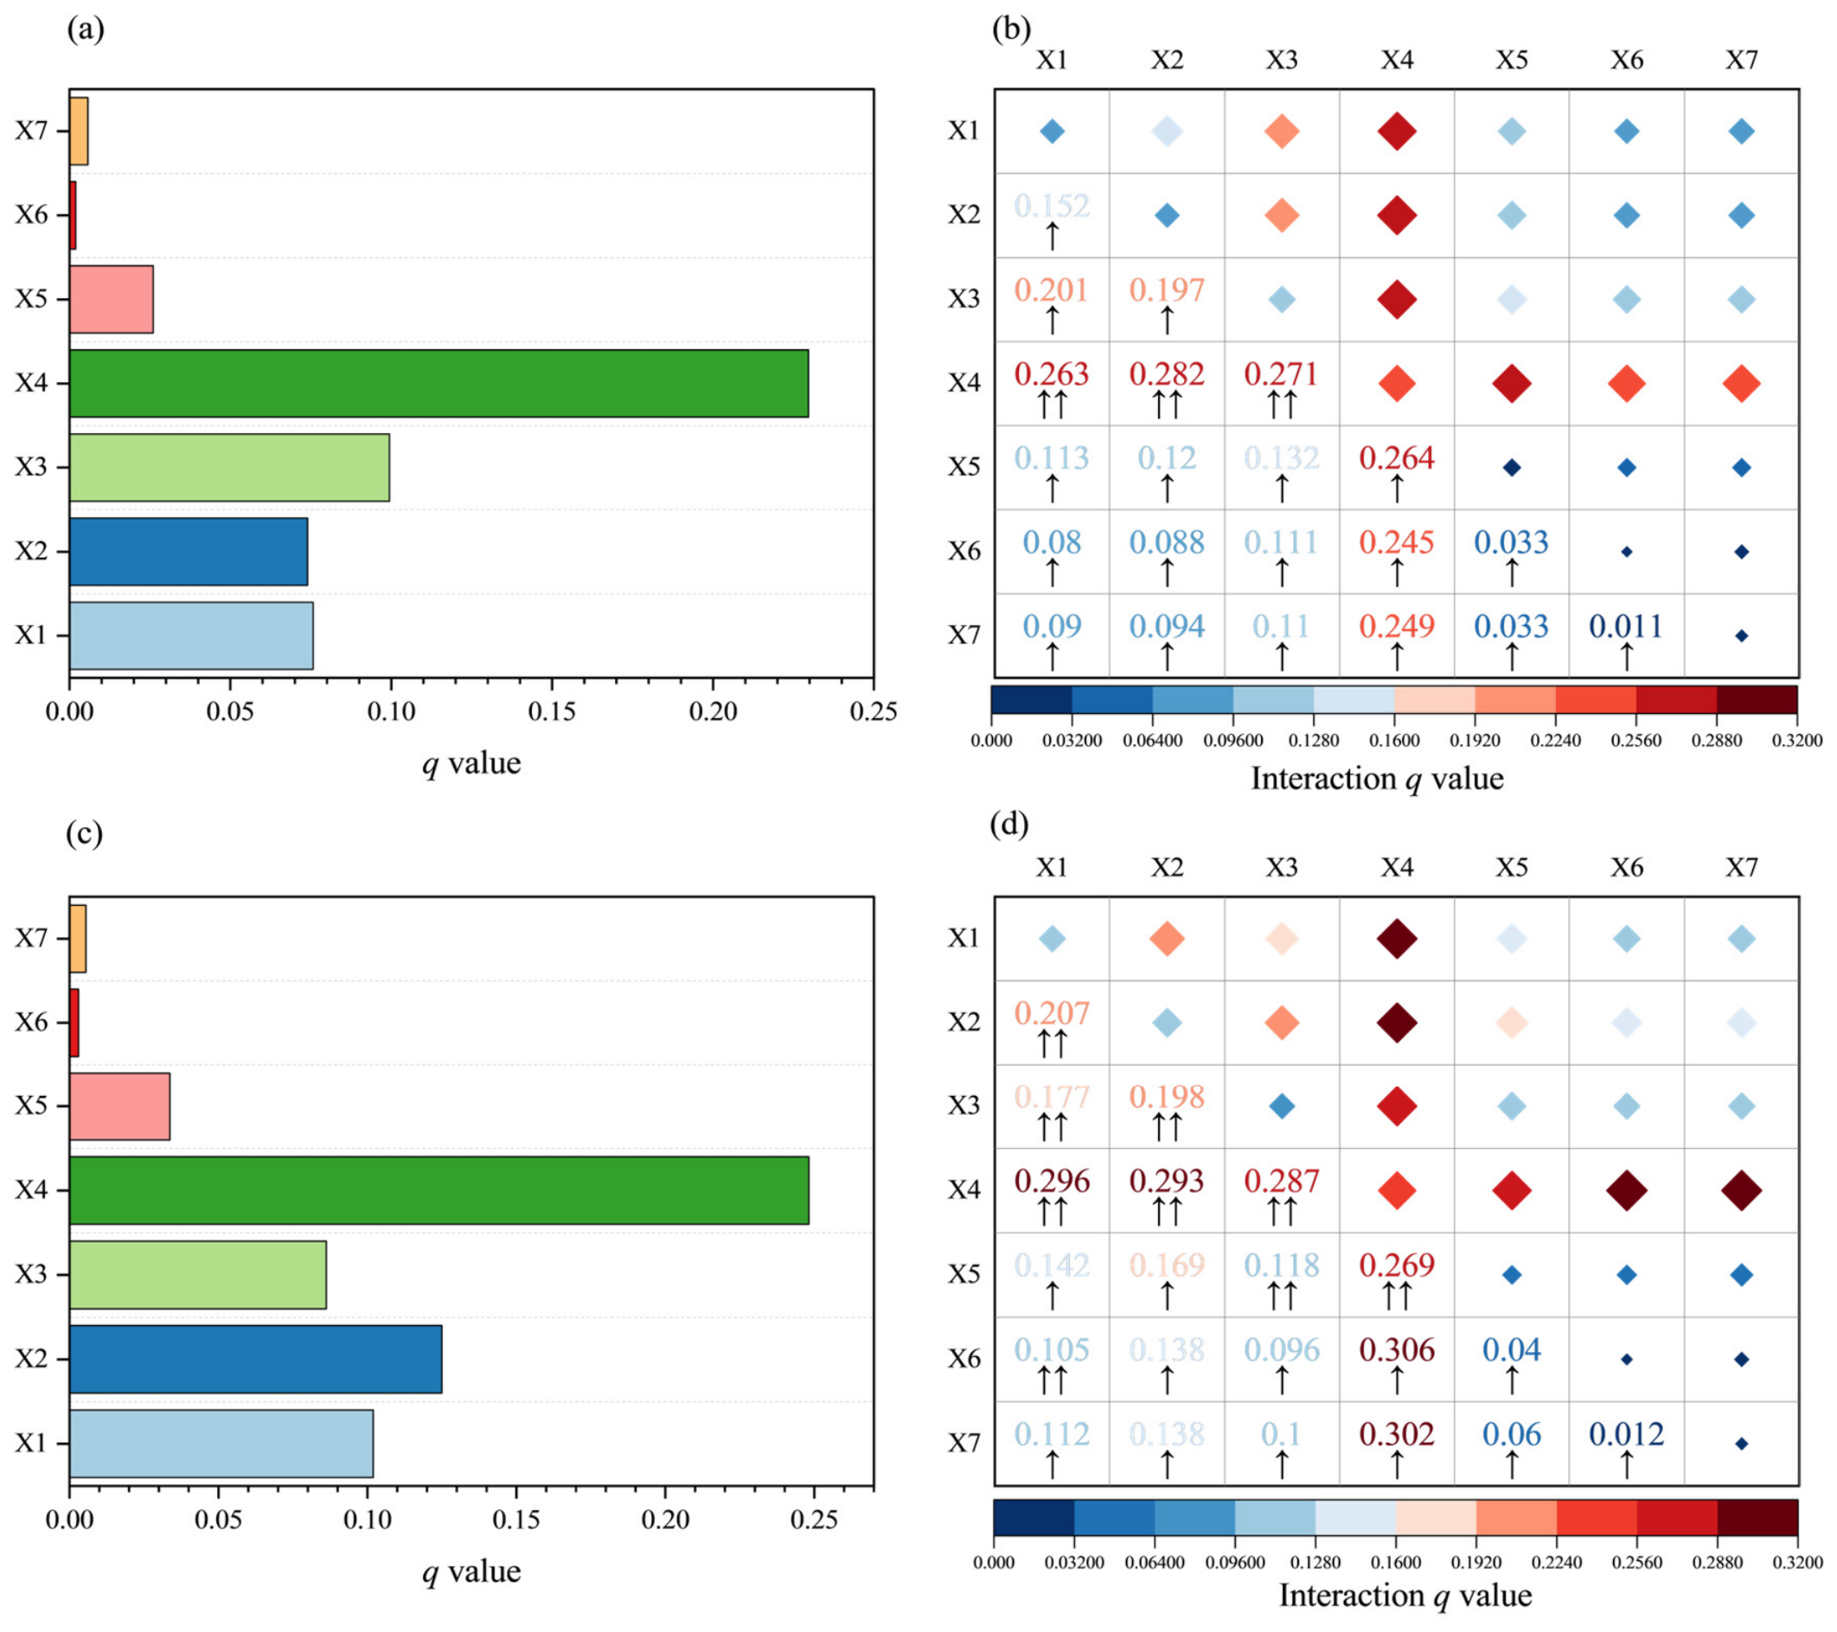
A clear temporal reordering was evident in the factors associated with the spatial differentiation of newly added built-up land (Figure 7). During 2000–2010, gridded GDP had the highest explanatory power among the factors other than initial built-up density (q = 0.0994), followed by road density (0.0757) and population density (0.0740). This ordering changed during 2010–2020. Population density increased to 0.1250 and became the strongest factor after initial built-up density, while road density increased to 0.1020. By contrast, the explanatory power of gridded GDP decreased to 0.0862. Population density showed the largest increase in q (+0.0510), followed by road density (+0.0263), whereas GDP decreased by 0.0133. The q value of slope also increased, from 0.0260 to 0.0337. The share of secondary industry and fiscal expenditure intensity remained below 0.006 in both periods. Initial built-up density retained the highest overall explanatory power, with q increasing from 0.2296 to 0.2481. This result indicates a persistent association between subsequent expansion and the existing built-up pattern.
Figure 7.
Temporal changes in GeoDetector results for the spatial differentiation of newly added built-up land in Shandong Province: (a) factor detector for 2000–2010; (b) interaction detector for 2000–2010; (c) factor detector for 2010–2020; and (d) interaction detector for 2010–2020. Bar lengths represent the explanatory power (q) of individual factors, while diamond size and color indicate the joint explanatory power of factor interactions. X1, road density; X2, population density; X3, gridded GDP; X4, initial built-up density; X5, slope; X6, share of secondary industry; and X7, fiscal expenditure intensity. ↑ indicates nonlinear enhancement, whereas ↑↑ indicates bivariate enhancement.
The interaction results further support this temporal shift. During 2000–2010, the strongest interactions excluding initial built-up density were road density × GDP (q = 0.201) and population density × GDP (0.197), followed by road density × population density (0.152). During 2010–2020, road density × population density increased to 0.207 and became the strongest interaction in this group, whereas road density × GDP declined to 0.177. Several population-related interactions also increased. Population density × slope rose from 0.120 to 0.169, population density × secondary industry from 0.088 to 0.138, and population density × fiscal expenditure intensity from 0.094 to 0.138. In contrast, population density × GDP remained nearly unchanged at 0.197–0.198. These changes indicate that population density showed stronger joint explanatory power across a broader range of spatial conditions in the later period.
Initial built-up density remained involved in the highest-q interactions in both periods, although the composition of these combinations changed. During 2000–2010, its strongest interaction was with population density (q = 0.282), followed by GDP (0.271), slope (0.264), and road density (0.263). During 2010–2020, its interactions with the share of secondary industry and fiscal expenditure intensity increased to 0.306 and 0.302, respectively. These were followed by interactions with road density (0.296), population density (0.293), and GDP (0.287). Notably, the share of secondary industry and fiscal expenditure intensity had individual q values below 0.006, but their interactions with initial built-up density reached 0.306 and 0.302. The composition of interaction types also changed. Nonlinear enhancement decreased from 18 of 21 factor pairs in 2000–2010 to 12 of 21 in 2010–2020, whereas bivariate enhancement increased from 3 to 9 pairs.
Taken together, the results reveal a temporal shift in the explanatory structure of urban expansion rather than a fixed hierarchy of associated factors. GDP and GDP-related interactions were more prominent during 2000–2010. During 2010–2020, population density and road density gained explanatory power, and the road–population interaction became the strongest combination excluding initial built-up density. The concurrent increase in several population-related interactions further supports this transition. Initial built-up density remained an important spatial background in both periods, while the socioeconomic and accessibility factors associated with expansion changed substantially over time.
4. Discussion
4.1. Changing Pace and Regional Differentiation of Urban Expansion
Urban expansion in Shandong shows a transition in growth characteristics rather than a simple slowdown. AGRs declined continuously from 7.09%/yr in 2000–2005 to 4.14%/yr in 2015–2020, whereas AGRa increased from 156.30 km2/yr to more than 207 km2/yr after 2010. UII also remained close to 0.133%/yr during the last two periods. The simultaneous decline in relative growth and persistence of large absolute increments reflects continued expansion from an increasingly large built-up stock. Song et al. [17] similarly reported declining expansion rates and pronounced intercity differences in the Shandong Peninsula. The present study extends this finding by showing that lower relative growth can coexist with persistently high absolute land expansion. Therefore, changes in urban expansion are better interpreted by considering both the amount of newly added built-up land and its proportional growth relative to the existing urban footprint.
The changing pace of expansion was accompanied by increasing differentiation among cities. Qingdao, Jinan, and Yantai remained the three largest contributors to the province-wide increase in built-up land over 2000–2020, indicating that large absolute increments remained concentrated in the principal urban centers. In contrast, high AGRs increasingly appeared in western and southwestern cities such as Binzhou, Heze, and Liaocheng. This pattern is consistent with Zhang et al. [18], who identified pronounced regional differences and asynchronous population, economic, and spatial development across Shandong. The present results further distinguish two dimensions of this regional differentiation: major urban centers continued to contribute large amounts of new built-up land, while several cities with smaller initial built-up areas experienced faster proportional growth. The ranking of cities therefore varied substantially depending on whether expansion was measured in absolute or relative terms.
Taken together, these patterns indicate that the spatial evolution of urban expansion in Shandong cannot be described as a simple shift of growth from the eastern and central cores toward the western periphery. Instead, continued large-scale expansion in major urban centers occurred alongside faster proportional growth in parts of western and southwestern Shandong. This coexistence suggests a more differentiated provincial expansion process, in which the spatial distribution of new development changed without displacing the established centers of large-scale land growth. It also highlights an important distinction between land expansion and broader changes in the urban system: rapid proportional growth in built-up land does not necessarily imply a corresponding rise in a city’s regional functional position. This distinction provides a basis for examining how continued expansion was subsequently reflected in urban morphology and morphological polycentricity.
4.2. Urban Morphological Evolution and Morphological Polycentricity
Urban morphological change in Shandong reveals a distinction between the spatial organization of recent expansion and the cumulative form of built-up land. AWMEI varied across periods and cities, whereas compactness declined and fractal dimension increased in most cities over 2000–2020. Liu et al. [41] emphasized that expansion indices describe the formation process of newly developed patches, while conventional morphological metrics characterize the spatial form observed at a given time. The present results further demonstrate that these two dimensions do not necessarily evolve synchronously. In Qingdao, the increase in AWMEI during the later period was accompanied by higher compactness and a lower fractal dimension, indicating greater consistency between recent expansion and cumulative morphological change. Jinan followed a different trajectory: AWMEI increased, while compactness continued to decline and fractal dimension increased. Thus, greater adjacency between new and existing built-up land can emerge before it is reflected in the morphology accumulated through successive phases of urban expansion. This process–form distinction helps explain why recent spatial integration does not necessarily imply an immediate transition toward a more compact overall urban footprint.
At the regional scale, changes in internal urban structure occurred within a persistent macro-scale spatial framework. The northeast–southwest orientation of built-up land remained stable, and the provincial centroid showed no sustained directional migration. At the same time, secondary built-up concentrations strengthened around Zibo–Weifang, Yantai, Jining, and Linyi, with greater spatial continuity along the Jinan–Zibo–Weifang–Qingdao direction. Such coexistence indicates that the internal configuration of an urban system can reorganize without a corresponding relocation of its overall spatial axis. More importantly, the KDE and rank–size results capture two complementary dimensions of this morphological evolution. Recent research argues that morphological polycentricity should be evaluated from both the spatial distribution and the relative size of urban centers, because neither dimension alone fully represents the regional center structure [12]. In Shandong, KDE identifies increasingly distinct secondary nodes, while the decline in the Zipf exponent to 0.7075 in 2020 indicates a tendency toward a flatter city-size gradient. Meanwhile, Jinan and Qingdao retained their dominant positions. Morphological polycentricity therefore strengthened primarily through the development of secondary centers and a more balanced distribution of built-up land, rather than through the weakening or replacement of the two principal cores.
This pattern also clarifies the nature of the morphological polycentric evolution identified in this study. Jiang et al. [20] demonstrated the value of combining remote-sensing and point-of-interest information to identify morphological polycentric structures and their differentiated temporal evolution in Chinese cities. However, a stronger morphological structure does not necessarily imply an equivalent strengthening of functional relationships. Burger and Meijers [19] similarly showed that morphological and functional polycentricity may diverge because a more balanced spatial distribution of urban centers does not necessarily correspond to stronger commuting or economic linkages. The Shandong results should therefore be interpreted as strengthening morphological polycentricity within a persistent dual-core structure. The evidence lies in the increasing prominence and spatial continuity of secondary built-up nodes together with a flatter city-size gradient, while the functional integration among these nodes remains beyond the scope of the present analysis.
4.3. Temporal Shifts in the Explanatory Structure and Planning Implications
The explanatory structure of built-up land expansion changed between the two development stages. During 2000–2010, economic activity was more prominent, as gridded GDP showed the highest explanatory power among factors other than initial built-up density and was involved in the strongest interactions with road and population conditions. During 2010–2020, population density and road density gained explanatory prominence, while the q value of gridded GDP declined. The road–population interaction simultaneously became the strongest combination excluding initial built-up density. These changes are consistent with the spatiotemporal variation in socioeconomic and transport associations reported for urban expansion in the Shandong Peninsula by Song et al. [17]. More importantly, the present results show that the transition occurred not only in the ranking of individual factors but also in the structure of their interactions. This suggests that the spatial conditions associated with expansion were stage-dependent rather than governed by a stable hierarchy of socioeconomic factors.
The interaction results provide further insight into this changing explanatory structure. Initial built-up density remained the strongest individual factor in both periods and participated in many high-q interactions, indicating that existing urban development provided a persistent spatial context for subsequent expansion. Similar interaction effects between existing development, transportation, and socioeconomic conditions have been reported for built-up land expansion in Beijing [49]. In Shandong, however, the later period also reveals an important contrast between individual and joint explanatory power. The share of secondary industry and fiscal expenditure intensity each had individual q values below 0.006, whereas their interactions with initial built-up density reached 0.306 and 0.302. Factors with weak individual explanatory power can therefore become more informative when considered in combination with the existing urban context. This finding cautions against interpreting single-factor rankings in isolation and reinforces the value of interaction analysis for understanding spatially differentiated urban expansion.
These findings have implications for differentiated land management. The increasing explanatory prominence of population density and road conditions in the later period is consistent with the people–land coordination emphasized in China’s current new urbanization policy. The State Council’s Five-Year Action Plan calls for urban construction-land allocation to be coordinated with permanent-resident population growth, employment absorption, industrial development, and urban carrying capacity [50]. Such coordination is particularly relevant because the expansion trajectories of Shandong’s cities differed substantially. Jinan and Qingdao continued to contribute large absolute increments, while several western and southwestern cities experienced rapid proportional growth from smaller built-up bases. For the major urban centers, continued expansion together with the long-term decline in compactness supports greater attention to urban renewal, more efficient use of existing land, and spatial integration. For cities with high relative growth, additional land supply should be evaluated jointly with population absorption, employment, and industrial capacity rather than inferred from land-expansion rates alone.
At the regional scale, the strengthening of morphological polycentricity also has implications for how future spatial development is coordinated. The Shandong Provincial New Urbanization Plan (2021–2035) promotes a networked urban system with multiple centers, levels, and nodes, while the Development Plan for the Shandong Peninsula Urban Agglomeration emphasizes stronger coordination and integration between Jinan and Qingdao [51,52]. The persistence of the Jinan–Qingdao dual-core structure and the strengthening of secondary built-up nodes are broadly consistent with these spatial objectives. However, morphological polycentricity alone cannot demonstrate functional integration among cities. Future polycentric development should therefore focus not only on the physical growth of secondary nodes but also on transport connectivity, functional complementarity, and coordinated public-service provision. In this sense, the planning challenge is not simply to create more urban centers, but to translate an increasingly multinodal physical structure into a more coordinated regional urban system.
4.4. Limitations and Future Research
Several methodological limitations should be acknowledged. The 1 km resolution of PANDA-China may not fully capture small built-up patches and complex urban edges, although it provides a consistent basis for long-term provincial and intercity comparisons. Because comparable official statistics for 2000 were unavailable, the 2001 built-up-area value was used to constrain the 2000 NTL extraction. Given the short one-year mismatch, this approximation may introduce some uncertainty into the initial benchmark and early-period expansion estimates, but is unlikely to substantially affect the long-term expansion pattern. In addition, the use of unified 2020 administrative boundaries may not fully reflect historical boundary adjustments. GeoDetector q values and their relative ranking may also vary with grid scale and the discretization of continuous variables, and should therefore be interpreted in the context of the five-class equal-frequency scheme adopted in this study. Moreover, the GeoDetector results represent spatial explanatory associations rather than direct causal relationships.
Future research could extend the present analysis in two directions. Higher-resolution land-cover, impervious-surface, and built-environment data could improve the delineation of urban edges and newly developed land, while analyses using alternative spatial scales and discretization schemes could further assess the robustness of the identified spatial associations. Spatial regression or panel-based approaches could also complement GeoDetector by examining the direction and temporal dynamics of these relationships. In addition, incorporating commuting, transport, employment, and other intercity flow data would allow morphological polycentricity to be compared with functional polycentricity and help determine whether the increasingly multinodal built-up structure is accompanied by stronger functional integration. Despite these opportunities for further refinement, the present study provides a consistent long-term framework for linking built-up land expansion, urban morphological change, and changes in regional urban structure, and offers a useful reference for comparable regional studies.
5. Conclusions
This study examines the long-term evolution of urban expansion and morphological polycentricity across the 16 prefecture-level cities of Shandong Province from 2000 to 2020. Built-up land increases from 1912.10 to 5646.04 km2, while the annualized expansion rate declines from 7.09%/yr to 4.14%/yr. Annual absolute expansion nevertheless remains high after 2010, indicating a transition from rapid proportional growth to sustained large-scale expansion on a larger urban base. The dominant northeast–southwest spatial axis remains stable, while declining compactness and increasing fractal dimension indicate increasingly dispersed and complex urban forms. At the regional scale, secondary built-up nodes around Zibo–Weifang, Yantai, Jining, and Linyi strengthen, while Jinan and Qingdao retain their dominant positions. Together with a flatter city-size gradient, these changes indicate strengthening morphological polycentricity within a persistent dual-core structure. GeoDetector results further reveal changes in the factors associated with newly added built-up land. GDP has greater explanatory power during 2000–2010, whereas population density and road density become more prominent during 2010–2020. Initial built-up density remains the strongest factor in both periods, and factor interactions consistently provide greater explanatory power than individual factors. Overall, urban expansion in Shandong is characterized by simultaneous changes in growth pace, urban form, regional hierarchy, and associated spatial conditions. These findings support differentiated land management, more efficient use of existing urban space, and stronger functional coordination among cities.
Supplementary Materials
The following supporting information can be downloaded at: https://www.mdpi.com/article/10.3390/su18168567/s1, Figure S1: Kernel-density patterns of NTL-derived built-up land in Shandong Province using a 30 km search radius: (a) 2000, (b) 2005, (c) 2010, (d) 2015, (e) 2020, and (f) changes in kernel density between 2000 and 2020; Figure S2: Kernel-density patterns of NTL-derived built-up land in Shandong Province using a 70 km search radius: (a) 2000, (b) 2005, (c) 2010, (d) 2015, (e) 2020, and (f) changes in kernel density between 2000 and 2020.
Author Contributions
Conceptualization, H.X. and W.Z.; methodology, W.Z., Y.C. and C.T.; software, W.Z., Y.C. and C.T.; validation, H.X. and W.Z.; formal analysis, H.Z., R.L. and S.C.; investigation, W.Z., Y.C. and C.T.; resources, H.X.; data curation, W.Z., Y.C. and C.T.; writing—original draft preparation, H.X. and W.Z.; writing—review and editing, H.Z. and R.L.; visualization, W.Z.; supervision, H.X.; project administration, H.X.; funding acquisition, H.X. All authors have read and agreed to the published version of the manuscript.
Funding
This research was funded by the Natural Science Foundation of Shandong Province, China (ZR2025QC1032) and Shandong Normal University Research Project for Young Faculty in the Humanities and Social Sciences (2024YTR002).
Institutional Review Board Statement
Not applicable.
Informed Consent Statement
Not applicable.
Data Availability Statement
The data sources are shown in Table 1.
Acknowledgments
The authors acknowledge the providers of the nighttime light dataset, statistical data, and map resources used in this study.
Conflicts of Interest
The authors declare no conflicts of interest.
References
- He, X.; Zhou, Y. Urban spatial growth and driving mechanisms under different urban morphologies: An empirical analysis of 287 Chinese cities. Landsc. Urban Plan. 2024, 248, 105096. [Google Scholar] [CrossRef] [Scilit]
- McDonald, R.I.; Mansur, A.V.; Ascensão, F.; Colbert, M.l.; Crossman, K.; Elmqvist, T.; Gonzalez, A.; Güneralp, B.; Haase, D.; Hamann, M.; et al. Research gaps in knowledge of the impact of urban growth on biodiversity. Nat. Sustain. 2020, 3, 16–24. [Google Scholar] [CrossRef] [Scilit]
- van Vliet, J. Direct and indirect loss of natural area from urban expansion. Nat. Sustain. 2019, 2, 755–763. [Google Scholar] [CrossRef] [Scilit]
- Li, M.; Cao, Y.; Dai, J.; Song, J.; Liang, M. A comprehensive review of urban expansion and its driving factors. Land 2025, 14, 1534. [Google Scholar] [CrossRef] [Scilit]
- Huang, M.; Liu, F.; Gong, D.; Lin, H.; Chen, Y.; Hu, B.; Ge, Y.; Xiao, C. Spatiotemporal evolution of land use efficiency in 357 cities across mainland China from 2000 to 2020 based on SDG 11.3.1. Sci. Total Environ. 2024, 954, 176157. [Google Scholar] [CrossRef] [Scilit] [PubMed]
- Li, X.; Zhou, Y.; Zhao, M.; Zhao, X. A harmonized global nighttime light dataset 1992–2018. Sci. Data 2020, 7, 168. [Google Scholar] [CrossRef] [Scilit] [PubMed]
- Zhang, L.; Ren, Z.; Chen, B.; Gong, P.; Xu, B.; Fu, H. A Prolonged Artificial Nighttime-light Dataset of China (1984–2020). Sci. Data 2024, 11, 414. [Google Scholar] [CrossRef] [Scilit] [PubMed]
- Li, T.; Chen, H.; Ma, C. China’s urbanisation evolution and metropolitan area expansion, based on the Prolonged Artificial Nighttime-light Dataset (PANDA, 1984–2020). Int. J. Digit. Earth 2024, 17, 2347448. [Google Scholar] [CrossRef] [Scilit]
- Lv, Y.; Zhou, L.; Yao, G.; Zheng, X. Detecting the true urban polycentric pattern of Chinese cities in morphological dimensions: A multiscale analysis based on geospatial big data. Cities 2021, 116, 103298. [Google Scholar] [CrossRef] [Scilit]
- Taubenböck, H.; Standfuß, I.; Wurm, M.; Krehl, A.; Siedentop, S. Measuring morphological polycentricity—A comparative analysis of urban mass concentrations using remote sensing data. Comput. Environ. Urban Syst. 2017, 64, 42–56. [Google Scholar] [CrossRef] [Scilit]
- Yue, W.; Wang, T.; Liu, Y.; Zhang, Q.; Ye, X. Mismatch of morphological and functional polycentricity in Chinese cities: An evidence from land development and functional linkage. Land Use Policy 2019, 88, 104176. [Google Scholar] [CrossRef] [Scilit]
- Yue, H.; Pan, Y.; Guan, Q. Measuring the spatial and size polycentricity: An empirical study of China’s urban agglomerations using population distribution data. Appl. Geogr. 2025, 176, 103529. [Google Scholar] [CrossRef] [Scilit]
- Colsaet, A.; Laurans, Y.; Levrel, H. What drives land take and urban land expansion? A systematic review. Land Use Policy 2018, 79, 339–349. [Google Scholar] [CrossRef] [Scilit]
- Li, G.; Sun, S.; Fang, C. The varying driving forces of urban expansion in China: Insights from a spatial-temporal analysis. Landsc. Urban Plan. 2018, 174, 63–77. [Google Scholar] [CrossRef] [Scilit]
- Wu, R.; Li, Z.; Wang, S. The varying driving forces of urban land expansion in China: Insights from a spatial-temporal analysis. Sci. Total Environ. 2021, 766, 142591. [Google Scholar] [CrossRef] [Scilit] [PubMed]
- Liu, K.; Xue, M.; Peng, M.; Wang, C. Impact of spatial structure of urban agglomeration on carbon emissions: An analysis of the Shandong Peninsula, China. Technol. Forecast. Soc. Change 2020, 161, 120313. [Google Scholar] [CrossRef] [Scilit]
- Song, Y.; Li, X.; Tao, G.; Liu, J. Exploring the characteristics and drivers of expansion in the Shandong Peninsula urban agglomeration based on nighttime light (NTL) data. IEEE J. Sel. Top. Appl. Earth Obs. Remote Sens. 2023, 16, 8535–8549. [Google Scholar] [CrossRef] [Scilit]
- Zhang, X.; Yu, S.; Ding, X.; Li, M.; Miao, Y.; Wang, C. Urban growth and shrinkage with Chinese characteristics: Evidence from Shandong Province, China. Appl. Geogr. 2023, 159, 103097. [Google Scholar] [CrossRef] [Scilit]
- Burger, M.J.; Meijers, E.J. Form follows function? Linking morphological and functional polycentricity. Urban Stud. 2012, 49, 1127–1149. [Google Scholar] [CrossRef] [Scilit]
- Jiang, L.; Wu, Y.; Wang, J.; Han, H.; Shi, K. A nonparametric approach for detecting urban polycentric spatial structure in China using remote sensing nighttime light and point of interest data. GISci. Remote Sens. 2024, 61, 2383461. [Google Scholar] [CrossRef] [Scilit]
- Tang, L.; Huang, J.; Cui, Q.; Chen, X.; Xian, B.; Wang, Y.; Wang, D. Evaluation of Regional Resources and Environmental Carrying Capacity in China: A Case Study of Shandong Province. Sustainability 2026, 18, 2256. [Google Scholar] [CrossRef] [Scilit]
- Shandong Provincial Bureau of Statistics. Shandong Statistical Yearbook 2021; China Statistics Press: Beijing, China, 2021. Available online: https://tjj.shandong.gov.cn/tjnj/nj2021/zk/indexch.htm (accessed on 6 August 2026).
- Xu, R.; Kim, Y.-G.; Liang, C. The Effect of Digitization on Economic Sustainable Growth in Shandong Province of China. Sustainability 2024, 16, 6798. [Google Scholar] [CrossRef] [Scilit]
- Wang, X.; Chen, B.; Dong, Q. The Limit of Urban Land Expansion Based on Population Growth and Economic Development: A Case Study of Shandong Province in China. Sustainability 2023, 15, 73. [Google Scholar] [CrossRef] [Scilit]
- Ministry of Housing and Urban-Rural Development of the People’s Republic of China. China Urban Construction Statistical Yearbook; China Statistics Press: Beijing, China, 2023. Available online: https://www.mohurd.gov.cn/gongkai/fdzdgknr/sjfb/tjxx/jstjnj/index.html (accessed on 6 August 2026).
- Xu, X. China GDP Spatial Distribution Kilometer-Grid Dataset. 2017. Available online: https://www.resdc.cn/DOI/doi.aspx?DOIid=33 (accessed on 6 August 2026).
- Lebakula, V.; Sims, K.; Reith, A.; Rose, A.; McKee, J.; Coleman, P.; Kaufman, J.; Urban, M.; Jochem, C.; Whitlock, C.; et al. LandScan Global 30 Arcsecond Annual Global Gridded Population Datasets from 2000 to 2022. Sci. Data 2025, 12, 495. [Google Scholar] [CrossRef] [Scilit] [PubMed]
- Davis, S.J.; Qian, M.; Zeng, W. A Comprehensive GIS Database for China’s Surface Transport Network with Implications for Transport and Socioeconomics Research; 33515; National Bureau of Economic Research: Cambridge, MA, USA, 2025. [Google Scholar]
- Crippen, R.; Buckley, S.; Agram, P.; Belz, E.; Gurrola, E.; Hensley, S.; Kobrick, M.; Lavalle, M.; Martin, J.; Neumann, M.; et al. NASADEM global elevation model: Methods and progress. Int. Arch. Photogramm. Remote Sens. Spat. Inf. Sci. 2016, XLI-B4, 125–128. [Google Scholar] [CrossRef] [Scilit]
- Shandong Provincial Bureau of Statistics. Shandong Statistical Yearbook 2001; China Statistics Press: Beijing, China, 2001.
- Shandong Provincial Bureau of Statistics. Shandong Statistical Yearbook 2011; China Statistics Press: Beijing, China, 2011. Available online: https://tjj.shandong.gov.cn/tjnj/nj2011/new/left.htm (accessed on 6 August 2026).
- Yang, J.; Huang, X. The 30 m annual land cover datasets and its dynamics in China from 1985 to 2025. Earth Syst. Sci. Data 2026, 13, 3907–3925. [Google Scholar] [CrossRef]
- National Geomatics Center of China. GlobeLand30: 30 m Global Land Cover Data for 2000, 2010 and 2020; National Geomatics Center of China: Beijing, China, 2020.
- Xu, X.; Liu, J.; Zhang, S.; Li, R.; Yan, C.; Wu, S. China Multi-Period Land Use/Land Cover Remote Sensing Monitoring Dataset (CNLUCC); Data Registration and Publishing System of the Resource and Environmental Science Data Center, Chinese Academy of Sciences: Beijing, China, 2018. [Google Scholar]
- Imhoff, M.L.; Lawrence, W.T.; Stutzer, D.C.; Elvidge, C.D. A technique for using composite DMSP/OLS “City Lights” satellite data to map urban area. Remote Sens. Environ. 1997, 61, 361–370. [Google Scholar] [CrossRef] [Scilit]
- Liu, Z.; He, C.; Zhang, Q.; Huang, Q.; Yang, Y. Extracting the dynamics of urban expansion in China using DMSP-OLS nighttime light data from 1992 to 2008. Landsc. Urban Plan. 2012, 106, 62–72. [Google Scholar] [CrossRef] [Scilit]
- Zheng, Y.M.; He, Y.R.; Zhou, Q.; Wang, H.W. Quantitative evaluation of urban expansion using NPP-VIIRS nighttime light and Landsat spectral data. Sustain. Cities Soc. 2022, 76, 103338. [Google Scholar] [CrossRef] [Scilit]
- Liu, C.; Yang, K.; Bennett, M.M.; Guo, Z.; Cheng, L.; Li, M. Automated extraction of built-up areas by fusing VIIRS nighttime lights and Landsat-8 data. Remote Sens. 2019, 11, 1571. [Google Scholar] [CrossRef] [Scilit]
- Yuill, R.S. The standard deviational ellipse: An updated tool for spatial description. Geogr. Ann. B Hum. Geogr. 1971, 53, 28–39. [Google Scholar] [CrossRef]
- Zhang, X.; Han, H. Characteristics and factors influencing the expansion of urban construction land in China. Sci. Rep. 2024, 14, 16040. [Google Scholar] [CrossRef] [Scilit] [PubMed]
- Liu, X.; Li, X.; Chen, Y.; Tan, Z.; Li, S.; Ai, B. A new landscape index for quantifying urban expansion using multi-temporal remotely sensed data. Landsc. Ecol. 2010, 25, 671–682. [Google Scholar] [CrossRef] [Scilit]
- Herold, M.; Goldstein, N.C.; Clarke, K.C. The spatiotemporal form of urban growth: Measurement, analysis and modeling. Remote Sens. Environ. 2003, 86, 286–302. [Google Scholar] [CrossRef] [Scilit]
- Dai, X.; Jin, J.; Chen, Q.; Fang, X. On Physical Urban Boundaries, Urban Sprawl, and Compactness Measurement: A Case Study of the Wen-Tai Region, China. Land 2022, 11, 1637. [Google Scholar] [CrossRef] [Scilit]
- Kinoshita, T.; Kato, E.; Iwao, K.; Yamagata, Y. Investigating the rank–size relationship of urban areas using land cover maps. Geophys. Res. Lett. 2008, 35, L17405. [Google Scholar] [CrossRef] [Scilit]
- Huang, Q.; He, C.; Gao, B.; Yang, Y.; Liu, Z.; Zhao, Y.; Dou, Y. Detecting the 20 year city-size dynamics in China with a rank clock approach and DMSP/OLS nighttime data. Landsc. Urban Plan. 2015, 137, 138–148. [Google Scholar] [CrossRef] [Scilit]
- Wang, H.; Qin, F.; Xu, C.; Li, B.; Guo, L.; Wang, Z. Evaluating the suitability of urban development land with a Geodetector. Ecol. Indic. 2021, 123, 107339. [Google Scholar] [CrossRef] [Scilit]
- Liu, Y.; Cao, X.; Li, T. Identifying Driving Forces of Built-Up Land Expansion Based on the Geographical Detector: A Case Study of Pearl River Delta Urban Agglomeration. Int. J. Environ. Res. Public Health 2020, 17, 1759. [Google Scholar] [CrossRef] [Scilit] [PubMed]
- Wang, J.; Haining, R.; Zhang, T.; Xu, C.; Hu, M.; Yin, Q.; Li, L.; Zhou, C.; Li, G.; Chen, H. Statistical Modeling of Spatially Stratified Heterogeneous Data. Ann. Am. Assoc. Geogr. 2024, 114, 499–519. [Google Scholar] [CrossRef] [Scilit]
- Ju, H.; Zhang, Z.; Zuo, L.; Wang, J.; Zhang, S.; Wang, X.; Zhao, X. Driving forces and their interactions of built-up land expansion based on the geographical detector: A case study of Beijing, China. Int. J. Geogr. Inf. Sci. 2016, 30, 2188–2207. [Google Scholar] [CrossRef] [Scilit]
- State Council of the People’s Republic of China. Notice of the State Council on Issuing the Five-Year Action Plan for Further Implementing the People-Centred New Urbanization Strategy. Available online: https://www.gov.cn/zhengce/zhengceku/202407/content_6965543.htm (accessed on 6 August 2026).
- Shandong Provincial People’s Government. Notice on Issuing the Shandong Provincial New Urbanization Plan (2021–2035). Available online: https://gb.shandong.gov.cn/art/2022/3/14/art_100623_40262.html (accessed on 6 August 2026).
- Shandong Provincial People’s Government. Notice on Issuing the Development Plan for the Shandong Peninsula Urban Agglomeration. Available online: https://m.shandong.gov.cn/jpaas-jpolicy-web-server/front/info/detail?iid=cb5fc28ab9b941a886c119fb98ebebdb (accessed on 6 August 2026).

Disclaimer/Publisher’s Note: The statements, opinions and data contained in all publications are solely those of the individual author(s) and contributor(s) and not of MDPI and/or the editor(s). MDPI and/or the editor(s) disclaim responsibility for any injury to people or property resulting from any ideas, methods, instructions or products referred to in the content. |
© 2026 by the authors. Licensee MDPI, Basel, Switzerland. This article is an open access article distributed under the terms and conditions of the Creative Commons Attribution (CC BY) license.