


Abstract
Maritime transport entered the EU Emissions Trading System (EU ETS) in 2024, turning a route’s carbon performance into an economic variable. Existing studies examine this on established routes; the case for a new (greenfield) short-sea corridor under the post-2024 regime remains unaddressed, particularly in the under-served south-eastern Baltic. This study proposes a transparent, transferable methodology linking multi-criteria route selection, a lane-metre demand model, a speed-dependent fuel-consumption model and a consignment-level modal-shift carbon balance, applied to a prospective Gdynia–Liepāja Ro-Pax connection (148 nautical miles). At high deck utilization, each freight unit shifted from the 850 km road alternative avoids roughly 300–380 kg of CO2 (a 44–55% reduction), because a short-sea leg replaces a long road haul rather than because the ferry is cleaner per tonne-kilometre. The benefit is conditional: the corridor is climate-beneficial only above a break-even freight-deck occupancy of about 45% at design speed, falling to about 34% under slow steaming. Across the demand scenarios (about 17,900–35,900 units per year), it avoids on the order of 10,000–13,400 t of CO2 annually under high demand, while under low demand the annual balance ranges from a small net increase at design speed to a modest saving under slow steaming. The corridor relieves the congested Suwałki Gap and aligns with smart-port enablers, providing a replicable decision tool for operators and port authorities.
1. Introduction
Maritime transport is the backbone of the Baltic Sea freight system, where short-sea shipping (SSS) and roll-on/roll-off (Ro-Ro) and passenger-and-freight (Ro-Pax) services connect peripheral markets to the trans-European transport network (TEN-T). The Baltic basin combines short inter-port distances, a high share of accompanied and unaccompanied road freight, and pronounced seasonality of passenger demand, which favours dedicated Ro-Pax tonnage able to serve cargo and tourist flows simultaneously.
At the same time, the regulatory environment has changed profoundly. The Monitoring, Reporting and Verification (MRV) regulation established emissions transparency for large ships [1], the extension of the EU ETS to maritime CO2 from January 2024 introduced a direct carbon cost into voyage economics [2,3], and FuelEU Maritime progressively tightens the greenhouse-gas intensity of energy used on board [4]. Because the Baltic is a designated Emission Control Area/Sulphur Emission Control Area (ECA/SECA), operators face additional constraints on sulphur and nitrogen oxides. Together these instruments make the carbon performance of a route an economic variable, not merely an environmental externality [2].
European transport policy explicitly promotes the transfer of freight from road to sea, and short-sea shipping is widely regarded as the principal realistic alternative to long-distance road haulage [5]. On the south-eastern Baltic axis, road freight between Poland and the eastern Baltic states is funnelled through the congested Suwałki Gap, while the reorientation of trade flows from an east–west to a north–south pattern has increased the role of Polish ports. This creates a supply gap that a new maritime corridor could fill, with potential benefits for congestion, driver-shortage resilience and emissions. Prior work on Gdynia has explored the prerequisites and variants for new ferry connections from a sustainable-mobility perspective [6], but without quantifying the freight decarbonization of an interurban Ro-Pax corridor. The interaction between environmental regulation and the competitiveness of the Ro-Ro and Ro-Pax segments has been studied mainly for established routes. Earlier work on the sulphur limits showed that environmental cost can erode the cost advantage of maritime legs and, in adverse cases, trigger a back-shift from sea to road [7]. More recent corridor- and vessel-level decarbonization studies examine operating connections, such as the Turku–Stockholm green-corridor case [8], or single-vessel fuel-transition roadmaps and emission-reduction measures on Baltic-type Ro-Pax services [9,10], against the backdrop of strategic pathways to decarbonize shipping by 2050 [11]. A systematic review of the maritime EU ETS confirms that the Ro-Ro and Ro-Pax segments are among those most exposed to its modal-shift effects, and that important knowledge gaps remain regarding its uneven impact across routes and segments [2].
To the authors’ knowledge, no published study assesses a prospective, greenfield Ro-Pax corridor in the under-served south-eastern Baltic and quantifies its net road-to-sea CO2 balance under the post-2024 EU ETS regime, while linking the outcome to enabling smart-port infrastructure. Existing route-level studies of new connections tend to quantify operational feasibility and financial viability while treating the climate dimension only descriptively, and no widely used, transparent procedure links route choice, vessel sizing and operating speed to a defensible, consignment-level estimate of avoided CO2 relative to the road alternative. Accordingly, the present study expresses the carbon case as a deck-occupancy threshold rather than an assumed capture rate, which is the more defensible formulation for a greenfield route.
The aim of this paper is twofold: (i) to propose a transferable, consignment-level methodology for assessing the decarbonization potential of a new SSS Ro-Pax corridor, and (ii) to demonstrate it on a prospective Gdynia–Liepāja connection. The study is guided by the following research questions:
RQ1. To what extent can a new Gdynia–Liepāja maritime corridor reduce CO2 emissions per freight consignment relative to the existing road alternative via the Via Baltica?
RQ2. How does the choice of economic operating speed (slow steaming) affect the corridor’s fuel consumption, CO2 emissions and EU ETS exposure?
RQ3. Which elements of smart and sustainable port infrastructure act as enablers of the corridor’s decarbonization and operational continuity?
2. Literature Review
2.1. The Regulatory Drivers of Maritime Decarbonization
The policy architecture that makes carbon an operating cost rests on three EU instruments. The MRV regulation established vessel-level emissions transparency [1]; the extension of the EU ETS to maritime CO2 from 2024 attached a direct allowance cost to each tonne emitted, phased in to full surrender from 2026 [3]; and FuelEU Maritime tightens the lifecycle greenhouse-gas intensity of energy used on board and mandates onshore power for large passenger and container ships at major TEN-T ports from 2030 [4]. A systematic review of the maritime ETS finds the Ro-Ro and Ro-Pax segments among those most exposed to its modal-shift effects, with the cost burden falling unevenly across routes and remaining an open research question [2]; port-level analyses reach similar conclusions [12]. Because the Baltic is a designated Emission Control Area, operators additionally face sulphur- and nitrogen-oxide limits [7]. Critical assessments stress that the principal obstacles to shipping decarbonization are increasingly political and economic rather than technical [13].
2.2. Short-Sea Shipping and the Road-to-Sea Modal Shift
Short-sea shipping is widely regarded as the principal realistic substitute for long-distance road haulage, and the modal-shift literature has matured from qualitative advocacy to systematic assessment [5]. A decisive and often overlooked lesson is that the environmental case is conditional: because Ro-Pax ferries can have a higher emission factor per tonne-kilometre than trucks, a maritime leg outperforms road only when it materially shortens the total transport distance [14]. Environmental regulation can also act against the shift; analysis of the sulphur limits showed that added compliance cost can erode the maritime cost advantage and, in adverse cases, trigger a back-shift from sea to road [7]. Competitiveness and recovery studies of established Baltic Ro-Pax services reach comparable conclusions about the fragility of the operating margin [9,15].
2.3. Decarbonization Levers: Speed, Fuels, Ports and Green Corridors
Four levers dominate the operational decarbonization of a corridor. Operating speed: Because fuel use scales steeply with speed, slow steaming is among the most immediate measures, although its magnitude is debated and the simple cubic relation overstates the effect at low engine load [16,17,18]; operational efficiency is also increasingly codified through the International Maritime Organization (IMO) Energy Efficiency Existing Ship Index (EEXI) and Carbon Intensity Indicator frameworks [19]. Alternative fuels: Reviews converge on LNG and dual-fuel propulsion as the mature transitional option, with methanol, ammonia and hydrogen as longer-term zero-carbon candidates conditioned by cost, safety and availability [11,20,21,22,23,24]. The ship–port interface: Ports can cut emissions through a structured set of technical and operational measures [25,26], of which onshore power supply (cold ironing) is the most studied, with reported in-port CO2 reductions but well-documented cost and coordination barriers [27,28,29,30,31,32]. The green-shipping-corridor concept bundles these levers along selected routes through cross-stakeholder commitments, a movement that has expanded rapidly yet still faces a gap between announcement and real-world implementation [8,33].
2.4. Ro-Pax Corridors and the Research Gap
For the Ro-Pax segment specifically, the literature concentrates on vessel-level fuel-transition roadmaps and design [9,10], on preliminary design parameters and terminal traffic engineering for Baltic ferries [34,35,36,37], and, for Gdynia, on the prerequisites for new sustainable ferry connections from an urban-mobility perspective [6]. What is missing is a transparent, transferable procedure linking route choice, vessel sizing and operating speed to a defensible, consignment-level estimate of avoided CO2 for a prospective (greenfield) corridor under the post-2024 ETS regime, expressed as a decision criterion rather than a single assumed outcome. This study addresses that gap.
3. Materials and Methods
The methodology comprises five linked modules: (Section 3.1) multi-criteria route selection; (Section 3.2) a lane-metre demand model; (Section 3.3) a speed-dependent fuel-consumption model; (Section 3.4) a modal-shift carbon balance against the road counterfactual; and (Section 3.5) an EU ETS cost module. All input parameters and their sources are summarized in Table 1. The approach is intentionally transparent so that it can be transferred to other candidate corridors.
Table 1.
Key input parameters and assumptions.
3.1. Study Area and Route Selection
Three candidate corridors departing from the Public Ferry Terminal in Gdynia were screened against nautical, logistic and economic criteria: Gdynia–Riga (≈328 nmi), Gdynia–Helsinki (≈420 nmi) and Gdynia–Liepāja (≈148 nmi). Liepāja was selected as the optimal compromise. The 148 nmi distance allows for a night-crossing model that complies with drivers’ rest regulations while permitting an economic operating speed; the port offers direct access from open sea (avoiding navigation on the Daugava River and the Gulf of Riga that penalizes Riga, and the channel-and-lake transit system analyzed for Liepāja itself [41]); and it is ice-free year round, removing the need for an ice-class hull required on the Finnish routes. These features reduce fuel burn and operating cost, which is central to the decarbonization argument. The screening follows established methods of ferry-line and terminal traffic engineering [36,37,42,43]. The screening is summarized in Table 2.
Table 2.
Multi-criteria screening of the three candidate corridors from Gdynia.
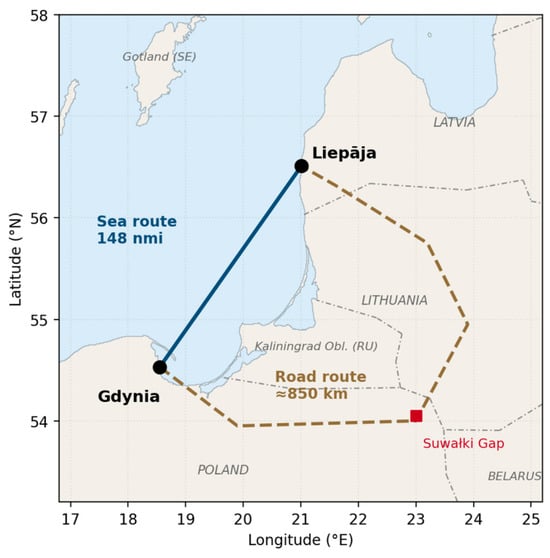
The Liepāja option also fills an identified supply gap without competing head-on with the saturated Sweden and Finland services, while offering a competitive alternative to road haulage that bypasses the congested Suwałki Gap. The corridor geometry and the road alternative are shown in Figure 1.
Figure 1.
Schematic of the proposed Gdynia–Liepāja corridor: the 148 nmi sea leg versus the ≈850 km road alternative through the congested Suwałki Gap. Equirectangular projection; routes are indicative. Legend: grey dash-dotted lines denote national borders; the brown dashed line marks the road route (Via Baltica); the red square indicates the Suwałki Gap. Basemap: GLOBE 1 km land mask (NOAA NGDC) [44,45] and Natural Earth country boundaries [46].
The choice of Gdynia and Liepāja as the two anchor regions follows from their complementary positions on the two sides of the south-eastern Baltic supply gap. Gdynia, one of the two core ports of the Polish Tricity agglomeration, operates an established Public Ferry Terminal with high operational readiness (Table 3) and long-standing Ro-Pax experience, and its hinterland covers the main Polish road flows oriented towards the north-east. Liepāja is the Latvian port closest to Polish waters, with underutilized capacity, port dues reduced by its Special Economic Zone status, and an existing Ro-Pax service to Travemünde, yet no direct maritime link with Poland; its current vessel-length limitation (≈190 m) defines the implementation-phase fleet. The only land alternative for Poland–western Latvia exchange is the ≈850 km routing along the Via Baltica through the congested and strategically sensitive Suwałki Gap, which makes this port pair a natural test bed for the proposed methodology.
Table 3.
Current terminal readiness: Gdynia versus Liepāja.
The two terminals differ markedly in their current readiness, which shapes the phased fleet strategy. Gdynia’s Public Ferry Terminal is of recent European standard, whereas Liepāja is the binding constraint in the implementation phase (Table 3).
3.2. Demand and Lane-Metre Model
Freight demand was estimated from Eurostat international road freight data [47] for Poland–Latvia (and the wider hinterland), converted into a required cargo deck length following the established approach to parameter optimization of multi-purpose Ro-Ro lines [43]. The number of standard freight units is multiplied by the lane length per unit, taken as 17 m (a 16.5 m tractor-and-trailer plus 0.5 m stowage clearance), and increased by a 15% reserve for demand fluctuation:
where Q is the annual road freight volume on the corridor, ks a seasonality coefficient, Nsail the annual number of sailings, η the deck-utilization factor and lunit the lane length per unit. Annual freight demand was estimated by the indicator method from international road freight tonnage between Poland and the eastern Baltic hinterland: based on 2024 Eurostat and Polish national statistics from Statistics Poland (GUS), the direct market (Latvia and Estonia) carried about 1211 and 514 thousand tonnes of Polish road exports respectively, with a further 353 thousand tonnes moving in Finnish transit. Tonnes were converted to standard units at 16 t per unit, and capture coefficients were applied to the resulting road volume. The capture coefficients are not measured; short-sea shipping is an established substitute for road freight on Baltic corridors [5], and the low and high scenarios bracket a plausible range of road-to-sea diversion rather than predict it. As shown in Section 4.6, the corridor’s robust result is an occupancy threshold that does not depend on the assumed capture rate. Two scenarios are adopted: a low scenario (15% of the direct and 8% of the transit road volume), giving about 17,900 units per year, and a high scenario (30% and 16%), giving about 35,900 units per year. Distributed over 350 sailings per year (a broadly daily service), these correspond to roughly 51 and 103 freight units per departure, respectively. The required lane length ranges from about 2000 m for freight alone in the implementation phase to about 3300 m once peak-season passenger vehicles are accommodated; the implementation-phase vessel is sized at about 2300 m of lane, i.e., a practical capacity of about 135 freight units per sailing. The gap between this capacity and the per-departure demand defines a deck occupancy of about 38% (low) to 76% (high), which proves decisive for the carbon balance (Section 4.6).
Lreq = (Q·ks)/(Nsail·η)·lunit·1.15
The seasonality coefficient ks represents intra-annual demand variation; in the implementation-phase calculations, it is set to ks = 1.0, with variability captured conservatively in two ways: through the 15% demand-fluctuation reserve in the formula above and through the separate peak-season scenario including passenger vehicles. This treatment avoids estimating a monthly profile, which the underlying statistics do not resolve at corridor level.
3.3. Fuel-Consumption Model
Daily fuel consumption of a ship rises approximately with the cube of the ratio of operating speed to design speed [16,18]. Empirical evidence shows that the cube law holds near the design point but overstates sensitivity at low load [18]; the proposed corridor operates at 14–18 kn against a design speed of about 24 kn, i.e., 60–75% engine load, within the efficient 70–80% band at the upper end. The consumption baseline is taken from the figure reported for Stena Flavia, currently operating to Liepāja, of about 120 kg of fuel per nautical mile in 2024, obtained from the European Maritime Safety Agency (EMSA) THETIS-MRV public emission database [38]. The MRV figure reflects the vessel’s actual 2024 operating profile; the proposed night-crossing service operates in a slower regime (14–18 kn, 60–75% engine load), and, given the approximately quadratic dependence of per-mile consumption on speed discussed below, a strictly speed-scaled adjustment would imply a reduction larger than 10%. The baseline is therefore reduced by a conservative 10%, giving 108 kg/nmi. Marine diesel oil (MDO) with scrubbers is assumed, at a reference price of about 480 USD/t taken from a public bunker-price index [40]. Because daily consumption scales with the cube of speed, fuel consumed per nautical mile scales with the square of speed; anchoring the 108 kg/nmi intensity at a representative operating speed of 16 kn gives a transparent first-order model, f(v) = 108·(v/16)2 kg/nmi, used for the speed-sensitivity analysis. As this relation overstates the speed effect at low load [18], the resulting figures are read as an upper bound on the sensitivity.
Fuel per one-way crossing therefore equals 108 kg/nmi × 148 nmi ≈ 16.0 t MDO.
3.4. Modal-Shift Carbon Balance
Ship CO2 emissions are obtained by applying the IMO carbon factor for MGO/MDO of 3.21 t CO2 per t fuel. For a Ro-Pax vessel, a share of emissions is allocated to freight; both an all-to-freight bound and an 80% allocation are reported. The choice of allocation method strongly influences the apparent carbon intensity of the freight segment: for a comparable Baltic Ro-Pax service, a mass-based allocation assigns roughly 87% of emissions to cargo [10], so the 80% adopted here is a conservative lower bound. Alternative conventions used in Ro-Pax carbon accounting, based on deck area or lane-metres rather than mass, would not materially lower the freight share on this service, because accompanied trailers dominate both the mass and the occupied deck area; the 80% share is therefore conservative under either convention. The road counterfactual is the 850 km journey between the two hinterlands via the Via Baltica, using an emission factor of about 0.80 kg CO2 per vehicle-kilometre for a laden 40 t articulated lorry, consistent with European modal emission-factor data [39]. Because Ro-Pax ferries can carry a higher emission factor per tonne-kilometre than trucks, the corridor’s advantage arises from replacing a long road haul (850 km) with a much shorter sea leg (148 nmi), rather than from a lower per-tonne-kilometre factor [14]. The avoided CO2 per shifted consignment is the difference between the road and the sea figure; annual avoided CO2 scales linearly with the number of consignments captured from road.
3.5. EU ETS Cost Module
The EU ETS cost is computed from the ship CO2 emissions, the phase-in share of verified emissions subject to surrender, and the EU Allowance (EUA) price. Because slow steaming reduces fuel burn, it lowers both operating cost and ETS exposure; this linkage is quantified in the sensitivity analysis. Indicative environmental surcharges already applied on comparable Baltic routes (of the order of 7.6–8.0 EUR per lane-metre of freight) are used to benchmark the order of magnitude. All input parameters and assumptions are summarized in Table 1.
4. Results
4.1. Fleet and Capacity
The required lane length of approximately 2300 m (implementation phase) corresponds to a vessel of the Visentini class [48], which is widely available on the second-hand market, matches Liepāja’s current length limitation (≈190 m) and already operates on the German–Liepāja link, so adopting the same vessel class unifies the fleet with that existing service. In the target phase, after the planned modernization of Liepāja, more efficient low-emission E-Flexer tonnage (dual-fuel, LNG-ready) [49] or a deep conversion of the Visentini units is recommended. A shuttle of two vessels supports daily evening departures from each port. At the estimated demand, the 135-unit freight capacity is utilized at about 38% in the low scenario (≈51 units per departure) and about 76% in the high scenario (≈103 units); as shown below, this utilization is the decisive factor in the carbon balance. The limiting design parameters synthesized from the demand and infrastructure analysis are summarized in Table 4.
Table 4.
Limiting design parameters for the corridor vessel.
4.2. Fuel and CO2 per Crossing
At 108 kg/nmi over 148 nmi, one one-way crossing consumes about 16.0 t of MDO and emits about 51.2 t of CO2 (the vessel total); a round trip emits about 102 t. At a full freight deck of 135 standard units, the ship-side CO2 attributable to a single consignment is about 379 kg under the all-to-freight bound and about 303 kg under the 80% allocation. These per-consignment values rise as the deck empties, because the crossing emissions are largely fixed regardless of the number of units carried.
4.3. Consignment-Level Modal Shift (RQ1)
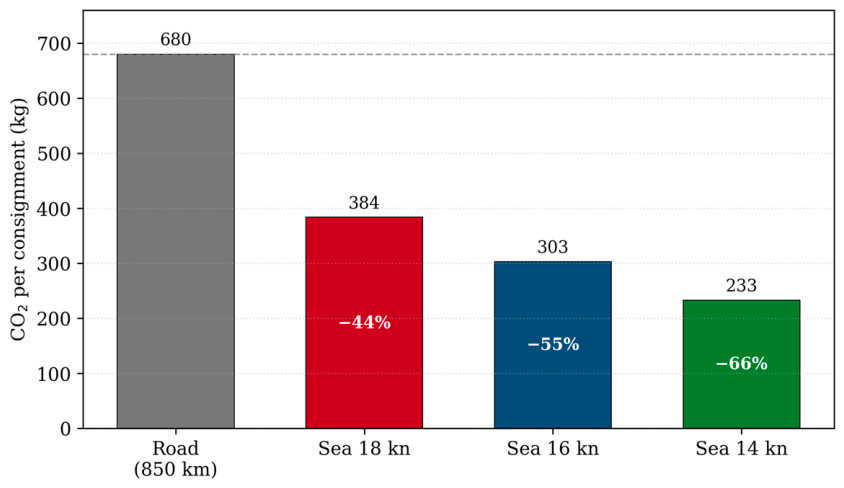
The road counterfactual of 850 km emits about 680 kg of CO2 per laden lorry. At high deck utilization (a full or near-full freight deck), shifting one consignment to the sea corridor avoids roughly 301 kg (all-to-freight) to 377 kg (80% allocation) of CO2, i.e., a 44–55% reduction per consignment (Table 5). This advantage is conditional on utilization: because the crossing emissions are largely fixed, the CO2 attributed to each consignment rises as the freight deck empties, so the figures in Table 5 describe the well-utilized case rather than a guaranteed outcome. The utilization at which the corridor still beats road is derived explicitly in Section 4.6.
Table 5.
CO2 per freight consignment at full deck utilization: sea corridor versus road counterfactual (16 kn). The comparison is visualized in Figure 2.
Figure 2.
CO2 per freight consignment at full deck utilization: the 850 km road counterfactual versus the sea corridor at 18, 16 and 14 knots, with the percentage reduction relative to road.
4.4. Annual Avoided Emissions
Annual avoided CO2 depends jointly on the volume captured and on deck utilization, because per-consignment emissions fall as the deck fills. Combining the two demand scenarios of Section 3.2 with the speed cases of Section 4.5 gives the net annual balance in Table 6. In the high-demand scenario (about 35,900 units per year, 76% occupancy), the corridor avoids on the order of 10,000–13,400 t of CO2 per year. In the low-demand scenario (about 17,900 units, 38% occupancy) the fixed 80% allocation yields a net increase of about 2200 t of CO2 per year at design speed, turning to a modest net saving (about +1200 t per year) only under slow steaming. An asymmetric variant, with the outbound leg at the high-demand level (76%) and the return leg at the low-demand level (38%), reflecting the Poland–Latvia trade imbalance, yields a net saving of roughly 4000 t per year at 16 kn and about 7300 t under slow steaming: the nearly full outbound legs carry the carbon budget of the lean return legs, but roughly half of the symmetric high-demand saving is lost. The decarbonization benefit is therefore conditional on either demand growth or a slower operating speed, not automatic.
Table 6.
Net annual avoided CO2 versus road by demand scenario and operating speed (80% allocation).
4.5. Speed Sensitivity and EU ETS Exposure (RQ2)
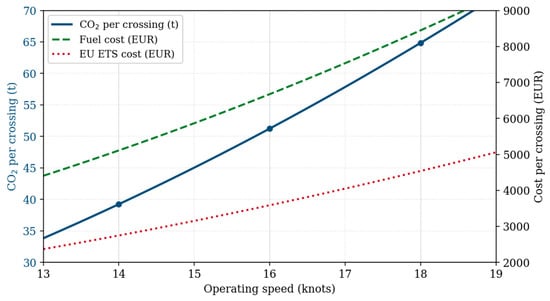
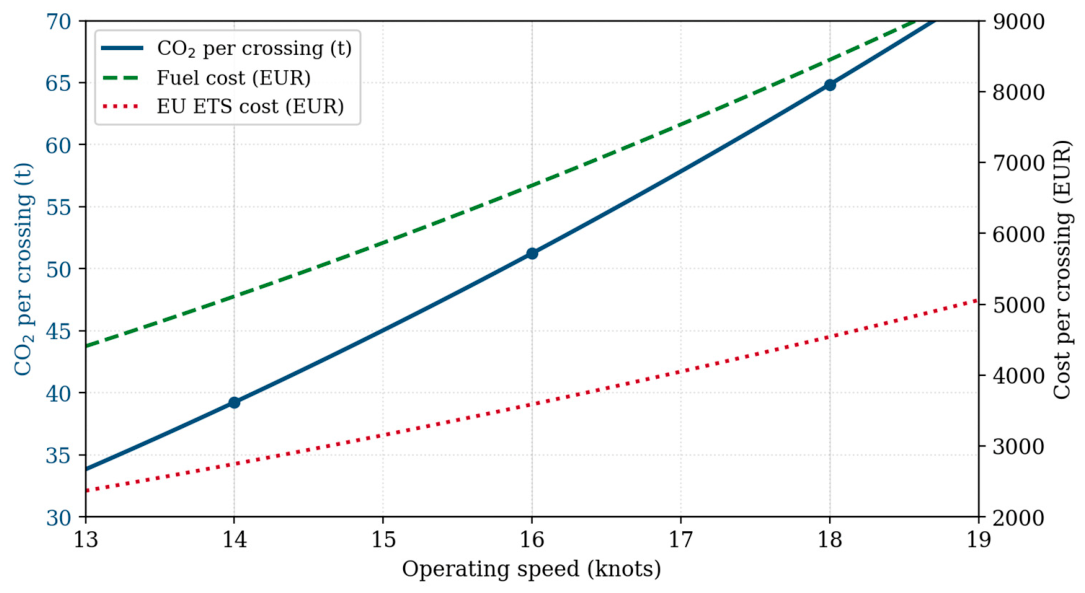
Because fuel consumption is strongly speed-dependent, operating speed is the principal lever over the corridor’s carbon and cost performance. Applying the speed–fuel relation of Section 3.3 across the 14–18 kn band, and pricing the resulting CO2 under the EU ETS at an assumed EUA price of 70 EUR/t with full phase-in (100% of verified emissions surrendered from 2026), yields the sensitivity in Table 7 and Figure 3. Because both Gdynia and Liepāja are EU ports, the voyage is intra-EU and 100% of its emissions fall within the ETS scope.
Table 7.
Speed sensitivity of fuel, CO2, cost and EU ETS exposure per one-way crossing (148 nmi), and the resulting per-consignment saving versus the 850 km road counterfactual.
Figure 3.
Speed sensitivity of CO2 emissions, fuel cost and EU ETS cost per one-way crossing (148 nmi), from the model f(v) = 108·(v/16)2 kg/nmi; markers indicate the 14, 16 and 18 kn operating points. EUA price assumed at 70 EUR/t, full ETS phase-in.
Slowing from 18 to 14 kn cuts fuel and CO2 per crossing by about 39% and reduces the EU ETS cost per crossing by a similar proportion, while lengthening the crossing only from roughly 8.2 to 10.6 h, comfortably within the night-crossing window. Crucially, slow steaming also raises the per-consignment carbon saving versus road from about 44% at 18 kn to about 66% at 14 kn, because lower sea-side emissions widen the gap to the fixed 680 kg road counterfactual. Slow steaming therefore improves margin and carbon performance simultaneously [16,17]. The financial baseline from the case (port dues of about 6551 EUR in Gdynia versus about 1951 EUR in Liepāja owing to its Special Economic Zone, from the respective published port tariffs [50,51], against freight revenue of about 60,000 EUR per round trip) confirms that the speed regime is compatible with a positive operating margin.
4.6. Break-Even Occupancy and the Modal-Shift Threshold
Because the corridor is greenfield, the share of road freight that would actually switch to the ferry cannot be measured and is treated as a scenario variable (Section 3.2). The carbon case, however, can be stated as an occupancy threshold that is independent of any capture forecast. A shifted consignment saves CO2 only if the ferry’s freight-allocated emissions per unit remain below the 680 kg road counterfactual; since the crossing emissions are incurred whether the deck is full or not, this defines a minimum average freight-deck occupancy. Solving the balance under the 80% allocation gives a break-even occupancy of about 45% of the 135-unit capacity at 16 kn (around 60 units), ranging from about 34% at 14 kn to about 57% at 18 kn. In other words, the corridor delivers a net carbon benefit over road provided the freight deck is on average at least roughly half full, and slow steaming lowers this threshold.
Expressed as annual volume over the 350 sailings per year (a capacity of about 47,000 freight-unit slots), the carbon break-even corresponds to roughly 21,000 shifted units per year at 16 kn, falling to about 16,000 units per year under slow steaming at 14 kn. Placing the two demand scenarios against this threshold makes the corridor’s logic clear: the high-demand scenario (about 35,900 units per year, 76% occupancy) lies well above the break-even at every speed and delivers a robust net saving, whereas the low-demand scenario (about 17,900 units, 38% occupancy) sits below the 16 kn threshold but above the 14 kn one, so it becomes climate-beneficial only through slow steaming. This threshold, rather than a single assumed capture rate, is the robust decision criterion for the corridor: it tells operators and port authorities the minimum utilization at which the modal shift is environmentally justified, and it is conservative because it allocates 80% of emissions to freight [10,14].
4.7. Operating Economics
The carbon balance is only actionable if the service is financially viable, so the cost and revenue structure is summarized here. Port charges, which are set principally on gross tonnage at both terminals, amount to about 6551 EUR per call in Gdynia against about 1951 EUR in Liepāja, the latter reduced by the port’s Special Economic Zone status [50,51]. With the speed-dependent fuel cost of Table 7, the total operating cost of a round trip is on the order of 30,000 EUR. On the revenue side, a freight tariff of about 900 EUR per accompanied unit, benchmarked to the competitive road rate, yields roughly 60,000 EUR of freight revenue per round trip under a conservative occupancy assumption, before passenger and onboard income, and scales upward with deck utilization. The indicative operating margin is therefore positive, but it is sensitive to the Poland–Latvia trade asymmetry: exports from Poland greatly exceed imports, so the return leg risks low utilization, which simultaneously depresses revenue and, as shown in Section 4.6, pushes the return crossing toward or below the carbon break-even. Demand balancing, slow steaming on the lean leg, and a reduced return frequency are the available mitigations.
4.8. Sensitivity Analysis
Three parameters dominate the results: the operating speed, the freight-deck occupancy and the EUA price. Speed and occupancy are treated in Section 4.5 and Section 4.6; their combined effect is captured by the demand-by-speed grid of Table 6. The EU ETS cost scales linearly with the EUA price: across a plausible 60–90 EUR/t band, the ETS cost of a 16 kn crossing ranges from about 3070 to about 4610 EUR (versus about 3580 EUR at the 70 EUR/t central value); per round trip, this is about 6100–9200 EUR, roughly 20–31% of the ~30,000 EUR round-trip operating cost. The road emission factor enters the break-even condition linearly and therefore deserves the same scrutiny: varying the adopted 0.80 kg CO2 per vehicle-kilometre across a plausible 0.70–0.90 kg/veh-km band, reflecting differences in loading, fleet age and terrain reported in European emission-factor datasets [39], shifts the road counterfactual between about 595 and 765 kg CO2 per consignment and the break-even occupancy at 16 kn between roughly 51% and 40% of deck capacity (versus 45% at the central value); the high-demand scenario (76% occupancy) clears the threshold across the entire band, while the low-demand scenario (38%) remains below it at design speed under any plausible road factor. The allocation assumption sets the level but not the direction of the per-consignment result: shifting from the conservative 80% freight share toward the mass-based 87% [10] raises the attributed sea emissions by about 9%, narrowing but not eliminating the advantage at good utilization. The qualitative conclusions, namely that the corridor is climate-beneficial above roughly 45% occupancy, that slow steaming lowers this threshold, and that EU ETS exposure is a modest but non-trivial cost, are stable across these ranges; only the precise magnitudes move.
5. Discussion
5.1. Smart-Port Infrastructure as an Enabler (RQ3)
The corridor’s decarbonization potential is conditioned by land-side infrastructure. Ports can reduce emissions at the ship–port interface and in hinterland operations through a structured set of technical and operational measures [25,26]. On the Gdynia side, automated smart gates with optical character recognition, slot-based pre-notification synchronized with Just-in-Time arrivals, and dynamic storage pricing reduce buffer-zone congestion and idling, indirectly lowering emissions and protecting throughput; comparable truck-appointment systems have been shown to improve terminal coordination and reduce waiting [52]. On the Liepāja side, dolphin-based berth extension and a drive-through linkspan enable faster turnaround and, ultimately, more efficient tonnage. Onshore power supply (OPS), whose barriers and drivers in northern Europe are well-documented [27], together with a dual-fuel/LNG-ready pathway provide the route to deeper emission cuts in the target phase; bibliometric and techno-legal reviews position LNG and dual-fuel propulsion as the mature transitional option while methanol, ammonia and hydrogen mature [11,20,21]. Comparable adaptability-oriented design of Baltic port fuel infrastructure, sizing conventional facilities with structural reserves for methanol and biofuels, has recently been demonstrated for a small southern-Baltic terminal [53], reinforcing the phased pathway proposed here. These elements connect the case directly to the smart and sustainable infrastructure agenda. Answering RQ3, the binding enablers are automated gates and slot-based pre-notification on the Gdynia side, and dolphin-based berth extension with a drive-through linkspan on the Liepāja side, while onshore power and a dual-fuel/LNG-ready pathway unlock the deeper, target-phase reductions.
5.2. Barriers and Limitations
Three structural risks qualify the result. First, the strong Poland–Latvia trade asymmetry (exports far exceeding imports) creates empty-running risk on the return leg, which would erode both economics and per-tonne carbon performance; this regime is quantified as the asymmetric scenario in Table 6, which roughly halves the annual saving relative to the symmetric high-demand case. Second, the target phase depends on the timely modernization of Liepāja. Third, the Gdynia terminal faces capacity limits. On the methodological side, the carbon balance relies on representative emission factors and an allocation assumption; results should be read as scenario-based estimates rather than forecasts, and empirical validation (verified MRV fuel data, actual lorry occupancy) would strengthen the analysis.
5.3. Policy Alignment
By relieving the Suwałki Gap and substituting road kilometres with a short maritime leg, the corridor supports the European Green Deal modal-shift objective and complements, rather than competes with, the parallel Rail Baltica and Via Baltica investments. Within the EU ETS and FuelEU framework, the corridor’s carbon advantage is also a competitive and financial advantage.
6. Conclusions
This study set out a transparent, transferable methodology for assessing the decarbonization potential of a new short-sea Ro-Pax corridor and applied it to a proposed Gdynia–Liepāja connection. Addressing RQ1, at high deck utilization, each consignment shifted from the 850 km road alternative to the 148 nmi sea corridor avoids roughly 300–380 kg of CO2 (a 44–55% reduction); under high demand the corridor avoids on the order of 10,000–13,400 t of CO2 per year, while under low demand the annual balance ranges from a small net increase at design speed to a modest saving under slow steaming, so the benefit is conditional on deck utilization rather than automatic. Addressing RQ2, economic slow steaming within the 14–18 kn band reduces fuel, CO2 and EU ETS exposure broadly in proportion, with the night-crossing schedule absorbing the longer transit, and it widens the per-consignment carbon advantage over road from about 44% to about 66%. Because the captured volume is not observable for a prospective route, the carbon case is expressed as a break-even occupancy of about 45% of deck capacity at design speed (falling to about 34% under slow steaming) rather than as a single assumed capture rate; the high-demand scenario clears this threshold comfortably, while the low-demand scenario requires slow steaming to become climate-beneficial. Addressing RQ3, smart-port infrastructure (automated gates, slot-based pre-notification, OPS and a dual-fuel/LNG-ready pathway) is the principal enabler of further reductions and of operational continuity. The methodology offers operators and port authorities a replicable decision tool, and the case demonstrates that the connection is consistent with the Green Deal and TEN-T frameworks. Future work should incorporate verified operational data and an empirical occupancy survey to move from scenario-based estimates to calibrated results.
The emission benefit is therefore conditional rather than automatic: it scales with freight-deck occupancy on both legs of the rotation—in the asymmetric scenario of Table 6, the net annual saving falls to about 4000 t per year at 16 kn, roughly half of the symmetric high-demand case (about 10,000 t per year)—and with operating speed, as slow steaming widens the advantage at any given occupancy. Emission savings should therefore always be read jointly against demand capture and the speed regime, including the return legs.
Author Contributions
Conceptualization, A.W. and M.S.; methodology, A.W. and M.S.; validation, A.W.; formal analysis, A.W.; investigation, A.W. and M.S.; data curation, M.S.; writing—original draft preparation, A.W.; writing—review and editing, A.W. and M.S.; visualization, A.W.; supervision, A.W.; project administration, A.W. All authors have read and agreed to the published version of the manuscript.
Funding
This research has been supported by Gdynia Maritime University, Faculty of Navigation, within the framework of project No. WN/2026/PZ/10.
Institutional Review Board Statement
Not applicable.
Informed Consent Statement
Not applicable.
Data Availability Statement
The study relies on publicly available data and on parameters estimated by the authors. Ship fuel and CO2 figures are derived from the European Maritime Safety Agency THETIS-MRV public emission database [38]; bunker prices from a public market index [40]; port charges from the published tariffs of the Port of Gdynia Authority [50] and the Liepāja Special Economic Zone [51]; and freight volumes from Eurostat road freight statistics [47]. No proprietary, commercially confidential or third-party restricted data were used; figures such as demand capture and freight revenue are the authors’ own scenario estimates derived from public road-rate and traffic data. The Figure 1 basemap uses public-domain geographic data (GLOBE 1 km land mask, NOAA NGDC; Natural Earth 1:110 m). The map in Figure 1 was generated programmatically from the public-domain datasets cited in the reference list [44,45,46]; the generation script is available from the corresponding author on request.
Conflicts of Interest
The authors declare no conflicts of interest.
Abbreviations
The following abbreviations are used in this manuscript:
| DEFRA | Department for Environment, Food and Rural Affairs (UK) |
| ECA/SECA | (Sulphur) Emission Control Area |
| EEA | European Environment Agency |
| EEXI | Energy Efficiency Existing Ship Index |
| EMSA | European Maritime Safety Agency |
| ETS | Emissions Trading System |
| EUA | EU Allowance |
| GLOBE | Global Land One-Kilometre Base Elevation |
| GUS | Statistics Poland (Główny Urząd Statystyczny) |
| HGV | Heavy Goods Vehicle |
| ICCT | International Council on Clean Transportation |
| IMO | International Maritime Organization |
| LNG | Liquefied Natural Gas |
| MDO | Marine Diesel Oil |
| MRV | Monitoring, Reporting and Verification |
| Ro-Pax | Roll-On/Roll-Off Passenger (Vessel) |
| Ro-Ro | Roll-On/Roll-Off |
| RQ | Research Question |
| SSS | Short-Sea Shipping |
References
- European Parliament and Council. Regulation (EU) 2015/757 of the European Parliament and of the Council of 29 April 2015 on the Monitoring, Reporting and Verification of Carbon Dioxide Emissions from Maritime Transport, and Amending Directive 2009/16/EC. Off. J. Eur. Union 2015, L123, 55–76. [Google Scholar]
- Kotzampasakis, M. Maritime emissions trading in the EU: Systematic literature review and policy assessment. Transp. Policy 2025, 165, 28–41. [Google Scholar] [CrossRef] [Scilit]
- European Parliament and Council. Directive (EU) 2023/959 of the European Parliament and of the Council of 10 May 2023 Amending Directive 2003/87/EC Establishing a System for Greenhouse Gas Emission Allowance Trading Within the Union and Decision (EU) 2015/1814 Concerning the Establishment and Operation of a Market Stability Reserve for the Union Greenhouse Gas Emission Trading System. Off. J. Eur. Union 2023, L130, 134–202. [Google Scholar]
- European Parliament and Council. Regulation (EU) 2023/1805 of the European Parliament and of the Council of 13 September 2023 on the Use of Renewable and Low-Carbon Fuels in Maritime Transport, and Amending Directive 2009/16/EC. Off. J. Eur. Union 2023, L234, 48–100. [Google Scholar]
- Raza, Z.; Svanberg, M.; Wiegmans, B. Modal shift from road haulage to short sea shipping: A systematic literature review and research directions. Transp. Rev. 2020, 40, 382–406. [Google Scholar] [CrossRef] [Scilit]
- Wawrzyńska, A.; Przybyłowski, A.; Baziuk, M. Innovative and sustainable approaches to urban waterborne transport: Insights from Gdynia port city. TransNav Int. J. Mar. Navig. Saf. Sea Transp. 2025, 19, 175–184. [Google Scholar] [CrossRef] [Scilit]
- Zis, T.; Psaraftis, H.N. The implications of the new sulphur limits on the European Ro-Ro sector. Transp. Res. Part D Transp. Environ. 2017, 52, 185–201. [Google Scholar] [CrossRef] [Scilit]
- Schwartz, H.; Tsvetkova, A.; Hellström, M.; Gustafsson, M. Decarbonizing Maritime Corridors: How Carbon-Neutral Shipping Creates Environmental, Economic, and Social Impacts; Springer: Berlin/Heidelberg, Germany, 2025. [Google Scholar] [CrossRef] [Scilit]
- Zis, T.P.V.; Psaraftis, H.N.; Tillig, F.; Ringsberg, J.W. Decarbonizing maritime transport: A Ro-Pax case study. Res. Transp. Bus. Manag. 2020, 37, 100565. [Google Scholar] [CrossRef] [Scilit]
- Mayanti, B.; Hellström, M.; Katumwesigye, A. Assessing the decarbonization roadmap of a RoPax ferry. Marit. Econ. Logist. 2024, 27, 123–146. [Google Scholar] [CrossRef] [Scilit]
- International Renewable Energy Agency (IRENA). A Pathway to Decarbonise the Shipping Sector by 2050; IRENA: Abu Dhabi, United Arab Emirates, 2021. [Google Scholar]
- Vaca-Cabrero, J.; González-Cancelas, N.; Camarero-Orive, A.; Corral, M.M.E.-I.; Ricci, S. Economic impact of the application of the ETS to European ports: Analysis of different scenarios. Sustainability 2024, 16, 10433. [Google Scholar] [CrossRef] [Scilit]
- Psaraftis, H.N. Decarbonization of maritime transport: To be or not to be? Marit. Econ. Logist. 2019, 21, 353–371. [Google Scholar] [CrossRef] [Scilit]
- Pizzol, M. Deterministic and stochastic carbon footprint of intermodal ferry and truck freight transport across Scandinavian routes. J. Clean. Prod. 2019, 224, 626–636. [Google Scholar] [CrossRef] [Scilit]
- Tapaninen, U.; Palu, R. Recovery of Ro-Pax ferry traffic from COVID-19 under tightening environmental regulations: Case Helsinki–Tallinn. J. Shipp. Trade 2022, 7, 10. [Google Scholar] [CrossRef] [Scilit]
- Psaraftis, H.N.; Kontovas, C.A. Speed models for energy-efficient maritime transportation: A taxonomy and survey. Transp. Res. Part C Emerg. Technol. 2013, 26, 331–351. [Google Scholar] [CrossRef] [Scilit]
- Cariou, P. Is slow steaming a sustainable means of reducing CO2 emissions from container shipping? Transp. Res. Part D Transp. Environ. 2011, 16, 260–264. [Google Scholar] [CrossRef] [Scilit]
- Adland, R.; Cariou, P.; Wolff, F.-C. Optimal ship speed and the cubic law revisited: Empirical evidence from an oil tanker fleet. Transp. Res. Part E Logist. Transp. Rev. 2020, 140, 101972. [Google Scholar] [CrossRef] [Scilit]
- Bayramoglu, K. The effects of alternative fuels, cruising duration and variable generators combination on exhaust emissions, energy efficiency existing ship index (EEXI) and carbon intensity rating (CII). Ocean Eng. 2024, 302, 117723. [Google Scholar] [CrossRef] [Scilit]
- Kołakowski, P.; Gil, M.; Wróbel, K.; Ho, Y.S. State of play in technology and legal framework of alternative marine fuels and renewable energy systems: A bibliometric analysis. Marit. Policy Manag. 2022, 49, 236–260. [Google Scholar] [CrossRef] [Scilit]
- Kołakowski, P.; Ampah, J.D.; Wróbel, K.; Yusuf, A.A.; Gil, M.; Afrane, S.; Jin, C.; Liu, H. Alternative fuels in shipping: Discussion on the findings of two recently published, independent bibliometric studies. J. Clean. Prod. 2022, 338, 130651. [Google Scholar] [CrossRef] [Scilit]
- Balcombe, P.; Brierley, J.; Lewis, C.; Skatvedt, L.; Speirs, J.; Hawkes, A.; Staffell, I. How to decarbonise international shipping: Options for fuels, technologies and policies. Energy Convers. Manag. 2019, 182, 72–88. [Google Scholar] [CrossRef] [Scilit]
- Bilgili, L. Comparative assessment of alternative marine fuels in life cycle perspective. Renew. Sustain. Energy Rev. 2021, 144, 110985. [Google Scholar] [CrossRef] [Scilit]
- Wang, Q.; Zhang, H.; Huang, J.; Zhang, P. The use of alternative fuels for maritime decarbonization: Special marine environmental risks and solutions from an international law perspective. Front. Mar. Sci. 2023, 9, 1082453. [Google Scholar] [CrossRef] [Scilit]
- Alamoush, A.S.; Ballini, F.; Ölçer, A.I. Ports’ technical and operational measures to reduce greenhouse gas emission and improve energy efficiency: A review. Mar. Pollut. Bull. 2020, 160, 111508. [Google Scholar] [CrossRef] [Scilit] [PubMed]
- Fadiga, A.; Ferreira, L.M.D.F.; Bigotte, J.F. Decarbonising maritime ports: A systematic review of the literature and insights for new research opportunities. J. Clean. Prod. 2024, 452, 142209. [Google Scholar] [CrossRef] [Scilit]
- Williamsson, J.; Costa, N.; Santén, V.; Rogerson, S. Barriers and drivers to the implementation of onshore power supply—A literature review. Sustainability 2022, 14, 6072. [Google Scholar] [CrossRef] [Scilit]
- Abu Bakar, N.N.; Bazmohammadi, N.; Vasquez, J.C.; Guerrero, J.M. Electrification of onshore power systems in maritime transportation towards decarbonization of ports: A review of the cold ironing technology. Renew. Sustain. Energy Rev. 2023, 178, 113243. [Google Scholar] [CrossRef] [Scilit]
- Herrero, A.; Ortega Piris, A.; Diaz-Ruiz-Navamuel, E.; Gutierrez, M.A.; Lopez-Diaz, A.-I. Influence of the implantation of the onshore power supply (OPS) system in Spanish medium-sized ports on the reduction in CO2 emissions: The case of the Port of Santander. J. Mar. Sci. Eng. 2022, 10, 1446. [Google Scholar] [CrossRef] [Scilit]
- Zis, T. Prospects of cold ironing as an emissions reduction option. Transp. Res. Part A Policy Pract. 2019, 119, 82–95. [Google Scholar] [CrossRef] [Scilit]
- Osipova, L.; Carraro, C. Shore Power Needs and CO2 Emissions Reductions of Ships in European Union Ports: Meeting the Ambitions of the FuelEU Maritime and AFIR; Working Paper 2023–2024; International Council on Clean Transportation: Washington, DC, USA, 2023. [Google Scholar]
- Stolz, B.; Held, M.; Georges, G.; Boulouchos, K. The CO2 reduction potential of shore-side electricity in Europe. Appl. Energy 2021, 285, 116425. [Google Scholar] [CrossRef] [Scilit]
- Global Maritime Forum. Annual Progress Report on Green Shipping Corridors 2024; Global Maritime Forum: Copenhagen, Denmark, 2024. [Google Scholar]
- Gucma, L.; Raczkowska, J. An Analysis of Basic Parameters of Ro-Pax Ferries in the Baltic Sea as Guidelines for Its Preliminary Design. Pol. Marit. Res. 2018, 25, 44–53. [Google Scholar] [CrossRef] [Scilit]
- Blokus, A.; Dziula, P. Reliability analysis of different configurations of master and back-up systems used in maritime navigation. J. Mar. Sci. Eng. 2020, 8, 34. [Google Scholar] [CrossRef] [Scilit]
- Alhosalo, M.; Helminen, R. Benchmarking of Ro-Ro Connections in the Baltic Sea and the North Sea. In Centre for Maritime Studies; University of Turku: Turku, Finland, 2019. [Google Scholar]
- Gucma, S. Morskie Terminale Promowe—Projektowanie i Eksploatacja w Ujęciu Inżynierii Ruchu; Fundacja Promocji Przemysłu Okrętowego i Gospodarki Morskiej: Gdańsk, Poland, 2012. [Google Scholar]
- European Maritime Safety Agency. THETIS-MRV: CO2 Emission Reports. Available online: https://mrv.emsa.europa.eu/#public/emission-report (accessed on 8 March 2026).
- European Environment Agency. Specific CO2 Emissions per Tonne-Km and per Mode of Transport in Europe; EEA: Copenhagen, Denmark, 2022; Available online: https://www.eea.europa.eu/en/analysis/maps-and-charts/specific-co2-emissions-per-tonne-2-daviz (accessed on 9 June 2026).
- Ship & Bunker. Marine Bunker Prices—Rotterdam. Available online: https://shipandbunker.com/prices/emea/nwe/nl-rtm-rotterdam (accessed on 8 March 2026).
- Frishfelds, V.; Sennikovs, J.; Bethers, U.; Murawski, J.; Timuhins, A. Modeling transit flow through port gates and connecting channel in the Baltic Sea–Liepāja Port–Liepāja Lake system. Front. Mar. Sci. 2021, 8, 657721. [Google Scholar] [CrossRef] [Scilit]
- PIANC. The Design of Terminals for Ro-Ro and Ro-Pax Vessels; MarCom Working Group Report No. 167; PIANC: Brussels, Belgium, 2023. [Google Scholar]
- Elek, A.; Połubiński, J.; Preis, H. Podstawy Optymalizacji Parametrów Linii Obsługiwanych Przez Wielozadaniowe Statki Typu Ro-Ro; Wydawnictwo Instytutu Morskiego: Gdańsk–Szczecin, Poland, 1977. [Google Scholar]
- NOAA National Geophysical Data Center. Global Land One-Kilometer Base Elevation (GLOBE) v.1; NOAA National Centers for Environmental Information: Boulder, CO, USA, 1999. [Google Scholar] [CrossRef] [Scilit]
- Karin, T. toddkarin/global-land-mask: Release of Version 1.0.0. Zenodo. 2020. Available online: https://zenodo.org/records/4066722 (accessed on 15 July 2026).
- Natural Earth. Free Vector and Raster Map Data. Available online: https://www.naturalearthdata.com (accessed on 15 July 2026).
- Eurostat. Road Freight Transport Statistics; European Commission: Luxembourg, 2024; Available online: https://ec.europa.eu/eurostat (accessed on 12 December 2025).
- Holthof, P. NAOS—A prominent ferry designer with a diverse portfolio and established Visentini partnership. Shipp. Info 2019, 7–8, 15–22. [Google Scholar]
- Stena RoRo. Stena E-Flexer. Available online: https://stenaroro.com/cases/e-flexer/ (accessed on 10 June 2026).
- Port of Gdynia Authority (ZMPG S.A.). Tariff of Harbour Dues, Effective 1 April 2024; Port of Gdynia Authority (ZMPG S.A.): Gdynia, Poland, 2024; Available online: https://www.port.gdynia.pl/wp-content/uploads/2024/01/Harbour-Dues-Port-Gdynia-dtd-2024-04-01.pdf (accessed on 26 February 2026).
- Liepāja Special Economic Zone Board. Port Fees in the Port of Liepāja (Effective 1 January 2025); Liepāja Special Economic Zone Board: Liepāja, Latvia, 2021; Available online: https://liepaja-sez.lv/doc/mod/document/76/1736242178_Port%20fees%20in%20the%20port%20of%20Liepaja%20(01.01.2025).pdf (accessed on 26 February 2026).
- Im, H.; Yu, J.; Lee, C. Truck appointment system for cooperation between the transport companies and the terminal operator at container terminals. Appl. Sci. 2021, 11, 168. [Google Scholar] [CrossRef] [Scilit]
- Wawrzyńska, A.; Karczewski, R. Energy security and the green transition: A case study of a diesel fuel transshipment terminal in the southern Baltic. TransNav Int. J. Mar. Navig. Saf. Sea Transp. 2026, 20, 407–421. [Google Scholar] [CrossRef] [Scilit]

Disclaimer/Publisher’s Note: The statements, opinions and data contained in all publications are solely those of the individual author(s) and contributor(s) and not of MDPI and/or the editor(s). MDPI and/or the editor(s) disclaim responsibility for any injury to people or property resulting from any ideas, methods, instructions or products referred to in the content. |
© 2026 by the authors. Licensee MDPI, Basel, Switzerland. This article is an open access article distributed under the terms and conditions of the Creative Commons Attribution (CC BY) license.