


Abstract
In response to issues such as disordered airflow distribution and prominent local hotspots in campus non-standard data centers, this study took a non-standard raised-floor air-supply data center at a university in Hangzhou as the research object, and used a combination of on-site measurements and computational fluid dynamics (CFD) numerical simulation to investigate the optimization of the thermal environment. The temperature and air velocity of the data center were measured using a handheld hot-wire anemometer, and a standard k-ε turbulence model was established on the 6SigmaDC platform (now Cadence Reality DC Design Pro, version 2024.1). Model accuracy was confirmed through grid independence verification with three mesh levels and statistical error metrics (MAE, MBE, RMSE) across multiple measurement zones. The results show that the mean absolute error of temperature does not exceed 0.9 °C in all zones and the mean absolute error of air velocity does not exceed 0.20 m/s, indicating that the model effectively reproduces the airflow distribution and thermal environment of the data center. On this basis, to address the uneven airflow distribution in the underfloor plenum, an optimization strategy was proposed that involved the installation of composite baffles and the coordinated adjustment of variable floor tile openings. Eight representative simulation scenarios were designed, with the coefficient of variation and air supply uniformity index as evaluation indicators. Results indicate that the combined effect of perforated baffles and variable floor tile openings is the optimal strategy, reducing the range of net airflow among air supply outlets from 0.100 to 0.077 m3/s, decreasing the coefficient of variation from 12.8% to 10.8%, and increasing the air supply uniformity index by 10.7%. Whole-room thermal environment verification shows that the optimal scheme reduces the supply heat index (SHI) from 0.42 to 0.35, with an estimated PUE reduction of about 0.03, achieving both airflow uniformity improvement and energy-saving benefits. By improving the cooling efficiency and reducing the PUE, this retrofit strategy contributes to the sustainable operation of small-to-medium-sized campus data centers, supporting energy efficiency and carbon footprint reduction goals under green campus and low-carbon initiatives.
1. Introduction
Compared with commercial large-scale standardized data centers, campus data centers are generally characterized by small construction scales, asymmetric layouts, and irregular hot/cold aisle configurations. Most are retrofitted from existing buildings, leading to prevalent issues such as disordered airflow distribution, localized hotspots, low cooling efficiency, and high energy consumption [1]. Field measurements indicate that the Power Usage Effectiveness (PUE) of campus data centers typically ranges from 1.8 to 2.3, significantly exceeding the 1.4–1.6 average of large commercial facilities [1]. Under the national ‘dual-carbon’ strategy and green campus initiatives, optimizing the thermal environment and energy performance of non-standard data centers has become an urgent practical necessity.
The optimization of airflow organization and thermal environments in data centers has attracted considerable research attention. Scholars have employed CFD numerical simulation [2], field measurements [3], and scaled experiments [4] to investigate key parameters such as raised-floor height [5] and room layout [6]. Ling et al. [7] established a quantitative relationship between perforated tile opening ratio, Reynolds number, and pressure loss coefficient, providing a theoretical basis for underfloor air supply design. Jiang et al. [8] compared three air supply strategies and found that hot/cold aisle containment could improve floor air supply efficiency from 65.69% to 85.57–90.25%, significantly reducing the Supply Heat Index (SHI). However, most existing studies target large, symmetric, standardized data centers; field measurement and simulation studies focusing on non-standard, asymmetric campus facilities remain scarce.
The underfloor plenum serves as the core hub for cold air distribution, and its airflow state directly determines the uniformity of supply air at each outlet. Zhang et al. [9] proposed inserting perforated plates into the plenum to improve flow homogeneity, achieving uniformity improvements of 87.50% and 56.71%, respectively. Chang et al. [10] noted in their review that optimizing plenum baffle design is one of the key measures for enhancing airflow uniformity. Yu et al. [11] used the 6SigmaDC software to simulate airflow in a small-scale data center and confirmed that a raised-floor height of 600 mm yields the lowest cabinet inlet temperatures. Additionally, Miao et al. [12], Liu [13], and Shang et al. [14] conducted studies on opening ratio optimization, flow guide structures, and orifice modifications, respectively. However, existing studies mostly target standardized data centers, and baffle arrangements are mostly derived from experience or orthogonal optimization, lacking targeted analysis for special scenarios such as non-standard equipment rooms.
This study takes a non-standard raised-floor air-supply data center at a university in Hangzhou as the research object and carries out a dedicated optimization study of the underfloor plenum. By installing composite baffles and adjusting the openings of variable-opening floor tiles, eight representative simulation scenarios were designed to systematically analyze the influence of baffle installation and floor tile opening strategies on the air supply uniformity of the plenum. Compared with previous studies, the features of this work are mainly reflected in two aspects: (1) in terms of research procedure, a four-step research framework of “field measurement validation—pre-simulation parameter screening—factorial scenario design—whole-room thermal environment verification” is adopted, in which all steps are interconnected and independent of the geometric conditions of a specific room, providing a reference for other non-standard data centers converted from existing buildings; (2) in terms of retrofit mechanism, unlike previous baffle arrangement methods based on experience or orthogonal tests, this study uses a comparison of eight scenarios to explain why the “macroscopic pressure-field reconstruction” of perforated baffles and the “microscopic resistance compensation” of variable-opening floor tiles must be used in coordination, and also explains the physical mechanism underlying the limited effect of any single measure, providing a reference for parameter selection in similar engineering retrofits.
2. Materials and Methods
2.1. Test Facility
The test object of this study is a non-standard raised-floor air-supply data center at a university in Hangzhou. The room measures 18.0 m × 8.4 m in plan and 3.6 m in height, with a raised-floor height of 0.4 m, and adopts underfloor air supply. Two rows (A and B) of 36 racks are arranged inside, with irregular cold/hot aisle spacing. The floor air supply outlets are scattered and not strictly aligned with the rack positions, resulting in severe mixing of cold and hot airflows. The room is equipped with 3 precision air-conditioning units with a total air supply volume of 8 m3/s and a supply air temperature of 18 °C. The room operates continuously for 8760 h per year, and the supply air temperature is constantly set at 18 °C throughout the year without adjustment to outdoor meteorological conditions. The heat dissipation of each rack varies considerably, with measured input power ranging from 0.35 kW to 2.94 kW. The room has no cold/hot aisle containment, and scattered air supply outlets exist in the hot aisle.
2.2. Field Measurements
A handheld hot-wire anemometer (with temperature measurement function) was used for the thermal environment measurement of the equipment room, and a high-precision digital clamp power meter was used for rack power measurement. The instrument parameters are listed in Table 1.
Table 1.
Parameters of measurement instruments.
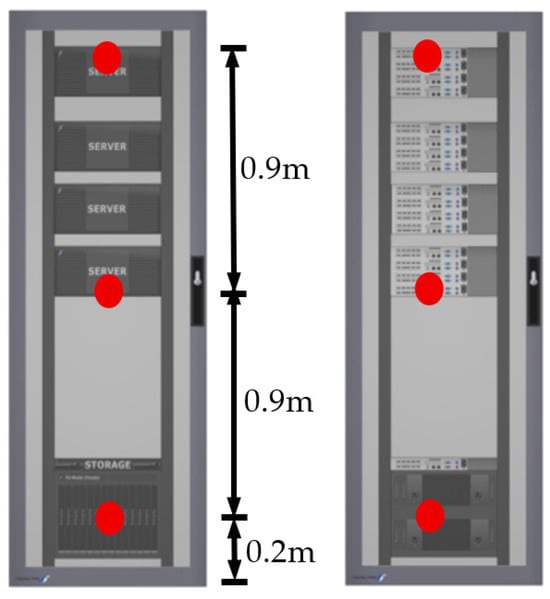
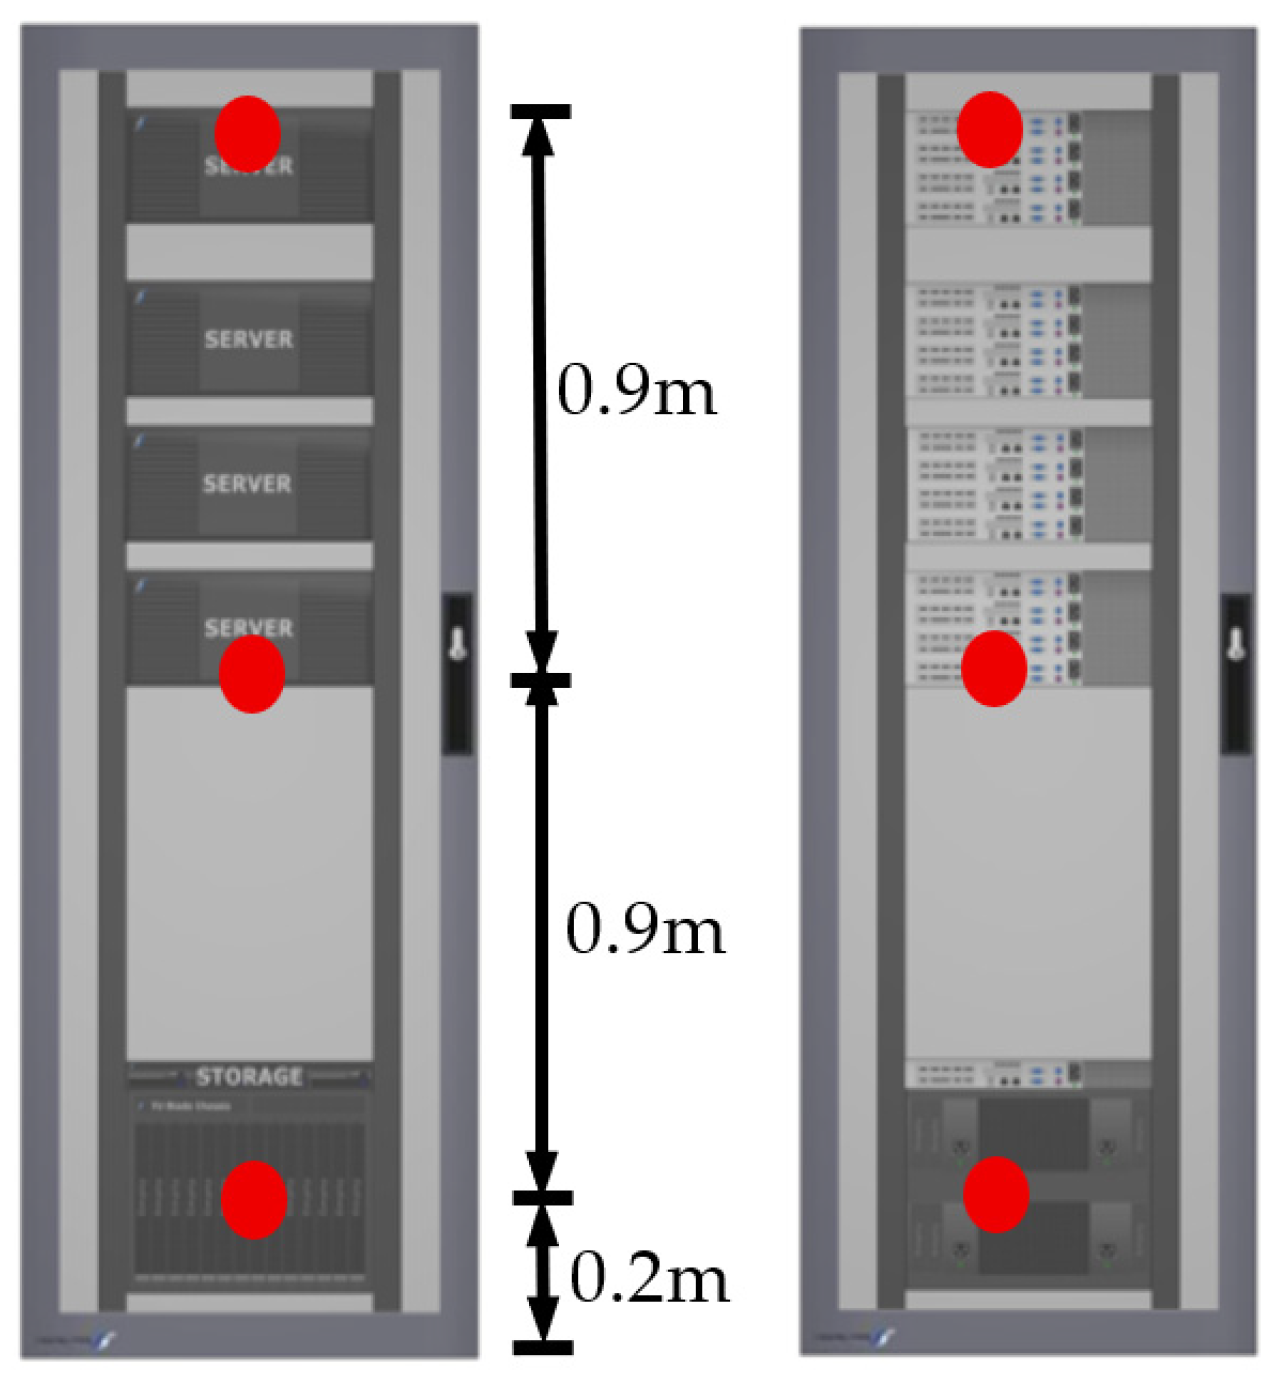
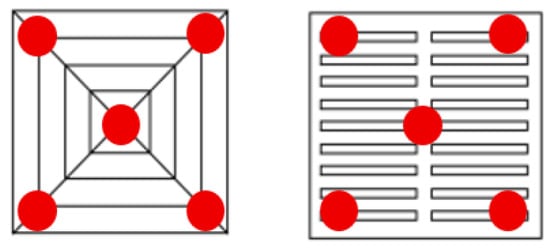
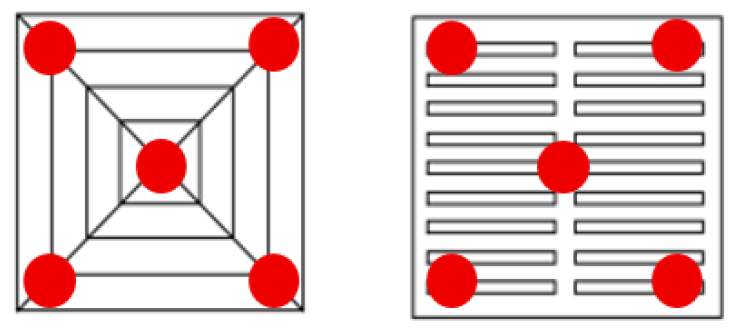
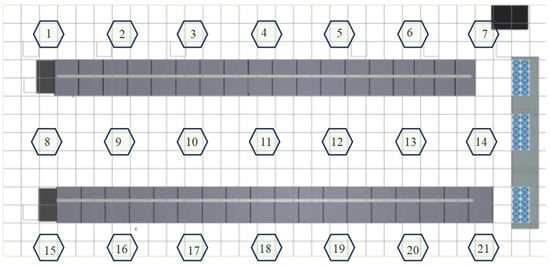
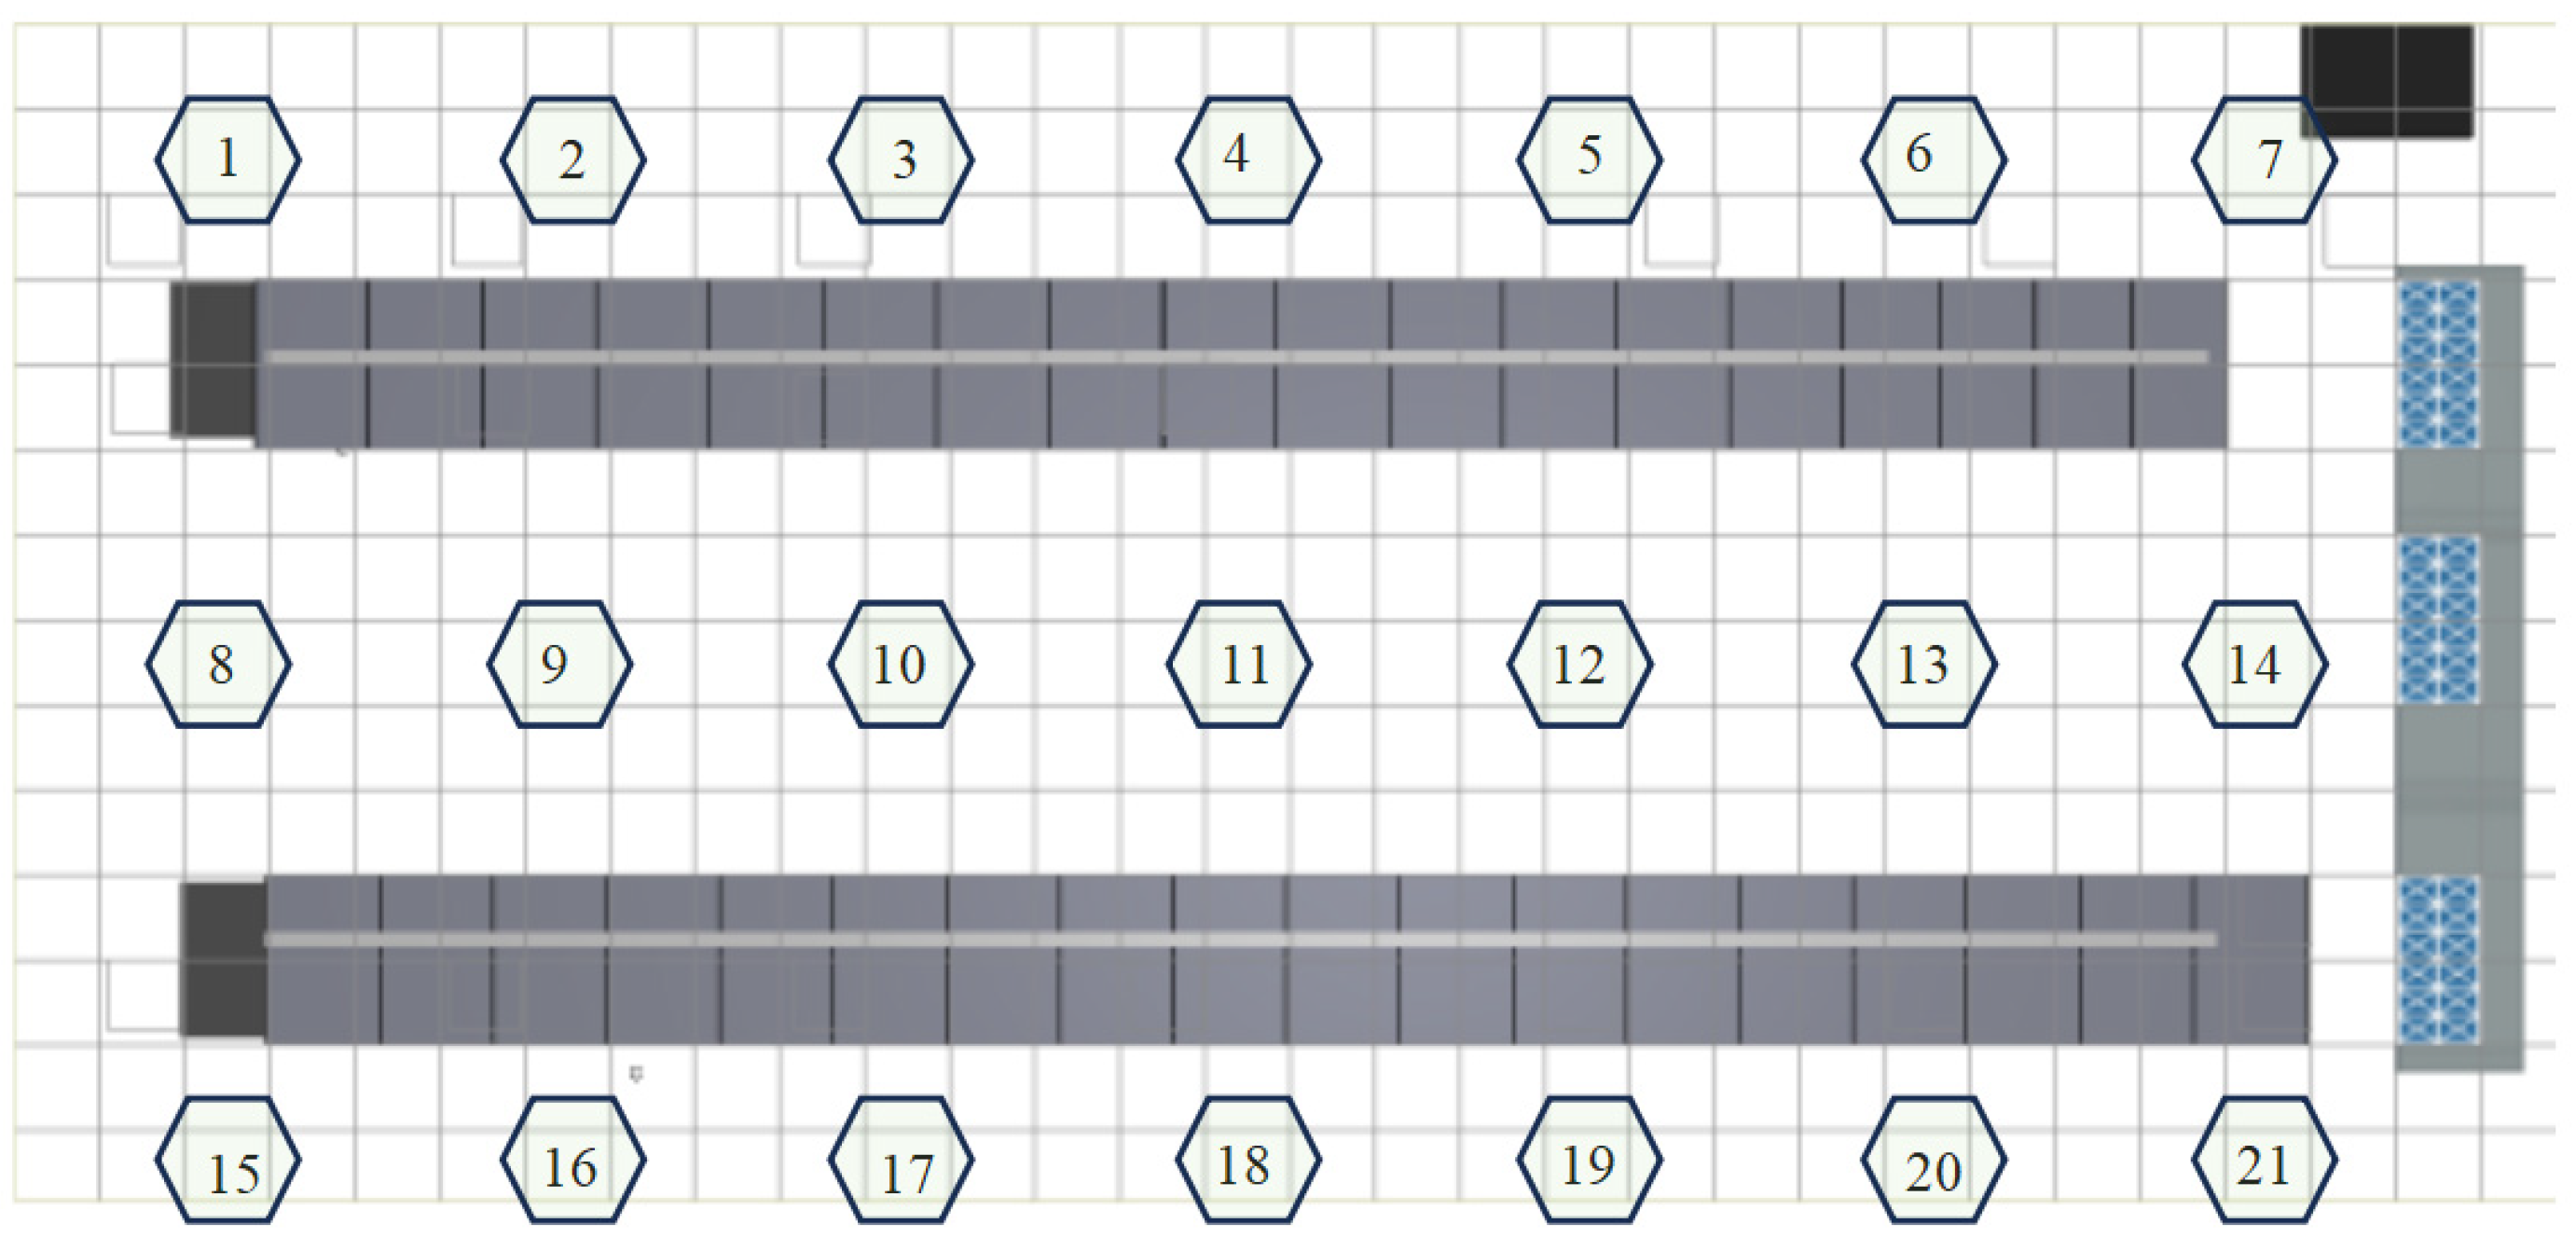
To comprehensively characterize the thermal environment and airflow organization of the equipment room, measurement points were arranged in layers according to three types of zones: (1) Rack inlets/outlets: for each rack in rows A and B, measurement points were set on the front (inlet) and back (outlet) at heights of 0.2 m, 1.1 m, and 2.0 m, respectively, i.e., 6 points per rack (Figure 1); (2) Perforated air-supply floor tiles: no fewer than 10 perforated tiles were randomly selected in each zone, and 5 measurement points were set on each tile at the centers of four equal-area squares and the overall center (Figure 2); (3) Cold/hot aisles: one measurement point was set every 1.8 m along the aisle, totaling 21 points at a height of 1 m (Figure 3).
Figure 1.
Layout of measurement points at rack inlets and outlets.
Figure 2.
Supply Air Floor Measurement Point Layout.
Figure 3.
Cold/Hot Aisle Measurement Point Distribution.
2.3. CFD Simulation
2.3.1. Boundary Conditions
The computational domain was built at a 1:1 scale according to the actual room dimensions, a full-room model of 18.0 m (length) × 8.4 m (width) × 3.6 m (height), including the 0.4 m-high underfloor plenum space; all 36 racks, 3 precision air conditioners, and all perforated air-supply floor tiles were modeled at their actual positions. The boundary conditions of the numerical simulation were all set based on the actual operating parameters and test data of the equipment room. The air supply volume of 8 m3/s and supply air temperature of 18 °C are actual operating values; the walls, floor, and ceiling of the room were treated as adiabatic boundaries. The actual steady-state operating power of the racks was directly measured with a high-precision clamp power meter, with an uncertainty of ≤±3%. Rack leakage was set as typical small gaps (5%); the perforated air-supply floor tiles were treated with a porous-media resistance model with a porosity of 50%. The specific boundary condition settings are listed in Table 2.
Table 2.
Boundary condition settings.
2.3.2. Solution Control
The numerical simulation was carried out on the 6SigmaDC professional data center simulation platform. The airflow in the equipment room is low-velocity, buoyancy-driven, large-scale recirculating turbulence, with a moderate turbulent Reynolds number and no obvious strong swirl or separated flow characteristics. The engineering accuracy of the standard k-ε turbulence model in full-room airflow simulation of data centers has been verified by a large number of similar studies [2,5,8], and it offers high computational stability and fast convergence; therefore, the standard k-ε model was selected in this study.
The governing equations were discretized using the finite volume method, with a second-order upwind scheme for convection terms and a central differencing scheme for diffusion terms. The air was treated as an incompressible ideal gas, and density variation was modeled with the Boussinesq approximation to account for buoyancy effects. Since the room walls are adiabatic and the temperature differences between surfaces are small, radiative heat transfer accounts for less than 5% of the total heat transfer and was therefore neglected; the racks are treated as uniformly distributed volumetric heat sources with measured power, and the perforated floor tiles are treated with a porous-media resistance model with a porosity of 50%. A calibrated residual convergence criterion was adopted during the solution process: the residuals of all parameters converged to the order of 10−4 after approximately 500 iterations, and the fluctuations of monitored temperature and velocity were less than 0.5%, satisfying the convergence requirements.
2.3.3. Mesh Generation and Independence Verification
A structured Cartesian mesh was generated, with local refinement in regions of steep gradients such as rack inlets/outlets, perforated air-supply floor tiles, baffles, and air-conditioning supply/return outlets; the minimum mesh size in the refined zones was 0.02 m, the cell aspect ratio was controlled within 20, and the skewness met the solver quality requirements. Considering that the airflow distribution in the raised-floor plenum is highly sensitive to mesh quality, a mesh independence verification was carried out with three mesh levels, using the air velocity and temperature at a characteristic point in the cold aisle (1.0 m above the floor) and the total flow rate of the air supply outlets as monitoring objects. The results are listed in Table 3.
Table 3.
Mesh independence verification results.
It can be seen that the deviation between the coarse-mesh results and the medium mesh reaches 5.0%, while the deviations of velocity, temperature, and total flow rate between the fine and medium meshes are all within 1%, indicating that the 1.52-million-cell mesh has achieved a mesh-independent solution. Considering both computational accuracy and resource consumption, the medium mesh scheme (approximately 1.52 million cells) was adopted for all subsequent simulations.
3. Model Validation
3.1. Cabinet Inlet/Outlet Temperature Validation
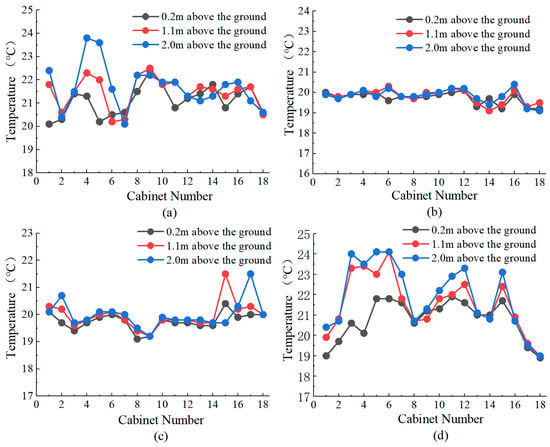
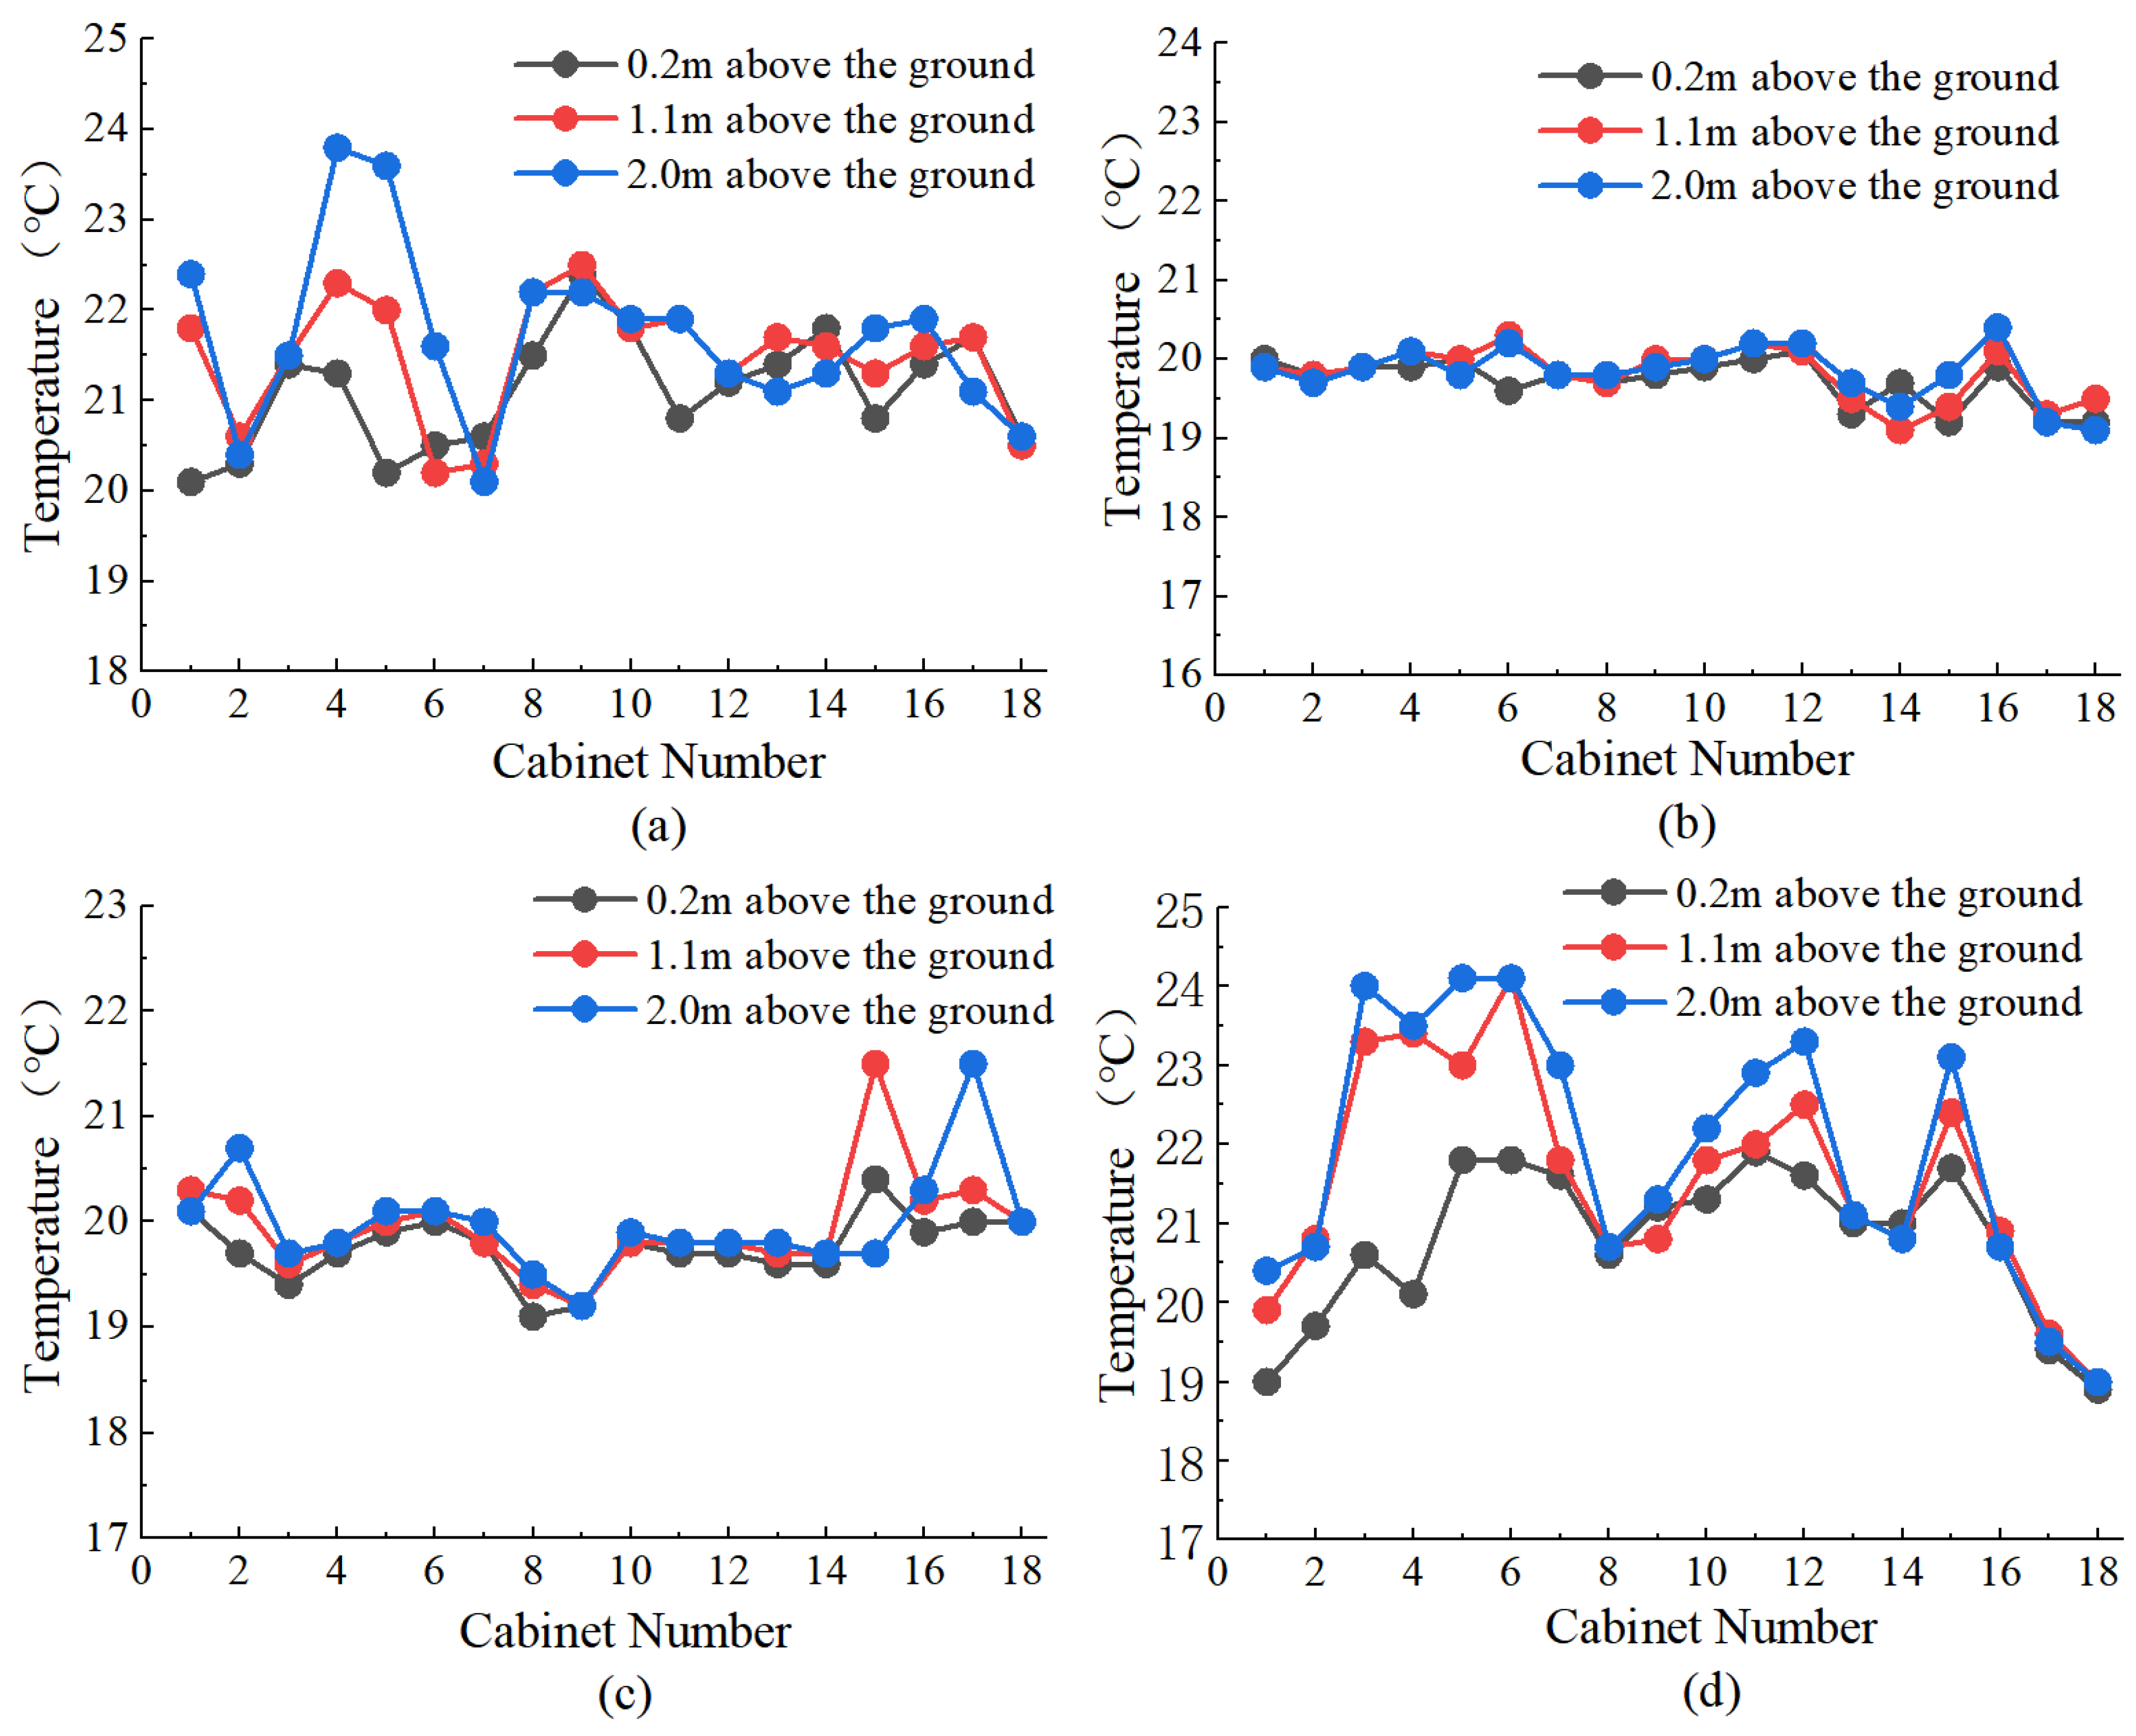
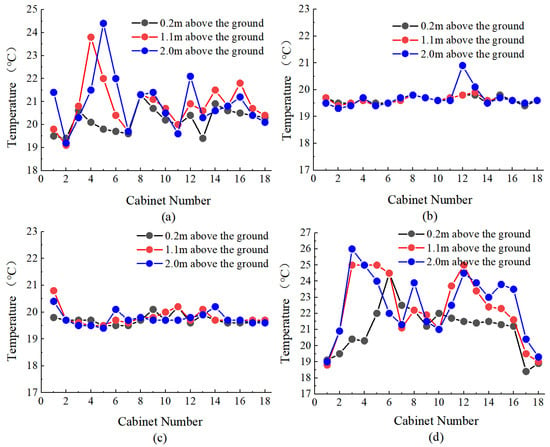
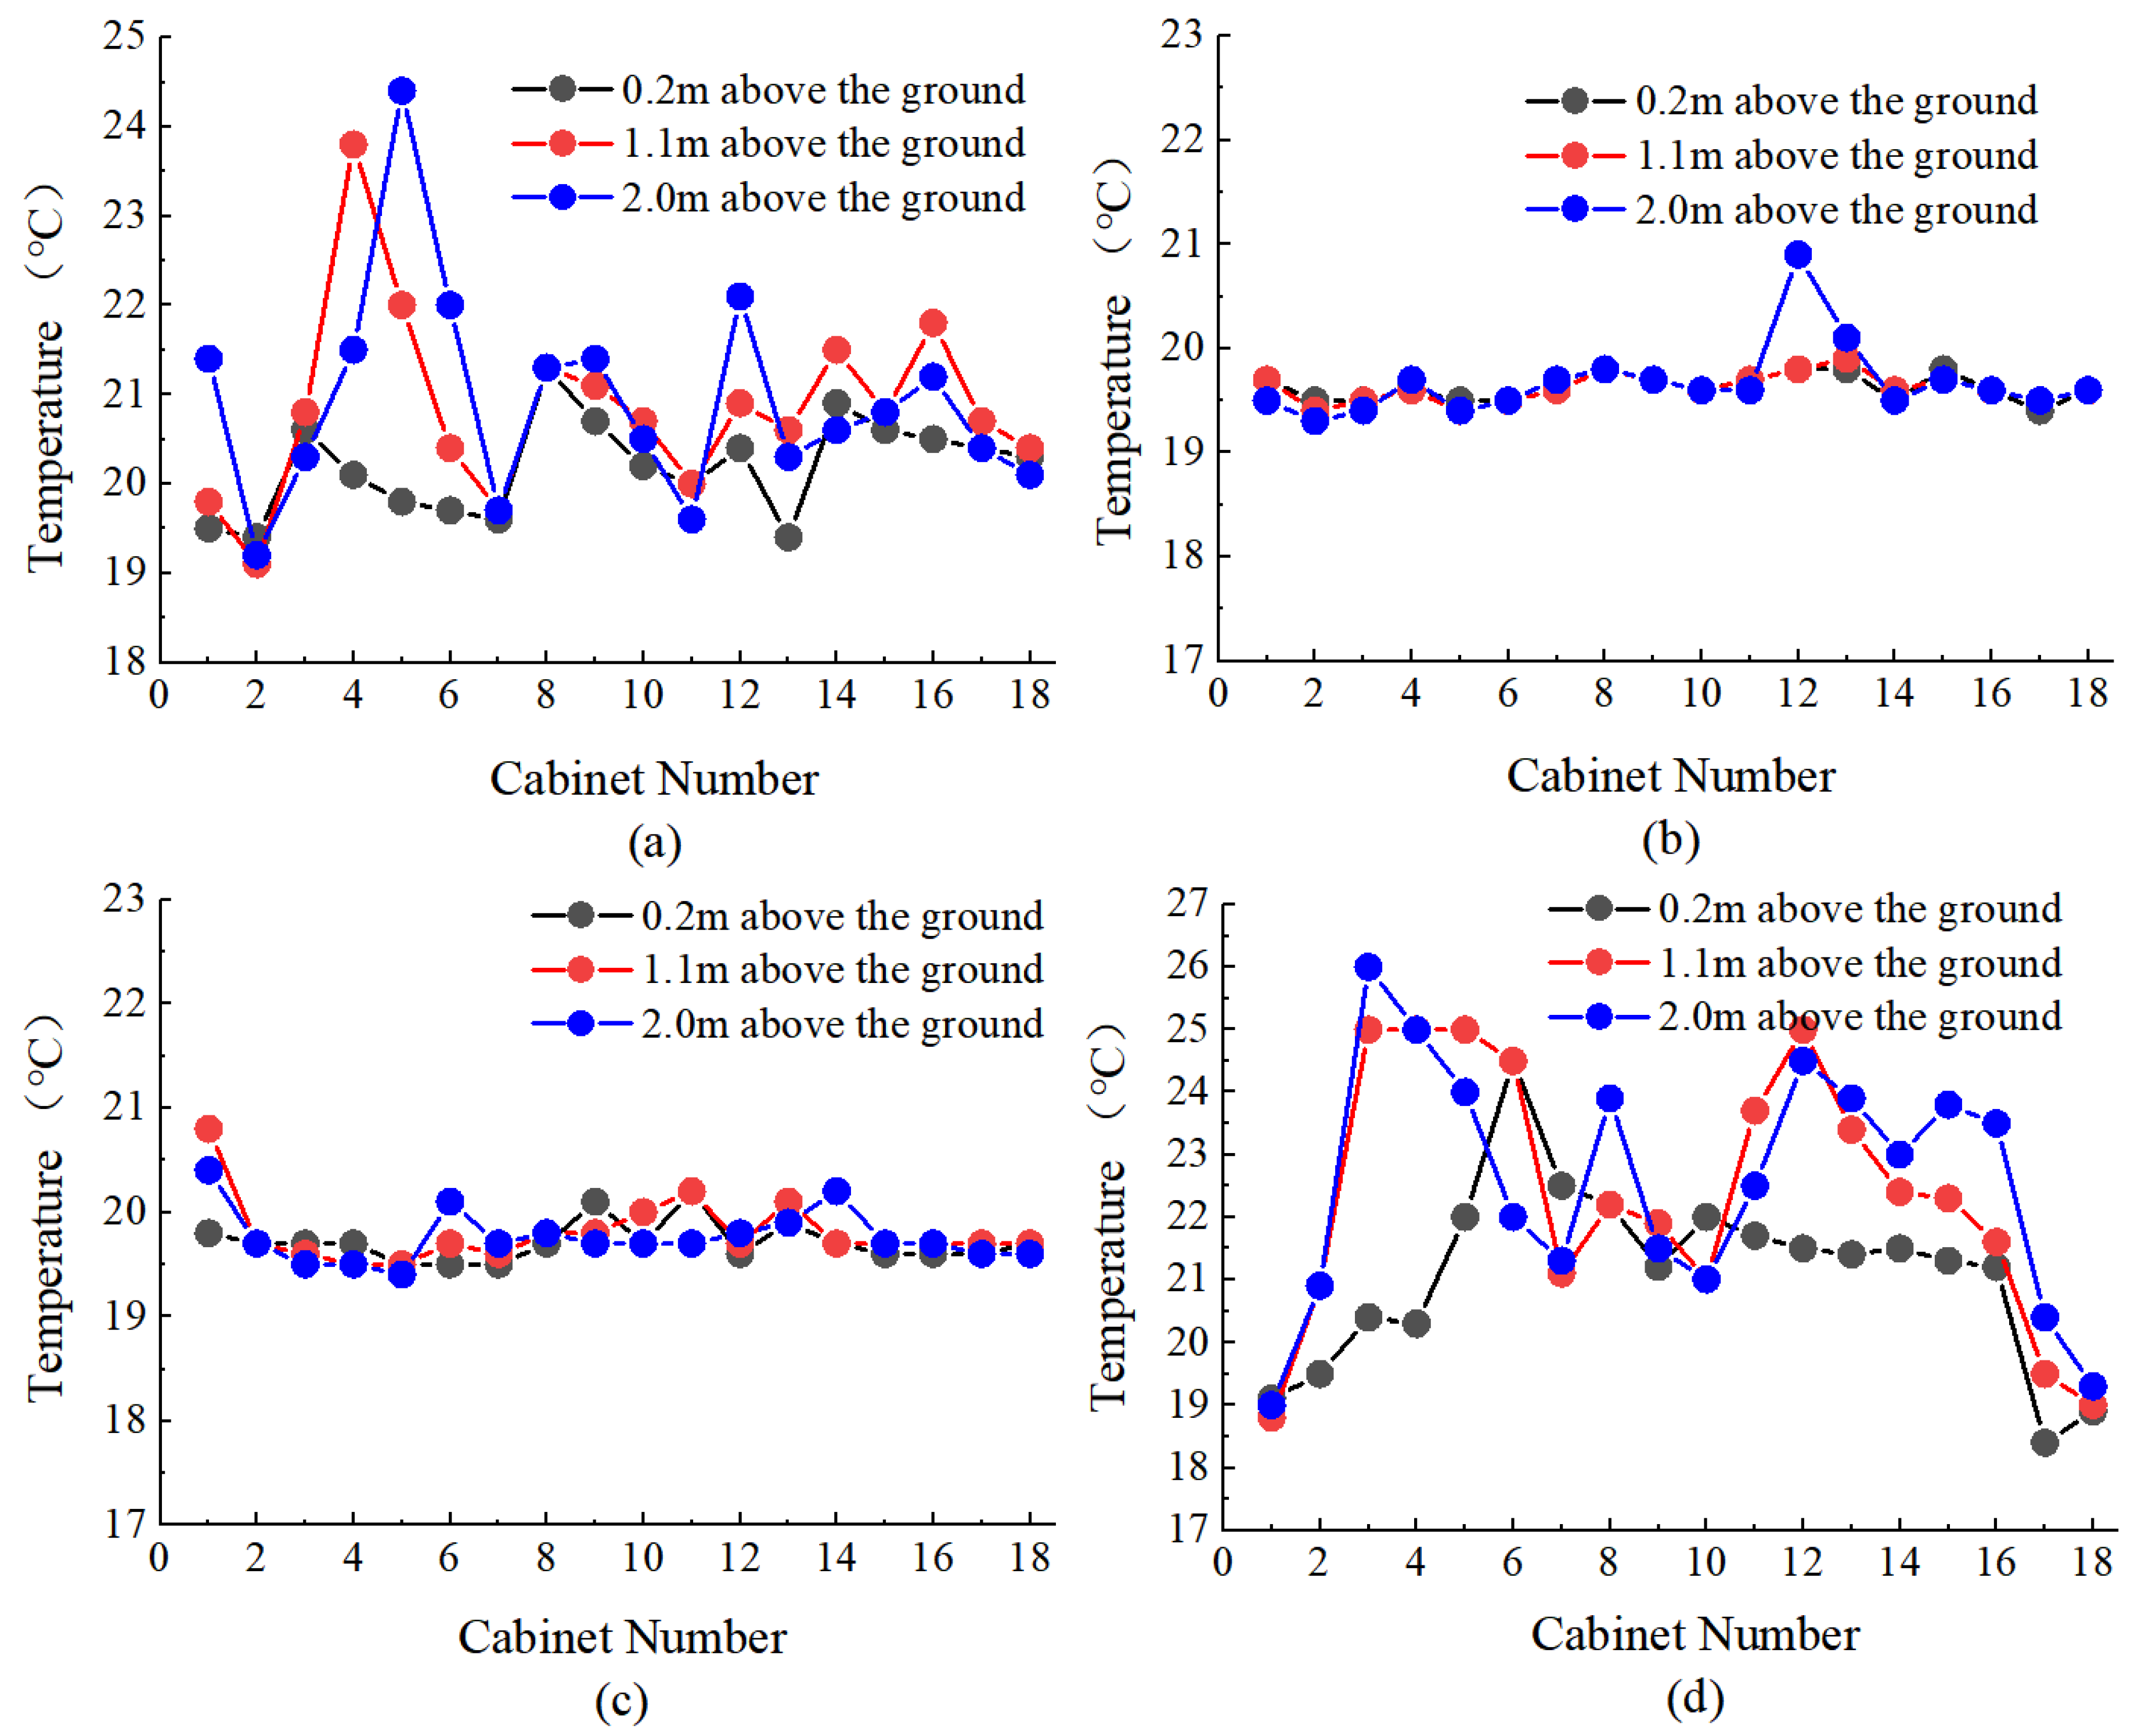
The temperatures at the inlets and outlets of racks in rows A and B were measured at heights of 0.2 m, 1.1 m, and 2.0 m above the floor, and the results are shown in Figure 4. It can be seen that the measured temperatures do not exhibit the theoretical vertical stratification of “low at the bottom and high at the top”; the temperatures at different heights are close to each other without obvious fluctuations. The temperature fluctuation on the cold-aisle side is very small overall, while a certain degree of vertical fluctuation exists on the hot-aisle side.
Figure 4.
Measured temperature distributions of racks: (a) hot-aisle side of row A; (b) cold-aisle side of row A; (c) cold-aisle side of row B; (d) hot-aisle side of row B.
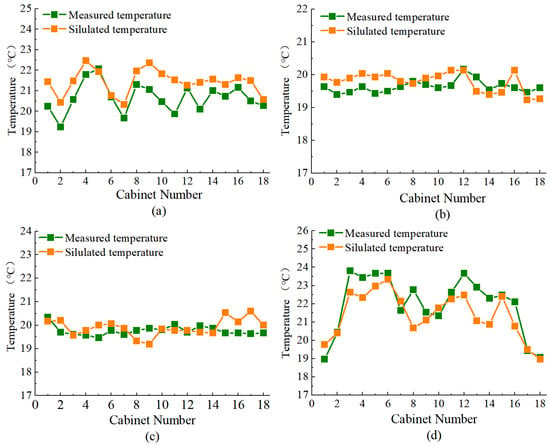
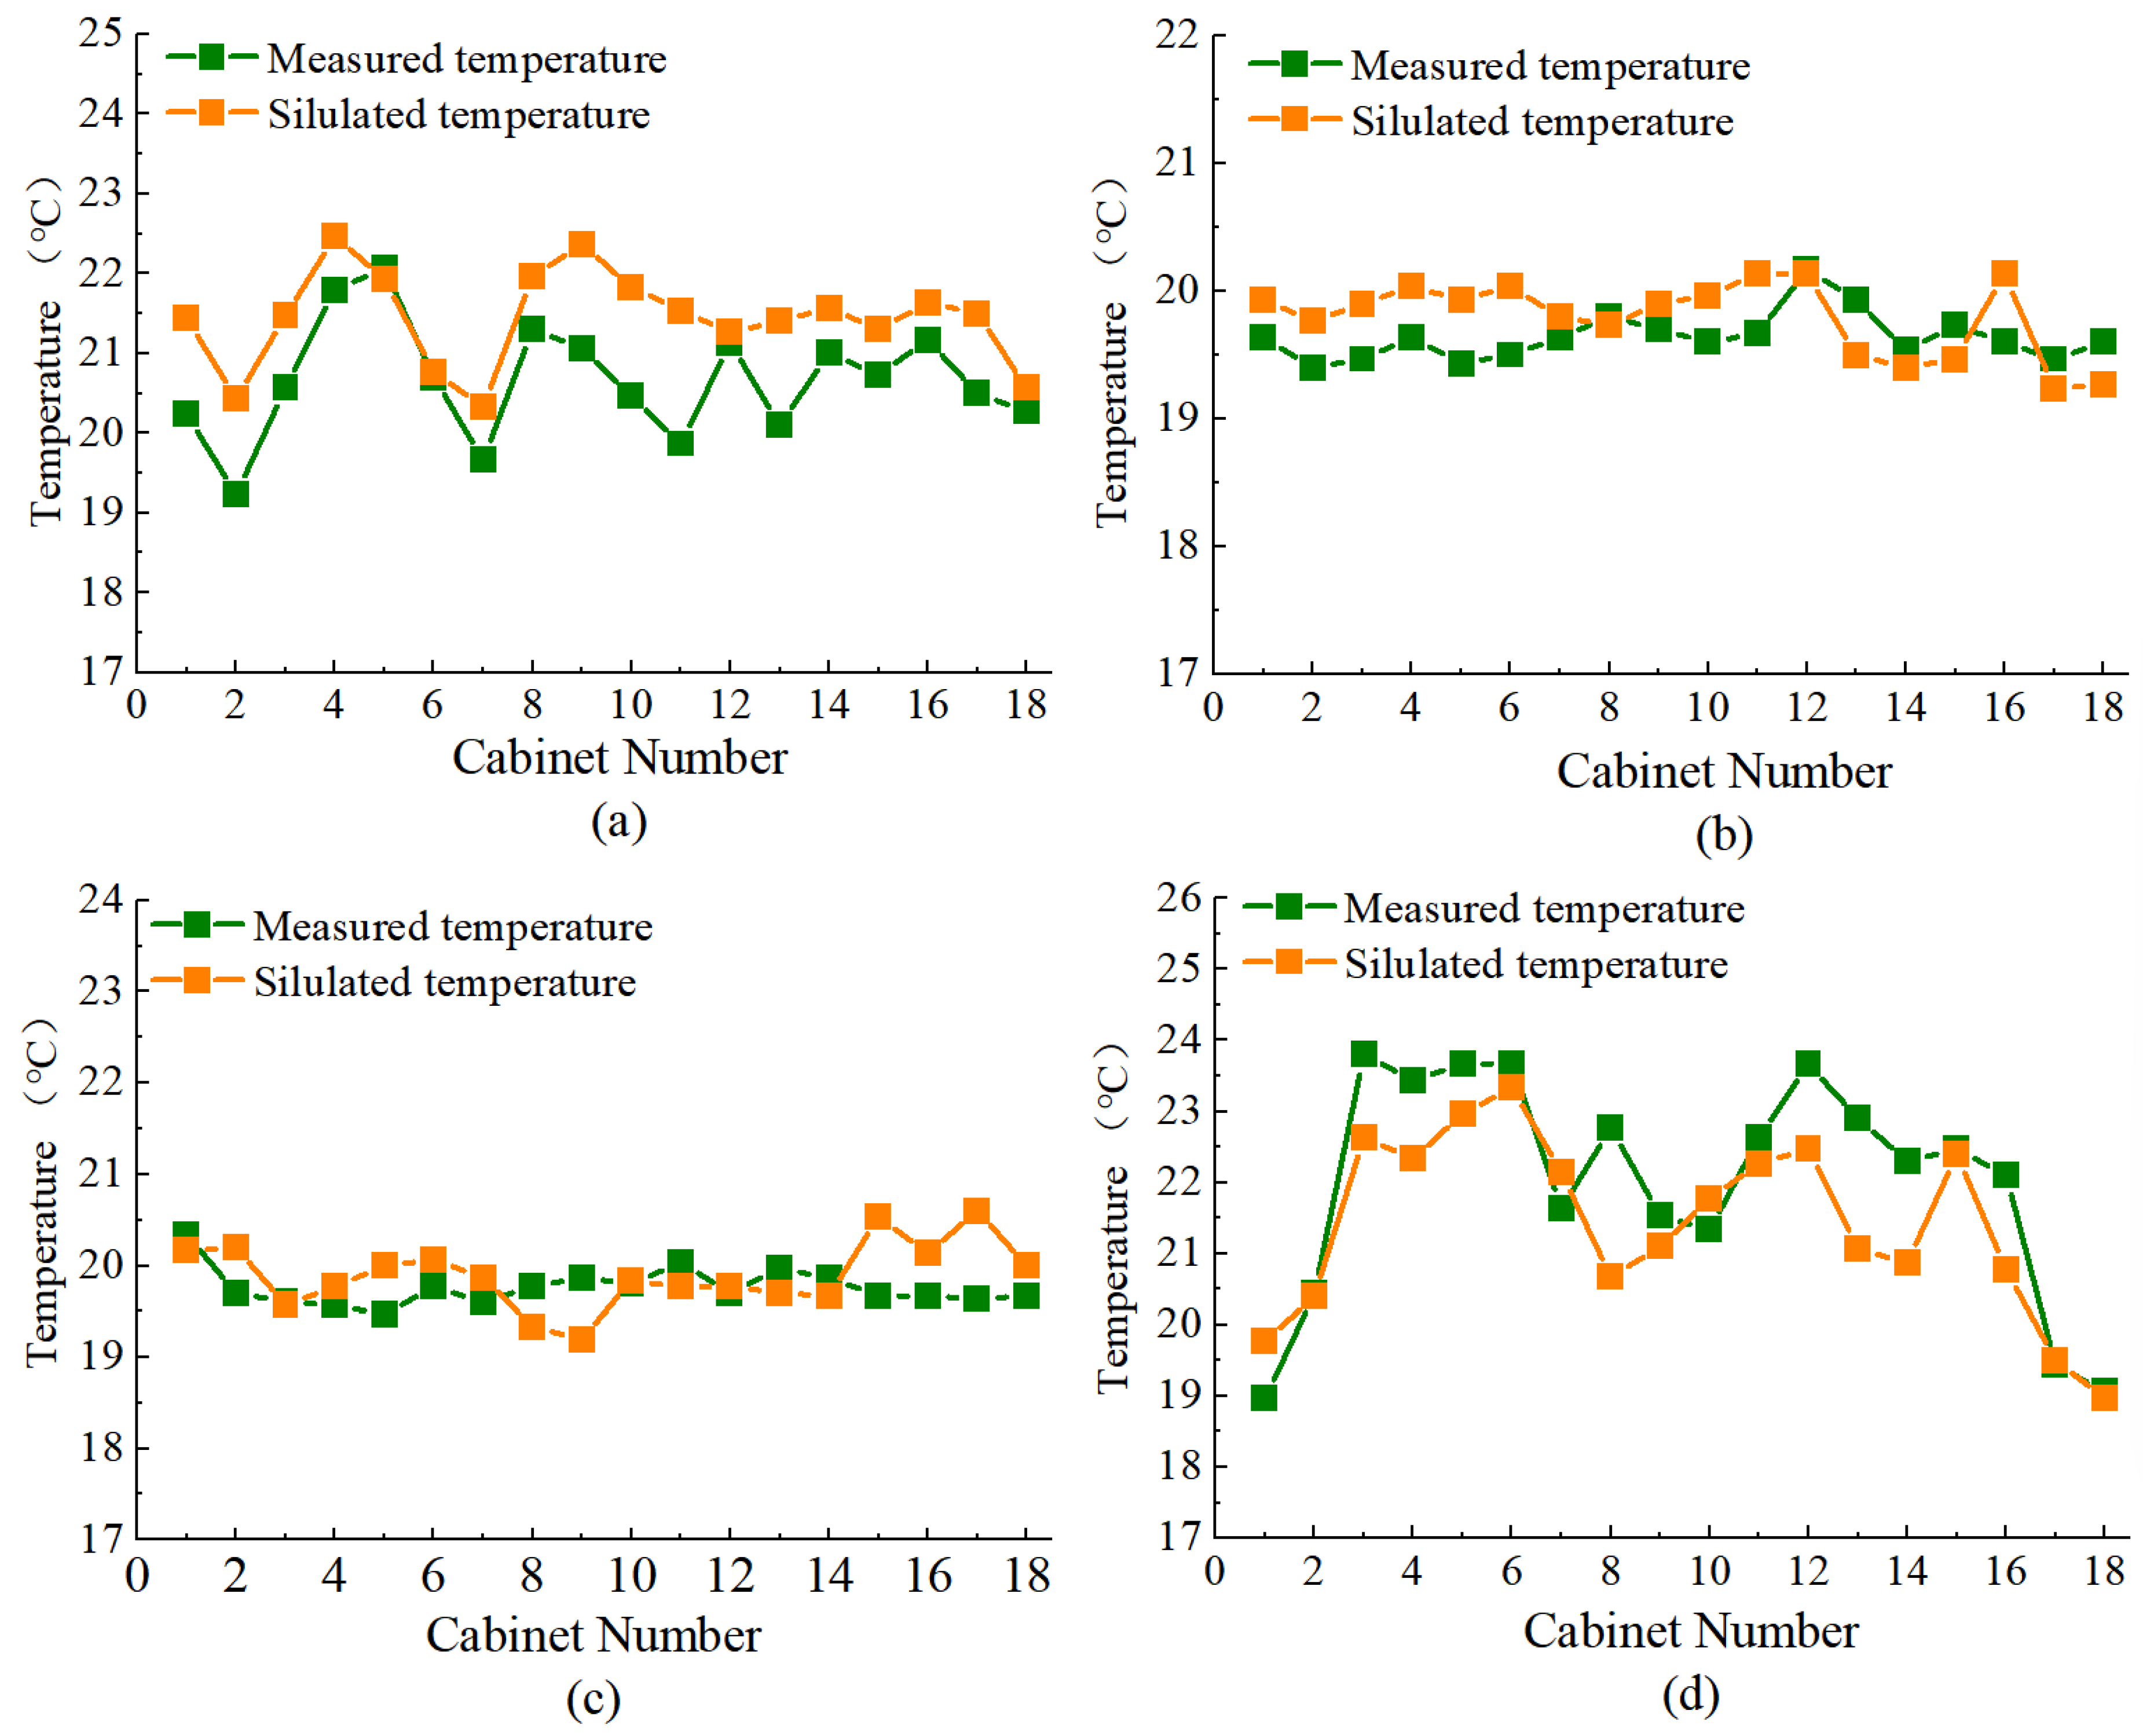
The airflow organization of the data center was simulated, and the corresponding temperatures at the three heights of 0.2 m, 1.1 m, and 2.0 m are shown in Figure 5. To more intuitively demonstrate the accuracy of the simulation results, the simulated results at the three heights were compared with the average of the measured temperatures for rack inlets/outlets in rows A and B, as shown in Figure 6. The comparison shows that the measured and simulated average curves on the cold-aisle side fit well, with an overall temperature fluctuation of less than 1.0 °C; the temperature fluctuation on the hot-aisle side is relatively larger, with an overall deviation within ±2.5 °C. Overall, the variation trends of the measured and simulated average curves in the cold and hot aisles are completely consistent, both showing corresponding temperature fluctuations with the variation in rack heat dissipation, which fully demonstrates the model’s ability to effectively reproduce the overall temperature distribution at rack inlets and outlets.
Figure 5.
Simulated temperature distributions of racks: (a) hot-aisle side of row A; (b) cold-aisle side of row A; (c) cold-aisle side of row B; (d) hot-aisle side of row B.
Figure 6.
Comparison between simulated and measured temperatures: (a) hot-aisle side of row A; (b) cold-aisle side of row A; (c) cold-aisle side of row B; (d) hot-aisle side of row B.
3.2. Perforated Floor Tile Outlet Validation
As the cold air supply outlets of the equipment room, the outlet temperature and air velocity of the perforated air-supply floor tiles are key indicators affecting rack cooling. In this experiment, the outlet temperature and velocity of the perforated tiles on the cold- and hot-aisle sides of rack rows A and B were comprehensively measured and compared with the simulation results one by one. The detailed validation results are as follows.
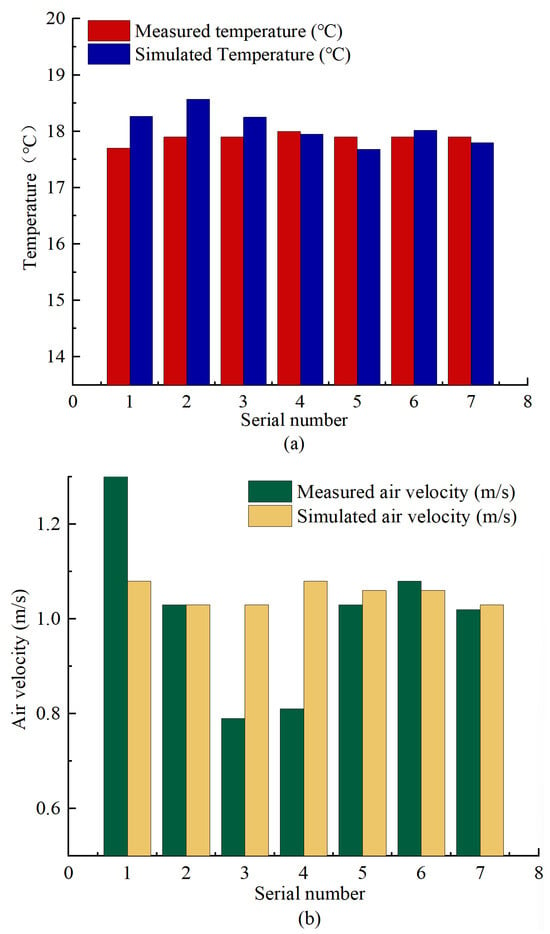
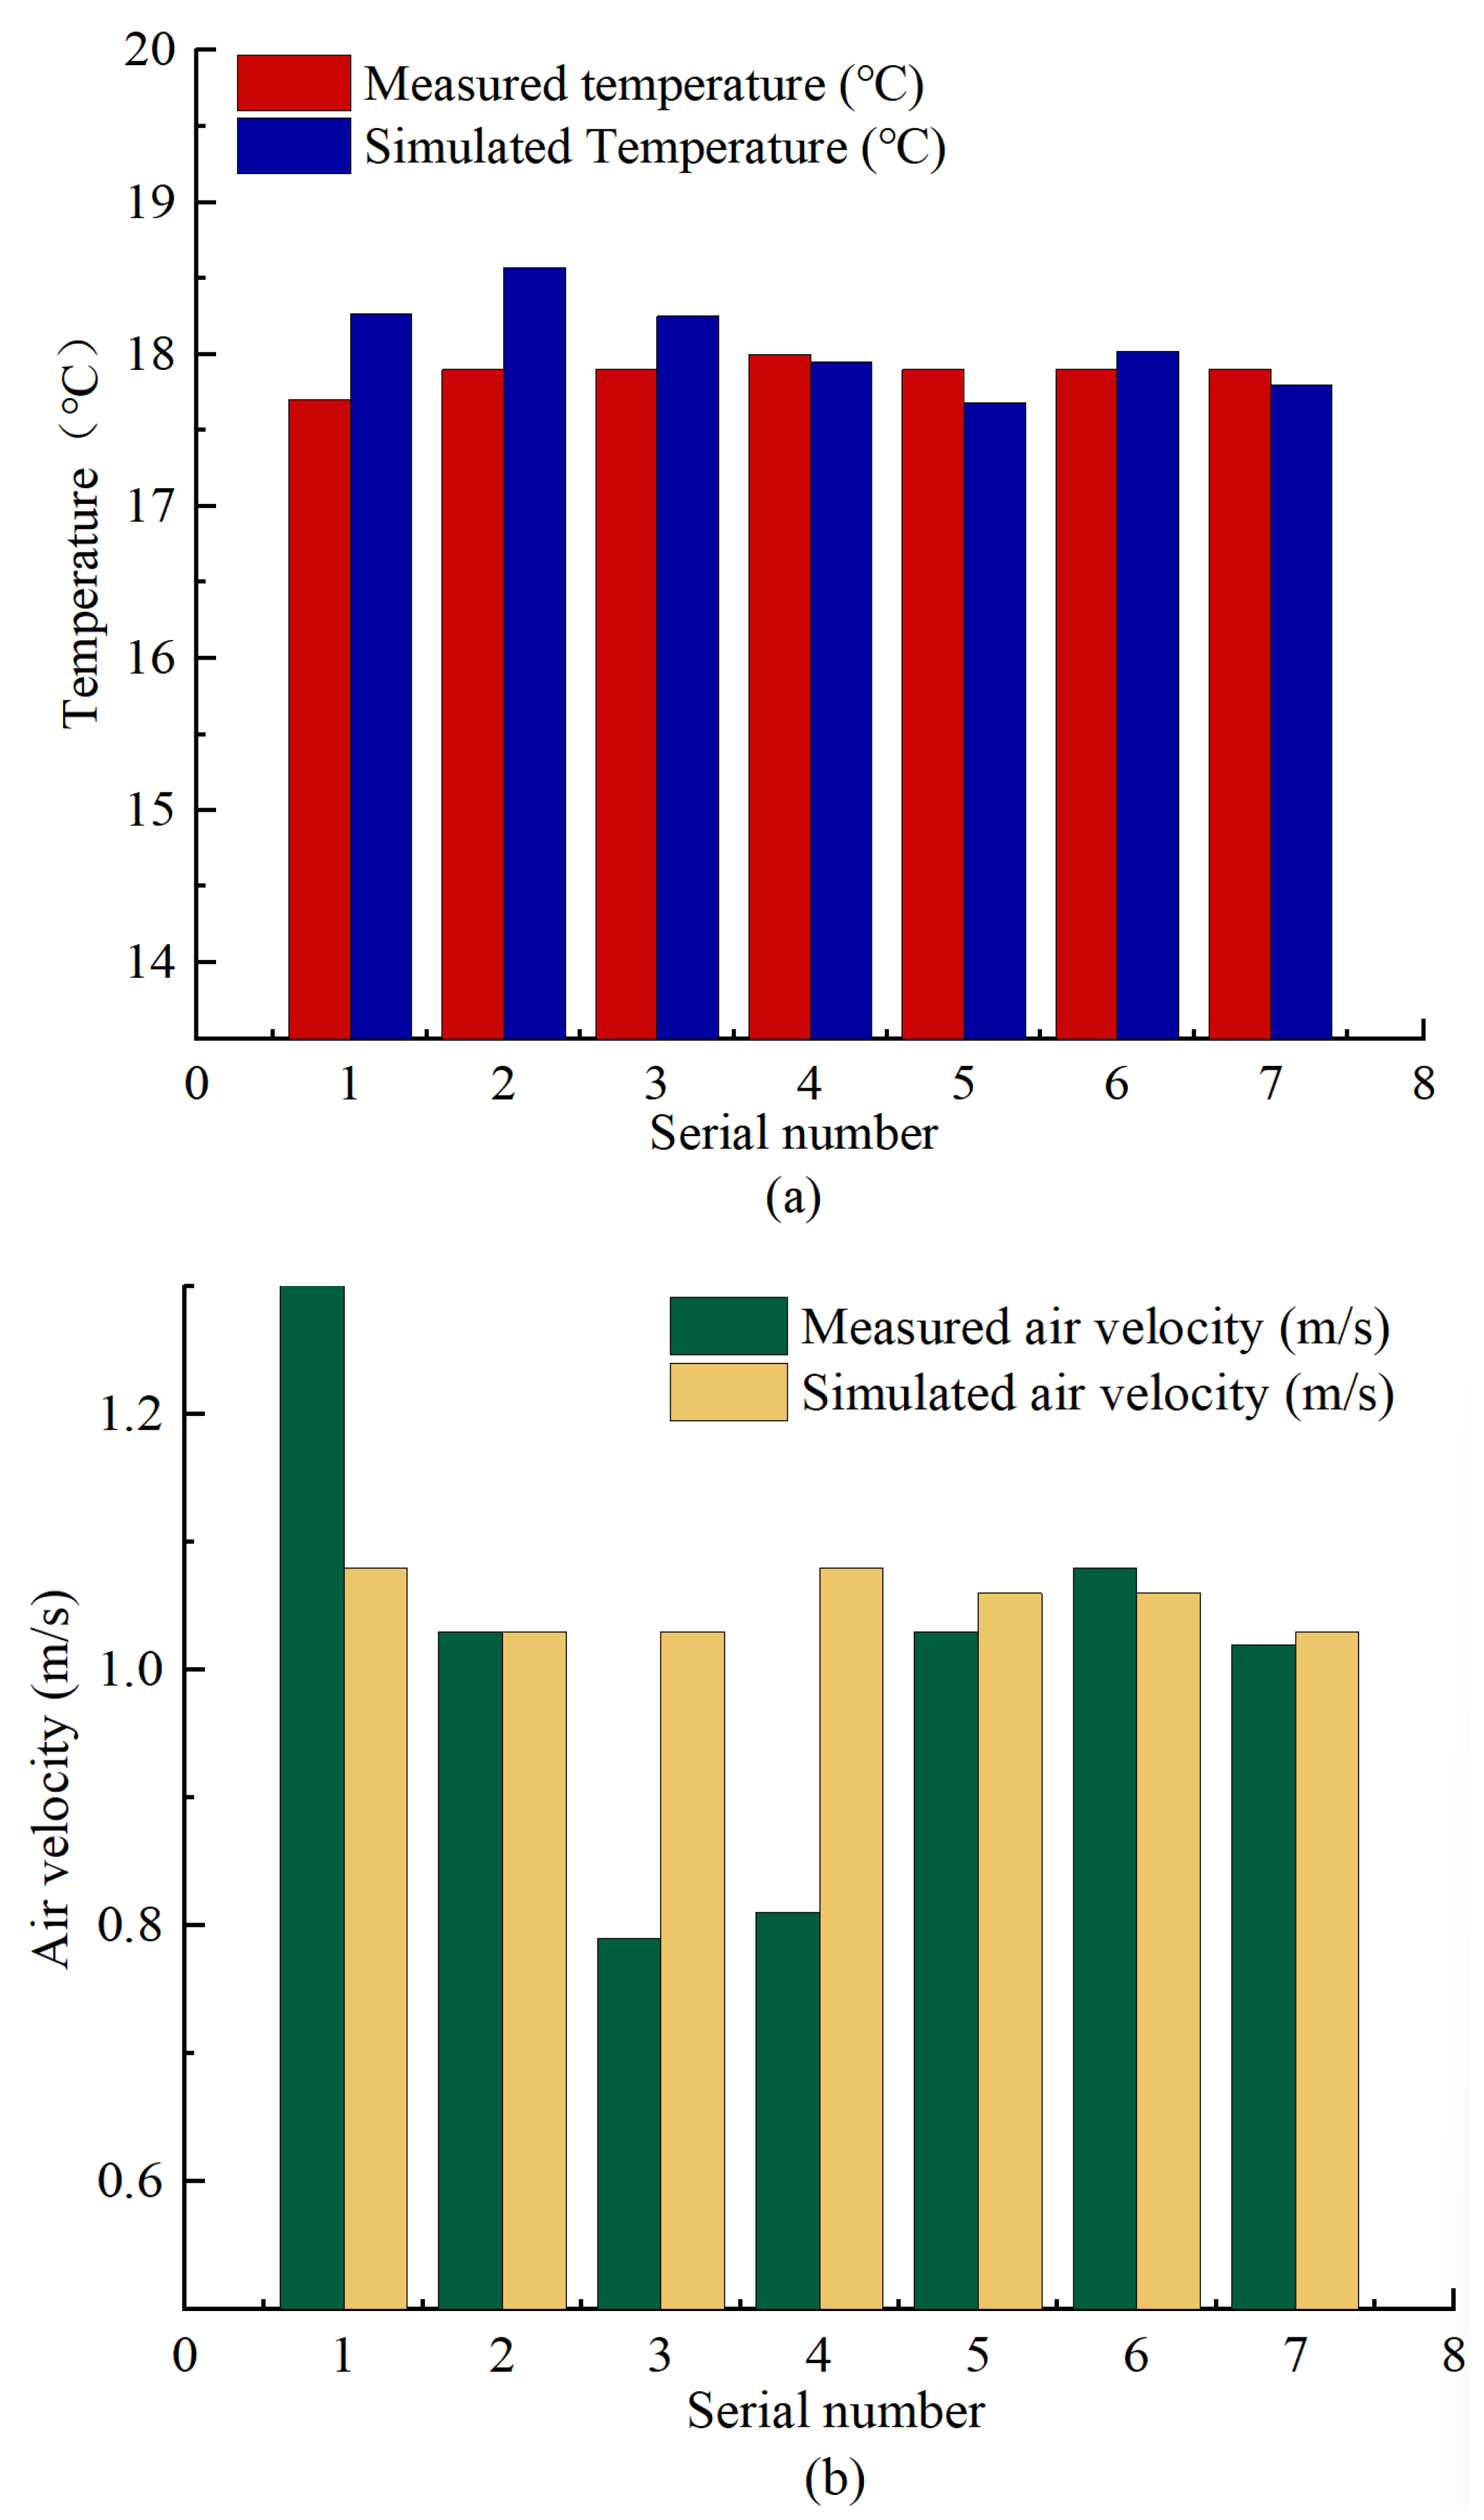
Figure 7 shows the comparison between the measured and simulated outlet temperature and air velocity on the hot-aisle side of rack row A. This zone contains 7 measurement points. The measured temperature ranges from 17.70 °C to 18.00 °C, and the simulated value ranges from 17.68 °C to 18.57 °C; the measured air velocity ranges from 0.79 m/s to 1.35 m/s, and the simulated value ranges from 1.03 m/s to 1.08 m/s. Point 2 is the point of maximum temperature deviation, with a measured value of 17.90 °C and a simulated value of 18.57 °C, a deviation of 0.67 °C. The points with relatively large velocity deviations are points 1 and 3–4: at point 1, the measured value is 1.35 m/s and the simulated value is 1.08 m/s, a deviation of 0.27 m/s; at points 3–4, the measured values are 0.79–0.81 m/s, with deviations of 0.24–0.27 m/s and a relative deviation of about 30%. The causes of the deviations are as follows: point 2 is close to a floor tile joint, where local air leakage exists in the actual air supply, resulting in a lower measured temperature, whereas the simulation uses an overall porosity of 50% without considering the local leakage effect of the joint; point 1 is close to the main air supply path of the air conditioner, and the measured velocity is higher due to the direct impact of the jet; pipelines below points 3–4 obstruct the actual airflow and reduce the measured velocity, whereas the shielding effect of the pipelines under the floor was simplified in the model, resulting in slightly higher simulated velocities.
Figure 7.
Comparison of experimental and simulated values of temperature and air velocity on the hot aisle side of the rack row A: (a) Temperature; (b) Air velocity.
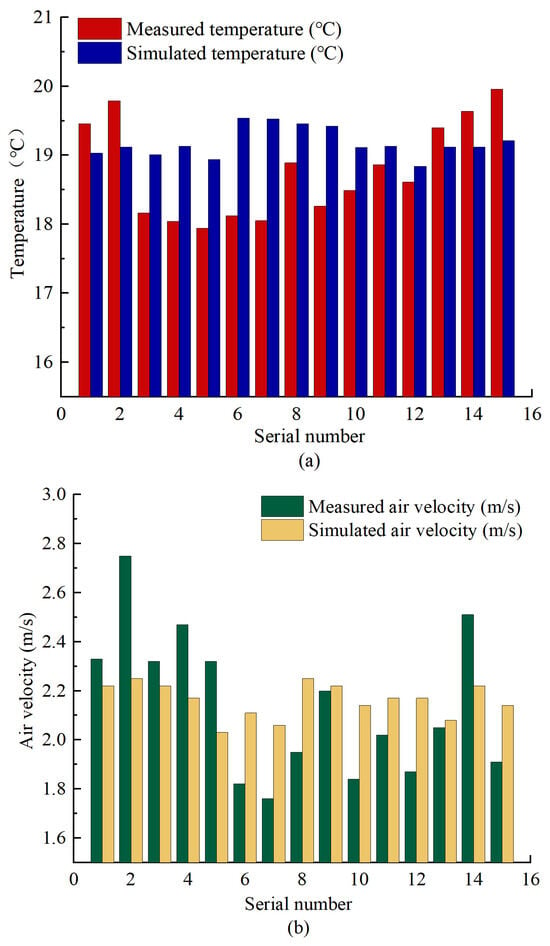
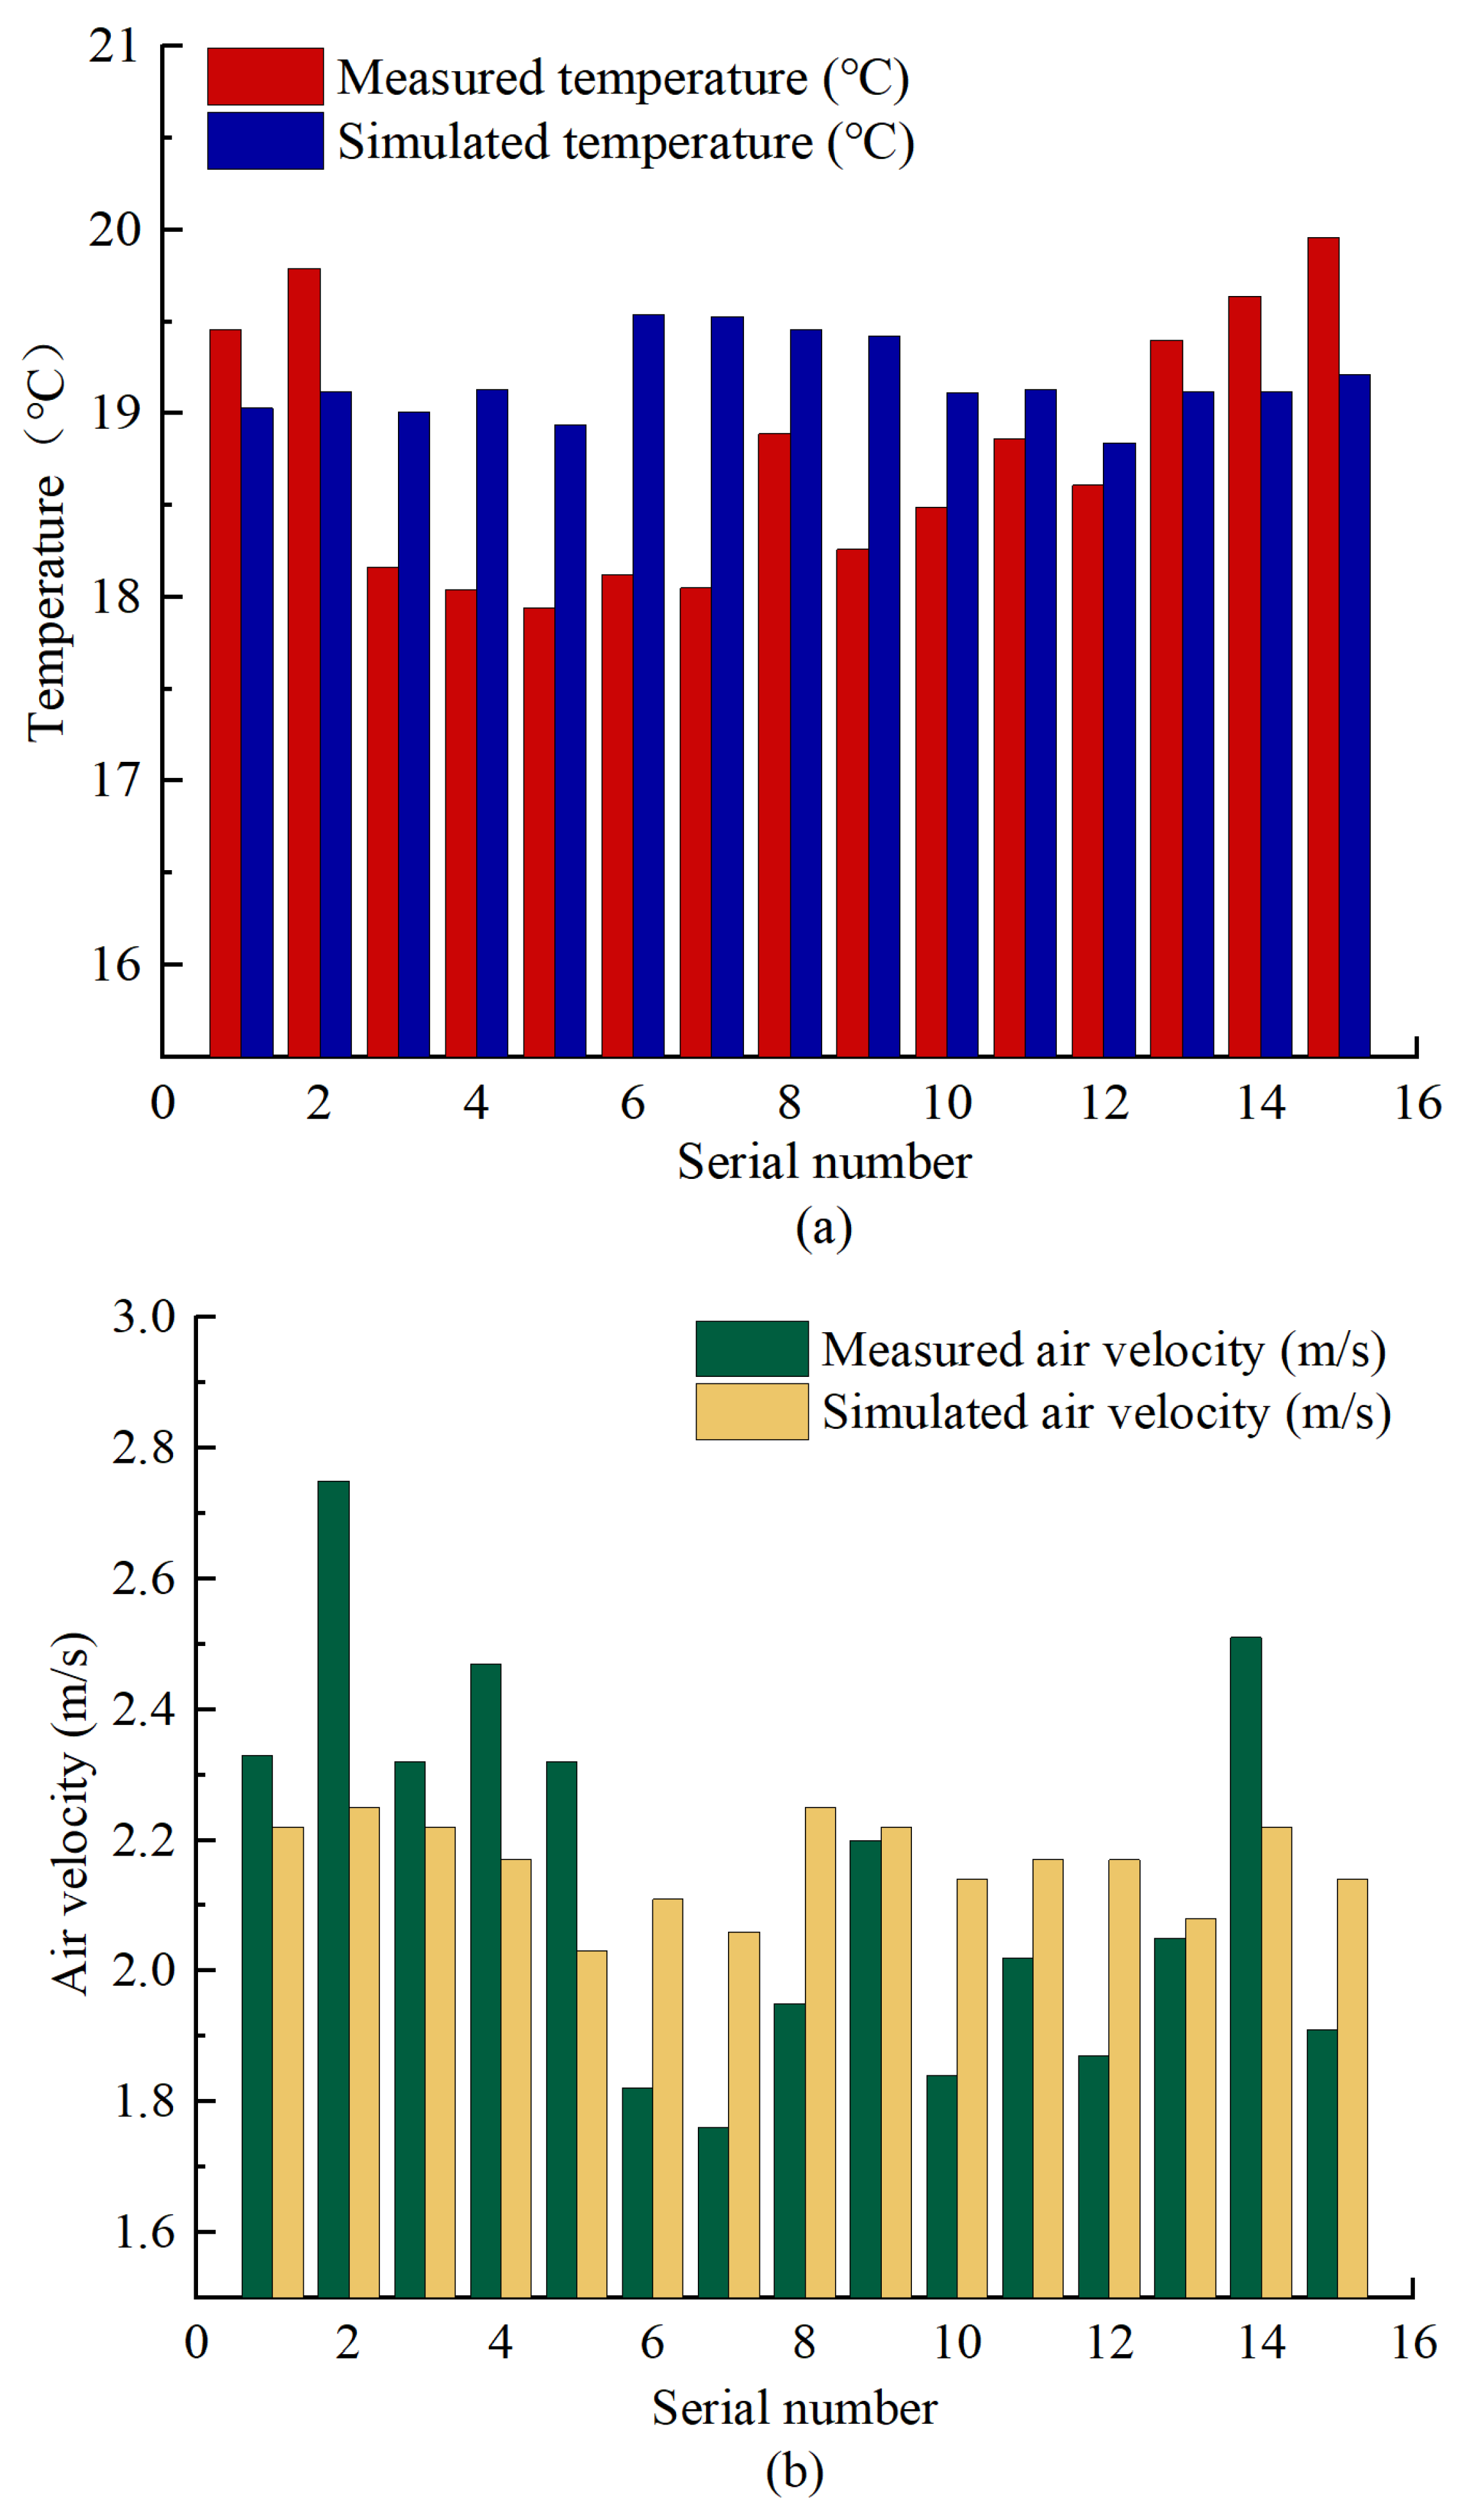
Figure 8 shows the comparison between the measured and simulated outlet temperature and air velocity on the cold-aisle side of rack row A. This zone contains 15 measurement points. The measured temperature ranges from 17.94 °C to 19.96 °C, and the simulated value ranges from 18.84 °C to 19.54 °C; the measured air velocity ranges from 1.76 m/s to 2.75 m/s, and the simulated value ranges from 2.03 m/s to 2.25 m/s. Point 15 is the point of maximum temperature deviation, with a measured value of 19.96 °C and a simulated value of 19.21 °C, a deviation of 0.75 °C; point 2 is the point of maximum velocity deviation, with a measured value of 2.75 m/s and a simulated value of 2.25 m/s, a deviation of 0.5 m/s and a relative deviation of about 18%. The causes of the deviations are as follows: point 15 is close to the confluence zone of hot-aisle and cold-aisle airflows, where local heat backflow caused by the mixing of cold and hot air exists, resulting in a higher measured temperature, and the simulation accuracy of the local turbulent mixing effect is limited; point 2 is a supply point directly below the air conditioner, where a jet effect exists in the actual air supply and the instantaneous measured velocity is higher, whereas the simulated value is a time-averaged velocity, which deviates from the measured instantaneous value.
Figure 8.
Comparison of experimental and simulated values of temperature and air velocity on the cold aisle side of the rack row A: (a) Temperature; (b) Air velocity.
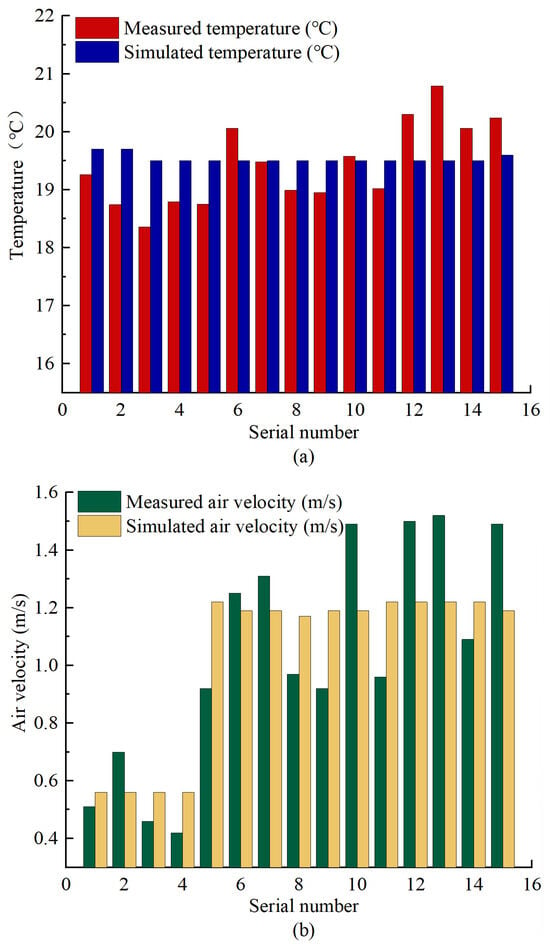
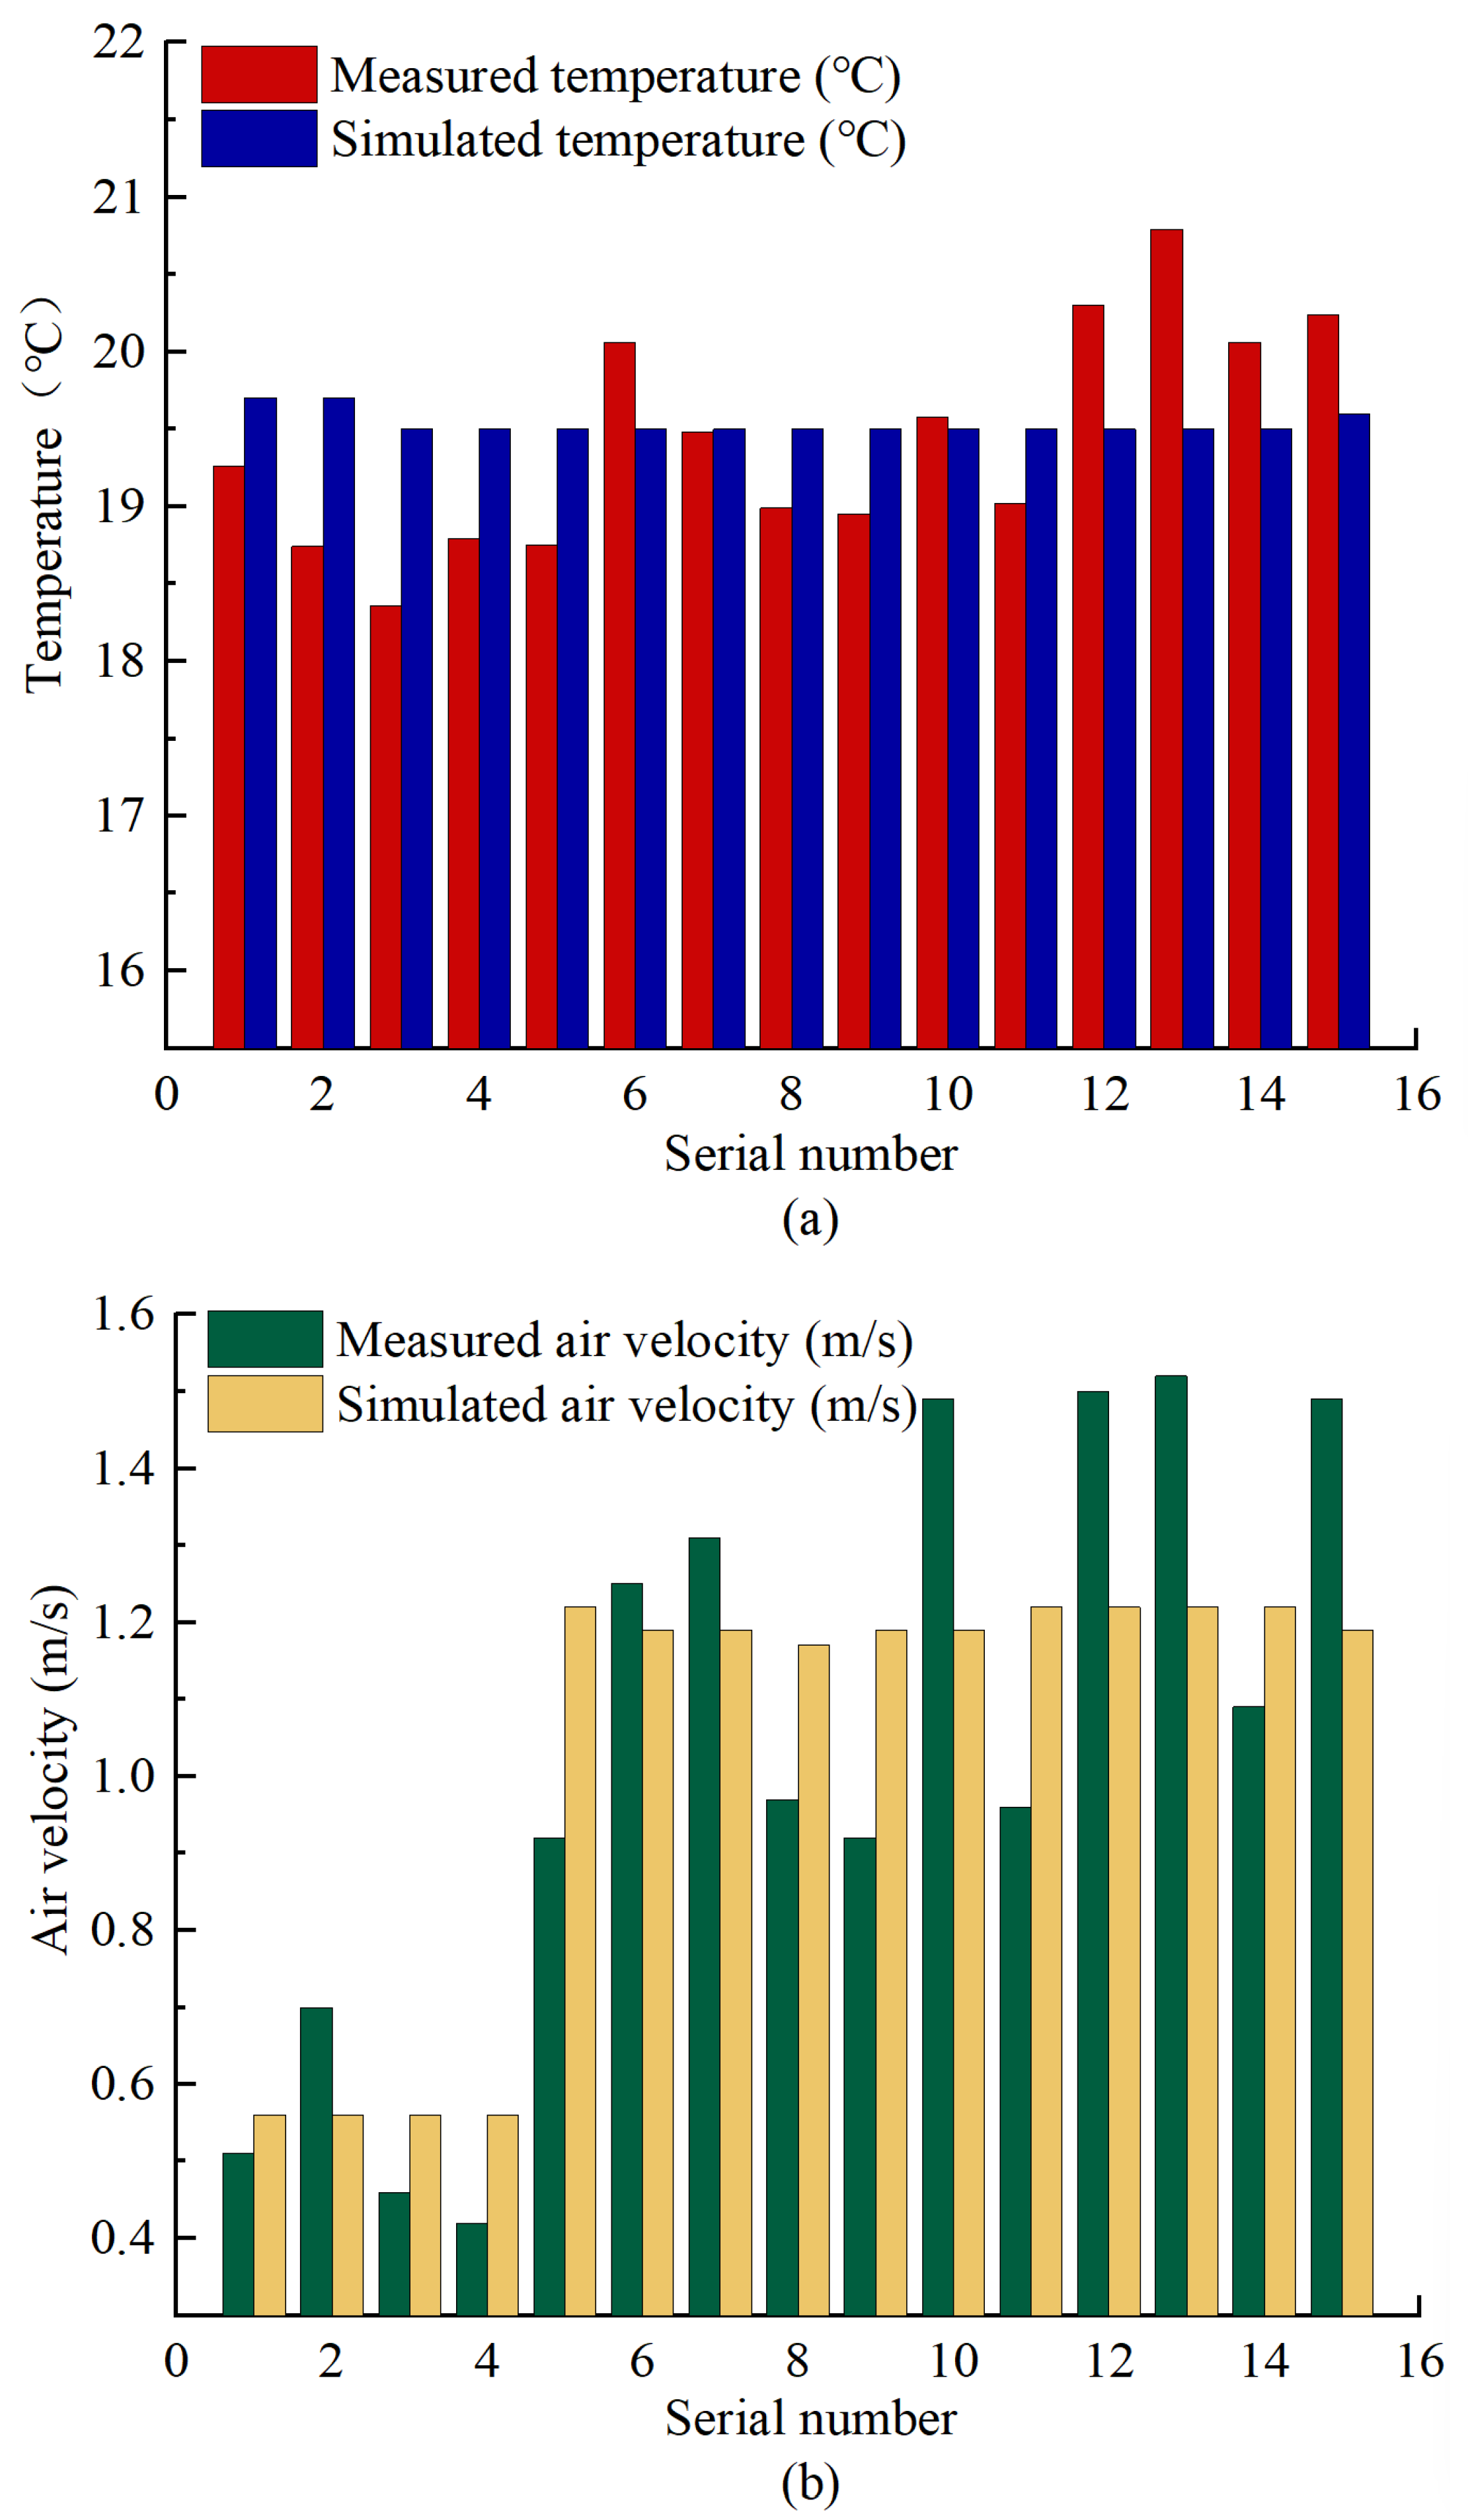
Figure 9 shows the comparison between the measured and simulated outlet temperature and air velocity on the cold-aisle side of rack row B. This zone contains 15 measurement points. The measured temperature ranges from 18.36 °C to 20.79 °C, and the simulated value ranges from 19.50 °C to 19.60 °C; the measured air velocity ranges from 0.42 m/s to 1.52 m/s, and the simulated value ranges from 0.56 m/s to 1.22 m/s. Point 13 is the point of maximum temperature deviation, with a measured value of 20.79 °C and a simulated value of 19.50 °C, a deviation of 1.29 °C; point 15 is the point of maximum velocity deviation, with a measured value of 1.49 m/s and a simulated value of 1.19 m/s, a deviation of 0.3 m/s and a relative deviation of about 20%. The causes of the deviations are as follows: point 13 corresponds to a high-heat-dissipation rack in row B, and the thermal radiation effect of the actual rack heat dissipation was not fully considered in the simulation, resulting in a higher measured ambient temperature; point 15 is located at the end of the cold aisle of row B, where the entrainment of exhaust air from adjacent racks raises the measured instantaneous velocity, whereas the simulated value is a time-averaged value that cannot reflect this local disturbance.
Figure 9.
Comparison of experimental and simulated values of temperature and air velocity on the cold aisle side of the rack row B: (a) Temperature; (b) Air velocity.
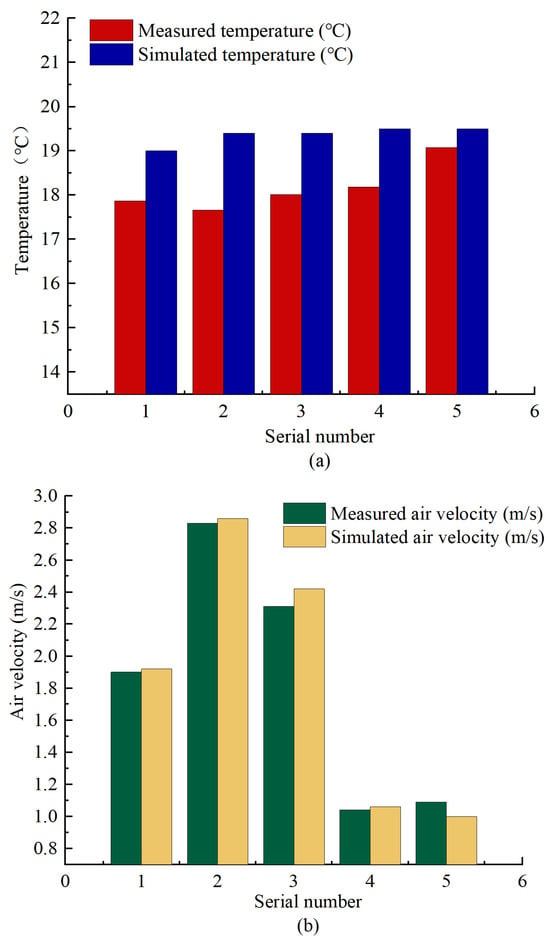
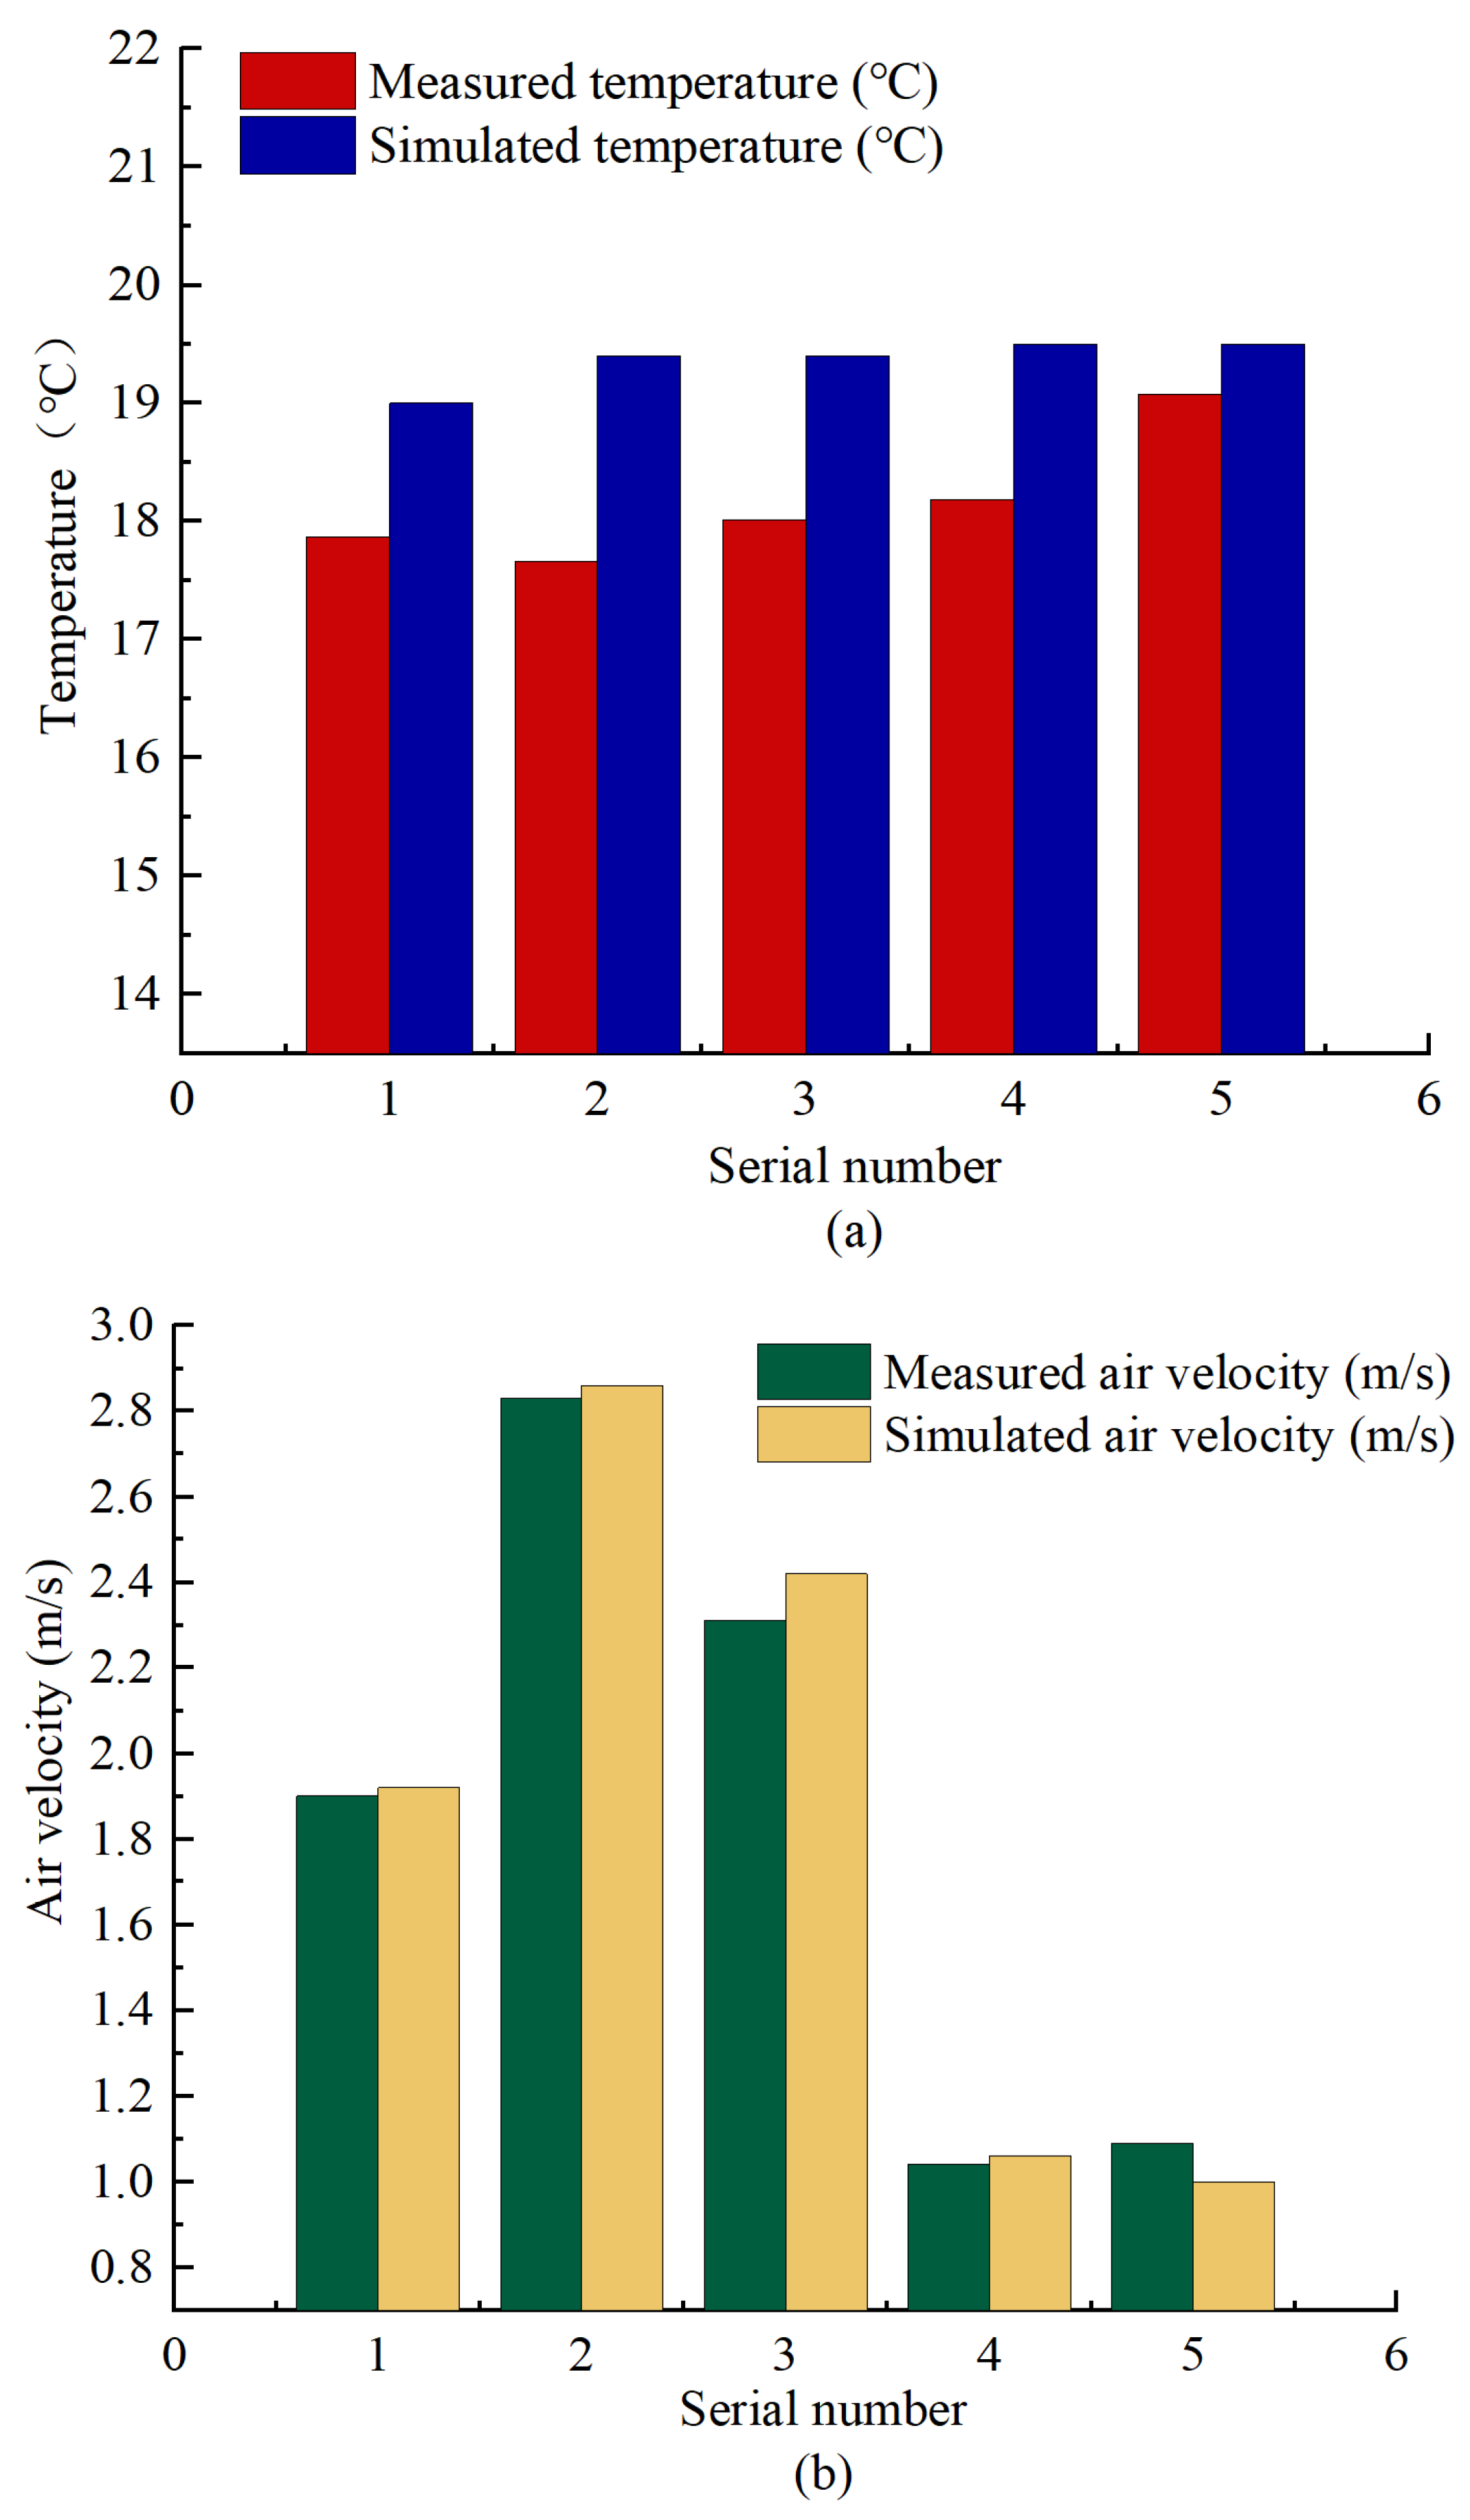
Figure 10 shows the comparison between the measured and simulated outlet temperature and air velocity on the hot-aisle side of rack row B. Point 2 is the point of maximum deviation for both temperature and velocity: the measured temperature is 17.66 °C and the simulated temperature is 19.40 °C, a deviation of 1.74 °C, which is the largest temperature deviation among all perforated floor tile zones; the measured velocity is 2.44 m/s and the simulated velocity is 2.86 m/s, a deviation of 0.42 m/s. The temperature deviations of the remaining points are all within 0.5 °C. The cause of the deviation is that point 2 is a perforated floor tile located in a corner of the equipment room, which is actually affected locally by the adiabatic effect of the room walls; the heat exchange between the cold air and the walls is weak, so the measured temperature is lower, whereas the adiabatic boundary condition of the walls was set in a global manner in the simulation, without considering the local thermal environment differences in the corner zone. The corner location also suffers from air leakage and the entrainment of cold and hot airflows, resulting in a lower measured velocity.
Figure 10.
Comparison of experimental and simulated values of temperature and air velocity on the hot aisle side of the rack row B: (a) Temperature; (b) Air velocity.
3.3. Cold/Hot Aisle Temperature Validation
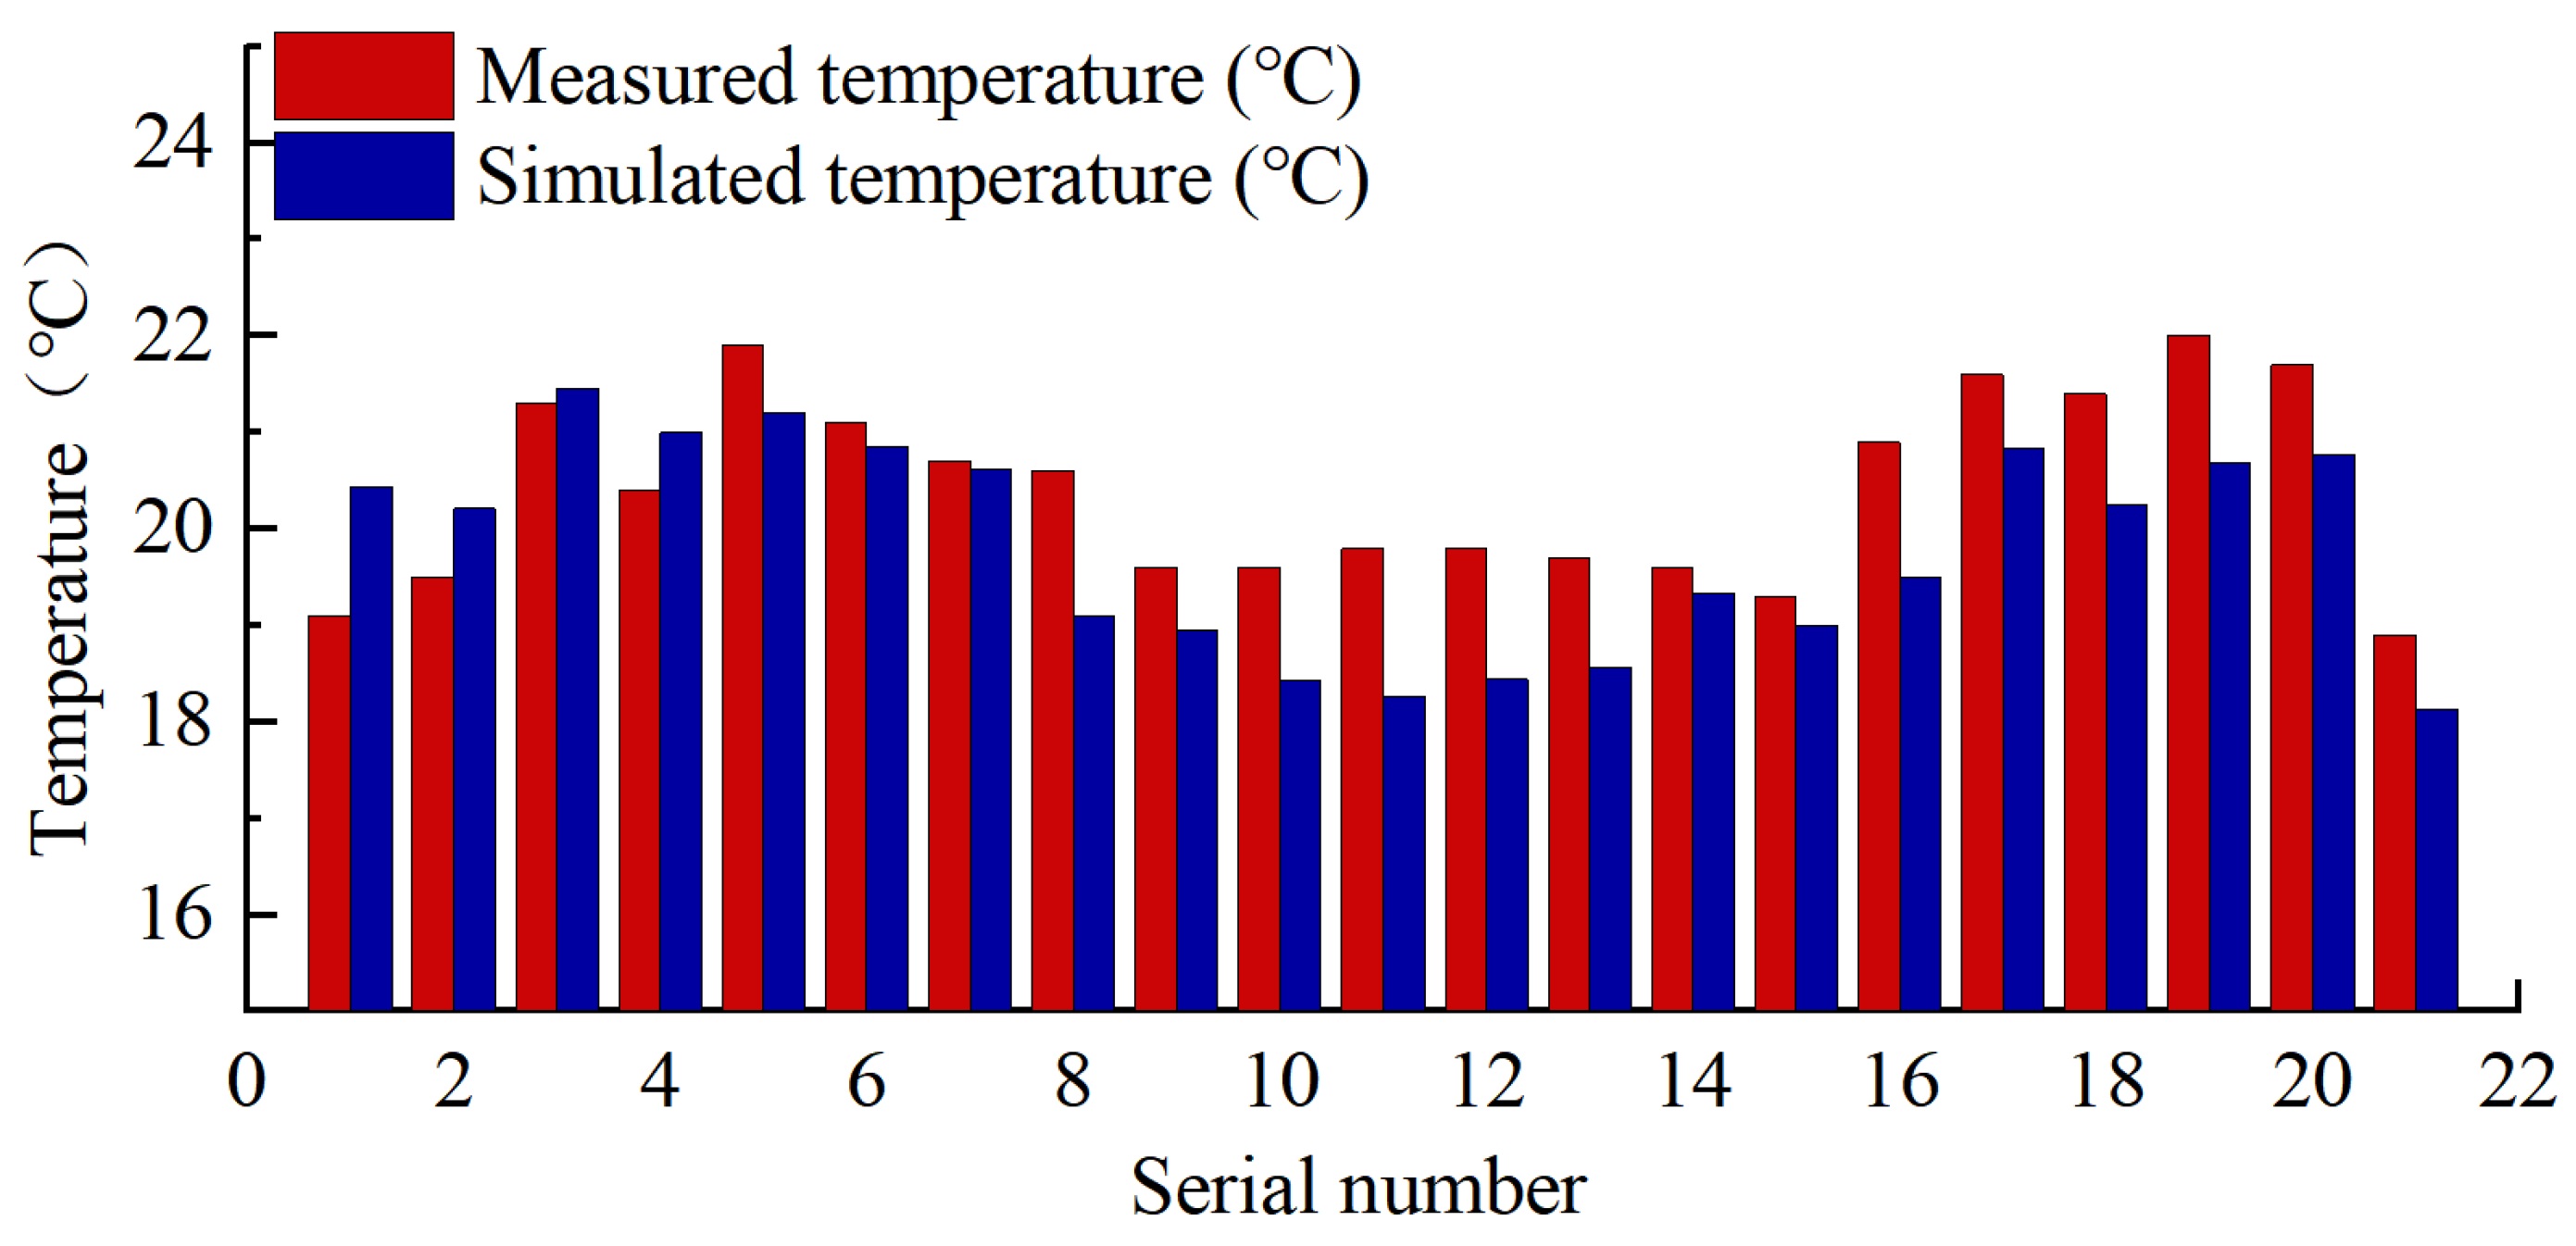
The temperatures at the 21 measurement points shown in Figure 3 were measured at a height of 1 m, and the results are shown in Figure 11. The measured temperature distribution ranges from 18.90 °C to 22.00 °C, and the simulated temperature distribution ranges from 18.13 °C to 21.46 °C. The difference between the two value ranges is small, and the simulation can basically reproduce the overall distribution trend of the cold/hot aisle temperatures.
Figure 11.
Comparison of experimental and simulated temperatures at the cold and hot aisle measurement points.
By zone, points 8–14 are located in the cold aisle, among which points 8–10 show relatively large differences between measured and simulated values, up to 1.5 °C. This is mainly because this zone is not completely enclosed and is affected by convection from the hot-aisle airflow, resulting in higher actual measured temperatures. Correspondingly, points 1–2 and 15–16, located in the hot aisle, show relatively large temperature deviations of up to 1.4 °C; affected by air convection from the adjacent cold aisle, the measured temperatures are lower than the simulated values.
3.4. Conclusions on Model Reliability
To further quantitatively evaluate the model accuracy, three statistical indicators were calculated for each validation zone: the mean absolute error (MAE), the mean bias error (MBE), and the root mean square error (RMSE). MAE reflects the average magnitude of the deviation between simulated and measured values, MBE reflects the tendency of systematic overestimation or underestimation, and RMSE assigns higher weight to larger deviations. The rack inlet/outlet temperatures were included in the statistics as the average of the three heights (0.2 m, 1.1 m, and 2.0 m) for each rack; the air-supply floor tile outlets were counted over 42 outlets; and the cold/hot aisles were counted over 21 measurement points. The results are listed in Table 4.
Table 4.
Statistical error indicators of simulation versus measurement for each validation zone.
As can be seen from Table 4:
- (1)
- The temperature MAE of all validation objects does not exceed 0.9 °C. In terms of rack inlet/outlet, the temperature deviation on the inlet side is the smallest, which is consistent with the aforementioned conclusion that the measured and simulated curves on the cold-aisle side fit well; the outlet side is affected by local hotspots of individual high-heat-dissipation racks in row B and shows relatively large deviations, but the larger deviations occur only at individual points and do not affect the overall deviation level.
- (2)
- The absolute values of the regional MBE do not exceed 0.65, indicating that the model has no obvious systematic overestimation or underestimation. The MBE on the rack outlet side is −0.65 °C, indicating that the model slightly underestimates the hot-aisle temperature, which is mainly related to the treatment of racks as uniformly distributed volumetric heat sources in the model without accounting for thermal radiation and local heat backflow. The velocity MBE is +0.04 m/s, with simulated values slightly higher than measured values overall, mainly because the pipeline shielding, pore blockage, and air leakage under the floor were simplified in the model, so the actual local resistance losses are higher than the model settings.
- (3)
- Air velocity is the indicator with the lowest accuracy among all validation objects: the velocity MAE is 0.20 m/s and the RMSE is 0.24 m/s. The reason is that the airflow in the non-standard equipment room fluctuates strongly, and the hot-wire anemometer measures instantaneous values with large fluctuations, whereas the simulation results are time-averaged values; the two inherently deviate in zones with disturbed airflow. The larger velocity deviations are concentrated at a few disturbed points, such as point 2 in the cold aisle of row A (the jet zone directly below the air conditioner, deviation of 0.50 m/s and relative deviation of about 18%), point 2 in the hot aisle of row B (the corner leakage and entrainment zone, deviation of 0.42 m/s and relative deviation of about 17%), and points 3–4 in the hot aisle of row A (the low-velocity zone shielded by pipelines, relative deviation of about 30%). The velocity deviations of most other points are within ±0.30 m/s, and the overall distribution trend of the velocity field is basically consistent with the measurement.
- (4)
- At the rack outlet side, the deviations of individual high-heat-dissipation rack points are relatively large, up to about 2.6 °C. This is because these racks dissipate a large amount of heat, and the local hotspots are significantly affected by thermal radiation and turbulent mixing, so the model’s ability to capture extreme local high temperatures is limited. However, the number of such points is very small and does not affect the distribution pattern of the overall temperature field.
In summary, the CFD numerical model established in this study can reflect the core characteristics of the airflow organization and thermal environment in the equipment room: the temperature MAE does not exceed 0.9 °C, the velocity MAE does not exceed 0.20 m/s, and there is no systematic deviation; the distribution trends of the simulation results and measured data are basically consistent in all core zones. Local point errors are mostly caused by objective factors such as experimental environment disturbances, measurement instrument accuracy, and modeling simplification assumptions. The model can be used for simulation research on airflow organization optimization of the equipment room.
4. Optimization of the Underfloor Plenum
In view of the current situation of this non-standard data center—blurred boundaries between cold and hot aisles, scattered air supply outlets, and significant differences in outlet velocity among the outlets—this section uses the 6SigmaDC simulation platform to separately study the airflow organization inside the underfloor plenum. By installing flexible baffles and adjusting the openings of variable-opening floor tiles, a suitable plenum arrangement scheme is screened to make the velocity of each air supply outlet more uniform.
4.1. Scenario Design
Based on the field observation that the air supply volume is large near the air conditioner and small at the far end, two retrofit measures were determined: installing perforated baffles to reconstruct the pressure field of the plenum, and adjusting the openings of variable-opening floor tiles to compensate for resistance differences. A partial factorial design was adopted to set up eight representative scenarios, as listed in Table 5. The scenarios were generated as follows: the two retrofit measures were taken as two factors, the baffle type had four levels (“no baffle/transverse perforated baffle/solid baffle/perforated + solid composite baffle”), and the floor tile strategy had two levels (“uniform opening/near-end flow restriction + far-end flow enhancement”), and eight representative scenarios were retained to cover the complete retrofit path of “no retrofit—single measure—dual-measure synergy”.
Table 5.
Simulation scenario design parameters.
The perforation ratio and arrangement position of the baffle are the two core parameters affecting the flow equalization effect, and their values directly determine the balance between energy dissipation intensity and system resistance. To determine the optimal parameter combination, pre-simulation screening was carried out for the perforation ratio and baffle position, respectively, with the S0 no-baffle baseline as the reference before the formal scenario design. The fluid mechanics mechanism of the pre-simulation parameter screening is as follows: after the air-conditioner outflow enters the plenum, it exhibits jet characteristics, and the velocity gradually decays along the path; the entrainment effect of the jet reduces the static pressure in the near-end zone and makes the static pressure insufficient in the far-end zone, which is the root cause of overflow at near-end outlets and insufficient air at far-end outlets. The perforated baffle acts as an additional local resistance in the flow path: when the airflow passes through the small holes, the velocity increases and the pressure decreases; the smaller the perforation ratio, the greater the baffle resistance and the more sufficient the energy dissipation of the high-velocity airflow, but the resistance that the air-conditioning fan needs to overcome also increases accordingly. The baffle position determines the timing of its intervention in the jet decay process—if arranged too close, the baffle directly bears the impact of the high-velocity jet and a disturbed flow field easily forms behind it; if arranged too far, the jet has already decayed naturally and the baffle can hardly reshape the pressure field. The following pre-simulation results are basically consistent with the above mechanism analysis.
- (1)
- Pre-simulation screening of the perforation ratio. With the baffle position fixed at 0.3 m from the air-conditioner outlet, five schemes with perforation ratios of 30%, 40%, 50%, 60%, and 70% were simulated, respectively, using the air supply uniformity index and the total resistance increment of the plenum as evaluation indicators. The results are listed in Table 6. At a perforation ratio of 30%, the uniformity index reaches the highest value of 0.62, but the resistance increment reaches 18.7%, significantly increasing system power consumption; at 40%, the uniformity index is 0.60 with a resistance increment of 12.3%; at 50%, the uniformity index is 0.58 with a resistance increment of 8.5%, which is the best balance point between energy dissipation effect and resistance increment; at 60%, the uniformity index drops to 0.55, with a resistance increment of only 5.2% but insufficient energy dissipation; at 70%, the uniformity index is only 0.53, close to the no-baffle level. Considering the flow equalization effect, system resistance, and engineering feasibility, 50% was selected as the final perforation ratio.Table 6. Pre-simulation results for different baffle porosities.
- (2)
- Pre-simulation screening of the baffle position. With the perforation ratio fixed at 50%, four schemes with baffle distances of 0 m, 0.3 m, 0.6 m, and 0.9 m from the air-conditioner outlet were simulated, and the results are listed in Table 7. At 0 m from the air conditioner, although the baffle is in the high-velocity jet core zone with strong energy dissipation, the local velocity at the baffle reaches 6.8 m/s, obvious turbulent disturbance forms behind the baffle, the downstream flow field stability is poor, and the uniformity index is 0.55; at 0.3 m, the local velocity at the baffle drops to 4.2 m/s, the airflow transitions smoothly after energy dissipation, and the uniformity index reaches the optimal value of 0.58; at 0.6 m, the jet has partially decayed naturally, the energy dissipation effect of the baffle is weakened, and the uniformity index drops to 0.54; at 0.9 m, the jet has fully decayed naturally, the baffle has almost no energy dissipation effect, and the uniformity index is only 0.52. Therefore, 0.3 m was selected as the final baffle position.Table 7. Pre-simulation results for different baffle positions.
- (3)
- Determination of the solid baffle partitioning scheme. Based on the flow field analysis of the S0 scenario, redundant dead zones that are difficult for the airflow to effectively reach in the plenum (mainly located in the corner at the south end of row B and the triangular zone behind the air conditioner) were identified, and solid baffles were used for physical partitioning to shrink the originally large plenum into an effective volume matching the main airflow path, with a volume reduction ratio of about 18%. After partitioning, the continuity of the main airflow path is preserved to ensure that the airflow after baffle energy dissipation can smoothly reach the far-end air supply outlets. Pre-simulation verification shows that a reasonable partitioning scheme can increase the air volume in the far-end low-flow zones by 15–25%, but excessive partitioning increases system resistance and creates local bypass dead zones; therefore, the partitioning scheme needs to be finely adjusted according to the specific flow field characteristics.
In summary, the baffle design parameters determined through pre-simulation screening are: a transverse perforated baffle with a perforation ratio of 50% arranged at 0.3 m from the air-conditioner outlet, and solid baffles partitioning the redundant dead zones identified by flow field diagnosis. The above parameter selection process provides a quantitative basis for the subsequent formal scenario design and ensures the scientificity and repeatability of the optimization scheme.
4.2. Scenario Analysis
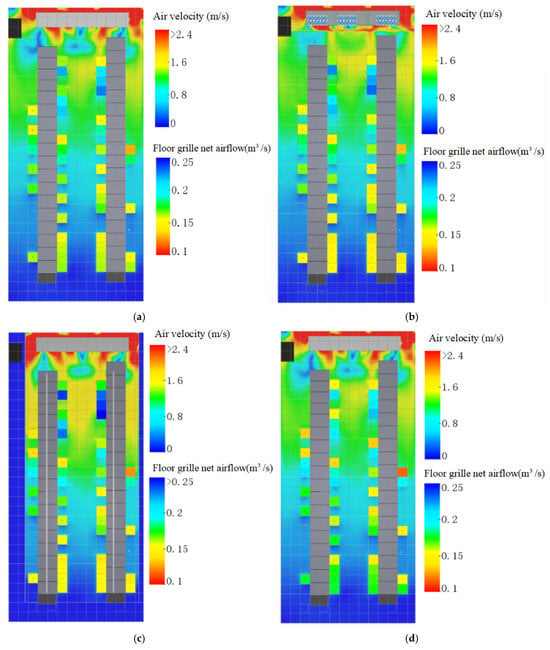
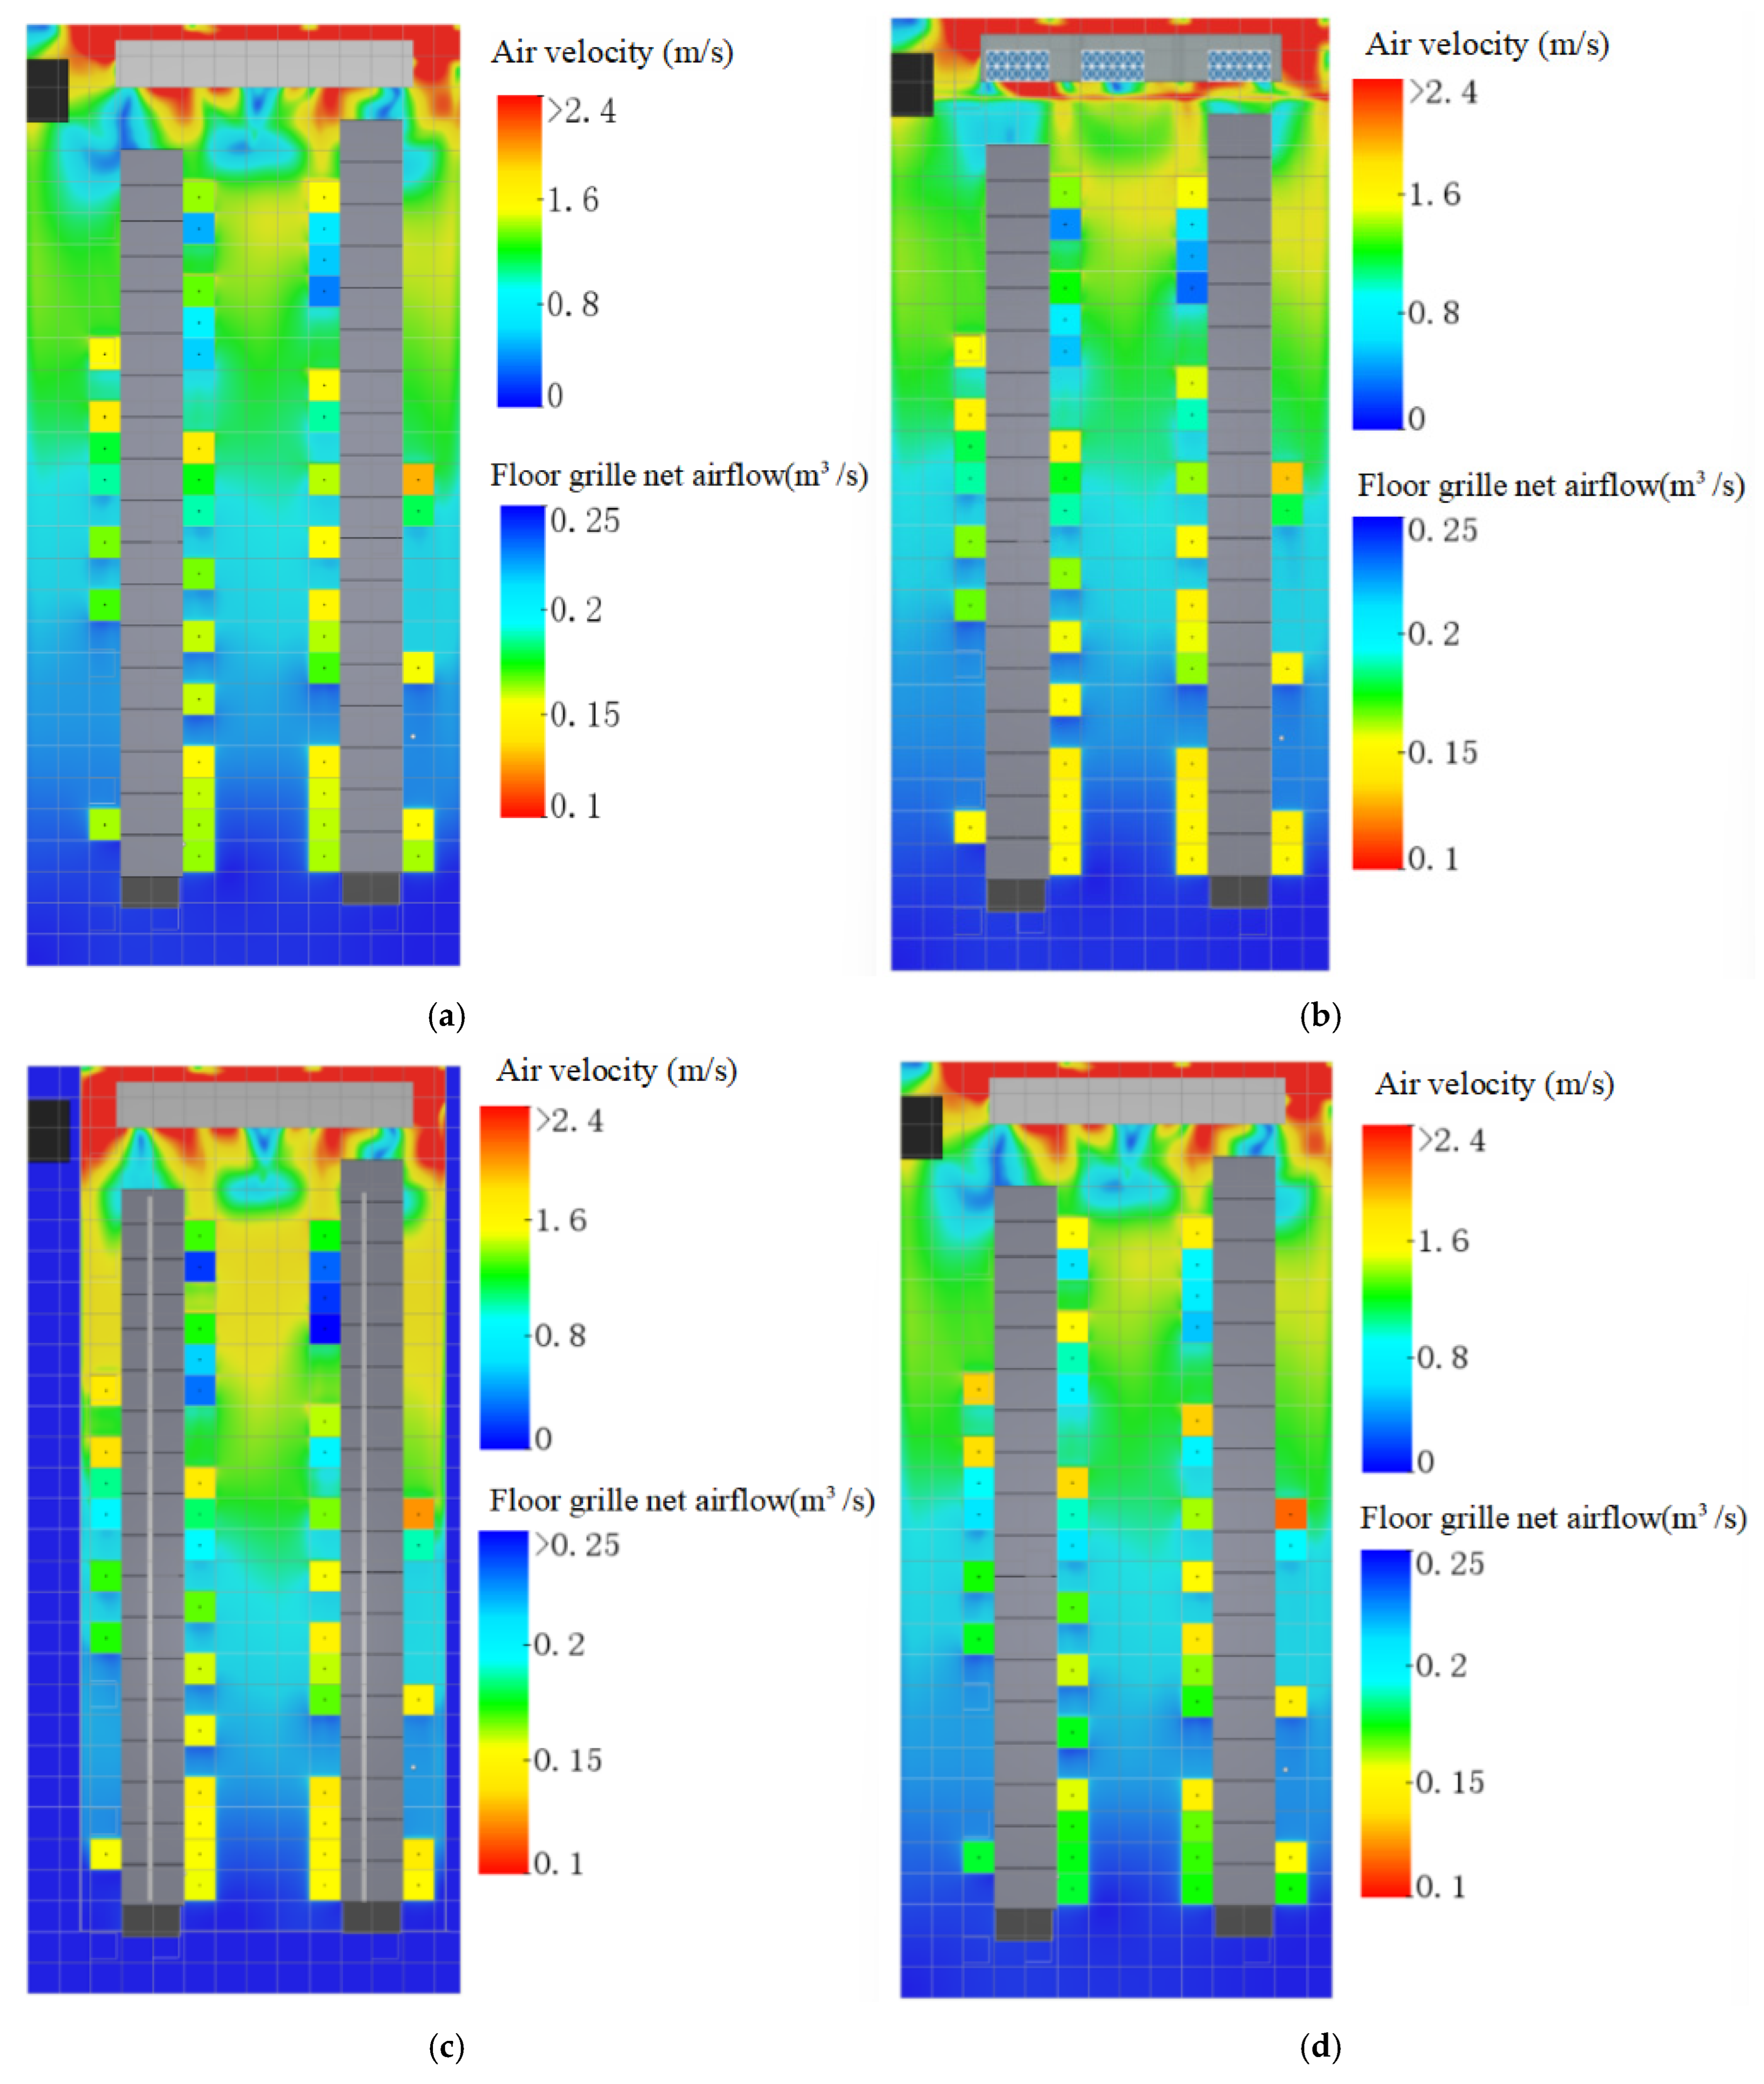
S0 is the original state without any retrofit. The simulation results are shown in Figure 12a: a high-velocity jet zone forms near the air-conditioner outlet, and the airflow rushes directly to the nearby floor grilles, causing locally excessive flow; in the far-end zone away from the air conditioner, the air volume can hardly arrive effectively due to insufficient dynamic pressure and excessively low static pressure. In this scenario, the net flow rates of the outlets range from 0.128 to 0.228 m3/s, with a range of 0.100 m3/s.
Figure 12.
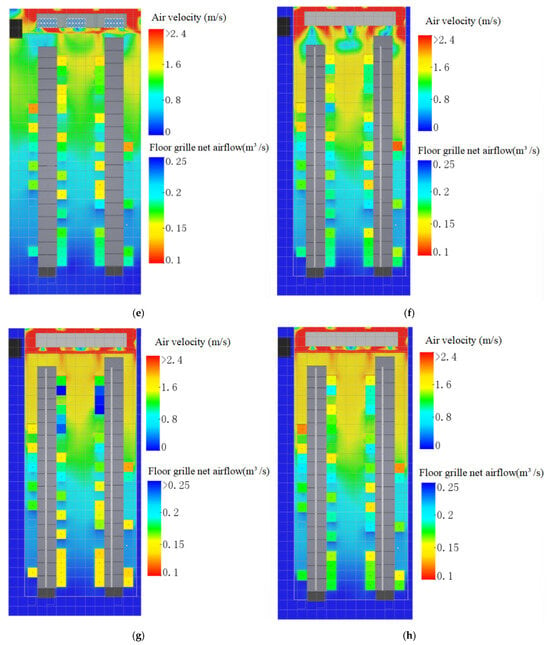
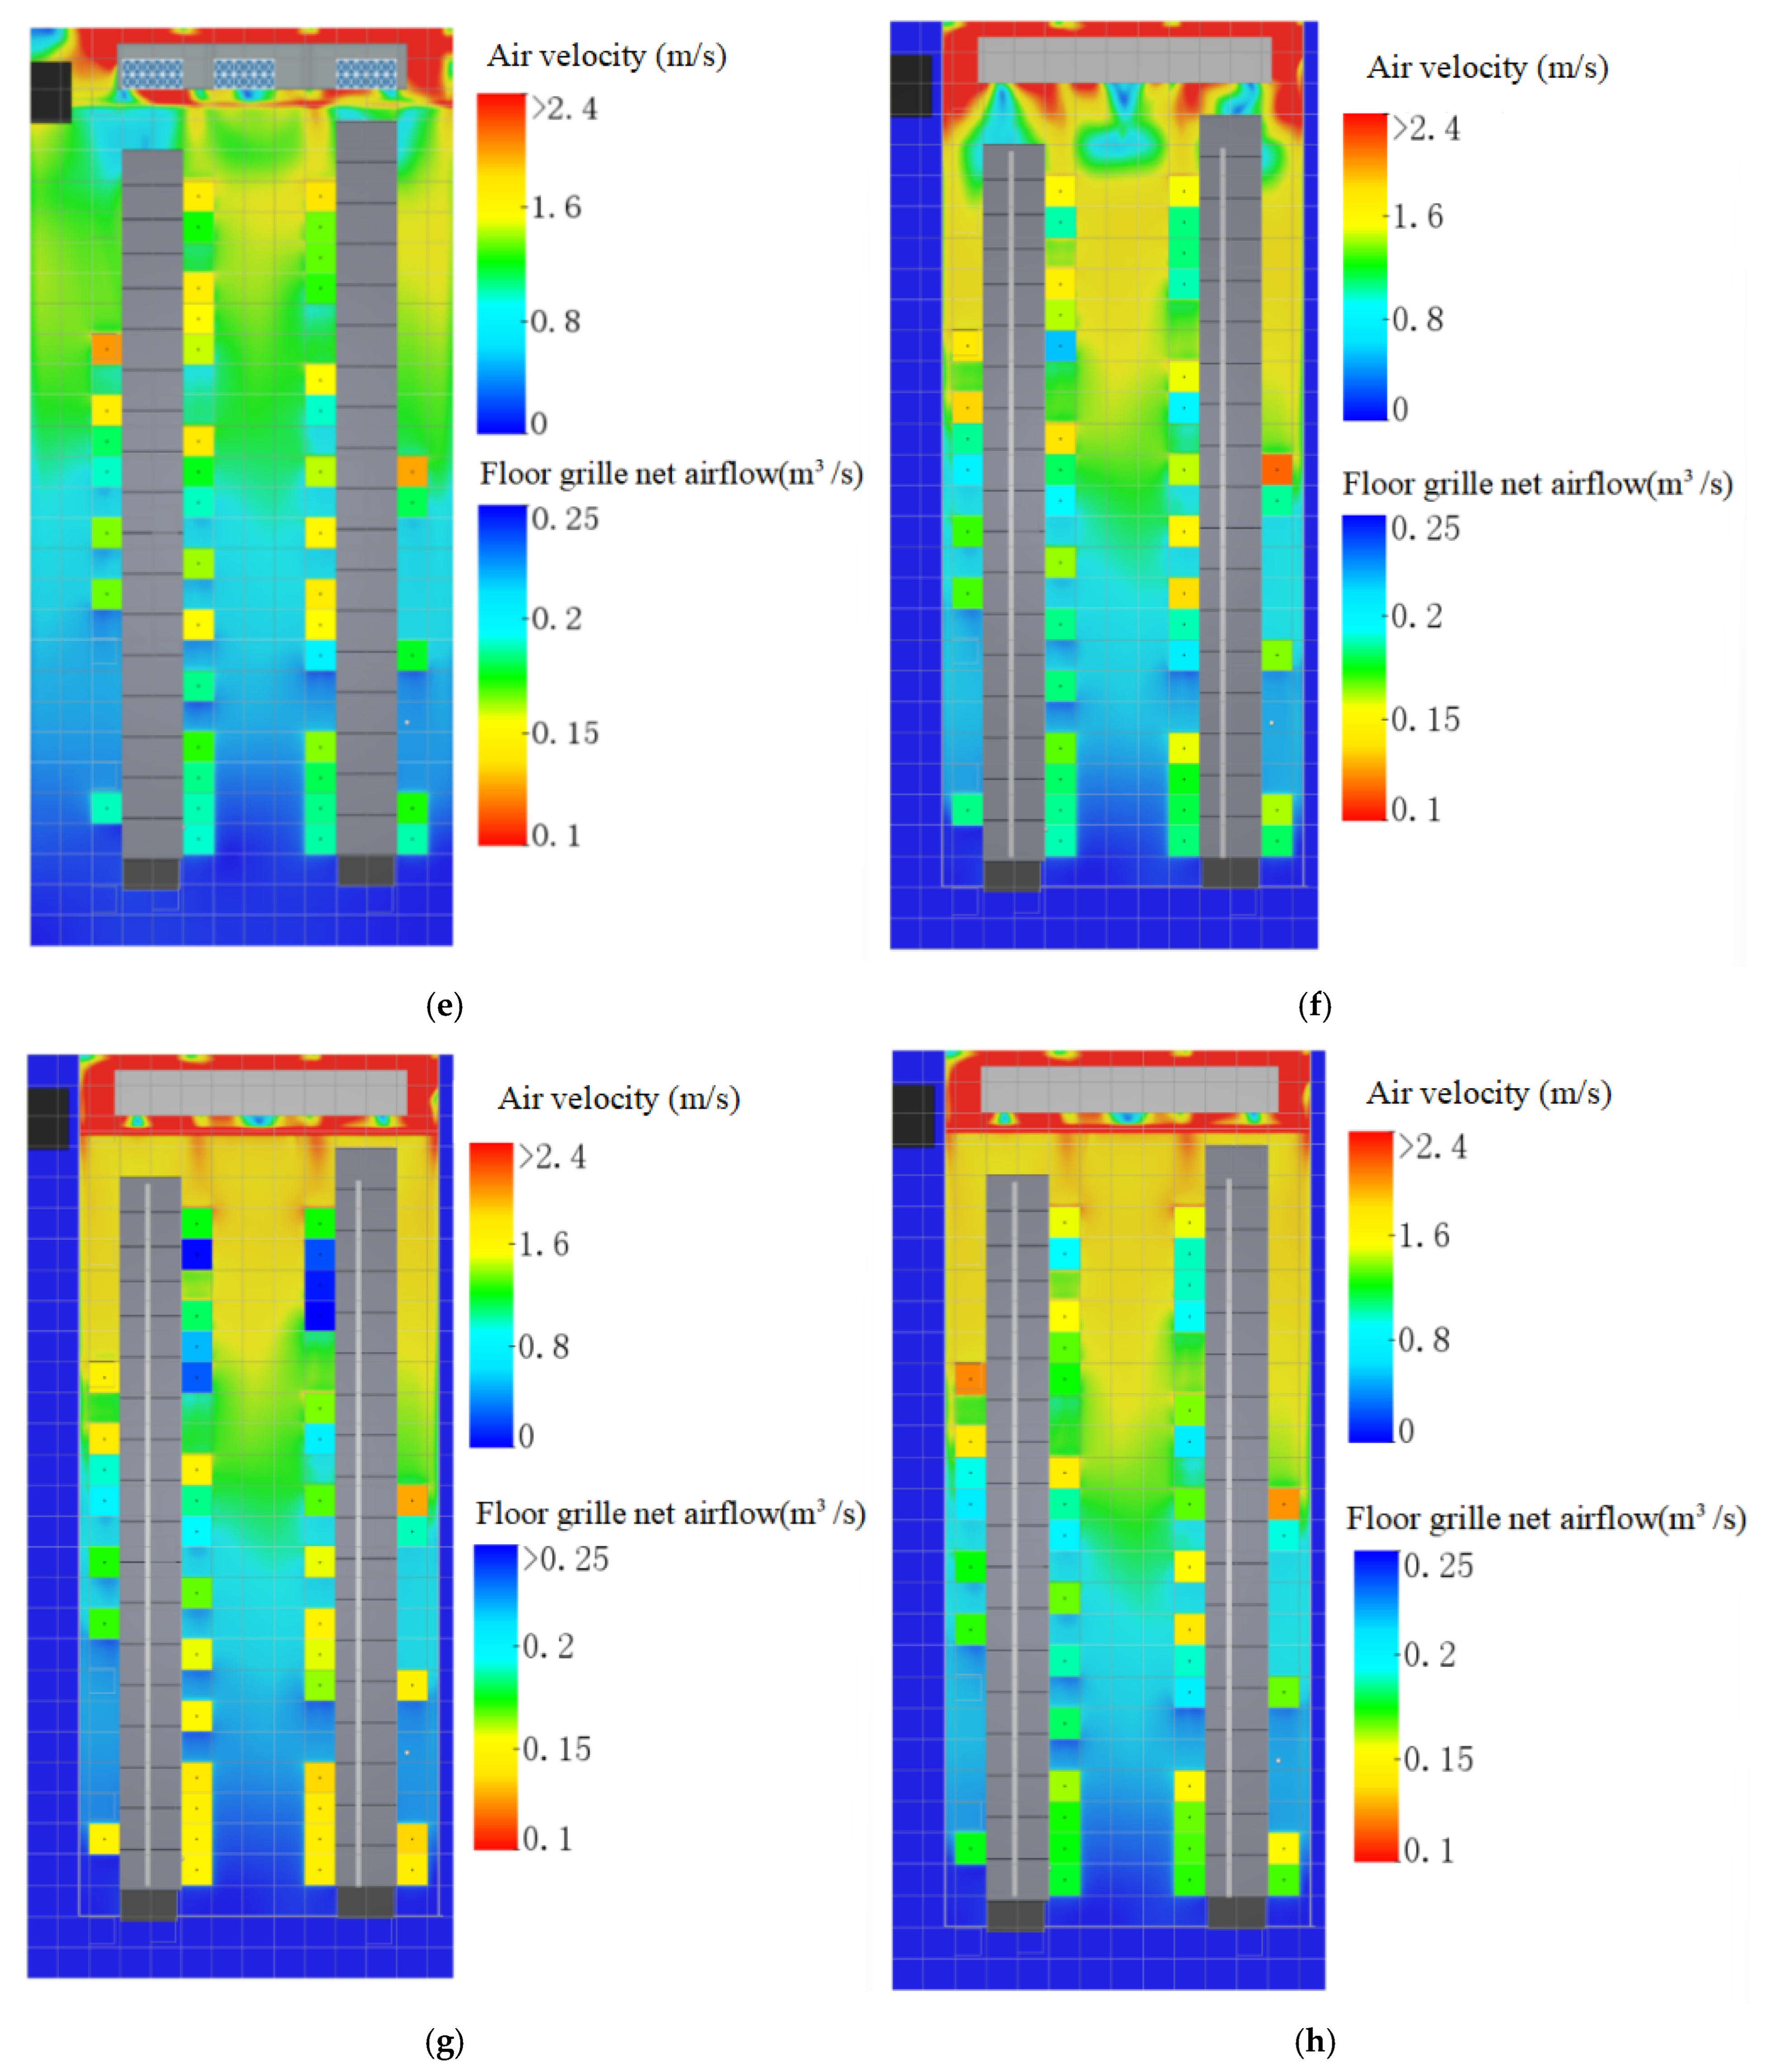
Air velocity at 0.3 m below the raised floor and net airflow distribution of floor grilles under each scenario: (a) S0; (b) S1; (c) S2; (d) S3; (e) S4; (f) S5; (g) S6; (h) S7. Note: The top part of each subfigure shows a velocity contour map at a 0.3 m high horizontal section inside the underfloor plenum (unit: m/s), and the bottom part shows the corresponding net flow distribution of the floor grille. The net flow range (unit: m3/s) is indicated below each subfigure.
The simulation results of S1 are shown in Figure 12b, with one transverse perforated baffle with a perforation ratio of 50% installed near the air-conditioner outlet. The perforated baffle has a certain dispersing effect on the high-velocity jet, but due to the high perforation ratio, the air transmission is still considerable; the leeward side of the baffle quickly returns to a low-pressure zone, failing to effectively reconstruct the pressure gradient of the entire plenum. The net flow range is 0.101 m3/s, almost the same as the baseline scenario, indicating that the perforated baffle alone has a very limited effect without the cooperation of variable-opening floor tiles.
The simulation results of S2 are shown in Figure 12c, in which the oversized underfloor plenum is physically partitioned by optimally arranged vertical solid baffles to remove redundant zones. However, after the volume reduction, the main airflow path is redefined: the near-end zone presents a high-velocity zone due to airflow concentration, and some outlets obtain abnormally high flow rates; although the far-end zone obtains some air, bypass dead zones still exist. The net flow rates range from 0.123 to 0.255 m3/s, with a range of 0.132 m3/s, about 32% worse than the baseline scenario. This shows that it is difficult to establish a uniform pressure gradient by relying solely on volume reduction without near-end energy dissipation.
The simulation results of S3 are shown in Figure 12d, in which flow equalization is achieved only by adjusting the local resistance of each air supply outlet without relying on baffles. The flow rates of the near-end outlets are limited due to the increased local resistance, but the restricted air volume does not automatically transfer to the far end as expected. Since the overall pressure field of the plenum has not been macroscopically reconstructed, the low-pressure environment in which the far-end outlets are located has not been fundamentally improved. The net flow range remains at 0.102 m3/s, almost the same as the baseline scenario. This shows that under the premise of an unbalanced pressure field itself, relying solely on the microscopic resistance compensation of variable-opening floor tiles cannot effectively guide the redistribution of air volume.
The simulation results of S4 are shown in Figure 12e. The transverse perforated plate with a perforation ratio of 50% first forms a first energy dissipation barrier at the near end, converting the dynamic pressure of the high-velocity airflow into static pressure and redistributing it; on this basis, the variable-opening floor tiles are adjusted in a gradient according to the “near-end restriction, far-end enhancement” strategy. In the velocity contour, the high-velocity core zone at the near end is significantly weakened, the low-velocity zone at the far end gradually brightens, and the flow distribution over the entire floor grille surface tends to be continuous and smooth. The net flow range converges to 0.124–0.201 m3/s, with a range of only 0.077 m3/s—the smallest among all scenarios, an improvement of about 23% over the baseline scenario. This result proves that the “macroscopic pressure-field reconstruction” of the perforated baffle and the “microscopic resistance compensation” of the variable-opening floor tiles form an effective two-level regulation system: the former creates a reasonable regulation basis for the latter, while the latter fills in the terminal differences that the former cannot cover.
The simulation results of S5 are shown in Figure 12f. After volume reduction combined with the adjustment of variable-opening floor tiles, the airflow concentration trend is effectively suppressed, and some far-end outlets recover reasonable air volumes. The net flow rates range from 0.116 to 0.217 m3/s, with a range of 0.101 m3/s, basically returning to the baseline level and significantly improved compared with the 0.132 m3/s of S2 using solid baffles alone. This shows that the adjustment of variable-opening floor tiles can effectively compensate for the airflow concentration effect caused by volume reduction, but the compensated uniformity only stops at “not deteriorating” and fails to achieve a substantial uniformity leap; the overall effect is far inferior to the perforated baffle combination.
The simulation results of S6 are shown in Figure 12g. The simulation image reveals a complex flow field interference phenomenon: after energy dissipation, the airflow upstream of the perforated baffle enters the partitioned space with reduced volume, where the static pressure changes more sensitively due to the reduced volume, and a pattern of coexisting local high-pressure accumulation and low-pressure voids appears locally. In the image, some near-end outlets present bright-yellow high-flow zones due to airflow squeezing in the reduced space, while the far-end zones shielded by the partition boundaries form large blue low-velocity zones. The net flow range marked at the bottom of the image is 0.127–0.258 m3/s, with a range of 0.131 m3/s, close to the S2 scenario and even exceeding the baseline scenario. This shows that the two mechanisms of energy dissipation and volume reduction interfere with each other in the absence of variable-opening floor tile cooperation, instead destroying the originally uneven but still coherent flow field structure.
The simulation results of S7 are shown in Figure 12h. The simulation image shows that after the fine adjustment of near-end restriction and far-end enhancement, the extreme flow points are somewhat converged, the near-end high-velocity zone is effectively suppressed, the far-end low-velocity zone is significantly brightened, and the zero-velocity phenomenon is basically eliminated. The net flow range marked at the bottom of the image is 0.121–0.206 m3/s, with a range of 0.085 m3/s, an improvement of about 15% over the baseline scenario, and the uniformity is significantly improved. However, compared with the S4 scenario, the flow field uniformity of S7 is still insufficient: in the image, the near-end flow rates are generally low due to the throttling of the variable-opening floor tiles, and the far end still has local flow surge points despite compensation, presenting an overall distribution characteristic of “low in the middle and fluctuating at the edges”. This shows that the additional path constraints introduced by volume reduction force the variable-opening floor tiles to undergo drastic adjustment over a larger range, which not only increases the total system resistance but also makes it difficult for the flow distribution to achieve the compact balance of the perforated baffle combination.
4.3. Evaluation Metrics
To quantitatively evaluate the air supply uniformity of each scenario, two evaluation indicators are introduced:
- (1)
- Coefficient of variation (CV): This indicator reflects the dispersion degree of the net flow rates of the outlets and is defined as the ratio of the standard deviation to the arithmetic mean.
- (2)
- Air supply uniformity index (γ): This is defined as the ratio of the minimum net flow rate to the maximum net flow rate. This indicator ranges from 0 to 1; the closer to 1, the smaller the difference between the maximum and minimum outlet flow rates and the more balanced the flow field.
The basis for selecting CV and γ as the evaluation indicators in the plenum optimization stage is as follows: both take the net flow rates of the air supply outlets as the statistical object, directly characterize the outlet flow distribution of the plenum, have clear calculation boundaries, do not depend on rack-level temperature field data, and are suitable for the horizontal comparison and screening of underfloor retrofit schemes. In contrast, indicators such as the rack cooling index (RCI), return heat index (RHI), supply heat index (SHI), and capture index are all defined based on the rack inlet/outlet temperature field and belong to room-level cooling efficiency indicators, which need to be obtained through whole-room thermal environment simulation after the plenum scheme is determined. Therefore, this study introduces SHI as a supplementary evaluation in the whole-room thermal environment verification stage in Section 4.4, forming a two-level evaluation system of “underfloor flow uniformity—room-level cooling efficiency”. It should be pointed out that there is currently no unified standard limit for the air supply uniformity of underfloor plenums at home and abroad; CV and γ are mainly used for the relative comparison among retrofit scenarios, while room-level thermal safety is examined in Section 4.4 using the ASHRAE-recommended rack inlet air temperature range (18–27 °C) [15].
The comparison of indicators for each scenario is listed in Table 8, with the CV values recalculated by the standard deviation method. The S4 scenario ranks first with the comprehensive advantages of CV = 10.8% and γ = 0.62, and the uniformity index is improved by 10.7% over the baseline S0; S7 ranks second. The indicators of S1 are close to those of S0, verifying the limited effect of the perforated baffle alone. S2 is the worst among all scenarios, confirming the destructive effect of solid baffle volume reduction alone on uniformity. After compensation by variable-opening floor tiles, the CV of S5 falls back to 13.8%, but the effect is still far inferior to the perforated baffle combination. Due to the lack of variable-opening floor tile adjustment, the range expansion effect of S6 is significant. The CV calculated by the standard deviation method is about 55% lower than that of the original range approximation method, but the relative ranking of the scenarios remains consistent, and the evaluation conclusions are not affected.
Table 8.
Evaluation metrics for all scenarios.
4.4. Full-Room Thermal Verification
Based on the plenum simulation results, three representative scenarios—S0 (baseline), S4 (optimal), and S7 (suboptimal)—were selected to carry out overall simulations of the room space and rack thermal environment, so as to examine the transfer effect of the underfloor optimization results to rack-level cooling efficiency.
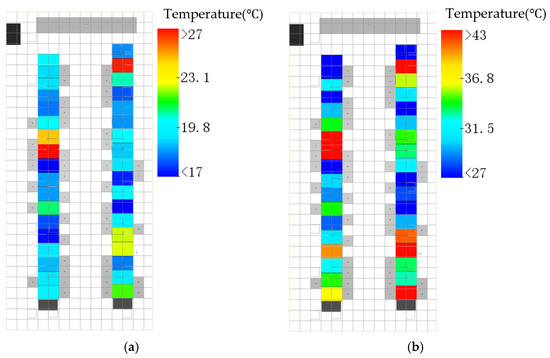
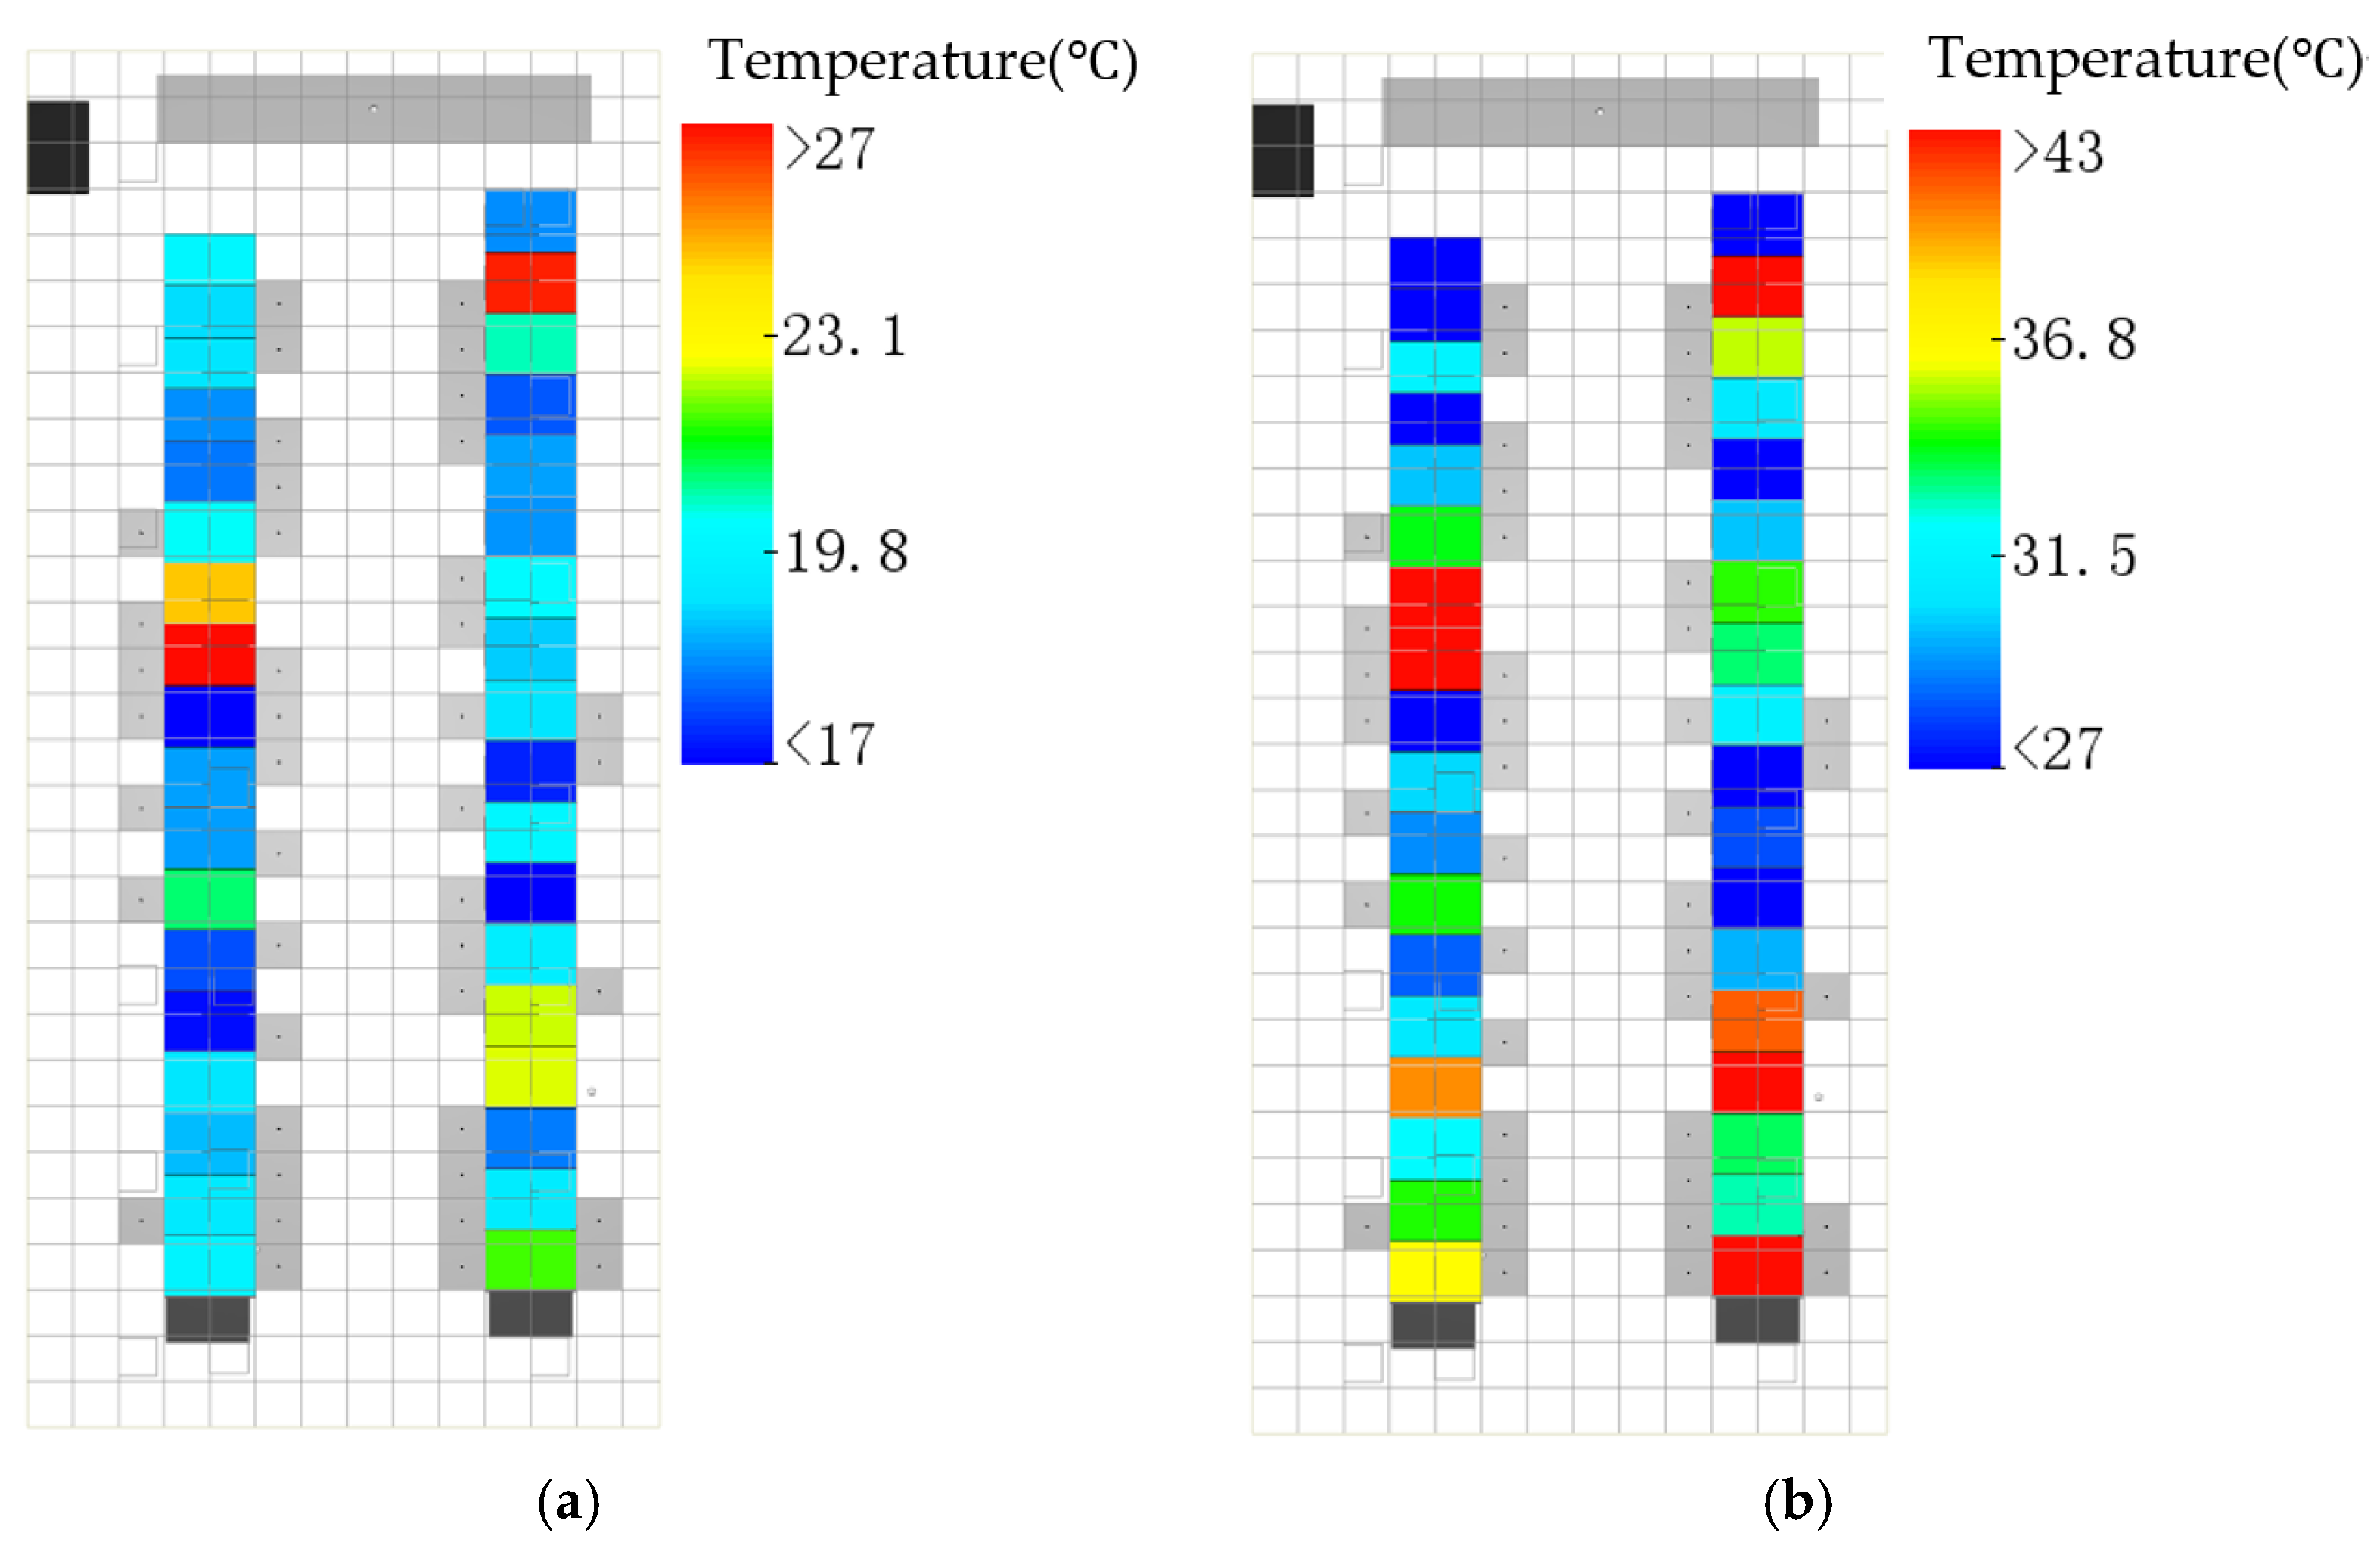
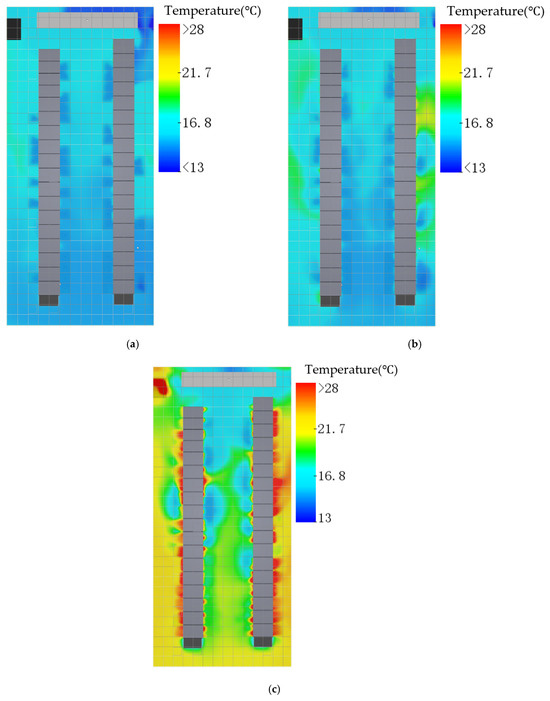
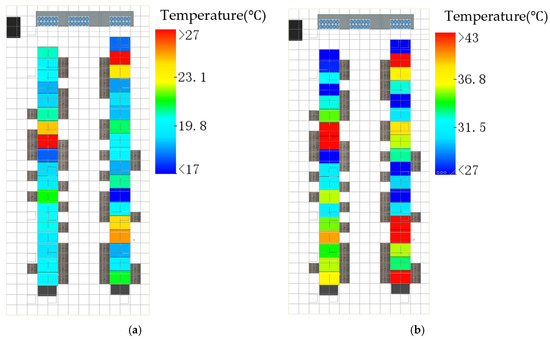
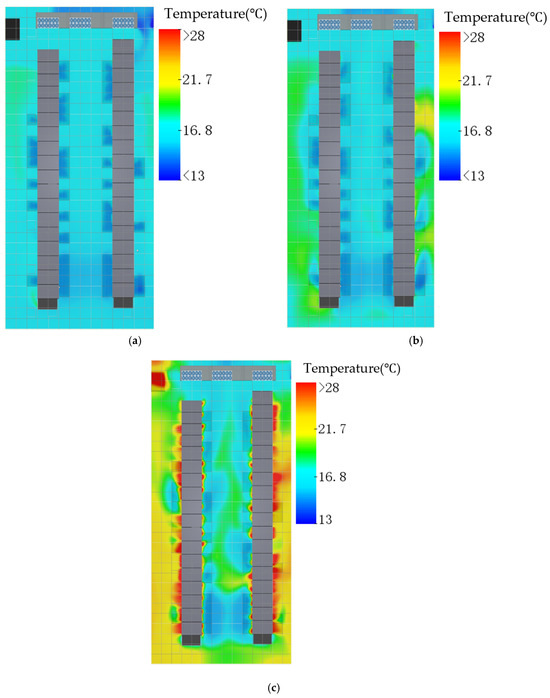
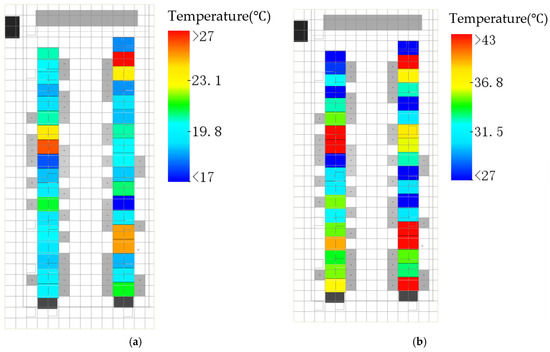
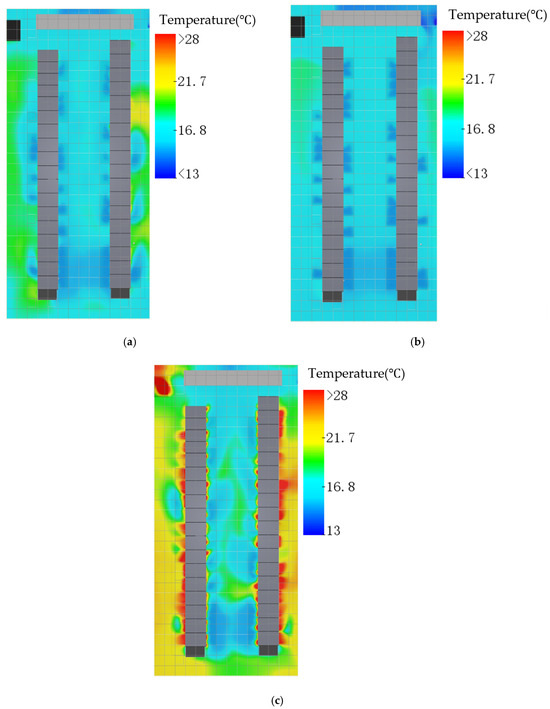
The whole-room simulation of the S0 scenario was carried out, and the results are shown in Figure 13 and Figure 14. It can be seen that in the original state with no baffles and uniform opening of the variable-opening floor tiles, the room thermal environment presents significant vertical and horizontal temperature gradients. From the temperature distributions at the three heights (0.2 m, 1 m, and 2 m), obvious temperature stratification exists in the cold aisle zone: the near-ground layer has a lower temperature due to the direct influence of floor air supply, but as the height increases, the mixing of cold and hot airflows intensifies, and the temperature rises rapidly with an extremely uneven distribution. The rack inlet temperatures are severely discrete: the average inlet temperature of rack AO12 is the highest at 27.2 °C, already touching the ASHRAE-recommended upper limit; that of rack BO7 is the lowest at only 16.1 °C, with a temperature difference of up to 11.1 °C between the two. The rack outlet temperatures also differ greatly, with AO12 reaching a maximum of 46.6 °C and BO7 a minimum of 19.7 °C.
Figure 13.
Simulation results of the average inlet and outlet temperatures of the rack under S0 conditions: (a) Average inlet temperature distribution; (b) Average outlet temperature.
Figure 14.
Temperature distribution in the machine room at different heights under S0 conditions: (a) Temperature distribution 0.2 m above the raised floor; (b) Temperature distribution 1 m above the raised floor; (c) Temperature distribution 2 m above the raised floor.
With the air-conditioning supply air temperature and flow rate unchanged, the whole-room simulation of the S4 scenario was carried out, and the results are shown in Figure 15 and Figure 16. The simulation results show that in the S4 scenario, the peak rack inlet temperature drops from 27.2 °C in S0 to 26.7 °C, the minimum value rises slightly from 16.1 °C to 16.5 °C, and the overall temperature range is narrowed. There are almost no hotspots at 0.2 m above the raised floor; at 1 m, there are only a few local zones with slightly higher temperatures in the cold aisle, and the maximum temperature is controlled at about 22 °C. However, because the air supply floor tiles are scattered and not strictly aligned with the rack positions, local air supply blind zones still exist in the cold aisle, and some racks are not effectively covered by cold air.
Figure 15.
Simulation results of the average inlet and outlet temperatures of the rack under S4 conditions: (a) Average inlet temperature distribution; (b) Average outlet temperature.
Figure 16.
Temperature distribution in the machine room at different heights under S4 conditions: (a) Temperature distribution 0.2 m above the raised floor; (b) Temperature distribution 1 m above the raised floor; (c) Temperature distribution 2 m above the raised floor.
The S7 scenario was simulated in the same way, and the results are shown in Figure 17 and Figure 18. In the S7 scenario, the average inlet temperature of rack BO17 is the highest at 28.9 °C, and that of BO7 is the lowest at 16.7 °C. It should be noted that S7 is superior to S0 in both plenum uniformity (γ = 0.59) and overall thermal environment indicators, but its maximum rack inlet temperature is higher than the 27.2 °C of S0; the two are not contradictory, because the improvement of a scenario’s overall indicators does not mean that all local positions improve simultaneously. The specific reason is that after S7 adopts solid baffle volume reduction, the main airflow is confined to a fixed path, and the flow rates of the near-end outlets are generally compressed when the variable-opening floor tiles are adjusted according to “near-end restriction, far-end enhancement”; rack BO17 is located in the far-end corner of row B, adjacent to the partition boundary, right at the edge of the bypass zone formed by the solid baffles, and receives limited cold air volume; coupled with the high heat dissipation of this rack and obvious local heat backflow, a new local hotspot is formed. Under the S0 scenario, this zone can still obtain part of the cold air through the free mixing of the large-space plenum, whereas the partitioning constraint of S7 weakens this compensation. This phenomenon shows from the negative side that volume-reduction retrofits can easily make flow regulation “improve one area at the expense of another”, whereas the S4 scheme introduces no additional path constraints and only regulates through the synergy of pressure-field reconstruction and resistance compensation, resulting in a more balanced temperature distribution; this is also an important reason why this study finally recommends S4 rather than S7. Meanwhile, the 28.9 °C of BO17 has exceeded the ASHRAE-recommended upper limit, indicating that S7 is not suitable as the final retrofit scheme and is retained in this study only as a comparison scenario.
Figure 17.
Simulation results of the average inlet and outlet temperatures of the rack under S7 conditions: (a) Average inlet temperature distribution; (b) Average outlet temperature.
Figure 18.
Temperature distribution in the machine room at different heights under S7 conditions: (a) Temperature distribution 0.2 m above the raised floor; (b) Temperature distribution 1 m above the raised floor; (c) Temperature distribution 2 m above the raised floor.
After the implementation of the underfloor plenum optimization, the room thermal environments of both the S4 and S7 schemes are substantially improved, with S4 superior to S7. From the comparison of the temperature distributions at different heights, it can be seen that the significant temperature gradient in the cold aisle zone under S0 is effectively suppressed in both S4 and S7, and the airflow organization tends to be uniform. The rack inlet temperature distribution is significantly more even than that of S0, proving the positive role of underfloor plenum regulation in improving air supply uniformity. Taking the ASHRAE-recommended upper limit of 27 °C for rack inlet air temperature as the criterion: both rack AO12 under S0 (27.2 °C) and rack BO17 under S7 (28.9 °C) have points exceeding the limit, while all rack inlet temperatures under S4 are within the recommended range, making it the only scheme that meets the thermal safety standard.
To comprehensively evaluate the optimization effect, the supply heat index (SHI) is introduced to evaluate the cooling efficiency. SHI is used to quantify the proportion of hot return air mixed into the cold air supplied by the air conditioners, and is defined as [16]:
where Th and Ts are the average return air and supply air temperatures of the air-conditioning units (°C), respectively; Tout and Tin are the average outlet and inlet temperatures of all racks (°C), respectively, with the statistical boundary covering all 36 racks and 3 air-conditioning units in the room. SHI ranges from 0 to 1; the closer to 0, the lower the degree of mixing of the supplied cold air with hot return air and the more sufficient the cooling capacity utilization.
The calculation results show that the SHI of the S0 scenario is 0.42; the SHI of the S4 scenario drops to 0.35; and the SHI of the S7 scenario is 0.37. It should be pointed out that the absolute level of SHI in this study is relatively high overall, which is directly related to the structural characteristics of this equipment room: neither the cold nor the hot aisle is enclosed, and scattered air supply outlets exist in the hot aisle, so part of the cold air enters the hot aisle directly without passing through the racks and mixes with the exhaust air, resulting in an inherently high proportion of hot return air mixed into the supplied cold air. The S4 scheme only improves the outlet uniformity of each air supply outlet through underfloor plenum regulation and does not change the airflow mixing path in the upper space of the room, so the SHI reduction is limited (about 17%): after the air supply is uniformed, each rack roughly receives cold air on demand, the phenomena of near-end overcooling and far-end undercooling are reduced, and the ineffective mixing of cooling capacity is reduced accordingly, but the mixing of cold and hot airflows at the aisle level still exists. To further reduce SHI, retrofit measures such as cold/hot aisle containment in the upper space of the room are required.
Regarding the phenomenon that the plenum uniformity gap between S7 and S4 (γ differs by 0.03) is small while their room thermal environment performances are close, the mechanism lies in the fact that the room thermal environment depends not only on the floor air supply uniformity but also on the combined influence of the upper-space airflow organization, rack heat distribution, and the buoyancy effect of cold and hot airflows. Although S7 is slightly inferior to S4 in floor air supply uniformity due to the additional path constraints introduced by the solid baffles, its partitioned space after volume reduction forms more targeted local airflow guidance in the high-heat-dissipation rack zones, partially compensating for the deficiency in air supply uniformity. Regarding the structural problem of cold aisle width: the actual width of the cold aisle in this room reaches 1.5–2.1 m, far exceeding the ASHRAE-recommended standard value of 1.2 m. The excessively wide cold aisle causes the floor air supply jets to undergo significant diffusion and decay before reaching the rack inlet surfaces; the central zone of the cold aisle, far from effective cold air supply sources, is continuously affected by the entrainment of upper hot return air above 1.5 m, forming a temperature “saddle”—the temperatures at the rack inlet surfaces on both sides are lower while the temperature in the middle zone is higher. This structural limitation cannot be avoided by underfloor plenum regulation alone, and supplementary measures such as cold aisle containment or precision air supply guidance above the raised floor are required to achieve comprehensive thermal safety.
5. Discussion
The main body of this study is the optimization of the underfloor plenum, whose direct goal is to improve the outlet uniformity of each air supply outlet; however, the engineering value of the uniformity improvement must ultimately be reflected in rack-level cooling effects and energy consumption. Section 4.4 has shown that the improvement of air supply uniformity can directly reduce the rack inlet temperature and its discreteness, bringing all rack inlet temperatures back within the ASHRAE-recommended range. On this basis, this section further discusses the influence of the optimization scheme on room energy consumption and PUE, as well as the engineering applicability and limitations of the method, following the logic of “uniform air supply → improved rack cooling → energy-saving potential”.
5.1. Analysis of Energy Consumption and PUE Impact
The ultimate value of airflow uniformity improvement should be reflected in energy saving. This section estimates and analyzes the energy consumption impact of the optimal scheme (S4) based on the simulation results.
- (1)
- Energy-saving benefits: In the S4 scenario, the SHI decreases from 0.42 to 0.35, and the maximum rack inlet temperature decreases from 27.2 °C to 26.7 °C with a significantly narrowed temperature distribution, which means that the supply air temperature setpoint of the air conditioners can be raised by about 1.5 °C under the same thermal safety margin. Estimated according to the empirical relationship that the COP of the refrigeration system increases by 2–3% for every 1 °C increase in supply air temperature, the refrigeration energy consumption can be reduced by about 3–4.5%.
- (2)
- Fan power penalty: The resistance increment of the plenum caused by the perforated baffle is 8.5%. Under the condition of constant air supply volume, the air-conditioning fan power increases by approximately 8.5% according to the relationship of “power ∝ air volume × pressure rise”. Considering that the air-conditioning fan power accounts for about 5% of the total energy consumption of the equipment room, this penalty is equivalent to an increase of about 0.4% in the total energy consumption.
- (3)
- Comprehensive PUE estimation: The current PUE of this equipment room is about 1.90. Refrigeration energy consumption accounts for more than 40% of the total energy consumption of the room, so the refrigeration energy saving of 3–4.5% is equivalent to a total energy consumption reduction of about 1.3–1.9%; after deducting the fan penalty of 0.4%, the net energy saving is about 0.9–1.5%, corresponding to a PUE reduction from about 1.90 to about 1.87, a decrease of about 0.03. It should be noted that the above estimation is a simplified calculation based on empirical relationships; the actual energy-saving effect is affected by the air-conditioning control strategy, outdoor meteorological conditions, and load fluctuations, and needs to be verified through continuous measurement after the retrofit is implemented.
- (4)
- Trade-off between energy consumption and performance: The comprehensive analysis shows that the energy-saving benefit of the S4 scheme is significantly higher than its resistance penalty cost, and the net benefit is positive. If it is subsequently implemented in combination with measures such as partial retrofit of the upper space of the room and dynamic adjustment of supply air temperature, the SHI is expected to be further reduced, and there is greater room for PUE reduction.
5.2. Discussion of Engineering Applicability and Limitations
- (1)
- Applicable objects: The optimization framework and baffle coordination strategy proposed in this study are aimed at existing air-cooled, raised-floor air-supply small and medium-sized data centers, and are especially suitable for campus and enterprise/institution equipment rooms that are converted from existing buildings, cannot be shut down for reconstruction, and have limited retrofit budgets. Such equipment rooms exist in large numbers and will continue to be dominated by air cooling for a considerable period of time in the future, so low-intrusion underfloor retrofits have realistic promotion value.
- (2)
- Relationship with the trend of liquid cooling technology: With the rapid development of high-density computing and artificial intelligence infrastructure, liquid cooling and immersion cooling are accelerating in popularity, and traditional air cooling is approaching its capability limit in scenarios where the single-rack power exceeds 20 kW, which to some extent compresses the long-term application space of airflow organization optimization strategies. However, it should be noted that: first, liquid cooling retrofit requires high investment and stringent requirements on room load-bearing and pipeline systems, making it difficult for existing small and medium-sized equipment rooms to fully switch to liquid cooling in the short term; second, in the hybrid cooling stage of transition from air cooling to liquid cooling, the auxiliary heat dissipation of liquid-cooled racks and the unretrofitted racks still rely on room-level airflow organization, and the method of this study can be used for airflow optimization on the air-cooled side; third, the methodology of the four-step framework in this study—“measurement validation—pre-simulation screening—factorial scenario design—whole-room thermal environment verification”—is also applicable to the evaluation of the remaining air-cooled parts of liquid-cooled equipment rooms. Therefore, this study still has clear engineering value during the transition period.
- (3)
- Generalization boundary of the conclusions: The specific parameter conclusions of this study (perforation ratio of 50%, 0.3 m from the air-conditioner outlet, etc.) are obtained for the geometric and boundary conditions of this particular room, and the pre-simulation parameter screening needs to be carried out again when directly transplanting them to equipment rooms with different climate zones, rack layouts, server densities, or cooling forms. However, the two-level coordinated regulation mechanism of “macroscopic pressure-field reconstruction + microscopic resistance compensation” and the four-step optimization framework are universal, and can provide methodological references for non-standard equipment rooms with similar causes of air supply imbalance (near-end jet short-circuiting and far-end air deficiency).
6. Conclusions
Taking a non-standard raised-floor air-supply data center at a university in Hangzhou as the research object, this study systematically investigated the optimization of the room thermal environment using a combination of field measurement and CFD numerical simulation. The main conclusions are as follows:
- (1)
- The established CFD numerical model was verified by three-level mesh independence verification and multi-zone statistical indicators. The temperature MAE of each zone does not exceed 0.9 °C, and the air velocity MAE does not exceed 0.20 m/s. The model can effectively reflect the overall distribution characteristics of the airflow organization and thermal environment of the non-standard equipment room, providing a reliable simulation platform for the optimization research.
- (2)
- For the underfloor plenum optimization, the optimal parameters of the perforated baffle were determined through systematic parameter studies: 0.3 m from the air-conditioner outlet and a perforation ratio of 50%. On this basis, the coordination of the perforated baffle and variable-opening floor tiles is the optimal strategy: the perforated baffle realizes macroscopic pressure-field reconstruction, and the variable-opening floor tiles realize terminal microscopic flow regulation. The synergy of the two can reduce the range of net airflow among the air supply outlets from 0.100 to 0.077 m3/s, reduce the coefficient of variation from 12.8% to 10.8%, and increase the air supply uniformity index from 0.56 to 0.62, an improvement of 10.7% over the baseline.
- (3)
- The whole-room thermal environment verification shows that all rack inlet temperatures of the optimal scheme S4 meet the ASHRAE-recommended range, the SHI decreases from 0.42 to 0.35, and the room PUE is estimated to be reduced by about 0.03; the airflow uniformity improvement can be transformed into tangible cooling efficiency and energy-saving benefits.
It should be pointed out that the specific parameter and numerical conclusions in (2) and (3) above are obtained for this particular room, and there are boundary condition limitations when directly generalizing them to other rooms. However, the four-step research method of “measurement validation—pre-simulation parameter screening—factorial scenario design—whole-room thermal environment verification” and the two-level coordinated regulation mechanism proposed in this study are universal, and can provide methodological references for non-standard campus data centers with similar structures and layouts and similar causes of air supply imbalance. Follow-up research will carry out long-term measurement in combination with the retrofit implementation and explore the combined optimization with measures such as cold aisle containment.
Author Contributions
Conceptualization, J.Z. and Z.W.; methodology, J.Z.; software, J.Z.; validation, J.Z. and Z.W.; formal analysis, J.Z.; investigation, J.Z. and G.J.; resources, Z.W. and G.J.; data curation, J.Z.; writing—original draft preparation, J.Z.; writing—review and editing, Z.W. and G.J.; visualization, J.Z.; supervision, Z.W.; project administration, Z.W. All authors have read and agreed to the published version of the manuscript.
Funding
This research received no external funding.
Institutional Review Board Statement
Not applicable.
Informed Consent Statement
Not applicable.
Data Availability Statement
The original contributions presented in this study are included in the article. Further inquiries can be directed to the corresponding author.
Conflicts of Interest
The authors declare no conflicts of interest.
References
- Qu, J. Research on energy saving of computer rooms in Chinese colleges and universities based on IoT and edge computing technology. Heliyon 2022, 8, e10970. [Google Scholar] [CrossRef] [Scilit] [PubMed]
- Zhan, Z.; Jing, Y.; Peng, Z.; Liu, Q.; Xie, X. Applicability of air-cooled data center cooling systems in different locations across China: A simulation-based investigation. Energy 2025, 338, 138813. [Google Scholar] [CrossRef] [Scilit]
- Abdilla, A.; Borg, S.P.; Licari, J. Relating measured PUE to the cooling strategy and operating conditions through a review of a number of Maltese data centres. Energy Rep. 2025, 13, 2612–2623. [Google Scholar] [CrossRef] [Scilit]
- Jing, Y.; Xie, L.; Li, F.; Zhan, Z.; Wang, Z.; Yang, F.; Fan, J.; Zhu, Z.; Zhang, H.; Zhao, C.; et al. Field test of cooling systems in two air-cooled data centers. Appl. Therm. Eng. 2024, 248, 123189. [Google Scholar] [CrossRef] [Scilit]
- Zhang, M.; Zhang, Z.; Hu, Y.; Huang, H.; Huang, Y. Effect of raised floor height on different arrangement of under-floor air distribution performance in data center. Procedia Eng. 2017, 205, 556–564. [Google Scholar] [CrossRef] [Scilit]
- Alkrush, A.A.; Salem, M.S.; Hegazi, A.A.; Abdelrehim, O. Integrated optimization of multi-parameter cooling strategies in data centers using numerical simulation and response surface methodology. Int. J. Refrig. 2025, 177, 393–416. [Google Scholar] [CrossRef] [Scilit]
- Ling, Y.Z.; Zhang, X.S.; Zhang, K.; Jin, X. On the characteristics of airflow through the perforated tiles for raised-floor data centers. J. Build. Eng. 2017, 10, 60–68. [Google Scholar] [CrossRef] [Scilit]
- Jiang, D. Effects and optimization of airflow on the thermal environment in a data center. Front. Built Environ. 2024, 10, 1362861. [Google Scholar] [CrossRef] [Scilit]
- Zhang, W.; Li, A.; Gao, R.; Gao, X.; Yang, C. Visualization experiment and flow homogenization optimization of the multi-path plenum chamber system using a perforated plate. Build. Environ. 2023, 233, 110081. [Google Scholar] [CrossRef] [Scilit]
- Chang, Q.; Huang, Y.; Liu, K.; Xu, X.; Zhao, Y.; Pan, S. Optimization control strategies and evaluation metrics of cooling systems in data centers: A review. Sustainability 2024, 16, 7222. [Google Scholar] [CrossRef] [Scilit]
- Yu, F.; Chen, H.; Wang, W.; An, J. Optimization strategies for underfloor air distribution in a small-scale data center. Buildings 2025, 15, 428. [Google Scholar] [CrossRef] [Scilit]
- Miao, Y.; Zhu, B.; Yue, T.; Lv, L. Review of optimization measures for data center plenum chambers. Build. Energy Effic. 2023, 51, 107–113. (In Chinese) [Google Scholar]
- Liu, X. Influence of underfloor air supply structure on the thermal environment of data centers. Build. Energy Effic. 2026, 54, 38–46. (In Chinese) [Google Scholar]
- Shang, S.; Zhou, T.; Cui, Z. Optimization of air supply orifices in raised floors for airflow organization and thermal environment of data centers. HV&AC 2025, 55, 297–301. (In Chinese) [Google Scholar]
- ASHRAE. Thermal Guidelines for Data Processing Environments, 5th ed.; ASHRAE: Atlanta, GA, USA, 2021. [Google Scholar]
- Li, W.K.; Chan, C.Y.; Chen, Y.A. Numerical investigation of baffle-enhanced cooling strategies in data center server racks. Case Stud. Therm. Eng. 2026, 77, 107606. [Google Scholar] [CrossRef] [Scilit]

Disclaimer/Publisher’s Note: The statements, opinions and data contained in all publications are solely those of the individual author(s) and contributor(s) and not of MDPI and/or the editor(s). MDPI and/or the editor(s) disclaim responsibility for any injury to people or property resulting from any ideas, methods, instructions or products referred to in the content. |
© 2026 by the authors. Licensee MDPI, Basel, Switzerland. This article is an open access article distributed under the terms and conditions of the Creative Commons Attribution (CC BY) license.