


Abstract
Desertification is a serious environmental challenge in regions with desert landscapes, such as the Khorezm Oasis in the Republic of Uzbekistan. Low precipitation rates and shortages of irrigation water have driven dynamic changes in desert-related land use and land cover (LULC) classes, threatening environmental and food security. This study aims to assess desertification safety levels in the Khorezm oasis using geospatial technologies to better understand spatiotemporal dynamics and to support sustainable agricultural management. A multi-criteria decision-making (MCDM) approach was used for desertification assessment. Annual mean values of key indicators—land surface temperature, vegetation index, groundwater (GW) depth, wind speed, soil erodibility (K-factor), precipitation, normalized enhanced sand index, maximum air temperature, and LULC classes—were analyzed for the period 2000–2023. The results indicate that the normalized enhanced sand index and LULC classes exert the strongest influence on desertification processes. Areas classified as high to very high desertification hazard are predominantly concentrated in the Republic of Karakalpakstan, covering a total area of 2345.65 km2. Ongoing water shortages in the Amu Darya River basin pose a significant risk of further expansion of desertified areas. The findings provide valuable insights for regional land management and desertification mitigation planning.
1. Introduction
Desertification is a complex natural–anthropogenic process that exerts significant environmental and socio-economic impacts, particularly in arid and semi-arid regions. Advances in geospatial technologies have provided effective tools for evaluating and mapping desertification hazard levels. Several studies have applied these technologies to assess land vulnerability and the rapid progression of desertification [1,2,3,4].
It is well known that vegetation cover and type play a key role in distinguishing Earth’s natural zones. From this perspective, desertification is a process involving the expansion of desert areas, characterized by the spread of sand fields and the degradation of natural vegetation and environmental conditions under both natural and anthropogenic influences. Sand and sandy soils are the main factors contributing to the development of sand vegetation cover in Central Asia and in other regions with similar soil conditions. Consequently, various concepts and definitions of desertification have been proposed worldwide [5,6]. In our study region, desertification is explicitly conceptualized as the progressive expansion of desert-specific flora and environments, driven by the encroachment of shifting sand masses under both natural and anthropogenic pressures.
This situation has led to the use of various approaches and assessment methods, including desertification degree index (DDI) = K × (Normalized Difference Vegetation Index (NDVI)—Albedo) [7], the Albedo–NDVI model [8], Normalized difference of sand index (NDSI) [9], Normalized Difference enhanced sand index (NDESI) [10], Normalized differential sandy land index (NDSLI) [11], and Seasonal autoregressive integrated moving average (SARIMA) [12].
While testing some of these methods in the research work in the oasis case, certain LULC classes—such as residential areas and vegetation-free agricultural lands—were mistakenly classified as desert areas. This phenomenon may also occur in other types of deserts, particularly those not dominated by sandy soils.
Selecting appropriate indicators for studying, assessing, and understanding desertification is a primary step that distinguishes different methodological approaches. Most of these factors are influenced by climatic conditions; therefore, air temperature is frequently included in desertification-related research [13,14]. Land Surface Temperature (LST) has been widely used by researchers [15,16] as a key indicator of desertification, while NDVI is commonly used to detect desertification [17,18]. Precipitation, being the main factor influencing vegetation cover in desert regions, is also frequently included in desertification assessment studies [19,20].
Wind speed also contributes significantly to the desertification process [21], a phenomenon commonly referred to as aeolian desertification [22]. Since soil erodibility (K-factor) varies across different soil textures, it should also be considered in desertification assessment studies.
In the case of the Khorezm Oasis in the Uzbekistan Republic, indicators such as the distribution of moving sand masses derived from NDESI, annual GW levels [23,24], and LULC classes are essential components of the desertification evaluation process. In addition to the above-mentioned factors, it should be noted that the genesis and morphology of deserts vary significantly from one region to another [25]. Therefore, the application of a common assessment technique may be less effective in certain regions, highlighting the need for region-specific evaluation methods. In this context, applying a geospatial technology approach to the Khorezm Oasis, an area surrounded and influenced by the Karakum and Kyzylkum deserts, is crucial for understanding the spatial extent and dynamics of land degradation. Therefore, the aim of this research is to identify the most significant factors and assess the level of desertification hazard in the Khorezm Oasis. In this place, the ecological safety is the state of protection of organisms and their environment against adverse changes induced by diverse factors across varying scales, intensities, and durations—safety levels are categorized based on ecosystem resilience and the degree of environmental degradation (ranging from absolutely safe to catastrophic dangerous).
2. Materials and Methods
2.1. Study Area
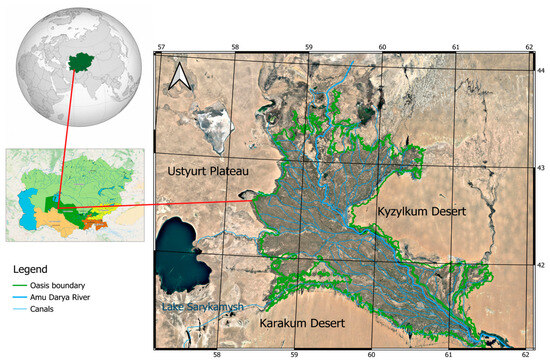
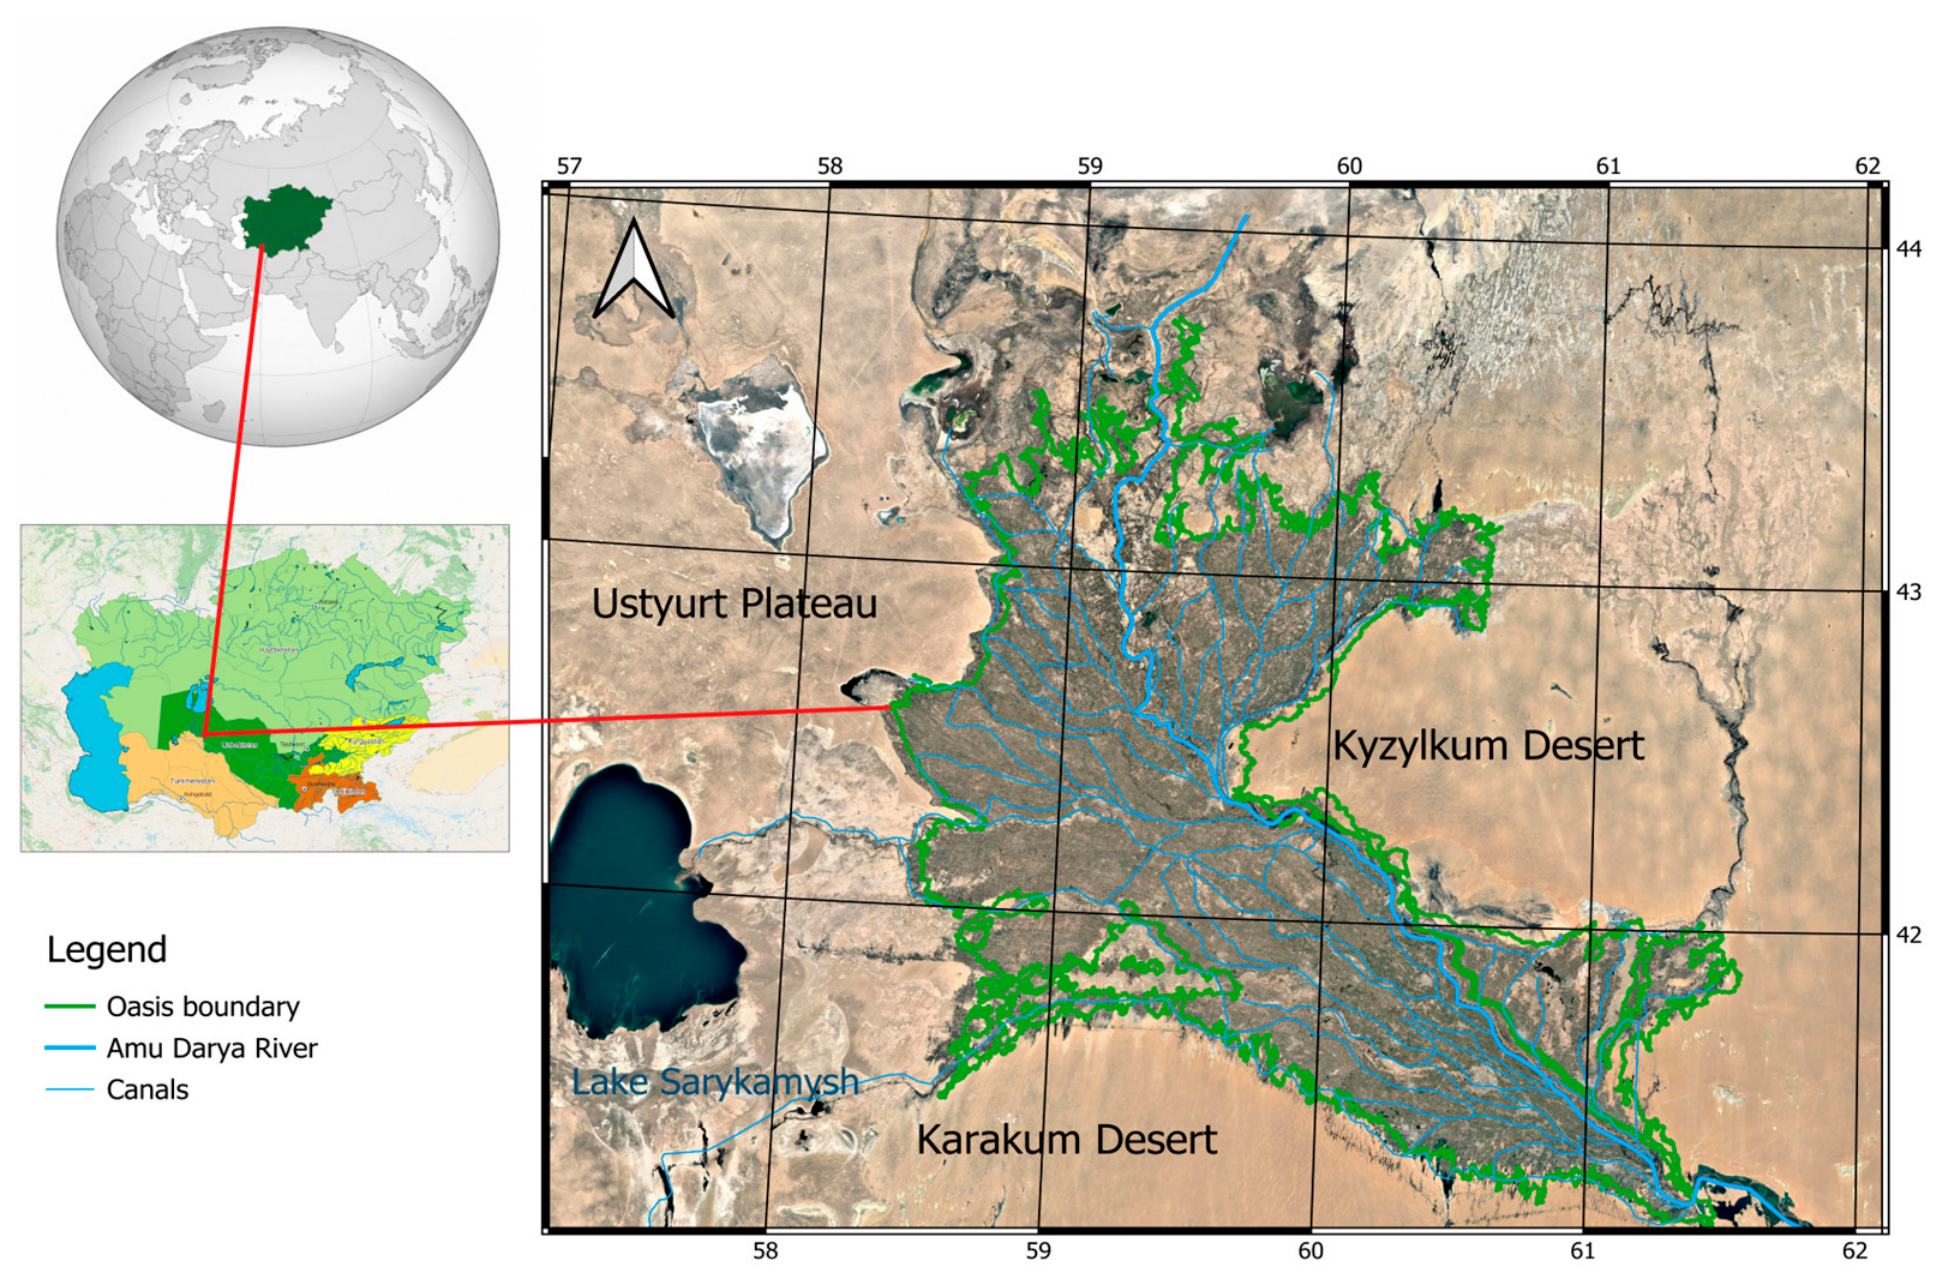
This research was conducted in the Khorezm Oasis, situated in the northwestern part of Uzbekistan between 41°08′ and 43°44′ N latitude and 58°17′ and 61°30′ E longitude. The total area of the oasis is approximately 31,885.41 km2 [26]. It encompasses the entire Khorezm Region of the Republic of Uzbekistan and almost all irrigated agricultural lands of the Republic of Karakalpakstan and the Dashoguz part of Turkmenistan. The oasis is bordered by the Karakum Desert to the south, the Kyzylkum Desert to the north and east, and the Ustyurt Plateau to the west. The northern boundary of the oasis adjoins the desiccated areas of the former Aral Sea (Figure 1). Geologically, the Khorezm Oasis was formed as a result of the accumulation of alluvial sediments deposited by the Amu Darya River.
Figure 1.
Geographical location of the Khorezm oasis.
The geographical location of the Khorezm Oasis contributes to its low annual precipitation, averaging approximately 92 mm, and to high diurnal temperature amplitude. The mean annual air temperature reaches about +28 °C, while the absolute minimum recorded as −32 °C [27]. The predominant soil types in the Khorezm Oasis include irrigated alluvial-meadow, saline (solonchak), takyr, and sandy soils, all characterized by relatively low natural fertility. The entire area is covered by a dense network of interconnected irrigation and drainage canals, hydraulically connected to the Amu Darya River. Numerous small saline lakes have formed in local relief depressions due to a shallow GW table. The saline drainage water is collected by the southern main drainage named “Do’stlik”, which flows toward Lake Sarykamysh.
The vegetation type and cover vary depending on soil characteristics, the availability of irrigation and GW, and, most importantly, the intensity of anthropogenic activities across the area. The dominant vegetation consists mainly of agricultural crops and orchards. Degraded tugai (riparian) forests occur along the Amu Darya River and around some lakes, while shrub communities and salt-tolerant grasses are found in non-agricultural zones. In contrast, desert-adapted vegetation is widely distributed in the transitional areas between irrigated lands and surrounding deserts.
The study area is characterized by high spatial heterogeneity, comprising approximately 30 distinct LULC classes. Despite this diverse landscape mosaic, the region is historically and ecologically recognized as being highly susceptible to severe desertification processes. Agricultural lands located on sandy soils are particularly vulnerable, especially during drought-affected years and under the influence of anthropogenic activities such as grazing by sheep and other livestock, and cutting shrubs for firewood. This area was selected for study due to its high vulnerability to desertification, driven by its arid climate, frequent droughts, and unsustainable human activities.
2.2. Data
Landsat 5 TM, Landsat 7 ETM+, and Landsat 8 OLI/TIRS products were used to generate annual mean LST and NDVI data for the period 2000–2023 using the Climate Engine platform [28]. Both LST and NDVI products were converted to 30 m spatial resolution to facilitate calculations, and the data have a 26-day temporal resolution.
The climatic variables, including annual mean precipitation, annual mean maximum air temperature, and annual mean wind speed, were sourced from the WorldClim v2.1 dataset [29] at an initial spatial resolution of 30 arc-seconds (~1 km2). To ensure spatial consistency with the other high-resolution environmental datasets and multispectral imagery used in this study, these climate surfaces were resampled to a 30 m resolution within the ArcMap environment. This was achieved using the Bilinear Interpolation method, selected to maintain a smooth, continuous climatic surface across the Khorezm oasis.
Annual mean GW datasets were compiled from the ZEF/UNESCO project (1990–2004) and hydrogeological stations’ records in Khorezm and Karakalpakstan (2018–2021). Here, the long-term mean values were utilized to represent the characteristic hydrogeological state of the study area. This approach minimizes the impact of short-term seasonal fluctuations and provides a stable proxy for the regional groundwater table depth.
Point-based measurements were processed in ArcMap and transformed into 30 m resolution raster layers using the Inverse Distance Weighting (IDW) interpolation method. This specific algorithm was selected because it demonstrated superior predictive accuracy during preliminary testing against independent validation points, providing a more reliable representation of the spatial variability across the study area.
The NDESI was computed through the Google Earth Engine (GEE) platform (https://code.earthengine.google.com/0dd631b64890c29668abed06732124bd?noload=true; accessed on 28 March 2026) using Sentinel 2A/B products for the 2019–2023 years. While this timeframe is relatively recent, the 10 m spatial resolution provided by the Sentinel-2 A/B constellation is critical for a high-fidelity assessment of contemporary desertification patterns. The NDESI was derived according to the following equation:
where Band2 corresponds to the reflectance of Band 2 (Blue, ~490 nm), Band7 represents Band 7 (Red Edge, ~783 nm), Band11 denotes Band 11 (Shortwave Infrared 1, ~1610 nm), and Band12 refers to Band 12 (Shortwave Infrared 2, ~2190 nm).
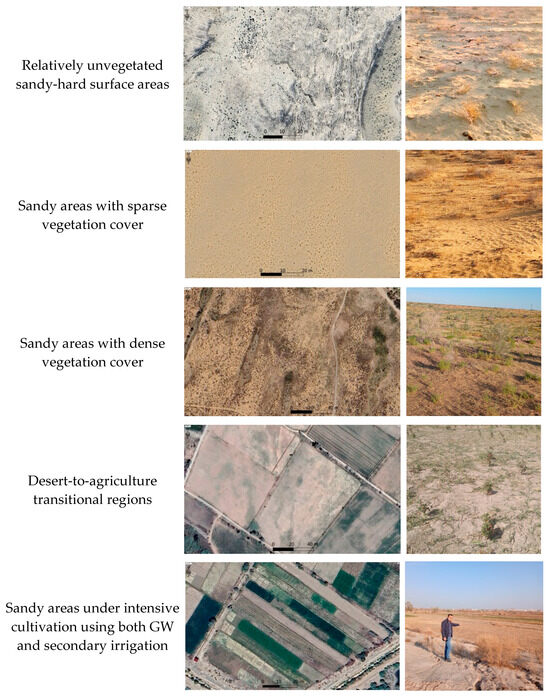
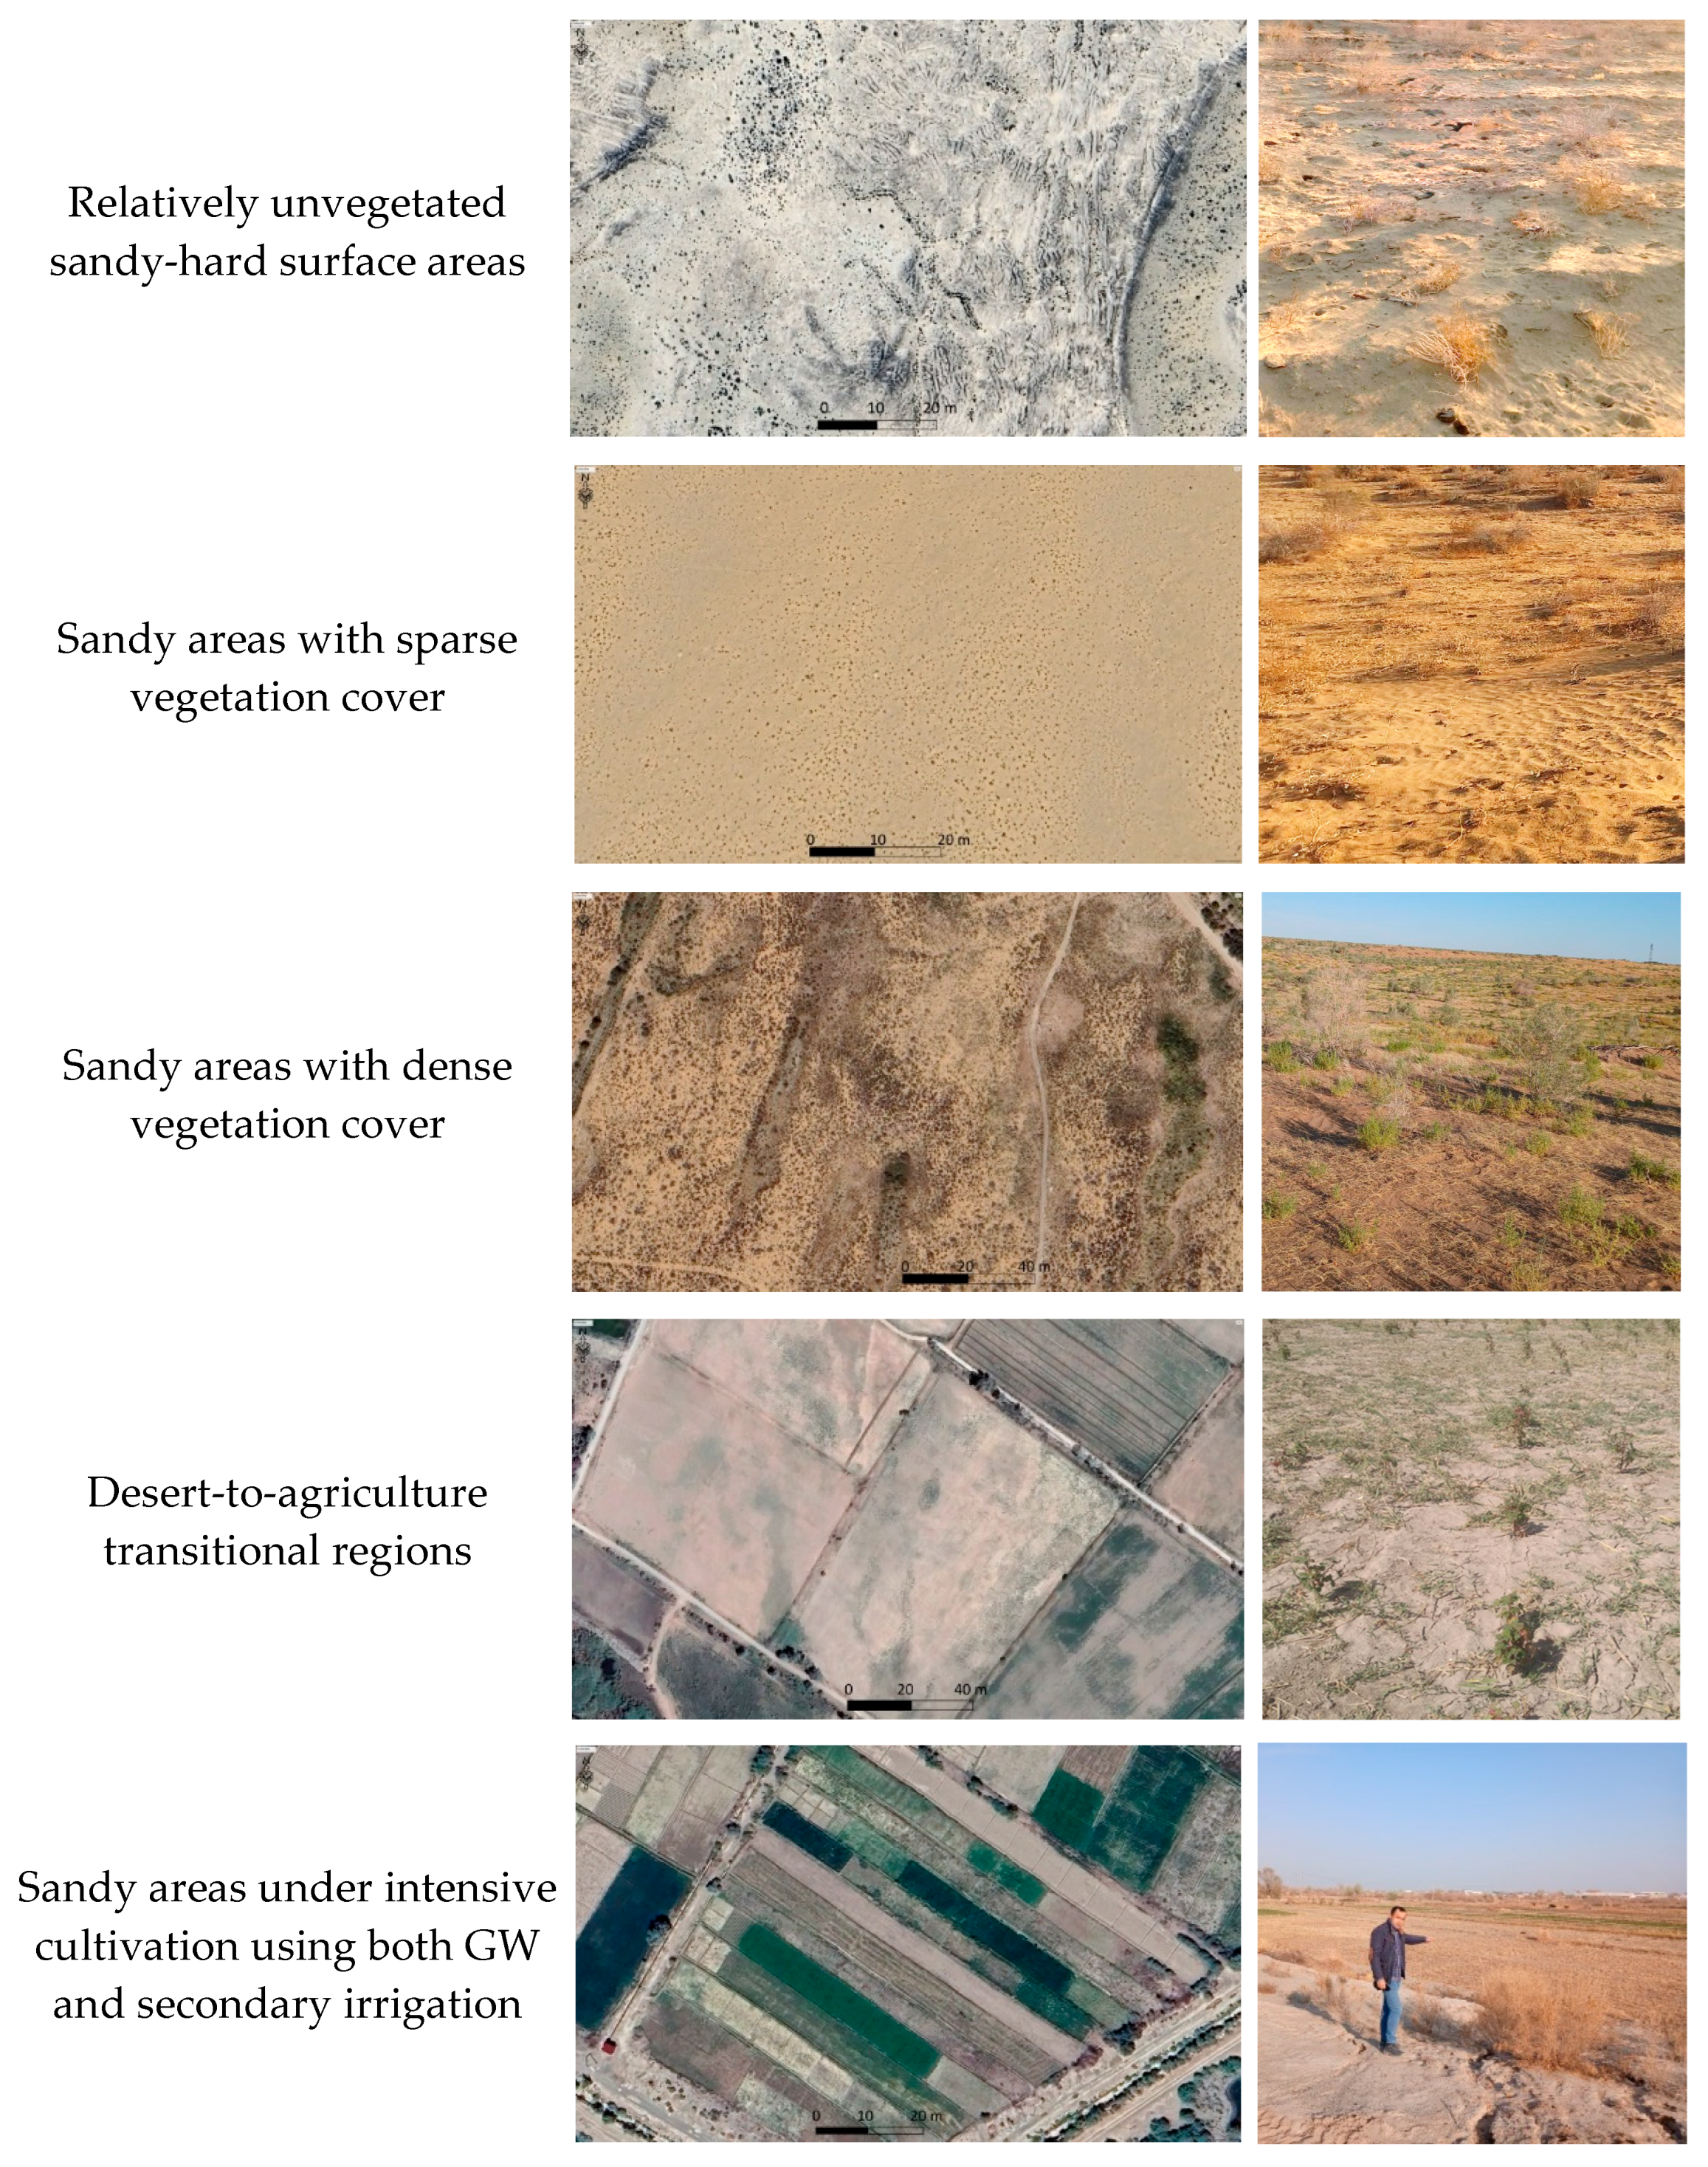
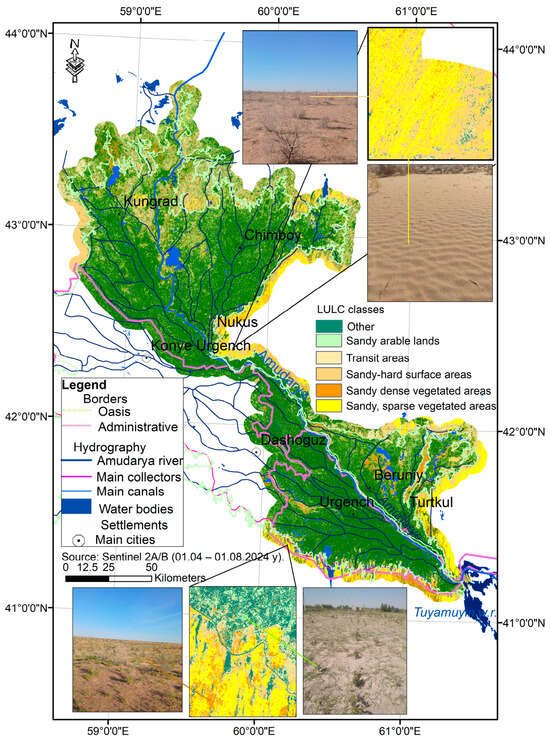
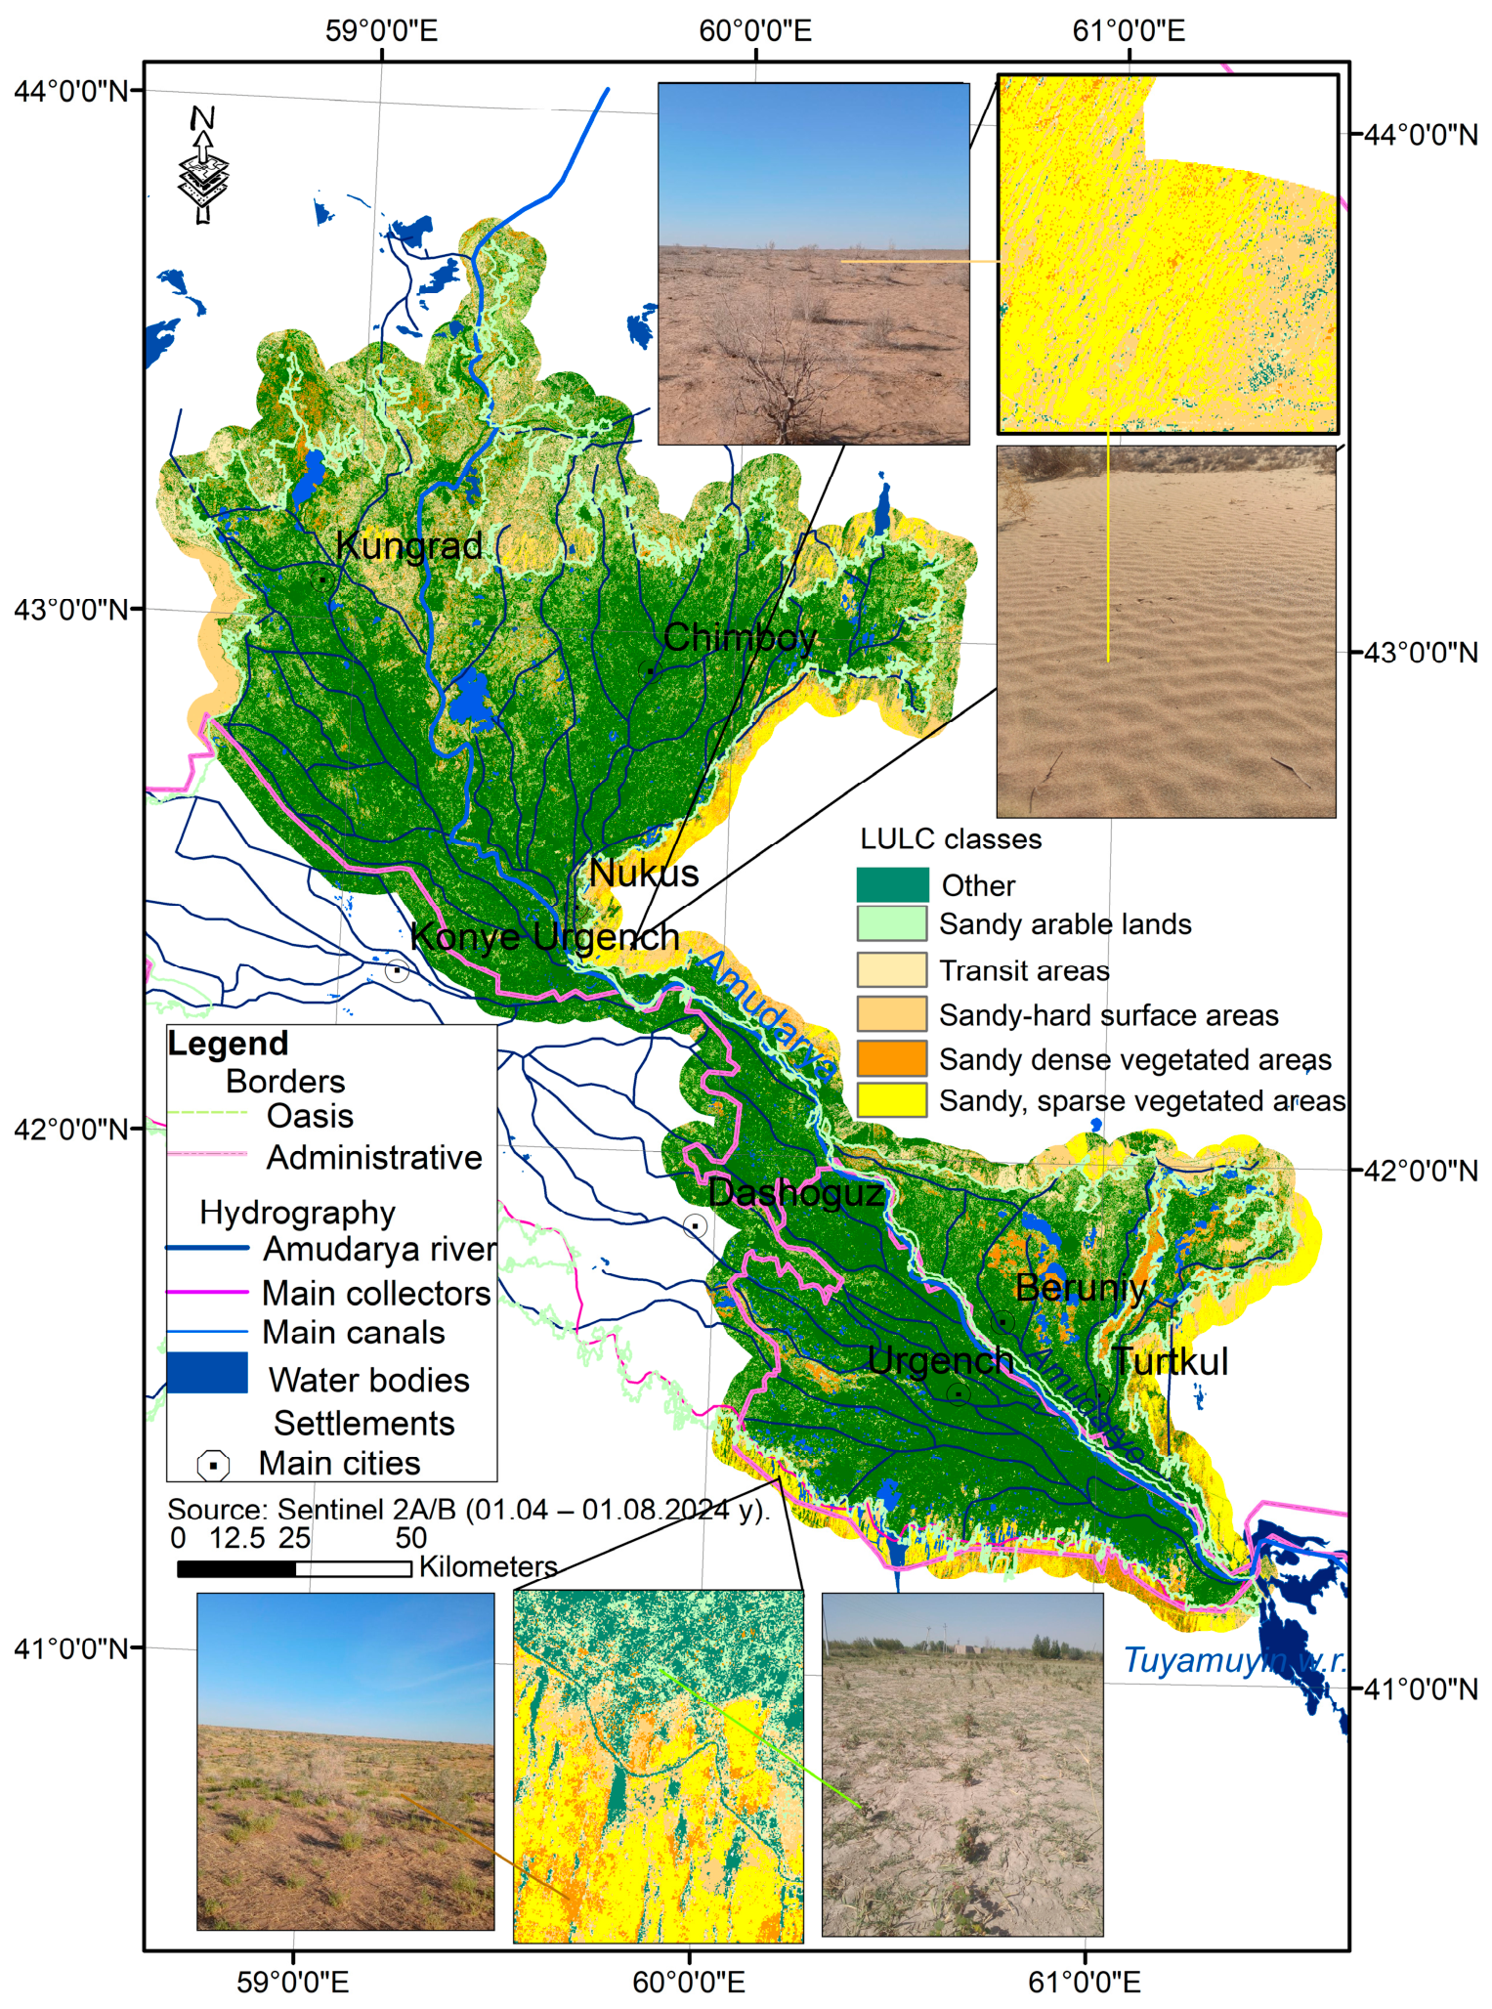
Threshold values for shifting sand detection (0.36–0.45) were established utilizing in situ observations and ground-truth verification conducted within the Karakum and Kyzylkum deserts in June 2023. These empirical parameters were specifically calibrated to ensure the accuracy of the desertification mapping in the study region. Nevertheless, these thresholds produced classification ambiguities within oasis regions, where bare soil and rigid (impervious) surfaces with little or no vegetation were erroneously detected as sand. Therefore, LULC classification was incorporated into the workflow to exclude non-sandy pixels and reduce misclassification. The following five sand-related LULC categories were identified as the primary desert-associated classes: (i) sparsely vegetated sandy-hard surfaces; (ii) sandy areas with low-density vegetation; (iii) sandy areas with high-density vegetation; (iv) desert-to-agriculture transitional zones; and (v) sandy areas under intensive cultivation (Figure 2). The decision tree classification algorithm was applied through the GEE platform (https://code.earthengine.google.com/52b20b7f1178504a16bb5089b03bfd8f?noload=true; accessed on 28 March 2026) using Sentinel-2A/B imagery for the period 1 June–1 August 2022.
Figure 2.
Sand-related LULC; field observation points.
All erroneously detected pixels were retained for the selected LULC classes, while pixels belonging to all other classes were set to null. Residential areas and cities were also excluded using high-resolution maps and validated through manual field surveys, except for those situated within sandy landscapes. The NDESI dataset was likewise converted to a 30 m spatial resolution. Soil texture class products based on the United States Department of Agriculture (USDA) system, obtained from the International Soil Reference and Information Centre (ISRIC) Data Hub [30] for the 0 and 5 cm soil layers, were averaged. The K-factor was subsequently adjusted to local soil texture conditions and resampled to a 30 m spatial resolution. A 5 km buffer was applied around the oasis boundary to reflect its dynamic nature and facilitate a detailed analysis of desertification trends in the adjacent transition zone.
2.3. Methodology
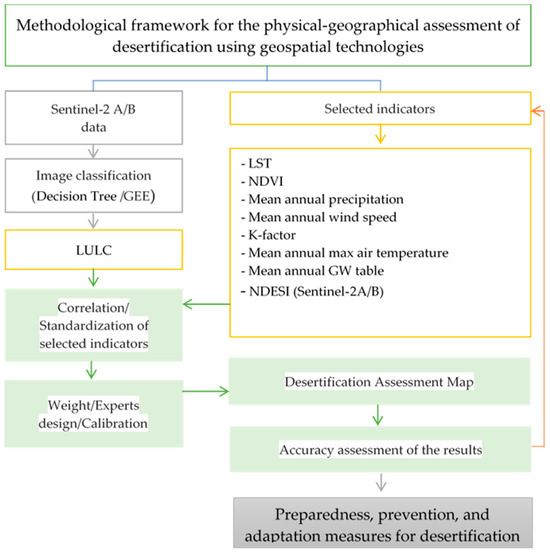
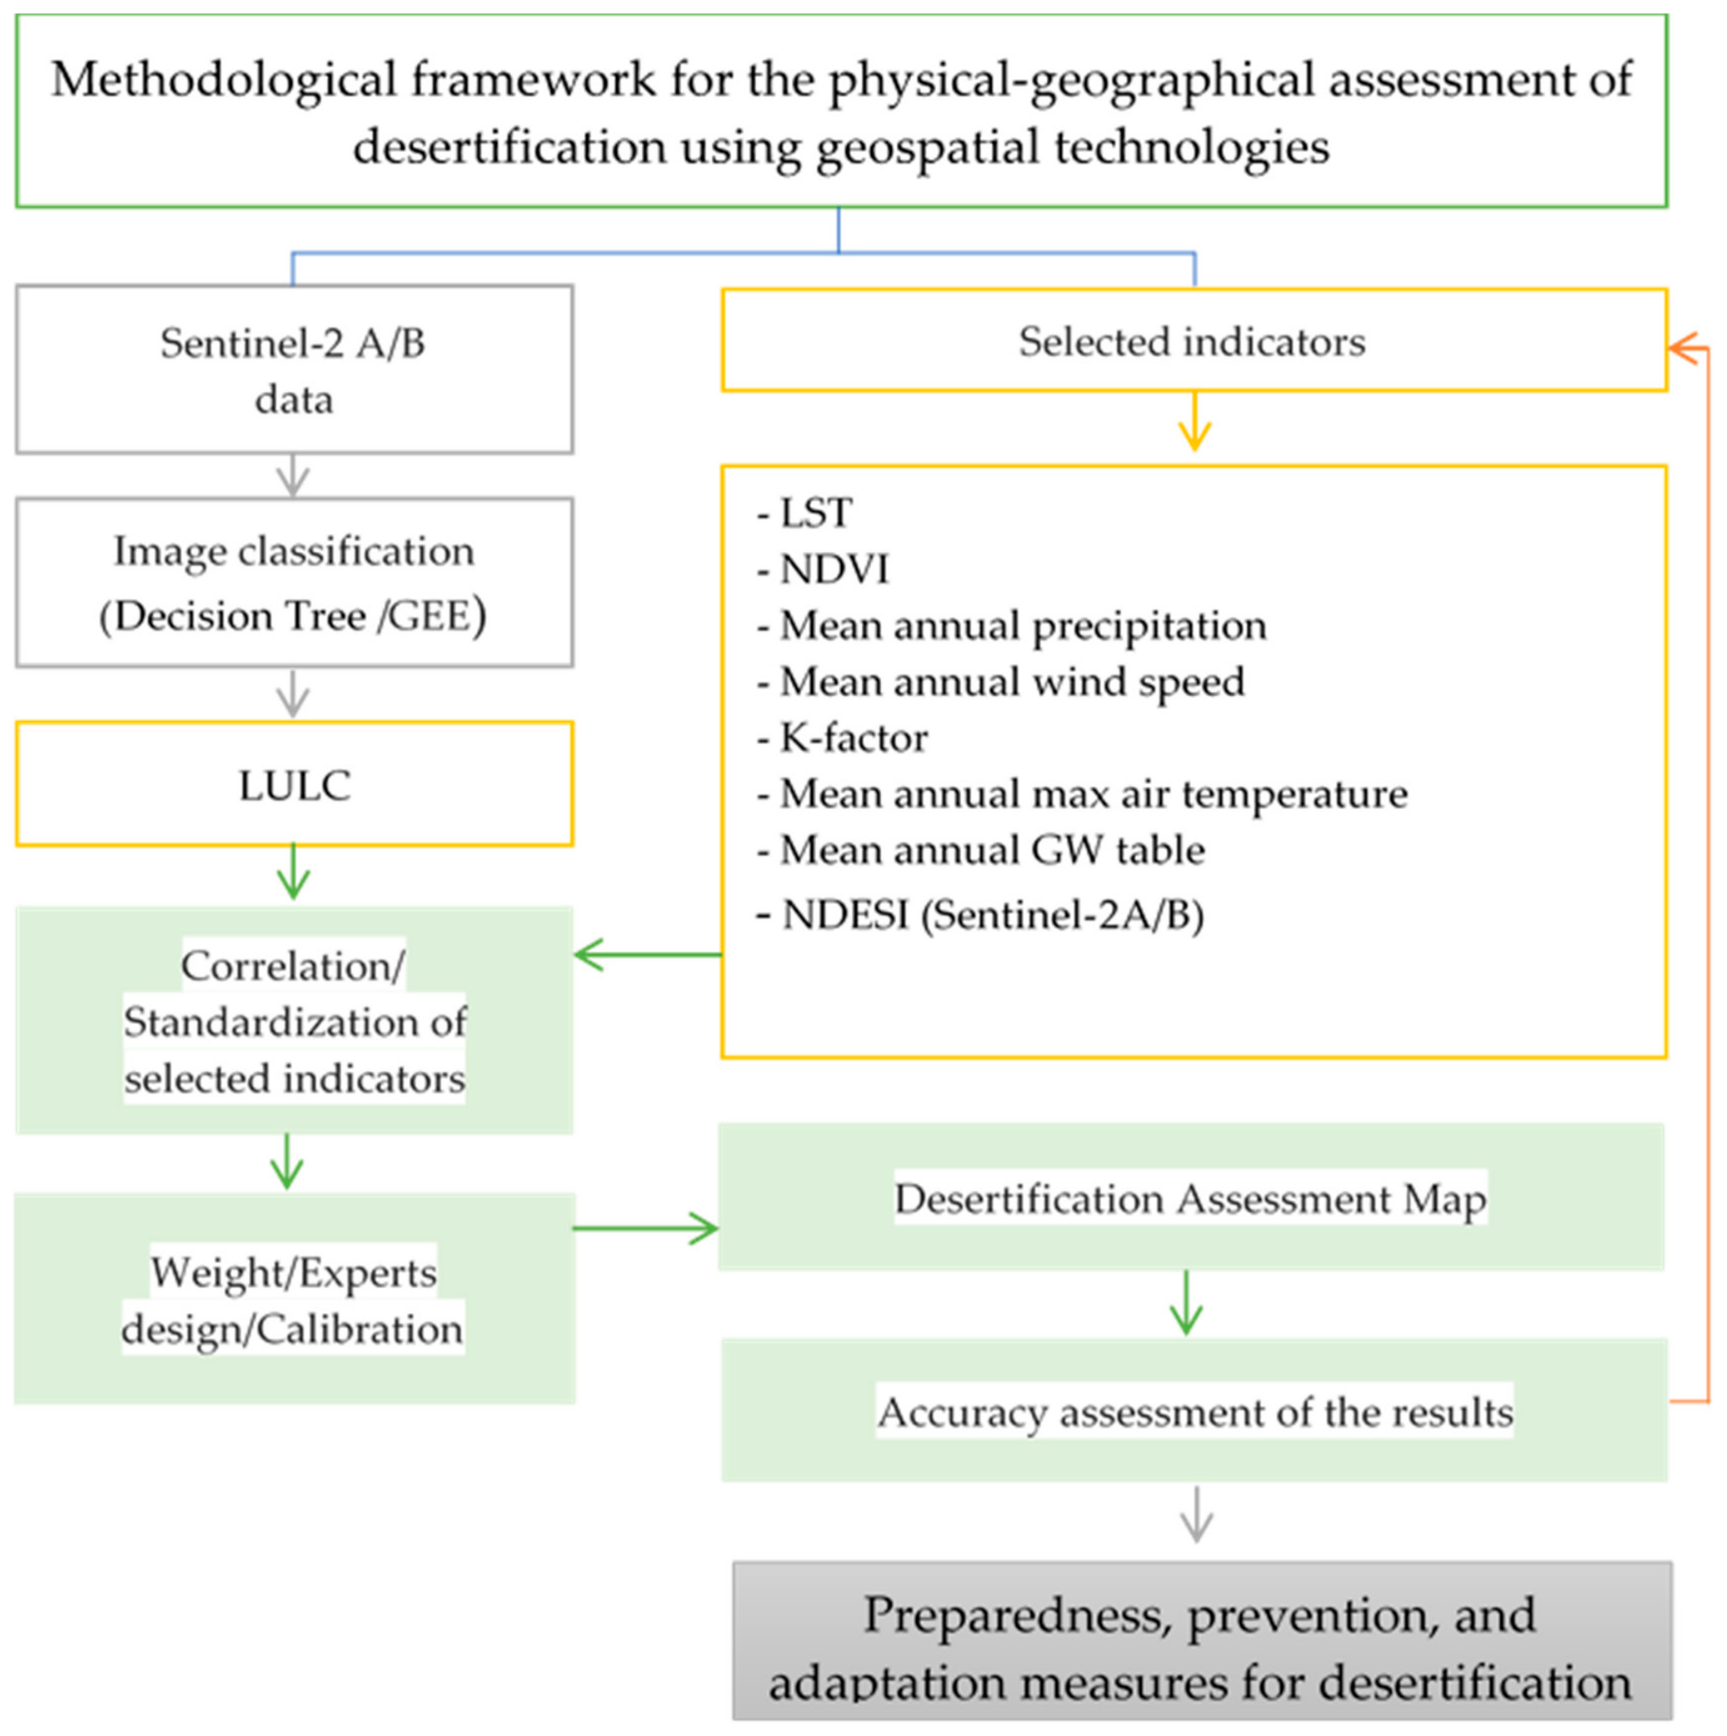
Because desert morphologies vary significantly, desertification safety assessments require region-specific methodologies. Accordingly, the methodological framework for assessing desertification safety levels in the Khorezm region is presented in Figure 3.
Figure 3.
Flowchart of the methodology applied in this research.
A total of 500 random points were generated (using the Arc Map Data Management → Sampling → Create Random Points tool) to perform the Pearson correlation analyses among the selected indicators to evaluate linear relationships, which maintained a minimum separation distance to mitigate the impact of spatial autocorrelation. A sample size of n = 500 was selected to ensure a representative distribution across the diverse biophysical gradients of the study area, providing sufficient statistical power to validate the relationships between climatic, edaphic, and vegetative indicators. Preliminary spatial analysis using Global Moran’s I indicated significant clustering (p < 0.01) for primary variables such as LST and NDVI. This clustering is consistent with the distinct ecological zonation (oasis vs. desert) characteristic of the irrigated oasis. By utilizing this robust sampling density, the approach successfully captures the regional trends and inter-dependencies required for an accurate desertification vulnerability assessment while ensuring that the individual observations remain statistically independent.
Hotspot analysis was conducted using the Getis-Ord Gi* statistic [31] to identify statistically significant spatial clusters of high and low values. The analysis utilized a fixed distance band to understand the spatial relationship. The results were compared with the annual-mean raster datasets for the selected indicators to clarify the underlying drivers of the observed correlations. These results helped to explain why lower correlation values occurred under specific conditions that were expected to be theoretically interrelated.
The selected indicators were resampled to a 30 m spatial resolution; they retain disparate measurements in dimensions. Thus, standardization equations are required to rescale these values to a 0–1 range. In accordance with Mao [32], specific Equations (2) and (3) were utilized based on whether the indicators exert a positive or negative influence on the phenomenon being assessed.
where the indicator i is expressed as a standardized value (vᵢ), where xᵢ represents the original value, xᵢₘₐₓ is the maximum value, and xᵢₘᵢₙ is the minimum value.
Several geospatial assessment methods have been employed to evaluate desertification hazard and territorial safety. Some approaches rely on spectral indices derived from satellite imagery, such as NDSI, NDESI, NDSLI, and DDI, as well as time-series modeling like SARIMA [9,10,11,12,33]. Other works utilize Multi-Criteria Decision-Making (MCDM) frameworks [34]. The MEDALUS model has proven highly effective for desertification assessment in the Mediterranean region [35,36], while region-specific frameworks such as IMDPA and ESA are also frequently applied [37]. The MCDM approach is particularly useful when multiple indicators influence a selected phenomenon at different levels. The weights of the selected indicators can be determined using various methods, including expert judgment, the Analytic Hierarchy Process (AHP), entropy, Criteria Importance Through Intercriteria Correlation (CRITIC), Principal Component Analysis (PCA), and others. Helene-Marie et al. [38] provided a comprehensive discussion of the advantages and limitations of several key methods. Given the unique physical and geographical characteristics of the oasis in this study, the MCDM approach was adopted. Furthermore, NDESI and LULC data were integrated as independent indicators, significantly enhancing the detection and mapping of desertification-prone areas.
In this study, the weighting of environmental variables was determined using an integrated expert calibration approach. Initially, weights were assigned on a scale of 1–9 based on a synthesis of Pearson correlation analysis, Getis-Ord Gi* Hotspot identification, and the specific physical-geographical conditions of the Khorezm Oasis (Table 1). This initial assessment accounted for non-linear interactions between variables; for instance, while air temperature is a fundamental driver of aridity, its localized impact is significantly mitigated by the prevalence of flood irrigation. Consequently, indicators such as the NDVI, which reflect the direct impact of agricultural practices, were assigned higher relative weights due to their stronger empirical link to desertification processes in this specific anthropogenic landscape.
Table 1.
Assigned weights of the selected indicators based on annual mean values.
The final desertification safety level was assessed using the Weighted Sum Model (WSM) according to Equation (4):
where V is the overall score, Wi—is the weight of the i-th indicator, Xi—is the normalized value of the i-th indicator.
To ensure the thematic accuracy of the desertification safety levels, a total of 74 reference points were utilized for validation. The sampling design followed a stratified approach to ensure equal representation across all desertification sensitivity classes.
The dataset comprises 59 field observation points and 15 high-resolution virtual reference points derived from Google Earth Pro. Of the field-based samples, 55 points located in the Khorezm region were monitored longitudinally over a 14-year period during the peak growing months (May–July) for various environmental assessments. The remaining 19 points (4 field observations and 15 high-resolution image references) were situated in the Karakalpakstan region. Due to the logistical constraints of the remote terrain in Karakalpakstan, high-resolution satellite imagery was used as a robust alternative to physical site visits, consistent with established remote sensing validation protocols. Representative examples of these field validation points are illustrated in Figure 2.
To mathematically validate the spatial robustness of the developed multi-criteria framework, a spatial overlay and intersection analysis was executed between these multi-temporal ground-truth reference points and the derived ecological safety zones. The empirical validation demonstrated high spatial correspondence accuracy, ranging from 88% to 91%. Critically, field-verified reference points representing “Sandy areas with sparse vegetation cover” and “Relatively unvegetated sandy-hard surface areas” fell consistently and systematically within the “Very high-dangerous” zones. This strong spatial correlation substantiates the empirical reliability of the assigned criteria weights, rendering probabilistic validation methods, such as the Receiver Operating Characteristic (ROC) curve, methodologically redundant for this deterministic framework. Structurally, the threshold values defining each ecological safety level were established based on baseline LULC classes. A marginal error rate of 9% to 12% was identified, which is primarily attributed to localized environmental and hydro-meteorological anomalies arising from the comparison of long-term annual mean baseline values against the specific eco-hydrological conditions of the oasis captured in the year 2023.
3. Results
3.1. Correlation Analysis
To assess the internal consistency and potential redundancy of the spatial model, a Pearson correlation analysis was performed on 500 randomly distributed sample points (calculated from the variables described in Table 2). The results indicate that most indicators are statistically independent or exhibit only weak-to-moderate correlations, justifying their inclusion in the desertification assessment.
Table 2.
Correlation analysis of annual mean desertification-related indicators.
A highly significant inverse relationship was identified between LST and NDVI (r = −0.820, p < 0.01), consistent with the biophysical cooling effect of healthy vegetation in arid oasis ecosystems. Additionally, the moderate positive correlation between precipitation and wind speed (r = 0.600, p < 0.0$) reflects the region’s seasonal atmospheric dynamics. Low correlation coefficients between factors such as the K-factor and wind speed (r = −0.007) suggest that edaphic and climatic drivers operate independently within the study area. Overall, the statistical significance of these relationships (p < 0.05 and p < 0.01) validates that the chosen indicators provide robust, non-random data for delineating desertification vulnerability.
Correlations among the selected indicators help to clarify their influence on desertification processes. In some cases, NDVI is used to assess desertification because it reflects the extent of land degradation in specific areas. However, desertification safety level assessments identify areas where the hazard of desertification is high or low, depending on the combined conditions of influencing factors. Therefore, the following correlation analyses were conducted.
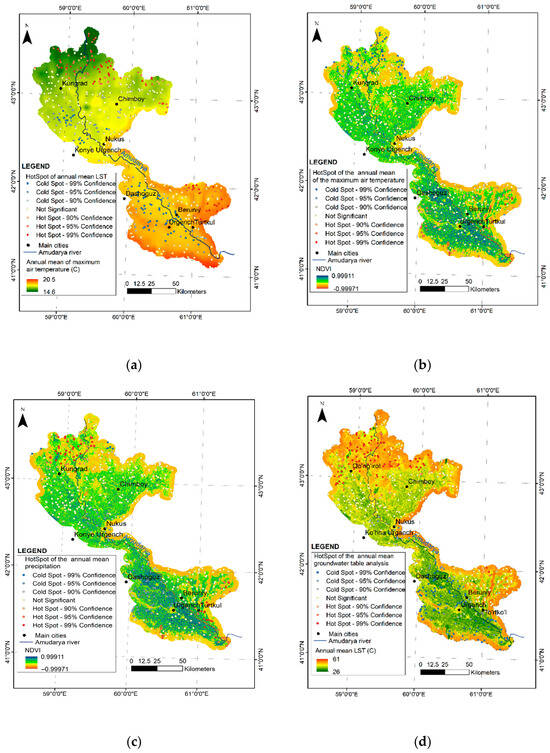
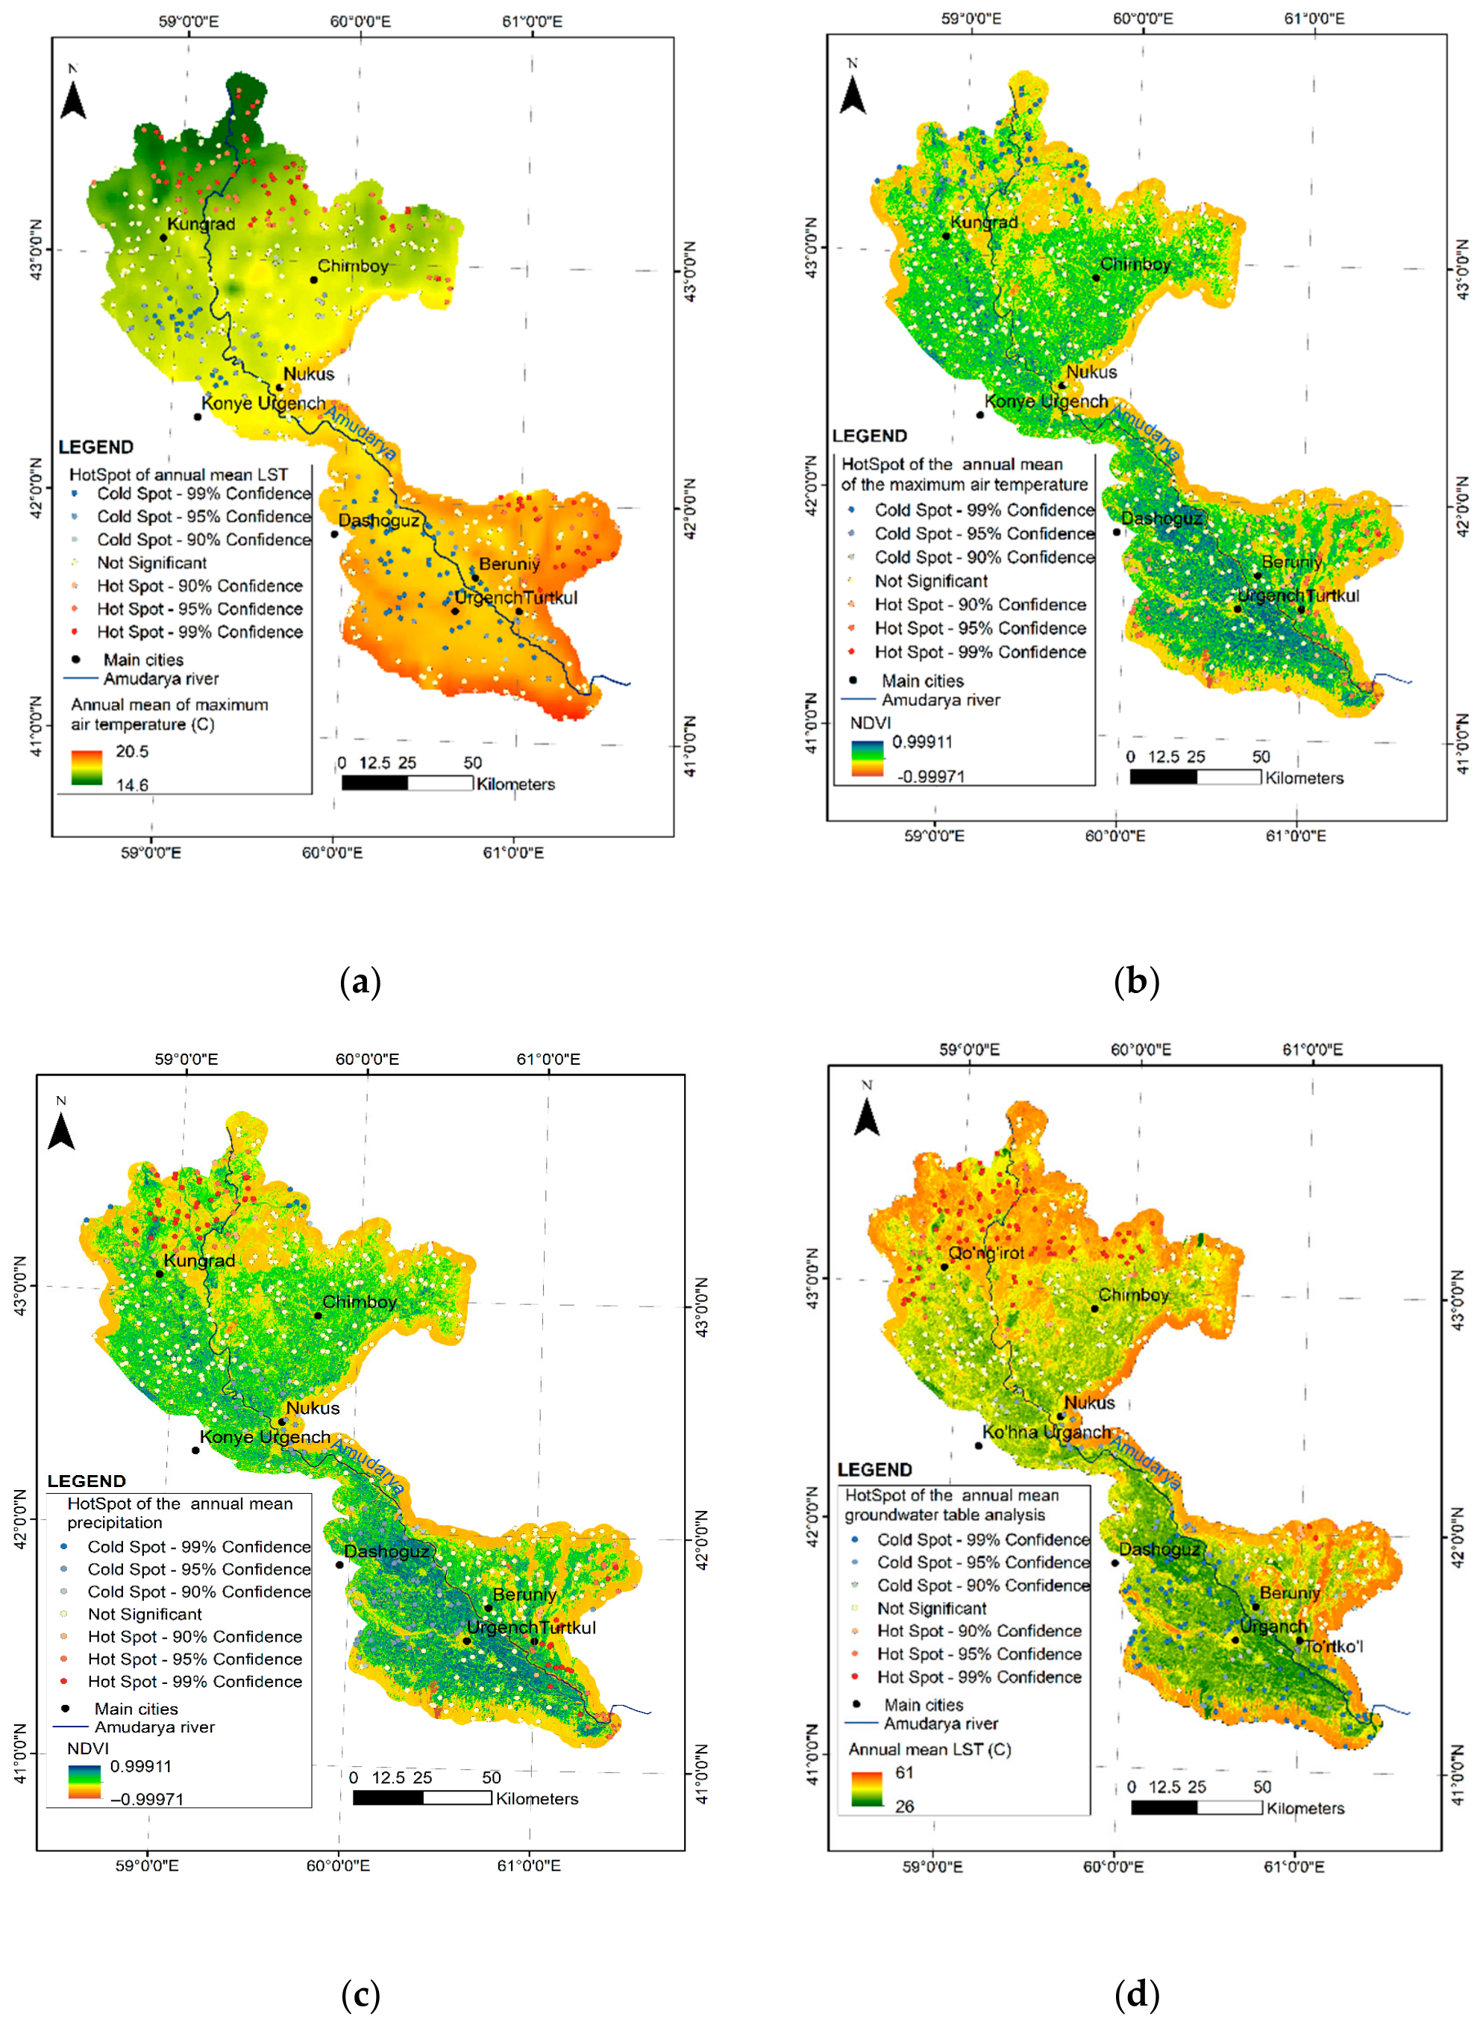
The annual mean LST and annual mean NDVI exhibited a strong negative correlation (r = −0.82) (Table 2). This relationship is expected, as sparsely vegetated areas generally exhibit higher LST values and are less protected from wind activity, making them more susceptible to aeolian processes. No significant correlation was observed between LST and annual mean maximum air temperature, likely due to intensive flood irrigation practices within the oasis (Table 2). However, a comparison of LST Hotspot analysis results and annual mean maximum air temperature revealed clusters of high LST values in areas characterized by high air temperatures, particularly in the northern parts of the To‘rtkul and Beruniy districts within desert–oasis transition zones (Figure 4a). Notably, clusters of high LST values were also detected in areas with relatively lower annual mean maximum air temperatures in the northern parts of the oasis, further indicating that LST is more strongly controlled by LULC characteristics than by air temperature alone. Similar to LST patterns, the distribution of NDVI aligns with annual mean maximum air temperatures in specific sectors (Figure 4b). In the core agricultural regions of the oasis, high NDVI values coincide with peak air temperatures, reflecting the complex interaction between land cover productivity and regional climatic variables. Optimal growth conditions for desert vegetation persist until April and May, when mean maximum temperatures reach 25 °C and annual precipitation averages approximately 12 mm [39]. Subsequent increases in air temperature and LST accelerate evapotranspiration rates, triggering the seasonal senescence of desert grasses.
Figure 4.
Hotspot analysis maps of indicators influencing desertification: (a) Annual mean of maximum air temperature (AMMAT) and Hotspot of LST; (b) Annual mean NDVI and Hotspot of AMMAT; (c) Annual mean NDVI and Hotspot of annual mean precipitation; (d) Annual mean of LST and annual mean GW table.
The correlation between annual mean NDVI and annual mean precipitation was −0.26. As noted, the annual precipitation rate is low, and flood irrigation exerts a greater influence on NDVI within the oasis. Thus, areas with less vegetation exhibit higher clustered values of mean annual precipitation, particularly in the eastern parts of the Turtkul district (Figure 4c).
Flood irrigation plays a significant role in GW recharge within and around the oasis. Areas where the GW table is close to the surface are characterized by dense vegetation cover and low LST values. These zones correspond to transitional desert areas and provide favorable conditions for agricultural activities through the use of secondary and GW resources. Among the analyzed indicators, a weak positive correlation was observed between the mean annual GW table depth and the mean annual LST (Table 2). Theoretically, a stronger correlation would be expected. Therefore, a Hotspot analysis of this indicator was performed and compared with LST raster data, and the results were subsequently validated through field observations. The hot spots, representing areas with a deeper mean annual GW table, were correctly clustered in regions with high LST values, particularly in the northern parts of the oasis located near the Aral Sea (Figure 4d). However, cold spots were also identified in areas exhibiting high LST values in the southern parts of the Khorezm district of the oasis. This pattern was found to be associated with the presence of lakes and wetlands formed by local relief-lowering processes.
Given the low correlation coefficients in Table 2 and the Hotspot analysis results, it was imperative to employ image classification to delineate the land surface’s physical features. This approach facilitates a more nuanced assessment of desertification safety levels. Specifically, intensive agricultural activities—even within desert-to-agriculture transition zones—rely on both GW and secondary irrigation. These human interventions disrupt the theoretical correlations between air temperature, NDVI, LST, and the GW table.
A comparative spatial analysis demonstrates that the distributions of hydromorphic and semi-hydromorphic soils exhibit notable deviations from the baseline LULC maps (Figure 5), specifically beyond transitional and urbanized landscapes.
Figure 5.
Classification of oasis land use and land cover based on desertification vulnerability.
The classification rigor was slightly attenuated in intensively cultivated transition zones, characterized by increased land-cover heterogeneity; nevertheless, the results maintained high reliability with an overall accuracy of 0.87 and a Kappa coefficient of 0.86. Consequently, these classification artifacts were mitigated during the standardization phase by assigning influence values using a six-point ordinal scale (0–5). The severe drought of 2000–2001 triggered a rapid transition of intensive agricultural lands and transitional zones into arid, desertified states.
3.2. Standardization and Assessment
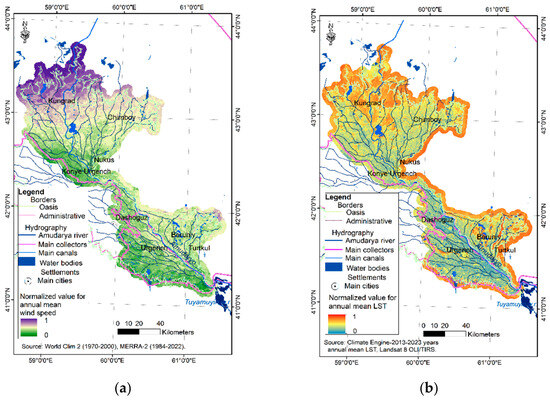
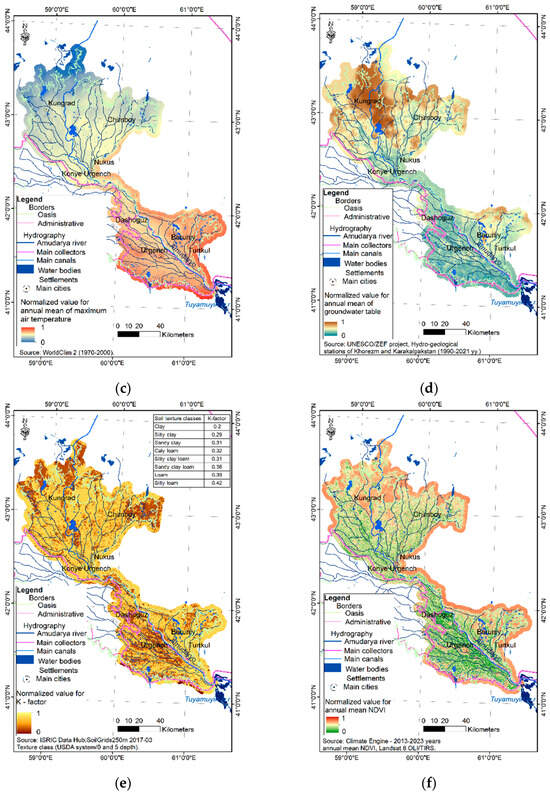
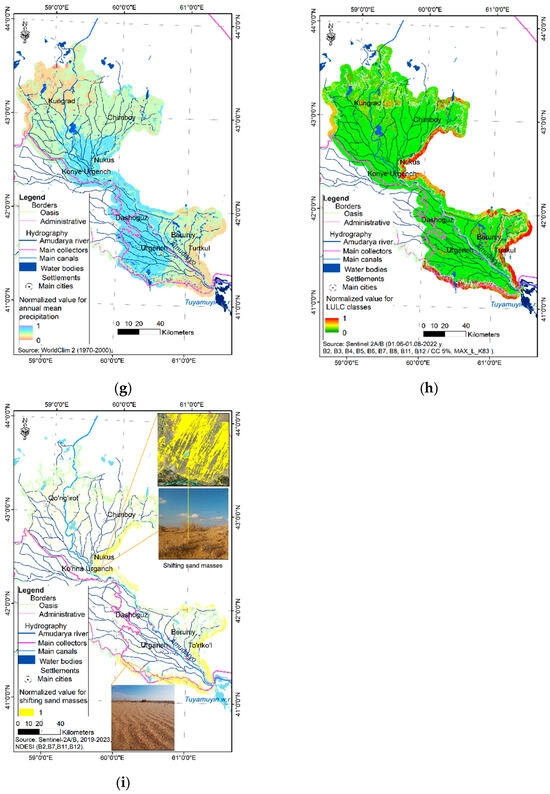
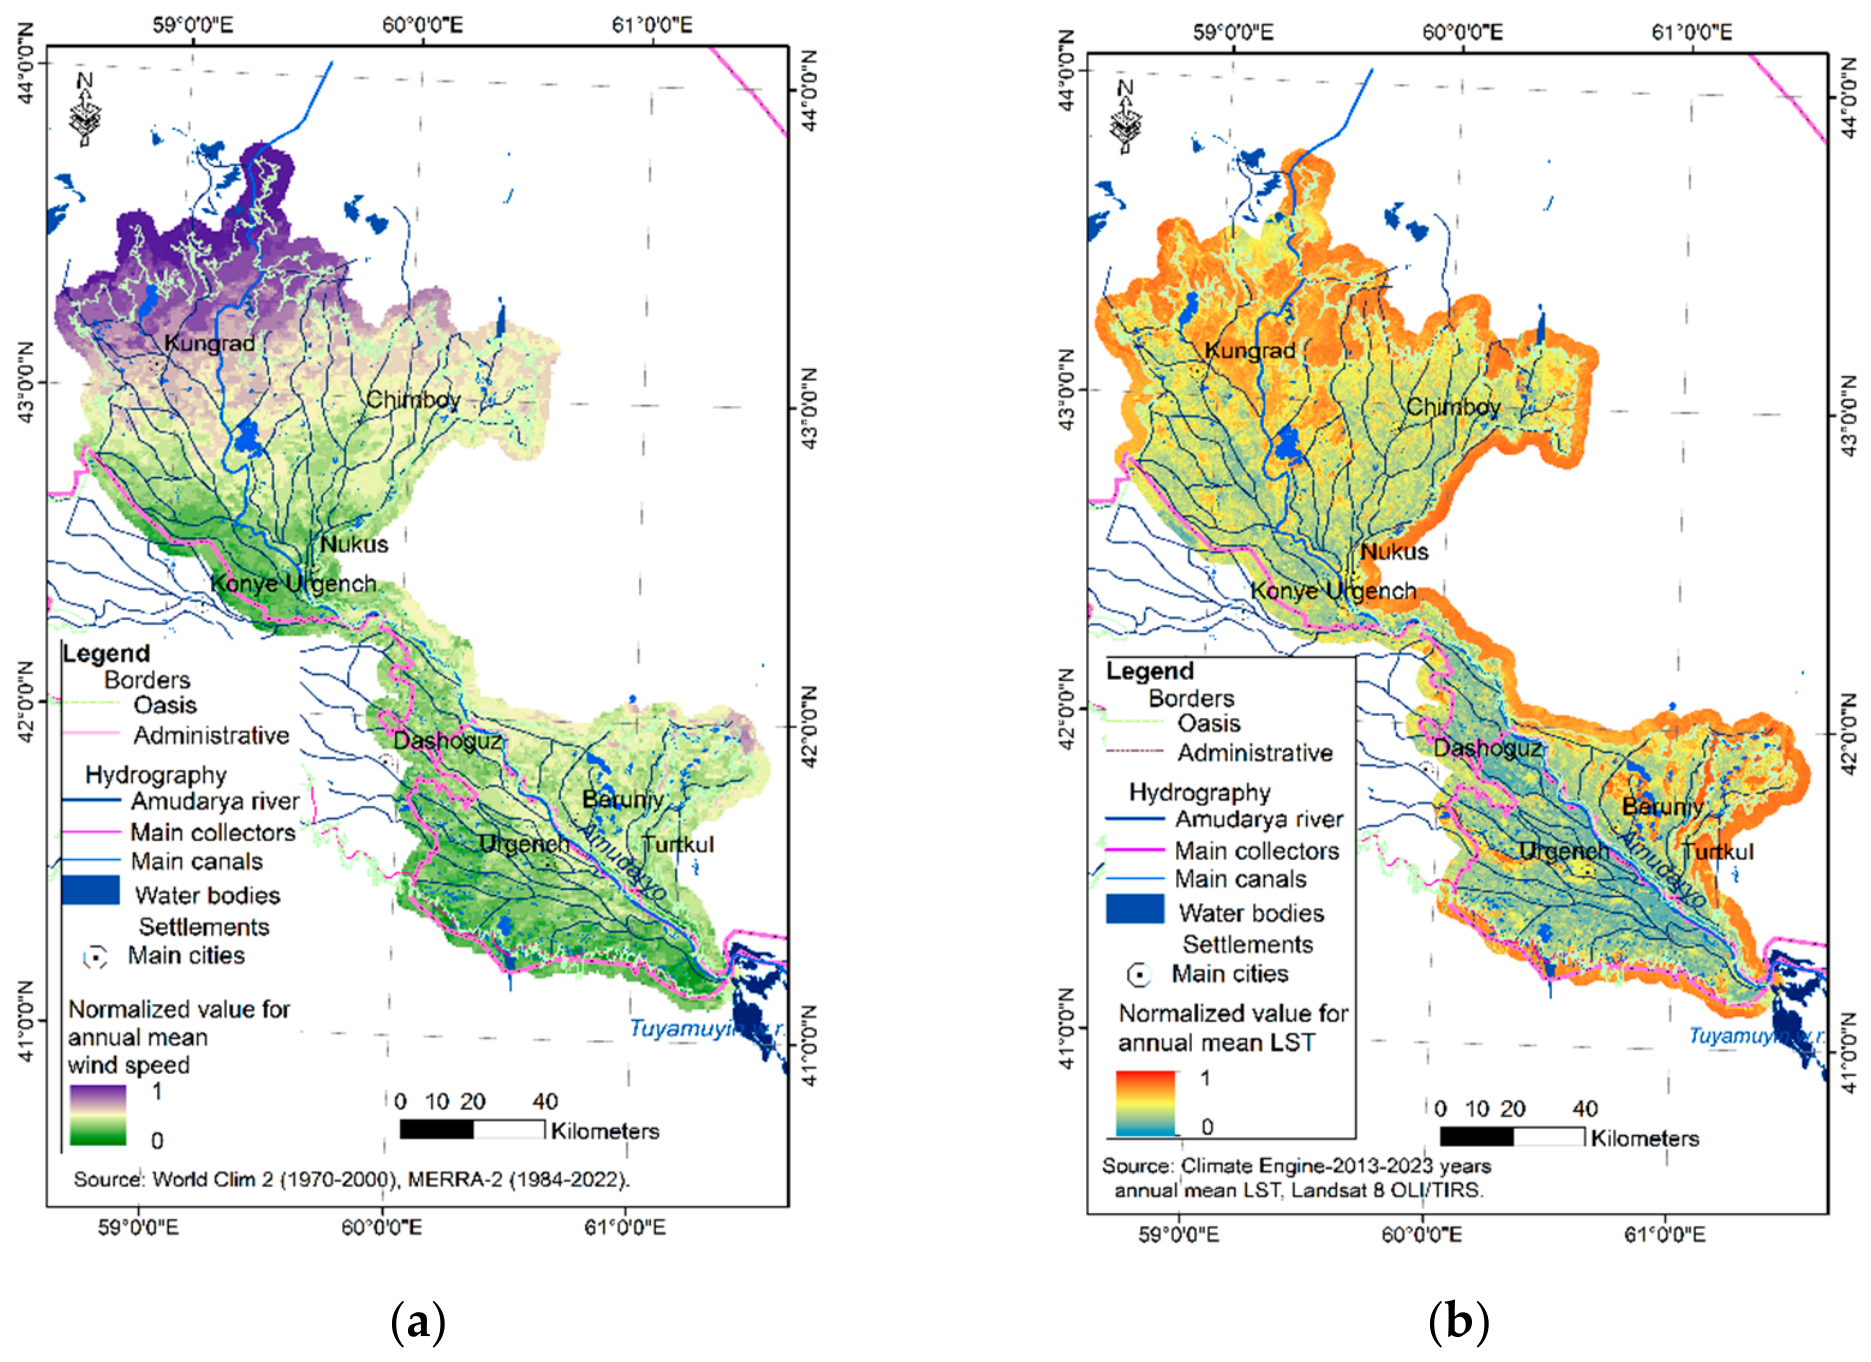
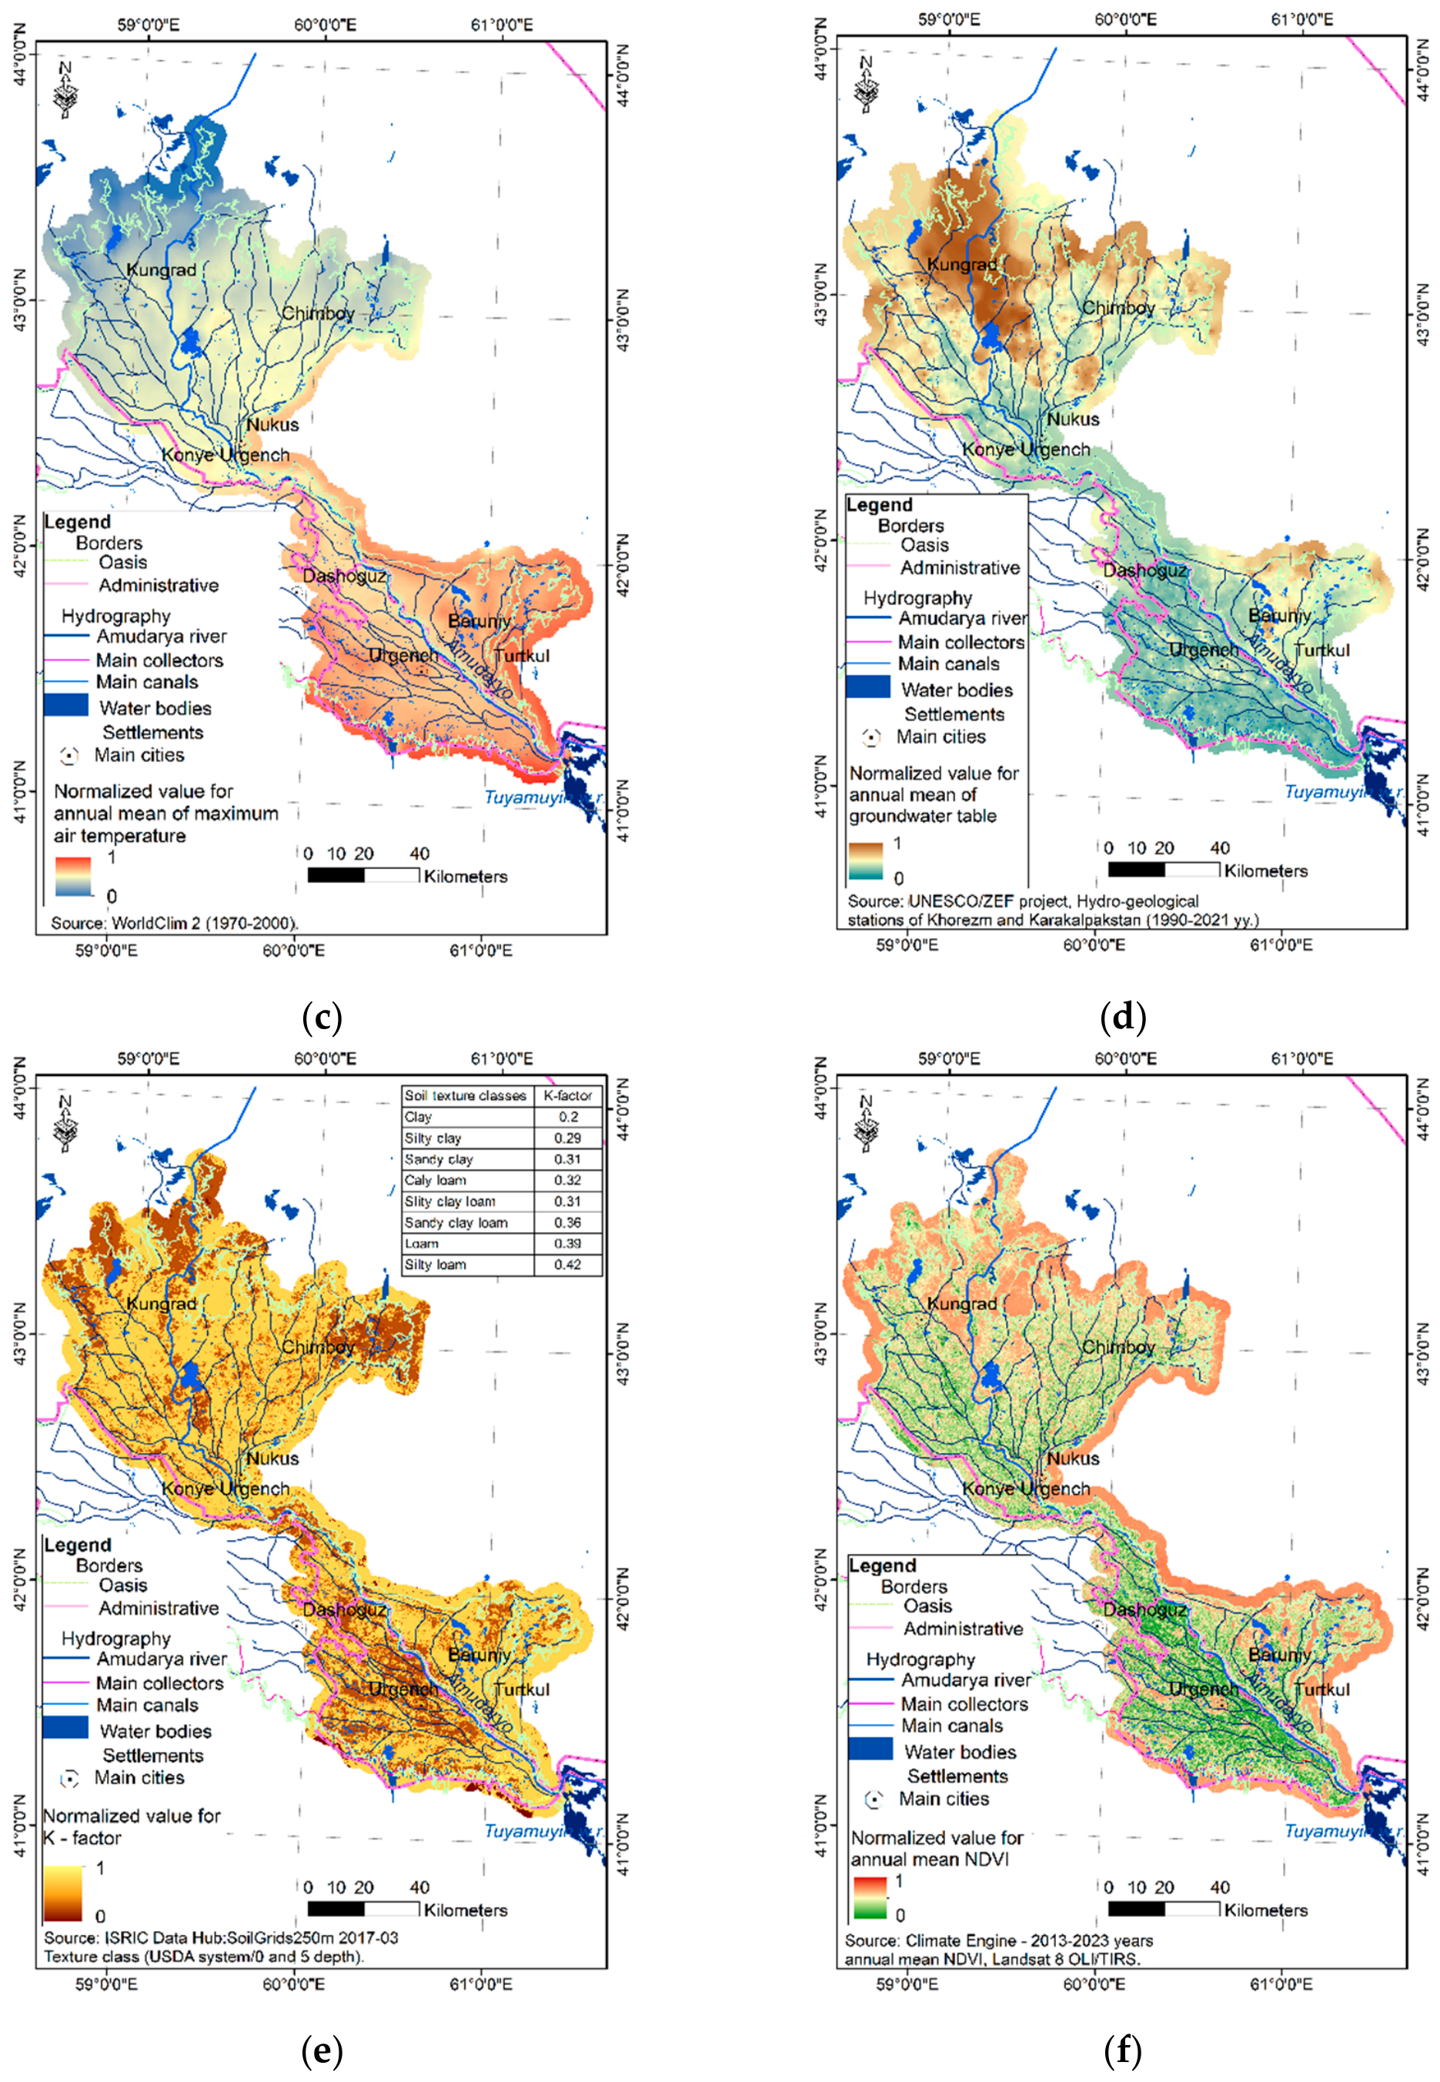
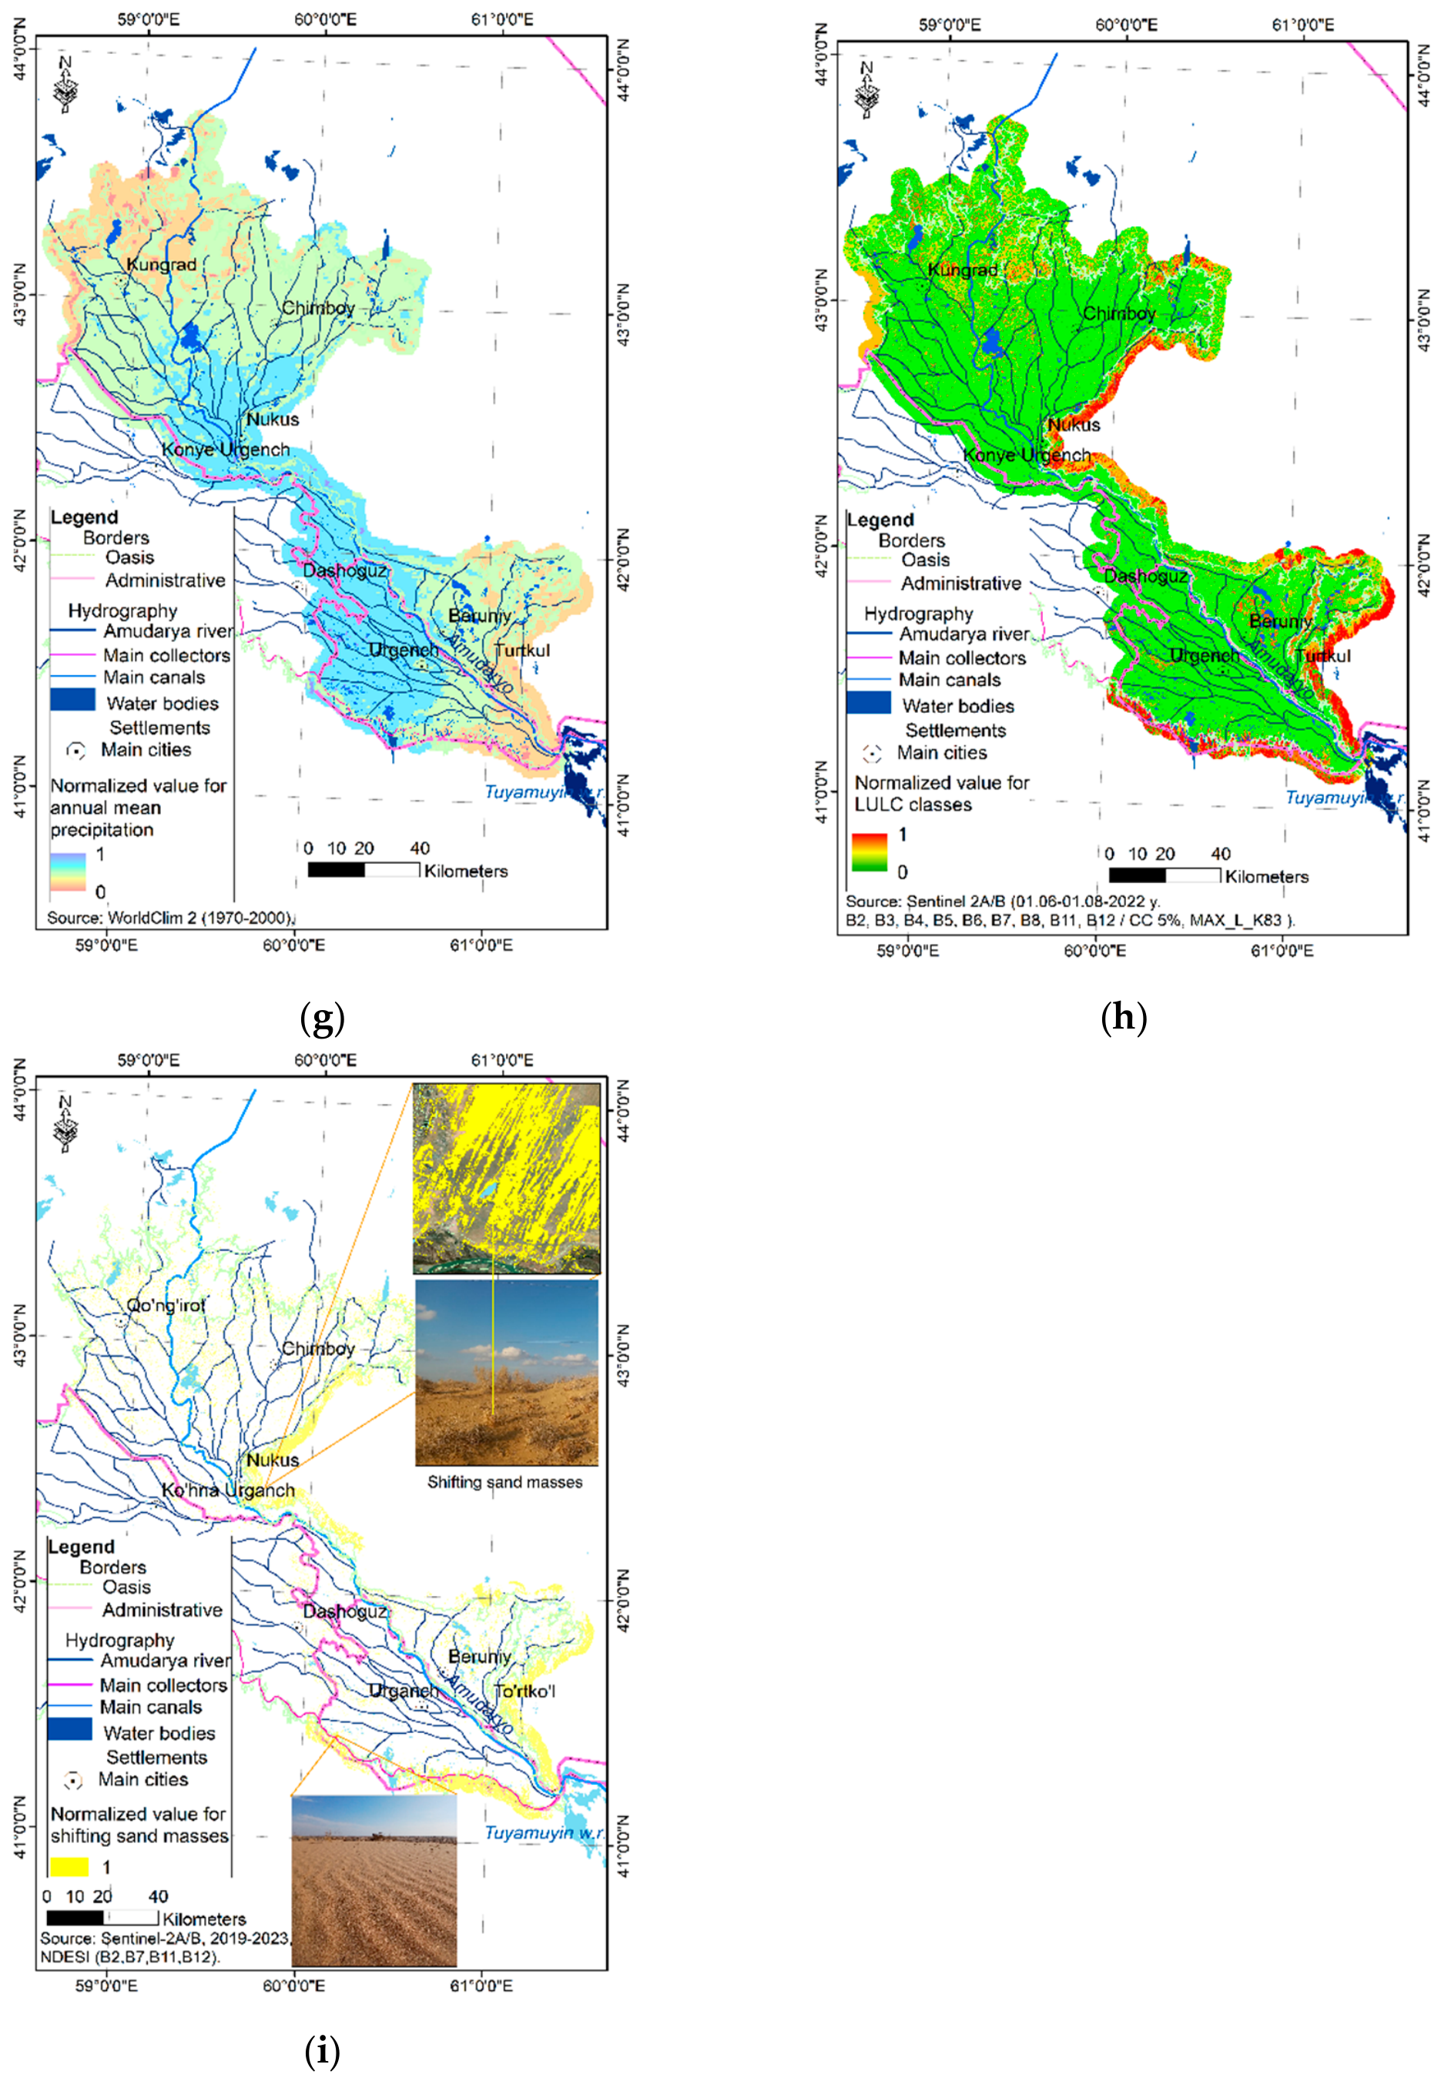
The selected indicators—annual mean wind speed (Figure 6a), LST (Figure 6b), maximum air temperature (Figure 6c), GW level (Figure 6d), and the adopted K-factor (Figure 6e)—were standardized using the minimum normalization equation (Equation (2)). The annual mean NDVI (Figure 6f) and annual mean precipitation (Figure 6g) were normalized using the maximum normalization equation (Equation (3)) to ensure comparability across variables. To ensure inter-variable comparability, indicators were standardized into a dimensionless range of (0–1) using linear scaling techniques. The normalization logic was dictated by the functional relationship between each indicator and land degradation. For pro-degradational factors, where higher values (e.g., elevated air temperatures) accelerate desertification, a minimum-normalization approach was employed. Conversely, for stabilizing factors, where higher values (e.g., dense vegetation cover) inhibit degradation, a maximum-normalization transformation was applied. This alignment ensures that a value of 1 consistently represents the maximum theoretical contribution to desertification hazard across all layers.
Figure 6.
Maps of normalized indices of indicators for assessing the impact of desertification processes on ecological safety: (a) Annual mean wind speed; (b) Annual mean LST; (c) Annual mean for maximum air temperature; (d) Annual mean GW table; (e) K-factor; (f) Annual mean NDVI; (g) Annual mean precipitation; (h) LULC classes; (i) Shifting sand masses.
As indicated above, the supervised classification, performed using the decision tree algorithm, achieved an overall accuracy of 0.87 and a Kappa coefficient of 0.86, validating the model’s efficacy in distinguishing diverse land-cover classes within the study area. This level of accuracy was considered satisfactory for sand-related LULC classes, including relatively unvegetated sandy-hard surface areas (user accuracy = 0.92), sandy areas with sparse vegetation cover (1), sandy areas with dense vegetation cover (0.94), desert-to-agriculture transitional regions (0.88), and sandy areas under intensive cultivation using both GW and secondary irrigation (0.84) (Figure 2). These classes were assigned with a six-point ordinal scale (0–5) to categorize desertification influence, based on field observations and the prevailing physical-geographical conditions. Sandy areas with sparse vegetation, which are highly susceptible to desertification, were assigned to the highest hazard level (5), while sandy areas with dense vegetation received a level of 4. Relatively unvegetated, sandy-hard surfaces, which are comparatively stable against desertification, were assigned level 3. Sandy areas under intensive cultivation were deemed safer than desert-to-agriculture transitional regions, corresponding to levels 2 and 1, respectively. The areas unaffected by desertification were assigned a value of 0. The residential areas that were misclassified due to a lack of desertification indicators were reclassified as non-sandy/other LULC classes. To ensure accuracy, these outputs were validated against an independent residential area data layer. The resulting indicator was then standardized using the minimum normalization equation (Equation (2)) (Figure 6h).
The normalization process of NDESI was applied to sand-related LULC classes, as illustrated in Figure 2. All the other LULC classes were assigned null values, as described in the methodology section.
The selected sand-related classes were subsequently compared with the NDESI threshold range of 0.36–0.45. Areas overlapping with this threshold range were assigned a value of 1, while all remaining areas were again set to null.
The accuracy of the NDESI results was evaluated through field observations. All selected validation points corresponded to shifting sand masses with no vegetation or only sparse vegetation cover. Values were classified as either 1 or null (Figure 6i).
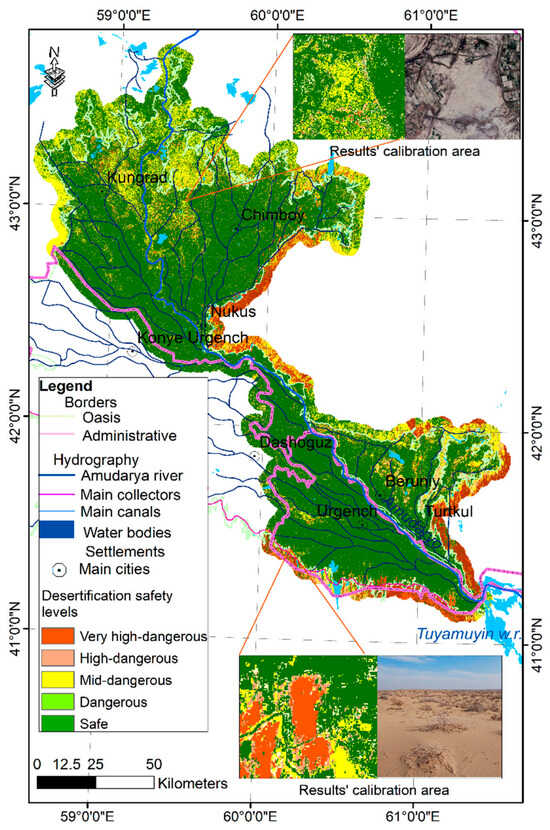
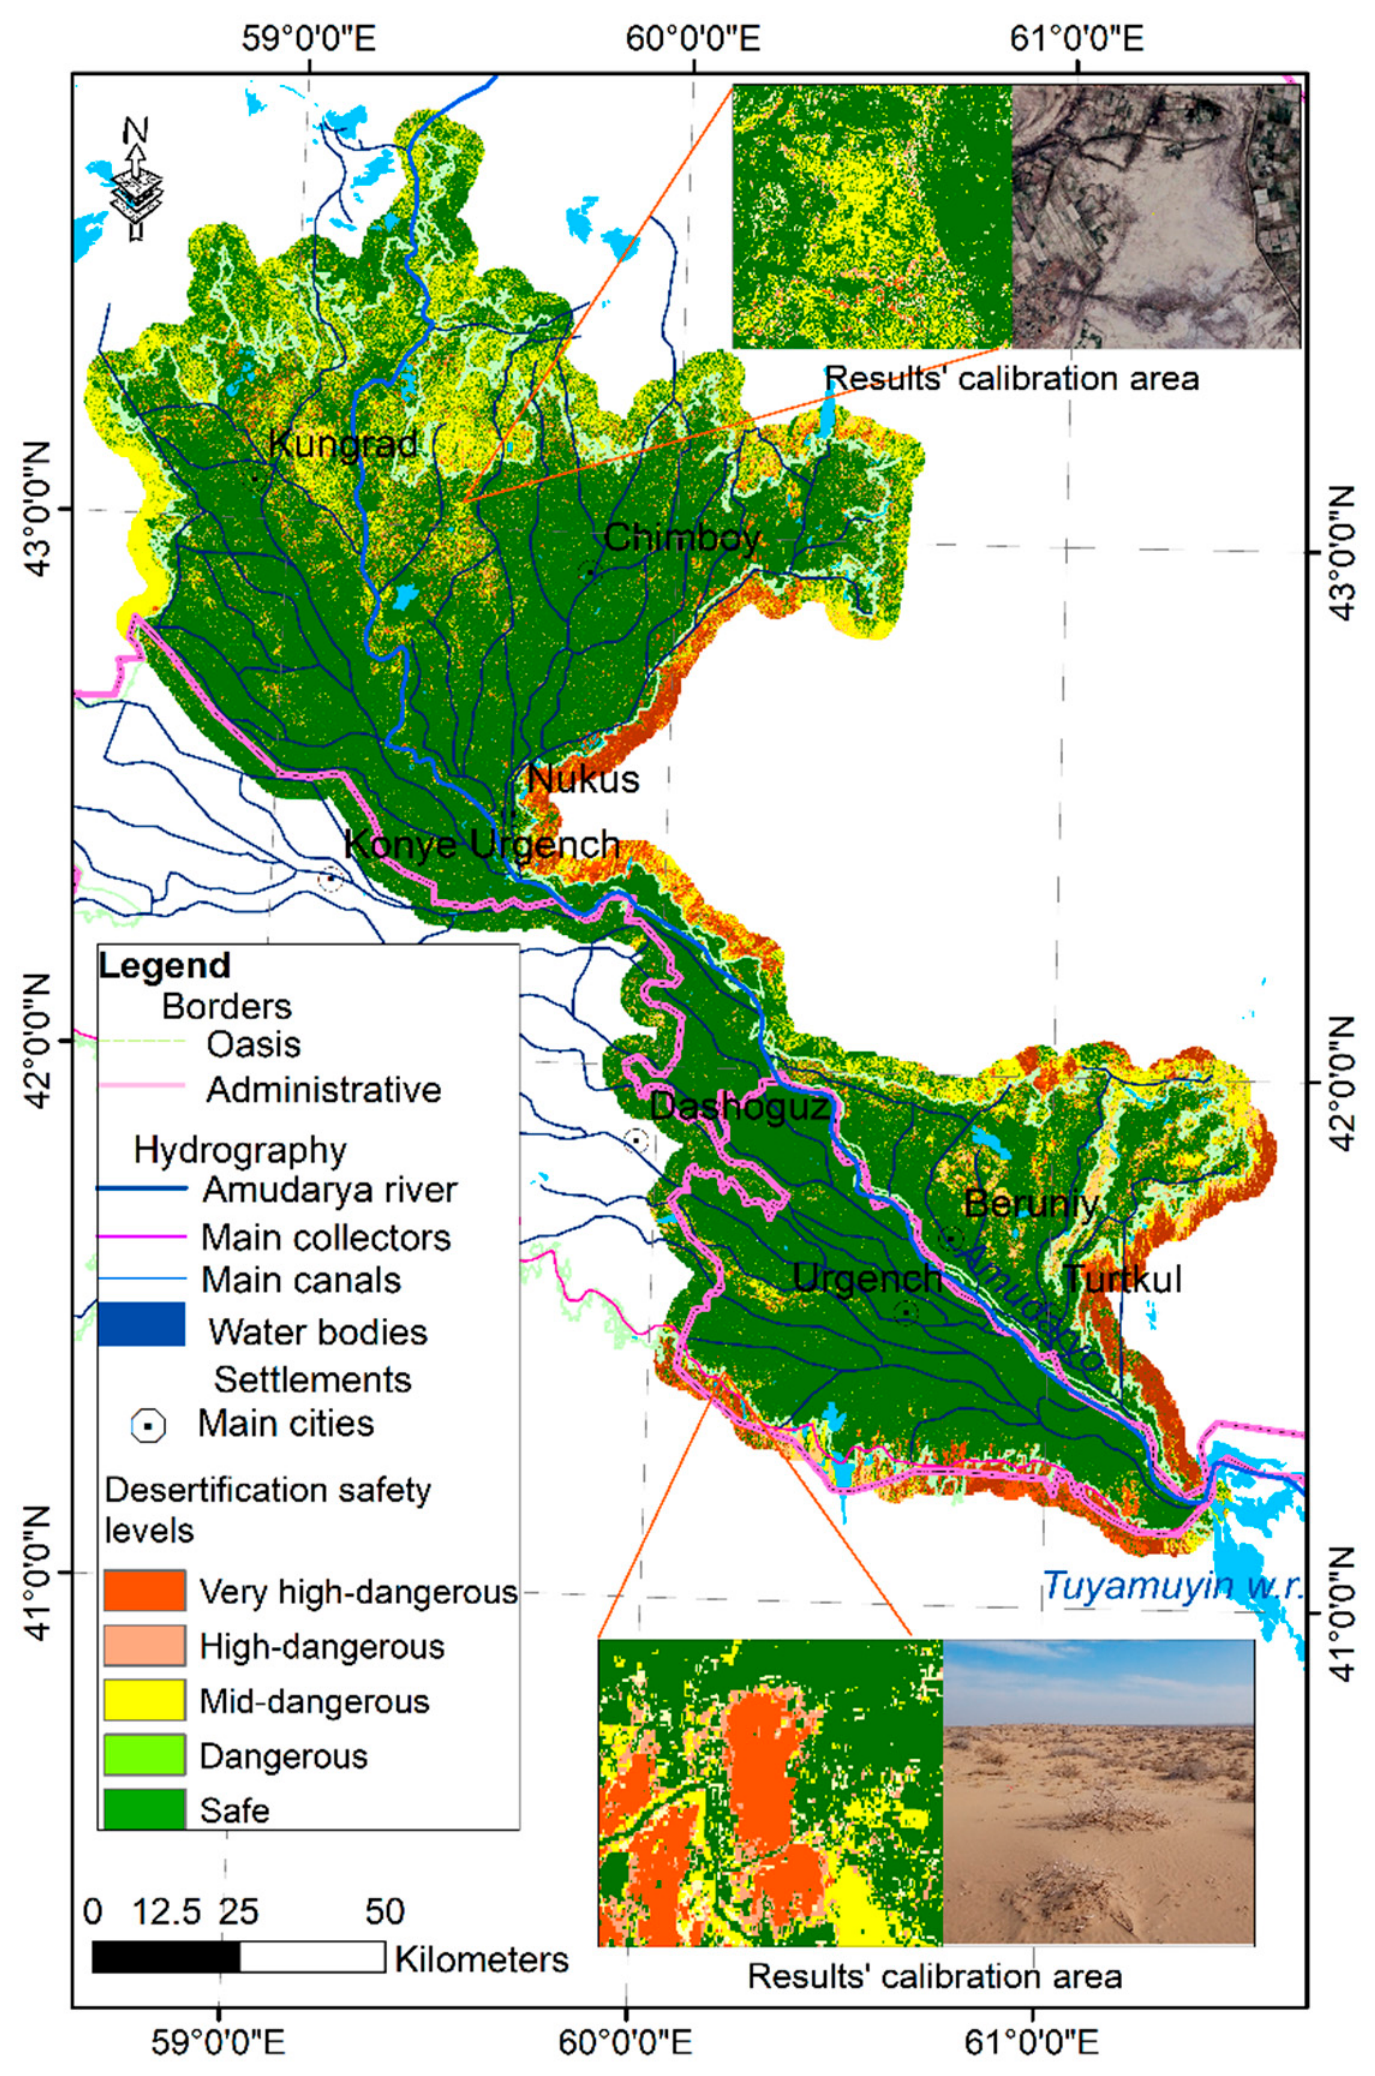
To ensure empirical accuracy and resolve initial spatial discrepancies, these expert-derived weights underwent an iterative calibration phase. Although the indicators were based on long-term mean data spanning 2000–2023, the weights were specifically calibrated against georeferenced field observation points representing the most recent oasis conditions (Table 1). This calibration was essential for delineating safety levels thresholds because preliminary outputs did not initially fully align with the complex, non-linear boundaries of desertification observed on the ground. By strategically selecting permanent observation points for each desertification vulnerability class, we achieved a fine-tuned adjustment of the weights. This process successfully bridged the gap between theoretical spatial analysis and observed field conditions, ensuring that the final weighted overlay achieved maximum geographic consistency with the actual ecological state of the oasis (Figure 7).
Figure 7.
Desertification safety map of the Khorezm Oasis.
The final assessed results were also adjusted to the LULC classes using field observations, as follows: when needed, the experts’ weights were calibrated (Table 1). Lakes, inner residential areas, and intensive agricultural fields with alluvial soils exhibited threshold values of 0–0.4 and were classified as safe from desertification. The dangerous level was defined as a threshold of 0.4–0.5, corresponding to sandy soil areas under intensive cultivation with both GW and secondary irrigation; during drought years, these areas can rapidly transform into desert-like conditions. Areas with a mid-danger level (threshold 0.5–0.6) primarily represented the transition zones from agricultural land to desert, whereas high-danger areas (threshold 0.6–0.7) corresponded to dense vegetation or relatively unvegetated sandy-hard surface regions. Threshold values above 0.7 were classified as very high-dangerous, representing sandy areas with sparse vegetation cover and shifting sand masses.
3.3. Accuracy Validation
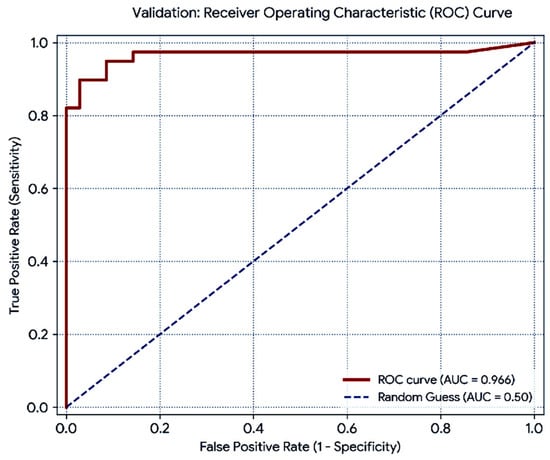
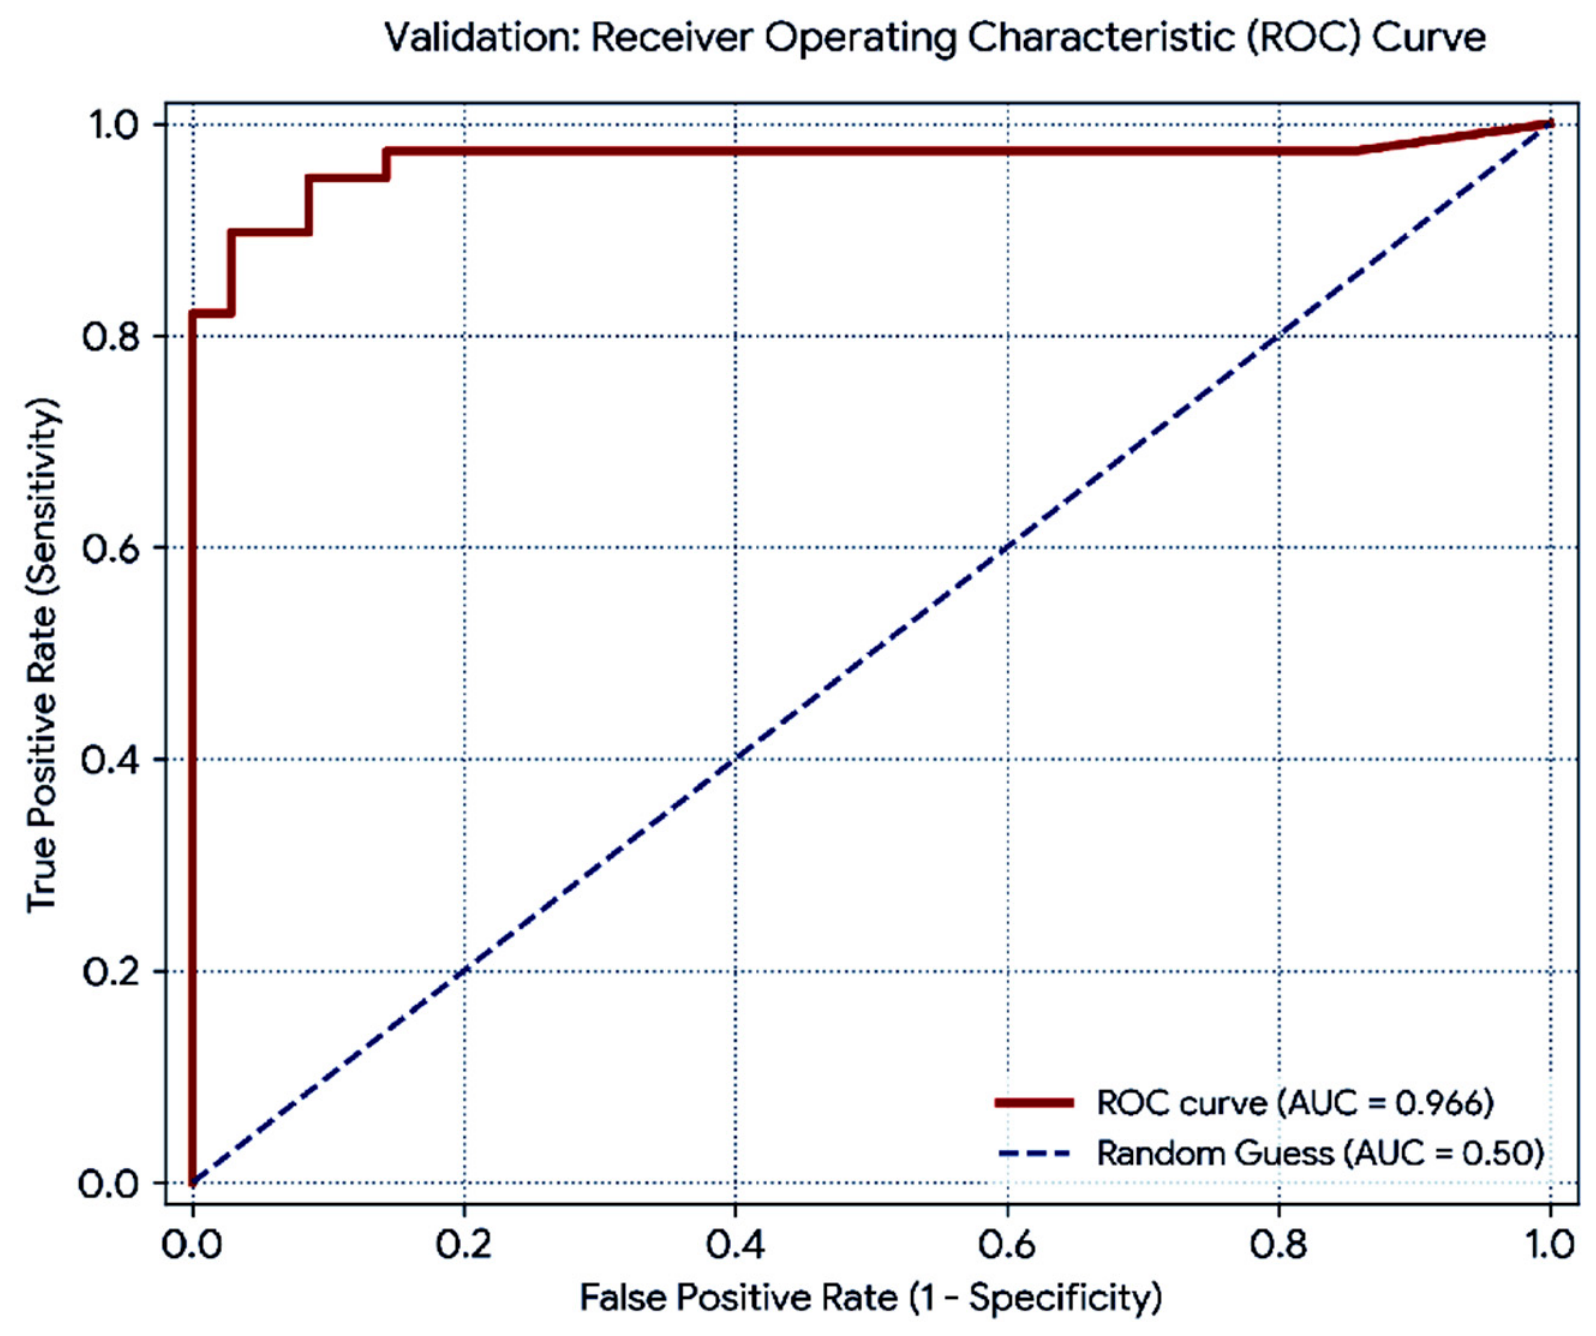
To evaluate the predictive performance of the developed desertification safety level map, a Receiver Operating Characteristic (ROC) analysis was conducted using 74 independent ground-truth validation points (39 field-verified desertified points and 35 safe control points). The spatial correlation between the binary field observations and the result-extracted continuous raster values yielded an Area Under the Curve (AUC) value of 0.966 (Figure 8). This indicates a high level of discriminatory accuracy in separating desertified areas from ecologically safe zones within the study area.
Figure 8.
Results validation.
4. Discussion
To enable readers to evaluate the distinct value of this study, it is essential to contextualize our framework within the landscape of mainstream desertification assessment methodologies, such as the widely adopted MEDALUS framework. While standard models available in high-ranking literature are highly effective for continental or national macro-assessments [40], they introduce significant structural complexity, requiring extensive multi-sectoral data alignment and complex recalibration of index weights [41]. More importantly, our preliminary testing revealed that these mainstream approaches typically rely on generalized macro-climatic or environmental assumptions, which obscure localized environmental dynamics.
In contrast, the framework developed in this study operates on a localized, empirical paradigm uniquely tailored to river-fed desert oasis ecosystems. The landscape types of the Khorezm oasis are heavily driven by localized artificial flood irrigation, specific groundwater table fluctuations, and regional soil salinization patterns. Consequently, standard regional models may not dynamically accommodate these micro-regional realities. Rather than calculating broad, composite sensitivity probabilities, our deterministic multi-criteria framework allows us to precisely calibrate and weight indicators based on direct spatial intersection analysis against long-term ground-truth field points. By explicitly defining desertification through the spatial mechanics of sand spread and the resulting expansion of desert-specific flora, this model directly captures the ecological realities of the oasis. Consequently, our approach replaces generalized simulation curves with empirical field validation, offering a streamlined, high-resolution alternative that isolates specific ecological safety thresholds. This makes it uniquely valuable for regional land managers who require direct, field-verified indicators rather than generalized vulnerability classifications.
The high AUC value of 0.966 demonstrates that integrating remote sensing indicators into the MCDM framework provides an exceptionally reliable assessment of desertification risk levels. This strong predictive power can be attributed to the robust selection of environmental parameters, which effectively captured the complex landscape dynamics of the oasis. Furthermore, achieving an AUC of 0.966 allows for a meaningful horizontal comparison with alternative modeling techniques. For instance, our results align closely with, or slightly exceed, recent machine learning and traditional ecological vulnerability indices applied to arid environments, which typically report AUC values ranging from 0.85 to 0.95. This high level of accuracy justifies the reliance on the selected spatial indicators for localized land degradation monitoring and regional environmental planning.
The desertification safety levels exhibit high variability, particularly during the transition from dangerous to very high-dangerous classes, driven by periodic variations in the selected indicators. The incorporation of land use and land cover classes and the NDESI into the assessment process, with a weight value of 0.2, effectively reduced the misclassification of desertified pixels within areas classified as safe.
The spatial distribution of the safety levels was analyzed across administrative units, including the Khorezm District and the Republic of Karakalpakstan, as well as within the defined buffer zone (Table 3).
Table 3.
Distribution of safety levels in the oasis (sq. km).
The results demonstrate that all dangerous levels, representing desertification-vulnerable regions, were accurately delineated within the buffer zone, covering a total area of 4974.9 km2. Conversely, the “Safe” areas within the buffer correspond to the established agricultural landscapes of Turkmenistan.
All desertification safety levels occur in a spatially intermixed pattern and are distinguished by variations in land surface temperature, vegetation cover, and GW conditions in the Khorezm province, part of the oasis. Very high desertification level areas cover 16.8 km2 and mainly correspond to desertification-prone zones characterized by sparse vegetation cover. Extensive areas are classified as moderate, high, and very high danger, along with smaller, discontinuous patches of partially very high-dangerous desertified land within the inner Amirqum Desert of the province.
Almost all desertification safety levels are widely dispersed in the Karakalpakstan part of the oasis (Table 3). Large, clustered areas classified as very high desertification level, covering 101.23 km2, are mainly concentrated in the northern parts of Turtkul and Beruniy districts and extend from the northern margins of Lake Dovutkul toward Kungrad District. The formation of very high-dangerous, desertification-prone areas in the northern part of Lake Dovutkul can be attributed to elevated land surface temperatures, sparse vegetation cover, a deep GW table, and limited surface water availability. Mid-dangerous areas (728.8 km2) are distributed across the entire region and are largely surrounded by relatively smaller areas of high-dangerous lands (367.5 km2).
The dangerous areas cover a total of 1148.12 km2 in the Karakalpakstan oasis. These areas are particularly widespread in the northern parts of Lake Dovutkul, while additional clustered patterns are also observed around Nukus. Adverse changes in the indicators used for assessment, namely land surface temperature, vegetation, GW table depth, wind speed, and air temperature, contribute directly to the intensification of desertification. This process becomes especially pronounced during dry years within the oasis.
According to the analysis, some areas classified as safe are associated with canals, drainage networks, lakes, and other water bodies. In other cases, desert areas with dense vegetation cover also occur sporadically as safe zones. These complex spatial patterns should be taken into account when designing and implementing desertification mitigation and land management measures.
5. Conclusions
This study demonstrates that correlations among key desertification indicators—annual mean LST, NDVI, precipitation, wind speed, K-factor, maximum air temperature, and GW depth—are generally weak within the oasis due to intensive agricultural activities. In contrast, strong correlations emerge in marginal areas adjacent to the surrounding desert. These findings highlight the importance of delineating LULC to improve the accuracy of assessments of desertification hazard and safety levels.
LULC classes and the NDESI emerged as dominant factors in minimizing pixel misclassification; therefore, higher weights are recommended for these indicators compared to others when assessing desertification in Central Asian deserts. Nevertheless, the results of the MCDM-based assessment should be calibrated using field observation data to better delineate threshold values for each desertification safety level.
Large areas of the oasis are at high risk of severe desertification, primarily in its peripheral zones. In addition, extensive high-dangerous areas of internal desertification have developed in Karakalpakstan, where periodic variability of the influencing indicators—mainly driven by insufficient irrigation water supply—leads to spatial and temporal shifts in these zones. Therefore, it is recommended to promote land-use and agricultural practices adapted to desert conditions within transitional desertification zones.
Author Contributions
Conceptualization of the research, design of the methodological framework, development and implementation of analytical procedures, software provision and configuration, validation and formal analysis of the results, preparation of the original draft, critical review and editing of the manuscript, visualization of tables and cartographic materials, and overall supervision of the research process were carried out by M.M. and A.T., O.M., I.G. and R.B. actively contributed to field data collection, data processing, statistical and spatial analysis of the results, and in situ validation of the assessment outcomes. All authors have read and agreed to the published version of the manuscript.
Funding
This research received no external funding.
Institutional Review Board Statement
Not applicable.
Informed Consent Statement
Not applicable.
Data Availability Statement
The following data sources were used to get the results of the research: LST and NDVI data were obtained from the Climate Engine platform (Climate Engine. Available online: https://app.climateengine.org/climateEngine; accessed on 11 March 2026). Wind speed, precipitation, and maximum air temperature data were downloaded from the WorldClim database (WorldClim—Global Climate Data. Available online: https://www.worldclim.org/; accessed on 11 March 2026). NDSEI (1 June–1 August 2022) and LULC (2019–2023) datasets were computed using Google Earth Engine based on Sentinel-2 A/B imagery (Google Earth Engine. Available online: https://earthengine.google.com/; accessed on 11 March 2026). GW table data were obtained from the ZEF/UNESCO Khorezm Project (1990–2004) and from hydrogeological monitoring stations located in the Khorezm region and the Republic of Karakalpakstan (2018–2021). Soil erodibility factor (K-factor) data were downloaded from the ISRIC Data Hub (ISRIC—World Soil Information. Available online: https://data.isric.org/; accessed on 11 March 2026).
Acknowledgments
The authors express their sincere gratitude to all online data providers used in this study and to the staff of the hydrogeological monitoring stations of the Khorezm region and the Republic of Karakalpakstan for their valuable support and assistance.
Conflicts of Interest
The authors declare no conflicts of interest.
Abbreviations
The following abbreviations are used in this manuscript:
| LST | Land Surface Temperature |
| LULC | Land Use and Land Cover |
| GEE | Google Earth Engine |
| MCDM | Multi-Criteria Decision-Making |
| NDVI | Normalized Difference Vegetation Index |
| DDI | Desertification Degree Index |
| NDSI | Normalized Difference of Sand Index |
| NDESI | Normalized Difference Enhanced Sand Index |
| NDSLI | Normalized Differential Sandy Land Index |
| SARIMA | Seasonal Autoregressive Integrated Moving Average |
| IDW | Inverse Distance Weighting |
| USDA | United States Department of Agriculture |
| ISRIC | International Soil Reference and Information Centre |
| AHP | Analytic Hierarchy Process |
| GW | Groundwater |
| AMMAT | Annual Mean of Maximum Air Temperature |
| CRITIC | Criteria Importance Through Intercriteria Correlation |
| PCA | Principal Component Analysis |
| WSM | Weighted Sum Model |
| ROC | Receiver Operating Characteristic |
| AUC | Area Under the Curve |
References
- Ahmady-Birgani, H.; McQueen, K.G.; Moeinaddini, M.; Naseri, H. Sand Dune Encroachment and Desertification Processes of the Rigboland Sand Sea, Central Iran. Sci. Rep. 2017, 7, 1523. [Google Scholar] [CrossRef] [Scilit] [PubMed]
- Bedoui, C. Study of desertification sensitivity in Talh region (Central Tunisia) using remote sensing, G.I.S. and the M.E.D.A.L.U.S. approach. Geoenviron. Disasters 2020, 7, 16. [Google Scholar] [CrossRef] [Scilit]
- Macêdo, T.H.d.J.; Tagliaferre, C.; da Silva, B.L.; de Paula, A.; Lemos, O.L.; Adenilson Rocha, F.; Pinheiro, R.G.d.S.; Santos Lima, A.C. Assessment of Land Desertification in the Brazilian East Atlantic Region Using the Medalus Model and Google Earth Engine. Land 2023, 13, 31. [Google Scholar] [CrossRef] [Scilit]
- Berdyyev, A.; Al-Masnay, Y.A.; Juliev, M.; Abuduwaili, J. Desertification Monitoring Using Machine Learning Techniques with Multiple Indicators Derived from Sentinel-2 in Turkmenistan. Remote Sens. 2024, 16, 4525. [Google Scholar] [CrossRef] [Scilit]
- Baartman, J.; Godert, L.; Reed, M.R.; Coen, H.R. Desertification and land degradation: Origins, Processes and Solutions—A Literature Review; DESIRE Scientific Report No. 4; ISRIC—World Soil Information: Wageningen, The Netherlands, 2007; pp. 1–105. [Google Scholar]
- United Nations Convention to Combat Desertification (Secretariat). United Nations Convention to Combat Desertification in those Countries Experiencing Serious Drought and/or Desertification, Particularly in Africa. Int. Leg. Mater. 1994, 33, 1328–1382. [Google Scholar] [CrossRef] [Scilit]
- Lamaamri, M.; Lghabi, N.; Ghazi, A.; El Harchaoui, N.; Adnan, M.S.G.; Shakiul Islam, M. Evaluation of Desertification in the Middle Moulouya Basin (North-East Morocco) Using Sentinel-2 Images and Spectral Index Techniques. Earth Syst. Environ. 2023, 7, 473–492. [Google Scholar] [CrossRef] [Scilit]
- Ma, Z.; Xie, Y.; Jiao, J.; Wang, X. The construction and application of an Aledo-NDVI based desertification monitoring model. Procedia Environ. Sci. 2011, 10, 2029–2035. [Google Scholar] [CrossRef] [Scilit]
- Al-Quraishi, A.M.F. Sand dunes monitoring using remote sensing and GIS techniques for some sites in Iraq. In SPIE International Conference on Photonics and Image in Agriculture Engineering; SPIE: Bellingham, WA, USA, 2013; Volume 8762, pp. 1–9. [Google Scholar] [CrossRef] [Scilit]
- Marzouki, A.; Abdullah, D. Normalized Difference Enhanced Sand Index for desert sand dunes detection using Sentinel-2 and Landsat 8 OLI data, application to the north of Figuig, Morocco. J. Arid Environ. 2022, 198, 104693. [Google Scholar] [CrossRef] [Scilit]
- Sahar, A.A.; Alhadithi, A.A.; Hassan, M.A.; Jasim, A.A. Integrated remote sensing and GIS for developed new spectral index for estimating Sandy land and its potential hazards. Case study: North-east Al-Muthanna Province area, south of Iraq. Arab. J. Geosci. 2021, 14, 191. [Google Scholar]
- Sinsin, T.; Mounir, F.; El Aboudi, A. Modeling and assessing driving factors of the spatial and temporal dynamics of the sand dunes in the district of Errachidia, Morocco. Arab. J. Geosci. 2021, 14, 2111. [Google Scholar] [CrossRef] [Scilit]
- Arghius, V.; Muntean, L.; Baciu, N.; Măcicășan, V.; Arghius, C. Analysis of annual and seasonal air temperature trends in central part of Romania. Present Environ. Sustain. Dev. 2020, 14, 51–61. [Google Scholar] [CrossRef] [Scilit]
- de Moraes, J.B.; Wanderley, H.S.; Delgado, R.C. Areas susceptible to desertification in Brazil and projected climate change scenarios. Nat. Hazards 2023, 116, 1463–1483. [Google Scholar] [CrossRef] [Scilit]
- Alexander, N.Z.; Luis, B.C.; Tatiana, B.T. Local climatically-driven changes of albedo and surface temperatures in the Sonoran Desert. J. Arid Environ. 2020, 178, 104147. [Google Scholar] [CrossRef] [Scilit]
- Lamchin, M.; Lee, W.-K.; Jeon, S.W.; Lee, J.-Y.; Song, C.; Piao, D.; Lim, C.H.; Khaulenbek, A.; Navaandorj, I. Correlation between Desertification and Environmental Variables Using Remote Sensing Techniques in Hogno Khaan, Mongolia. Sustainability 2017, 9, 581. [Google Scholar] [CrossRef] [Scilit]
- Farah, C.; Manel, R.; Abbes, A.B.; Farah, I.R. Desertification Detection Based on Landsat Time-Series Images and Variational Auto-Encoder: Application in Jeffera, Tunisia. In Proceedings of the IGARSS 2022 IEEE International Geoscience and Remote Sensing Symposium, Kuala Lumpur, Malaysia, 17–22 July 2022; pp. 3688–3691. [Google Scholar] [CrossRef] [Scilit]
- Tuama, R.; Al-Khaqani, E. Desertification Detection by NDVI and Other Indices: A Case Study in Najaf. J. Xidian Univ. 2020, 14, 1148–1161. [Google Scholar] [CrossRef] [Scilit] [PubMed]
- Ali, S.M.; Alaa, S.M.; Qutaiba, M.H.; Fadiya, W.A.; Thamir, H. Fluctuating rainfall as one of the important cause for desertification in IRAQ. J. Environ. Earth Sci. 2013, 3, 25–33. [Google Scholar]
- Racioppi, R.; Simeone, V. Desertification risk in Southern Apulia rainfall decreasing analysis. In Local Resources and Global Trades: Environments and Agriculture in the Mediterranean Region; CIHEAM: Bari, Italy, 2003; pp. 429–440. [Google Scholar]
- Han, X.; Jia, G.; Yang, G.; Wang, N.; Liu, F.; Chen, H.; Guo, X.; Yang, W.; Liu, J. Spatiotemporal dynamic evolution and driving factors of desertification in the Mu Us Sandy Land in 30 years. Sci. Rep. 2020, 10, 21734. [Google Scholar] [CrossRef] [Scilit] [PubMed]
- Feng, L.; Jia, Z.L.; Qingxue, Z.A.; Zhang, Z.; Zhao, Y. Spatiotemporal Change of Aeolian Desertification Land Distribution in Northern China from 2001 to 2015. J. Indian Soc. Remote Sens. 2018, 46, 1555–1561. [Google Scholar] [CrossRef] [Scilit]
- Ibáñez, J.; Gartzia, R.; Alcalá, F.J.; Martínez-Valderrama, J. The Importance of Prevention in Tackling Desertification: An Approach to Anticipate Risks of Degradation in Coastal Aquifers. Land 2022, 11, 1626. [Google Scholar] [CrossRef] [Scilit]
- Saleh, I.; Khazaei, M.; Naeimi, M. Desertification intensity affected by groundwater and land subsidence in Maharloo-Bakhtegan watershed. Soil Manag. Model. Water 2023, 3, 171–184. [Google Scholar]
- Harris, N. Atlas of the World’s Deserts, 1st ed.; Taylor and Francis: Chicago, IL, USA, 2003; pp. 1–358. [Google Scholar]
- Matchanov, M.; Teodoro, A.; Schroder, C. Criterion definition for the identification of physical-geographical boundaries of Khorezm oasis through remotely sensed data. Environ. Monit. Assess. 2016, 188, 35. [Google Scholar] [CrossRef] [Scilit] [PubMed]
- Galina, S.; Georgy, S.; Odilbek, E. Estimation of Crop Water Requirements in Irrigated Land of the Khorezm Oasis in the Context of Climate Change. Sustain. Agric. Res. 2019, 8, 94–103. [Google Scholar] [CrossRef] [Scilit]
- Huntington, J.; Hegewisch, K.; Daudert, B.; Morton, C.; Abatzoglou, J.; McEvoy, D.; Erickson, T. Climate Engine: Cloud Computing of Climate and Remote Sensing Data for Advanced Natural Resource Monitoring and Process Understanding. Bull. Am. Meteorol. Soc. 2017, 98, 2397–2410. [Google Scholar] [CrossRef] [Scilit]
- Fick, S.E.; Hijmans, R.J. WorldClim 2: New 1km spatial resolution climate surfaces for global land areas. Int. J. Climatol. 2017, 37, 4302–4315. [Google Scholar]
- ISRIC Data Hub. ISRIC—World Soil Information. Available online: https://data.isric.org/ (accessed on 11 March 2026).
- Li, R.; Han, R.; Yu, Q.; Qi, S.; Guo, L. Spatial Heterogeneous of Ecological Vulnerability in Arid and Semi-Arid Area: A Case of the Ningxia Hui Autonomous Region, China. Sustainability 2020, 12, 4401. [Google Scholar] [CrossRef] [Scilit]
- Mao, D.H. Comprehensive assessment and analysis on the risk degree of flood-waterlogging in Dongting Lake region. J. Nat. Disasters 2001, 10, 104–107. (In Chinese) [Google Scholar]
- Wei, H.; Juanle, W.; Kai, C.; Ge, L.; Altanshukh, O.; Davaadorj, D.; Sonomdagva, C. Desertification Information Extraction Based on Feature Space Combinations on the Mongolian Plateau. Remote Sens. 2018, 10, 1614. [Google Scholar] [CrossRef] [Scilit]
- Shihab, T.H.; Al-Hameedawi, A.N. Desertification Hazard Zonation in Central Iraq Using Multi-criteria Evaluation and GIS. J. Indian Soc. Remote Sens. 2020, 48, 397–409. [Google Scholar] [CrossRef] [Scilit]
- Ahmed, S.A.; Abdelatif, D.A. Assessment of desertification using modified MEDALUS model in the north Nile Delta, Egypt. Geoderma 2021, 405, 115400. [Google Scholar] [CrossRef] [Scilit]
- Rhinane, H.; Hilali, A.; Lahssini, S.; Moukrim, S. Desertification assessment using MEDALUS model in watershed Oued El Maleh, Morocco. Geosciences 2017, 7, 50. [Google Scholar] [CrossRef] [Scilit]
- Jafari, H.; Akbari, M.; Kashki, M.; Nameghi, S. An efficiency comparison of the IMDPA and ESAs models on desertification risk management in arid regions of Southern Khorasan Razavi, Iran. J. Arid Biome 2019, 9, 39–54. [Google Scholar]
- Helene-Marie, S.; Cohen, B.; Harrison, S.T.L.; Broadhurst, J.L. Validity of using expert judgements to inform multiple criteria decision analysis: Selecting technologies for sulfide-enriched fine coal waste reuse. J. Clean. Prod. 2023, 415, 137671. [Google Scholar] [CrossRef] [Scilit]
- Allaberganov, T.K. Priridnyye Usloviya Khorezmskogo Oazisa i ego Rayonirovaniye [Natural Conditions of the Khorezm Oasis and Its Regionalization]; O’qituvchi: Tashkent, Uzbekistan, 1976; pp. 1–145. [Google Scholar]
- Liu, J.; Ren, Y.; He, P.; Xiao, J. Quantifying uncertainty in projections of desertification in Central Asia using Bayesian networks. Remote Sens. 2025, 17, 665. [Google Scholar] [CrossRef] [Scilit]
- Salmurzauly, R. Ecological vulnerability of arid lands: Analysis based on the MEDALUS model and remote sensing. Sustainability 2025, 17, 9990. [Google Scholar] [CrossRef] [Scilit]

Disclaimer/Publisher’s Note: The statements, opinions and data contained in all publications are solely those of the individual author(s) and contributor(s) and not of MDPI and/or the editor(s). MDPI and/or the editor(s) disclaim responsibility for any injury to people or property resulting from any ideas, methods, instructions or products referred to in the content. |
© 2026 by the authors. Licensee MDPI, Basel, Switzerland. This article is an open access article distributed under the terms and conditions of the Creative Commons Attribution (CC BY) license.