Article

From Benchmark Accuracy to Field Performance: Hybrid Deep Learning-Based Plant Disease Classification with IoT-Enabled Environmental Monitoring

by
Jalampelli Thirupathi
1,2,
Nandagopal Malarvizhi
1 and
Potula Sree Brahmanandam
3,*
1
Department of Computer Science and Engineering, Vel Tech Rangarajan Dr. Sagunthala R&D Institute of Science and Technology, Chennai 600602, India
2
Department of Computer Science and Engineering, Institute of Aeronautical Engineering, Hyderabad 500043, India
3
Department of Physics, Shri Vishnu Engineering College for Women (A), Bhimavaram 534202, India
*
Author to whom correspondence should be addressed.
Sustainability 2026, 18(13), 6867; https://doi.org/10.3390/su18136867 (registering DOI)
Submission received: 1 May 2026 / Revised: 19 June 2026 / Accepted: 2 July 2026 / Published: 6 July 2026

Abstract

Accurate detection of plant leaf diseases is essential for enhancing crop productivity and supporting global food security. In addition to disease classification, understanding how environmental and soil conditions affect model performance is important for developing robust real-world agricultural monitoring systems. Although deep learning (DL) models achieve high accuracy on benchmark datasets, their performance in real-world settings is often limited by variations in illumination, background complexity, and environmental conditions. This study proposes a smart DL framework for detecting and classifying multiple leaf diseases in tomato, potato, and pepper plants. The framework combines U2-Net-based leaf segmentation with a Convolutional Neural Network–Bidirectional Gated Recurrent Unit (CNN–Bi-GRU) architecture. MobileNetV2 is employed as the feature extraction backbone to capture spatial characteristics, while Bi-GRU layers model sequential feature dependencies, forming a spatio-temporal network whose architectural design prioritizes parameter efficiency through depthwise separable convolutions and reduced gating complexity. The model was trained and validated using the PlantVillage benchmark dataset and achieved a classification accuracy of 99.8% with a macro-averaged F1-score of 94%, outperforming several state-of-the-art architectures. To assess robustness under real-world conditions, the trained model was further tested on leaf images collected from open-field environments near Eluru, South India. The field evaluation revealed a reduction in classification accuracy to 61.97%, indicating the impact of domain shift and environmental variability. To investigate potential contributing factors, soil parameters, including pH, temperature, moisture, and NPK levels, were monitored using an IoT-based Arduino sensing system over ten consecutive days. Rather than serving as direct inputs to the disease classification model, these environmental measurements were analyzed to assess their potential influence on disease symptom expression and the observed reduction in model performance under field conditions. The results suggest that environmental conditions may influence disease symptom expression and model transferability. This study highlights the importance of integrating DL-based disease recognition with environmental monitoring for reliable field-level agricultural applications. Nevertheless, computational complexity metrics, including inference latency and memory footprint, were not evaluated in the present work and are identified as a priority for future edge deployment studies.

1. Introduction

Plant diseases pose a critical challenge to global food security, as early symptoms often manifest as subtle, spatially localized lesions that rapidly intensify. Delays or inaccuracies in diagnosis amplify yield losses, drive pesticide misuse, and create downstream economic risks. Conventional visual inspection remains constrained by human subjectivity, symptom similarity across pathogens, and the sheer scale of monitoring required in commercial cultivation. Consequently, there is an urgent need for automated, accurate, and scalable disease surveillance systems.
Recent advances in deep learning methods have significantly transformed plant disease detection, identification, and classification [1,2,3]. Convolutional neural networks (CNNs) have been widely adopted for automated classification because of their ability to learn discriminative features directly from raw images without reliance on handcrafted descriptors [4,5,6]. These approaches mark a paradigm shift toward precision agriculture, where real-time, fine-grained diagnosis enables timely and sustainable interventions. However, single-image CNN classifiers often face limitations in real-world deployments due to small or occluded targets, illumination variations, and an inability to model disease progression. While CNNs are effective for spatial encoding, the inherently dynamic nature of plant disease requires methods that can capture sequential dependencies and contextual transitions [7].
Hybrid architectures address these limitations by combining CNN-based spatial feature extraction with recurrent layers such as Long Short-Term Memory (LSTM) networks or Gated Recurrent Units, which can model sequential relationships among extracted feature representations [8,9]. Bidirectional GRUs further enhance feature learning by processing feature sequences in both forward and backward directions, enabling the network to capture complementary contextual information [10]. When integrated with CNN-based feature extractors, Bi-GRU layers facilitate the learning of both fine-grained lesion characteristics and higher-level feature dependencies, thereby improving disease classification performance in complex agricultural imaging environments.
Hybrid networks that combine convolutional feature extraction with recurrent sequence modeling have increasingly incorporated segmentation and attention modules to improve performance on noisy, real-world data across various domains. For example, previous work proposed an Automatic Segmentation and Hyperparameter Optimization Artificial Rabbits Algorithm (AS-HPOARA) to enhance plant leaf disease classification [11]. A modified U-Net performs segmentation to isolate disease-specific regions, enabling richer feature representation. Classification is then carried out through an Artificial Rabbits Algorithm with hyperparameter optimization, which increases training efficiency, reduces statistical bias, and minimizes model complexity. By combining segmentation, augmentation, and optimized classification, this approach achieves higher accuracy and robustness in disease detection.
While hybrid pipelines improve accuracy on disease progression modeling tasks, they also raise training/inference latency, memory footprint, and engineering complexity (e.g., error propagation across stages, multi-branch losses, and sequence packing). The combination of multiple architectural components creates a highly expressive but computationally expensive network. Such models may be difficult to train and can be unsuitable for real-time applications [12,13]. Particularly, attention modules (e.g., channel and spatial attention mechanisms) have been widely adopted to improve feature representation by emphasizing informative regions and suppressing irrelevant information. However, these modules introduce additional architectural complexity, which may increase computational requirements depending on the model design and deployment environment [12,13]. On the other hand, U2-Net is designed for explicit pixel-level salient object detection and produces high-resolution masks that preserve both global structure and fine boundary details. When applied as a preprocessing step in plant-disease pipelines, U2-Net removes background clutter and isolates symptomatic leaf regions, which yields cleaner inputs for feature extractors.
Most importantly, several DL-based studies on disease detection rely on the PlantVillage dataset, a curated benchmark of ≈54,000 single-leaf images across 38 classes captured under controlled conditions [14]. Apart from the PlantVillage dataset [14], other curated repositories such as the PlantDoc dataset [15] and the PlantCLEF [16] dataset are also widely used for disease detection, classification, and precision agriculture research.
While most powerful DL-based studies trained on this dataset often report near-ceiling accuracy, their performance drops significantly when applied to real-world conditions where illumination, canopy clutter, overlapping leaves, and sensor noise are present [6,17]. This “lab-to-field” gap has been repeatedly documented, demonstrating that over-reliance on PlantVillage inflates performance metrics and obscures generalization limits [18]. Beyond curated repositories, researchers are increasingly using field-collected (user-driven) datasets, which capture natural variability such as lighting changes, canopy clutter, overlapping leaves, and mixed symptoms. This data improves the ecological validity of deep learning models, ensuring higher reliability in deployment and better adaptation to region-specific conditions like local cultivars, climates, and pathogen strains [6,19,20]. Additionally, developing original field datasets adds novelty to the research community and contributes new insights to the literature.
In recent years, deep learning and hybrid deep learning models have emerged as powerful tools in crop pest and disease management, becoming standard methodologies for addressing challenges in the detection, identification, and classification of crop pests [1,21,22]. Several review-based studies have further consolidated these advancements, not only outlining effective predetermined steps for predicting plant diseases using DL- and ML-based approaches but also providing critical evaluations of their limitations and challenges [1,17]. Among DL models, CNNs have been particularly successful for image-based classification tasks, primarily due to their ability to extract hierarchical spatial features from visual data. However, CNNs are inherently limited in capturing temporal or sequential dynamics of disease progression, such as the development of spots, lesions, mosaics, mottling, or rings over time. Moreover, CNN-based models often require large volumes of labeled training data and are computationally expensive, which constrains their practical deployment in resource-limited agricultural settings.
To address these limitations and effectively capture both the spatial and temporal aspects of plant disease progression, researchers have increasingly adopted hybrid neural network architectures. Hybrid deep learning frameworks integrating CNN and SVM have been widely investigated for crop disease detection. For instance, a research study presented an automated deep learning framework to improve paddy crop productivity through early disease detection. A hybrid CNN–SVM model was developed to identify brown spot, bacterial leaf blight, and leaf smut, achieving over 98% accuracy [19]. An alternative hybrid architecture integrates a Vision Transformer (ViT) for advanced feature representation with a Support Vector Machine (SVM) for classification, demonstrating high accuracy in bean leaf lesion detection while simultaneously minimizing computational overhead [23].
In another study, the CNN–SVM hybrid model was proposed for automated strawberry leaf disease detection, achieving high accuracy, precision, recall, and F1-score, thereby demonstrating its potential as an effective tool for disease diagnosis and crop health monitoring [24]. A research study introduced a hybrid framework for automated tomato leaf disease diagnosis by integrating deep learning and machine learning techniques. The model employed a pre-trained CNN, specifically MobileNetV2, for robust feature extraction, which was subsequently coupled with a Support Vector Machine (SVM) classifier for multi-class disease prediction. The hybrid MobileNetV2-SVM model demonstrated superior performance, attaining classification accuracies between 88% and 99%, surpassing several conventional approaches whose accuracies ranged from 70% to 97% [23].
A hybrid CNN-RNN model, such as Xception-GRU, applies the Xception network for deep feature extraction, followed by GRU layers to capture complex sequential dependencies among extracted features. Studies show that these models can reach classification accuracies above 98% on benchmark datasets, significantly outperforming classical CNN-only solutions for plant disease identification [24]. Another approach employed DenseNet-based and Inception-Xception hybrid CNN architectures, sometimes integrated with attention mechanisms, to enhance performance in distinguishing fine-grained disease symptoms, particularly in crops such as rice and wheat [25]. CoAtNet, a hybrid of convolutional and attention-based networks, achieved high precision and F1-scores in the classification of various rice leaf diseases, showing that these architectures are adept at both identifying disease symptoms and ignoring irrelevant background information [26]. Several studies have integrated Grad-CAM and other interpretability frameworks with hybrid models to visualize the features most influential in classification decisions. Such approaches improve model interpretability and enhance trust and transparency in agricultural AI systems [27].
The integration of CNNs with recurrent neural networks (RNNs), such as bidirectional LSTMs or GRUs, has shown great promise. This hybrid CNN–Bi-GRU framework synergistically leverages the feature extraction capabilities of CNNs with the contextual and sequential modeling capabilities of Bi-GRUs. The result is a robust architecture that enhances classification performance by providing spatially rich and temporally informed representations of plant disease symptoms, ultimately leading to more accurate and reliable predictions. Combining CNNs with Bi-GRUs for rice disease identification achieved higher accuracy than standalone models, though the study was limited to four disease types, restricting generalization. The authors emphasized the need for larger, real-field datasets to ensure robustness under complex agricultural conditions.
While CNN-based methods perform well on controlled datasets with consistent imagery, hybrid architectures generally exhibit greater robustness and adaptability under challenging agricultural conditions, including environmental variability and complex disease patterns [21,24]. Extending these developments, Zhang and Wang [10] integrated attention pooling and capsule networks within a BERT-BiGRU-CapsNet framework for crop disease–pest question classification, enabling effective feature extraction from unstructured data and outperforming several conventional machine learning and deep learning approaches.
Across multiple studies, reviews emphasize that hybrid models improve generalization by leveraging complementary strengths of CNNs, sequential models, and advanced pooling mechanisms, making them more resilient to field-level challenges than pure CNNs. Bi-CNNs integrating fine-tuned VGG and pruned ResNet enhance feature extraction while supporting large-scale applications, and integration with edge–cloud systems enables rapid, field-level diagnosis [24].
Recent advancements in deep learning have significantly improved plant disease detection, with hybrid architectures (e.g., CNN–SVM, CNN–BiGRU, MobileNetV2–SVM, and CoAtNet, to name a few) demonstrating superior accuracy and robustness compared to conventional CNN-only models. However, most existing frameworks remain computationally demanding, requiring high memory and processing power, which restricts their deployment in real-world agricultural environments, especially on resource-limited devices. Furthermore, while hybrid models enhance spatial–temporal feature learning and generalization, challenges persist in balancing accuracy with efficiency, adaptability to heterogeneous field data, and scalability for large-scale applications.
Therefore, there is a need to design deep learning frameworks that balance classification accuracy with architectural efficiency for practical agricultural deployment. In response, this study proposes a hybrid U2-Net–MobileNetV2–Bi-GRU framework for plant disease detection and classification. By leveraging depthwise separable convolutions in MobileNetV2 and sequential feature modeling through Bi-GRU, the proposed architecture seeks to achieve high predictive performance while maintaining a relatively efficient network structure. The framework is further evaluated under both benchmark and field conditions to assess its applicability to real-world agricultural monitoring systems.
The novelty of this work lies in the integration of segmentation-guided spatio-temporal deep learning with real-field environmental sensing to systematically analyze the domain generalization limitations of benchmark-trained plant disease detection models. Most importantly, the present study builds on the research group’s expertise in precision agriculture, including IoT-based pesticide spraying [28], soil monitoring with hybrid machine learning [29], and field-based citrus fruit detection and classification using the FIDS-30 datasets [30]. Despite these advances, existing approaches often operate independently, limiting their effectiveness under real-world conditions. Therefore, there is a need for an integrated, soil-aware deep learning framework that combines spatial, temporal, and environmental data. Addressing this gap, the proposed study develops a hybrid model tailored to the agro-ecological conditions of Eluru (India), enabling early stress detection and robust crop monitoring. This integration supports accurate, scalable, and sustainable precision agriculture systems.
Unlike multimodal disease diagnosis frameworks that directly fuse sensor measurements and image features within a unified learning architecture, the present study employs IoT-based soil monitoring as a complementary environmental assessment component. The objective is not to develop a sensor-fusion classifier, but rather to investigate how field-level environmental conditions may influence disease symptom expression and contribute to the performance gap observed between benchmark and real-world datasets.
The present research findings not only establish a benchmark for addressing the lab-to-field gap but also provide a transferable framework for future research in similar agro-climatic regions, particularly for researchers focusing on field-based disease detection with state-of-the-art deep learning approaches.
In view of the above, the present research aims are as follows:
(a)
To develop a hybrid deep-learning framework that integrates U2-Net-based leaf segmentation, MobileNetV2-based feature extraction, and Bidirectional Gated Recurrent Unit (Bi-GRU) networks for automated leaf disease detection.
(b)
To quantitatively evaluate the contribution of segmentation-assisted feature extraction and sequential feature modeling by comparing the proposed CNN-Bi-GRU architecture against baseline deep-learning models using accuracy, precision, recall, and F1-score metrics. To assess the effectiveness of the proposed framework for accurate disease recognition across multiple crop species and disease categories. To validate the generalization capability and robustness of the proposed framework using curated PlantVillage datasets and independently collected field datasets, and to assess its suitability for real-time plant disease monitoring applications.
(c)
To investigate the influence of field-level soil and environmental conditions on the transferability of deep learning-based disease classification models using an IoT-based soil monitoring system.
The paper is organized as follows: Section 2 describes the methodology, including datasets in sub-Section 2.1, pre-processing in sub-Section 2.2, U2-Net segmentation in sub-Section 2.3, experimental setup in Section 2.4, and a graphical workflow of the study in Section 2.5. Section 3 presents and discusses the experimental results, while Section 4 concludes with key findings and directions for future work. Section 5 presents the limitations and future scope of the present study.

2. Materials and Methods

2.1. Datasets

The present study employed two primary data sources. First, the publicly available PlantVillage dataset was used as a benchmark for training and validation. Secondly, an iPhone camera with a 13 mm lens was used to capture high-resolution leaf images in a natural environment. The dataset represents images collected between 9 July and 18 July, 2025, which is a critical period for disease manifestation due to favorable climatic conditions such as high humidity and moderate rainfall. To ensure diversity and model generalizability, images were taken under varying environmental conditions, including different light intensities and disease severities observed in these regions. For preprocessing, the diseased portions of the leaves were manually extracted as patches from the original high-resolution images to focus on the affected areas.
These patches were treated as individual data samples and initially resized to a uniform dimension of 300 × 300 pixels for U2-Net-based segmentation. After segmentation and background removal, the resulting leaf regions were resized to 224 × 224 × 3, consistent with the input requirements of the MobileNetV2 backbone used for CNN-BiGRU classification.
This comprehensive dataset, with its geographical and seasonal diversity, aims to provide a robust basis for evaluating the model’s performance and generalizability across similar agricultural settings [30]. The inclusion of real-field imagery was intended to improve the generalization and robustness of the proposed hybrid deep learning framework under heterogeneous agricultural conditions. Notably, our earlier research utilized citrus fruit data collected from the same fields, where a conventional CNN model was applied for automated fruit detection and classification [30]. Building on this prior work, the present study extends the approach to leaf disease detection, integrating benchmark and field datasets for comprehensive evaluation.
The PlantVillage dataset offers a large-scale, annotated collection of plant leaf images captured under controlled environments [14]. In contrast, the field samples introduce variability in terms of background noise, lighting, and natural disease progression, thereby enhancing the robustness of the proposed model. We considered the leaves of pepper, potato, and tomato plants (both healthy and diseased categories) from the PlantVillage dataset, which comprises 41,276 sample images. Of these, 28,068 images (68%) were allocated for training to optimize model weights, while 4953 images (12%) were used for validation to monitor performance on unseen data, tune hyperparameters, and reduce overfitting. Finally, 8255 images (20%) were reserved as a test set to provide an unbiased evaluation of the trained model’s performance. The PlantVillage dataset was partitioned into training (68%), validation (12%), and testing (20%) subsets using stratified sampling to preserve class distributions. This partitioning strategy provides a balance between effective model learning, hyperparameter tuning, and unbiased evaluation while maintaining a sufficiently large independent test set for reliable assessment of model generalization.
Although the 70–15–15 strategy is widely employed in deep learning research [6,31], the slightly larger test set in this study was adopted to ensure robust statistical evaluation across multiple disease categories, particularly in the presence of class imbalance. This allocation is consistent with best practices in CNN-based plant disease recognition, where sufficient validation data is required to optimize loss functions such as class weighting or focal loss [32] and avoid bias toward majority classes. Moreover, for a hybrid CNN-BiGRU model, maintaining relatively larger validation and testing sets is advantageous, as the recurrent component benefits from more diverse unseen examples to fine-tune temporal dependencies and reduce the risk of overfitting to sequential noise during training.
Figure 1 illustrates the geographical location of the study fields near Eluru (16.71° N, 81.10° E), Andhra Pradesh, India. The study area lies within the Krishna–Godavari agro-climatic zone and is characterized by a tropical wet-and-dry climate. The region receives an average annual rainfall of approximately 900–1100 mm, primarily during the southwest monsoon season, and experiences mean temperatures ranging from 20 °C to 40 °C throughout the year. The dominant agricultural soils in the area consist of alluvial and clay loam soils with moderate water-holding capacity and favorable conditions for crop cultivation. These agro-climatic and soil characteristics make the region suitable for evaluating plant disease detection systems under practical field conditions.

2.2. Pre-Processing Workflow for Leaf Disease Detection

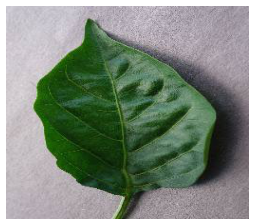
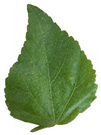
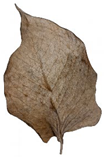
Table 1 shows the representative leaf image dataset comprising field-acquired samples and PlantVillage images. Although the PlantVillage dataset contained Tomato Target Spot and Tomato Mosaic Virus categories, these diseases were not encountered during the field survey period. Consequently, they were not represented in the field-acquired image dataset.
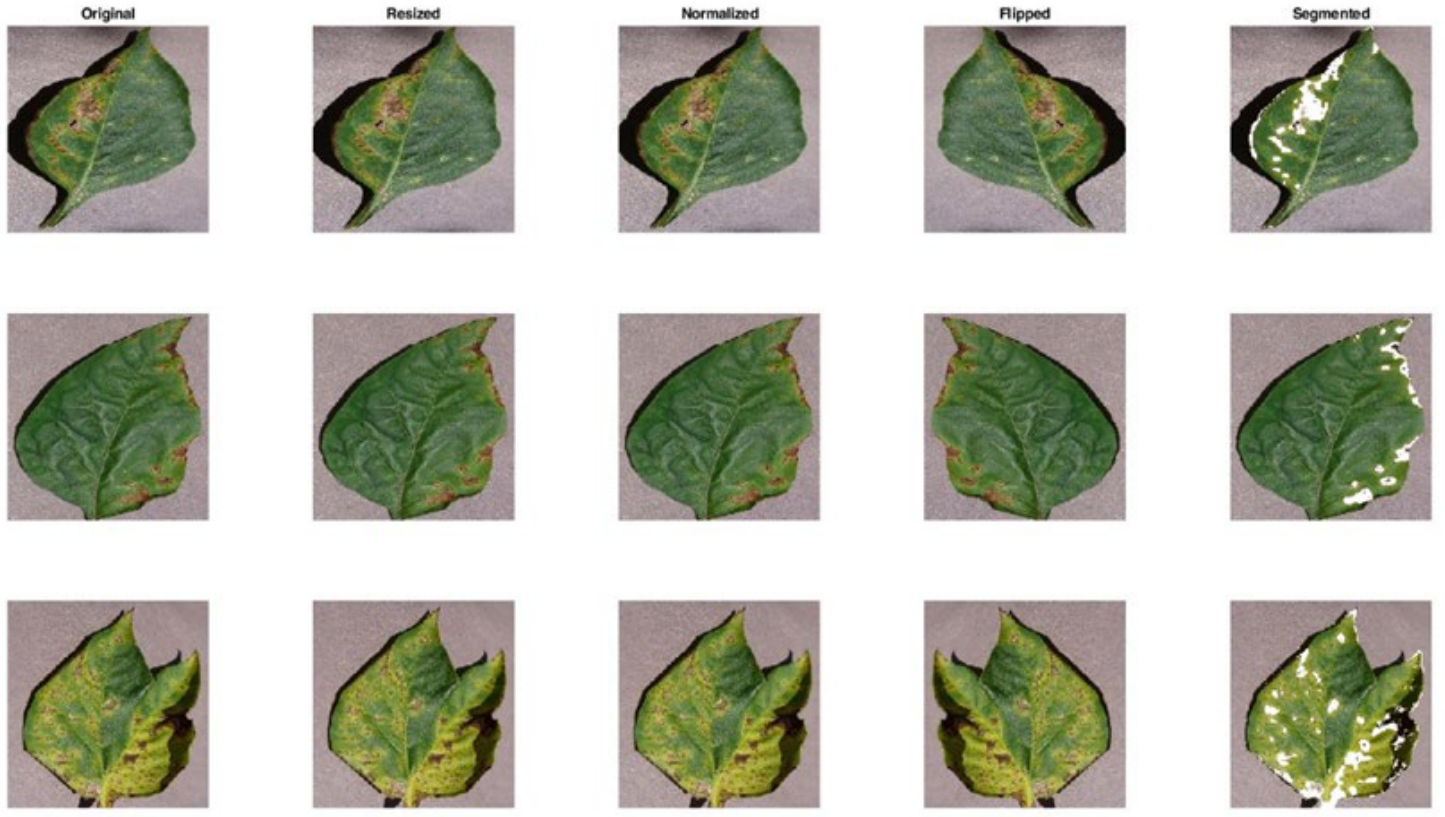
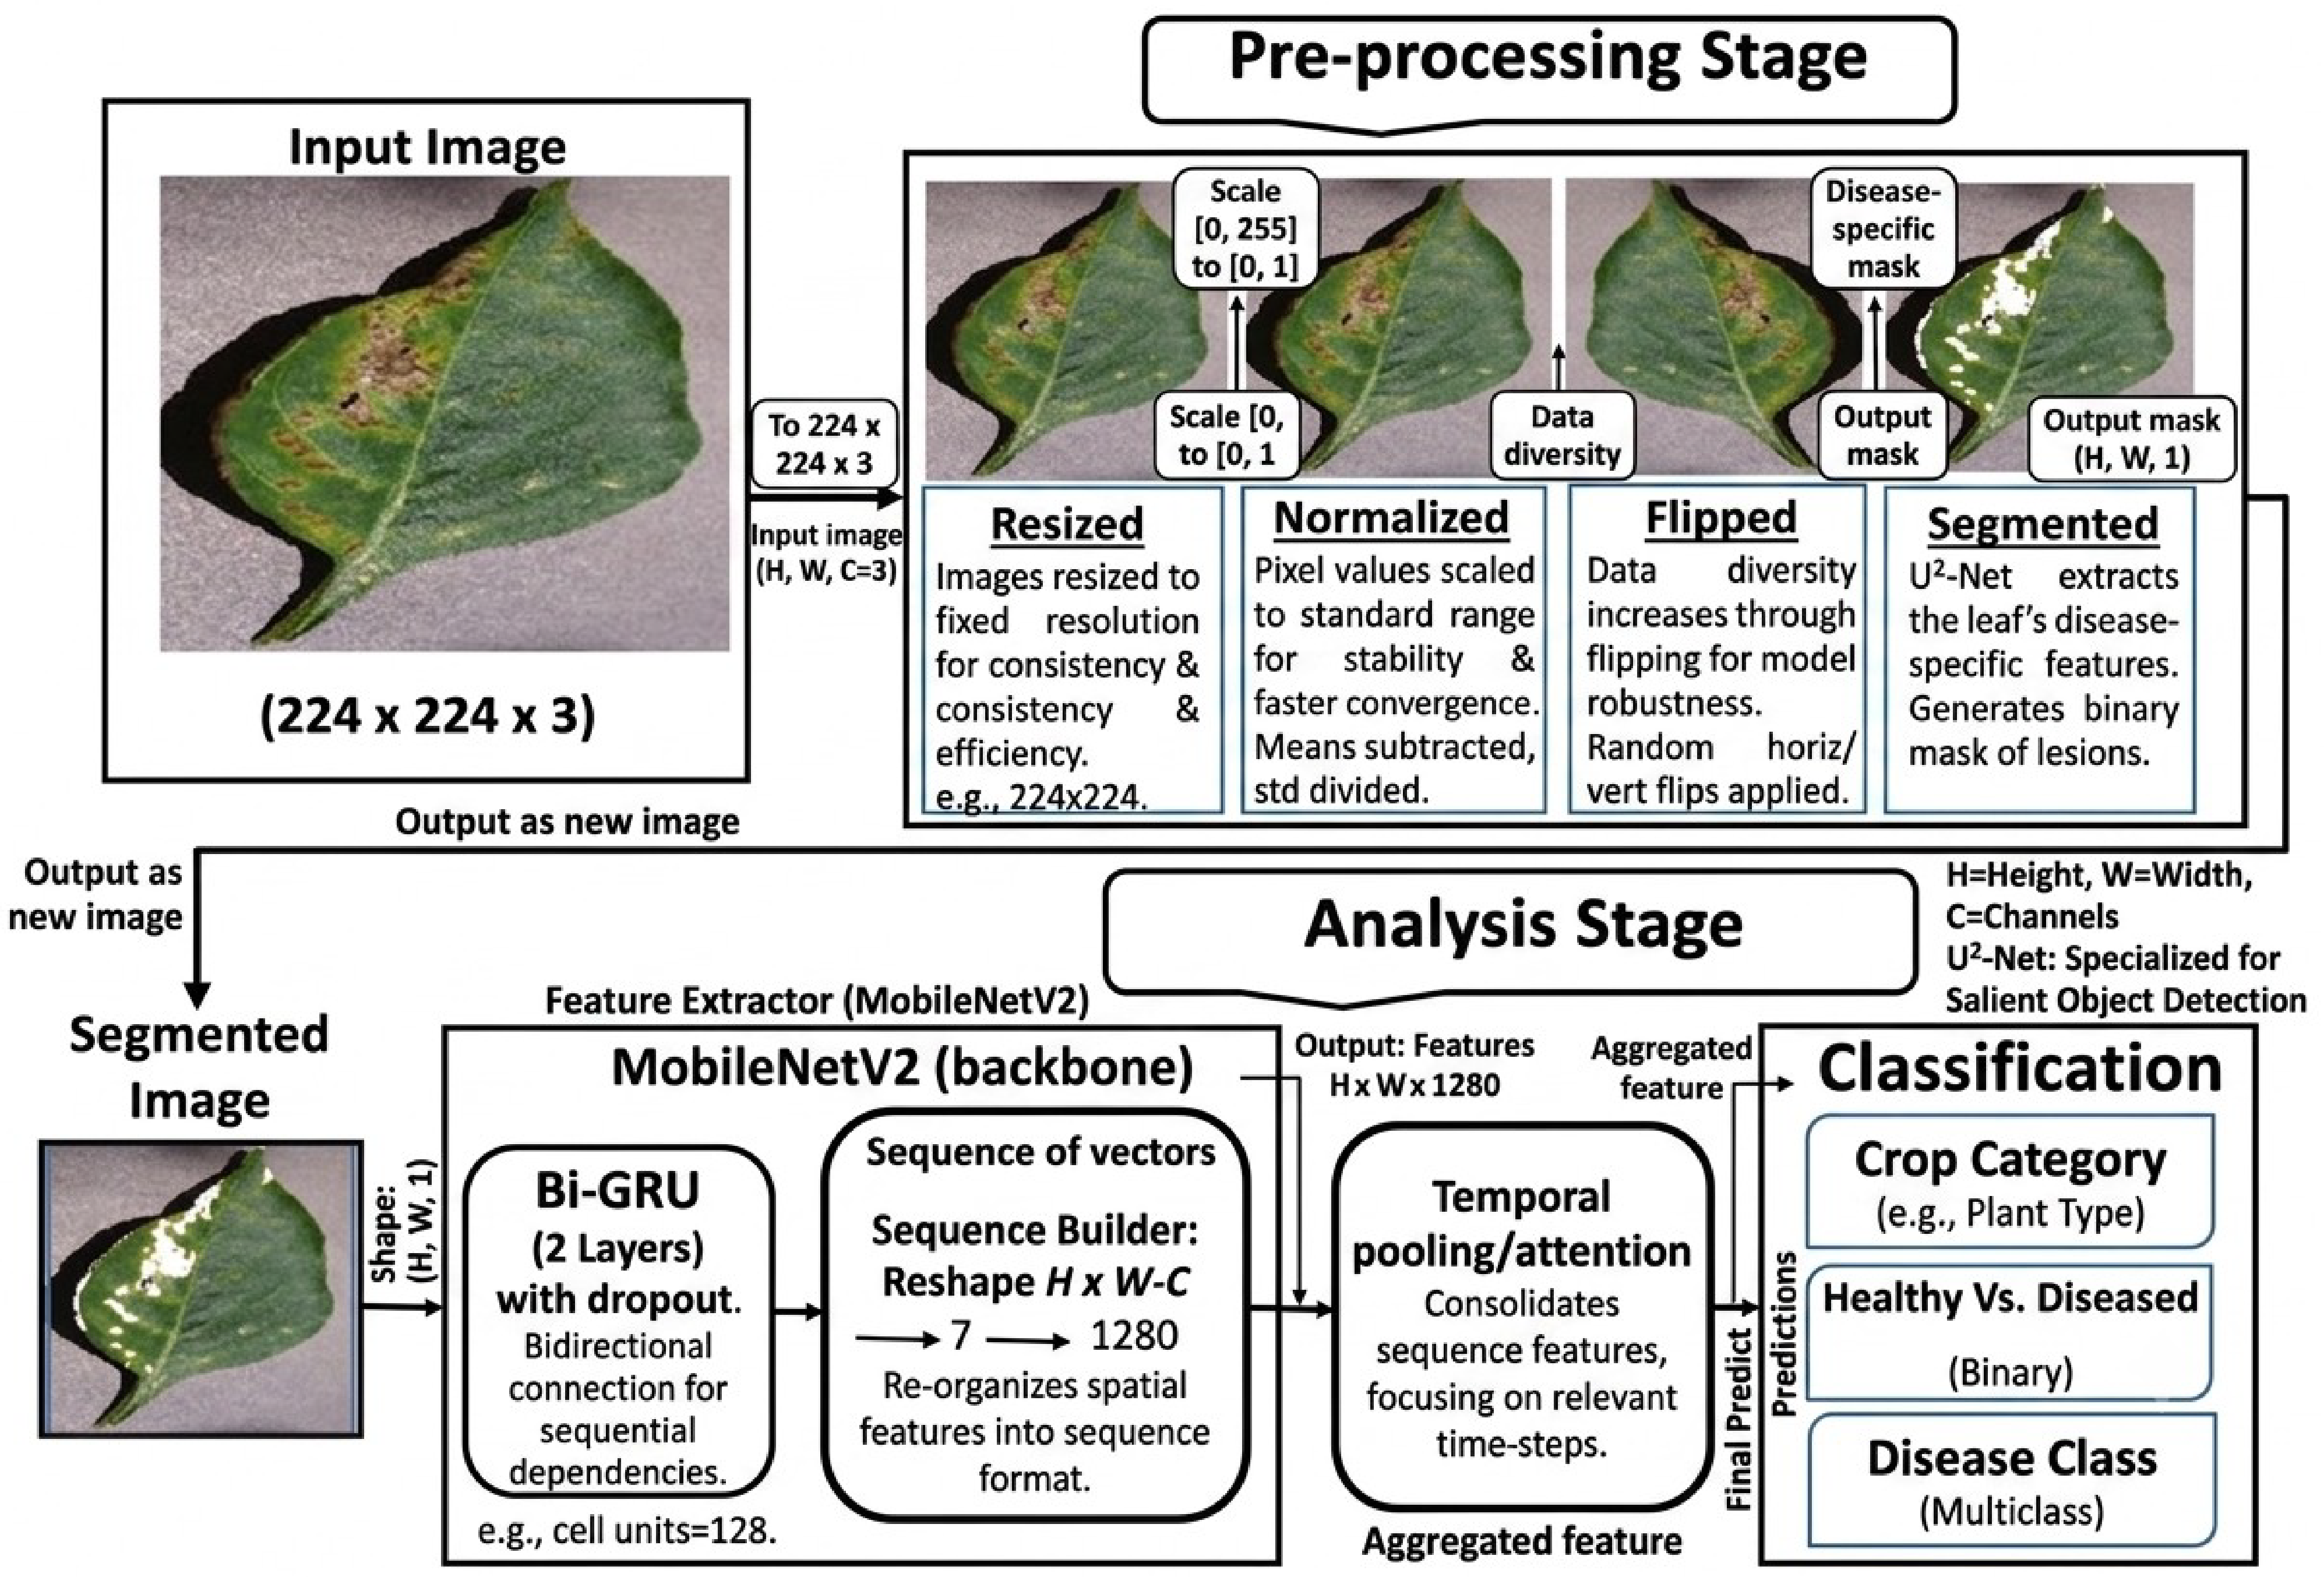
PlantVillage samples supplement the dataset with standardized images across diverse pathologies. Diseased categories include Bacterial leaf spot in Mulberry, Bacterial spot in Bell pepper, Early blight and Late blight in Potato, and Target spot, Mosaic virus, and Bacterial spot in Tomato. The diversity across species and pathologies enables robust model training, supporting generalization across different crops. By including both controlled (PlantVillage) and heterogeneous field-acquired samples, the dataset ensures evaluation under conditions approximating practical agricultural deployment. To ensure uniformity and optimize computational efficiency, all images were subjected to a standardized pre-processing pipeline, as illustrated in Figure 2. Each image first underwent resizing to a fixed resolution, ensuring dataset consistency and reducing computational overhead during training [6]. This was followed by normalization, where pixel intensities were scaled to a standard range to accelerate convergence and stabilize the learning process [33].
To enhance data diversity and mitigate overfitting, augmentation techniques such as horizontal flipping, rotation, and scaling were applied, effectively increasing the variability of training samples and improving model robustness to orientation and geometric distortions [34,35]. Finally, an optional segmentation stage was employed using U2-Net to isolate the leaf from complex backgrounds. This ensured that disease-specific features were emphasized while minimizing the influence of irrelevant background artifacts [12,18]. Through this sequential pipeline—resizing, normalization, augmentation, and segmentation—the dataset was transformed into a balanced, information-rich input set. Such systematic pre-processing not only improved generalization but also enhanced the ability of convolutional neural networks to extract discriminative features, ultimately leading to higher accuracy in leaf disease classification [5,36].
To improve generalization and mitigate overfitting, data augmentation techniques, including flipping, rotation, and scaling, were applied to the training images. These transformations increased the diversity of the training samples and enhanced the robustness of the proposed framework to variations in leaf orientation, size, and imaging conditions.

2.3. U2-Net-Based Segmentation

The segmentation of the pre-processed images is carried out using the U2-Net model, a two-level and deeply nested U-shaped network specifically designed for salient object detection and fine-grained segmentation tasks [12]. The U-Net architecture’s encoder–decoder structure with skip connections efficiently utilizes both local and global information, enabling precise and fine-grained segmentation for tasks such as autonomous driving, scene interpretation, and medical image analysis [36]. The nested residual U-blocks (RSUs) form the core of U2-Net.
The output of an RSU block is defined as:
Y = F (X) + X
where X denotes the input feature map, F(X) represents the nested U-shaped feature extraction operation within the RSU block, and Y is the refined output feature map. The residual connection facilitates feature reuse, improves gradient propagation, and enables the network to capture both local details and global contextual information efficiently.
Each RSU embeds a lightweight U-Net structure within a single encoder–decoder stage, enabling effective feature reuse and refinement. In the context of plant disease analysis, U2-Net significantly enhances the identification of infected regions on leaves by capturing both global contextual features and local fine details.
This design provides several advantages:
(a)
The nested architecture bridges the semantic gap between encoder and decoder by preserving multi-scale contextual information.
(b)
The residual connections mitigate vanishing gradients and improve training stability.
(c)
The saliency-driven mechanism suppresses irrelevant background information while highlighting diseased regions.
(d)
Hierarchical multi-level supervision ensures both coarse and fine segmentation maps contribute to the final output.
The nested U-block operation at stage (p, q) can be represented as
Y p ,   q = R f ( Y p 1 ,   q ,   q = 0 ,
Y p ,   q = R f ( k = 0 q 1 C A g Y i ,   k ,   U   Y p + 1 ,   q 1 ) ,   q > 0 ,
where (p) denotes the hierarchical level (depth) of the RSU module and (q) denotes the position of the convolutional layer within that level.   ( Y { p ,   q ) } ) represents the corresponding intermediate feature representation produced during forward propagation.
  • Y (p, q) denotes the output of the RSU block at depth p and stage q.
  • F (⋅) is a convolutional layer with ReLU activation.
  • R {⋅} indicates residual connections.
  • Ag (⋅) is the attention/saliency gating function.
  • C (⋅) denotes the concatenation of feature maps.
  • U (⋅) represents an up-sampling operator.
This recursive formulation enables U2-Net to simultaneously refine low-level structural details and high-level semantic features (through skip connections), which has been reported to achieve competitive segmentation performance compared with conventional architectures such as U-Net and UNet++ [12,13,36]. The U2-Net segmentation effectively isolates leaf regions from the background while preserving disease-related visual characteristics. This step is useful before applying classification models like MobileNetV2–BiGRU.
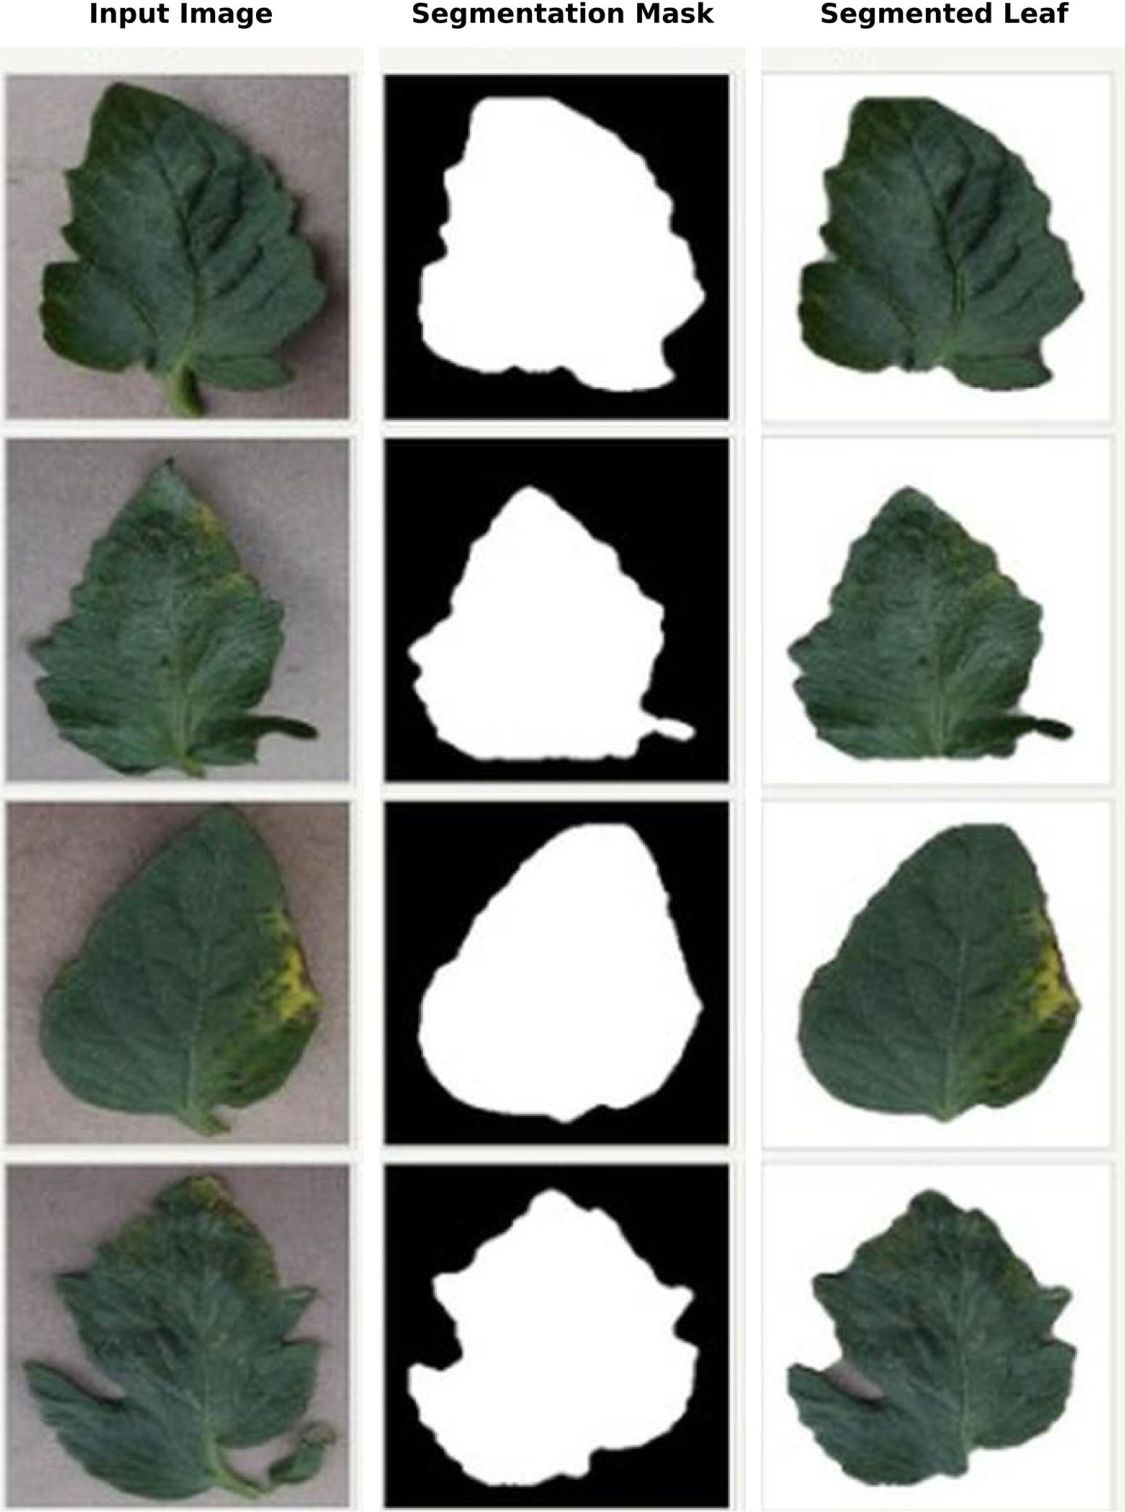
Figure 3 shows representative leaf segmentation results generated using the U2-Net framework. The model was trained for 50 epochs using the Adam optimizer (learning rate = 1 × 10⁻⁴, batch size = 16) with a hybrid Binary Cross-Entropy (BCE) and Dice loss function. The resulting segmentation masks effectively isolated leaf regions from the background while preserving disease symptoms and lesion characteristics. The extracted leaf images were resized to 224 × 224 × 3 pixels and supplied to the MobileNetV2–BiGRU classifier (Figure 4). This preprocessing step reduced background interference and improved the extraction of disease-relevant features.
The left column of Figure 3 displays representative original leaf images exhibiting varying disease symptoms and severity levels. The middle column presents the corresponding segmentation masks generated by the U2-Net framework, while the right column shows the extracted leaf regions after background removal. The segmentation process effectively isolates the leaf foreground from complex background elements while preserving disease-relevant visual features, including lesion boundaries, discoloration patterns, and symptomatic regions. By eliminating irrelevant background information, the segmentation stage provides cleaner inputs for subsequent feature extraction and classification. This preprocessing step enhances the ability of the MobileNetV2–BiGRU network to focus on disease-specific characteristics, thereby improving classification robustness and reducing the influence of background variability commonly encountered in field-acquired images.
The CNN–BiGRU architecture is designed to learn spatial representations via convolutional neural network (CNN) layers and sequential dependencies via Bidirectional Gated Recurrent Unit (BiGRU) layers. In the proposed framework, MobileNetV2 serves as the feature extraction backbone, while the BiGRU component models dependencies among the extracted feature vectors, enabling enhanced representation learning. BiGRU was selected because previous studies have demonstrated its effectiveness in capturing long-range feature dependencies while employing a simpler gating mechanism than conventional Long Short-Term Memory (LSTM) networks [37,38]. The bidirectional structure further improves contextual feature extraction by processing feature sequences in both forward and backward directions. Consequently, the CNN–BiGRU architecture provides a robust framework for plant disease classification and was therefore adopted in the present study.
It is worthwhile mentioning that although the input data consist of static leaf images, the Bi-GRU module is employed to process sequentially arranged feature representations generated by the MobileNetV2 backbone rather than temporal image sequences. Specifically, the extracted convolutional feature maps are reshaped into ordered feature vectors and fed into the Bi-GRU layer to capture long-range contextual dependencies among spatial features. Consequently, the Bi-GRU serves as a feature refinement mechanism that enhances discriminative representation learning and classification accuracy, rather than modeling temporal changes in plant disease progression.
To further enhance the discriminative capacity of the model, the pre-processed images were segmented using the U2-Net model [12], which is specifically designed for salient object detection. By extracting the leaf region and suppressing background artifacts, U2-Net ensures that the CNN learns only disease-relevant spatial patterns, thereby minimizing overfitting to irrelevant features such as soil, shadows, or imaging conditions. This segmentation not only improves intra-class consistency but also enables the Bi-GRU component to capture sequential dependencies across leaf patches (e.g., tip–midrib–base progression of lesions) in a more meaningful manner. Consequently, the integration of U2-Net segmentation with CNN-BiGRU is expected to yield superior classification accuracy, better generalization across environments, and enhanced sensitivity to minority disease classes when compared with models trained on unsegmented raw images.

2.4. Experimental Setup

The proposed CNN–Bi-GRU framework employed MobileNetV2 as the feature extraction backbone. The extracted feature representations were subsequently processed using Bidirectional Gated Recurrent Unit (Bi-GRU) layers to capture sequential dependencies among spatial features. The model was trained using the Adam optimizer with an initial learning rate of 0.001 and categorical cross-entropy loss. The model was trained for a maximum of 100 epochs using the Adam optimizer and early stopping. Training converged after 43 epochs based on validation loss.
Before classification, leaf images were processed using the U2-Net segmentation model to isolate symptomatic leaf regions and reduce background interference. The segmentation module generated pixel-level masks that were applied to extract the leaf foreground before feature extraction. This preprocessing step improved disease localization and reduced the influence of complex backgrounds and non-leaf objects.
All experiments were conducted on a Lenovo ThinkCentre M70s Gen 3 desktop computer running Microsoft Windows 11 Pro, equipped with a 12th Generation Intel® Core™ i7-12700 processor (12 cores, 20 logical processors) and 16 GB RAM. Model performance was evaluated using accuracy, precision, recall, and F1-score metrics. Data augmentation techniques, including random rotation, horizontal flipping, zooming, and brightness adjustments, were applied during training to improve model generalization. It is also worthwhile to mention that the field dataset comprised approximately 700 images collected under natural environmental conditions. An examination of the class distribution indicated no severe imbalance among the available categories. Consequently, no additional imbalance-mitigation techniques, such as SMOTE, oversampling, or class-weighted loss functions, were employed.
The present study focused on classification performance and generalization capability. Therefore, detailed measurements of computational complexity, including FLOPs, parameter count, memory footprint, and inference latency, were not included and are identified as an important direction for future investigation.

2.5. Workflow of the Present Research

Figure 4 depicts the workflow of the proposed U2-Net-assisted CNN (MobileNetV2) + Bi-GRU leaf-diagnostics pipeline. Following U2-Net segmentation performed on 300 × 300 pixel images, the segmented leaf regions were resized to 224 × 224 × 3 and standardized via normalization and augmentation before being supplied to the MobileNetV2–BiGRU classification framework. In analysis, MobileNetV2 extracts a spatial feature map (e.g., 7 × 7 × 1280), a sequence builder reshapes the map into spatial tokens, and a Bi-GRU models long-range dependencies across tokens. Attention/temporal pooling aggregates the sequence into a global embedding that feeds multi-task heads to predict crop category, healthy vs. diseased, and disease class. This hybrid CNN-BiGRU architecture leverages spatial feature extraction and sequential modeling, making it suitable for complex image analysis tasks like plant disease detection.

3. Results and Discussion

3.1. Classification Performance—PlantVillage Data

The identification and categorization of diverse leaf diseases were systematically performed to ensure accurate recognition of disease types. To establish the robustness of the proposed framework, its classification performance was rigorously benchmarked against state-of-the-art models, including Deep Convolutional Neural Networks (DCNN), DenseNet, Vision Transformer (ViT), and EfficientNet-B3. Comparative evaluation was conducted using a comprehensive set of performance metrics encompassing accuracy, precision, recall, F1-score, specificity, and the area under the ROC curve (AUC-ROC).
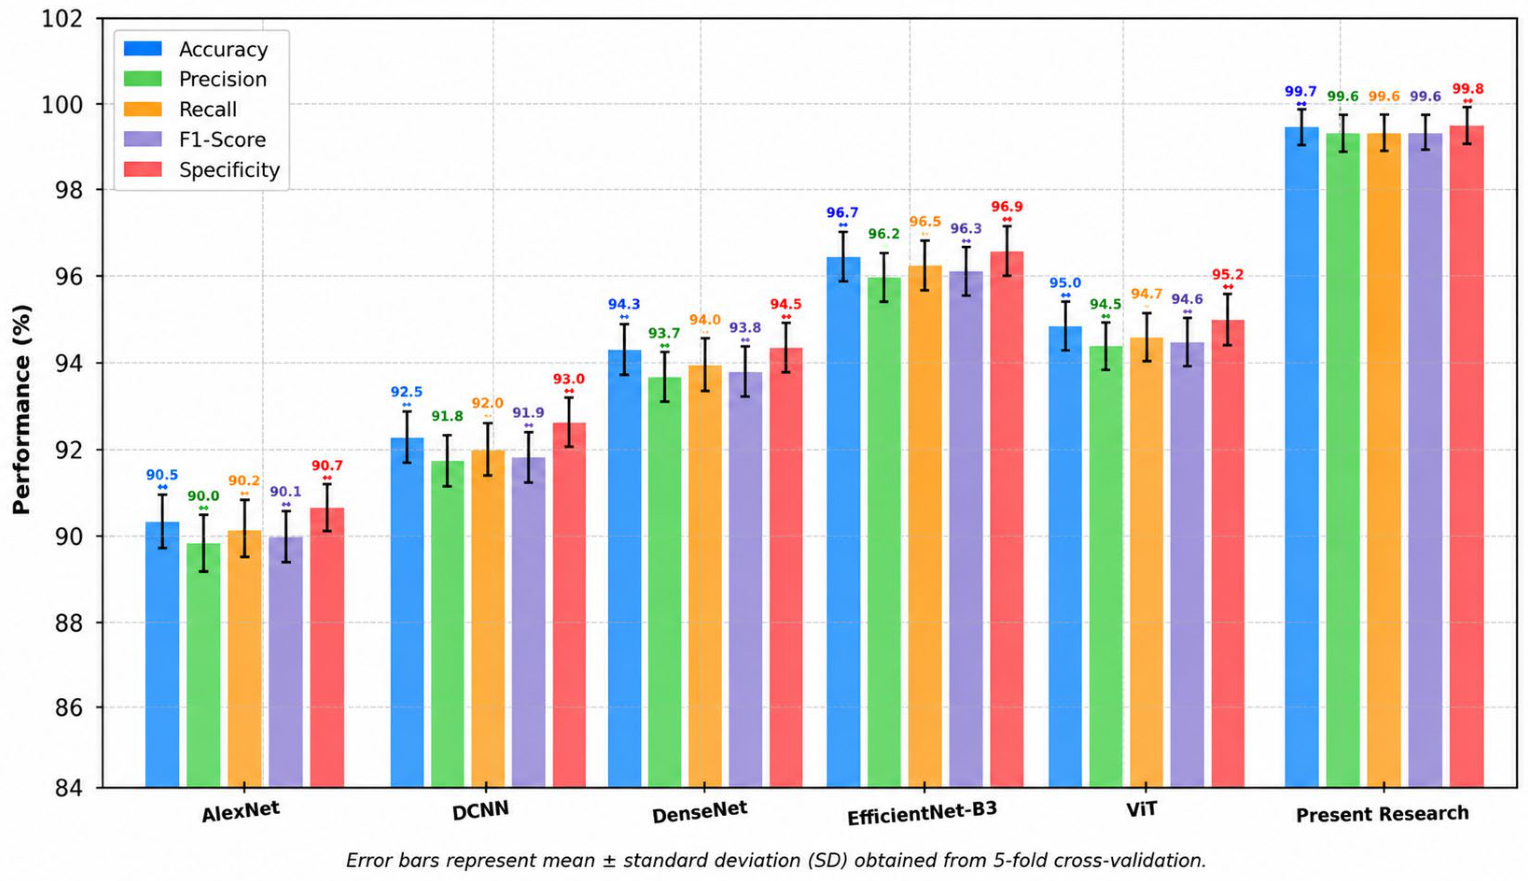
The results, illustrated in Figure 5, along with error bars, demonstrate that the proposed approach consistently outperforms existing architectures across multiple evaluation criteria, thereby underscoring its efficacy and reliability for plant disease diagnosis. The performance metrics considered include accuracy, precision, recall, F1-score, and specificity. The results demonstrate that the present research model achieves superior performance across all metrics, reaching an accuracy of 99.8%, thereby significantly outperforming existing approaches in terms of classification efficacy and reliability.
The exceptionally high performance achieved on the PlantVillage dataset should be interpreted with caution because the dataset was acquired under controlled imaging conditions with relatively homogeneous backgrounds and limited environmental variability. Such characteristics reduce intra-class complexity and often facilitate higher classification accuracy than would be expected under real-world conditions. The independent field evaluation conducted near Eluru revealed a substantial decrease in accuracy, demonstrating the presence of domain shift and highlighting the challenges associated with transferring models trained on benchmark datasets to practical agricultural environments. These findings underscore the importance of incorporating field-collected data and environmental sensing information to improve model robustness and generalization.
The inclusion of statistical error bars strengthens the reliability of the comparative analysis by demonstrating the variability of the models under repeated cross-validation experiments. Figure 5 confirms that the proposed framework significantly outperforms the existing deep learning models in terms of predictive accuracy, sensitivity, precision, and specificity, making it highly suitable for reliable and accurate leaf disease classification.
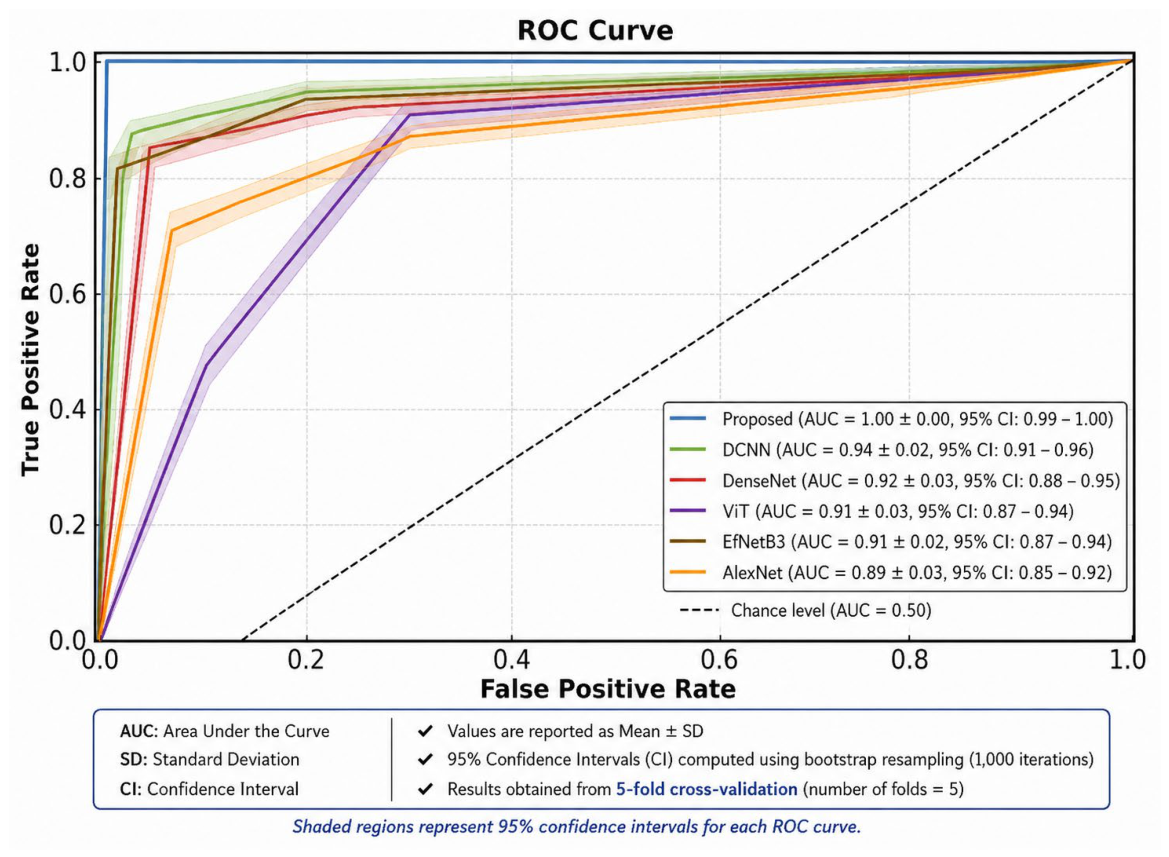
The ROC analysis, as shown in Figure 6, demonstrates the superior classification capability of the proposed deep learning framework compared with the benchmark architectures. The proposed model achieved a near-perfect ROC performance with an average AUC approaching 1.00 (95% CI: 0.99–1.00) across the five-fold cross-validation experiments. Among the comparative models, DCNN exhibited the second-best performance with an AUC of 0.94 ± 0.02, followed by DenseNet with 0.92 ± 0.03. Vision Transformer (ViT) and EfficientNetB3 produced comparable performance levels, each achieving an AUC of approximately 0.91, although with slightly broader confidence intervals, suggesting moderate variability in classification performance. AlexNet recorded the lowest performance with an AUC of 0.89 ± 0.03, indicating comparatively weaker discriminative capability for plant leaf disease classification, particularly for disease classes exhibiting similar visual symptoms.
The shaded confidence bands around each ROC curve represent the 95% confidence intervals obtained through bootstrap resampling, providing an estimate of uncertainty associated with model performance. The relatively narrow confidence intervals observed for the proposed framework indicate stable performance across the cross-validation folds. However, the near-perfect ROC performance achieved on the PlantVillage dataset should be interpreted in the context of the dataset’s controlled acquisition conditions and limited environmental variability. The substantial reduction in accuracy observed during independent field validation demonstrates that high benchmark performance does not necessarily translate to equivalent real-world performance. These findings highlight the importance of evaluating plant disease classification models using both benchmark and field-collected datasets to assess robustness and generalization capability under practical agricultural conditions.
Further, an ablation study was conducted to evaluate the contribution of the MobileNetV2 backbone, GRU, Bi-GRU, and U2-Net segmentation modules. The results demonstrated progressive improvements in classification performance from MobileNetV2 (96.4% accuracy) to MobileNetV2+GRU (97.8%), MobileNetV2+Bi-GRU (98.9%), and the complete U2-Net+MobileNetV2+Bi-GRU framework (99.8%). Detailed results are provided in Supplementary Table S1.
Hybrid architectures combining CNNs with recurrent units like GRU or LSTM consistently exhibit robust performance across diverse domains—including motor imagery classification in EEG [38] and multi-class disease recognition under field conditions [39,40]. Notably, CNN–BiGRU and CNN–BiLSTM structures are repeatedly shown to outperform pure CNNs, particularly with limited training data, due to their ability to capture both spatial features and temporal dependencies [41]. Although some hybrid CNN–RNN models can achieve these gains with relatively lower computational overhead [4], it is also true that more complex hybrids can demand increased computational resources and fine-grained hyperparameter tuning. Nonetheless, their superior generalization—especially in scenarios marked by data scarcity, variability in field setups, and non-local symptom patterns—strongly justifies the architectural complexity for critical agricultural applications.
Several hybrid deep learning models trained on controlled datasets such as PlantVillage and PlantDoc, which are characterized by uniform backgrounds, consistent illumination, and standardized imaging conditions, routinely report accuracies exceeding 99%. However, their performance degrades significantly when applied to authentic in situ field-based imagery. This disparity arises from the profound domain shift between curated datasets and real-world agricultural environments, where variability in lighting, occlusion, background clutter, and symptom expression introduces substantial intra-class variation. Such findings underscore the inherent limitations of current deep learning architectures in generalizing from simplified laboratory settings to complex natural ecosystems. Consequently, field-based evaluation emerges as a more realistic yet inherently challenging benchmark of model robustness, and the present study provides a systematic demonstration of this critical aspect.

3.2. Classification Performance—Field-Based Leaf Images

The performance of the proposed deep learning framework was further evaluated using an independent dataset of 700 leaf images collected from open-field environments near Eluru, India, with 68% used for training, 12% for validation, and 20% for testing (approximately 140 test images). The dataset comprised images of Epipremnum aureum, Mulberry, Guava (Psidium guava), and Hibiscus (Hibiscus rosasinensis) leaves, categorized into healthy and diseased classes, including Bacterial leaf spot and Anthracnose. The nearly uniform class distribution was maintained to minimize class imbalance and ensure unbiased model training and evaluation.
All images were manually annotated based on visible disease symptoms and verified using standard plant pathology references and expert consultation. To ensure annotation quality, the labels were reviewed and cross-checked before model training. The dataset was designed to maintain a reasonably balanced distribution among healthy and diseased classes across the selected plant species, thereby reducing potential bias associated with class imbalance. The collected images encompass substantial variability in environmental conditions, disease severity, illumination, and background complexity, making the dataset suitable for evaluating model robustness under real-world agricultural scenarios.
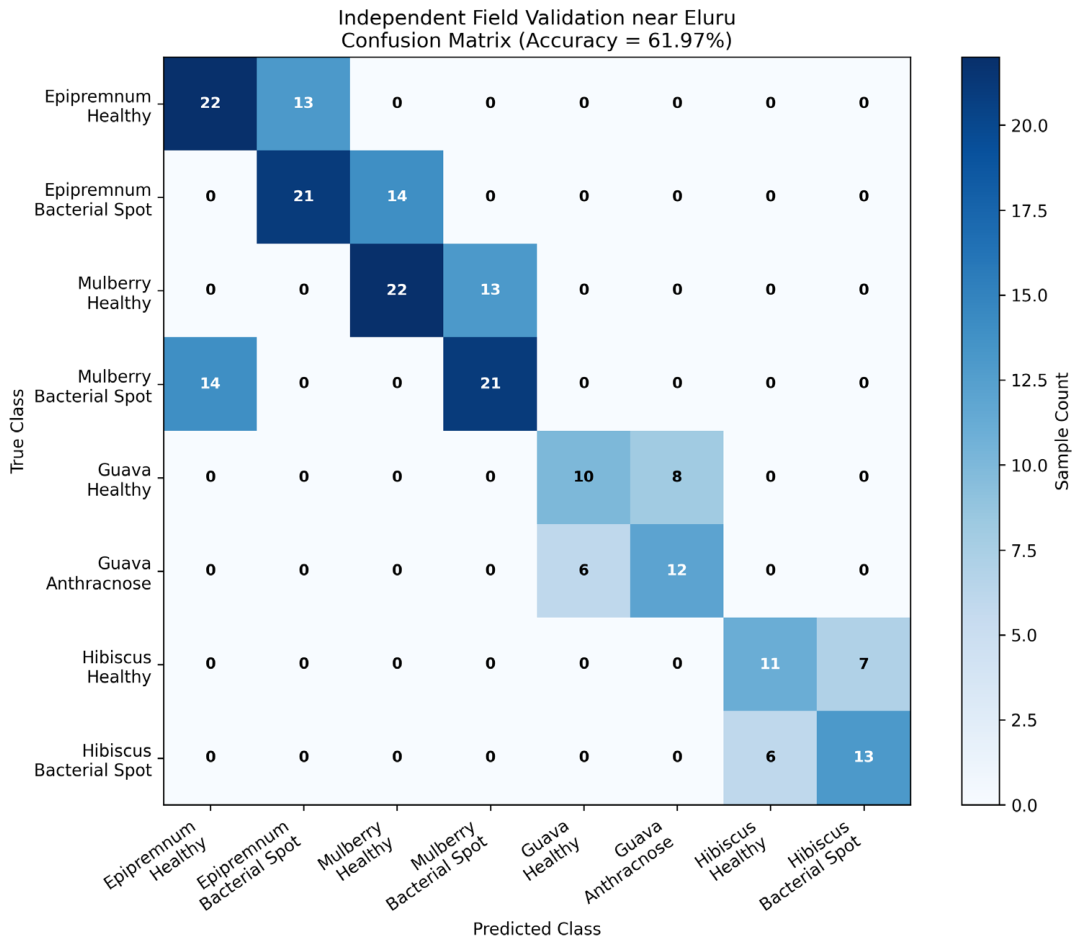
Figure 7 presents the confusion matrix obtained during field validation. The results indicate an overall classification accuracy of approximately 61.97%, with notable misclassification occurring between healthy and diseased categories within the same plant species. Specifically, Epipremnum Healthy, Epipremnum Bacterial spot, Mulberry Healthy, and Mulberry Bacterial spot achieved correct classification rates of 62.86%, 60.00%, 62.86%, and 60.00%, respectively. Similarly, Guava Healthy, Guava Anthracnose, Hibiscus Healthy, and Hibiscus Bacterial spot achieved recall values of 55.56%, 66.67%, 61.11%, and 68.42%, respectively. The observed confusion among classes highlights the challenges associated with disease recognition under real-world field conditions, where variations in illumination, background complexity, environmental factors, and symptom severity significantly affect model generalization and transferability.
Table 2 summarizes the class-wise performance of the proposed framework during independent field validation near Eluru. Recall values ranged from 55.56% to 68.42%, indicating moderate success in correctly identifying healthy and diseased leaf samples under real-world conditions. Specificity values ranged from 92.13% to 96.92%, indicating a strong ability to distinguish target classes from non-target classes despite environmental variability. The highest recall and F1-score were achieved for Hibiscus bacterial spot (68.42% and 66.67%, respectively), while Guava Healthy exhibited the lowest recall (55.56%). Overall, the relatively high specificity combined with moderate recall and F1-scores suggests that the model maintained good discriminative capability but experienced reduced sensitivity under field conditions. These findings are consistent with the effects of domain shift, background complexity, illumination variation, and differences in disease symptom expression between benchmark and real-world agricultural environments.
The resulting confusion matrix yielded an overall test accuracy of 61.97%, corresponding to 86 correctly classified samples and 54 misclassifications out of 140 field-collected leaf images. A detailed examination of the confusion matrix reveals several notable misclassification patterns. For Epipremnum aureum, 22 healthy leaves were correctly identified, whereas 13 healthy samples were misclassified as bacterial spot-infected leaves. Similarly, 21 bacterial spot-infected leaves were correctly classified, while 14 samples were incorrectly assigned to the Mulberry Healthy category. For Mulberry, 22 healthy leaves were correctly recognized, whereas 13 samples were misclassified as Mulberry bacterial spot. In addition, 21 bacterial spot-infected leaves were correctly classified, while 14 were incorrectly identified as Epipremnum Healthy.
These results highlight the challenges associated with cross-species disease recognition under real-world field conditions. Confusion was particularly evident between healthy and diseased categories, likely due to similarities in visual symptom expression, varying stages of disease progression, heterogeneous backgrounds, illumination changes, and environmental variability present in open-field imagery. Similar observations have been reported in previous studies, where models trained on controlled benchmark datasets such as PlantVillage achieved very high classification accuracies exceeding 99% [6,18] but experienced substantial performance degradation when evaluated on independent field datasets due to domain shift, intra-class variability, and differences in image acquisition conditions. These findings emphasize the importance of incorporating field-specific data and environmental information to improve model robustness and generalization in practical agricultural monitoring systems.
In the following table, we present a few striking examples of healthy and diseased leaves retrieved from an open field and analyzed using our hybrid framework combining deep learning-based disease classification and IoT-enabled environmental monitoring. Table 3 shows various leaves, both healthy and unhealthy, and how the present hybrid approach differentiated crop category, health status, and disease class. The table also includes a remarks column in which possible reasons for correct or incorrect identification are explained.
Table 2 summarizes results for Epipremnum aureum and mulberry leaves under open-field conditions. For E. aureum, healthy leaves were consistently identified despite natural variegation, confirming the model’s ability to distinguish pigmentation from pathological lesions [1,2]. Diseased E. aureum with Bacterial Leaf Spot was correctly classified, as CNN-BiGRU effectively captured lesion-specific textures [3]. In mulberry, healthy leaves were correctly classified (Rows 5–6), but diseased samples were misidentified. Likely causes include background bias (desk texture learned instead of leaf features) [4] and loss of disease cues under complete necrosis, reducing inter-class separability [5]. These findings highlight that while CNN-BiGRU performs well on variegated and spot-type lesions, it struggles with advanced necrosis and background interference, emphasizing the need for background-invariant training and progressive disease datasets.
The results in Table 3 show that while the CNN–BiGRU framework performs effectively on variegated and spot-type lesions, it struggles with advanced necrosis and background interference, highlighting the need for background-invariant training and progressive disease datasets. A recent engineering-driven study using Retinex, RPN, and transmission modules reported improved accuracy, though such approaches remain non-organic in scope [42]. Importantly, most current works emphasize detection only after visible symptom onset, whereas transforming leaf images into thermal signatures may enable earlier disease diagnosis through pre-symptomatic temperature variations.
An IoT-based system incorporating an Arduino microcontroller was employed to record soil and environmental parameters at one-minute intervals, including humidity, temperature, pH, nitrogen (N), phosphorus (P), and potassium (K), during the vegetative growth stage [29]. It is worth mentioning that soil and microclimatic measurements are not incorporated as inputs to the CNN–BiGRU classification architecture. Instead, these variables are collected independently and analyzed separately to investigate potential causes of performance variation and reduced model generalization observed during field deployment. A comparison between temperature and humidity measurements obtained from the Arduino sensors and those provided by the India Meteorological Department (IMD, https://mausam.imd.gov.in/) revealed a strong agreement, demonstrating one-to-one similarity.
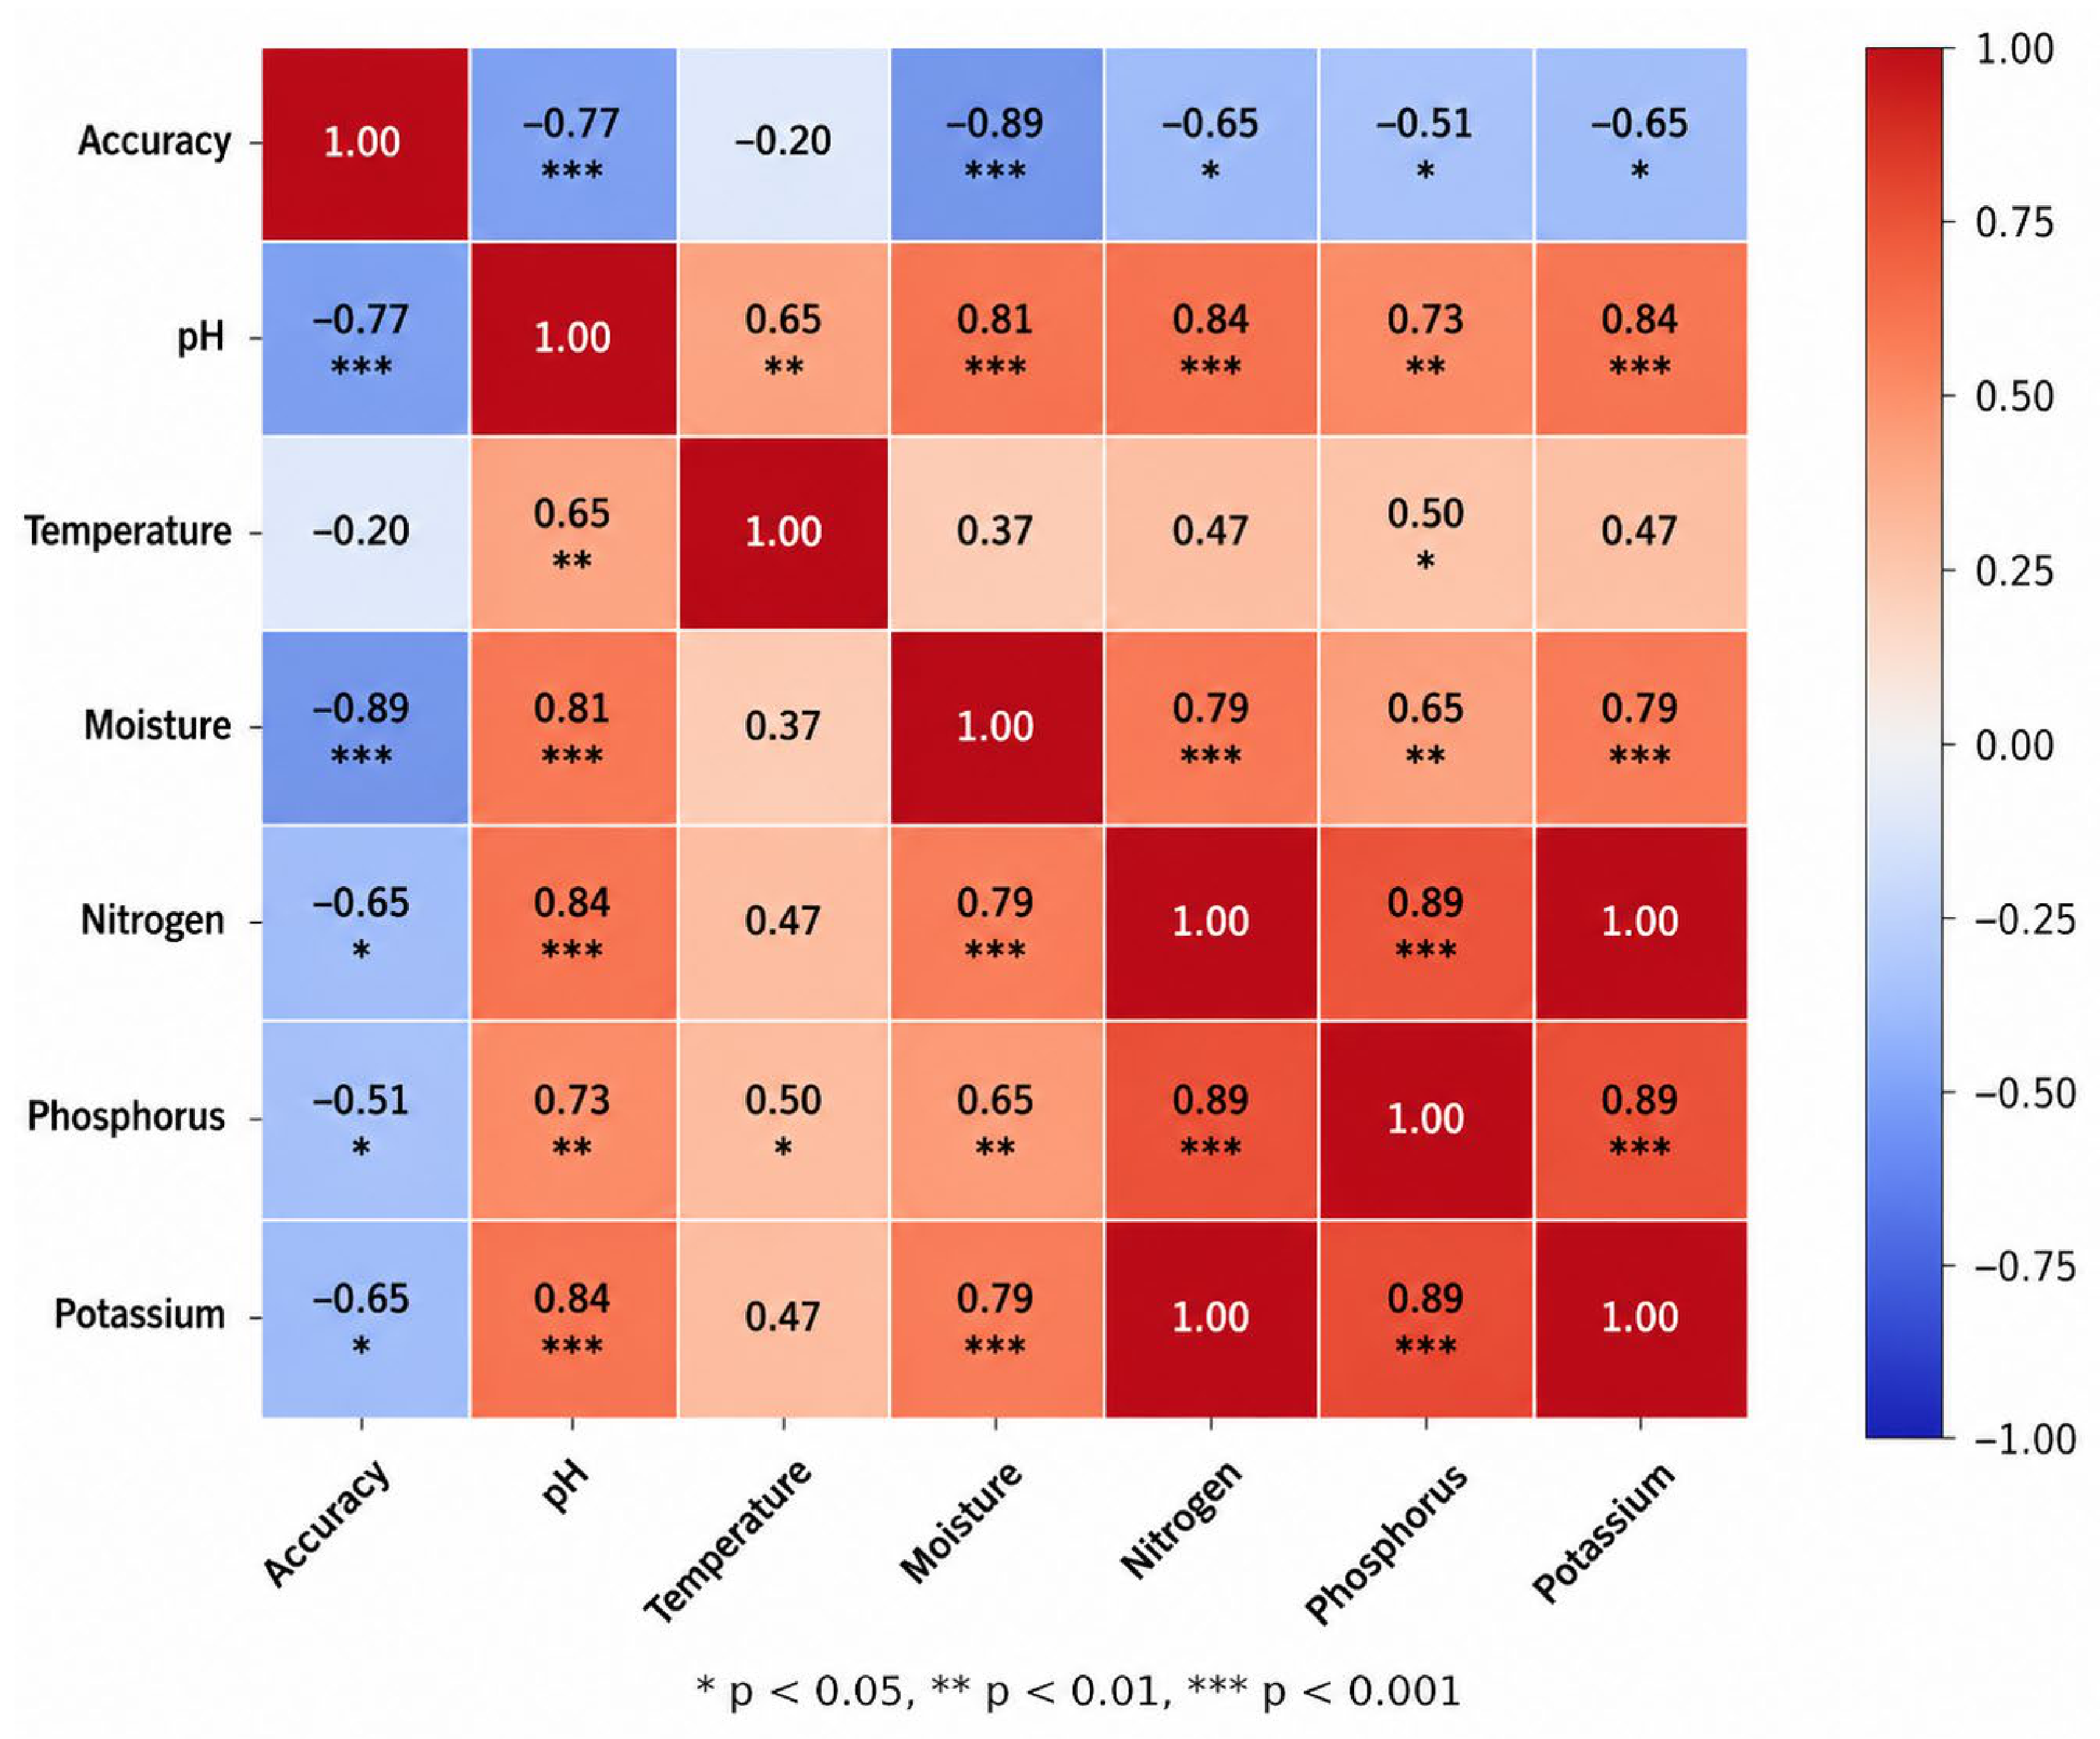
Figure 8 shows the Pearson correlation matrix with statistical significance, illustrating the relationship between environmental stressors and CNN–BiGRU model accuracy over a 10-day (from 9 July to 18 July 2025) monitoring period in Eluru, India. The Pearson correlation analysis reveals statistically significant relationships between in situ environmental stressors and the classification performance of the CNN–BiGRU model over the 10-day monitoring period in Eluru. A strong negative correlation was observed between soil moisture and model accuracy (r = −0.89, p < 0.001), indicating that elevated moisture levels substantially degrade classification performance under field conditions. Similarly, soil pH exhibited a significant negative association with accuracy (r = −0.77, p < 0.01), suggesting that variations in soil chemical properties influence disease manifestation and, consequently, feature discriminability.
The strong negative correlation observed between soil moisture and classification accuracy may be attributed to a combination of biological and imaging-related factors. Increased soil moisture can influence disease development and symptom expression, leading to variations in lesion morphology, color distribution, and tissue characteristics that differ from those represented in the training dataset. Furthermore, high-moisture environments are often associated with increased humidity, leaf wetness, specular reflections, and illumination variability, which may affect image acquisition and feature extraction. Therefore, the observed relationship likely reflects both physiological changes in disease manifestation and environmental factors influencing image quality, rather than a single causal mechanism. The strong negative correlation observed between soil moisture and classification accuracy may be attributed to a combination of biological and imaging-related factors. Increased soil moisture can influence disease development and symptom expression, leading to variations in lesion morphology, color distribution, and tissue characteristics that differ from those represented in the training dataset.
Furthermore, high-moisture environments are often associated with increased humidity, leaf wetness, specular reflections, and illumination variability, which may affect image acquisition and feature extraction. Therefore, the observed relationship likely reflects both physiological changes in disease manifestation and environmental factors influencing image quality, rather than a single causal mechanism. The observed correlations between soil parameters and disease classification performance can be explained by their influence on plant physiology and symptom development. Soil moisture plays a critical role in pathogen proliferation and disease progression, often increasing lesion formation and symptom severity under favorable conditions. Likewise, nutrient availability, particularly nitrogen, phosphorus, and potassium, directly affects chlorophyll synthesis, photosynthetic activity, cell wall strength, and plant defense mechanisms. Deficiencies or imbalances in these nutrients can alter leaf coloration, texture, and lesion expression, thereby affecting the visual features used for disease classification. Soil pH further influences nutrient availability and rhizosphere microbial activity, which indirectly affects plant health and susceptibility to infection. Consequently, variations in soil conditions can modify the visibility and intensity of disease symptoms, explaining their relationship with the classification accuracy observed in this study.
Nutrient parameters, particularly nitrogen and potassium, also demonstrated moderate negative correlations with accuracy (r ≈ −0.65, p < 0.05), highlighting the role of nutrient dynamics in altering plant physiological responses and visual disease characteristics. In contrast, temperature showed a comparatively weaker and statistically non-significant relationship with model performance (r = −0.20), indicating a secondary influence relative to soil-driven factors. Furthermore, strong positive intercorrelations among N, P, and K (r > 0.85) confirm the coupled nature of soil nutrient dynamics, consistent with established soil chemistry principles. These findings collectively explain the observed decline in model accuracy to approximately 61.97% when evaluated on real-world field images, emphasizing the critical impact of environmental variability on deep learning model generalization in agricultural applications. Similar observations have been reported in recent studies, in which environmental heterogeneity and domain shifts significantly affect the robustness of deep learning-based plant disease detection models [5,6].
To elaborate on this further, the substantial reduction in classification accuracy from 99.8% on the PlantVillage benchmark dataset to 61.97% on field-acquired images indicates a significant domain shift between controlled laboratory conditions and real-world agricultural environments. PlantVillage images are typically captured under homogeneous backgrounds, controlled illumination, and limited environmental variability, enabling deep learning models to learn highly discriminative disease features. In contrast, field images are characterized by complex backgrounds, non-uniform illumination, shadows, occlusions, variations in camera viewpoints, and heterogeneous environmental conditions, all of which adversely affect model generalization [5,18].
Beyond imaging conditions, disease symptoms observed under natural environments often exhibit considerable variability in lesion morphology, color intensity, severity levels, and progression stages. Similar visual symptoms may arise from multiple biotic and abiotic stressors, including nutrient deficiencies, water stress, temperature fluctuations, and pathogen interactions, making disease discrimination substantially more challenging in field settings [18]. Consequently, models trained predominantly on benchmark datasets may learn dataset-specific visual representations that do not fully capture the diversity of real-world symptom manifestations.
Furthermore, the field evaluation involved plant species such as Epipremnum aureum and Mulberry, whereas model training was conducted primarily using tomato, potato, and pepper leaf images from the PlantVillage dataset. This introduces a cross-crop domain shift associated with differences in leaf morphology, venation structures, texture patterns, pigmentation, and disease expression characteristics. Previous studies have reported that deep learning models trained on a limited set of crop species frequently experience performance degradation when applied to unseen crops or field environments due to distributional differences between training and deployment data [42].
In addition, environmental variables such as soil moisture, nutrient availability, pH, temperature, and humidity can influence both plant physiology and disease progression, thereby altering the visual appearance of symptoms. The correlation analysis conducted in this study suggests that environmental conditions may contribute to symptom heterogeneity and consequently affect classification performance. These findings emphasize the need for domain adaptation techniques, diverse field-based training datasets, and multimodal learning frameworks that integrate image features with environmental and soil parameters to improve robustness and generalization under real-world agricultural conditions. Table 4 shows a comparative performance analysis of the state-of-the-art methods with the present model.
It is important to note that the present study does not claim universal cross-species generalization. Although the proposed framework exhibited promising results on independent field samples, these experiments should be regarded as an initial cross-domain validation rather than definitive evidence of species-independent performance. Further, large-scale studies involving diverse crop species, disease manifestations, environmental conditions, and imaging scenarios are required before broader generalization claims can be established with confidence.
It is worth mentioning here that the model was not retrained on the field species, and the field test was designed to measure the magnitude and correlates of the lab-to-field performance gap rather than to establish species-independent classification efficacy.

3.3. Soil–Disease Mechanism

Soil and environmental conditions play a critical role in disease development by influencing both pathogen activity and host plant responses. Soil moisture is particularly important because elevated moisture levels can enhance pathogen survival, spore germination, dispersal, and infection efficiency, thereby increasing disease severity in many plant-pathogen systems. Likewise, nutrient availability, especially nitrogen, phosphorus, and potassium, affects plant metabolism, immune responses, and susceptibility to disease. Nutrient imbalances may alter symptom expression, resulting in variations in lesion morphology, chlorosis, necrosis, and tissue discoloration. Soil pH further regulates nutrient availability and microbial community composition, indirectly influencing disease incidence and progression. Consequently, environmental conditions can substantially modify the visual manifestation of disease symptoms observed on leaves. Since deep learning models rely primarily on visual features, changes in symptom appearance induced by soil and environmental variability may contribute to reduced classification performance when models trained on controlled benchmark datasets are applied to field conditions. These findings highlight the importance of incorporating environmental context into future multimodal disease prediction frameworks [50].

4. Conclusions

The proposed smart neural network delivers high classification accuracy with acceptable latency and model size for edge deployment. Its structure effectively captured spatial and sequential lesion features. Comparative analysis confirms that transformer-based models (MobileViT, Swin-Tiny) are promising but still slightly outperformed by architectures when dealing with complex real-world leaf disease patterns. The results further show that integrating robust U2-Net-based segmentation with the classification framework substantially improves disease localization and feature extraction, leading to enhanced predictive reliability. Owing to the use of MobileNetV2 as the feature extraction backbone, the proposed architecture remains relatively compact compared with many conventional deep CNN models.
The proposed CNN–Bi-GRU framework demonstrated strong classification performance on the PlantVillage benchmark dataset and provided valuable insights into the challenges associated with deploying disease detection models under real-world field conditions. The results highlight the effectiveness of combining segmentation and hybrid deep learning architectures for plant disease classification while also revealing the significant impact of environmental variability and dataset domain shift on model generalization. These findings contribute to the ongoing development of intelligent plant disease monitoring systems and provide a foundation for future research aimed at improving robustness, adaptability, and practical deployment in precision agriculture environments.
However, there are a number of limitations at the current stage that need to be addressed in future work. First, when tested on a set of images taken under conditions different from the images used for training, the model’s accuracy is reduced substantially, to a mere 61.97%. It is important to note that this accuracy is much higher than that based on random selection of 38 classes (2.6%), but a more diverse set of training data is needed to improve the accuracy. Our current results indicate that more (and more variable) data alone will be sufficient to substantially increase the accuracy, and corresponding data collection efforts are underway.

5. Limitations and Future Scope

While the proposed CNN–Bi-GRU framework demonstrated excellent performance on the PlantVillage benchmark dataset, the observed reduction in accuracy under real-field conditions highlights the challenges associated with environmental variability and domain shift. In the present study, soil and environmental parameters, including pH, soil moisture, temperature, and NPK concentrations, were collected using an IoT-based monitoring system and analyzed to investigate their relationship with disease occurrence and model generalization. However, these parameters were not directly incorporated into the disease classification network as predictive inputs. As a result, the current framework should be regarded as an image-based disease classification system supplemented by environmental analysis rather than a true multimodal disease prediction model. Although the correlation analysis provided valuable insights into the influence of soil and microclimatic conditions on disease development and model performance, the direct integration of environmental information with image-derived features was beyond the scope of the present work.
Nevertheless, future research will focus on developing multimodal learning architectures that jointly exploit visual, soil, and environmental data. Feature-level fusion approaches may combine deep image embeddings extracted from convolutional neural networks with IoT-derived soil attributes, while decision-level fusion strategies may integrate predictions from independent image-based and environmental models. Such multimodal frameworks have the potential to provide complementary information for disease diagnosis, improve robustness against variations in illumination, background complexity, and field conditions, and enhance generalization across diverse agricultural environments.
Secondly, the PlantVillage dataset and the field-collected dataset differ substantially in terms of plant species, imaging conditions, disease manifestations, and environmental variability. Therefore, the field evaluation performed in this study should be regarded as a preliminary cross-domain robustness assessment rather than a direct validation of species-independent generalization. While the proposed framework demonstrated encouraging performance on the independent field samples, further validation using larger multi-species and multi-environment datasets is required before broader generalization claims can be established. Future research will focus on domain adaptation strategies and extensive field-scale evaluations to further assess the transferability of the proposed approach.
A limitation of the present study is that image-based disease classification and IoT-derived soil measurements were analyzed independently rather than through a unified multimodal learning framework. Consequently, the environmental data were used to interpret field-level performance variations rather than directly enhancing classification predictions. Nevertheless, the study demonstrates the value of environmental monitoring for understanding model robustness and provides a practical baseline for future sensor-image fusion approaches in smart agriculture.
The field evaluation near Eluru should be interpreted as a cross-domain stress test rather than a species-specific validation experiment, since the CNN–Bi-GRU model was trained on PlantVillage images of tomato, potato, and pepper, while the field dataset comprised entirely different species, including Epipremnum aureum, Mulberry, Guava, and Hibiscus. Accordingly, the observed field accuracy of 61.97% reflects the combined effect of cross-species morphological differences, imaging conditions, and background complexity, rather than a direct measure of disease classification robustness within any single target species. Future work will focus on domain adaptation and transfer learning with target-domain fine-tuning, supported by annotated multi-species field datasets spanning diverse crop types, disease severities, and agro-climatic conditions, before broader generalization claims can be established with confidence.
Although the proposed U2-Net-assisted MobileNetV2–BiGRU framework achieved high classification accuracy on benchmark and field datasets, a detailed computational complexity analysis was not conducted. Metrics such as trainable parameters, FLOPs, memory usage, and inference latency were not evaluated. Future work will quantify these metrics and assess deployment performance on edge devices such as Raspberry Pi, NVIDIA Jetson, and mobile platforms for real-time smart agriculture applications.
Incorporating additional environmental variables, such as humidity, rainfall, solar radiation, and remotely sensed vegetation indices, may facilitate the development of comprehensive disease forecasting systems capable of supporting precision agriculture and real-time crop health management. Therefore, multimodal joint prediction represents a promising extension of the proposed framework and an important direction for future investigation.
Another limitation of the proposed CNN–Bi-GRU framework is that the recurrent module operates on ordered feature representations derived from convolutional feature maps rather than on naturally occurring temporal sequences. Although this design enables the Bi-GRU to capture contextual relationships among extracted features, the resulting sequence is an artificial representation of spatial information and does not correspond to temporal disease progression. Consequently, the recurrent modeling component should be interpreted as a feature refinement mechanism rather than a true temporal learning framework. Future research will investigate attention-based and transformer-based architectures that can model long-range spatial dependencies directly without requiring the construction of sequential feature representations. Although U2-Net effectively removed background regions and improved classification performance, quantitative segmentation evaluation using metrics such as IoU and Dice Coefficient was not performed due to the absence of manually annotated ground-truth masks. Future work will include the creation of annotated segmentation datasets to facilitate comprehensive evaluation of the segmentation module.
A further limitation of the present study is the relatively modest size of the field dataset used for robustness evaluation. Although the dataset was collected under realistic environmental conditions and included representative healthy and diseased leaf samples, larger datasets encompassing broader variations in crop species, disease severity, environmental conditions, and imaging scenarios would provide a more comprehensive assessment of model generalization.

Supplementary Materials

The following supporting information can be downloaded at: https://www.mdpi.com/article/10.3390/su18136867/s1, Figure S1: Temporal variations in soil and environmental parameters (pH, temperature, moisture, and NPK) recorded over 10 days (from 9 July to 18 July 2025) in Eluru, India. Table S1: Ablation study of the U2-Net-MobileNetV2-Bi-GRU Framework for Plant Leaf Disease Classification.

Author Contributions

J.T. conducted the main research and collected, analyzed, and interpreted the data. N.M. conceived the idea and developed the theory, supervised the research, and reviewed and edited the manuscript before submission. P.S.B. drafted the manuscript and revised it critically. All authors have read and agreed to the published version of the manuscript.

Funding

This research received no external funding.

Institutional Review Board Statement

Not applicable.

Informed Consent Statement

Not applicable.

Data Availability Statement

Data are contained within this present article or as part of the Supplementary Files.

Acknowledgments

The authors acknowledge Vel Tech Rangarajan Sagunthala R&D Institute of Science, Technology, and Shri Vishnu Engineering College for Women (A), Bhimavaram, India, for providing infrastructural facilities that enabled us to carry out this research work.

Conflicts of Interest

The authors declare no conflicts of interest.

References

  1. Liu, J.; Wang, X. Plant diseases and pests detection based on deep learning: A review. Plant Methods 2021, 17, 22. [Google Scholar] [CrossRef] [PubMed]
  2. Lu, J.-Y.; Chang, C.-L.; Kuo, Y.-F. Monitoring Growth Rate of Lettuce Using Deep Convolutional Neural Networks. In Proceedings of the 2019 ASABE Annual International Meeting, Boston, MA, USA, 7–10 July 2019. [Google Scholar] [CrossRef]
  3. Charisis, C.; Argyropoulos, D. Deep Learning-Based Instance Segmentation Architectures in Agriculture: A Review of the Scopes and Challenges. Smart Agric. Technol. 2024, 8, 100448. [Google Scholar] [CrossRef]
  4. Zhao, S.; Peng, Y.; Liu, J.; Wu, S. Tomato leaf disease diagnosis based on improved convolution neural network by attention module. Agriculture 2021, 11, 651. [Google Scholar] [CrossRef]
  5. Mohanty, S.P.; Hughes, D.P.; Salathé, M. Using deep learning for image-based plant disease detection. Front. Plant Sci. 2016, 7, 1419. [Google Scholar] [CrossRef] [PubMed]
  6. Ferentinos, K.P. Deep learning models for plant disease detection and diagnosis. Comput. Electron. Agric. 2018, 145, 311–318. [Google Scholar] [CrossRef]
  7. Lee, S.H.; Goëau, H.; Bonnet, P.; Joly, A. Attention-based recurrent neural network for plant disease classification. Front. Plant Sci. 2020, 11, 601250. [Google Scholar] [CrossRef] [PubMed]
  8. Jain, S.; Ramesh, D. AI-based hybrid CNN-LSTM model for crop disease prediction: An ML advent for rice crop. In Proceedings of the 12th International Conference on Computing Communication and Networking Technologies (ICCCNT), Kharagpur, India, 6–8 July 2021; IEEE: New York, NY, USA, 2021; pp. 1–7. [Google Scholar] [CrossRef]
  9. Devi, E.; Gopi, S.; Padmavathi, U.; Arumugam, S.R.; Premnath, S.; Muralitharan, D. Plant Disease Classification using CNN-LSTM Techniques. In Proceedings of the 5th International Conference on Smart Systems and Inventive Technology (ICSSIT), Tirunelveli, India, 23–25 January 2023; IEEE: New York, NY, USA, 2023; pp. 1225–1229. [Google Scholar] [CrossRef]
  10. Zhang, T.; Wang, D. Classification of crop disease-pest questions based on BERT-BiGRU-CapsNet with attention pooling. Front. Plant Sci. 2023, 14, 1300580. [Google Scholar] [CrossRef] [PubMed]
  11. Khan, I.R.; Sangari, M.S.; Shukla, P.K.; Aleryani, A.; Alqahtani, O.; Alasiry, A.; Alouane, M.T.-H. An Automatic-Segmentation- and Hyper-Parameter-Optimization-Based Artificial Rabbits Algorithm for Leaf Disease Classification. Biomimetics 2023, 8, 438. [Google Scholar] [CrossRef]
  12. Qin, X.; Zhang, Z.; Huang, C.; Dehghan, M.; Zaiane, O.R.; Jagersand, M. U2-Net: Going deeper with nested U-structure for salient object detection. Pattern Recognit. 2020, 106, 107404. [Google Scholar] [CrossRef]
  13. Ronneberger, O.; Fischer, P.; Brox, T. U-Net: Convolutional Networks for Biomedical Image Segmentation. In Medical Image Computing and Computer-Assisted Intervention—MICCAI 2015; Navab, N., Hornegger, J., Wells, W., Frangi, A., Eds.; Lecture Notes in Computer Science; Springer: Cham, Switzerland, 2015. [Google Scholar] [CrossRef]
  14. Hughes, D.P.; Salathé, M. An open access repository of images on plant health to enable the development of mobile disease diagnostics. arXiv 2015, arXiv:1511.08060. [Google Scholar] [CrossRef]
  15. Singh, D.; Jain, N.; Jain, P.; Kayal, P.; Kumawat, S.; Batra, N. Plantdoc: A dataset for visual plant disease detection. In Proceedings of the 7th ACM IKDD CoDS and 25th COMAD, Hyderabad, India, 5–7 January 2020; ACM: New York, NY, USA, 2020; pp. 249–253. [Google Scholar] [CrossRef]
  16. Goëau, H.; Martellucci, G.; Bonnet, P.; Vinatier, F.; Joly, A. PlantCLEF2025 @ LifeCLEF & CVPR-FGVC. 2025. Available online: https://kaggle.com/competitions/plantclef-2025 (accessed on 17 March 2026).
  17. Das, A.; Pathan, F.; Jim, J.R.; Kabir, M.; Mridha, M. Deep Learning-Based Classification, Detection, and Segmentation of Tomato Leaf Diseases: A State-of-the-Art Review. Artif. Intell. Agric. 2025, 15, 192–220. [Google Scholar] [CrossRef]
  18. Barbedo, J.G.A. Plant disease identification from individual lesions and spots using deep learning. Biosyst. Eng. 2019, 180, 96–107. [Google Scholar] [CrossRef]
  19. Padhi, J.; Mishra, K.; Ratha, A.K.; Behera, S.K.; Sethy, P.K.; Nanthaamornphong, A. Enhancing Paddy Leaf Disease Diagnosis -a Hybrid CNN Model Using Simulated Thermal Imaging. Smart Agric. Technol. 2025, 10, 100814. [Google Scholar] [CrossRef]
  20. Bhaskar, N.; A, P.C.; Tupe-Waghmare, P.; Shetty, P.; Shetty, S.S.; Rai, T. A deep learning hybrid approach for automated leaf disease identification in paddy crops. In Proceedings of the International Conference on Distributed Computing and Optimization Techniques (ICDCOT), Bengaluru, India, 15–16 March 2024; IEEE: New York, NY, USA, 2024; pp. 1–5. [Google Scholar] [CrossRef]
  21. Sidana, S. Towards Sustainable Agriculture: A Transformer-based Hybrid Model for Advanced Leaf Disease Classification. In Proceedings of the 15th International Conference on Computing Communication and Networking Technologies (ICCCNT), Kamand, India, 24–28 June 2024; IEEE: New York, NY, USA, 2024; pp. 1–6. [Google Scholar] [CrossRef]
  22. Kumar, R.R.; Chauhan, R.; Dhondiyal, S.A.; Singh, A. Deep Learning-Driven Diagnosis: A CNN-SVM Hybrid Approach for Automated Detection of Strawberry Leaf Diseases. In Proceedings of the IEEE 3rd World Conference on Applied Intelligence and Computing (AIC), Gwalior, India, 27–28 July 2024; IEEE: New York, NY, USA, 2024; pp. 1467–1470. [Google Scholar] [CrossRef]
  23. Esomonu, N.F.; Eze, U.F.; John-Otumu, A.M.; Ayogu, I.I.; Nwokonkwo, O.C.; Oshoiribhor, E.O.; Okolie, S.A.; Nwokorie, E.C.; Mbamala, C.V.; Dokun, O. A Hybrid Model using MobileNetv2 and SVM for Enhanced Classification and Prediction of Tomato Leaf Diseases. SSRG Int. J. Electr. Electron. Eng. 2023, 10, 37–50. [Google Scholar] [CrossRef]
  24. Anwar, B.; Hegazy, I.; Mabrouk, M.; Elarif, T.; Taha, Z. Hybrid cnn-rnn architecture for accurate tomato disease diagnosis with xception-gru. Int. J. Intell. Comput. Inf. Sci. 2024, 24, 60–72. [Google Scholar] [CrossRef]
  25. Shafik, W.; Tufail, A.; Liyanage De Silva, C.; Apong, R.A.A.H.M. A novel hybrid inception-xception convolutional neural network for efficient plant disease classification and detection. Sci. Rep. 2025, 15, 3936. [Google Scholar] [CrossRef] [PubMed]
  26. Karunanithi, A.; Singh, A.S.; Kannapiran, T. Enhanced hybrid neural networks (Coatnet) for paddy crops disease detection and classification. Rev. d’Intell. Artif. 2022, 36, 671–679. [Google Scholar] [CrossRef]
  27. Murugesan, S.; Chinnadurai, J.; Srinivasan, S.; Mathivanan, S.K.; Chandan, R.R.; Moorthy, U. Robust multiclass classification of crop leaf diseases using hybrid deep learning and Grad-CAM interpretability. Sci. Rep. 2025, 15, 29955. [Google Scholar] [CrossRef] [PubMed]
  28. Babu, A.N.; Blossom, M.C.; Praneetha, A.; Shirisha, P.; Kishore, P.M.; Mounika, F.M.; Kumar, G.A.; Brahmanandam, P.S. Internet of Things (IoT) based Pesticide Spraying Robot—A Revolution in Smart Farming. Indian J. Sci. Technol. 2023, 16, 1676–1681. [Google Scholar] [CrossRef]
  29. Babu, G.R.; Gokuldhev, M.; Brahmanandam, P.S. Integrating IoT for Soil Monitoring and Hybrid Machine Learning in Predicting Tomato Crop Disease in a Typical South India Station. Sensors 2024, 24, 6177. [Google Scholar] [CrossRef] [PubMed]
  30. Thirupathi, J.; Malarvizhi, N.; Brahmanandam, P.S. Citrus fruit detection and classification: Field-based images and FIDS-30 dataset. Multidiscip. Sci. J. 2025, 7, 2025582. [Google Scholar] [CrossRef]
  31. Zhang, K.; Wu, Q.; Liu, A.; Meng, X. Can deep learning identify tomato leaf disease? Adv. Multimed. 2018, 2018, 6710865. [Google Scholar] [CrossRef]
  32. Lin, T.; Goyal, P.; Girshick, R.; He, K.; Dollár, P. Focal loss for dense object detection. In Proceedings of the IEEE International Conference on Computer Vision (ICCV), Venice, Italy, 22–29 October 2017; IEEE: New York, NY, USA, 2017; pp. 2980–2988. [Google Scholar] [CrossRef]
  33. Too, E.C.; Yujian, L.; Njuki, S.; Yingchun, L. A comparative study of fine-tuning deep learning models for plant disease identification. Comput. Electron. Agric. 2019, 161, 272–279. [Google Scholar] [CrossRef]
  34. Shorten, C.; Khoshgoftaar, T.M. A survey on image data augmentation for deep learning. J. Big Data 2019, 6, 60. [Google Scholar] [CrossRef]
  35. Wang, Y.; Dhamodharan, R.U.S.; Sarwar, N.; Almalki, F.A.; Naith, Q.H. A hybrid approach for rice crop disease detection in agricultural IoT system. Discov. Sustain. 2024, 5, 99. [Google Scholar] [CrossRef]
  36. Wang, J.; Jia, J.; Zhang, Y.; Wang, H.; Zhu, S. RAAWC-UNet: An apple leaf and disease segmentation method based on residual attention and atrous spatial pyramid pooling improved UNet with weight compression loss. Front. Plant Sci. 2024, 15, 1305358. [Google Scholar] [CrossRef] [PubMed]
  37. Chung, J.; Gulcehre, C.; Cho, K.; Bengio, Y. Empirical evaluation of gated recurrent neural networks on sequence modeling. arXiv 2014, arXiv:1412.3555v1. [Google Scholar] [CrossRef]
  38. Bouchane, M.; Guo, W.; Yang, S. Hybrid CNN-GRU models for improved EEG motor imagery classification. Sensors 2025, 25, 1399. [Google Scholar] [CrossRef] [PubMed]
  39. Kanakala, S.; Ningappa, S. Detection and classification of diseases in multi-crop leaves using LSTM and CNN models. J. Innov. Image Process. 2025, 7, 161–181. [Google Scholar] [CrossRef]
  40. Syed, K.; Asiya Begum, S.S.; Palakayala, A.R.; Vidya Lakshmi, G.V.; Gorikapudi, S. Leaf disease detection and classification in food crops with efficient feature dimensionality reduction. PLoS ONE 2025, 20, e0328349. [Google Scholar] [CrossRef] [PubMed]
  41. Lu, Y.; Wu, X.; Liu, P.; Li, H.; Liu, W. Rice disease identification method based on improved CNN-BiGRU. Artif. Intell. Agric. 2023, 9, 100–109. [Google Scholar] [CrossRef]
  42. Sun, J.; Yang, Y.; He, X.; Wu, X. Northern Maize Leaf Blight Detection Under Complex Field Environment Based on Deep Learning. IEEE Access 2020, 8, 33679–33688. [Google Scholar] [CrossRef]
  43. Zhang, L.; Li, C.; Wu, X.; Xiang, H.; Jiao, Y.; Chai, H. BO-CNN-BiLSTM deep learning model integrating 788 multisource remote sensing data for improving winter wheat yield estimation. Front. Plant Sci. 2024, 15, 1500499. [Google Scholar] [CrossRef] [PubMed]
  44. Vini, S.L.; Rathika, P. Trioconvtomatonet-bilstm: An efficient framework for the classification of tomato leaf diseases in real-time complex background images. Int. J. Comput. Intell. Syst. 2025, 18, 79. [Google Scholar] [CrossRef]
  45. Zhou, C.; Zhou, S.; Xing, J.; Song, J. Tomato leaf disease identification by restructured deep residual dense network. IEEE Access 2021, 9, 28822–28831. [Google Scholar] [CrossRef]
  46. Sabanci, K. Benchmarking of CNN Models and MobileNet-BiLSTM Approach to Classification of Tomato Seed Cultivars. Sustainability 2023, 15, 4443. [Google Scholar] [CrossRef]
  47. Arshad, F.; Mateen, M.; Hayat, S.; Wardah, M.; Al-Huda, Z.; Gu, Y.H.; Al-Antari, M.A. PLDPNet: End-to-end hybrid deep learning framework for potato leaf disease prediction. Alex. Eng. J. 2023, 78, 406–418. [Google Scholar] [CrossRef]
  48. Asghar, M.; Khan, Z.F.; Ramzan, M.; Khan, M.A.; Baili, J.; Zhang, Y.; Nam, Y.; Nam, Y.-C. A lightweight hybrid model for scalable and robust plant leaf disease classification. Sci. Rep. 2025, 15, 32353. [Google Scholar] [CrossRef] [PubMed]
  49. Haider, I.; Nazir, M.; Khan, M.A.; Raza, M. NRB-BiLNET: A Novel Deep Learning Architecture for Crop Leaf Disease Classification. In Proceedings of the Horizons of Information Technology and Engineering (HITE), Lahore, Pakistan, 15–16 October 2024; IEEE: New York, NY, USA, 2024; pp. 1–6. [Google Scholar] [CrossRef]
  50. Agrios, G.N. Plant Pathology, 5th ed.; Elsevier Science: Burlington, MA, USA, 2005. [Google Scholar]
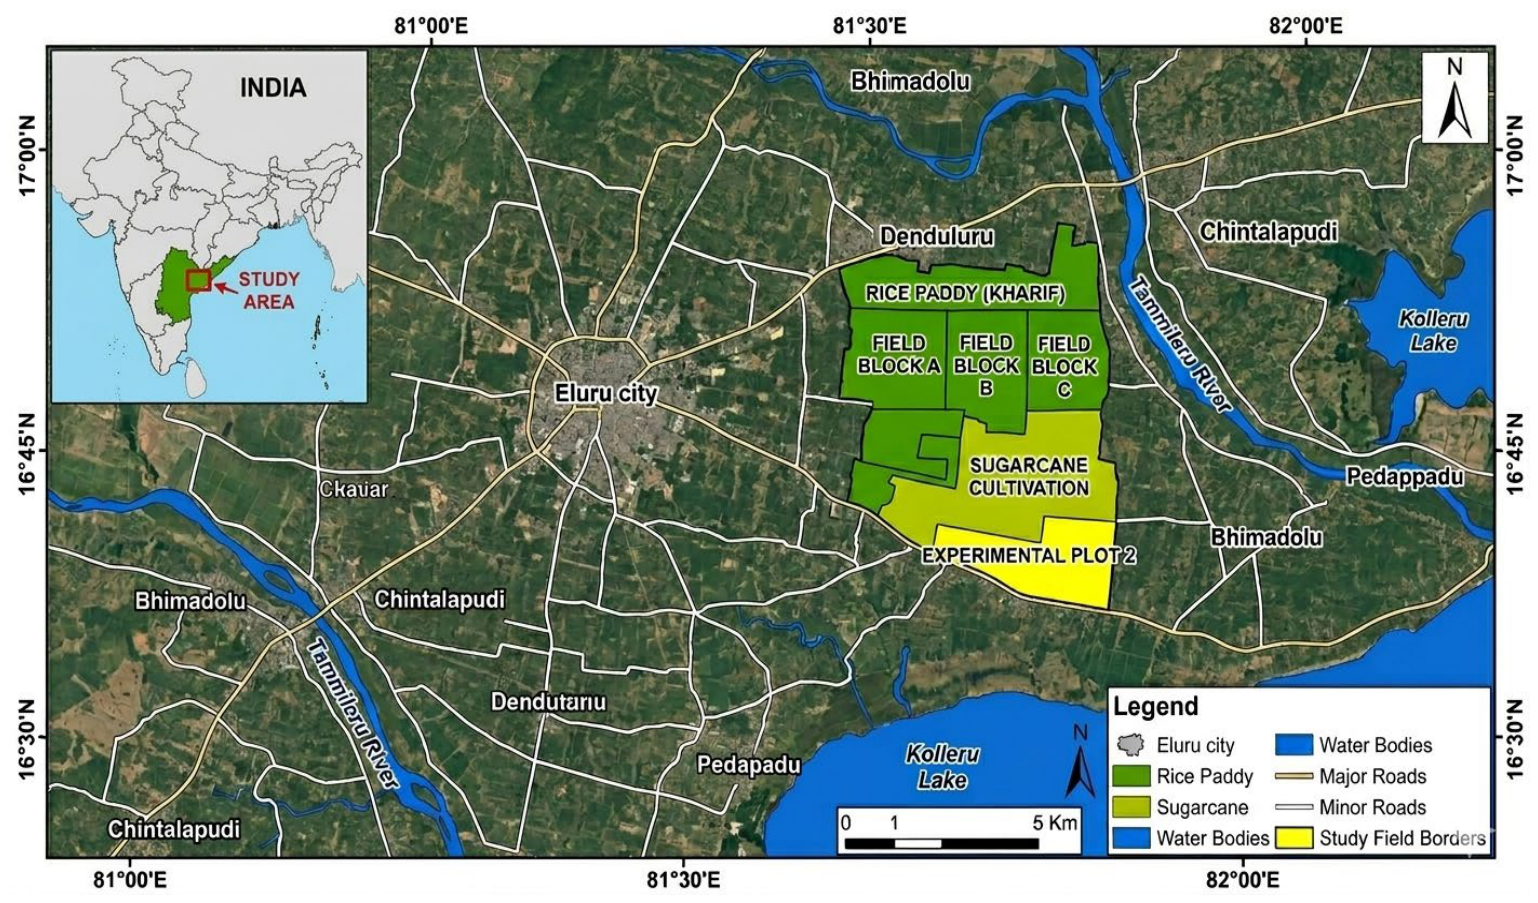
Figure 1. Location of the study area and experimental agricultural fields near Eluru, Andhra Pradesh, India. The inset map shows the study site’s location within India, while the main map depicts the field blocks used for crop monitoring, leaf image acquisition, and environmental data collection.
Sustainability 18 06867 g001
Figure 2. Examples of the pre-processing pipeline applied to representative diseased leaf images from the study dataset. From left to right, the images show the original leaf image, the resized image, the normalized image, and the augmented image generated through flipping. The illustrated samples represent tomato, potato, and pepper leaf diseases used in the classification framework.
Sustainability 18 06867 g002
Figure 3. Representative examples of leaf segmentation using the U2-Net framework: Original leaf images (left-side panels), predicted masks (mid panels), and extracted leaf regions (right-side panels).
Sustainability 18 06867 g003
Figure 4. Workflow of the U2-Net-assisted MobileNetV2-BiGRU framework for Crop Leaf Disease Classification. Proposed image-processing pipeline: 300 × 300 input images are segmented using U2-Net, and the resulting segmented outputs are resized to 224 × 224 × 3 for MobileNetV2-based classification.
Sustainability 18 06867 g004
Figure 5. Performance Comparisons of Deep Learning Architectures with Error Bar Analysis. Bars indicate the mean Accuracy, Precision, Recall, F1-Score, and Specificity (%) computed across the validation folds, while error bars denote one standard deviation (±SD). Asterisks indicate statistically significant differences compared with the baseline models (* p < 0.05, ** p < 0.01). The results demonstrate that the proposed U2-Net-assisted MobileNetV2–BiGRU model achieves superior predictive performance and lower variability compared with AlexNet, DCNN, DenseNet, EfficientNet-B3, and Vision Transformer (ViT) architectures.
Sustainability 18 06867 g005
Figure 6. Comparative ROC curve Analysis of Deep Learning Models (AlexNet, DCNN, DenseNet, EfficientNet-B3, ViT, and Present Research) with 95% Confidence Intervals for leaf disease classification.
Sustainability 18 06867 g006
Figure 7. Class-Wise Classification Performance of the Proposed Model Represented as a Confusion Matrix.
Sustainability 18 06867 g007
Figure 8. Correlation matrix showing the relationships between classification accuracy and measured soil parameters (pH, temperature, moisture, nitrogen, phosphorus, and potassium). A diverging color scale centered at zero is used, where blue indicates negative correlations, red indicates positive correlations, and white represents weak or negligible correlations. Statistical significance levels are denoted by asterisks (* p < 0.05, ** p < 0.01, *** p < 0.001).
Sustainability 18 06867 g008
Table 1. Healthy and Diseased Leaf Samples from the PlantVillage Database (Bell pepper, Potato, and Tomato crops).
PlantVillage Database
Bell PepperPotatoTomato
Sustainability 18 06867 i001Sustainability 18 06867 i002Sustainability 18 06867 i003
Sustainability 18 06867 i004Sustainability 18 06867 i005Sustainability 18 06867 i006
Bacterial spotEarly blightTarget spot
Sustainability 18 06867 i007Sustainability 18 06867 i008
Late blightMosaic virus
Sustainability 18 06867 i009
Bacterial spot
Table 2. Class-wise performance metrics obtained from five-fold cross-validation.
ClassRecall (%)Specificity (%)F1-Score (%)
Epipremnum healthy62.8692.1361.97
Epipremnum bacterial spot60.0092.7060.87
Mulberry healthy62.8692.1361.97
Mulberry bacterial spot60.0092.7060.87
Guava healthy55.5696.9258.82
Guava anthracnose66.6795.9063.16
Hibiscus healthy61.1196.9262.86
Hibiscus bacterial spot68.4296.3966.67
Table 3. Evaluation of CNN-BiGRU Model for Classification of Healthy and Diseased Leaf Images from Open Field Crops.
S. NoClassification
Leaf Images Retrieved from Open FieldCrop CategoryHealthy vs. DiseasedDisease ClassRemarks
1.Sustainability 18 06867 i010Epipremnum aureumHealthyNot ApplicableCorrectly identified
2.Sustainability 18 06867 i011Epipremnum aureumHealthyNot ApplicableCorrectly identified.
3.Sustainability 18 06867 i012Epipremnum aureumHealthyNot ApplicableCorrectly identified, though a mix of dark green and light green could appear here and there.
4.Sustainability 18 06867 i013Epipremnum aureumNot ApplicableUnhealthy and the identified disease was bacterial leaf spot. Identified correctly. The model correctly identified Bacterial Leaf Spot due to distinct lesion patterns and effective CNN-BiGRU feature learning.
5.Sustainability 18 06867 i014MulberryHealthyNot ApplicableCorrectly identified
6.Sustainability 18 06867 i015MulberryHealthyNot ApplicableCorrectly identified
7.Sustainability 18 06867 i016MulberryNot ApplicableUnhealthyThe model did not identify correctly. The probable reasons could be due to the fact that the model may have learned desk color/texture cues instead of leaf cues.
8.Sustainability 18 06867 i017MulberryNot ApplicableUnhealthyThe model did not identify correctly. The probable reasons could be that disease-specific features are lost in complete necrosis, and class definitions are too narrow, forcing wrong predictions.
9.Sustainability 18 06867 i018Guava (Psidium guajava)HealthyNot ApplicableCorrectly identified
10.Sustainability 18 06867 i019Guava (Psidium guajava) Not ApplicableAnthracnoseCorrectly Identified
11.Sustainability 18 06867 i020Hibiscus (Hibiscus rosa-sinensis).HealthyNot ApplicableCorrectly identified.
12.Sustainability 18 06867 i021Hibiscus (Hibiscus rosa-sinensis).Not ApplicableUnhealthy, and the identified disease was Bacterial Leaf Spot.Correctly identified.
Table 4. Comparative Performance Analysis of the State-of-the-art Methods.
COMPARISON GROUPREFERENCECROP/
DATASET
MODELPERFORMANCEPROS AND CONS
RICE DISEASE DETECTIONLu et al. (2023)
[41]
RiceCNN–BiGRU98.21Pros: Captures both spatial and sequential features with enhanced attention, yielding very high accuracy.
Cons: Increased model complexity and computational cost may limit scalability in real-time field applications.
RICE DISEASE DETECTIONWang et al. (2024)
[35]
RiceDC-GAN+MDF C-ResNet95.99%Pros: Higher Accuracy, Robust across climates.
Cons: Model’s complexity hinders lightweight deployment; BO adds computational cost.
WHEAT YIELD PREDICTIONZhang et al., (2024)
[43]
Winter wheatBO-CNN-BiLSTMR2 81%Pros: High accuracy, Robust to complex backgrounds, Fewer training parameters.
Cons: Added sequence module increases model complexity/latency.
TOMATO LEAF DISEASE/IDENTIFICATIONLedbin Vini & Rathika (2025)
[44]
TomatoTrio Conv TomatoNet + Bi-LSTM99.65-
99.83%
Pros: Strong fine-grained discrimination; better sample quality; training stability.
Cons: Higher computational cost; GAN training overhead; Reliance on heavy preprocessing
TOMATO LEAF DISEASE/IDENTIFICATIONZhou et al. (2021)
[45]
TomatoRDN-based Hybrid DL95%Pros: High accuracy with efficient parameter usage and better gradient flow.
Cons: Model re-structuring is complex, and dataset-specific adaptability may be limited.
TOMATO SEED CULTIVAR CLASSIFICATIONSabanci (2023)
[46]
Tomato seedMobileNetV2 + BiLSTM96%Pros: Higher accuracy; Robust to subtle inter-class differences.
Cons: Complex pipeline; Higher compute/memory; Potential overfitting without careful regularization.
POTATO LEAF DISEASEArshad et al. (2023)
[47]
PotatoPLDPNet98.66%Pros: High Accuracy,
Hybrid Feature Fusion and Vision Transformer Integration.
Cons: Computationally Intensive, Complex Architecture, Limited Practical Deployment.
POTATO & TOMATO DATASETAsghar et al. (2025)
[48]
Potato and TomatoHPDC-Net99%Pros: Lightweight and Compact, High Efficiency.
Cons: Since the datasets use lab-controlled images, they lack real-world variability and complexity.
COTTON DISEASE DETECTIONHaider et al. (2024)
[49]
CottonNRB-BiUNet95.22%Pros: Lightweight model, Robust Architecture.
Cons: Reduced Prediction Time
Limited Scope of diseases, Preprocessing overhead
CUCUMBER CLASSIFICATIONZhang & Wang (2023)
[10]
CucumberBBGCAPF1 92.66%Pros: Improved accuracy, Rich semantic understanding, and Sequential dependency capture.
Cons: High complexity, Slower training, Limited generalization
PRESENT WORKPresent ResearchPepper/Potato/TomatoCNN-BiGRU99.8%Pros: The CNN–Bi-GRU with U2-Net achieves 99.8% accuracy on PlantVillage benchmark; employs architecturally parameter-efficient components (MobileNet V2 depthwise separable convolutions, Bi-GRU reduced gating) and robust spatio-contextual feature learning.
Cons: Significant performance degradation under domain shift (99.8% benchmark vs. 61.97% field accuracy); field evaluation involved cross-species inference beyond the training distribution; computational complexity metrics (FLOPs, parameters, inference latency) not empirically evaluated; IoT soil data analyzed independently rather than integrated into the classification pipeline.
Disclaimer/Publisher’s Note: The statements, opinions and data contained in all publications are solely those of the individual author(s) and contributor(s) and not of MDPI and/or the editor(s). MDPI and/or the editor(s) disclaim responsibility for any injury to people or property resulting from any ideas, methods, instructions or products referred to in the content.