Article

Assessment of the Quality of Digitalization Construction in Rural Development in the Yangtze River Delta from a Policy Perspective

School of Public Administration, Hohai University, Nanjing 211100, China
*
Author to whom correspondence should be addressed.
Sustainability 2026, 18(13), 6862; https://doi.org/10.3390/su18136862
Submission received: 14 May 2026 / Revised: 11 June 2026 / Accepted: 15 June 2026 / Published: 6 July 2026

Abstract

Digital rural construction is a key component of China’s agricultural and rural transformation, as well as a means to improve rural productivity and strengthen the coordinated development of urban and rural areas in the Yangtze River Delta, which requires the backing of an efficient policy framework. Based on this, the research object is the 145 digital village policies issued by the Yangtze River Delta, and 16 of them are selected for evaluation after content mining. The findings are as follows: (1) Sixteen policies have an average PMC index of 8.42; four policies are excellent, 12 are good, and the quality of policies is generally good. (2) At the administrative level, there is a characteristic that the quality of provincial policies is superior to that of municipal policies. Among regions, the policy quality advantages represented by Zhejiang are obvious, presenting a pattern of “Zhejiang leading, Jiangsu steady, Anhui catching up, and Shanghai waiting for improvement”. (3) Except for the “policy function”, although the absolute scores of some indicators (such as policy field, policy content, policy evaluation) are at a high level, there is still a significant gap compared to the outstanding performance of the policy function (0.98). Moreover, from the perspective of the requirement for comprehensive and coordinated development of policies, the attention and investment in these dimensions are slightly insufficient, resulting in policies not fully exerting their expected comprehensive effectiveness, which is the main reason restricting the overall quality of policies. (4) It is recommended to increase the regulatory and advisory nature of the policy; Expand the scope of policy audiences; Take into account the forward-looking and long-term nature of policy formulation; Refine the execution plan to ensure the implementation of policies; The content of the construction of fiscal taxation, laws and regulations will be increased to provide a scientific basis for the rural transformation; Encourage local exploration and innovation, combine with local conditions, and form replicable and promotable development models.

1. Introduction

Currently, a new wave of scientific and technological revolution has sparked a comprehensive change in the world, and a new “digital twin era” is being established, thanks to the continuous development and breakthrough of digital technologies represented by information and communication, artificial intelligence, e-commerce, and cloud computing [1,2], the world has entered the era of digital transformation [3,4], and rural areas thus obtain important opportunities for digital revolution and digital construction [5,6], the integration of digital technology is pervasive in rural construction, significantly advancing the modernization, transformation, and sustainable growth of rural areas and agriculture [7,8,9,10]. Consequently, the creation of the digital economy and the digital countryside have turned into a new strategy of “changing lanes and overtaking vehicles” in many nations in an effort to take advantage of this advantageous chance [11,12], introduced various policies and measures according to their respective needs [13], For example, India’s Digital India Initiative, which focuses on improving rural infrastructure [14]; South Korea’s “Informationized Village Project” [15]; The United States’ Rural Broadband Initiative [16] and Australia, Finland, Northern Ireland, and Italy’s Smart Rural Initiative [17,18,19,20]. As a large agricultural country, China has also joined this digital trend [21,22]. China first developed a digital village strategy in 2018, which was subsequently supported by directives including the Digital Village Construction Guide 1.0 and the Outline of Digital Village Development Strategy [23]. The guidelines for building a digital village in the modern era are outlined in the Action Plan for the Development of Digital Village (2022–2025), which was created in 2022 [24] and points out the direction of high-quality rural development [25]. Digital villages began to rise across the country [26]. At this time, as the leader in economic development, the Yangtze River Delta takes the initiative to grasp the opportunities of the times [27], and strives to elevate regional development into a national development strategy in 2018, leading the country to high-quality development. Meanwhile, Zhejiang Province in this region is the first digital rural leading area in China, with advanced experience in rural modernization development. It has a significant demonstration effect on the whole country. Given that policies play a core leading and regulatory role in the construction of digital rural areas, systematically evaluating the quality, framework, and synergy of these policies is of crucial academic and practical significance for revealing their inherent logic, implementation effectiveness, and potential optimization space. This is not only a prerequisite for understanding the development trajectory of digital rural areas but also a key link to ensure the effective implementation of strategic goals. Therefore, in the current era when digital village has become the mainstream trend, we think it is critical to investigate how the Yangtze River Delta’s digital countryside is developing, which not only helps to promote the realization of higher quality integration and improve the international competitiveness, but also can accumulate experience for reference in other regions of the country, so that various regions can learn from each other. Finally, the whole country and society will be fully modernized.

2. Literature Review

2.1. Research on Digital Villages

The development of digital villages is a new hot topic in countryside regions that has increasingly drawn interest from academic and political circles [28,29,30], and relevant studies have shown an explosive growth. Through analysis, the research topics are mostly focused on the concept, impact, evaluation system and construction path.
First, scholars from various countries have discussed the concept of digital village, but have not given a unified definition [31]. In 2017, the European Union proposed in the European Commission. EU Action for SMART VILLAGES: A smart village is a new form of development of rural industry and benefits for farmers by combining digital technology and network information on the basis of rural advantages. Essentially, digitizing rural development is a prerequisite for building a smart village. According to Bielska et al. [32], the “digital countryside” is a demonstration of the outcomes of applying digitalization and informatization in rural areas as well as a model for achieving the digitalization of rural life and governance based on contemporary technology. Wang et al. [8] noted that the fast growth of the digital economy is advantageous for the creation of a digital countryside, and the core is to empower rural digital and reconstruct the rural economy’s and society’s style of development. In general, a digital village refers to the incorporation of digital resources [33,34,35], an economic activity that integrates information network technology into rural modernization development [36,37]. In the context of this study, it is conceptualized as a tool for achieving agricultural modernization and rural revitalization through policy-driven digital transformation and digital construction.
Second, about the impact of digital village construction. In fact, digital technology can make up for the shortcomings of rural production and lifestyle by improving talent, capital, technology and demand, and is a force to promote sustainable rural development [38,39]. Specifically, the construction of digital countryside can break the current situation of “information island” in rural areas [40], change the rural communication mode through the Internet and other platforms, and obtain useful information [41,42], which helps the transformation of rural industries and generates new digital enterprises such as e-commerce and Taobao village [43] to promote the diversified development of rural areas. At the same time, various platforms and information help to broaden the agricultural products’ distribution channels [44,45], increasing the consumption demand and disposable income [46]. Moreover, the construction of the digital countryside can realize the reasonable allocation of resources, promote the communication and interaction between urban and countryside resources, and bring about the integration of the two [47]. In addition, it will help to improve agricultural production technology and change extensive operation methods [48,49], while promoting high-quality agricultural development [50], it can also improve the rural environment [51,52].
Third, the digital village’s construction level evaluation system. Since the idea of a “digital village” is still relatively new, there is variability in the markers used to measure its level. Scholars have tried to construct it according to their own professional knowledge, so as to evaluate and understand the general situation of rural digital development. For example, scholar Fang [53] constructed measurement indicators from seven aspects, including smart farmers, smart environment, infrastructure, and digital agriculture, which are closely related to rural development. Huang [54] built a total of 17 measurement indicators in four aspects, namely smart agriculture, smart construction, smart cultural tourism and smart governance, focusing on rural production and management. With the application of indicators into specific practices by some scholars, for example, Mieczyslaw and Magdalena [55] established 24 indicator variables including life, nature, society and economy, and carried out an empirical investigation on the rural potential of three regions in eastern Poland. Vilma and Gintare [56] evaluated the growth of smart villages in Lithuania and discovered that the absence of digital innovation, human resources, and technology significantly impeded the development of the communities. As research has progressed, a number of computational techniques, including the entropy approach, the analytic hierarchy process, the normalization method, and the Topsis method, have been used extensively [57]. Su and Peng [58] and Zhu and Chen [59] have comprehensively applied measurement methods and index systems. Make the evaluation results more scientific and reasonable.
Fourth, scholars from various countries have put forward their own opinions about how the digital village should grow in light of the current circumstances [60]. Anastasiou et al. [61] believed that the long-term problems suffered by rural areas, such as population outflow and weak infrastructure, accelerated the decline of rural areas, and it was urgent to make use of digital management and technical knowledge to make smart planning for rural areas, so as to promote rural development. Zhao et al. [62] pointed out that this is a systematic project that needs to improve infrastructure, digital transformation and upgrading of agriculture, use information platforms to coordinate urban and rural development, and rely on the Internet to improve governance. Ramsden et al. [63] believe that talents are the guarantee for rural development. While attracting foreign talents, digital technologies must also be used to provide training and professional education for rural workers, so as to enhance the skills of local talents. Stojanova et al. [64] suggested setting up a rural digital innovation center to help local enterprises carry out technological innovation, improve production efficiency and increase rural productivity [65].

2.2. Research on Policy Evaluation

Policy evaluation refers to the activity in which the evaluation subject adopts a series of scientific and effective evaluation criteria and methods to systematically measure and judge the entire system and process of policies, in order to comprehensively examine, analyze, and summarize the effects of policies. The purpose of policy evaluation is to provide decision support for policy adjustment and optimization, in order to achieve the scientific formulation and effective implementation of policies [66]. The concept of policy evaluation first appeared in education and public health programs before World War I, but it was not until the 1970s that policy evaluation gradually emerged in the field of social sciences and continued to develop and evolve in an empirical manner [67]. Scholars from multiple disciplines such as economics, management, political science, sociology, and statistics have conducted in-depth research on policy evaluation from different perspectives, enabling the continuous expansion and maturity of policy evaluation methods.
Common policy evaluation methods include text analysis, principal component analysis, Delphi method, difference-in-differences method, PMC index model method, etc. The PMC index model is highly favored due to its series of advantages, and its full name is Policy Modeling Consistency (PMC) index model. It is a quantitative evaluation method for policy texts proposed by Ruiz Estrada et al. [68] based on the Omnia Mobilis hypothesis, which has been widely applied in different fields [69]. The application principle of this model is to measure and evaluate the internal consistency of a single policy by constructing multiple indicators and then to reflect the differences between the overall policy and all aspects by analyzing the advantages and disadvantages of a single policy. For the setting of indicators, the model believes that everything in the world is interrelated, and each related variable is equally important and consistent. Therefore, it is important to take into account the potential effects of each element and incorporate as many relevant factors as you can [70], so as to conduct a comprehensive quantitative evaluation of policies and reflect the effectiveness and internal consistency of policy formulation. Firstly, the variables required for the PMC index model are mainly obtained through text mining, especially the extraction of secondary variables. There is no limit to the number and weight of variables, and binary values, namely 0 and 1, are used to balance each variable, greatly reducing subjective interference from human evaluation and ensuring the objectivity of the evaluation; Secondly, the PMC index model does not have limitations on the number and range of variables selected, and can add variables according to the research topic; In addition, the results obtained from the PMC index model can be presented in the form of a surface, which can intuitively show the advantages and disadvantages of individual policy texts, and is conducive to the adjustment and optimization of related policies. Therefore, the PMC index model has become a popular policy evaluation method with these advantages.
Meanwhile, in recent years, the PMC index model has been widely applied in the fields of digital policy and rural policy evaluation. Cai et al. [71] combined the model with the PMC surface graph to quantitatively evaluate the digital economy policies in Jilin province. Gao constructed a quantitative evaluation framework covering policy structure, policy tools, and policy effects based on 135 rural revitalization policies issued by central ministries from 2018 to 2022. The PMC index model was used for evaluation, revealing the shortcomings of current policies and providing a reference for improving the policy system of rural revitalization [72]. Qin used software and content analysis methods to extract high-frequency words of digital rural policies, establish evaluation indicators, construct PMC models for 12 policy samples, analyze the advantages and disadvantages of each policy, and propose optimization suggestions [73]. Zou et al. [74] used text mining technology and the PMC index model to construct an evaluation index system for digital rural public cultural service policies. They found that there was insufficient synergy among policy subjects, and the evaluation system needed to be improved. Based on this, targeted suggestions were proposed. In summary, applying the PMC index model to the evaluation of digital rural policies will have strong scientific validity and feasibility.
In summary, the above research has achieved many results in both theoretical and practical fields, providing a valuable basis for this study. However, there are still shortcomings in current research, mainly in the lack of attention to information mining of digital rural policies themselves. Specifically, existing research has focused on the connotation, implementation effects, and development recommendations of digital rural areas, with little attention paid to the policy-making process. In fact, policy-making is the “locomotive” of the entire policy process, determining the implementation and effectiveness of subsequent policies. Front-end analysis is the main basis for policy abolition, reform, and establishment, and a good level of digital rural policies is a prerequisite for promoting digital rural construction. Although there have been some studies on the quality of digital rural policies in the future, these have focused on policies at the national or provincial level, and the research objects are either too large or too small, lacking research on a regional scope. Therefore, in this context, this study chooses the widely used PMC index model, establishes evaluation indicators for digital rural policies, takes the Yangtze River Delta region as the research object, analyzes the advantages and disadvantages of policies, explores the optimizable aspects of relevant policies, improves the level of rural development in the Yangtze River Delta region, and provides useful references for the further improvement of the regional and even national policy system in the future.

3. Materials and Methods

3.1. Study Area

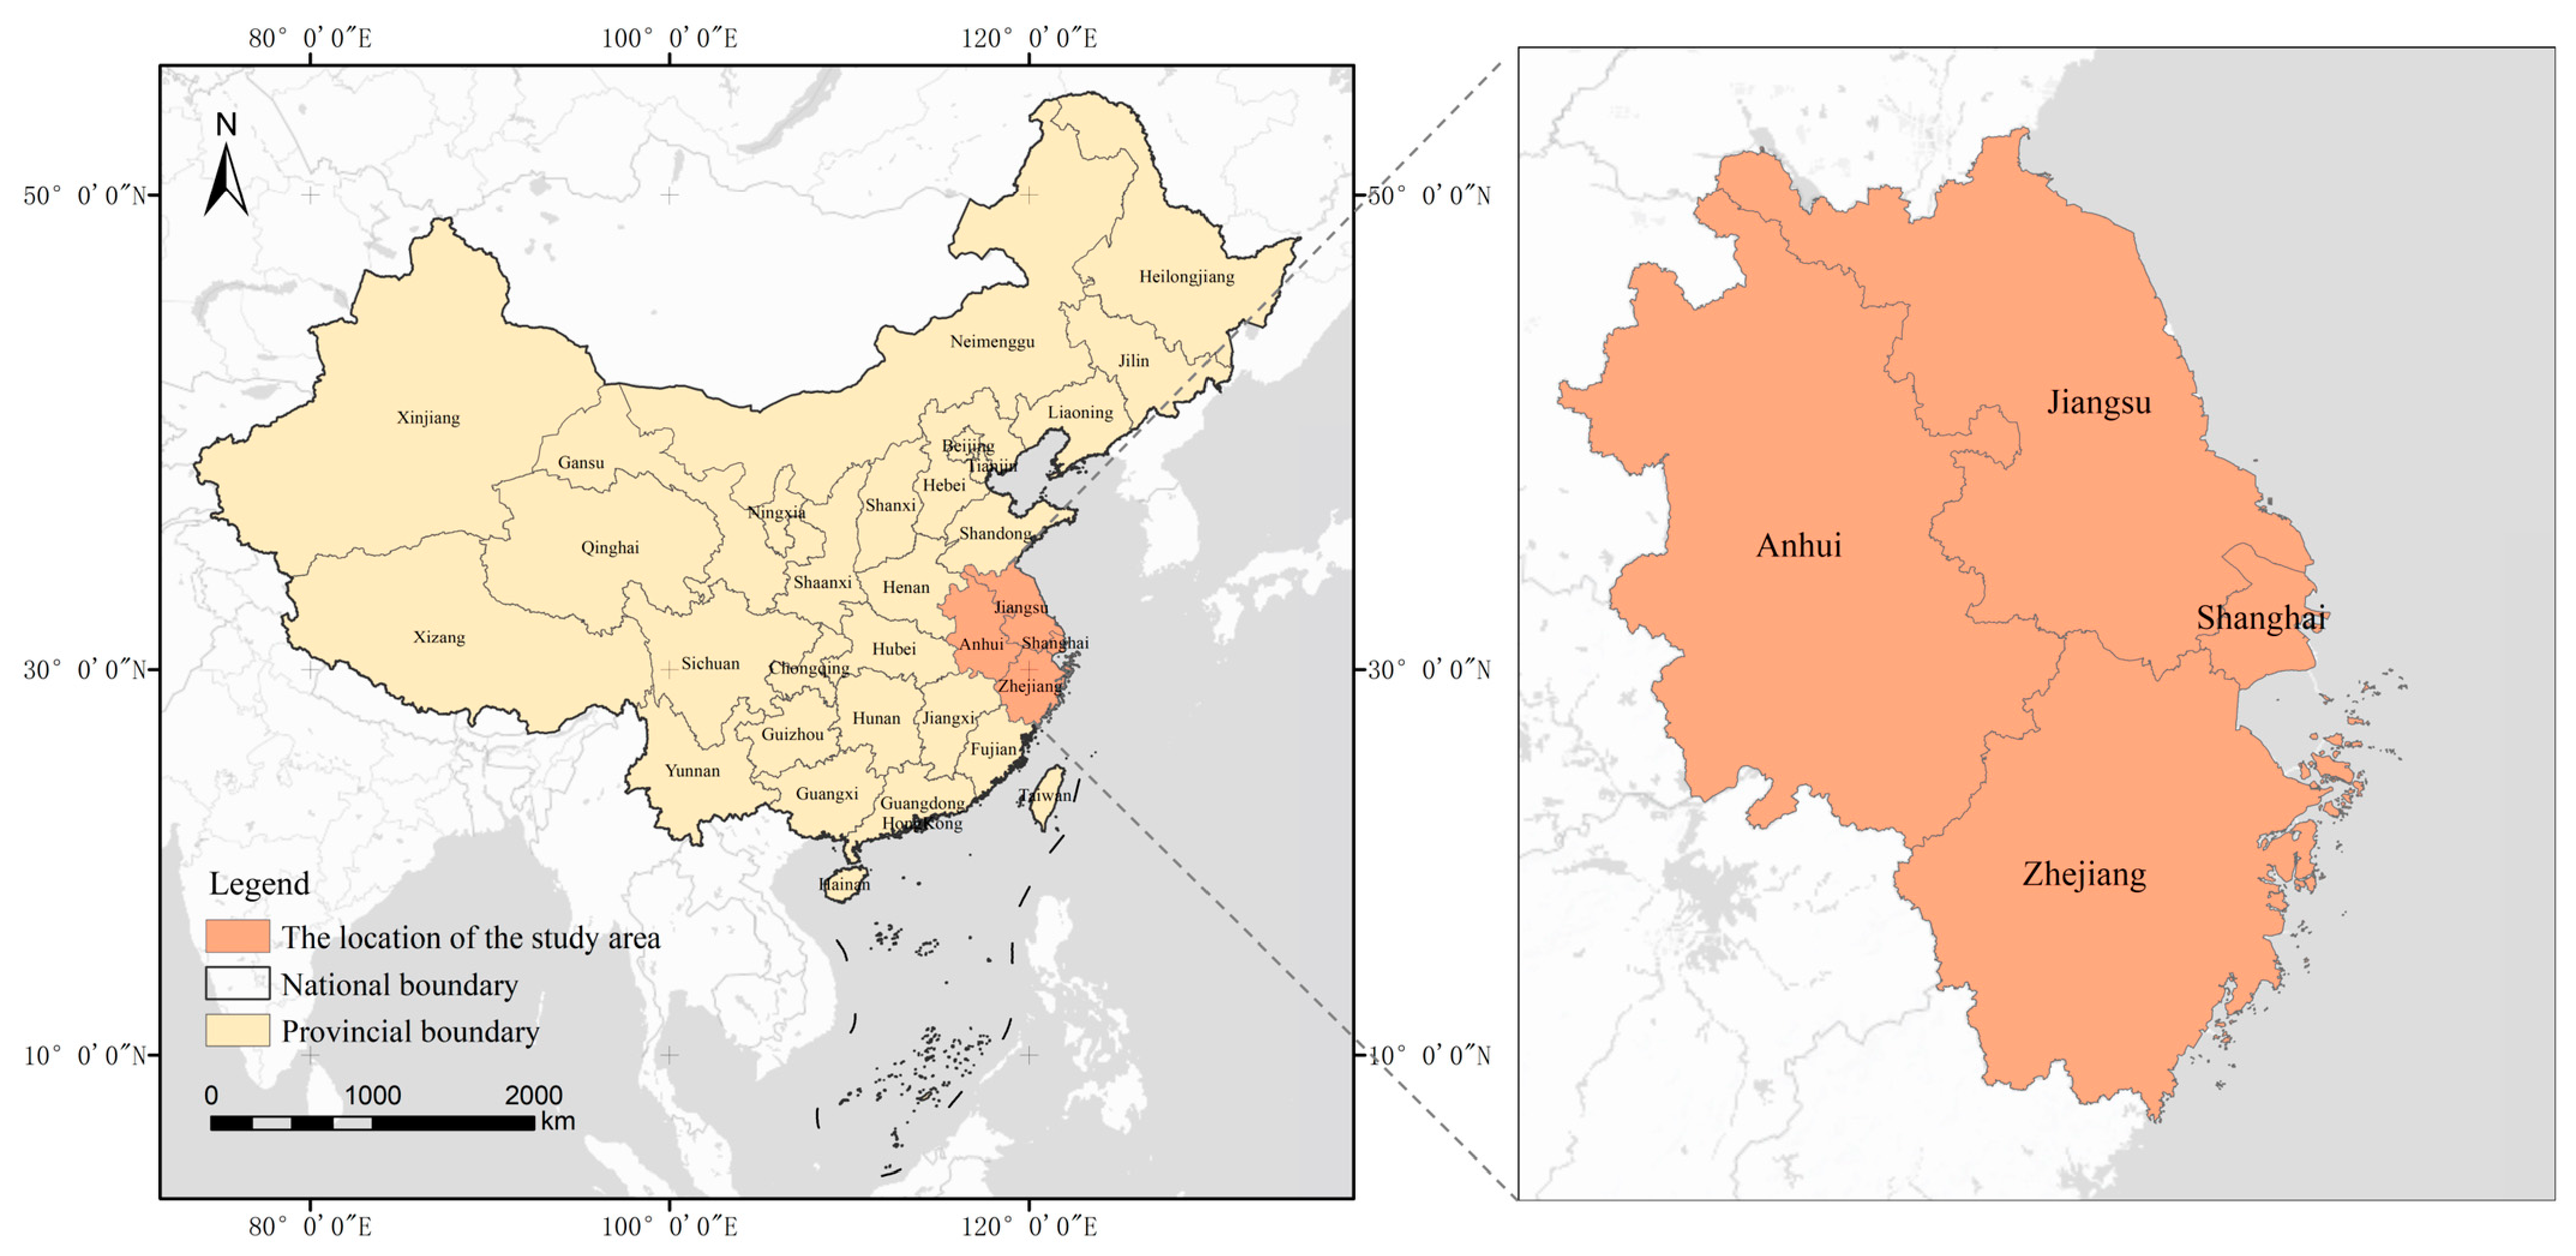
According to the Outline of the Yangtze River Delta Regional Integration Development Plan approved by the State Council, the Yangtze River Delta region includes the entire territory of Jiangsu, Zhejiang, Anhui, and Shanghai. Therefore, the area is roughly between 114°52′ E–123°25′ E, 27°03′ N–35°07′ N, with a total area of approximately 359,100 square kilometers. The geographical location is shown in Figure 1. The selection of the Yangtze River Delta region as the research object for digital rural policies is mainly based on the following considerations: Firstly, the Yangtze River Delta region, especially Zhejiang Province, took the lead in promoting digital rural construction in 2018 and has a first-mover advantage. In February 2023, the Cyberspace Administration of China, the Ministry of Agriculture and Rural Affairs, and the Zhejiang Provincial People’s Government officially signed a memorandum of cooperation to jointly build a digital rural leading area. Zhejiang has become the only digital rural leading area in the country and is at the forefront of implementing the digital rural strategy. Secondly, in 2020, the Cyberspace Administration of China and other departments announced the first batch of national digital rural pilot areas. A total of 14 regions in the Yangtze River Delta region were selected, including Pudong New Area and Fengxian District in Shanghai; Feng County in Xuzhou City, Zhangjiagang City in Suzhou City, Pukou District in Nanjing City, and Donghai County in Lianyungang City in Jiangsu Province; Deqing County in Huzhou City, Pinghu City in Jiaxing City, Cixi City in Ningbo City, and Lin’an District in Hangzhou City, Zhejiang Province; Changfeng County in Hefei City and Dangshan County in Suzhou City, Anhui Province, have accumulated rich practical experience for regional digital rural construction. Finally, as one of the regions in China with strong economic vitality, a high level of openness, and strong innovation capabilities, the Yangtze River Delta has a high level of urban–rural integration development and relatively complete digital infrastructure. Taking it as the research object not only helps to summarize the effective path of rural digital development in economically developed areas, but also provides a reference for other regions in the country as a “Yangtze River Delta model”. In summary, selecting the Yangtze River Delta region for research has strong universality and promotional value.

3.2. Data Source

All of the digital village policies in the Yangtze River Delta that were gathered for this study came from government-released public data. The two processes below are primarily involved in the selection of policy samples. The gathering and arrangement of policy papers is the first phase. First of all, read a lot of literature related to digital villages and determine the search keywords as “Yangtze River Delta”, “digitalization”, “digital village”, “agricultural and rural modernization,” and so on. Secondly, after inputting the above keywords, the initial search will be carried out in the State Council policy document database, Peking University Magic Talisman, Law Star and other databases. After that, the search will be carried out on the Yangtze River Delta government websites at all levels, the Department of Human Resources and Social Security and other official websites to supplement the policies and ensure the comprehensiveness of the policy samples. The second step is to screen policy samples. The first is to follow the timeliness of the policy, and select the policy whose release time is from 1 January 2018 to 1 July 2024; second, choose the text whose title and content are directly related to the development of the “digital countryside” in order to guarantee the policy’s relevance, and delete the text with incomplete content and low correlation; third, in line with the authority of the policy, the main selection of notices, planning, program methods, implementation opinions and other effective, excluding leaders’ speeches, explanations, meeting minutes and other informal documents; fourth, to meet the uniqueness of the policy, delete the nature of forwarding and duplicate files. After extensive screening, 145 effective samples of digital rural policies were finally determined, including 53 in Jiangsu, 39 in Zhejiang, 15 in Shanghai, and 38 in Anhui.

3.3. Research Methods

As an important part of the policy life cycle, policy analysis determines the quality of the realization of policy objectives [75,76]. Therefore, the adoption of scientific evaluation models and tools has become an important topic; only in this way can the effectiveness and reliability of policy evaluation results be guaranteed [77]. Therefore, to comprehensively and objectively evaluate the quality of policies, this study adopts the PMC index model as the core evaluation method. This model is based on the “Omnia Mobilis” hypothesis proposed by Ruiz Estrada, which evaluates the consistency of individual policies by constructing multidimensional indicators and allows for flexible adjustment of variables according to research topics, making it suitable for quantitative comparison of policy texts. At the same time, in order to reduce the subjectivity of variable selection, this study is supplemented by policy text mining and social network analysis. Specifically, high-frequency words were extracted from policy texts using Rost cm6.0 software, and a co-occurrence map of keywords was drawn using Gephi 0.9.2 software. Among them, high-frequency words and their network relationships reveal the focus and structural connection of digital rural policies, providing an objective basis for the construction of the evaluation index system in the following text [78].

3.4. Construction of PMC Index Model

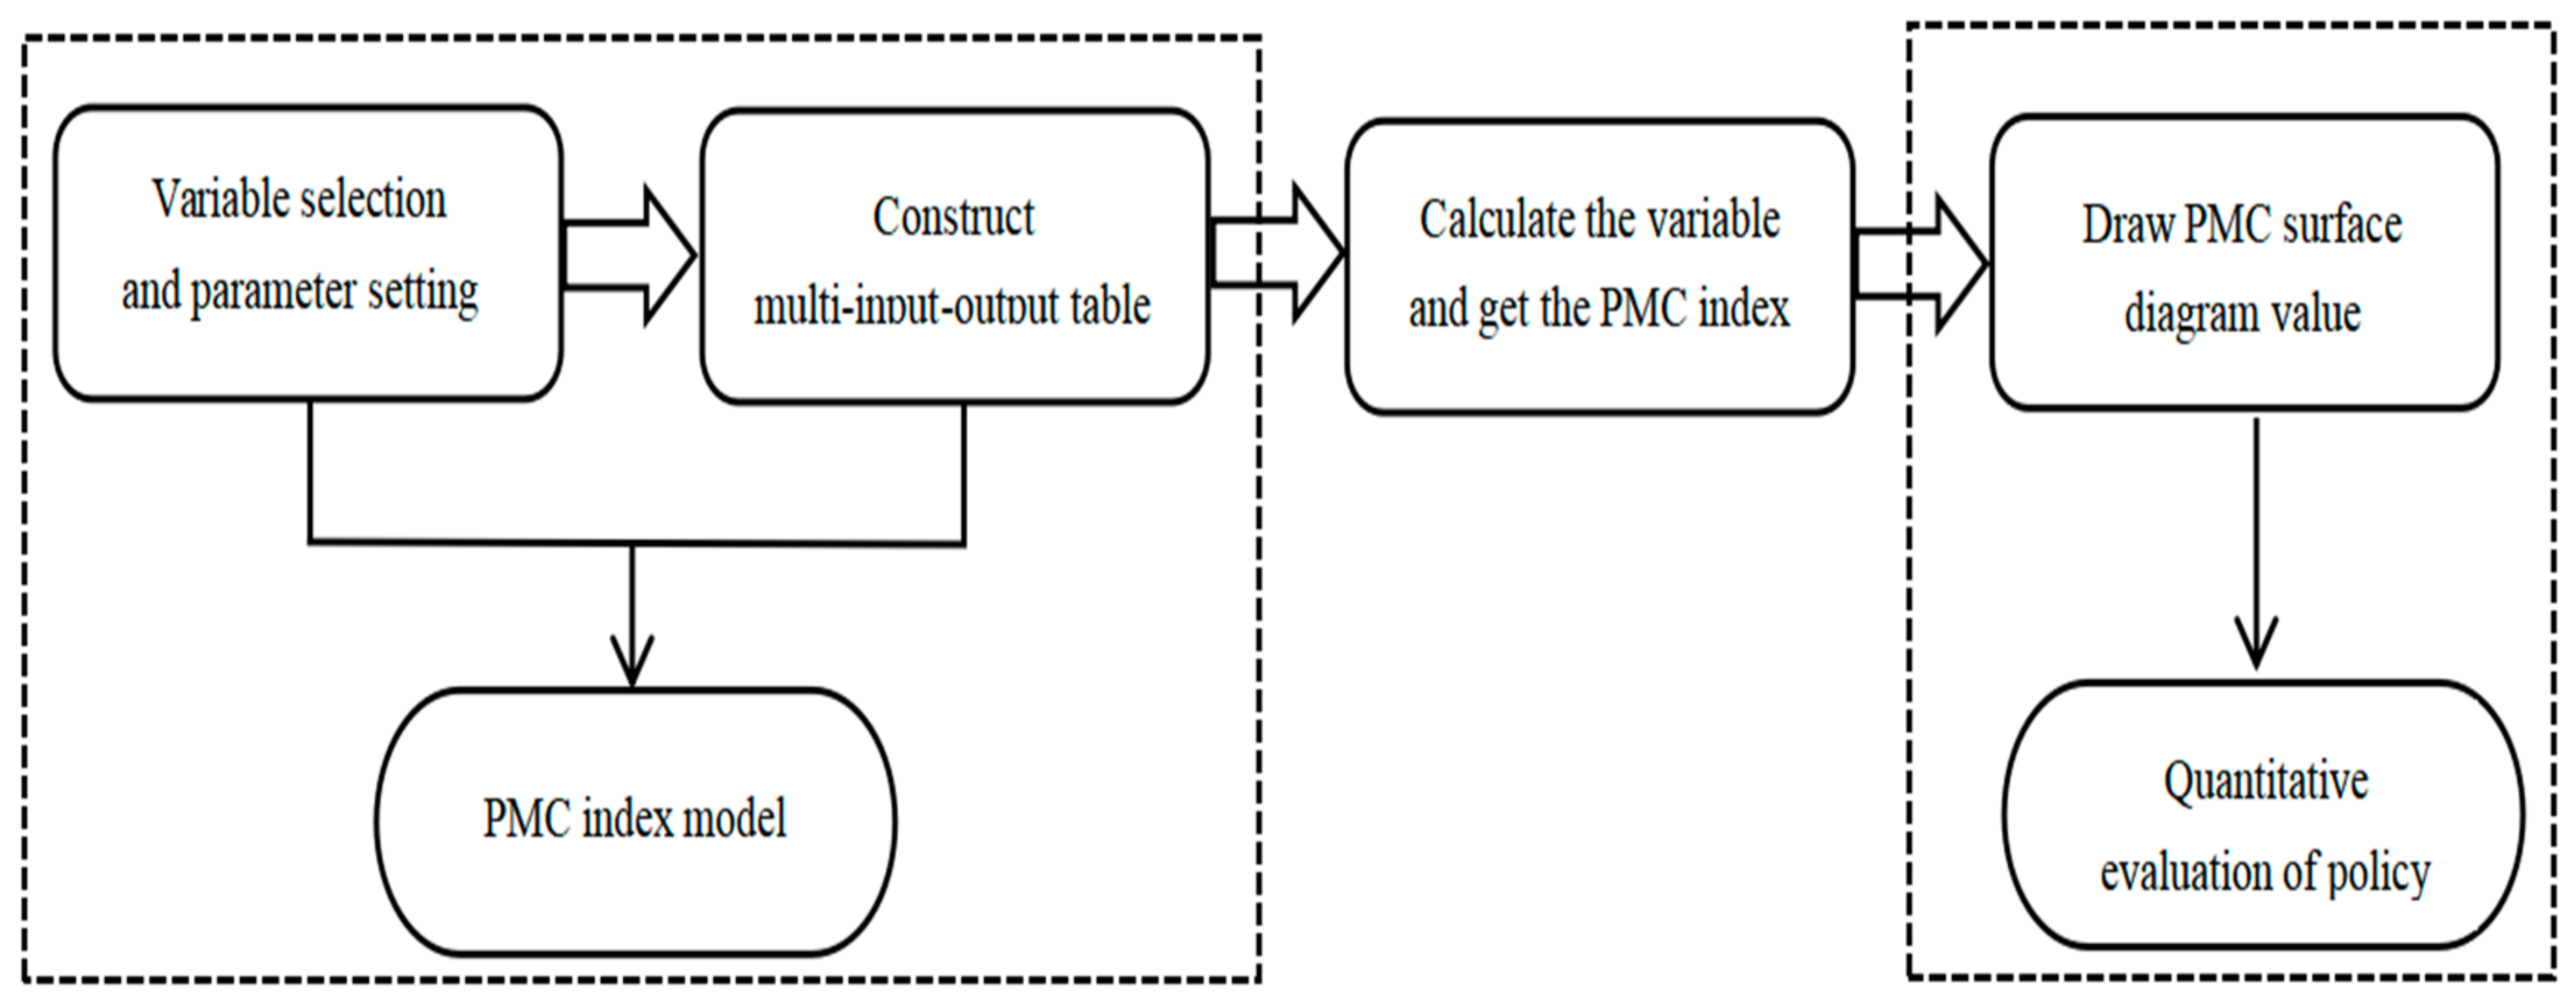
The following four aspects are included in the PMC index model’s construction steps: first, selecting evaluation variables and setting parameters; second, creating a table with several inputs and outputs; third, calculating the PMC index; and fourth, creating and illustrating a PMC surface diagram, as seen in Figure 2.

3.4.1. Identification and Selection of PMC Index Model Variables

(1)
Mining policy texts
The identification and selection of variables in the PMC index model is the foundation of this study, which has a direct impact on the efficacy and rationality of the outcomes of policy evaluation. Simultaneously, as per the above-mentioned PMC index model introduction, before conducting policy evaluation, it is necessary to widely consider all possible relevant variables. Therefore, using Rost cm6.0 software for content mining of policy texts provides a reference for selecting primary and secondary evaluation indicators for policies. After sorting, effective high-frequency vocabulary has been obtained. Due to limited space, this study only lists the top 50 ranked vocabulary items, as shown in Table 1 below.
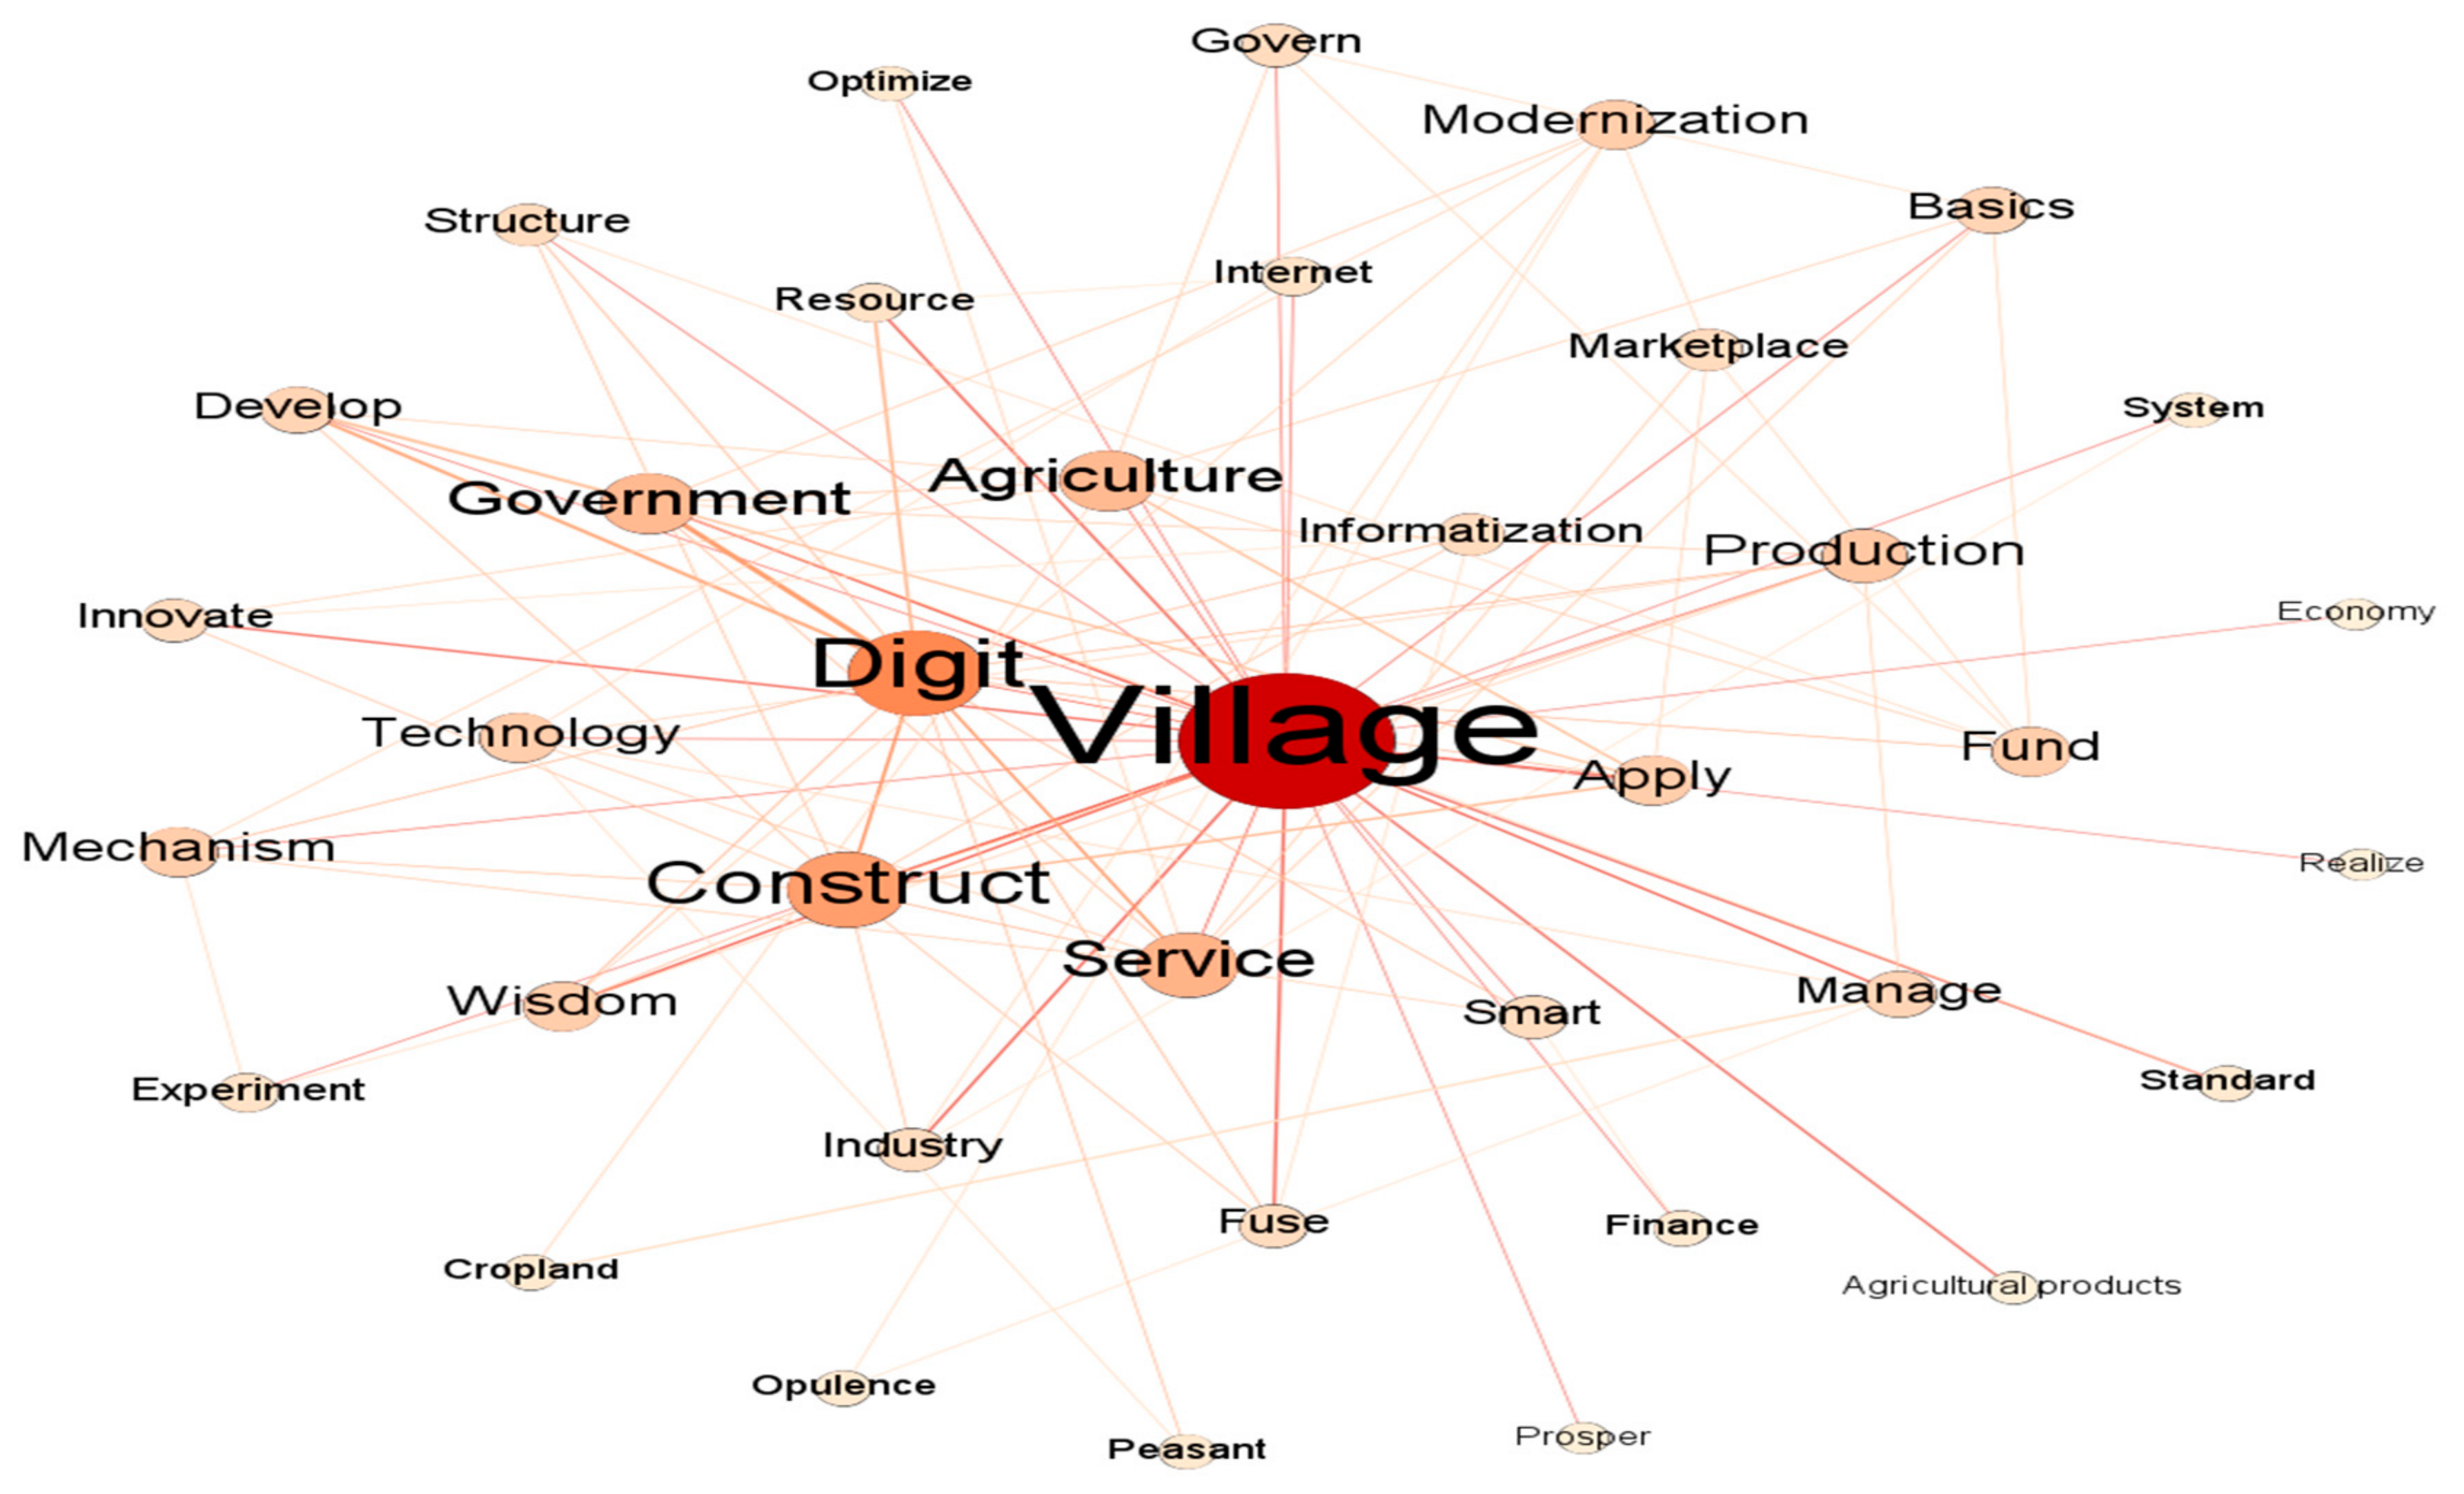
Simultaneously, to more intuitively observe the internal relationships between high-frequency words and understand the distribution focus of policy content. Figure 3 displays the social network map of words with a high frequency in digital rural policies created with Gephi 0.9.2 software. In this graph, high-frequency words are represented by nodes. The larger the node, the larger the corresponding label, and the more nodes are connected to each other, the more important the node. Based on Table 1 and Figure 2, it can be seen that there are a total of 50 high-frequency theme words for digital rural policies in the Yangtze River Delta, with a frequency higher than 200. Among them, “Village” appears 8603 times, “Digit” appears 8359 times, and “Construct” appears 7595 times, indicating that the policy text content retrieved this time is mainly focused on the construction of digital rural areas. Correspondingly, the figure also revolves around the symbiotic relationship of these three keywords, revealing the top-level design framework and policy priorities of the Yangtze River Delta policy.
(2)
Variable setting and indicator selection
Ruiz Estrada’s [79] PMC index model serves as the foundation for this investigation and refers to the revisions made by many scholars to the PMC index model [80,81,82,83] and related research on digital rural construction [5,84,85,86,87]. Based on the results of policy text mining and the social network graph, as well as the features of the digital rural policy itself, the evaluation index system is constructed, and 10 first-level variables are revised and selected, and 49 second-level variables are set up. Specific variables are shown in Table 2 below.
As mentioned earlier, Ruiz Estrada et al. [68] emphasized the need to include as many variables as possible and not ignore any related variables. So, following the hypothesis of “Omnia Mobilis”, all secondary variables are given the same weight to eliminate artificial hierarchical differences between variables. At the same time, when setting the parameters of secondary variables, binary values are used to assign 0 or 1 to each variable. The criteria for assigning values are that if the policy content is consistent with the description of the corresponding secondary variable, 1 is allocated to the policy. If it is inconsistent, the policy is assigned a value of 0. It should be noted that “Policy disclosure” does not have secondary variables and only assigns values to its primary variable. As each policy is publicly announced by the government, X10 is assigned a value of 1. And policy effectiveness (X2): Long term (X2:1) represents more than 5 years, medium term (X2:2) represents 3–5 years, and short-term (X2:3) represents 1–3 years.

3.4.2. Establish a Multi-Input-Output Table

The essence of a multi-input-output table is to construct a framework for multidimensional data analysis, enabling researchers to systematically and comprehensively quantify and analyze each variable [88]. It is also the basis for calculating the weight of variable indicators, and the secondary variables under each primary variable are equally important. Therefore, in the multi-input-output table data framework, the binary form is adopted to process variable indicators to ensure that each secondary variable is given the same weight. Finally, based on the construction principles of the PMC model and the specific conditions of various variables in digital rural policies, this study established a multi-input-output table, as shown in Table 3. It should be noted that in the results analysis section, the secondary variables of the selected typical digital village policies will be assigned values.

3.4.3. Calculation of PMC Index and Classification of Policy Levels

First, there are 10 first-level and 49 second-level variables in the multi-input-output table; Second, the appropriate second-level variables are assigned values using Formulas (1) and (2), in accordance with the conditions listed in Table 2. Next, Formula (3) states that the index of the second-level variable is summed to determine the value of the matching first-level variable. Finally, according to Formula (4), the PMC index for each policy is the total of the values of the ten first-level variables.
X N   0 ,   1
X = { X R : 0 , 1 }
X t j = 1 n X t j T X t j   t = 1,2 , 3,4 , 5,6 , 7,8 , 9,10
P M C = X 1 j = 1 6 X 1 j 6 + X 2 j = 1 3 X 2 j 3 + X 3 j = 1 3 X 3 j 3 + X 4 j = 1 6 X 4 j 6 + X 5 j = 1 3 X 5 j 3 + X 6 j = 1 10 X 6 j 10 + X 7 j = 1 8 X 7 j 8 + X 8 j = 1 5 X 8 j 5 + X 9 j = 1 5 X 9 j 5 + X 10
In Formula (3), t is the first-level variable; j is the second-level variable, and T is the number of the t-th first-level variable.
Based on specific scores and the scoring criteria of Ruize Estrada et al. [68], classify relevant policies into levels. Due to the selection of 10 first-level variables in this study, the PMC index had a value between 0 and 10. Table 4 provides specific level standards in detail: 9–10 indicates excellent policy, 7–8.99 indicates good policy, 5–6.99 indicates acceptable policy, and 0–4.99 indicates poor policy.

3.4.4. Drawing of PMC Surface

The PMC surface diagram is obtained by converting the specific values of first-level variables into a 3 × 3 matrix on the basis of the PMC index score. Formula (5) displays the details. The curved surface diagram can show the policy in an all-round way, reveal the policy’s benefits and drawbacks in each dimension, and suggest a course for policy optimization through second-order variables. It should be noted that there are 10 first-level variables in this study, among which X10 has no second-level variables, and the score of each policy in this item is 1. Consequently, to guarantee the surface’s symmetry and balance, the X10 variable is removed when drawing the matrix.
P M C   surface = X 1 X 2 X 3 X 4 X 5 X 6 X 7 X 8 X 9

4. Results and Discussion

4.1. Selection of Policy Samples

This study obtained a total of 145 policy texts, making it difficult to calculate and quantitatively analyze them one by one. Therefore, in order to better reflect the construction of policies and since Shanghai does not have a county-level government, in order to ensure consistency in the research, this study mainly selected two policies from each region’s provincial and municipal levels, totaling 16, as the PMC index model’s evaluation object, numbered P1–P16. Please refer to Table 5 for details. The selected policy samples all belong to normative documents with high implementation effectiveness, including opinions, plans and other types, covering the work that the administration has done over the last four years, both short-, medium- and long-term, taking into account as many variables as possible to make them representative to a certain extent.

4.2. Quantitative Evaluation Results and Analysis of Policies

4.2.1. Overall Policy Quality Assessment

Read the policy documents one by one and create the sixteen digital village policies’ multi-input-output table. Next, determine each policy’s PMC values using the applicable formulas and evaluate and rank the policies based on the policy-level classification standards, as shown in Table 6.
When looking at policies from a macro perspective, Table 6’s 16 digital village policies have an average PMC index of 8.42, which is at a good level. Specifically, the 16 policies are ranked as follows: P3 > P2 > P7 > P4 > P11 > P1 > P8 > P12 > P5 > P9 > P10 > P6 > P15 > P16 > P14 > P13. According to the policy level standards in Table 4, four policies were rated as excellent, namely P2, P3, P4 and P7. Among them, the PMC index of P3 in Zhejiang was 9.50, ranking first; twelve policies were rated as good, namely P1, P5, P6, P8, P9, P10, P11, P12, P13, P14, P15 and P16. Among them, the PMC index of P13 in Shanghai was 7.40, with the lowest score; No policy is acceptable or unfavorable, and the overall excellence rate of the policy reaches 100%, indicating that the government in the Yangtze River Delta region is gradually increasing its attention to digital village construction. When formulating digital village policies, comprehensive consideration is given, and the “Digital China” strategy is actively implemented. The overall formulation of policies has strong effectiveness and scientificity, and a digital village strategy and policy network that is in line with the reality of the Yangtze River Delta has been preliminarily formed.

4.2.2. Analysis of Different PMC Index Levels

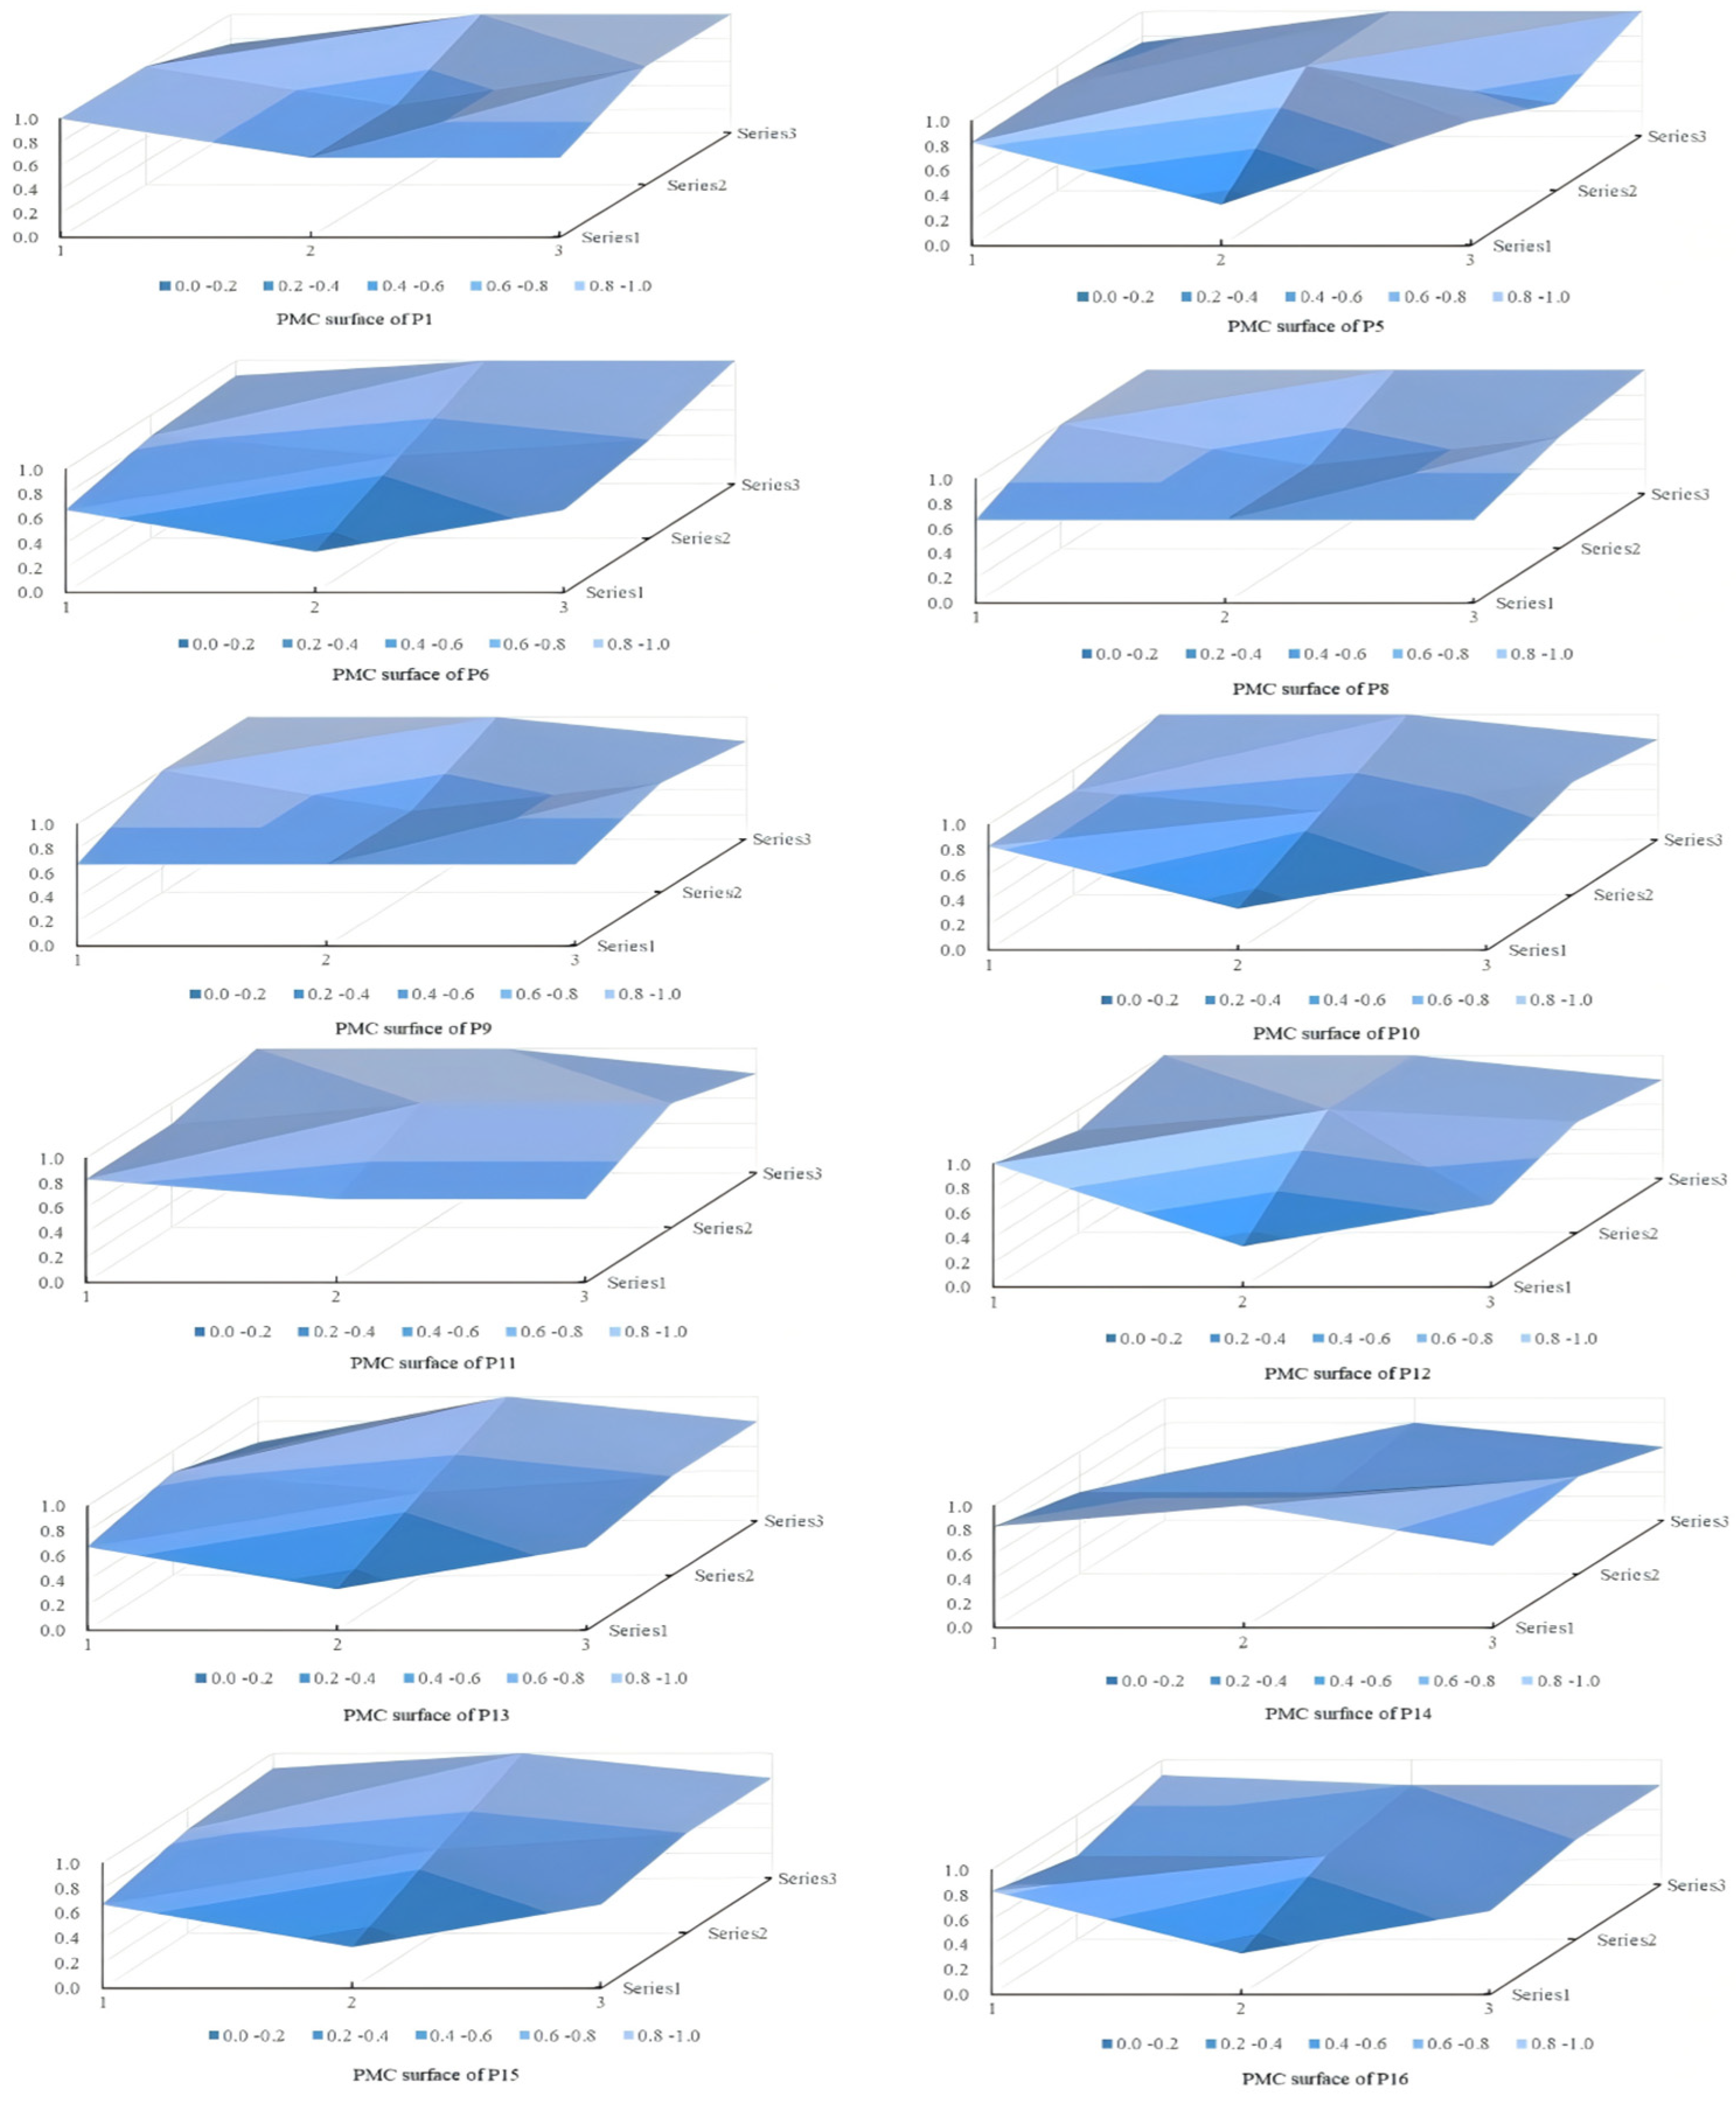
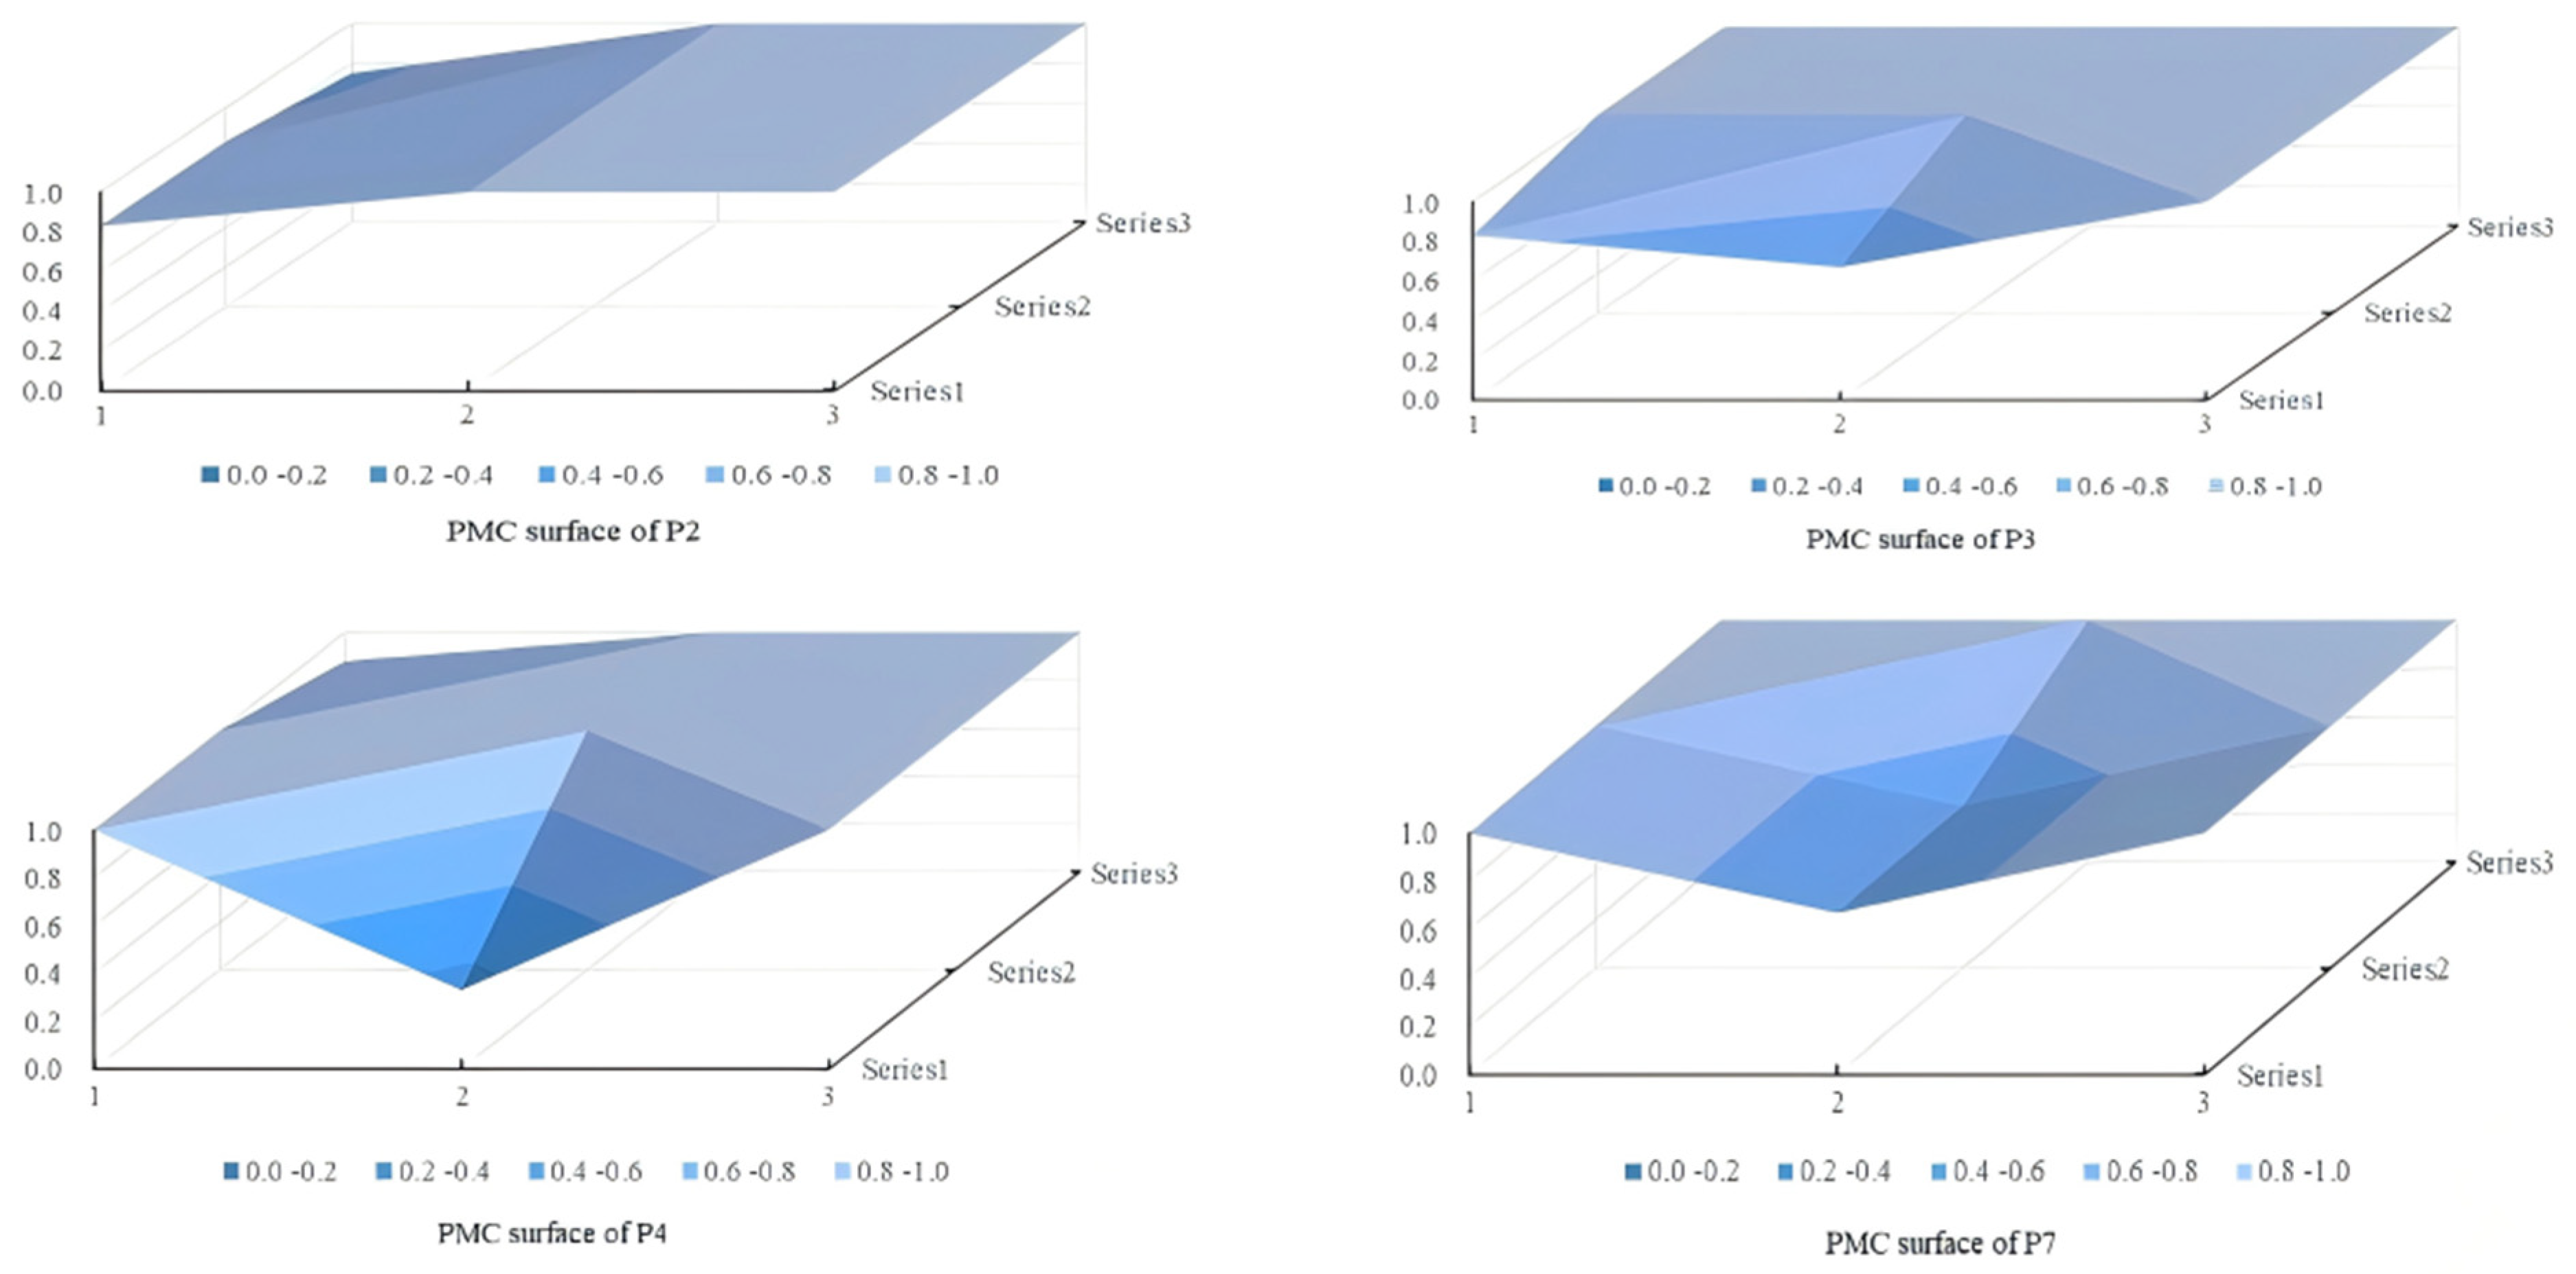
Convert the scores of the first-level variables for each representative digital village policy into a third-order matrix (Table 7) and draw a three-dimensional PMC surface graph for 16 policies, as shown in Figure 4 and Figure 5. Among them, the X-axis represents matrix rows, namely 1, 2, and 3 in the graph; the Y-axis represents matrix columns, namely series 1, series 2, and series 3; and the Z-axis represents the score of the PMC index, with a score range of 0–1. It should be noted that each color in the graph represents the score of the policy in different variable dimensions, and the darker the color, the more concave it is. The concave convex part indicates that a certain variable of the policy has a low or high score, which can be used to judge the overall quality and areas for improvement of the policy.
(1)
The “Excellent” group of policies
Among the 16 policy samples, P2, P3, P4 and P7 are rated “Excellent”. All of which are comprehensive policies.
From a micro perspective, the PMC indices of the four policies mentioned above are all above 9.20, and they score close to or reach full marks on the majority of the variables. The overall smooth surface chart reflects the comprehensiveness and foresight of policy design. The common advantages include: all policies have macro guidance and micro measures, covering cutting-edge fields such as infrastructure construction, network information dissemination, and digital intelligence development; Core dimensions, such as X8 (policy function), X9 (policy evaluation), and X6 (policy content), generally score full or close to full. However, even at this highest level, there are still weak links between commonalities and individualities. Firstly, there is an imbalance in policy timelines (X2): P3 and P4 only focus on the short term and lack medium—to long-term planning, while P7 only sets medium—to long-term goals but lacks specific arrangements for the current stage, reflecting the different emphasis of excellent policies in the time dimension and the failure to achieve comprehensive coverage in the short, medium, and long term. Secondly, there is a lack of advisory content of a policy nature (X1), and both P2 and P3 lack advisory guidance on future trends and development directions, which affects the forward-looking nature of policies. Once again, the incompleteness of the safeguard measure (X7), the lack of key guarantee elements such as tax incentives and institutional linkage in P2 and P4, and the existence of a gap in the supervision mechanism in P2 indicate that insufficient intensity of incentive measures and poor institutional linkage are common shortcomings. In addition, the micro-level in policy perspective (X5) is insufficient, and P7 ignores the needs of grassroots individuals and specific implementation subjects, lacking micro-operational guidance.
In short, excellent-level policies have shown outstanding performance in terms of design integrity, functional positioning, and content coverage, but further optimization is still needed in terms of time balance, the addition of advisory content, the strengthening of safeguard measures, and the supplementation of micro perspectives. This also indicates that even high-quality policies may have a “biased” phenomenon, and comprehensive and coordinated development is still the key direction for policy optimization.
(2)
The “Good” group of policies
Although there are 12 policies with an overall rating in the “Good” range (PMC index 7.40–8.76), they typically have the following systemic deficiencies, summarized based on their frequency and severity:
The policy timelines (X2) are generally insufficient. Most policies lack long-term or short-term planning and focus more on medium-term goals. For example, the X2 scores of P5, P6, P12, and P13 are relatively low, resulting in poor flexibility and continuity of policies at different time stages.
Systematic absence of policy audience (X3). Almost all policies ignore the industrial enterprise group, with policy targets mainly targeting the government and farmers, lacking the design of mechanisms for enterprise participation, responsibility definition, and incentive measures (such as P1, P6, P9, P12, etc.).
The safety measure (X7) is not sound. Tax incentives, institutional connections, laws and regulations are commonly missing sub-dimensions. P1, P5, P13, P16, and others have obvious shortcomings in terms of safeguard measures, which affect the operability and sustainability of policies.
The coverage of the policy field (X4) and policy content (X6) is incomplete. Some policies have gaps in political factors, public services, urban–rural integration, platform applications, etc. (such as P5, P12, P13), resulting in insufficient policy breadth and systematicity.
Policy perspective (X5) and policy nature (X1) have limitations. The lack of macro-strategic perspective or micro-operational guidance is common (such as P1, P6, P8), and there is also a lack of advisory and supervisory content of a policy nature.
Lack of innovation. Policies such as P16 and P12 have homogenized content and lack innovative measures tailored to local conditions, which affects their ability to drive digital rural construction.
In addition, there are also individual policies with extreme performance, with P13 ranking last (PMC = 7.40), only scoring full marks on X8 (policy function), and other dimensions clearly lacking, reflecting its narrow application scope, short strategic vision, and weak guarantee system.
In short, the shortcomings of good-level policies are highly concentrated in three aspects: timeliness planning, lack of enterprise participation, and incomplete safeguard measures. These defects are interrelated and jointly constrain the effective transformation of policies from “design quality” to “implementation effectiveness”. In contrast, the excellent level policy shows a more balanced performance in the above dimensions, further verifying the necessity of comprehensive and coordinated development of policies.

4.2.3. Evaluation and Analysis of Different Policy Indicators

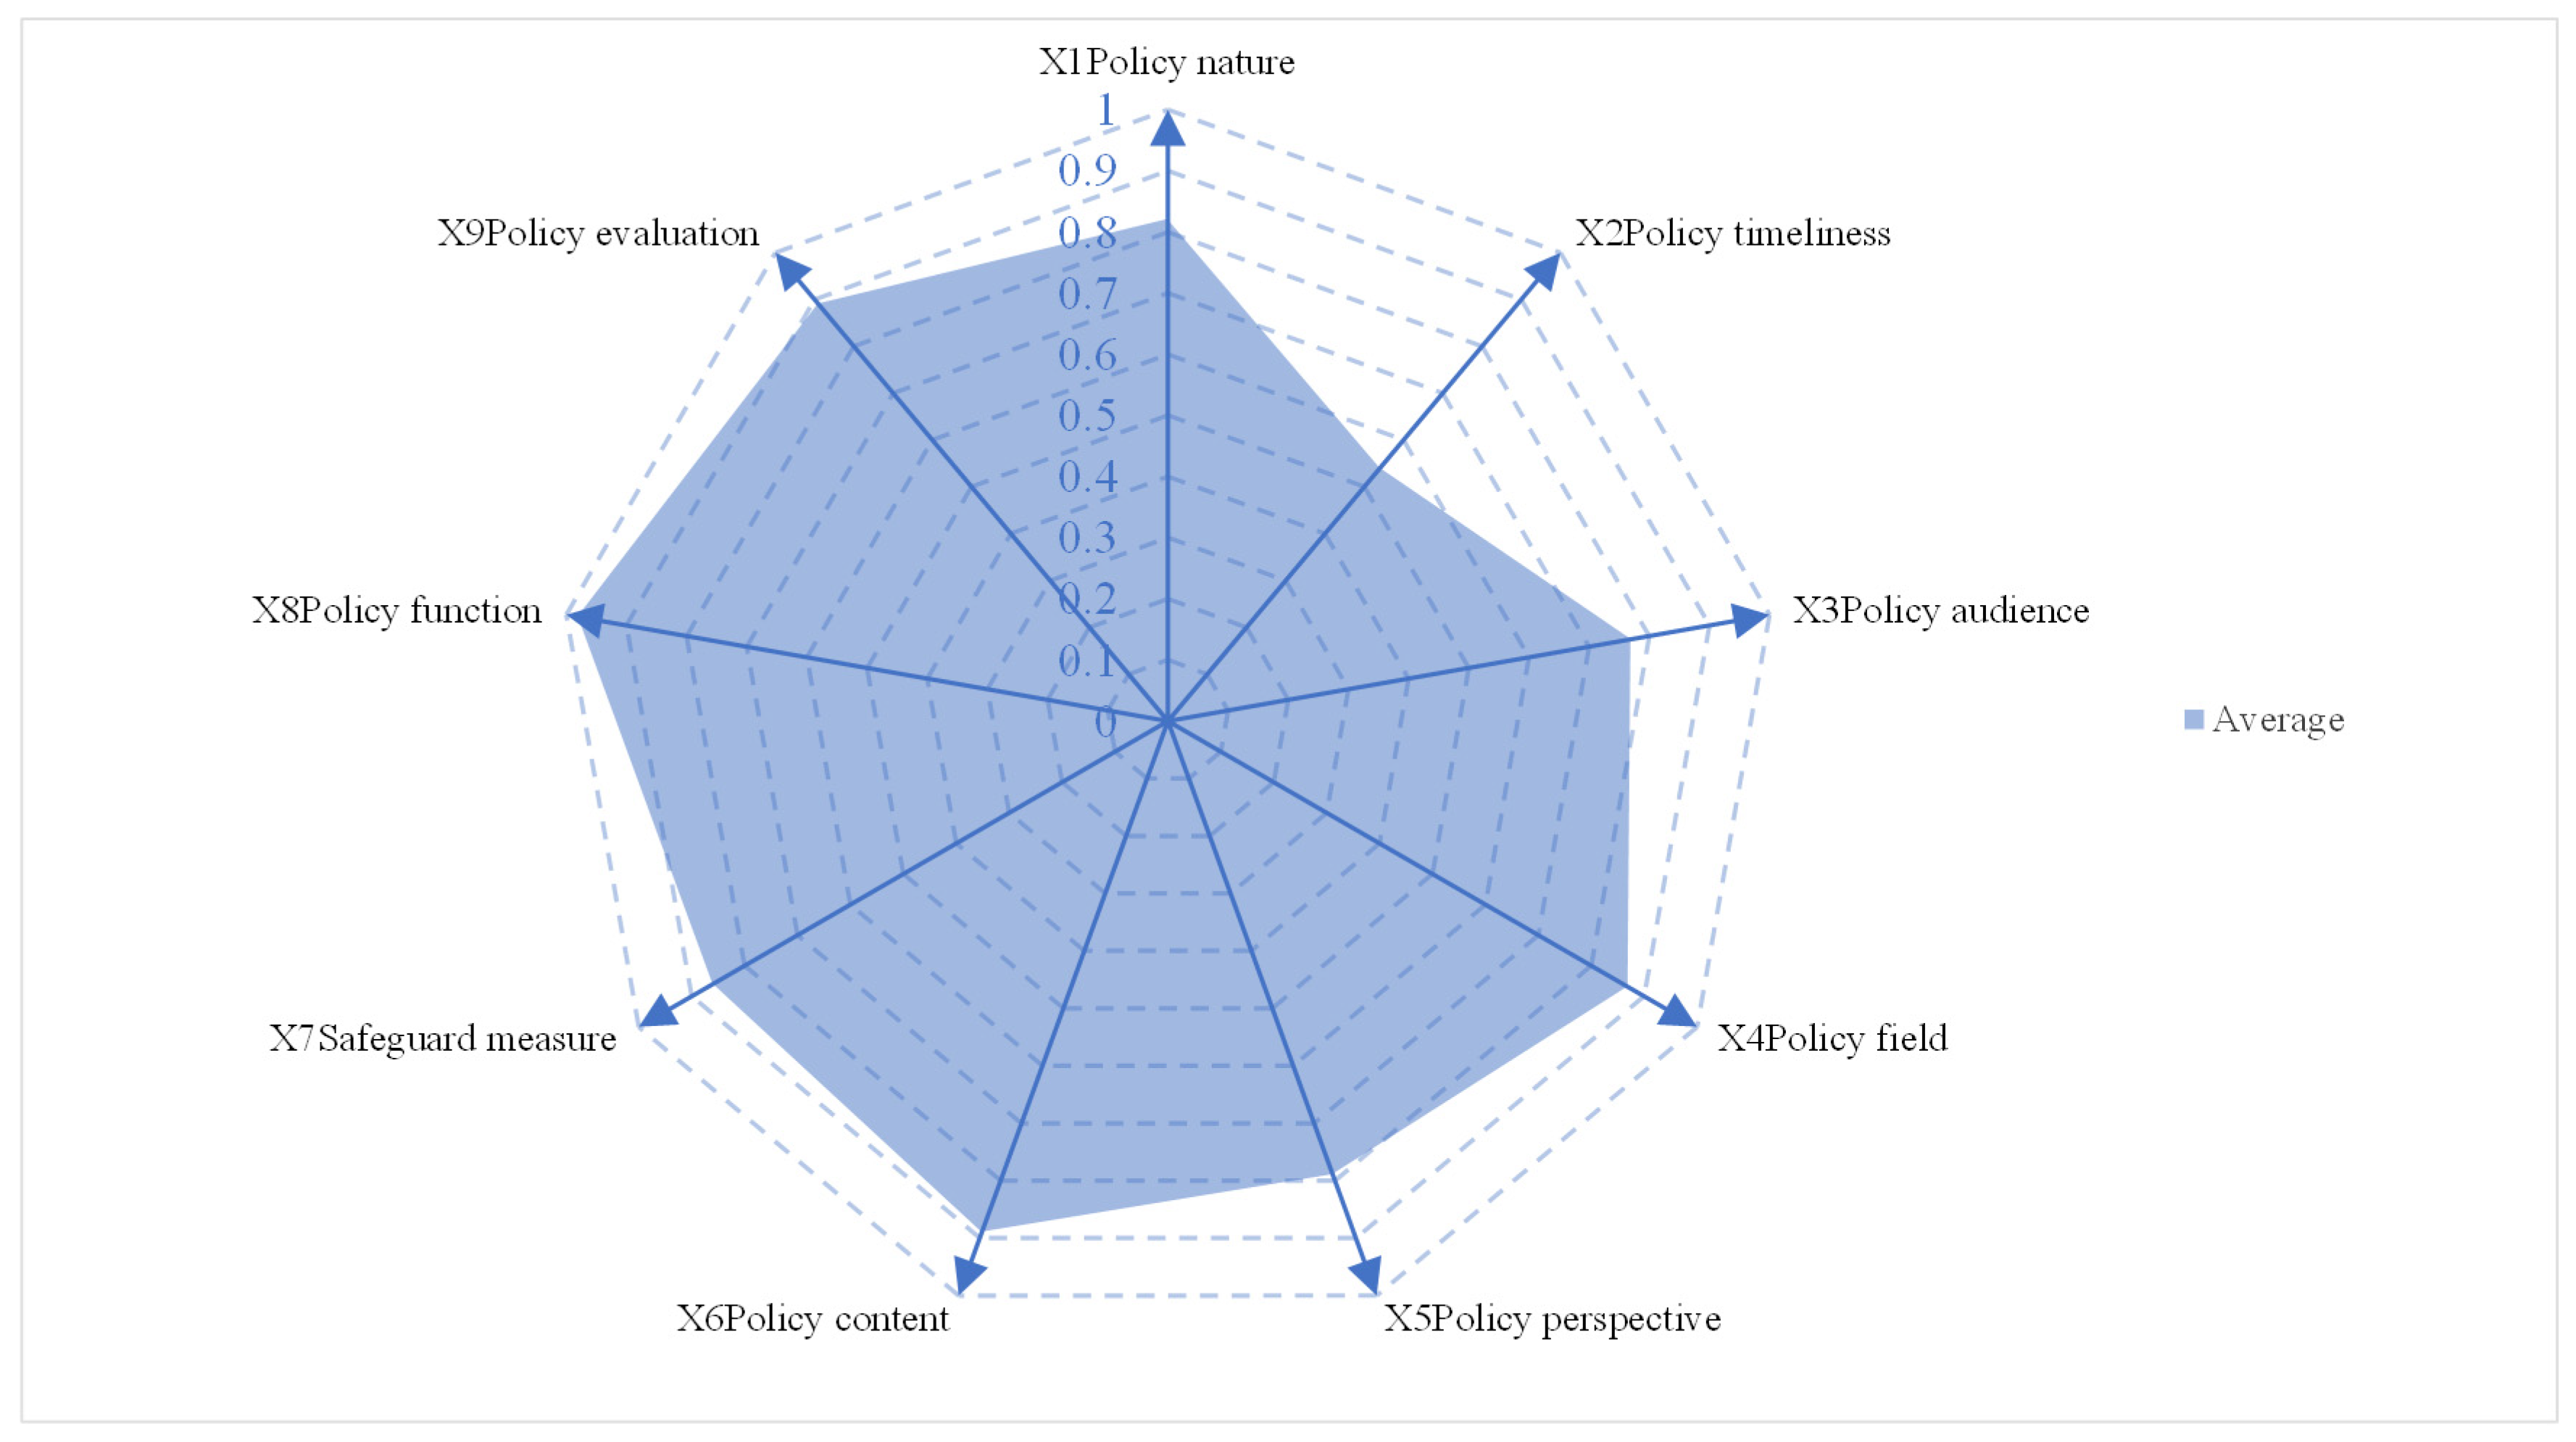
From the micro perspective of policy, in terms of primary variables, the average ranking of the 16 policy indicators is: X8 (policy function) > X9 (policy evaluation) = X6 (policy content) > X4 (policy field) > X7 (safeguard measure) > X1 (policy nature) > X5 (policy perspective) > X3 (policy audience) > X2 (policy timeliness). In order to display the overall situation of various digital village policies more intuitively, the average values of 9 primary variables were selected from Table 6, and a radar chart was created using software, as shown in Figure 6. From the radar chart, it can be seen that the scores of the primary variables of the 16 policies show an uneven feature. Among them, the X8 (policy function) score is as high as 0.98, significantly higher than all other primary variables, indicating that existing policies perform particularly well in the dimension of “policy function”. The scores of the remaining primary variables range from 0.54 to 0.89. Although X9 (policy evaluation, 0.89) and X6 (policy content, 0.89) are also at a relatively high level, there is still a certain gap compared to X8. At the same time, the effectiveness of digital rural policies depends not only on the outstanding performance of a certain dimension but also on the comprehensive and coordinated development of all dimensions. Therefore, except for X8, which has already performed well, there are varying degrees of optimization space for the policy dimensions corresponding to the other primary variables. Specifically, X4 (policy field, 0.87), X1 (policy nature, 0.82), X7 (safeguard measure, 0.86) at a moderate level, although policies have been involved in these areas, they have not yet been fully implemented, and further expansion of coverage and depth is needed; The scores of X3 (policy audience, 0.77) and X5 (policy perspective, 0.79) are relatively low, which is a shortcoming dimension that needs attention in the current policy system; However, the X2 (policy timelines) score is only 0.54, far lower than other indicators, indicating that the time planning effectiveness of policies has not been effectively utilized, and there is a lack of policies with long-term and short-term effectiveness, which is a weak link that needs to be improved as a key focus at present. In summary, in order to further enhance the overall quality and implementation effectiveness of digital rural policies in the Yangtze River Delta, policymakers should consolidate the advantages of X8 while systematically strengthening their attention and investment in other dimensions, especially X2, to improve the overall balance and effectiveness of policies.
To present the deficiencies of each indicator more clearly and accurately, combined with the performance of secondary indicators, the specific issues are summarized in the following table (Table 8).
From the above table, it can be seen that X1 mainly lacks two types of content: “suggestion” and “supervise”; X2 indicates that both long-term planning and short-term measures have shortcomings, which will directly weaken the coherence and effectiveness of policy implementation. It is necessary to change the work of a single time frame and strengthen the forward-looking impact of policies; X3 often neglects industrial enterprises and fails to actively mobilize the role of enterprise groups, which hinders the realization of rural modernization; X4 is weak in institutional construction and environmental protection; X5 lacks macro and micro perspectives; There are gaps in public services, urban–rural integration, and platform applications for X6, which will slow down the speed and quality of rural digital construction; X7 lacks tax incentives, institutional linkage, and legal protection, indicating that the application of policy safeguards is not comprehensive enough; X8 is relatively complete; X9 needs to improve its content innovation, as the lack of tailored incentive clauses and flexible institutional arrangements will not activate the behavioral response of the target group. In summary, these systemic deficiencies will collectively constrain the overall quality of digital rural policies.

4.2.4. Evaluation and Analysis of Policies at Different Administrative Levels

(1)
Policy evaluation based on descriptive statistical results
To further compare the specific situation of the PMC index under different circumstances and explore policy consistency between different levels, this study conducted descriptive statistics on policies at different levels. The specific results are shown in Table 9. From the overall standard deviation comparison, the standard deviation of provincial-level policies (0.98) is slightly lower than that of city-level policies (1.02), reflecting the characteristic differences in policy-making at different levels. The relatively small standard deviation at the provincial level indicates that provincial policies have higher internal consistency and stability under the PMC evaluation system and also demonstrates that provincial policies have a more unified planning concept, a relatively standardized policy framework, and a more mature policy-making mechanism in the formulation process. In contrast, the standard deviation at the municipal level is slightly larger, reflecting greater differences in the specific implementation process of municipal policies. However, all municipal policies belong to the “good” level, which not only reflects the policy adjustment of local governments according to local conditions but also exposes the imbalance in the formulation ability and policy quality of municipal policies. From the distribution of standard deviations of primary indicators, whether it is provincial or municipal policies, the X2 indicator shows the largest standard deviation. For the provincial level, a standard deviation of 0.22 indicates a lack of uniformity in the time planning of digital rural policies among provinces. Some provinces may have set more urgent short-term goals, while others tend to set more relaxed long-term plans. The standard deviation in timeliness at the municipal level is larger, at 0.24, further highlighting the complexity of time coordination in grassroots policy implementation, reflecting the greater uncertainty and implementation difficulty faced by municipal governments in grasping policy timeliness. Ultimately, it can be concluded that the high standard deviation in timeliness between provincial and municipal policies may lead to a mismatch in policy implementation time, affecting the overall efficiency of promoting digital rural construction. It is necessary to strengthen the time coordination mechanism between different levels in future policy formulation, establish more unified policy timeliness standards, and improve the synchronization and effectiveness of policy implementation.
(2)
Policy evaluation based on the PMC surface
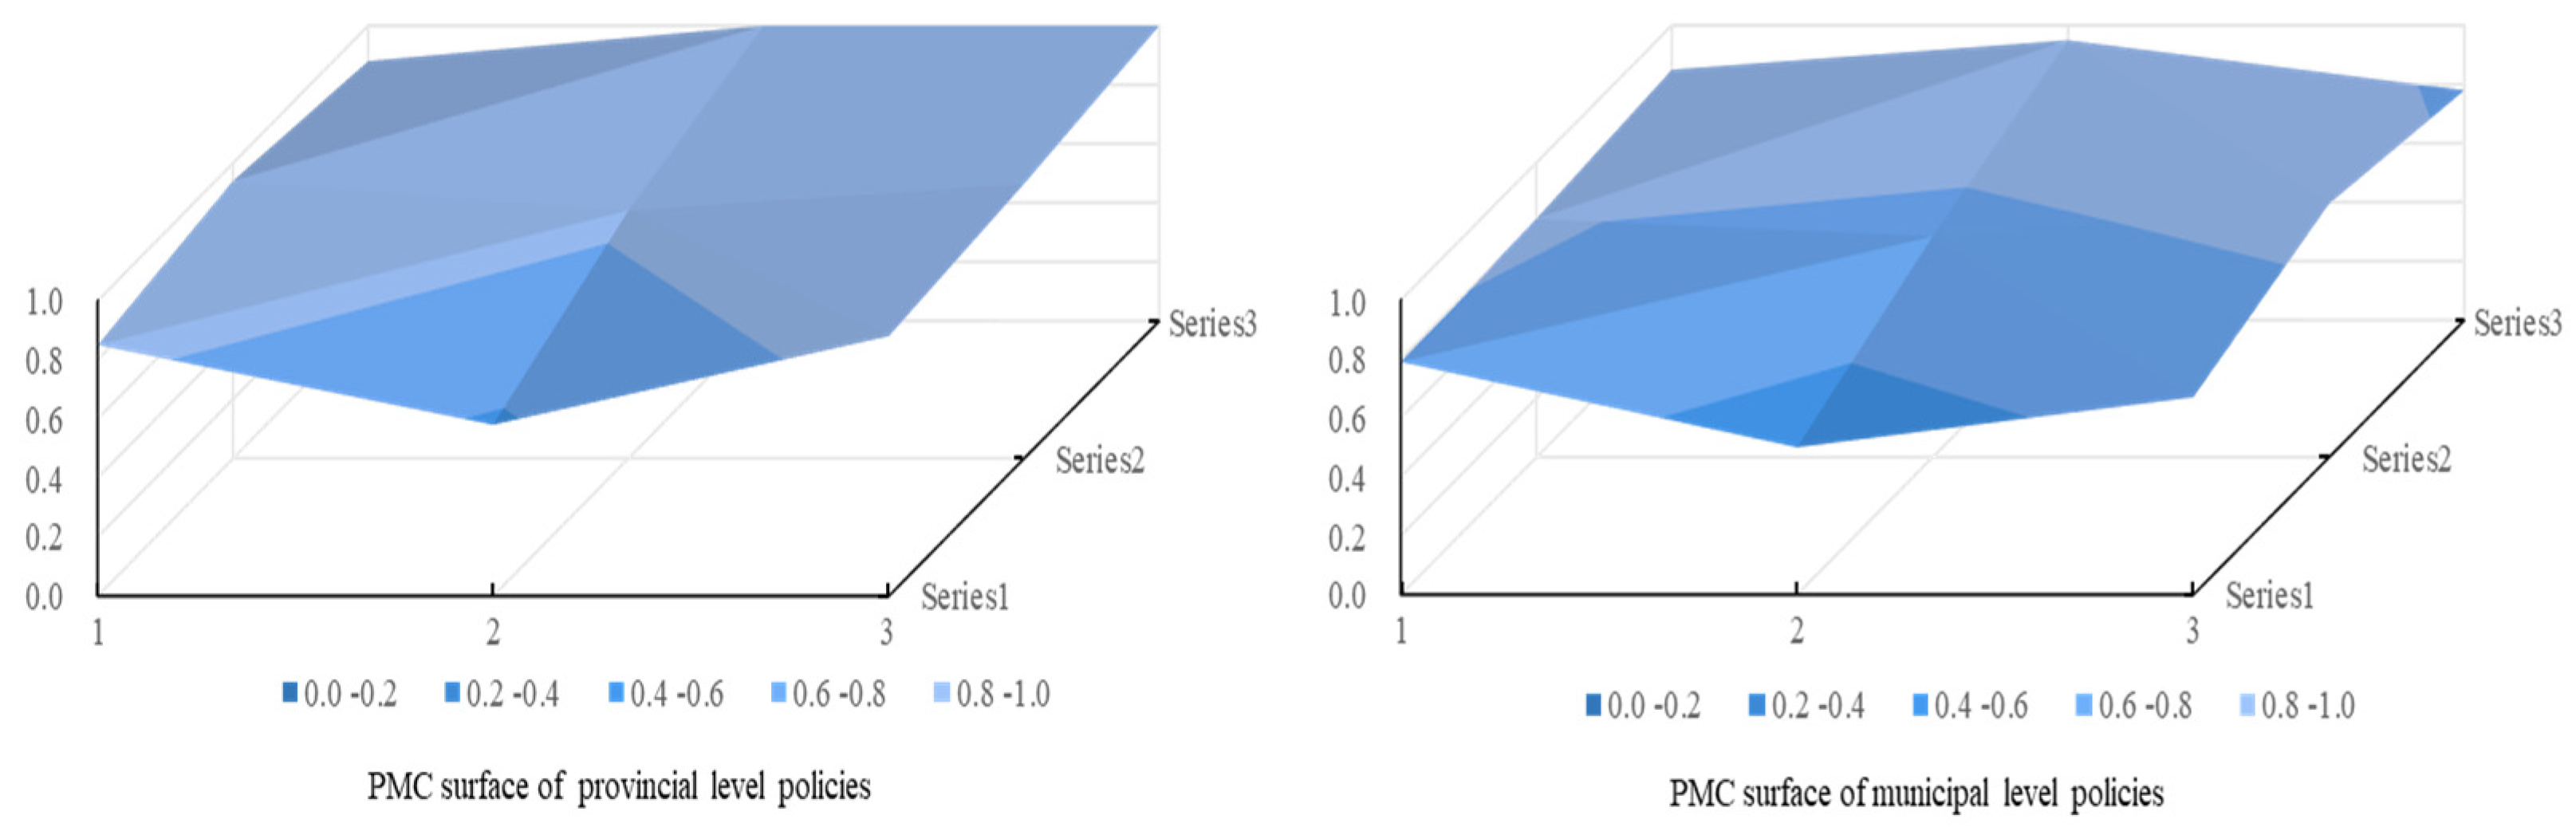
According to the PMC evaluation results, the average PMC of provincial policies is 8.89, while the average PMC of municipal policies is 7.96, with a difference of 0.93, reflecting that the overall quality of provincial policies is better than that of municipal policies. From Figure 7, it can be seen that the provincial level presents a smoother contour in the surface graph and has achieved a “good” level in seven indicators, indicating that the provincial government has stronger professional capabilities in policy content design, safeguard measures configuration, and evaluation mechanism establishment. At the same time, provincial policies only have two indicators on the “acceptable” level, indicating that there is room for improvement in some areas, but the overall level is still relatively balanced. In contrast, at the municipal level, there are only two indicators at the good level, namely policy function (X8) and policy openness (X10), reflecting that the municipal government can better meet the needs of the grassroots. However, at the municipal level, there are seven indicators at the “acceptable” level, covering almost all evaluation areas. This indicates that there are obvious shortcomings in the overall quality control and standardization level of municipal policies, so the shaded area of their surface chart is relatively large. It is particularly noteworthy that policies at the provincial and municipal levels show a certain consistency in problem distribution, especially in the weak link of policy timeliness. More interestingly, the full score performance on X9 policy evaluation indicators at the provincial level is in sharp contrast to the comprehensive lack at the municipal level, reflecting the insufficient policy design ability of the municipal government and the lack of ability to effectively translate the spirit of higher-level policies into specific implementation plans.

4.2.5. Policy Evaluation and Analysis Between Regions

(1)
Policy evaluation based on descriptive statistical results
To further explore the policy synergy in the Yangtze River Delta region, this study will conduct descriptive statistics on the policies of four provinces and cities. The specific results are shown in Table 10. According to the table, the average PMC values for Jiangsu, Zhejiang, Shanghai, and Anhui are 8.65, 9.03, 7.78, and 8.26, respectively. This indicates that Zhejiang has the highest policy synergy, while Shanghai has the lowest. Additionally, except for Zhejiang, which has a policy rating of “excellent”, the other three provinces and cities have a policy rating of “good”. Moreover, the standard deviation in Zhejiang is also the lowest, indicating that the overall coordination of various policy elements in the process of formulating digital rural policies in Zhejiang is more effective, and the overall and balanced policy system is also stronger. Based on the first-level indicators, there are significant fluctuations in the policy timeliness of X2 in all four provinces and cities, and there is an imbalance in the distribution of long-term, medium-term, and short-term policies. In addition, Jiangsu has the lowest standard deviation in the X8 policy function dimension, and its performance is the most stable; Zhejiang has the lowest standard deviation between X8 policy functions and X5 policy perspectives, indicating strong coordination in this area, but there are significant differences in policy audience coverage; Shanghai has the lowest standard deviation in X6 policy content, indicating that it pays more attention to the rationality and scientificity of policy design, demonstrating the characteristics of refined governance; Anhui pays more attention to maintaining balance in the distribution of X5 policy perspectives. This also indicates that regions with higher economic levels pay more attention to the functional orientation and content integrity of policies, while regions with slightly weaker economic levels emphasize the unity of policy perspectives but generally lack a precise grasp of policy release timeliness.
(2)
Policy evaluation based on the PMC surface
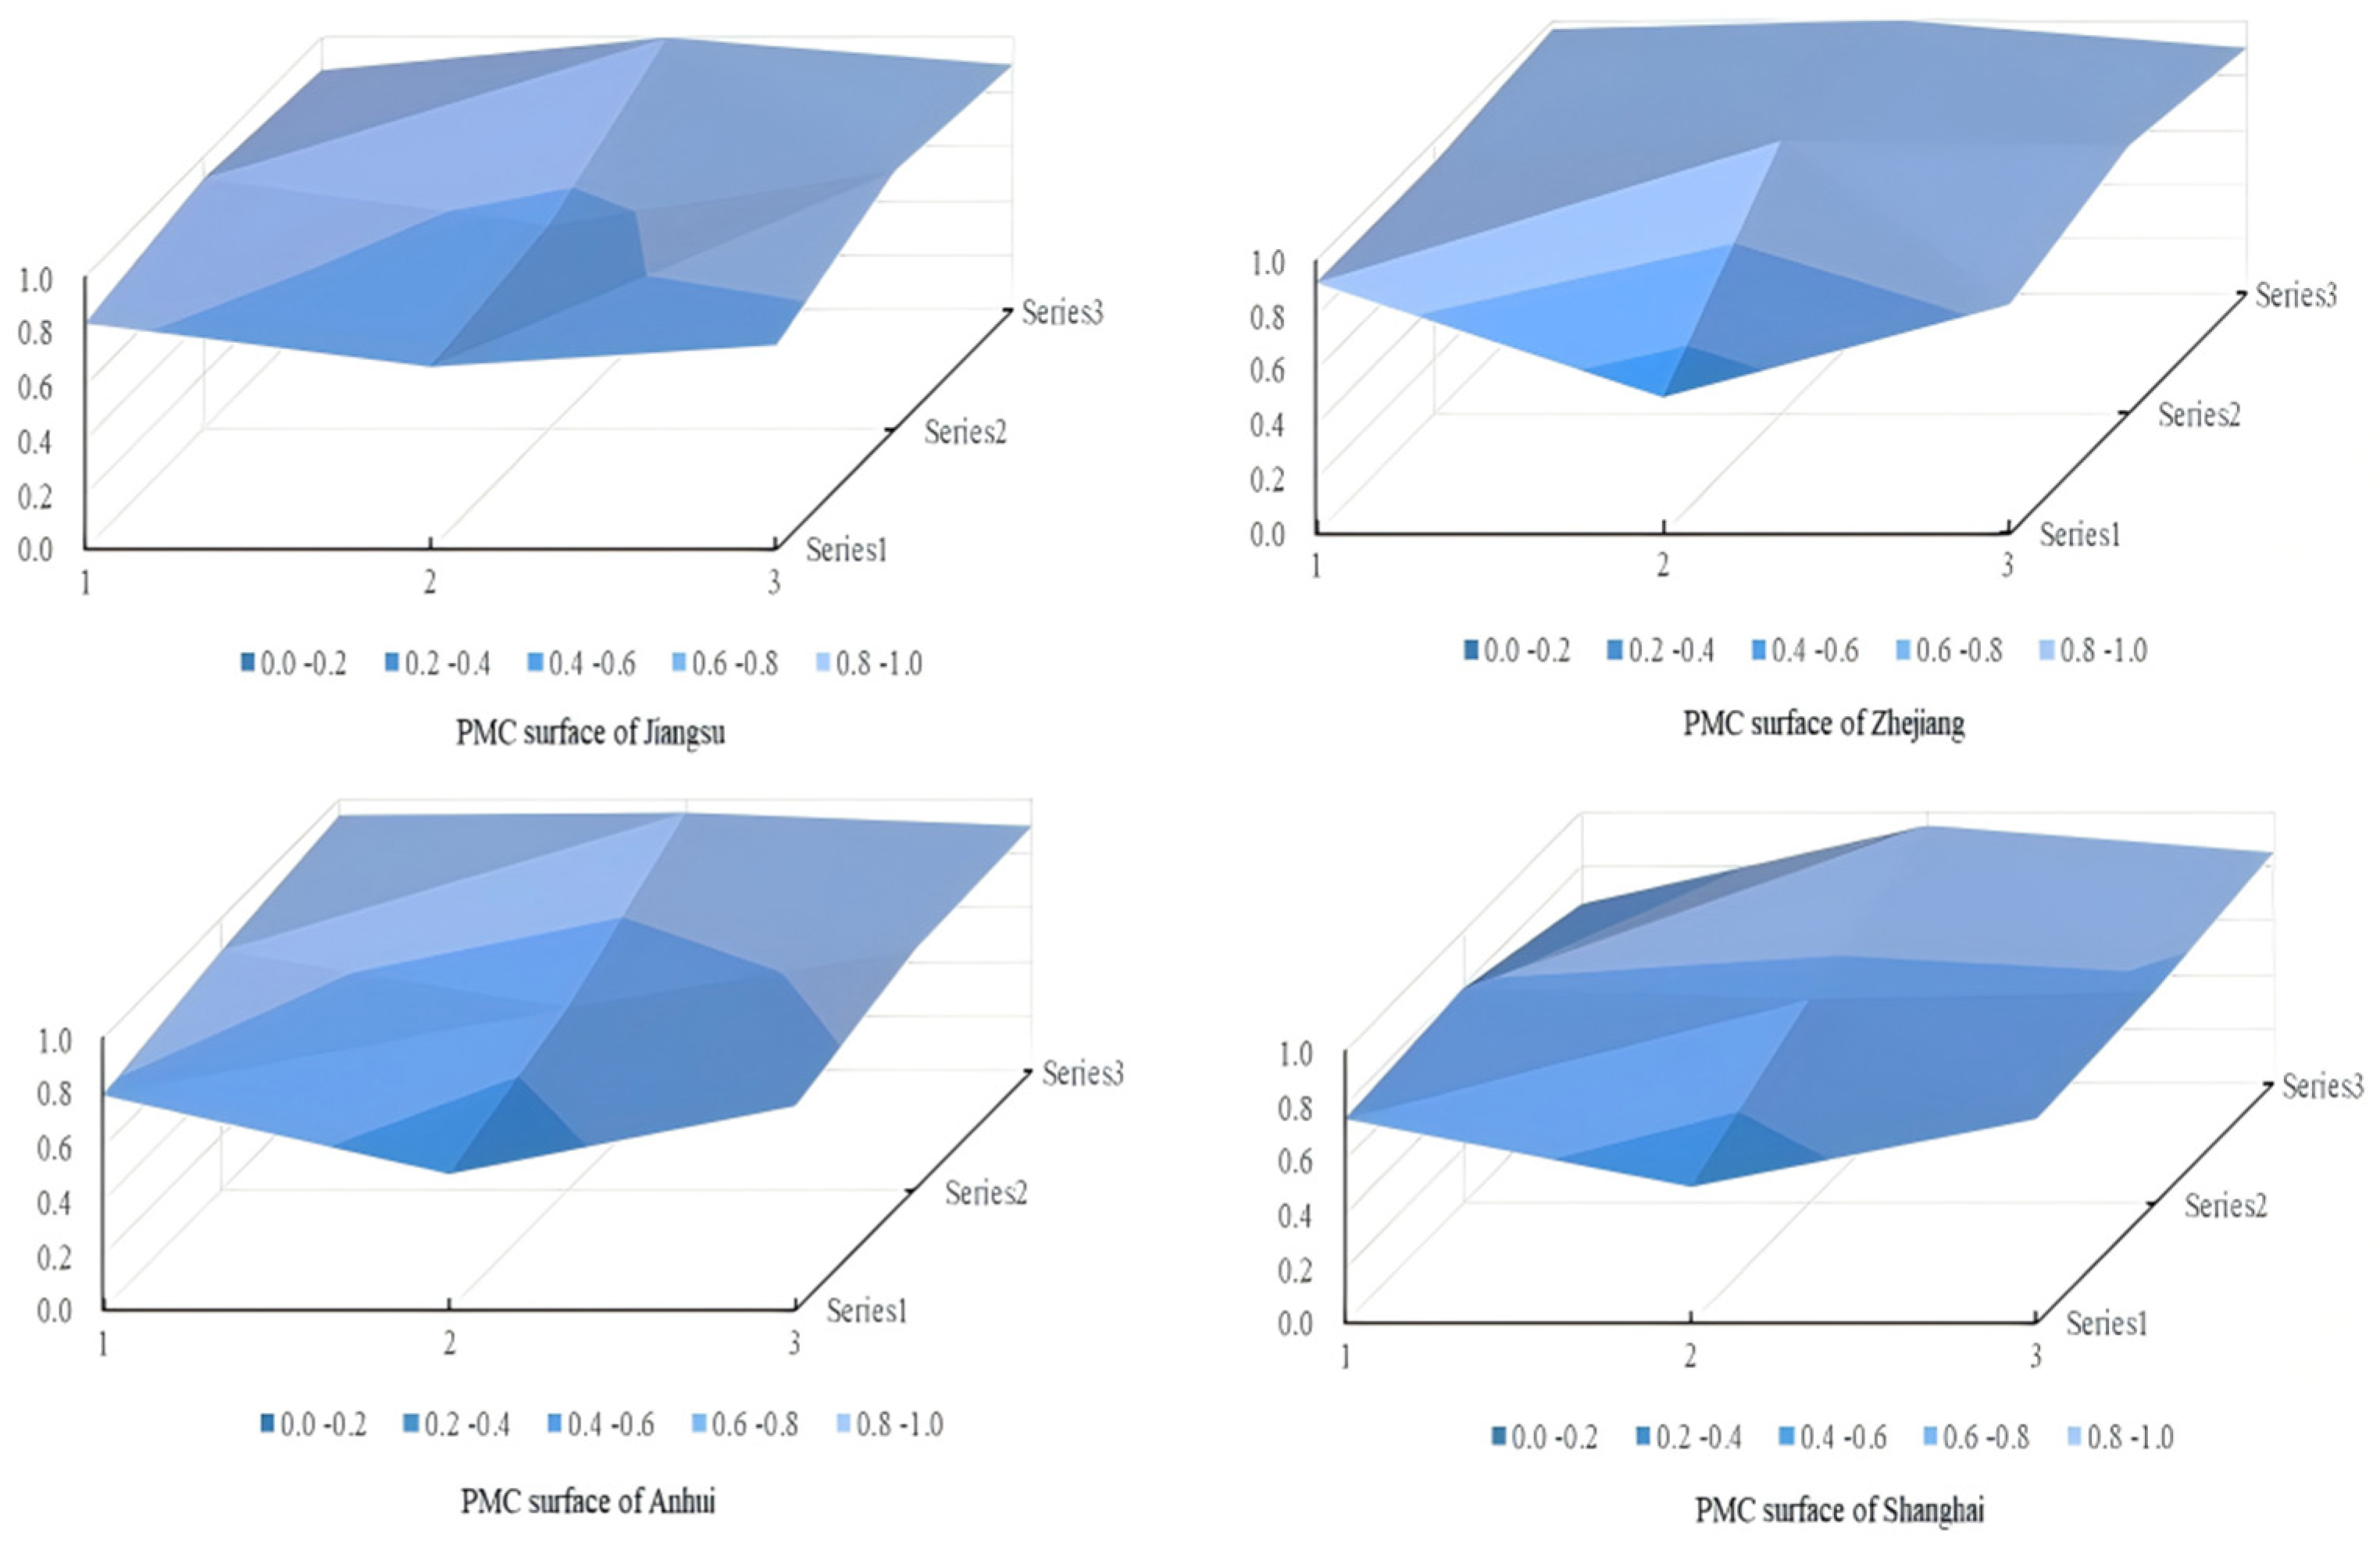
In order to compare and observe policy differences between regions more effectively and intuitively, this study drew PMC surface maps of four provinces and cities based on policy sample data, as shown in Figure 8. According to the chart, the policy performance in Zhejiang Province is the most prominent, with a high degree of smoothness in the PMC surface chart. Only a few policies have slight depressions in the dimensions of policy nature (X1) and policy timeliness (X2), which is reflected in the lack of suggestions for future trends and short-term measures to take immediate action. This achievement is attributed to the leading position of Zhejiang Province’s digital economy and the government’s leading advantage in digital transformation, which makes its digital rural policies more forward-looking and systematic, providing sufficient support and supporting measures in policy design and implementation.
Jiangsu closely follows, with stable policy quality and a relatively smooth surface. Its policies have shown excellent performance in terms of framework integrity and clear objectives. However, the lack of enterprise participation in X3’s policy audience, the lack of a macro perspective in X5’s policy perspective, and the lack of pilot demonstrations and tax incentives in X7’s safeguard measures have resulted in a concave PMC curve in these areas. As a major economic province, Jiangsu Province needs to mobilize more social forces and provide more market-oriented incentives in the construction of digital villages in the future.
Anhui’s policy quality is relatively moderate. As a latecomer region in the Yangtze River Delta, its economic development level is relatively low, and its digital infrastructure and talent reserves may be relatively weak. This, to some extent, affects the formulation and implementation of its digital rural policies. There is still room for improvement in the balance between the micro implementation level of X5 and the policy timeliness of X2.
The policy quality of Shanghai is relatively low, with a large concave area on the curved surface. Its digital rural construction shows typical urban characteristics and has advantages in digital technology application and urban–rural integration. However, the policy timeliness is generally short, and there are deficiencies in the completeness of guarantee measures and policy fields, which is related to the governance needs of its mega city and the urban–rural dual structure.
Overall, from the perspective of regional synergy, there are commonalities in the policy orientation of digital rural construction among the four provinces and cities, but each has its own characteristics in specific measures and implementation paths, which also reflects the differentiated strategies of the Yangtze River Delta region in pursuing integrated development.

5. Conclusions, Recommendations and Limitations

5.1. Conclusions

It investigates the efficacy of digital village policies by performing a detailed quantitative evaluation and empirical analysis on 16 typical policies chosen in the Yangtze River Delta between 2018 and 2024. It then makes the following conclusions:
First, based on previous research, this study establishes the index system for the assessment of the Yangtze River Delta’s digital village policy by combining the policy content with Rost cm6.0 and Gephi software. It sets a total of 10 first-level and 49 second-level indicators, which include policy nature, policy timeliness, policy audience, policy field, policy perspective, policy content and safeguard measure, policy function, policy evaluation and policy disclosure, and on this basis, the calculation and rating standards for PMC indicators have been standardized and established.
Second, the Yangtze River Delta has typically high-quality digital village policies. Out of the 16 digital village policies, the average PMC index is 8.42, which belongs to the good grade, among which 4 policies are rated as “Excellent” and 12 policies are rated as “Good”, and no PMC index score is “Acceptable” or “Bad”, suggesting that the government actively implements the national strategy when formulating digital rural policies. The overall design of the policy has a certain scientific and rational basis and has initially formed a rural construction strategy and policy network in line with the regional reality.
Third, at the administrative level, the overall quality of provincial-level policies is better than that of city-level policies. Provincial-level policies perform better in terms of framework integrity and consistency, while city-level policies need to be improved in terms of overall quality control and standardization. At the level of regional collaboration, Zhejiang has the best policy quality with a highly smooth surface; Jiangsu closely follows, with stable policy quality performance; Anhui’s policy quality ranks in the middle; However, Shanghai’s policy quality is relatively lower, with the largest concave surface area. The above characteristics are in line with the current status of digital rural construction in the region and also reflect the differentiated strategies of the region in pursuing integrated development.
Fourth, on the first level indicator variables, various policies have a certain degree of convergence. Except for “policy disclosure”, most policies only score high in the “policy function” aspect. Although the absolute scores of some indicators (such as policy field and policy content) are not low (0.87–0.89), there is still a certain gap compared to the “policy function” (0.98), and from the perspective of comprehensive and coordinated development of policies, there is room for optimization to varying degrees. These indicators have received relatively insufficient attention in the current policy system, resulting in policies not fully exerting their intended effectiveness, which is also the main reason restricting the overall quality of policies.
Fifth, according to the one-by-one analysis of policy P1–P16, although the policy excellence rate reached 100% and the policy integrity and consistency were excellent, there were still obvious opportunities for improvement in many policy-related variables. The specific performance is: the nature of the policy is not perfect, there is a lack of supervision and suggestions regarding the nature of the policy; the policy of short-term and long-term prescription is insufficient, and the policy continuity is weak; the scope of the policy field is not comprehensive; the policy audience is insufficient; there is a lack of measures for public services and network platforms with insufficient emphasis on urban–rural integration; incentive guarantee means are not in place, tax incentives are not strong, a complete legal system has not yet been formed, and the lack of institutional coherence hinders policy implementation; and there are deficiencies in policy innovation among municipal governments, which lack the ability to effectively translate the spirit of higher-level policies into specific implementation plans.

5.2. Policy Recommendations

Based on the above results and the policy deficiencies revealed in the discussion, combined with the actual needs of digital rural construction in the Yangtze River Delta, the following optimization suggestions are proposed.
First, on the nature of the policy, the role of the current digital village policy is mainly reflected in the planning, guidance, measures and descriptions. However, the role of relevant policies in supervision and suggestions is not prominent enough; that is, the government focuses on the description and guidance of policies when formulating policies, but ignores the supervision of policy implementation and suggestions to direct departments. There is therefore an urgent need for appropriate regulatory and advisory elements. On the one hand, strengthen the functions of the regulatory authorities, so that it is based on appropriate policy supervision, so as to ensure that the implementation of policies is effective; On the other hand, the suggested content can enable the executive department to determine a clearer direction of action and ensure the precision of policy implementation. Finally, the digital rural policy’s diagnosis and prediction mechanism can be configured to monitor the policy’s impact over time, encourage ongoing policy optimization, and help the policy adjust to the demands of a changing era and stage.
Second, enhance the timeliness and operability of policies. Most of the selected policies lack a comprehensive consideration of long-term, medium and short-term goals. Therefore, in future policy adjustments, it is necessary to carefully consider how to formulate long-term and forward-looking policies, adopt a combination of medium- and short-term methods, and develop work for each stage according to the needs of rural construction. In addition, we must consider how long-term objectives are broken down, use long-term overall planning to ensure the continuity of policies [89], use medium and short-term planning to ensure the flexibility of policies, and adjust the timeliness of policies according to the changes in the times, so as to steadily promote the implementation of policies.
Third, expand policy fields and the scope and level of policy audiences. The digital village policy involves a relatively wide range, including system, economy, technology and other fields, but it lacks institutional construction and the rural environment. And these two aspects are also very important. In the future, it is recommended to strengthen the construction of institutional systems, incorporate environmental protection into the framework of digital rural development, improve social governance content, and build a comprehensive policy domain system that integrates politics, economy, society, technology, system, and environment. Simultaneously energizing the rural market and forming the development of agricultural and rural industrialization is of utmost importance. Therefore, the formulation of policies must consider the main body of enterprises, implementation of targeted enterprise incentive rules and regulatory mechanisms: firstly, establish a special reward and subsidy fund for digital rural areas, and implement tiered financial subsidies and tax reductions for enterprises that implement smart farming and e-commerce platforms based on project investment amounts; the second is to standardize the full chain supervision of projects in the digital field, establish a three-level supervision system of project admission review, mid-term performance inspection, and later result acceptance, clarify the boundaries of government and agricultural enterprise rights and responsibilities, dynamically adjust support policies based on the effectiveness of project implementation, reduce cooperation risks through institutionalized supervision, and further leverage social capital and market entities to actively participate in digital rural construction.
Fourth, in terms of policy content, it is necessary to refine the implementation plan to ensure policy implementation. Specifically, in the future, we need to strengthen the development and utilization of digital technology, establish various digital platforms, and enhance the promotion and popularization of platform applications. At the same time, it is suggested to improve the digital content of public services, strengthen the mechanism of urban–rural integration development, accelerate the flow of information and resources between urban and rural areas, improve resource utilization efficiency [90], and ensure the standardized development of rural areas in the Yangtze River Delta.
Fifth, improve safeguard measures, promote policy innovation, and adopt multiple measures to support rural construction. Firstly, improve fiscal and tax policies, increase policy support, and the government can directly invest in eligible rural areas and enterprises through special financial subsidies to support and promote rural construction. Key support should be given to agricultural industry projects, technology, finance, and other policies, with priority given to digital projects. At the same time, tax incentives should be diversified, tax and price policies should be appropriately tilted, and credit support should be increased to reduce business risks and expand rural industrialization. Moreover, financial institutions should take the initiative to assume social responsibility, closely cooperate with government guidance departments, and provide financial products that simplify loan procedures based on local conditions, providing sufficient support for the development of rural industries. Secondly, strengthen legal safeguards, enhance the legislative and enforcement efforts of digital rural construction policies, and enhance the authority and sustainability of policies. To this end, the Yangtze River Delta government can establish laws and regulations for digital rural areas that are in line with regional realities in accordance with the central spirit, clarify the responsibilities and obligations of each subject, and ensure that relevant laws are conducive to guiding and encouraging the orderly promotion of rural digitization. Finally, in response to the lack of innovation in municipal policies, it is necessary to establish a policy transmission mechanism for provincial and municipal linkage in the future and improve the quality of policy formulation by municipal governments through policy interpretation training [91], standardized template provision, technical support, and other methods.
Sixth, at the administrative level, in response to the common shortcomings in municipal policies, the leading role of provincial policies should be further strengthened, and guidance and training at the municipal level should be enhanced. While adhering to a unified direction and basic principles, it is encouraged to innovate policy content and implementation methods based on local characteristics, form replicable and promotable development models and experience practices, and maintain the forward-looking and leading nature of policies. In terms of regional collaboration, we should not only learn from the successful experience of pioneers such as Zhejiang, but also face the special challenges faced by megacities such as Shanghai. At the same time, we should strengthen policy coordination and improvement within provinces such as Jiangsu and Anhui, as well as between provincial and municipal levels. Future policy optimization should strive to enhance the comprehensiveness, refinement, operability, and guarantee of policies in order to achieve coordinated development and an overall leap of digital rural construction in the Yangtze River Delta region.

5.3. Limitations

There are still the following limitations on this study, which can be used for a more comprehensive and in-depth discussion in the follow-up research. Firstly, due to factors such as time and methodology, although the PMC index model is as objective and evidence-based as possible in allocating secondary variables in this article, there is still a certain degree of subjectivity. In the future, expert consultation, field research, and the introduction of big data analysis methods can be used to continuously optimize and validate variables in the obtained data. Secondly, the implementation effect of the policy is related to the quality of the policy at all stages, while the article mainly focuses on the formulation level of the policy for the front-end analysis, which is one-sided, and to fully control the validity and credibility of the evaluation of the digital village policy in the Yangtze River Delta, the follow-up can be systematically analyzed using various research methodologies for the policy’s implementation and feedback stage.

Author Contributions

Conceptualization, Y.X., T.H. and J.N.; methodology, Y.X. and J.N.; software, Y.X. and J.N.; validation, Y.X. and T.H.; formal analysis, T.H.; investigation, Y.X. and J.N.; resources, Y.X. and T.H.; data curation, Y.X. and J.N.; writing—original draft preparation, Y.X.; writing—review and editing, Y.X. and T.H.; visualization, Y.X.; supervision, T.H.; project administration, T.H. All authors have read and agreed to the published version of the manuscript.

Funding

This research received no external funding.

Institutional Review Board Statement

Not applicable.

Informed Consent Statement

Not applicable.

Data Availability Statement

The data shown in this research are available on request from the corresponding author.

Conflicts of Interest

The authors declare no conflicts of interest.

References

  1. Verdouw, C.; Bedir, T.; Adrie, B.; Sjaak, W. Digital twins in smart farming. Agric. Syst. 2021, 189, 103046. [Google Scholar] [CrossRef]
  2. Duan, Y.; Edwards, J.S.; Dwivedi, Y.K. Artificial intelligence for decision making in the era of Big Data-evolution, challenges and research agenda. Int. J. Inf. Manag. 2019, 48, 63–71. [Google Scholar] [CrossRef]
  3. Tian, T.; Li, L.; Wang, J. The Effect and Mechanism of Agricultural Informatization on Economic Development: Based on a Spatial Heterogeneity Perspective. Sustainability 2022, 14, 3165. [Google Scholar] [CrossRef]
  4. Zeng, Y.; Song, Y.; Lin, X.; Fu, C. Some Humble Opinions on China’s Digital Village Construction. China Rural. Econ. 2021, 4, 21–35. (In Chinese) [Google Scholar]
  5. Li, W.; Zhang, P.; Zhao, K.; Chen, H.; Zhao, S. The Evolution Model of and Factors Influencing Digital Villages: Evidence from Guangxi, China. Agriculture 2023, 13, 659. [Google Scholar] [CrossRef]
  6. Cowie, P.; Townsend, L.; Salemink, K. Smart rural futures: Will rural areas be left behind in the 4th industrial revolution? J. Rural Stud. 2020, 79, 169–176. [Google Scholar] [CrossRef] [PubMed]
  7. Sun, J.; Zhang, A. Digital village construction in the Era of Digital Economy: Significance, Challenges and Countermeasures. J. Northwest Norm. Univ. Soc. Sci. 2023, 60, 127–134. (In Chinese) [Google Scholar]
  8. Wang, S.; Yu, N.; Fu, R. Digital village development: Mechanisms, challenges and implementation strategies. Reform 2021, 4, 45–59. (In Chinese) [Google Scholar]
  9. Gerli, P.; Whalley, J. Fibre to the countryside: A comparison of public and community initiatives tackling the rural digital divide in the UK. Telecommun. Policy 2021, 45, 102222. [Google Scholar] [CrossRef]
  10. Rijswijk, K.; Klerkx, L.; Turner, J.A. Digitalisation in the New Zealand agricultural knowledge and innovation system: Initial understandings and emerging organisational responses to digital agriculture. NJAS-Impact Agric. Life Sci. 2019, 90–91, 100313. [Google Scholar] [CrossRef]
  11. Malik, P.K.; Singh, R.; Gehlot, A.; Akram, S.V.; Das, P.K. Village 4.0: Digitalization of Villagewith Smart Internet of Things Technologies. Comput. Ind. Eng. 2022, 165, 107938. [Google Scholar] [CrossRef]
  12. Chenic, A.S.; Cretu, A.I.; Burlacu, A.; Moroianu, N.; Virjan, D.; Huru, D.; Stanef-Puica, M.R.; Enachescu, V. Logical Analysis on the Strategy for a Sustainable Transition of the World to Green Energy-2050. Smart Cities and Villages Coupled to Renewable Energy Sources with Low Carbon Footprint. Sustainability 2022, 14, 8622. [Google Scholar] [CrossRef]
  13. Stojanova, S.; Lentini, G.; Niederer, P.; Egger, T.; Cvar, N.; Kos, A.; Duh, E.S. Smart villages policies: Past, present and future. Sustainability 2021, 13, 1663. [Google Scholar] [CrossRef]
  14. Gill, S.S.; Chana, I.; Buyya, R. IoT based agriculture as a cloud and big data service: The beginning of digital India. J. Organ. End User Comput. 2017, 29, 1–23. [Google Scholar] [CrossRef]
  15. Lee, S.H.; Choi, J.Y.; Yoo, S.H.; Oh, Y.G. Evaluating spatial centrality for integrated tourism management in rural areas using GIS and network analysis. Tour. Manag. 2013, 34, 14–24. [Google Scholar] [CrossRef]
  16. Gao, F.; Wang, J. International experience and enlightenment of digital village construction. Jiangsu Agric. Sci. 2021, 49, 1–8. (In Chinese) [Google Scholar]
  17. Ydersbond, I.M.; Auvinen, H.; Tuominen, A.; Fearnley, N.; Aarhaug, J. Nordic Experiences with Smart Mobility: Emerging Services and Regulatory Frameworks. Transp. Res. Procedia 2020, 49, 130–144. [Google Scholar] [CrossRef]
  18. McGuire, R.; Longo, A.; Sherry, E. Tackling poverty and social isolation using a smart rural development initiative. J. Rural Stud. 2022, 89, 161–170. [Google Scholar] [CrossRef]
  19. Wojcik, M.; Dmochowska-Dudek, K.; Tobiasz-Lis, P. Boosting the Potential for GeoDesign: Digitalisation of the System of Spatial Planning as a Trigger for Smart Rural Development. Energies 2021, 14, 3895. [Google Scholar] [CrossRef]
  20. Komorowski, L.; Stanny, M. Smart Villages: Where Can They Happen? Land 2020, 9, 151. [Google Scholar] [CrossRef]
  21. Faxon, H.O. Welcome to the Digital Village: Networking Geographies of Agrarian Change. Ann. Am. Assoc. Geogr. 2022, 112, 2096–2110. [Google Scholar] [CrossRef]
  22. Wang, Z.; Li, X. Research on the Practice and Innovation of Smart Villages Under the Background of Rural Vitalization Based on Ecological Theory. Fresenius Environ. Bull. 2021, 30, 9084–9090. (In Chinese) [Google Scholar]
  23. Xing, Z. The National Logic of Digital Rural Construction. J. Jishou Univ. (Soc. Sci.) 2021, 42, 58–68. [Google Scholar] [CrossRef]
  24. Fan, H.; Wu, T. New Digital Infrastructure, Digital Capacity and Total Factor Productivity. Res. Econ. Manag. 2022, 43, 3–22. [Google Scholar] [CrossRef]
  25. Huang, Z.; Wang, P. Digital Village Construction Will Be Fully Boost Rural Revitalization of the Realization of Strategic Goals. Gansu Agric. 2023, 5, 1. [Google Scholar] [CrossRef]
  26. Qin, J.; Gao, C. Exploring the synergistic development of digital inclusive finance and digital countryside. China Econ. Trade J. 2019, 951, 120–121. (In Chinese) [Google Scholar]
  27. Zhang, X.; Hu, Y.; Lin, Y. The influence of highway on local economy: Evidence from China’s Yangtze River Delta region. J. Transp. Geogr. 2020, 82, 102600. [Google Scholar] [CrossRef]
  28. Wang, Q.; Luo, S.; Zhang, J.; Furuya, K. Increased Attention to Smart Development in Rural Areas: A Scientometric Analysis of Smart Village Research. Land 2022, 11, 1362. [Google Scholar] [CrossRef]
  29. Ha, B.H.; Kim, Y.S.; Kim, P.W. Image super-resolution for heterogeneous embedded smart devices and displays in smart global village. Sustain. Cities Soc. 2019, 47, 101496. [Google Scholar] [CrossRef]
  30. Cambra-Fierro, J.J.; Perez, L. (Re)thinking smart in rural contexts: A multi-country study. Growth Change 2022, 53, 868–889. [Google Scholar] [CrossRef]
  31. Satola, L.; Milewska, A. The Concept of a Smart Village as an Innovative Way of Implementing Public Tasks in the Era of Instability on the Energy Market-Examples from Poland. Energies 2022, 15, 5175. [Google Scholar] [CrossRef]
  32. Bielska, A.; Malgorzata, S.G.; Katarzyna, S.M.; Mroczkowski, R. Implementation of the smart village concept based on selected spatial patterns-A case study of mazowieckie voivodeship in Poland. Land Use Policy 2021, 104, 105366. [Google Scholar] [CrossRef]
  33. Pylianidis, C.; Osinga, S.; Athanasiadis, I. Introducing digital twins to agriculture. Comput. Electron. Agric. 2021, 184, 105942. [Google Scholar] [CrossRef]
  34. Bailey, D.E.; Faraj, S.; Hinds, P.J.; Leonardi, P.M.; von Krogh, G. We are all theorists of technology now: A relational perspective on emerging technology and organizing. Organ. Sci. 2022, 33, 1–18. [Google Scholar] [CrossRef]
  35. Rokhman, A. Supporting Factors for Digital Village Sustainability in Dermaji Village, Banyumas Regency. Adv. Soc. Sci. Educ. Humanit. Res. 2022, 452, 105–107. [Google Scholar] [CrossRef]
  36. Jiang, Q.; Li, J.; Si, H.; Su, Y. The Impact of the Digital Economy on Agricultural Green Development: Evidence from China. Agirculture 2022, 12, 1107. [Google Scholar] [CrossRef]
  37. Washizu, A.; Nakano, S. Exploring the characteristics of smart agricultural development in Japan: Analysis using a smart agricultural kaizen level technology map. Comput. Electron. Agric. 2022, 198, 107001. [Google Scholar] [CrossRef]
  38. Youssef, A.B.; Boubaker, S.; Dedaj, B.; Carabregu-Vokshi, M. Digitalization of the economy and entrepreneurship intention. Technol. Forecast. Soc. Change 2021, 164, 120043. [Google Scholar] [CrossRef]
  39. Xie, W.; Song, D.; Bi, Y. Construction of digital countryside in China: Internal mechanism, articulation mechanism and practical path. J. Soochow Univ. (Philos. Soc. Sci. Ed.) 2022, 43, 93–103. [Google Scholar] [CrossRef]
  40. Liu, P.; Chuai, X. Research on China’s Digital Village Construction and Development Path under the Big Data Environment. In 2021 2nd International Conference on Big Data Economy and Information Management (BDEIM); IEEE: New York, NY, USA, 2021; pp. 286–289. [Google Scholar] [CrossRef]
  41. Wu, H.; Ba, N.; Ren, S.; Xu, L.; Chai, J.; Irfan, M.; Hao, Y.; Lu, Z.-N. The Impact of Internet Development on the Health of Chinese Residents: Transmission Mechanisms and Empirical Tests. Socio-Econ. Plan. Sci. 2022, 88, 101178. [Google Scholar] [CrossRef]
  42. Kasimov, A.; Provalenova, N.; Parmakli, D.; Zaikin, W. An integrated approach to digitalization of rural areas as a condition for their sustainable development. IOP Conf. Ser. Earth Environ. Sci. 2021, 857, 12004. [Google Scholar] [CrossRef]
  43. Zhang, Y.; Long, H.; Ma, L.; Tu, S.; Li, Y.; Ge, D. Analysis of rural economic restructuring driven by e-commerce based on the space of flows: The case of Xiaying village in central China. J. Rural Stud. 2022, 93, 196–209. [Google Scholar] [CrossRef]
  44. Tim, Y.N.; Cui, L.; Sheng, Z. Digital resilience: How rural communities leapfrogged into sustainable development. Inf. Syst. J. 2021, 31, 323–345. [Google Scholar] [CrossRef]
  45. Hidalgo, F.; Quiñones-Ruiz, X.F.; Birkenberg, A.; Daum, T.; Bosch, C.; Hirsch, P.; Birner, R. Digitalization, sustainability, and coffee. Opportunities and challenges for agricultural development. Agric. Syst. 2023, 208, 103660. [Google Scholar] [CrossRef]
  46. Leng, X. Digital revolution and rural family income: Evidence from China. J. Rural Stud. 2022, 94, 336–343. [Google Scholar] [CrossRef]
  47. Li, G. Study on the impact of rural digital infrastructure construction on rural residents’ consumption: An analysis of the transmission path based on rural industrial structure. Price Theory Pract. 2022, 461, 112–115. [Google Scholar] [CrossRef]
  48. Qazi, S.; Khawaja, B.A.; Farooq, Q.U. IoT-Equipped and AI-Enabled next generation smart agriculture: A critical review, current challenges and future trends. IEEE Access 2022, 10, 21219–21235. [Google Scholar] [CrossRef]
  49. Guo, Z.; Zhang, X. Carbon reduction effect of agricultural green production technology: A new evidence from China. Sci. Total Environ. 2023, 874, 162483. [Google Scholar] [CrossRef] [PubMed]
  50. Xia, X.; Chen, Z.; Zhang, H.; Zhao, M. High-quality development of agriculture: Digital empowerment and path to realization. China Rural. Econ. 2019, 420, 2–15. (In Chinese) [Google Scholar]
  51. Shen, Z.; Wang, S.; Boussemart, J.P.; Hao, Y. Digital transition and green growth in Chinese agriculture. Technol. Forecast. Soc. Change 2022, 181, 121742. [Google Scholar] [CrossRef]
  52. Song, S.; Zhang, L.; Ma, Y. Evaluating the impacts of technological progress on agricultural energy consumption and carbon emissions based on multi-scenario analysis. Environ. Sci. Pollut. Res. 2023, 30, 16673–16686. [Google Scholar] [CrossRef] [PubMed]
  53. Fang, Y. Construction and Analysis of Digital Village Evaluation Index System. Shanxi Agric. Econ. 2020, 275, 21–23. [Google Scholar] [CrossRef]
  54. Huang, X. Construction of an evaluation system for smart rural construction and empirical measurement. Stat. Decis. 2023, 39, 61–66. [Google Scholar] [CrossRef]
  55. Mieczyslaw, A.; Magdalena, Z.L. The “Smart Village” as a Way to Aclrieve Sustainable Development in Rural Are as of Poland. Sustainability 2020, 12, 6503. [Google Scholar] [CrossRef]
  56. Vilma, A.; Gintare, V. Smart Village Developm ent Principles and Driving Forces: The Case of Litimuania. Eur. Countrys. 2019, 11, 497–516. [Google Scholar] [CrossRef]
  57. Zhang, H.; Du, K.; Jin, B. Research on the Readiness Evaluation of Digital Rural Development under the Rural Revitalization Strategy. J. Xi’an Univ. Financ. Econ. 2020, 33, 51–60. [Google Scholar] [CrossRef]
  58. Su, L.; Peng, Y. Research on the Evaluation and Driving Factors of Farmer’s Practical Participation in the Perspective of Digital Rural Construction. J. Huazhong Agric. Univ. (Soc. Sci. Ed.) 2021, 5, 168–179+199–200. [Google Scholar] [CrossRef]
  59. Zhu, H.; Chen, H. Measurement of the level, spatiotemporal evolution, and promotion pathof digital rural development in China. Issues Agric. Econ. 2023, 3, 21–33. [Google Scholar] [CrossRef]
  60. Budziewicz-Guzlecka, A.; Drozdz, W. Development and Implementation of the Smart Village Concept as a Challenge for the Modern Power Industry on the Example of Poland. Energies 2022, 15, 603. [Google Scholar] [CrossRef]
  61. Anastasiou, E.; Manika, S.; Ragazou, K.; Katsios, I. Territorial and Human Geography Challenges: How Can Smart Villages Support Rural Development and Population Inclusion? Soc. Sci. 2021, 10, 193. [Google Scholar] [CrossRef]
  62. Zhao, X.; Wang, G.; Yang, P. Digital Rural Construction under the Background of Rural Revitalization Strategy. J. Northwest Univ. (Soc. Sci. Ed.) 2022, 22, 52–58. [Google Scholar] [CrossRef]
  63. Ramsden, R.; Colbran, R.; Christopher, E.; Edwards, M. The role of digital technology in providing education, training, continuing professional development and support to the rural health workforce. Health Educ. 2021, 122, 126–149. [Google Scholar] [CrossRef]
  64. Stojanova, S.; Cvar, N.; Verhovnik, J.; Božić, N.; Trilar, J.; Kos, A.; Stojmenova Duh, E. Rural Digital Innovation Hubs as a Paradigm for Sustainable Business Models in Europe’s Rural Areas. Sustainability 2022, 14, 14620. [Google Scholar] [CrossRef]
  65. Georgios, C.; Nikolaos, N.; Michalis, P. Neo-Endogenous Rural Development: A Path Toward Reviving Rural Europe. Rural Sociol. 2021, 86, 911–937. [Google Scholar] [CrossRef]
  66. Zhai, Y.; Guo, L.; Zhao, D.; Lu, W. Telemedicine policy evaluation based on PMC index model. J. Inf. Resour. Manag. 2022, 12, 112–122+137. [Google Scholar] [CrossRef]
  67. Zang, W.; Zhang, Y.; Xu, L. Quantitative research on artificial intelligence policy text in China: Policy status and frontier trend. Sci. Technol. Prog. Policy 2021, 38, 125–134. [Google Scholar]
  68. Ruiz Estrada, M.A.; Yap, S.F.; Nagaraj, S. Beyond the Ceteris Paribus Assumption: Modeling Demand and Supply Assuming Omnia Mobilis; Social Science Electronic Publishing: Rochester, NY, USA, 2010. [Google Scholar]
  69. Arriagada, R.; Lagos, F.; Jaime, M.; Salazar, C. Exploring consistency between stated and revealed preferences for the plastic bag ban policy in Chile. Waste Manag. 2022, 139, 381–392. [Google Scholar] [CrossRef] [PubMed]
  70. Kuang, B.; Han, J.; Lu, X.; Zhang, X.; Fan, X. Quantitative evaluation of China’s cultivated land protection policies based on the PMC-Index model. Land Use Policy 2020, 99, 105062. [Google Scholar] [CrossRef]
  71. Cai, D.; Chai, Y.; Tian, Z. Quantitative evaluation of digital economy policy text in Jilin province based on PMC index model. Inf. Sci. 2021, 39, 141–147. (In Chinese) [Google Scholar]
  72. Gao, X.; Sun, Y. Quantitative evaluation of rural revitalization policy text based on PMC index model. Stat. Decis. 2022, 38, 59–62. (In Chinese) [Google Scholar]
  73. Qin, L.; Zhang, H.; Wu, H.; Hu, F. Research on quantitative evaluation of digital rural policies based on PMC index model. Mod. Manag. Sci. 2023, 338, 129–141. (In Chinese) [Google Scholar]
  74. Zou, K.; Li, Y.; Liu, Y.; Wang, S.; Jiang, Z. Quantitative evaluation of digital rural public cultural service policies based on PMC index model. Inf. Sci. 2024, 42, 105–115. (In Chinese) [Google Scholar]
  75. Howlett, M.; Leong, C. The “inherent vices” of policy design: Uncertainty, maliciousness, and noncompliance. Risk Anal. 2022, 42, 920–930. [Google Scholar] [CrossRef] [PubMed]
  76. Zhang, Q.; Liu, H.; Wan, Z. Evaluation on the effectiveness of ship emission control area policy: Heterogeneity detection with the regression discontinuity method. Environ. Impact Assess. Rev. 2022, 94, 106747. [Google Scholar] [CrossRef]
  77. Schoenefeld, J.; Jordan, A. Governing policy evaluation? Toward a new typology. Evaluation 2017, 23, 274–293. [Google Scholar] [CrossRef]
  78. Liu, Q.; Jia, M.; Xia, D. Dynamic evaluation of new energy vehicle policy based on text mining of PMC knowledge framework. J. Clean. Prod. 2023, 392, 136237. [Google Scholar] [CrossRef]
  79. Estrada, M.A.R. Policy modeling: Definition, classification and evaluation. J. Policy Model. 2011, 33, 523–536. [Google Scholar] [CrossRef]
  80. Dai, S.; Zhang, W.; Lan, L. Quantitative evaluation of china’s ecological protection compensation policy based on PMC index model. Int. J. Environ. Res. Public Health 2022, 19, 10227. [Google Scholar] [CrossRef] [PubMed]
  81. Li, Z.; Guo, X. Quantitative evaluation of china’s disaster relief policies: A PMC index model approach. Int. J. Disaster Risk Reduct. 2022, 74, 102911. [Google Scholar] [CrossRef]
  82. Xiong, Y.; Zhang, C.; Qi, H. How effective is the fire safety education policy in China? A quantitative evaluation based on the PMC-index model. Saf. Sci. 2023, 161, 106070. [Google Scholar] [CrossRef]
  83. Xu, J.; Zhang, Z.; Xu, Y.; Liu, L.; Pei, T. Quantitative evaluation of waste sorting management policies in China’s major cities based on the PMC index model. Front. Environ. Sci. 2023, 11, 1065900. [Google Scholar] [CrossRef]
  84. Cvar, N.; Trilar, J.; Kos, A.; Volk, M.; Duh, E.S. The Use of IoT Technology in Smart Cities and Smart Villages: Similarities, Differences, and Future Prospects. Sensors 2020, 20, 3897. [Google Scholar] [CrossRef] [PubMed]
  85. Jiang, S.; Zhou, J.; Qiu, S. Digital Agriculture and Urbanization: Mechanism and Empirical Research. Technol. Forecast. Soc. 2022, 180, 121724. [Google Scholar] [CrossRef]
  86. Liu, S.; Zhu, S.; Hou, Z.; Li, C. Digital village construction, human capital and the development of the rural older adult care service industry. Front. Publ. Health 2023, 11, 1190757. [Google Scholar] [CrossRef] [PubMed]
  87. Ren, Y. Rural China Staggering towards the Digital Era: Evolution and Restructuring. Land 2023, 12, 1416. [Google Scholar] [CrossRef]
  88. Zhang, Y.; Zhou, Y. Policy instrument mining and quantitative evaluation of new energy vehicles subsidies. China Popul. Resour. Environ. 2017, 27, 188–197. (In Chinese) [Google Scholar]
  89. Zhu, C.; Zhu, Y. Consistency between macroeconomic policies and non economic policy orientations: Theoretical logic, practical challenges, and practical approaches. Ningxia Soc. Sci. 2024, 1, 82–90. (In Chinese) [Google Scholar]
  90. Luo, Q.; Wang, J. Cross-regional collaborative innovation in the era of data openness: A factor mobility perspective. Technol. Soc. 2025, 83, 102989. [Google Scholar] [CrossRef]
  91. Frisch-Aviram, N.; Beeri, I.; Cohen, N. How policy entrepreneurship training affects policy entrepreneurship behavior among street-level bureaucrats—A randomized field experiment. J. Eur. Publ. Policy 2021, 28, 698–722. [Google Scholar] [CrossRef]
Figure 1. Map of China and the Yangtze River Delta region.
Sustainability 18 06862 g001
Figure 2. The construction process of PMC index model.
Sustainability 18 06862 g002
Figure 3. Social network map of common high-frequency words in the Yangtze River Delta digital village policy.
Sustainability 18 06862 g003
Figure 4. PMC surface of the “Excellent” group.
Sustainability 18 06862 g004
Figure 5. PMC surface of the “Good” group.
Sustainability 18 06862 g005
Figure 6. Radar chart of 16 digital rural policies.
Sustainability 18 06862 g006
Figure 7. PMC surfaces at different administrative levels.
Sustainability 18 06862 g007
Figure 8. PMC surface of policies in four provinces and cities.
Sustainability 18 06862 g008
Table 1. Statistics of high-frequency words in the digital rural policy of the Yangtze River Delta.
No.KeywordFrequencyNo.KeywordFrequency
1Village860326Wisdom1649
2Digit835927Govern1545
3Construct759528Internet1430
4Government720629System1271
5Service653630Standard1228
6Agriculture576731Peasant1106
7Develop539232Facility1098
8Platform501633Guarantee958
9Manage473534Engineering904
10Apply426835Institution883
11Technology405136Urban and rural areas827
12Production372637Grassroots753
13Structure368038Implement705
14Resource347539Economy667
15Prosper325440Basics641
16Realize306641Cultivate608
17Smart296942Fund591
18Fuse283343Informatization558
19Finance255944Marketplace522
20Innovate211745Share464
21Experiment207746Cropland362
22Optimize195247Project334
23Mechanism191348Modernization330
24Agricultural products183949Opulence228
25Industry170350Talent209
Table 2. Variable setting and evaluation index of digital village policy in the Yangtze River Delta.
First-Level VariablesSecond-Level Variables
CodeVariablesCodeVariablesCodeVariables
X1Policy natureX1:1PlanningX1:2Suggestion
X1:3GuidanceX1:4Measure
X1:5SuperviseX1:6Description
X2Policy timelinessX2:1Long termX2:2Medium term
X2:3Short term
X3Policy audienceX3:1Whole villageX3:2Industrial enterprise
X3:3Government department
X4Policy fieldX4:1PoliticsX4:2Economy
X4:3SocietyX4:4Technology
X4:5InstitutionX4:6Environment
X5Policy perspectiveX5:1Macro-levelX5:2Meso-level
X5:3Micro-level
X6Policy contentX6:1InfrastructureX6:2Technological innovation
X6:3Digital intelligenceX6:4Market economy
X6:5Network informationX6:6Public service
X6:7Urban–rural integrationX6:8Government governance
X6:9Industrial developmentX6:10Platform application
X7Safeguard measureX7:1Talent cultivationX7:2Pilot demonstration
X7:3Mechanism guaranteeX7:4Financial support
X7:5Tax incentivesX7:6Institutional connection
X7:7Laws and regulationsX7:8Policy guidance
X8Policy functionX8:1Increase incomeX8:2Improve governance
X8:3Accelerate constructionX8:4Normative guidance
X8:5Overall guarantee
X9Policy evaluationX9:1Sufficient referenceX9:2Clear objective
X9:3Detailed planX9:4Scientific scheme
X9:5Content innovation
X10Policy disclosure/
Table 3. Multi-input-output table of digital village policy in the Yangtze River Delta.
First-Level VariablesSecond-Level Variables
X1X1:1X1:2X1:3X1:4X1:5X1:6
X2X2:1X2:2X2:3
X3X3:1X3:2X3:3
X4X4:1X4:2X4:3X4:4X4:5X4:6
X5X5:1X5:2X5:3
X6X6:1X6:2X6:3X6:4X6:5X6:6X6:7X6:8X6:9X6:10
X7X7:1X7:2X7:3X7:4X7:5X7:6X7:7X7:8
X8X8:1X8:2X8:3X8:4X8:5
X9X9:1X9:2X9:3X9:4X9:5
X10/
Table 4. Evaluation criteria of the PMC index.
Score9–107–8.995–6.990–4.99
LevelExcellentGoodAcceptableBad
Table 5. Sample of digital village policies.
Policy CodePolicy NameIssuing AgencyIssued Time
P1Jiangsu Province digital village construction guideNetwork Information Office of Jiangsu Provincial Party Committee,
Jiangsu Provincial Department of Agriculture and Rural Affairs
2021
P2Jiangsu Province “14th Five-Year Plan” digital agriculture rural development planJiangsu Provincial Department of Agriculture and Rural Affairs2022
P3Zhejiang Province digital village construction “14th Five-Year Plan”Zhejiang Provincial Department of Agriculture and Rural Affairs2021
P4Implementation Opinions on Promoting Comprehensive Rural Revitalization with High Quality in 2022Zhejiang Provincial Party Committee General Office,
General Office of Zhejiang Provincial People’s Government
2022
P5Action scheme for Promoting High-quality Agricultural Development in Shanghai (2021–2025)General Office of Shanghai Municipal People’s Government2020
P6Opinions on the implementation of the key work of comprehensively promoting rural revitalization in 2023Shanghai Municipal Committee General Office,
General Office of Shanghai Municipal People’s Government
2023
P7Anhui Province’s 14th Five-Year Plan for Agricultural and Rural ModernizationAnhui Provincial Department of Agriculture and Rural Affairs and Anhui Provincial Development and Reform Commission2022
P8Key points of digital rural development in Anhui Province in 2024Anhui Provincial Department of Agriculture,
Development and Reform Commission and Department of Industry and Information Technology
2024
P9Implementation Plan for Deepening Agricultural Digitalization Construction in Lianyungang City during the 14th Five-Year Plan PeriodLianyungang Municipal People’s Government2022
P10Key Points of Digital Rural Construction in Suzhou City in 2024Suzhou Municipal Party Committee Cyberspace Administration and Suzhou Agriculture and Rural Bureau2024
P11Three-Year Action Plan for the Cultivation and Development of Digital Agriculture in Hangzhou City (2022–2024)Hangzhou Rural Revitalization Work Leading Group2022
P12Implementation Plan for Deepening the Construction of Digital Government in Lishui CityLishui Municipal People’s Government2022
P13Pudong New Area Three Year Action Plan for Urban Digital Transformation (2023–2025)Office of the Leading Group for Urban Digital Transformation in Pudong New Area2023
P14Implementation Plan for Creating Livable and Business-Friendly Boutique Villages in Chongming DistrictOffice of the Leading Group for Implementing the Rural Revitalization Strategy in Chongming District2023
P15Digital Hefei Development Plan for the 14th Five-Year Plan of Hefei CityHefei Data Resources Management Bureau2022
P16Key Points of Digital Rural Development in Mount Huangshan City in 2023Mount Huangshan Municipal Committee Cyber Information Office, Municipal Bureau of Agriculture and Rural Affairs, Development and Reform Commission, Economic and Information Bureau, Rural Revitalization Bureau, and Data Resources Bureau2023
Table 6. An overview of the 16 digital village policies’ PMC index.
X1X2X3X4X5X6X7X8X9X10PMC IndexRankingRating
Provincial-level policies
P11.000.670.671.000.671.000.751.001.001.008.766Good
P20.831.001.000.831.001.000.751.001.001.009.412Excellent
P30.830.671.001.001.001.001.001.001.001.009.501Excellent
P41.000.331.001.001.001.000.881.001.001.009.214Excellent
P50.830.331.000.831.000.700.751.001.001.008.449Good
P60.670.330.670.830.670.800.881.001.001.007.8512Good
P71.000.671.001.000.671.001.001.001.001.009.343Excellent
P80.670.670.671.000.670.901.001.001.001.008.587Good
Average0.850.580.880.940.840.930.881.001.001.008.89
Municipal-level policies
P90.670.670.671.000.670.901.001.000.801.008.3810Good
P100.830.330.670.830.670.901.001.000.801.008.0311Good
P110.830.670.670.831.001.001.001.000.801.008.805Good
P121.000.330.670.831.000.901.001.000.801.008.538Good
P130.670.330.670.830.670.800.631.000.801.007.4016Good
P140.831.000.670.670.670.800.380.800.601.007.4215Good
P150.670.330.670.830.670.800.881.000.801.007.6513Good
P160.830.330.670.670.670.800.880.800.801.007.4514Good
Average0.790.500.670.810.750.860.850.950.781.007.96
Overall average0.820.540.770.870.790.890.860.980.891.008.42
Table 7. PMC-matrix of 16 digital village policies.
CodeP1P2P3P4
PMC-matrix 1.00 0.67 0.67 1.00 0.67 1.00 0.75 1.00 1.00 0.83 1.00 1.00 0.83 1.00 1.00 0.75 1.00 1.00 0.83 0.67 1.00 1.00 1.00 1.00 1.00 1.00 1.00 1.00 0.33 1.00 1.00 1.00 1.00 0.88 1.00 1.00
CodeP5P6P7P8
PMC-matrix 0.83 0.33 1.00 0.83 1.00 0.70 0.75 1.00 1.00 0.67 0.33 0.67 0.83 0.67 0.80 0.88 1.00 1.00 1.00 0.67 1.00 1.00 0.67 1.00 1.00 1.00 1.00 0.67 0.67 0.67 1.00 0.67 0.90 1.00 1.00 1.00
CodeP9P10P11P12
PMC-matrix 0.67 0.67 0.67 1.00 0.67 0.90 1.00 1.00 0.80 0.83 0.33 0.67 0.83 0.67 0.90 1.00 1.00 0.80 0.83 0.67 0.67 0.83 1.00 1.00 1.00 1.00 0.80 1.00 0.33 0.67 0.83 1.00 0.90 1.00 1.00 0.80
CodeP13P14P15P16
PMC-matrix 0.67 0.33 0.67 0.83 0.67 0.80 0.63 1.00 0.80 0.83 1.00 0.67 0.67 0.67 0.80 0.38 0.80 0.60 0.67 0.33 0.67 0.83 0.67 0.80 0.88 1.00 0.80 0.83 0.33 0.67 0.67 0.67 0.80 0.88 0.80 0.80
Table 8. Main deficiencies of second-level variables under each first-level variable.
First-Level
Variables
ScoreCore Deficiencies of Second-Level VariablesSpecific Manifestations
X1 Policy nature0.82X1:2 Suggestion
X1:5 Supervise
Lack of constructive content for future directions and supervision clauses for the execution process
X2 Policy timeliness0.54X2:1 Long term
X2:3 Short term
Long-term planning is insufficient, short-term measures are not specific, and there is a focus on the medium term
X3 Policy audience0.77X3:2 Industrial enterpriseEnterprises, as important participants, are generally ignored, and policies are often targeted at the government and farmers
X4 Policy field0.87X4:5 Institution
X4:6 Environment
The content of institutional system construction and ecological environment protection is obviously insufficient
X5 Policy perspective0.79X5:1 Macro-level
X5:3 Micro-level
Both macro-strategic perspective and micro-operational guidance are lacking, with a focus on the meso level
X6 Policy content0.89X6:6 Public service
X6:7 Urban–rural integration
X6:10 Platform application
Insufficient measures for digitalization of public services, interaction of urban and rural resources, and application of online platforms
X7 Safeguard measure0.86X7:5 Tax incentives
X7:6 Institutional connection
X7:7 Laws and regulations
Tax incentives are almost missing, institutional connections are not smooth, and legal protection is incomplete
X8 Policy function0.98No obvious defects/
X9 Policy evaluation0.89X9:5 Content innovationSome policy contents are homogenized and lack innovation
Table 9. Descriptive statistics of policies at different administrative levels.
VariablesProvincial LevelMunicipal Level
AverageMaxMinSDAverageMaxMinSD
X10.851.000.670.130.791.000.670.11
X20.581.000.330.220.501.000.330.24
X30.881.000.670.160.670.670.670.00
X40.941.000.830.080.811.000.670.10
X50.841.000.670.170.751.000.670.14
X60.931.000.700.110.861.000.800.07
X70.881.000.750.110.851.000.380.21
X81.001.001.000.000.951.000.800.09
X91.001.001.000.000.780.800.600.07
X101.001.001.000.001.001.001.000.00
Sum8.8910.007.620.987.969.476.591.03
Table 10. Descriptive statistics of policy samples between regions.
VariablesJiangsuZhejiangShanghaiAnhui
AverageMaxMinSDAverageMaxMinSDAverageMaxMinSDAverageMaxMinSD
X10.831.000.670.120.921.000.830.090.750.830.670.080.791.000.670.14
X20.671.000.330.240.500.670.330.170.501.000.330.290.500.670.330.17
X30.751.000.670.140.841.000.670.170.751.000.670.140.751.000.670.14
X40.921.000.830.090.921.000.830.090.790.830.670.070.881.000.670.14
X50.751.000.670.141.001.001.000.000.751.000.670.140.670.670.670.00
X60.951.000.900.060.981.000.900.040.780.800.700.040.881.000.800.08
X70.881.000.750.130.971.000.880.050.660.880.380.180.941.000.880.06
X81.001.001.000.001.001.001.000.000.951.000.800.090.951.000.800.09
X90.901.000.800.100.901.000.800.100.851.000.600.170.901.000.800.10
X101.001.001.000.001.001.001.000.001.001.001.000.001.001.001.000.00
Sum8.6510.007.621.029.039.678.240.717.789.346.491.208.269.347.290.92
Disclaimer/Publisher’s Note: The statements, opinions and data contained in all publications are solely those of the individual author(s) and contributor(s) and not of MDPI and/or the editor(s). MDPI and/or the editor(s) disclaim responsibility for any injury to people or property resulting from any ideas, methods, instructions or products referred to in the content.