


Abstract
Using panel data from 282 prefecture-level and above cities in China, this study employs a difference-in-differences (DID) model to examine the impact of the National Sustainable Development Plan for Resource-Based Cities on carbon emission efficiency, as well as its underlying mechanisms and heterogeneous effects. The results indicate that the implementation of the Plan significantly improves carbon emission efficiency. This conclusion remains robust after a series of robustness tests, including the propensity score matching difference-in-differences (PSM-DID) approach. Mechanism analysis further reveals that technological innovation, industrial upgrading, and reductions in energy consumption constitute the primary channels through which the Plan enhances carbon emission efficiency. In addition, economic growth pressure and the degree of marketization exert negative and positive moderating effects, respectively, on the relationship between the Plan and carbon emission efficiency. Heterogeneity analysis shows that the positive effect of the Plan is significant only in resource-based cities located in eastern China, southern China, or southeast of the Hu Huanyong Line. In terms of city size, the positive effect is observed only in medium-sized cities and Type II large cities.
1. Introduction
At present, China faces dual pressures: maintaining steady economic growth and achieving carbon reduction targets. Whether the country can simultaneously sustain growth and continue reducing carbon emissions largely depends on improvements in carbon emission efficiency. Enhancing the carbon emission efficiency of resource-based cities is a crucial step for China to fulfill its dual-carbon commitments and pursue high-quality development. Resource-based cities, which account for approximately 40% of all Chinese cities, have long faced challenges such as industrial distortion, resource depletion, and environmental degradation.
In response, the State Council issued the National Sustainable Development Plan for Resource-Based Cities (hereafter referred to as the Plan) in 2013. The Plan aims to guide policy-making and planning in resource-based cities nationwide, exploring a path for sustainable urban development with Chinese characteristics. The policy has been in effect for over eight years and has attracted considerable attention in the academic community. However, despite being a guiding framework for sustainable development across resource-based cities, the Plan’s impact on carbon emission efficiency has not yet been systematically studied.
This raises an urgent question: has the implementation of the Plan improved carbon emission efficiency in resource-based cities? What mechanisms drive this effect, and how do these effects vary across different contexts? Addressing these questions is critical not only for shaping the future policy direction of resource-based cities but also for defining concrete pathways toward China’s dual-carbon goals. To explore these issues, this study uses panel data from 282 prefecture-level and above cities in China and employs a difference-in-differences (DID) model to analyze the impact of the Plan on carbon emission efficiency in depth.
The literature closely related to this study can be grouped into two strands. First, studies on green and low-carbon development in resource-based cities have mainly focused on the transformation of resource-dependent economies, regional industrial upgrading, environmental regulation, and improvements in carbon emission efficiency. Existing studies suggest that resource dependence can easily create path lock-in toward high-carbon development [1]. By contrast, industrial upgrading and green technological innovation provide important pathways for breaking this lock-in and driving the green transformation of resource-based regions [2]. Meanwhile, environmental regulation instruments, such as carbon emissions trading, pollutant discharge fees, and administrative penalties for environmental protection, can effectively improve carbon emission efficiency [3,4]. In addition, just transition theory emphasizes that green transformation should account for economic efficiency, environmental performance, and social equity [5,6,7]. This perspective offers a new theoretical lens for the sustainable development of resource-based regions. Second, regarding the policy effects of the Plan for Resource-Based Cities, existing studies suggest that the Plan has significantly promoted the green transformation of resource-based cities. However, its effect on the sustainable use of resources has not yet fully emerged [8,9]. Further evidence shows that the implementation of the Plan can effectively promote the evolution of industrial structure toward a more advanced form [10]. However, it may also exert a certain inhibitory effect on GDP growth [11]. At the same time, the Plan can significantly reduce carbon emissions [12,13,14] and pollutant emissions [15,16,17], thereby achieving coordinated governance of pollution reduction and carbon mitigation.
Overall, the existing literature provides an important foundation for understanding how the Plan affects carbon emission efficiency. However, several areas remain open for further investigation. First, existing studies on the environmental effects of the Plan have mainly focused on total emissions. Insufficient attention has been paid to carbon emission efficiency, which accounts for both economic output and environmental performance. It should be noted that total carbon emissions reflect the absolute scale of emissions. Carbon emission intensity measures the level of emissions per unit of output. Carbon emission efficiency, by contrast, comprehensively captures the relationship among inputs, outputs, and carbon emissions. Therefore, it better reflects the synergy between economic growth and carbon reduction. Second, existing research on green and low-carbon transformation has mostly focused on identifying policy outcomes. The pathway through which the Plan produces its effects remains insufficiently examined. Third, previous studies on industrial structure adjustment have mainly examined how the Plan affects changes in the shares of secondary and tertiary industries. Few studies have further explored whether industrial upgrading can be translated into improvements in carbon emission efficiency. It also remains unclear whether this policy effect differs across institutional environments and city types.
Based on these gaps, this study makes the following marginal contributions. First, in terms of research perspective, this study differs from prior literature that mainly examines the impact of the Plan on total emissions. It takes carbon emission efficiency as the core object of analysis and emphasizes the synergy between economic growth and carbon reduction. In doing so, it expands the research scope of environmental effect assessments of sustainable development policies for resource-based cities. Second, in terms of mechanism identification, this study differs from existing research that focuses on industrial structure adjustment or carbon reduction outcomes. It reveals the internal mechanisms through which the Plan improves carbon emission efficiency from three dimensions: technological innovation, industrial upgrading, and energy reduction. This further deepens the understanding of the green and low-carbon transformation process in resource-based cities. Third, in terms of boundary conditions, this study incorporates economic growth pressure and the degree of marketization into the analytical framework. It examines the moderating roles of government target constraints and market mechanisms in shaping policy effects. It also identifies differences in policy effects across city locations and city sizes. These analyses provide empirical evidence for resource-based cities to improve carbon emission efficiency and promote sustainable development.
2. Theoretical Analysis and Research Hypotheses
2.1. Direct Impact of the Plan on Carbon Emission Efficiency
Based on the Plan’s fundamental principles, implementation goals, and development mechanisms, this study posits that its implementation can effectively mitigate the tension between economic growth and carbon reduction, thereby positively affecting carbon emission efficiency. This effect mainly arises from two channels: policy constraints and policy guidance.
First, regarding policy constraints, the Plan emphasizes environmental governance and ecological protection and sets quantitative targets for energy consumption reduction and major pollutant abatement, thereby strengthening regional environmental regulations. Existing studies provide two contrasting views on the impact of environmental regulation on carbon emission efficiency, based on the “innovation compensation” and “compliance cost” theories. The former suggests that environmental regulations stimulate corporate innovation, promoting clean energy and environmental technologies, which improves resource utilization and economic performance, thereby enhancing carbon emission efficiency. The latter argues that increased compliance costs may offset these benefits, inhibiting efficiency [4]. In practice, firms under strict environmental regulation often respond to the dual pressure of emission reduction and cost control by pursuing technological innovation to enhance competitiveness. This process can improve industry-wide productivity and carbon emission efficiency [18]. Moreover, as the conflict between economic development and environmental protection intensifies and environmental performance gains prominence in officials’ performance evaluations, the dominant effect of environmental regulation in China has been the “innovation compensation” effect [12].
Second, regarding policy guidance, the Plan calls for major industrial projects to favor resource-based cities, establishes mechanisms for stable fiscal growth, and directs production factors toward alternative industries. These measures provide effective policy guidance for improving carbon emission efficiency. Under the Plan, existing resource endowments and infrastructure support the development of high-tech and alternative industries. The emergence and growth of these industries enhance knowledge spillovers and scale economies, accelerate the decoupling of carbon emissions from economic growth, and reduce dependence on natural resources, mitigating their negative impact on carbon emission efficiency [19]. In addition, active government support reduces the risks of corporate innovation and investment, encouraging environmentally friendly practices that improve economic performance, further promoting carbon emission efficiency. Overall, the Plan achieves a dual win for economic growth and carbon reduction through effective policy constraints and guidance.
H1.
The implementation of the Plan improves carbon emission efficiency in resource-based cities.
2.2. Mechanisms Through Which the Plan Influences Carbon Emission Efficiency
The Plan may affect carbon emission efficiency through three intrinsic mechanisms: technological innovation, industrial upgrading, and reductions in energy consumption.
First, the technological innovation effect. The Plan seeks to drive sustainable development through technological progress and management innovation. By enhancing talent development, innovation platforms, and fiscal support, it creates a favorable environment for innovation. Under the Plan, both traditional resource extraction and clean technologies benefit from high-quality incubation, which supports the transformation of production processes and energy-saving, low-carbon practices. Advances in these technologies not only reduce carbon emissions by replacing outdated methods but also increase productivity and economic gains, thereby enhancing carbon emission efficiency [20,21].
Second, the industrial upgrading effect. Economic restructuring focuses on optimizing industrial composition. Accordingly, the Plan promotes deep processing of resource-based industries, cultivates alternative industries, and develops specialized services. These strategies guide the upgrading of traditional industries and stimulate the growth of clean industrial and service sectors, leading to a more diversified economic structure. Industrial upgrading facilitates a win-win between carbon reduction and economic growth, providing a fundamental basis for improving carbon emission efficiency [21].
Third, the energy reduction effect. The Plan prioritizes energy conservation and emission reduction. Measures such as restraining high-energy-consumption industries, scaling up energy-efficient products, and promoting low-carbon technologies enhance the efficient use of materials and energy. Reducing energy intensity is a primary driver of emission mitigation and an important pathway to improving carbon emission efficiency while promoting sustainable economic and social development [22].
H2.
The Plan improves carbon emission efficiency through technological innovation, industrial upgrading, and energy reduction effects.
2.3. Moderating Effects of Economic Growth Pressure and Marketization
Sustainable development in resource-based cities requires coordinated roles of government and market mechanisms. On the government side, setting economic growth targets serves as a leading tool but also introduces growth pressures.
First, when market conditions cannot meet expected goals, governments may increase resource extraction, the share of secondary industries, and fixed asset investment to boost short-term output [23,24]. Second, such interventions can distort fiscal allocations and crowd out investments in innovation and environmental governance [25]. Third, higher growth targets may weaken environmental regulations to attract high-pollution industries [26]. In resource-based cities with weak economic bases and single-industry structures, these actions may achieve limited growth but substantially increase carbon emissions. Thus, economic growth pressure can reduce the effectiveness of government guidance, weaken the Plan’s impact on technological innovation and industrial upgrading, and diminish its positive effect on carbon emission efficiency.
On the market side, higher marketization can enhance the Plan’s effect on carbon emission efficiency. Many resource-based cities in China face state-owned enterprises crowding out private and individual economic activity, limiting non-state sector growth. Marketization helps break this rigidity, increasing private sector participation, promoting competitive production services, and overcoming low-end industrial lock-in [26]. Additionally, it strengthens the survival-of-the-fittest mechanism, accelerates the exit of unproductive firms, and promotes industrial upgrading. Under competitive market conditions and the Plan’s low-carbon orientation, firms are motivated to innovate, optimize resource allocation, and reduce costs, leading to more energy-saving technologies [27]. A robust market system also encourages investment from domestic and foreign actors, creating jobs, improving living standards, and preventing polluting firms from entering [12]. Thus, higher marketization aligns with sustainability goals and reinforces the Plan’s effects on industrial upgrading and energy reduction, further enhancing carbon emission efficiency.
H3a.
Economic growth pressure negatively moderates the effect of the Plan on carbon emission efficiency.
H3b.
Marketization positively moderates the effect of the Plan on carbon emission efficiency.
3. Empirical Strategy
3.1. Model Specification
This study treats the issuance of the Plan for Resource-Based Cities in November 2013 as a quasi-natural experiment and employs a DID model to evaluate its impact on carbon emission efficiency. The baseline regression model is specified as follows:
In Equation (1), i denotes the city and t denotes the year, while α0 represents the constant term. Carbon emission efficiency (lnCeeit) is the dependent variable. The interaction term between the implementation period of the Plan and the designation of resource-based cities (didit) serves as the core explanatory variable. controlit represents a series of control variables. μi and λt denote city-fixed effects and time-fixed effects, respectively, and ɛit is the random error term.
In addition, the DID method requires the parallel trends assumption to hold. That is, before policy implementation, the treatment and control groups should exhibit similar trends in carbon emission efficiency. To test this assumption, this study follows the event-study approach and constructs the following model:
In Equation (2), In the equation, denotes a set of dummy variables. These variables cover observations from eight years before a city was designated as a pilot city, the year of designation, and six years after designation. For non-pilot cities, all dummy variables are set to 0. The value of is assigned as follows. Let n denote the implementation year of the Plan, where (n = 2014). The study period covers 2006 to 2020. If , is assigned a value of 1 for pilot cities and 0 otherwise. In addition, this study excludes the year immediately before policy implementation as the benchmark year to avoid multicollinearity. The parameter is the key parameter of interest in this section. It represents the difference in carbon emission efficiency between the treatment and control groups in the kth year of the Plan’s implementation.
3.2. Variable Description
3.2.1. Dependent Variable
Carbon emission efficiency (lnCee). From the perspective of inputs and outputs, this study measures carbon emission efficiency using the super-efficiency SBM model in MATLAB (R2021a (MathWorks, Natick, MA, USA) under the assumption of constant returns to scale. This model not only incorporates undesirable outputs and adjusts slack variables, but also overcomes a limitation of the conventional SBM model. Specifically, the conventional SBM model often produces many efficiency scores equal to 1. As a result, the super-efficiency SBM model substantially improves both accuracy and practical applicability [28]. The model is expressed as follows:
In Equation (3), ρ denotes the target efficiency score. A larger value indicates higher efficiency for the decision-making unit. θ denotes the weight vector. , , and represent the input indicators, desirable output, and undesirable output, respectively. , , and represent their corresponding slack variables. m, S1, S2, and n denote the number of input indicators, desirable outputs, undesirable outputs, and decision-making units, respectively. In this study, the input indicators used to measure carbon emission efficiency include capital, labor, and energy. These are represented by fixed capital stock, the number of employed persons, and energy consumption, respectively. The output indicators include both desirable and undesirable outputs. Real regional GDP is used to measure desirable output, while carbon emissions are used to measure undesirable output. The specific indicators are reported in Table 1.
In addition, following previous research [29], carbon emissions are calculated comprehensively based on natural gas, liquefied petroleum gas, total electricity consumption, and total heat supply, including steam and hot water. The formula is as follows:
In Equation (4), CO2it denotes the total carbon emissions of city i in period t. GCit denotes natural gas consumption, and τ is the carbon emission conversion coefficient for natural gas, with a value of 2.1622 kg/m3. LCit denotes liquefied petroleum gas consumption, and υ is the carbon emission conversion coefficient for liquefied petroleum gas, with a value of 3.1013 kg/kg. PCit denotes total electricity consumption, and ψ is the carbon emission conversion coefficient for electricity, with a value of 0.7119 t/MWh. HCit denotes total heat supply. Since raw coal is the main fuel used for heat supply, the amount of raw coal consumed for thermal energy can be used to indirectly calculate the carbon emissions generated by heat supply. ω denotes the thermal efficiency value, which is set at 70%. χ denotes the average low calorific value coefficient of raw coal, with a value of 20,908 kJ/kg. κ denotes the carbon emission conversion coefficient for raw coal, with a value of 1.9003 kg/kJ.
Table 1.
Input–Output Indicators and Definitions of Carbon Emission Efficiency.
3.2.2. Core Explanatory Variable
By treating the Plan as a quasi-natural experiment, this study uses the interaction term between the implementation period and the designation of resource-based cities (did) as the core explanatory variable. Since the Plan was issued in November 2013 and policy implementation may exhibit lagged effects, the starting year is set as 2014. Specifically, from 2014 onward, the policy variable (did) is assigned a value of 1 for all resource-based cities and 0 otherwise.
3.2.3. Control Variables
To more accurately identify the impact of the Plan on carbon emission efficiency, this study incorporates the following control variables based on prior literature [21,28]: ① Economic development level (Pgdp): measured by real GDP per capita, using 2006 as the base year. ② Environmental regulation (Er): measured using a composite index of urban pollutant emissions [31]. ③ Urbanization level (Ur): measured by the ratio of urban population to total population. ④ Industrial structure (Ind): measured by the proportion of secondary industry output in GDP. ⑤ Foreign direct investment dependence (FDI): measured by the ratio of actual utilized foreign direct investment to GDP. ⑥ Population density (Pop): measured by the ratio of resident population to administrative land area. ⑦ Human capital (Hum): measured by the number of university students per 10,000 people. ⑧ Infrastructure (Inf): measured by per capita paved road area.
3.3. Data Description
This study uses panel data from 282 prefecture-level and above cities in China from 2006 to 2020 to examine the impact of the Plan on carbon emission efficiency. Based on the 126 prefecture-level resource-based administrative regions identified in the Plan, this study excludes two autonomous prefectures, eight prefectures, Bijie City, and Laiwu City, which was abolished in 2019, due to severe data deficiencies. The remaining 114 resource-based cities constitute the treatment group, while the other 168 cities form the control group.
It should be noted that using non-resource-based cities as the control group is fully reasonable in this study. First, both types of cities operate within the same national macroeconomic and environmental governance context. They face similar economic development trends, climatic conditions, and industry-level emission reduction regulations. Therefore, external policy shocks are highly comparable, which helps satisfy the parallel trends assumption required by the DID model. Second, resource-based cities have formed distinctive industrial structures, energy consumption patterns, and carbon emission characteristics based on their resource endowments. Their policy implementation needs and emission reduction potential differ substantially from those of non-resource-based cities. Therefore, the group classification is clear and objective, and the differences between the two groups are relatively distinct. Third, non-resource-based cities were not subject to the policy intervention of the Plan. This satisfies the sample grouping principle that the treatment group is exposed to the policy shock, whereas the control group is not. This design helps effectively remove interference from confounding factors beyond the policy itself. It also enables a more accurate identification of the net policy effect and ensures that the model identification logic is rigorous and reliable.
The original data are obtained from official sources, including the China City Statistical Yearbook, government work reports, statistical bulletins on national economic and social development, and the EPS database. Missing values in the original dataset are supplemented using the average growth rate method. In addition, to mitigate potential heteroskedasticity, all continuous variables are logarithmically transformed in the empirical analysis. Descriptive statistics of the main variables are reported in Table 2.
Table 2.
Descriptive Statistics of Main Variables.
4. Baseline Regression and Robustness Checks
4.1. Parallel Trend Test
A key assumption for the validity of the DID model is the parallel trend assumption. This requires that, prior to the implementation of the Plan, carbon emission efficiency in resource-based cities and non-resource-based cities followed similar trends. To this end, following existing research [12], this study uses the year immediately before policy implementation as the base period for the test.
The results in Table 3 show that, before policy implementation, the estimated coefficients of the relative-time dummy variables are all statistically insignificant. This indicates that, prior to 2014, there were no systematic differences in carbon emission efficiency between the treatment and control groups, satisfying the parallel trend assumption. Two years after the Plan’s implementation, the estimated coefficients turn positive and remain significant, suggesting that the Plan substantially improves carbon emission efficiency in resource-based cities. However, the effect exhibits a certain time lag.
Table 3.
Results of the Parallel Trends Test.
4.2. Baseline Regression
Table 4 presents the estimation results of the baseline regression models. Columns (1), (2), and (3) report models with year-fixed effects, city-fixed effects, and two-way fixed effects, respectively. The estimated coefficient of the core explanatory variable (did) is consistently positive and statistically significant at the 1% level across all specifications. This provides initial empirical support for Hypothesis H1, indicating that the Plan effectively improves carbon emission efficiency. Using the results in Column (3) as the baseline, the implementation of the Plan increases carbon emission efficiency in resource-based cities by an average of 5.34% (=[exp(0.052) − 1)] × 100%) compared with non-resource-based cities.
Table 4.
Baseline Regression Results.
4.3. Robustness Checks
4.3.1. PSM-DID Estimation
To mitigate the potential influence of sample selection bias on the baseline regression results, this study conducts a robustness check using the PSM-DID method. Specifically, the control variables in the baseline regression are selected as covariates. A Logit model is then constructed to estimate propensity scores. Based on these scores, kernel matching with a bandwidth of 0.05 is applied under the common support restriction. This procedure matches each treated observation with control observations that have the most similar characteristics. Before matching, the full sample contains 4230 observations. After matching, 228 observations that fail to satisfy the common support condition are excluded. The final matched sample contains 4002 valid observations. The sample loss rate is only 5.39%, which falls within a reasonable range.
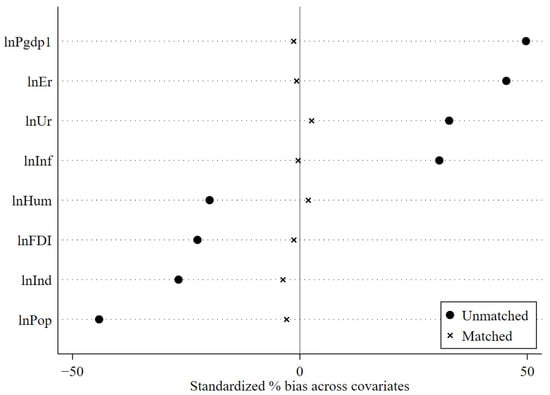
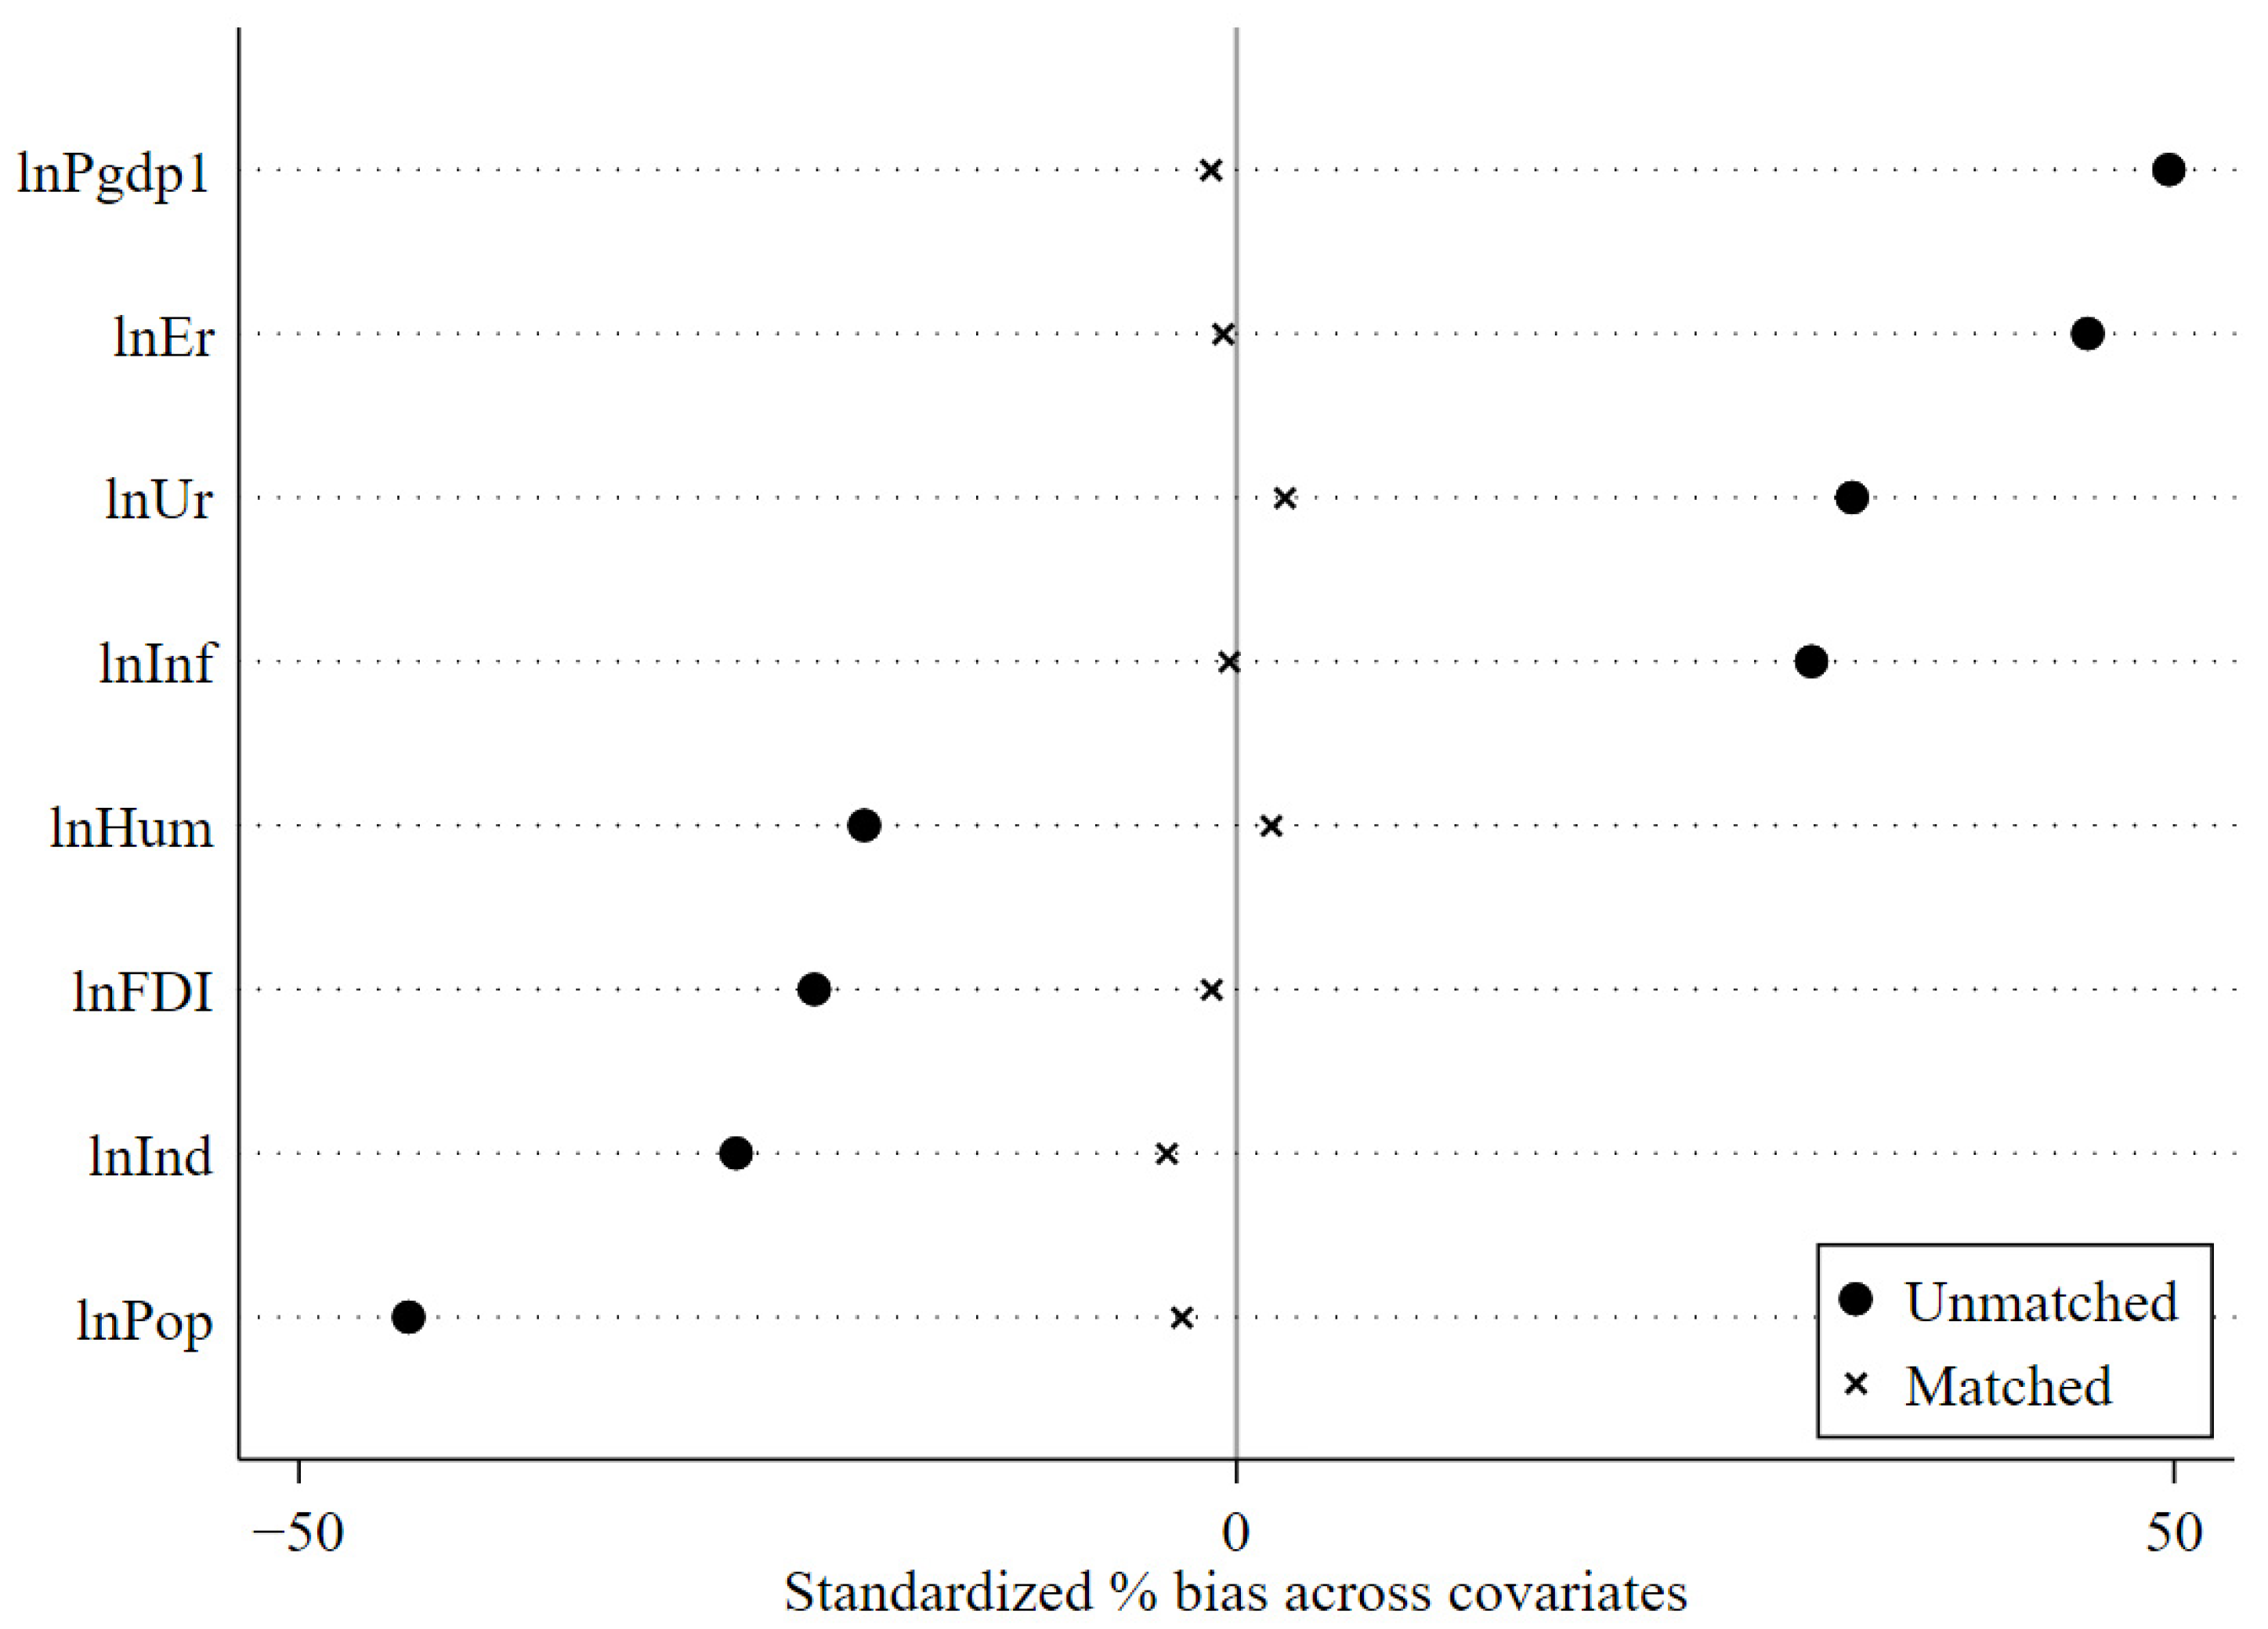
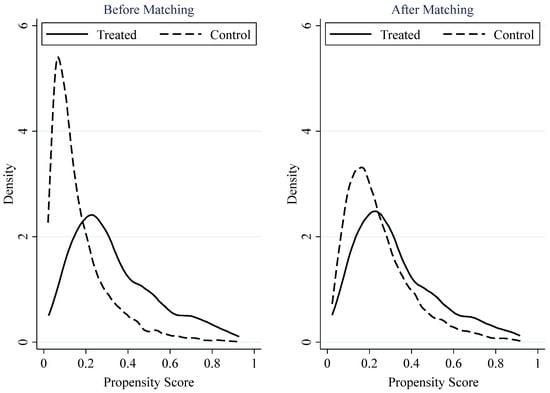
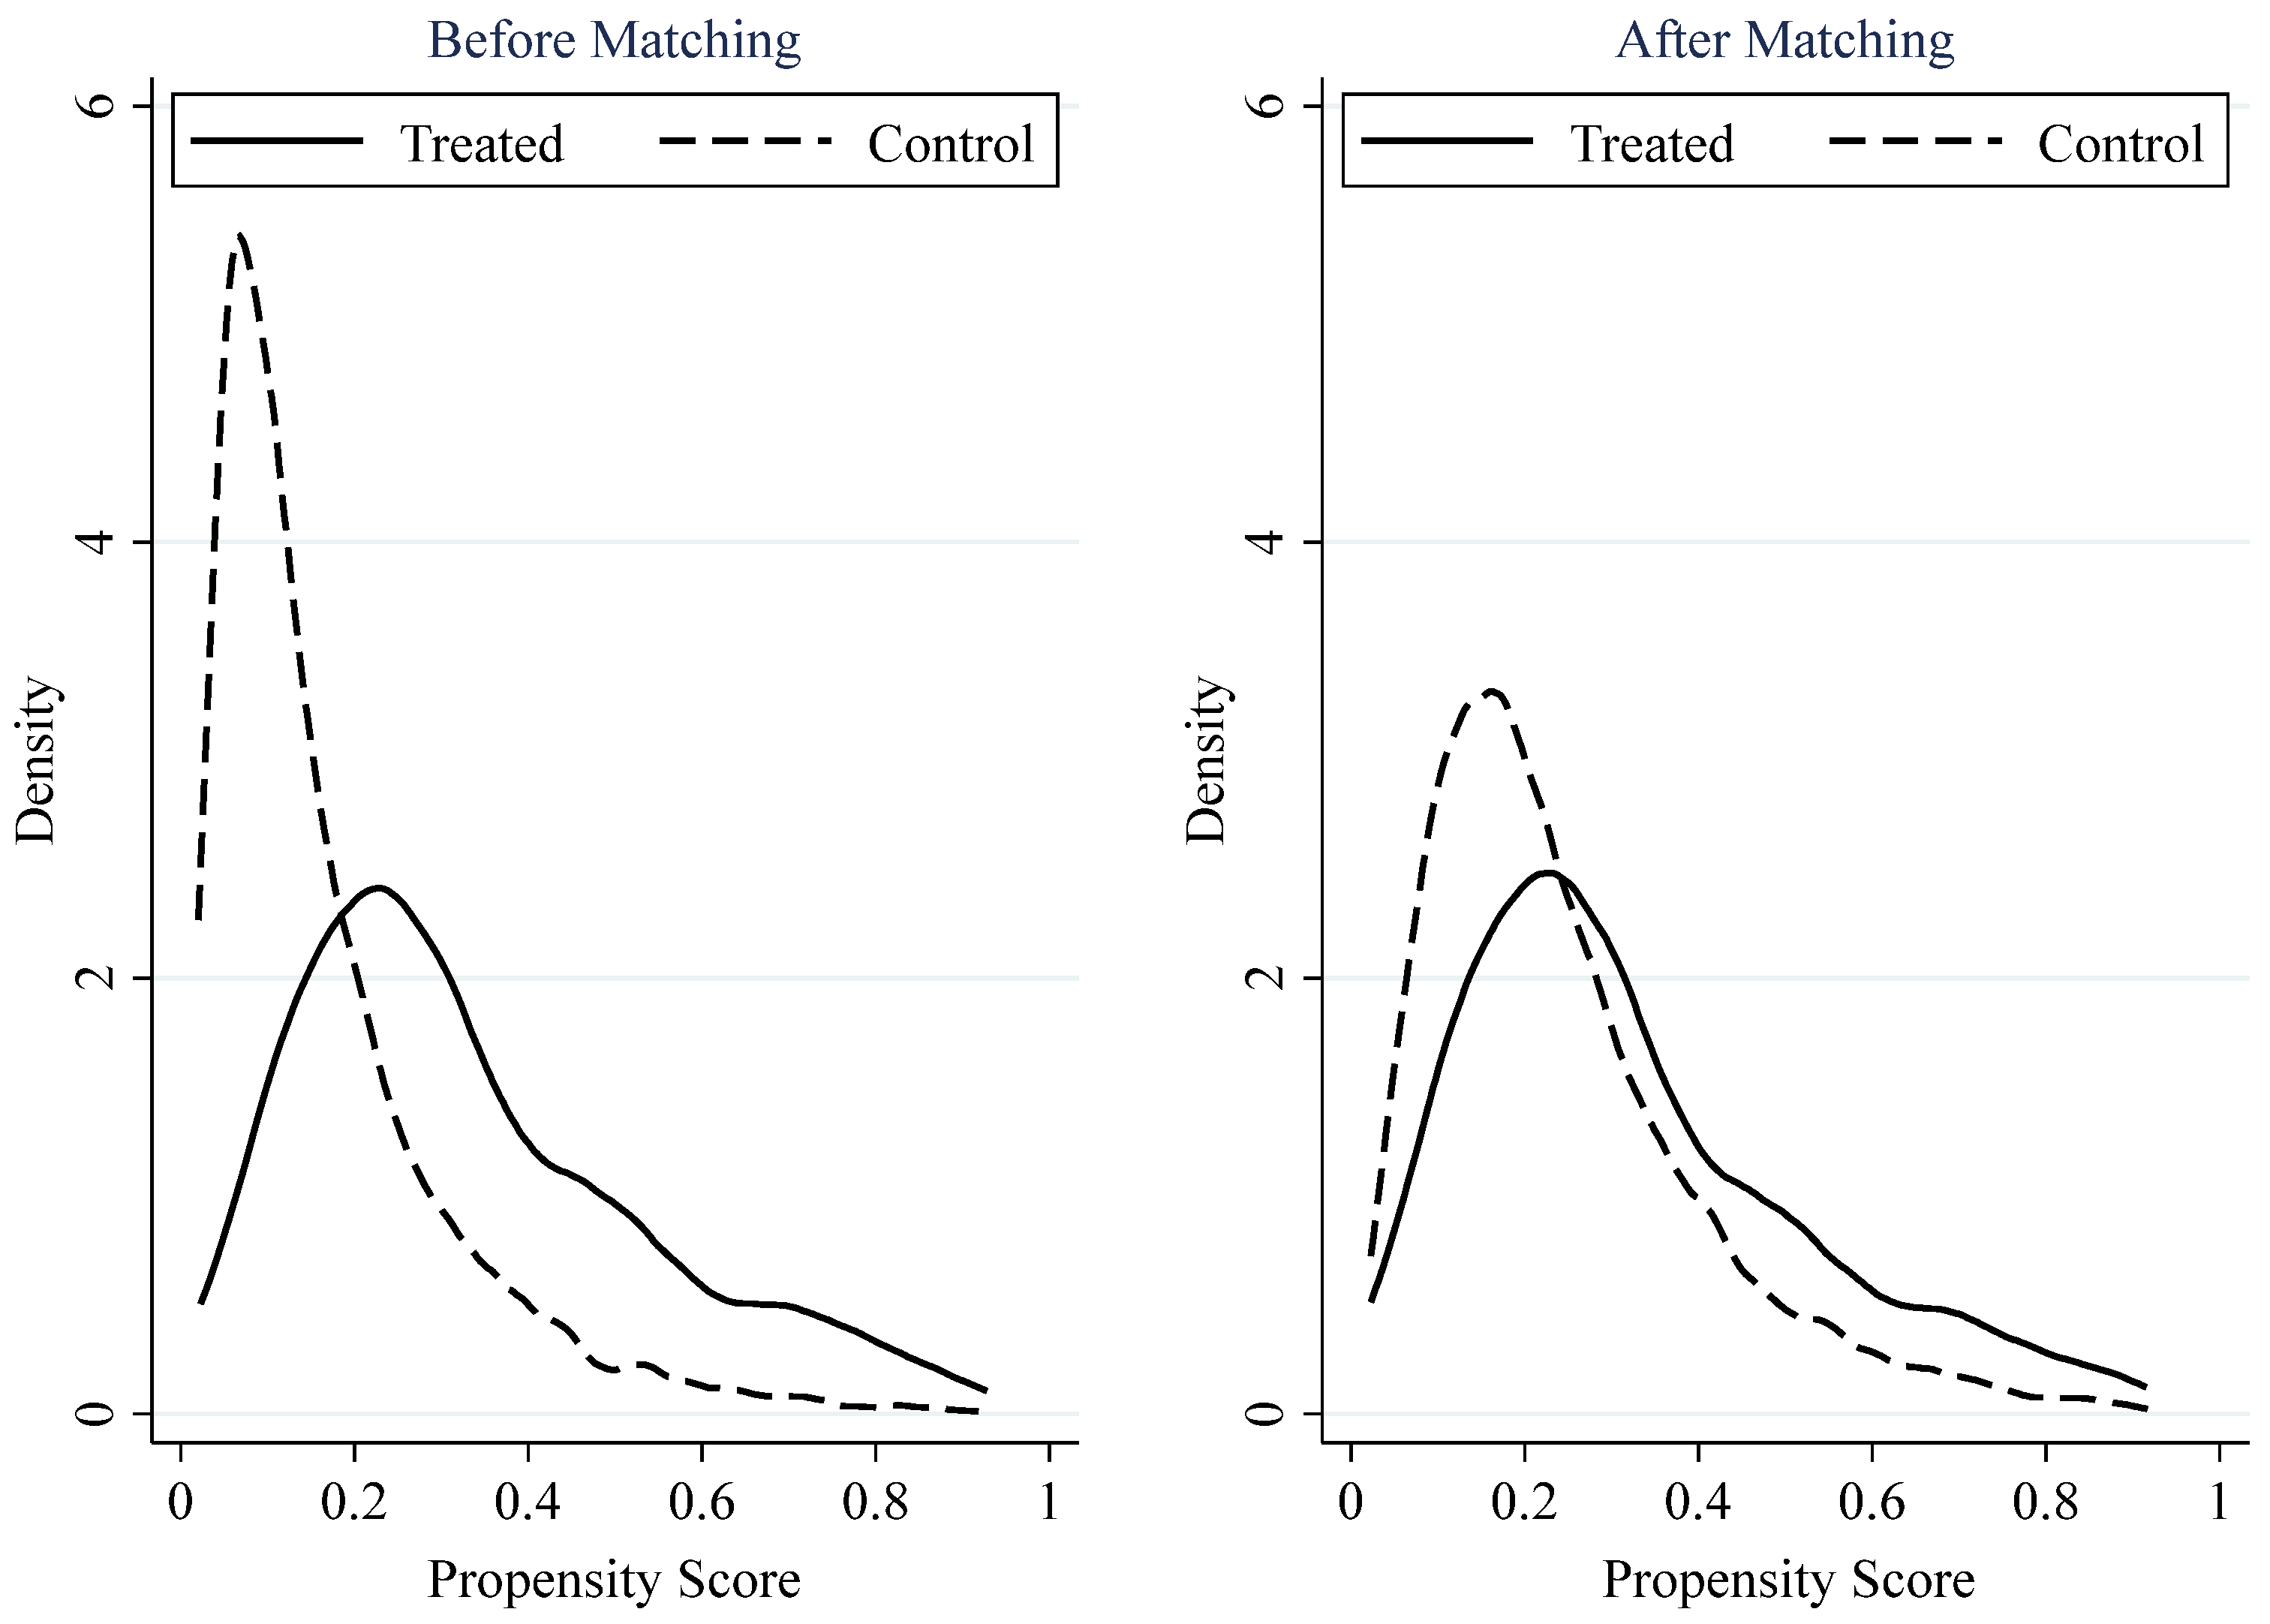
The balance test results in Table 5 show that, after matching, the absolute values of the standardized bias for all covariates decrease to below 10%. In addition, the t-test results are statistically insignificant for all covariates. Figure 1, which presents the standardized bias plot, visually shows the changes in covariate bias before and after matching. The standardized bias of all variables clearly converges toward zero after matching. Figure 2, which compares the kernel density distributions of propensity scores, further confirms the matching quality. Before matching, the propensity score distributions of the treatment and control groups already show some overlap. After matching, the degree of overlap between the two groups increases markedly, indicating good matching quality. The model is then re-estimated using the matched sample. As shown in Column (1) of Table 6, the coefficient of the Plan remains highly significant at the 1% level after applying the PSM-DID method. This result confirms that the baseline regression findings are robust.
Table 5.
Balance Test for Propensity Score Matching.
Figure 1.
Standardized Bias Before and After Matching.
Figure 2.
Propensity Score Distributions of the Treatment and Control Groups Before and After PSM.
Table 6.
Robustness Checks Results (1–3).
4.3.2. Bilateral Winsorization of Variables
Given the large amount of data involved in this study, extreme values may affect the estimation results. To address this issue, all major continuous variables are winsorized at the 1% level on both tails. The corresponding regression results are reported in Column (3) of Table 6. After excluding the influence of extreme observations, the Plan still significantly promotes carbon emission efficiency in resource-based cities, indicating that the main conclusions remain robust.
4.3.3. Remeasuring Carbon Emission Efficiency Using Alternative Carbon Emission Data
At present, no consensus has been reached regarding the measurement of carbon emissions. In Table 1 and the baseline regression, this study follows existing research [29] by calculating carbon emissions based on both direct carbon sources, such as natural gas and liquefied petroleum gas, and indirect carbon sources, such as electricity consumption. In addition to this approach, the China Emission Accounts and Datasets (CEADs) database provides county-level carbon emission data for 2735 counties in China based on DMSP/OLS and NPP/VIIRS nighttime light data. This dataset has been widely adopted in recent studies [32,33]. Accordingly, this study aggregates county-level emissions to the city level and replaces the original carbon emission data in Table 1 to recalculate carbon emission efficiency. As shown in Column (3) and (4) of Table 6, the Plan continues to exhibit a significantly positive effect on carbon emission efficiency in resource-based cities, further supporting the robustness of the empirical findings.
4.3.4. Controlling for Other Policy Effects
To effectively identify and isolate the impact of the Plan, this study incorporates three additional policy dummy variables into the baseline regression: the low-carbon pilot policy (didLcp) [34], the carbon emission trading pilot policy (didCet) [3], and the innovative city pilot policy (didInn) [35]. Columns (1)–(3) of Table 7 present the estimation results. Even after controlling for these three policy interventions separately, the positive effect of the Plan on carbon emission efficiency remains significant. This indicates that the implementation of other policies does not confound the Plan’s effectiveness, further supporting the robustness of the previous findings.
Table 7.
Robustness Checks Results (4–5).
4.3.5. Placebo Test
A placebo test is conducted by artificially assigning alternative implementation years for the Plan [36,37]. Specifically, two periods are considered: 2006–2012 and 2015–2020, with 2009 and 2017 set as hypothetical policy start years, respectively. If the estimated coefficients are not significant, it suggests that the observed improvement in carbon emission efficiency in resource-based cities is indeed attributable to the Plan; otherwise, the results would be unstable. Columns (4) and (5) of Table 7 show that when the policy start year is artificially altered, the coefficient of the core explanatory variable becomes statistically insignificant. This provides additional evidence for the robustness of the baseline regression results.
5. Testing the Intrinsic Mechanisms and Moderating Effects
5.1. Testing the Intrinsic Mechanisms
Theoretical analysis above suggests that the Plan may affect carbon emission efficiency through technological innovation, industrial upgrading, and energy reduction effects. To verify these mechanisms while addressing potential endogeneity issues in traditional mediation models, this study follows related research [38,39] and conducts the analysis in two steps.
First, the mechanism variables are used as dependent variables, with did serving as the core explanatory variable. Second, the effects of the mediating variables on the dependent variable are further examined separately using a fixed effects model. This additional test is based on existing theories and literature, and it helps strengthen the reliability of the conclusions. The specific model is specified as follows:
In Equations (5) and (6), Mit represents the variables measuring the intrinsic mechanisms: ① Technological innovation effect (lnInn): measured by the logarithm of domestic patents granted per 10,000 people. ② Industrial upgrading effect: measured by the industrial structure advancement index (AInd), measured as the ratio of tertiary industry output to secondary industry output, and the industrial structure rationalization index (Rind), calculated based on the industrial structure deviation index following Han et al. [40]. ③ Energy reduction effect (Econ): measured by the logarithm of energy consumption per unit of GDP. Following previous research [21], energy consumption is calculated by combining direct energy consumption generated from natural gas and liquefied petroleum gas with indirect energy consumption generated from electricity consumption. All other variables are consistent with those in Equation (1).
Table 8 reports the regression results of the internal mechanism tests. First, the estimation results in Columns (1) and (2) show that the Plan has a significantly positive effect on technological innovation, and that technological innovation also has a significantly positive effect on carbon emission efficiency. This finding is consistent with the theoretical expectations discussed above. By providing comprehensive support in terms of human, material, and financial resources, the Plan creates a favorable environment for technological innovation. This further contributes to the improvement of carbon emission efficiency.
Table 8.
Intrinsic Mechanism Tests Results.
Second, the estimation results in Columns (3) and (4), as well as Columns (5) and (6), show that the Plan significantly promotes the advancement and rationalization of industrial structure at the 1% level. Meanwhile, both industrial structure advancement and industrial structure rationalization have significantly positive effects on carbon emission efficiency. Through a series of measures, such as promoting the transformation of traditional industries and guiding and supporting the development of emerging industries, the Plan generates a significant industrial upgrading effect. This effect serves as one of the key mechanisms for improving carbon emission efficiency.
Finally, the estimation results in Columns (7) and (8) indicate a significantly negative relationship between the Plan and energy consumption per unit of GDP. The estimated coefficient is highly significant at the 1% level. In addition, the relationship between energy consumption and carbon emission efficiency is also significantly negative. This objectively indicates that the implementation of the Plan generates a strong energy reduction effect. It is therefore conducive to improving both energy use efficiency and carbon emission efficiency. In summary, the Plan improves carbon emission efficiency through technological innovation, industrial upgrading, and energy reduction effects. Thus, theoretical hypothesis H2 is verified.
5.2. Testing the Moderating Effects
According to the theoretical hypotheses, the positive effect of the Plan on carbon emission efficiency may be moderated by economic growth pressure and the degree of marketization. Specifically, higher economic growth pressure weakens this effect, while higher marketization strengthens it. To test these hypotheses, the following model is constructed:
In Equation (7), Adit represents the moderating variable, either economic growth pressure or marketization. The interaction term diditAdit is the key coefficient of interest. Economic growth pressure (lnTarget) is measured by the logarithm of the annual GDP growth target reported in each prefecture-level city’s government work report. Higher targets indicate greater economic growth pressure. Marketization (lnMar) is measured by the logarithm of private and self-employed persons per 10,000 people.
Table 9 presents the results of the moderating effect tests for economic growth pressure and marketization. Columns (1) and (3) report the regressions without control variables, while Columns (2) and (4) include control variables. First, regarding economic growth pressure, the coefficient of the interaction term didlnTarget is significantly negative at the 5% level after including control variables. This indicates that higher economic growth pressure weakens the positive effect of the Plan on carbon emission efficiency. As suggested in the theoretical analysis, elevated growth pressure may lead to excessive expansion of the secondary industry, reducing the government’s ability to regulate and guide development, which in turn limits the Plan’s effectiveness.
Table 9.
Moderating Effects Test Results.
Second, regarding marketization, the coefficient of the interaction term didlnMar remains significantly positive at the 1% level regardless of whether control variables are included. This suggests that a higher degree of marketization strengthens the Plan’s effect on improving carbon emission efficiency. This result is intuitive: stronger marketization not only helps overcome low-end lock-in in industrial structures but also fosters the emergence of more energy-saving and emission-reducing technologies, effectively supporting the implementation of the Plan. In summary, economic growth pressure and marketization exert negative and positive moderating effects, respectively, on the Plan’s impact on carbon emission efficiency, providing empirical support for Hypothesis H3.
6. Heterogeneity Analysis
6.1. Regional Heterogeneity
First, based on economic regional differences, the sample is divided into two categories: eastern and central-western regions. Generally, the eastern region has stronger economic development conditions, while the central-western region possesses richer natural resource endowments. Columns (1) and (2) of Table 10 present the regression results for this heterogeneity dimension. For resource-based cities in the eastern region, the coefficient of the Plan is 0.134 and significant at the 1% level. In contrast, the coefficient for the central-western region is only 0.019 and not significant. Moreover, the between-group coefficient difference test is significant at the 5% level. This indicates that the Plan’s positive effect on carbon emission efficiency exists primarily in eastern resource-based cities and is relatively strong. This may be because eastern resource-based cities have a stronger economic foundation, better industrial supporting systems, and a more favorable market environment. These conditions allow the industrial restructuring, technological upgrading, and energy efficiency improvement requirements advocated by the Plan to be integrated into existing development systems within a relatively short period. As a result, resource-based industries in these cities can extend toward high value-added manufacturing segments and green, low-carbon industries, thereby improving carbon emission efficiency. By contrast, resource-based cities in the central and western regions are more deeply dependent on resources. Their industrial systems are concentrated mainly in energy extraction, raw material production, and heavy chemical industries. In addition, insufficient cultivation of alternative industries, weak innovation capacity, and stronger short-term growth pressure make it difficult for the Plan to fully release its effect on improving carbon emission efficiency.
Table 10.
Regional Heterogeneity Results.
Second, from a geographic perspective, natural conditions and production-living patterns differ notably on the two sides of the Qinling-Huaihe Line, leading to different policy responses. Accordingly, the sample cities are divided into southern and northern regions. Columns (3) and (4) of Table 10 report the corresponding regression results. The Plan’s positive effect on carbon emission efficiency is only significant in southern resource-based cities (coefficient significant at 5%), while it is not significant in northern cities. Meanwhile, the between-group coefficient difference test is significant at the 1% level. This may be because southern resource-based cities have a relatively mild climate and lower demand for centralized winter heating. Therefore, they are less dependent on traditional fossil fuels such as coal. At the same time, a more developed industrial system and market environment provide a favorable basis for the Plan to exert its industrial guidance and energy-saving constraint effects. These conditions make it easier for the Plan to improve carbon emission efficiency through industrial restructuring and the low-carbon transformation of production modes. By contrast, northern resource-based cities have long relied on heavy industrial sectors such as coal, steel, and petrochemicals. Their economic growth is more deeply tied to high-carbon energy consumption. In addition, the rigid energy demand generated by winter heating further reinforces the inertia of high-carbon development. As a result, the carbon emission efficiency-enhancing effect of the Plan is difficult to fully realize in these cities.
Finally, the Hu Huanyong Line serves as a demarcation of economic development levels and population distribution in China, with a clear difference in resource concentration on its two sides. Columns (5) and (6) of Table 10 show the regression results based on this criterion. The Plan significantly improves carbon emission efficiency in cities located southeast of the Hu Huanyong Line (coefficient significant at 1%), but its effect is insignificant and negative in cities northwest of the line. Meanwhile, the between-group coefficient difference test is significant at the 1% level. This indicates that the Plan improves carbon emission efficiency only in resource-based cities located on the southeastern side of the Hu Huanyong Line. This may be because population, capital, technology, and market demand are more concentrated on the southeastern side of the Hu Huanyong Line. In this region, industrial chain supporting systems and innovation systems are also relatively well developed. These conditions provide a practical foundation for the Plan to exert its effects through industrial guidance, innovation incentives, and energy-saving constraints. As a result, resource-based industries are more likely to extend toward diversified, low-carbon, and high value-added development, thereby improving carbon emission efficiency. By contrast, resource-based cities on the northwestern side of the Hu Huanyong Line have limited market size. Their industrial development relies more heavily on resource extraction and primary processing. They also face weaker ecological carrying capacity, insufficient infrastructure, and limited innovation resources. These constraints create a substantial gap between the policy objectives of the Plan and local transformation capacity. As a result, its effect on improving carbon emission efficiency is not significant in these cities.
6.2. Scale Heterogeneity
The preceding analysis indicates that the effect of the Plan on carbon emission efficiency exhibits significant heterogeneity across different regions. From the perspective of city size, it is important to examine whether the Plan’s positive effect exists consistently across cities of different scales. Generally, larger cities benefit from economic agglomeration, talent concentration, and abundant research resources, which provide advantages in implementing the Plan and promoting a low-carbon economic transition. However, the continuous expansion of city size also brings challenges such as resource scarcity, environmental pollution, and traffic congestion, which may hinder sustained carbon reduction and high-quality economic development.
To explore the heterogeneity of the Plan’s impact on carbon emission efficiency across city sizes, the sample cities are categorized into five groups based on the permanent population in urban areas, following the 2014 State Council notice on adjusting urban scale classification: small cities, medium-sized cities, Type II large cities, Type I large cities, and mega cities and above. Table 11 reports the corresponding regression results. It can be seen that the Plan’s coefficient is significantly positive for medium-sized cities and Type II large cities, passing the 1% and 10% significance tests, respectively. In contrast, the coefficients for other city size categories are not significant. Meanwhile, the between-group coefficient difference tests are all significant at least at the 5% level. This indicates that the Plan’s positive effect on carbon emission efficiency is significant only in medium-sized and Type II large cities. Moreover, the effect is stronger in medium-sized cities, with a coefficient of 0.106, substantially higher than 0.028 in Type II large cities.
Table 11.
Scale Heterogeneity Results.
These patterns arise because the policy effect of the Plan is jointly shaped by the resource agglomeration capacity and governance carrying capacity associated with city size. For small cities, population, capital, technology, and public service resources are insufficiently concentrated. Their industrial foundations are also relatively weak. As a result, small cities find it difficult to effectively meet the requirements of the Plan regarding industrial substitution, technological innovation, energy conservation, and consumption reduction. Therefore, the policy effect is not significant. Medium-sized cities and Type II large cities fall within a more suitable size range. They have a certain industrial foundation, market demand, and talent agglomeration capacity. At the same time, they have not yet faced excessive pressure from traffic congestion, environmental pollution, or resource constraints. Under these conditions, the industrial upgrading, technological innovation, and energy consumption reduction effects of the Plan can be more easily released. Therefore, its effect on improving carbon emission efficiency is more evident in these cities. As city size continues to expand, Type I large cities and megacities and above have stronger factor agglomeration capacity. However, they also face problems such as expanding total energy consumption, increasing carbon emissions from transportation and buildings, and rising environmental governance costs. These urban problems may offset the low-carbon transformation effect of the Plan, resulting in an insignificant policy impact. Therefore, the carbon emission efficiency-enhancing effect of the Plan does not increase linearly with city size. Instead, it depends on the balance between factor agglomeration effects and urban governance costs.
7. Conclusions and Policy Recommendations
Based on panel data from 282 prefecture-level and above cities in China, this study employs a DID model to empirically examine the effect, underlying mechanisms, and heterogeneity of the Plan for Resource-Based Cities on carbon emission efficiency. The results show that the Plan significantly improves carbon emission efficiency. A series of robustness checks, including PSM-DID, controlling for other policies, and placebo tests, support these conclusions. Mechanism analysis indicates that the Plan enhances carbon emission efficiency through technological innovation, industrial upgrading, and energy reduction effects. Further, economic growth pressure and the degree of marketization exert negative and positive moderating effects, respectively, on the Plan’s impact. Heterogeneity analysis shows that the Plan’s policy effects vary significantly across city location and size. Specifically, in terms of location, the Plan’s positive effect on carbon emission efficiency is significant only in eastern cities, southern cities, and cities southeast of the Hu Huanyong Line. Regarding city size, the positive effect is significant only in medium-sized and Type II large cities.
Based on these findings, the following policy recommendations are proposed:
First, the support policies for the sustainable development of resource-based cities should be continuously improved, with a stronger goal orientation toward enhancing carbon emission efficiency. The empirical results show that the Plan significantly improves carbon emission efficiency in resource-based cities. This indicates that comprehensive sustainable development planning plays a positive role in coordinating economic growth and carbon reduction. Therefore, based on the implementation experience of the Plan, the policy system for the sustainable development of resource-based cities should be further improved. Indicators such as carbon emission efficiency, energy utilization efficiency, and industrial transformation performance should be incorporated into the policy evaluation framework. This would help resource-based cities shift from focusing only on the scale of emission reduction to placing greater emphasis on the quality of green development.
Second, policy implementation should focus more closely on technological innovation, industrial upgrading, and energy consumption reduction. The mechanism tests show that, after the implementation of the Plan, resource-based cities experienced significant improvements in technological innovation, industrial upgrading, and energy consumption reduction. These findings provide supporting evidence that these factors may serve as channels through which the policy affects carbon emission efficiency. Therefore, follow-up policies should continue to strengthen support for the research, development, and diffusion of green technologies. They should guide traditional resource-based industries toward high-tech, high value-added, and low-emission development. At the same time, efforts should be made to promote modern services, the digital economy, and alternative industries. This would reduce the dependence of economic growth on resource extraction and energy-intensive industries. In addition, energy consumption per unit of output should be continuously reduced through the application of energy-saving technologies, optimized energy management, and resource recycling.
Third, economic growth targets should be set in a reasonable manner, and market-oriented reform should be continuously advanced. The moderating effect results show that economic growth pressure weakens the carbon emission efficiency-enhancing effect of the Plan, whereas a higher degree of marketization strengthens this policy effect. Therefore, resource-based cities should reduce the importance of GDP growth in the performance evaluation of local officials. They should also increase the weight of ecological and environmental indicators, such as carbon reduction performance, in the evaluation system. This would encourage governments to set economic growth targets in a scientific and reasonable way in line with the requirements of sustainable development. At the same time, the business environment should be continuously improved. Reforms to streamline administration, delegate power, improve regulation, and upgrade services should be further deepened. A sound mechanism for cultivating, attracting, and supporting market entities should also be established. By combining an effective market with a proactive government, the carbon emission efficiency-enhancing effect of the Plan can be further strengthened.
Fourth, differentiated governance should be implemented according to differences in city location and city size. The heterogeneity analysis shows that the carbon emission efficiency-enhancing effect of the Plan is mainly significant in eastern cities, southern cities, cities on the southeastern side of the Hu Huanyong Line, medium-sized cities, and Type II large cities. However, this effect is not evident in central–western cities, northern cities, cities on the northwestern side of the Hu Huanyong Line, and some small and very large cities. Therefore, for resource-based cities in the central and western regions, northern China, and the northwestern side of the Hu Huanyong Line, policy efforts should focus on improving the capacity to cultivate alternative industries, support green technologies, and optimize the energy structure. These measures would help alleviate resource dependence and high-carbon industrial lock-in. For small cities, industrial undertaking capacity and public service capacity should be strengthened. For Type I large cities and megacities and above, greater attention should be paid to the carbon emission pressure caused by the expansion of transportation, buildings, and energy consumption. These cities should improve urban governance efficiency and prevent urban problems from weakening the effectiveness of low-carbon transformation.
8. Research Deficiencies and Prospects
Although this study systematically evaluates the impact of the Plan on carbon emission efficiency and its underlying mechanisms using a DID model, and confirms the reliability of the findings through the parallel trends test and other robustness checks, several limitations remain and should be further addressed in future research.
First, the validity of the DID method depends on the parallel trends assumption between the treatment and control groups and on the exogeneity of policy assignment. Although the parallel trends test in this study supports the former condition, resource-based cities and non-resource-based cities have long-standing inherent differences in economic development stages, industrial structure inertia, and energy consumption patterns. These structural differences may cause the DID estimator to capture both the policy effect and the effects of regional structural transformation to some extent. The model can control for observable factors only through city and year fixed effects. It cannot completely eliminate endogeneity bias arising from unobservable long-standing inherent differences or nonrandom policy assignment. Future research could seek strictly exogenous instrumental variables to mitigate selection bias. It could also adopt a regression discontinuity design to further improve the validity of causal identification.
Second, the measurement of carbon emission efficiency relies on macro-level statistical data. Such data may not fully capture the emission reduction behavior of micro-level agents. Measurement errors in the data may also affect the accuracy of the results. Future research could combine multi-source data to construct more precise indicators.
Third, the conclusions of this study are based on a sample of resource-based cities in China. They are shaped by contextual factors such as China’s institutional environment and industrial structure. Whether these findings can be extended to other emerging economies requires further examination through cross-country comparative research.
Fourth, during the study period, several environmental policies were implemented simultaneously, including low-carbon city policies and carbon emissions trading schemes. This study does not identify the synergistic or crowding-out effects of policy combinations. Future research could construct multi-policy interaction models to examine these effects in greater depth.
Author Contributions
Conceptualization, Q.Z. and Z.B.; methodology, Q.Z.; software, Z.B.; formal analysis, Q.Z.; data curation, Z.B.; writing—original draft preparation, Q.Z.; writing—review and editing, Z.B.; All authors have read and agreed to the published version of the manuscript.
Funding
This research was funded by Project supported by the National Natural Science Foundation of China, grant number 72274114 and 72474123, National Natural Science Foundation of China Youth Project, grant number 72204151.
Institutional Review Board Statement
Not applicable.
Informed Consent Statement
Not applicable.
Data Availability Statement
The original contributions presented in this study are included in the article. Further inquiries can be directed to the corresponding author.
Conflicts of Interest
The authors declare no conflicts of interest.
References
- Nwani, C.; Adams, S. Environmental cost of natural resource rents based on production and consumption inventories of carbon emissions: Assessing the role of institutional quality. Resour. Policy 2021, 74, 102282. [Google Scholar] [CrossRef] [Scilit]
- Du, K.; Cheng, Y.; Yao, X. Environmental regulation, green technology innovation, and industrial structure upgrading: The road to the green transformation of Chinese cities. Energy Econ. 2021, 98, 105247. [Google Scholar] [CrossRef] [Scilit]
- Chen, L.; Liu, Y.; Gao, Y.; Wang, J. Carbon emission trading policy and carbon emission efficiency: An empirical analysis of China’s prefecture-level cities. Front. Energy Res. 2021, 9, 793601. [Google Scholar] [CrossRef] [Scilit]
- Liu, L.; Li, M.; Gong, X.; Jiang, P.; Jin, R.; Zhang, Y. Influence mechanism of different environmental regulations on carbon emission efficiency. Int. J. Environ. Res. Public Health 2022, 19, 13385. [Google Scholar] [CrossRef] [Scilit] [PubMed]
- Carley, S.; Konisky, D.M. The justice and equity implications of the clean energy transition. Nat. Energy 2020, 5, 569–577. [Google Scholar] [CrossRef] [Scilit]
- Sovacool, B.K. Who are the victims of low-carbon transitions? Towards a political ecology of climate change mitigation. Energy Res. Soc. Sci. 2021, 73, 101916. [Google Scholar] [CrossRef] [Scilit]
- Nacke, L.; Cherp, A.; Jewell, J. Phases of fossil fuel decline: Diagnostic framework for policy sequencing and feasible transition pathways in resource dependent regions. Oxf. Open Energy 2022, 1, oiac002. [Google Scholar] [CrossRef] [Scilit]
- Wang, Y.; Chen, H.; Long, R.; Sun, Q.; Jiang, S.; Liu, B. Has the sustainable development planning policy promoted the green transformation in China’s resource-based cities? Resour. Conserv. Recycl. 2022, 180, 106181. [Google Scholar] [CrossRef] [Scilit]
- Fan, F.; Zhang, X. Transformation effect of resource-based cities based on PSM-DID model: An empirical analysis from China. Environ. Impact Assess. Rev. 2021, 91, 106648. [Google Scholar] [CrossRef] [Scilit]
- Li, Q.; Zeng, F.E.; Liu, S.; Yang, M.; Xu, F. The effects of China’s sustainable development policy for resource-based cities on local industrial transformation. Resour. Policy 2021, 71, 101940. [Google Scholar] [CrossRef] [Scilit]
- Wang, J.X. Did China’s “National Sustainable Development Plan of Resource-Based Cities” promote economic growth? Sustainability 2022, 14, 8222. [Google Scholar] [CrossRef] [Scilit]
- Zhang, Y.; Zheng, H.Y.; Ge, L.M. The impact of sustainable development policy of resource-based cities on carbon emissions. J. Financ. Econ. 2022, 48, 49–63. [Google Scholar] [CrossRef]
- Zheng, H.Y.; Ge, L.M. Impact of sustainable development in resource-based cities on carbon emissions: From the perspective of resource dependence. China Environ. Sci. 2022, 42, 2955–2964. [Google Scholar] [CrossRef]
- Zhang, H.; Sun, X.; Bi, C.; Ahmad, M.; Wang, J. Can sustainable development policy reduce carbon emissions? Empirical evidence from resource-based cities in China. Sci. Total Environ. 2022, 838, 156341. [Google Scholar] [CrossRef] [Scilit] [PubMed]
- Guan, H.L.; Dong, H.J.; Zhang, Y.R. Research on the pollution reduction effect of the sustainable development plan of resource-based cities nationwide. Econ. Probl. 2021, 43, 80–90. [Google Scholar] [CrossRef]
- Meng, Y.; Liu, L.; Wang, J.; Ran, Q.; Yang, X.; Shen, J. Assessing the impact of the national sustainable development planning of resource-based cities policy on pollution emission intensity: Evidence from 270 prefecture-level cities in China. Sustainability 2021, 13, 7293. [Google Scholar] [CrossRef] [Scilit]
- Zhou, H.H.; Gu, G.F. Assessment on pollution reduction effects of sustainable development policy in Chinese resource-based cities. J. Land Resour. Environ. 2020, 34, 50–57. [Google Scholar] [CrossRef]
- Li, S.S.; Ma, Y.Q. The effect of environmental regulation on the factorization of total factor carbon emission efficiency. J. Shanxi Univ. Financ. Econ. 2019, 41, 50–62. [Google Scholar] [CrossRef]
- Fan, M.; Li, M.; Liu, J.; Shao, S. Is high natural resource dependence doomed to low carbon emission efficiency? Evidence from 283 cities in China. Energy Econ. 2022, 115, 106328. [Google Scholar] [CrossRef] [Scilit]
- Pan, X.; Pan, X.; Li, C.; Song, J.; Zhang, J. Effects of China’s environmental policy on carbon emission efficiency. Int. J. Clim. Change Strateg. Manag. 2019, 11, 326–340. [Google Scholar] [CrossRef] [Scilit]
- Guo, P.; Liang, D. Does the low-carbon pilot policy improve the efficiency of urban carbon emissions: Quasi-natural experimental research based on low-carbon pilot cities. J. Nat. Resour. 2022, 37, 1876–1892. [Google Scholar] [CrossRef] [Scilit]
- Gao, G.L.; Wen, Y.; Wang, L.; Xu, R. Study on carbon peak of urban clusters based on analysis of influencing factors of carbon emissions. Bus. Manag. J. 2023, 2, 39–58. [Google Scholar] [CrossRef]
- Yu, Y.Z.; Pan, Y. The mysterious coexistence of rapid economic growth and a lag in the service industry’s upgrade in China: An interpretation based on the economic growth target constraints perspective. Econ. Res. J. 2019, 3, 150–165. [Google Scholar] [CrossRef] [Scilit]
- Li, F.; Wang, Z.; Huang, L. Economic growth target and environmental regulation intensity: Evidence from 284 cities in China. Environ. Sci. Pollut. Res. 2022, 29, 10235–10249. [Google Scholar] [CrossRef] [Scilit] [PubMed]
- Wang, F.F. The impact of economic growth goals on the efficiency of local environmental governance: An empirical analysis based on the panel data of cities above the prefecture level in China. Urban Probl. 2022, 326, 76–86. [Google Scholar] [CrossRef]
- Yang, T.B.; Zhu, Y.M.; Liu, M.H.; Zhou, B. Industrial co-agglomeration, marketization and environmental pollution in resource-based cities. Ind. Econ. Res. 2020, 6, 15–27, 112. [Google Scholar] [CrossRef]
- Li, J.J.; Luo, N.S. Ownership structure, market degree and regional environmental pollution: An empirical test based on China’s provincial panel data. J. Nanjing Univ. Financ. Econ. 2019, 4, 26–35. [Google Scholar]
- Xu, Y.Q.; Cheng, Y.; Wang, J.J. The impact of green technological innovation on the spatiotemporal evolution of carbon emission efficiency of resource-based cities in China. Geogr. Res. 2023, 42, 878–894. [Google Scholar] [CrossRef]
- Wu, J.X.; Guo, Z.Y. Research on the convergence of carbon dioxide emissions in China: A continuous dynamic distribution approach. Stat. Res. 2016, 33, 54–60. [Google Scholar] [CrossRef]
- Zhang, J.; Wu, G.Y.; Zhang, J.P. The estimation of China’s provincial capital stock: 1952–2000. Econ. Res. J. 2004, 50, 35–44. [Google Scholar]
- Ye, Q.; Zeng, G.; Dai, S.Q.; Wang, F.L. Research on the effects of different policy tools on China’s emissions reduction innovation: Based on the panel data of 285 prefectural-level municipalities. China Popul. Resour. Environ. 2018, 28, 115–122. [Google Scholar] [CrossRef] [Scilit]
- Chen, J.; Gao, M.; Cheng, S.; Hou, W.; Song, M.; Liu, X.; Liu, Y.; Shan, Y. County-level CO2 emissions and sequestration in China during 1997–2017. Sci. Data 2020, 7, 391. [Google Scholar] [CrossRef] [Scilit] [PubMed]
- Li, S.; Zhan, Y. Carbon emission reduction effect of smart city construction from the perspective of industrial transformation and upgrading. J. Shanghai Univ. Financ. Econ. 2022, 24, 3–18, 107. [Google Scholar] [CrossRef]
- Zhang, H.; Feng, C.; Zhou, X. Going carbon-neutral in China: Does the low-carbon city pilot policy improve carbon emission efficiency? Sustain. Prod. Consum. 2022, 33, 312–329. [Google Scholar] [CrossRef] [Scilit]
- Liu, L.; Zhang, Y.; Liu, B.; Xiu, P.; Sun, L. How to achieve carbon neutrality: From the perspective of innovative city pilot policy in China. Int. J. Environ. Res. Public Health 2022, 19, 16539. [Google Scholar] [CrossRef] [Scilit] [PubMed]
- Yu, L.H.; Ma, B.W. Supportive policy for resource-exhausted cities, the manufacturing upgrading and the coordinated regional development. China Ind. Econ. 2022, 8, 137–155. [Google Scholar] [CrossRef]
- Chen, Y.J.; Li, P.; Lu, Y. Career concerns and multitasking local bureaucrats: Evidence of a target-based performance evaluation system in China. J. Dev. Econ. 2018, 133, 84–101. [Google Scholar] [CrossRef] [Scilit]
- Jiang, T. Mediating effects and moderating effects in causal inference. China Ind. Econ. 2022, 40, 100–120. [Google Scholar] [CrossRef]
- Bian, Z.Q.; Zhang, Q.H. The impact of national-level urban agglomeration construction on the synergistic development of carbon reduction and growth and its policy implications. J. Nat. Resour. 2026, 41, 1554–1577. [Google Scholar] [CrossRef] [Scilit]
- Han, Y.H.; Huang, L.X.; Wang, X.B. Do industrial policies promote industrial structure upgrading? Theory and evidence from China’s development-oriented local government. Econ. Res. J. 2017, 52, 33–48. [Google Scholar]

Disclaimer/Publisher’s Note: The statements, opinions and data contained in all publications are solely those of the individual author(s) and contributor(s) and not of MDPI and/or the editor(s). MDPI and/or the editor(s) disclaim responsibility for any injury to people or property resulting from any ideas, methods, instructions or products referred to in the content. |
© 2026 by the authors. Licensee MDPI, Basel, Switzerland. This article is an open access article distributed under the terms and conditions of the Creative Commons Attribution (CC BY) license.