Article

Corporate ESG Performance and Low-Carbon Technology Innovation: Mechanism Analysis and Heterogeneity Tests


1
School of Economics, Shanxi University of Finance and Economics, Taiyuan 030006, China
2
Industry Research Institute for Carbon Peaking and Carbon Neutrality, Shanxi University of Finance and Economics, Taiyuan 030006, China
*
Authors to whom correspondence should be addressed.
Sustainability 2026, 18(13), 6849; https://doi.org/10.3390/su18136849 (registering DOI)
Submission received: 12 May 2026 / Revised: 17 June 2026 / Accepted: 25 June 2026 / Published: 6 July 2026

Abstract

ESG (Environmental, Social, and Governance) performance is increasingly viewed as a strategic factor shaping firms’ innovation activities. However, existing studies have largely examined green innovation as a whole, with limited attention to low-carbon technological innovation as a distinct domain and insufficient understanding of its driving mechanisms and conditional heterogeneity. Using panel data on Chinese A-share listed companies from 2009 to 2024, this study employs a two-way fixed-effects framework to examine the effect of ESG performance on low-carbon technological innovation, and further investigates the underlying transmission mechanisms and heterogeneous effects. The results show that ESG significantly promotes low-carbon technological innovation, with a notably stronger effect on substantive innovation than on strategic innovation, indicating that ESG drives genuine technological advancement rather than superficial patent accumulation. Mechanism tests reveal that ESG facilitates innovation by easing financing constraints and enhancing government support. At the dimensional level, the environmental and social pillars exert significant positive effects, whereas the governance pillar does not. Heterogeneity analyses demonstrate that the promotional effect is more pronounced in state-owned enterprises, large firms, heavily polluting industries, and non-technology-intensive firms, revealing structural variation across firm characteristics. By isolating low-carbon innovation from the broader green innovation concept and identifying dual transmission channels, this study extends the literature on the economic consequences of ESG and provides evidence for designing differentiated green governance policies.

1. Introduction

As global efforts to reduce carbon emissions intensify, low-carbon technological innovation, which encompasses clean energy, carbon capture, and energy-efficiency technologies, has become a critical pathway for firms to achieve sustainable development and energy transition [1]. Compared with general technological innovation, it is characterized by longer R&D cycles, higher upfront costs, and greater uncertainty in commercial returns, creating significant barriers for corporate investment. Firms must therefore navigate a fundamental tension between environmental compliance pressure and innovation investment, mobilizing diverse resources beyond internal R&D budgets to sustain low-carbon innovation efforts.
In this context, the Environmental, Social, and Governance (ESG) framework offers a new analytical lens for examining this challenge. ESG has become an increasingly important framework for evaluating firms’ sustainable development capabilities and long-term value creation, and it has been widely incorporated into corporate decision-making and investment practices [2]. In China, this transition has accelerated. In February 2024, the Shanghai, Shenzhen, and Beijing Stock Exchanges jointly issued the Guidelines for Sustainability Reports of Listed Companies, marking a shift from voluntary disclosure to mandatory sustainability reporting for a large number of listed firms. As ESG compliance evolves from voluntary commitment to regulatory obligation, firms face increasingly prominent trade-offs in resource allocation. A pressing question therefore arises: Does ESG performance function as a strategic resource that facilitates low-carbon innovation, or does it become a compliance burden that crowds out scarce innovation resources?
Theoretically, ESG and low-carbon technological innovation are inherently coupled through three dimensions. In the environmental dimension (E), carbon reduction targets and energy efficiency requirements directly compel firms to incorporate low-carbon R&D into strategic investment. In the social dimension (S), stakeholder expectations and consumer demand for sustainable products create market incentives that reward innovation. In the governance dimension (G), board oversight mechanisms and information disclosure systems reduce agency costs and information asymmetry, thereby ensuring stable long-term investment in innovation activities. ESG performance thus serves as a critical bridge connecting policy-driven carbon reduction requirements and firm-level low-carbon innovation practices.
Nonetheless, the existing literature has not reached a consensus on whether ESG drives or inhibits low-carbon innovation. Some studies argue that strong ESG performance can mitigate information asymmetry and optimize resource allocation, thereby empowering green innovation [3,4,5]. Others contend that ESG compliance costs crowd out R&D expenditure and may even foster “greenwashing” and other formalistic behaviors that suppress substantive innovation [6,7]. This ongoing debate points to three distinct research gaps. First, innovation metrics remain overly broad. Most studies treat green innovation as an aggregate indicator without focusing on low-carbon technological innovation in the context of the “dual carbon” goals, nor distinguishing substantive from strategic innovation, making it difficult to identify the differential effects of ESG on different types of low-carbon R&D. Second, the theoretical integration underlying ESG’s impact on low-carbon innovation is insufficient. Existing studies tend to apply single theories in isolation rather than constructing a unified analytical framework that draws on resource dependence theory, stakeholder theory, and principal–agent theory, which weakens the theoretical foundation for hypothesis development. Third, heterogeneity analyses remain fragmented, with limited systematic examination of how firm characteristics such as ownership structure, technology intensity, firm size, and pollution intensity shape the ESG low-carbon innovation relationship, leaving the structural sources of differential effects underexplored.
Accordingly, this study asks whether and how ESG performance drives low-carbon technological innovation, what mechanisms mediate this relationship, and under what firm-level conditions the effect varies. Using a sample of Chinese A-share listed firms from 2009 to 2024, it constructs a fixed-effects panel model to examine the ESG and low-carbon innovation nexus, investigates two mediating channels, namely the alleviation of financing constraints and the enhancement of government support, and conducts heterogeneity analyses across ownership type, technology intensity, and firm size. These efforts aim to provide micro-level evidence for the ESG–innovation nexus and policy implications for designing differentiated strategies to harness ESG as a driver of corporate low-carbon transition.

2. Literature Review

2.1. ESG and Corporate Innovation

As a non-financial evaluation framework for corporate sustainability, ESG has generated a substantial body of research on its relationship with innovation. This literature can be organized along the three ESG pillars: environmental, social, and governance.
Research on the environmental dimension (E) centers on the interaction between environmental regulation and green innovation. Early debates revolved around the Porter Hypothesis. Some scholars argue that command-and-control environmental policies compel firms to increase green R&D investment. Using data from Chinese A-share listed firms, empirical evidence shows that command-and-control policies, such as the environmental target responsibility system, are more effective in stimulating substantive green innovation than market-based instruments such as carbon trading [8]. The underlying mechanism lies in the ability of such policies to reduce the uncertainty associated with innovation returns. However, other studies highlight the potential crowding-out effect of environmental regulation. When regulatory pressure exceeds firms’ capacity to absorb compliance costs, resources are more likely to be allocated to pollution abatement rather than technological R&D. This inhibitory effect is particularly pronounced among firms with weaker innovation capabilities or lower intrinsic R&D incentives [9]. A U-shaped relationship between environmental regulation and technological innovation has also been identified, suggesting that the effect is contingent on regulatory intensity [10]. With the refinement of ESG evaluation systems, research has increasingly treated ESG performance as a transmission channel linking environmental regulation and green innovation. Using a difference-in-differences approach, existing studies confirm that the Environmental Protection Tax Law improves firms’ environmental pillar scores, facilitating access to green subsidies and credit and indirectly promoting green innovation [5].
Research on the social dimension (S) focuses on stakeholder pressure and innovation resource acquisition. According to stakeholder theory, fulfilling social responsibility enhances brand reputation and stakeholder trust [11], attracting critical resources for innovation. Socially responsible firms are found to more easily obtain support from governments, investors, and consumers. This social capital accumulation eases financing constraints and delivers innovation resources, strengthening competitiveness [12]. Existing studies further identify a dynamic interaction between green innovation and ESG performance. Green innovation plays a mediating role in the relationship between ESG responsibility fulfillment and firm value enhancement [13]. Green innovation plays a mediating role in the relationship between ESG responsibility fulfillment and firm value enhancement [14]. Moreover, the positive effect of corporate social responsibility (CSR) on green technological innovation is more pronounced in mature firms operating in highly competitive industries [15]. This can be attributed to the differentiated competitive advantages derived from CSR engagement, which incentivize firms to strengthen their market position through green innovation.
Research on the governance dimension (G) examines how corporate governance structures shape innovation decisions, primarily through mitigating short-termism via principal–agent optimization. Dual-class share structures have been shown to promote innovation in high-tech firms in developed economies with sound external oversight [16]. Existing evidence demonstrates that governance structures must align with innovation strategies to effectively foster innovation [17]. Institutional openings such as the Shanghai-Hong Kong Stock Connect are found to introduce foreign investors who strengthen management monitoring, improve corporate governance quality, and promote green technological innovation [18]. This integrates external governance mechanisms into the ESG innovation framework.

2.2. ESG and Low-Carbon Technological Innovation

Research on the relationship between ESG and low-carbon technological innovation, a core subset of green innovation with explicit emission-reduction objectives, has grown rapidly but remains characterized by two unresolved debates.
The first debate concerns the direction of the effect. The promotion view holds that ESG drives low-carbon innovation through signaling and resource integration mechanisms. Under the “Dual Control Targets,” firms are found to increasingly rely on technology introduction as a key innovation strategy [19]. ESG ratings are shown to promote green transformation more strongly in heavily polluting and competitive industries by easing financing constraints, reducing risk, and stimulating green innovation to sustain earnings [5]. In contrast, proponents of the limitation perspective argue that the stimulative effect of ESG on low-carbon innovation is limited by industry boundaries. ESG is found to promote low-carbon innovation only in certain sectors. Studies also note that firms may pursue a strategy of “increasing quantity while reducing quality” in green patenting to inflate ESG scores, raising concerns about the substantiveness of ESG-driven innovation [7].
The second debate concerns the mechanisms of mediating. Existing studies have identified financing constraints and R&D investment as mediators but have insufficiently examined synergistic multi-channel effects. Multi-period difference-in-differences analyses show that higher ESG ratings promote green transformation by easing financing constraints and reducing agency costs. However, these studies typically do not distinguish low-carbon innovation from general green innovation. Further empirical work finds that ESG performance promotes corporate innovation by improving employee innovation efficiency and strengthening risk-taking propensity. However, the existing literature largely fails to incorporate government support, a critical external resource particularly in emerging economies where public funding plays a substantial role in low-carbon R&D. Nor does it systematically analyze heterogeneity across firms with different ownership types, technological capabilities, and scales, which limits the generalizability of existing conclusions.
It is important to note that although the environmental dimension of ESG is conceptually related to low-carbon technological innovation, the two constructs differ fundamentally. ESG primarily captures firms’ compliance and governance performance in environmental responsibility and information disclosure, whereas low-carbon technological innovation reflects substantive R&D activities aimed at emission reduction. Therefore, the impact of ESG on low-carbon innovation should not be interpreted as a mere indicator overlap. Rather, ESG indirectly promotes innovation through mechanisms such as resource reallocation, the alleviation of financing constraints, and the attraction of government support.

2.3. Research Gaps and Marginal Contributions

The existing literature has three major limitations. First, the majority of studies treat green innovation as an undifferentiated construct, without isolating low-carbon technological innovation as a distinct subset with explicit emission-reduction objectives. Nor do these studies further distinguish substantive innovation from strategic innovation, making it difficult to reveal the genuine effect of ESG in a carbon-constrained setting. Second, mechanism analyses tend to focus on a single mediating channel, such as financing constraints or government support [3], without systematically examining how multiple mechanisms may jointly shape the ESG and low-carbon innovation relationship. Third, empirical evidence on heterogeneous effects remains limited, with insufficient attention to how ownership structure, technology intensity, and firm size may condition the ESG and low-carbon innovation relationship, leaving unclear whether this impact is structurally differentiated across firm types.
To address these gaps, this study makes three main contributions. First, it separates low-carbon technological innovation from the broader concept of green innovation and further distinguishes substantive from strategic innovation while incorporating joint green patent indicators, providing a more refined measurement framework that directly aligns with carbon reduction objectives. Second, it develops a dual-mediation framework using the SA index to measure financing constraints and government subsidies to capture government support, identifying two parallel transmission channels through which ESG influences the quality and patterns of low-carbon technological innovation. Third, it systematically examines heterogeneous effects across ownership structure, technology intensity, and firm size, offering more targeted evidence regarding the economic consequences of ESG practices.

3. Theoretical Analysis and Hypotheses

3.1. Positive Impact of ESG Performance on Low-Carbon Technological Innovation

Low-carbon technological innovation is central to corporate green transition under the “dual carbon” goals, aiming to reduce carbon intensity and improve resource efficiency through technological R&D and application. ESG can enhance corporate competitive advantage by improving reputation, attracting high-quality talent, alleviating financing constraints, and increasing innovation investment [20], creating a natural coupling between ESG and institutional innovation outcomes in corporate sustainable development. Yet the existing ESG literature has largely focused on information transmission, financing costs, and green innovation as a whole [21], without disaggregating innovation outcomes. Incorporating low-carbon technological innovation into the analytical framework therefore helps reposition ESG from an external regulatory constraint toward an internal value-creation mechanism and from a compliance instrument toward a catalyst for structural transformation. Drawing on resource dependence theory, stakeholder theory, and principal-agent theory, this study constructs an integrated analytical framework for understanding how ESG performance influences corporate low-carbon technological innovation.
From an environmental perspective, resource dependence theory posits that firms must secure critical external resources to sustain survival and development, while environmental performance within the ESG framework serves as an important conduit for accessing green resources. On the one hand, with the tightening of regulatory policies—such as the expansion of the national carbon market and the implementation of environmental protection tax laws—firms face dual pressures of rising compliance costs and constrained resource access. In response, firms need to enhance their environmental performance to meet regulatory requirements, thereby gaining access to government green subsidies, green credit, and recognition from internal stakeholders [22]. On the other hand, the improved environmental information disclosure regime encourages investors to allocate capital toward environmentally compliant firms. By disclosing ESG-related information such as carbon footprints and pollution abatement measures, enterprises can mitigate information asymmetry with investors and alleviate financial constraints on innovation.
From a social perspective, stakeholder theory holds that firms must respond to the demands of consumers, communities, and non-governmental organizations to maintain legitimacy, and ESG social performance is key to building stakeholder trust. Rising consumer demand for green products compels firms to embed low-carbon technologies into production processes, while community and public environmental oversight pressures encourage firms to integrate social responsibility with innovation. Moreover, as core stakeholders, employees play a significant and positive role in shaping innovation performance. Firms that fulfill employee-related social responsibilities can enhance innovation outcomes through improved employee stability, labor productivity, and the share of technical and highly educated personnel [23].
From a governance perspective, principal–agent theory suggests that conflicts of interest between managers and shareholders may induce short-term behavior, while ESG governance performance helps mitigate this problem through improved institutional design, providing a governance foundation for low-carbon technological innovation. Effective internal corporate governance can reduce agency costs, curb managerial opportunism, and foster a stronger orientation toward long-term investment, ultimately supporting sustainable and high-quality corporate development [24]. A sound governance structure also helps reduce information asymmetry between firms and external stakeholders, enhances transparency, and lowers monitoring costs for external regulators, thereby activating external oversight functions and ensuring that corporate decisions are more closely aligned with the interests of shareholders and other stakeholders. Continuous improvement in corporate governance therefore constitutes a key driver of low-carbon technological innovation.
In summary, ESG performance drives low-carbon technological innovation through resource acquisition (E), legitimacy building (S), and institutional guarantee (G). Based on the above analysis, this study proposes the following hypothesis.
H1. 
ESG performance significantly and positively stimulates corporate low-carbon technological innovation.

3.2. Mediating Role of Financing Constraints

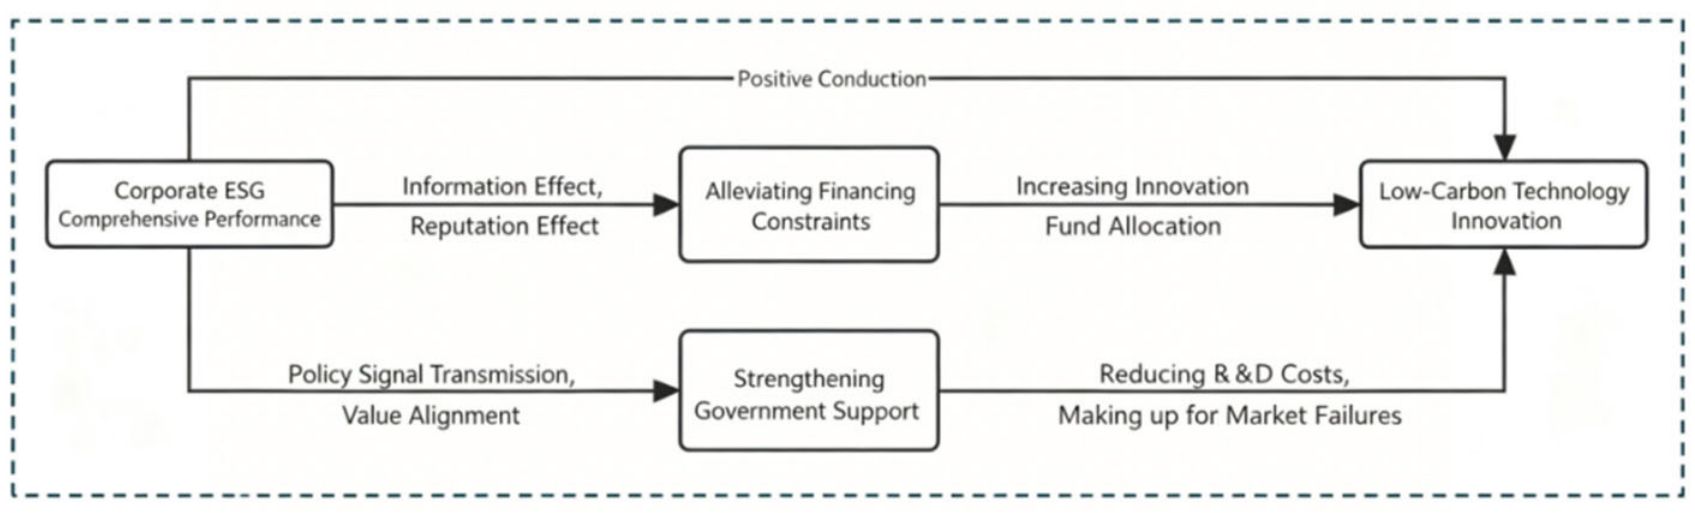
Financing constraints constitute a primary barrier to firms’ low-carbon technological innovation. Compared with conventional innovation activities, low-carbon R&D is characterized by longer investment horizons, higher risk, and stronger asset specificity, which lead investors to demand higher risk premiums. As a result, firms face significantly greater difficulty in obtaining external financing for such projects than for general investments [3], while the relaxation of financing constraints has been shown to significantly promote corporate innovation output [25]. ESG performance, however, provides a critical pathway for alleviating financing constraints and optimizing the allocation of innovation capital through both information and reputation effects [26,27]. The specific mechanisms are as follows.
From the perspective of the information effect, ESG disclosure helps reduce information asymmetry between firms and capital providers. Traditional financial reports often fail to capture firms’ environmental risks and long-term sustainability potential. In contrast, ESG reports provide non-financial information regarding carbon emissions, green supply chain management, and environmental compliance, enabling investors to evaluate firms’ long-term risk profiles more accurately [28]. Firms with superior ESG performance generally exhibit lower environmental violation risks and lower default probabilities than those with poor ESG performance. Consequently, financial institutions are more willing to extend green credit at lower interest rates to such firms [29]. This informational role is especially salient in equity markets. Banks and other debt providers can monitor firms’ actual cash-flow positions in real time through deposit, settlement, and custodial operations and mitigate credit risk through collateral, repayment covenants, and third-party guarantees. External shareholders, by contrast, rely primarily on periodically published annual reports and other public disclosures, making their information channels considerably more limited. Equity investors therefore depend more heavily on ESG disclosures to form comprehensive judgments about firms’ long-term operational risks and growth potential [27].
From the reputation-effect perspective, strong ESG performance helps firms accumulate green reputational capital and improve financing accessibility. By actively fulfilling social responsibilities, firms cultivate a sustainable corporate image in the market. This reputational capital not only attracts investment from emerging green financial instruments such as ESG-dedicated funds and green insurance but also strengthens government trust in the firm, facilitating access to policy-oriented financing support. Accordingly, this study proposes the following hypothesis.
H2. 
Financing constraints play a partial mediating role between ESG performance and low-carbon technological innovation. Specifically, ESG performance promotes low-carbon technological innovation by alleviating financing constraints and improving the efficiency of capital allocation for low-carbon R&D.

3.3. Mediating Role of Government Support

Low-carbon technological innovation exhibits typical public-good characteristics. R&D outcomes are easily imitated by competitors, giving rise to free-riding behavior whereby private returns fall below social returns and dampening firms’ incentive to innovate. Market mechanisms alone therefore cannot achieve the socially optimal level of R&D investment, a classic instance of market failure, and government support serves as the primary instrument for correcting this problem. Meanwhile, under the policy orientation of the “dual carbon” goals, ESG performance has become an important signal through which governments screen and select firms for support. Existing research has shown that government subsidies, as a resource-empowering mechanism, can strengthen the positive relationship between corporate ESG performance and sustainable innovation [28].
In designing green policies such as subsidies and tax incentives, governments tend to prioritize firms with high ESG ratings and a demonstrated commitment to environmental and social responsibility. First, governments reduce the cost of low-carbon innovation through direct funding subsidies and tax preferences. In the early stages of low-carbon technological innovation, the high costs and market uncertainty involved require substantial government guidance funding and policy support [30], and empirical evidence confirms that government support significantly affects the quantity of corporate technological innovation, with direct subsidies and tax incentives being the most effective channels [31]. Second, governments amplify the signaling effect of ESG through green certification and policy endorsement, helping firms access additional innovation resources. Research on emissions trading policies shows that such schemes can significantly promote green innovation [32], and when government support extends across the entire innovation chain, synergies among participants can generate higher levels of cooperation and facilitate a more efficient green innovation process [33]. Based on the above analysis, this study proposes the following hypothesis.
H3. 
Government support plays a partial mediating role between corporate ESG performance and low-carbon technological innovation. This study further tests the heterogeneous moderating effect of government support across the environmental (E), social (S), and governance (G) dimensions of ESG.
The overall theoretical mechanism framework is illustrated in Figure 1.

4. Research Design

4.1. Sample and Data

This paper uses annual data of Chinese A-share listed firms from 2009 to 2024. Data cleaning procedures: (1) Delete observations with missing values; (2) Exclude ST, *ST firms; (3) Exclude financial firms; (4) Exclude firms with debt-to-asset ratio > 1 or ≤0; (5) To mitigate the impact of outliers, winsorize all continuous variables at the 1st and 99th percentiles. Data on corporate financing constraints are mainly obtained from the CSMAR database. Green patent data are collected from the China National Intellectual Property Administration (CNIPA). All other financial data are derived from the China Stock Market & Accounting Research (CSMAR) Database.

4.2. Variable Definition

4.2.1. Dependent Variable: Low-Carbon Technological Innovation

Following the method of Li and Zheng [34], we classify low-carbon innovation into substantive low-carbon innovation and strategic low-carbon innovation. Based on the World Intellectual Property Organization (WIPO) Green Inventory, this study further identifies technology fields directly related to greenhouse gas emission reduction from the broader set of green patents, including alternative energy production, transportation energy conservation, energy savings, and nuclear power generation. Green invention patent applications and grants falling under these low-carbon technology IPC codes are used to measure substantive low-carbon innovation (lnGPC1), while green utility model patent applications and grants are used to measure strategic low-carbon innovation (lnGPC2). The sum of the two serves as total low-carbon technological innovation (lnGPC). In addition, green patents jointly applied for and granted in a given year are used to construct a collaborative innovation indicator (lnCO_GPC), which serves as a supplementary dependent variable in the robustness tests. To mitigate the influence of extreme values, all patent counts are transformed by adding one before taking the natural logarithm. All variable definitions and measurement approaches adopted in this research are summarized in Table 1.

4.2.2. Independent Variable: Corporate ESG Performance

The core explanatory variable is corporate ESG performance, measured by the overall ESG score encompassing the environmental, social, and governance dimensions. ESG ratings have been widely adopted as a comprehensive measure of corporate sustainability performance in empirical research on green innovation and corporate behavior [3,4,20]. ESG data are obtained from the Bloomberg database. Bloomberg’s ESG evaluation framework is developed in accordance with internationally recognized standards, including the Global Reporting Initiative (GRI) and the Sustainability Accounting Standards Board (SASB), providing a robust data source for firms, investors, and policymakers. Specifically, the environmental dimension includes indicators related to carbon emissions, energy efficiency, water resource management, waste management, environmental policies, and environmental violations. The social dimension covers employee relations, community engagement, product responsibility, supply chain standards, and diversity and inclusion policies. The governance dimension comprises board structure, shareholder rights, auditing and risk control mechanisms, transparency, and information disclosure. To further ensure the robustness of the empirical results, the ESG ratings provided by Huazheng ESG are also employed in robustness analyses. Compared with international ESG rating systems, Huazheng ESG is developed within China’s regulatory and policy context, with indicators more closely aligned with corporate green development practices in the country.

4.2.3. Control Variables

Furthermore, to control for factors that may influence corporate green and low-carbon technology innovation, this study introduces the following control variables into the model by referring to existing literature [3,35]. Firm-level financial characteristics, including firm size (size), leverage ratio (lev), fixed asset intensity (fixed), return on assets (roa), return on equity (roe), revenue growth rate (growth), and net profit growth rate (net profit growth), capture differences in resource availability, financial health, and growth potential that may affect innovation investment. Corporate governance variables, including managerial shareholding ratio (mshare), proportion of independent directors (indep), and CEO duality (dual), control for internal governance quality that shapes managerial incentives for long-term R&D commitment. Firm age (age), ownership nature (soe), and Tobin’s Q (TobinQ) account for organizational maturity, institutional differences between state-owned and non-state-owned enterprises, and market valuation, respectively.

4.2.4. Mediating Variables

This paper introduces two mediating variables, financing constraints and government support, to examine their roles in the impact of ESG performance on low-carbon technology innovation.
Financing constraints are measured using the SA index proposed by Hadlock and Pierce [36], which is designed to address potential endogeneity issues associated with traditional financial indicators in measuring financing constraints. The index is constructed using two relatively time-invariant and highly exogenous variables: firm size and firm age, with the formula:
SA = −0.737 × Size + 0.043 × Size2 − 0.040 × Age,
where Size is the natural logarithm of a firm’s total assets, and Age is calculated as the observation year minus the year of establishment. Note that the SA index yields negative values for all sample firms (see Table 2, mean = −3.834). More negative values indicate more severe financing constraints. Accordingly, a positive coefficient on the SA index in the mediation model indicates that ESG performance shifts the SA index toward zero, reflecting a reduction in the severity of financing constraints.
Government subsidies have been widely used as a proxy for government support in studies examining the relationship between public policy and corporate innovation [31,32]. Government support (GS) is measured by the amount of government subsidies received by the firm (in ten thousand yuan), specifically the amount recognized in current-period profit and loss as reported in financial statements, transformed by adding one before taking the natural logarithm.
Detailed definitions of all variables are presented in Table 1.

4.3. Model Specification

A multivariate regression model is constructed as Model (1) to examine the impact of corporate ESG performance on low-carbon technological innovation.
lnGPCi,t+1 = α0 + α1PB_ESGi,t + α2Controli,t + μi + λt + εi,t
where i denotes the sample firm and t denotes the year. The dependent variable lnGPC represents the level of corporate low-carbon technology innovation. The dependent variable is led by one period (lnGPCi,t + 1), so that current-period ESG performance is used to explain next-period innovation output. This specification captures the time-lagged nature of ESG’s effect on innovation and structurally mitigates reverse causality, as t + 1 period innovation cannot influence t period ESG performance [3,4]. The explanatory variable PB_ESG is obtained from the ESG rating in the Bloomberg database. Controli,t represents firm-level and industry-level control variables, and µi and λt represent firm fixed effects and year fixed effects, respectively. εi,t is the residual term of the model.

4.4. Analysis of Descriptive Statistics for Core Variables

Table 2 reports the descriptive statistics of the main variables, with a total of 15,212 observations for all variables. The mean value of total low-carbon technological innovation (lnGPC) is 4.169 with a standard deviation of 1.469, indicating notable variation in low-carbon innovation levels across firms. The mean value of substantive low-carbon innovation (lnGPC1) is 3.415, which is higher than that of strategic low-carbon innovation, suggesting that sample firms tend to engage in high-quality green invention patent innovation rather than formalistic strategic patent accumulation. The mean Bloomberg ESG score and Huazheng ESG rating are 31.863 and 74.294, respectively, reflecting a degree of differentiation in corporate ESG performance that provides a sound basis for subsequent analysis. The distributions of control variables, including firm size, leverage ratio, profitability, and governance structure, all fall within reasonable ranges consistent with the typical characteristics of A-share listed companies, with no extreme outliers. Overall, the distribution of the variable data is reasonable, which guarantees the reliability of subsequent empirical analysis.

5. Empirical Results

5.1. Baseline Regression

Table 3 reports the baseline regression results on the relationship between ESG performance and corporate low-carbon technological innovation. Column (1) presents the results without control variables or fixed effects. Column (2) incorporates firm-level control variables. Column (3) further adds two-way fixed effects for firm and year. Column (4) controls for year and industry fixed effects. The results show that the coefficient of the core explanatory variable PB_ESG is significantly positive across all four columns at the 1% statistical level, indicating that improved corporate ESG performance exerts a stable promotional effect on low-carbon technological innovation. Among the control variables, the coefficients of firm size and management shareholding ratio are significantly positive, suggesting that larger firms and those with stronger managerial incentives achieve higher low-carbon innovation output. Leverage ratio and fixed asset ratio show significant effects in certain model specifications, with their overall directions consistent with theoretical expectations.
Overall, the baseline regression results confirm the core hypothesis that improved corporate ESG performance significantly facilitates low-carbon technological innovation. This conclusion remains robust after the progressive inclusion of control variables and multi-dimensional fixed effects.

5.2. Robustness Checks

5.2.1. Replacement of Core Dependent and Independent Variables

To mitigate potential bias arising from reliance on a single-variable specification and to verify the reliability of the baseline regression results, this study conducts robustness tests by replacing both the dependent variable and the core explanatory variable. At the dependent variable level, total low-carbon technological innovation in the baseline model is sequentially replaced by collaborative low-carbon innovation (lnCO_GPC), substantive low-carbon innovation (lnGPC1), and strategic low-carbon innovation (lnGPC2). These three indicators correspond to cross-entity collaborative innovation, high-quality technological R&D, and formalistic patent accumulation, respectively, capturing corporate low-carbon R&D activities from multiple dimensions and enriching the analytical perspective. The regression results show that, after controlling for two-way firm and year fixed effects and all control variables, the coefficients of the core explanatory variable remain significantly positive across all specifications.
At the core explanatory variable level, given that different rating agencies adopt distinct indicator systems and scoring criteria, with Bloomberg ESG scores emphasizing internationally recognized standards while Huazheng ESG ratings are grounded in domestic regulatory frameworks and market conditions and thus more closely aligned with the realities of Chinese listed companies, this study re-estimates the model using Huazheng ESG scores as the alternative explanatory variable. The results show that the coefficient remains statistically significant and positive, confirming that the core conclusion is not sensitive to the choice of ESG data source or measurement standard.
Overall, whether replacing the measurement of low-carbon innovation or adopting ESG ratings from a different institution, the core finding that ESG performance significantly promotes corporate low-carbon technological innovation remains stable, demonstrating the strong reliability of the baseline regression results. The detailed regression results of these robustness tests are presented in Table 4.

5.2.2. Endogeneity Test

Although fixed effects and variable replacement have been employed for robustness testing, potential endogeneity concerns, including reverse causality and omitted variables, may still exist between ESG performance and corporate low-carbon technological innovation. On the one hand, firms that continuously engage in low-carbon innovation and embrace green development principles may in turn receive higher ESG ratings, giving rise to bidirectional causality. On the other hand, unobservable firm characteristics and industry-level policy factors may simultaneously influence both variables, leading to estimation bias. To address these concerns, following Xie and Lv [37], this study adopts the number of broad ESG funds holding the firm’s shares and the corresponding fund shareholding values as instrumental variables. From one perspective, investors can signal their approval or disapproval of a firm’s practices through stock transactions. If a company exhibits poor ESG performance, investors may choose to sell its shares, expressing dissatisfaction with its business conduct. Such behavior affects the firm’s stock price and simultaneously conveys a signal that ESG improvement is needed. From another perspective, ESG funds are unlikely to directly affect corporate low-carbon technological innovation. According to the China Responsible Investment Annual Report 2020, such funds typically seek to improve corporate ESG performance through private engagement with senior management, and fund stock selection is ultimately determined by fund managers’ investment philosophies. For firms, innovation outcomes are primarily driven by R&D capabilities within the relevant technological domain.
To further guard against endogeneity arising from omitted variables or reverse causality, the instrumental variable method is employed for robustness testing. Most existing studies select the industry-average ESG score as an instrumental variable, but this choice may violate the exclusion restriction. From the perspective of instrument validity, the variables adopted in this study satisfy both the relevance and exogeneity requirements. In terms of relevance, broad ESG funds are guided by value investment and responsible investment principles and preferentially allocate capital to firms with superior ESG performance, making fund holdings highly correlated with corporate ESG levels. In terms of exogeneity, these funds influence corporate ESG governance mainly through shareholding and engagement rather than direct intervention in internal low-carbon R&D decisions and thus do not exert a direct effect on low-carbon innovation, satisfying the exogeneity assumption for instrumental variables.
The first-stage model of instrumental variable regression is specified as follows:
PB_ESGi,t = β0 + β1ESGFQi,t + β2Controli,t + μi + λt + εi,t
where PB_ESGi,t denotes the ESG rating of listed firm i in year t, and ESGFQi,t denotes the number of ESG funds holding stocks of firm i in year t. All other variables are consistent with the baseline model. Column (1) of Table 5 reports the first-stage regression results. The coefficient of the number of broad ESG fund holdings is significantly positive, confirming a significant correlation between the instrumental variable and the endogenous independent variable. The Kleibergen-Paap rk Wald F statistic is 9.24, which exceeds the 15% critical value of the Stock-Yogo test, thereby ruling out the weak instrumental variable problem. The Kleibergen-Paap rk LM test is significant at the 1% level, indicating no under-identification issue. Since the model is exactly identified, the over-identification test is not required.
Columns (2) through (5) of Table 5 report the second-stage regression results. After using the instrumental variable to strip out endogeneity interference, the coefficients of ESG on total low-carbon technological innovation, substantive innovation, strategic innovation, and collaborative innovation are all significantly positive at the 1% level, with coefficient signs fully consistent with the baseline regression. This indicates that, after effectively addressing endogeneity concerns, the core conclusion that ESG performance significantly promotes corporate low-carbon technological innovation continues to hold, further confirming the robustness and reliability of the findings.

5.2.3. Propensity Score Matching (PSM) and Entropy Balancing

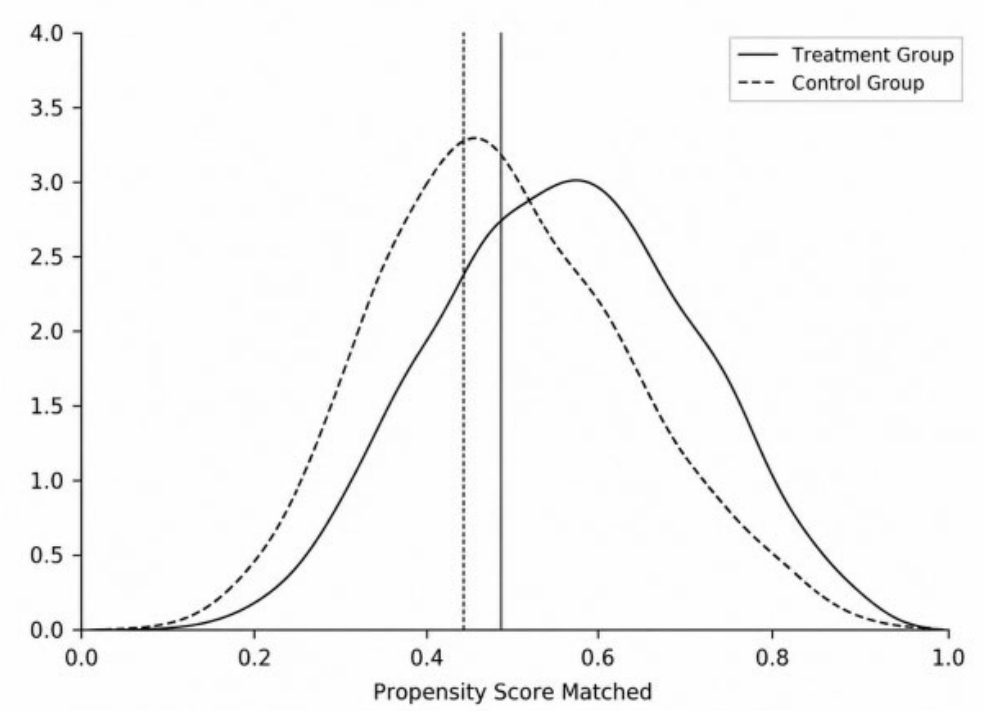
To alleviate sample self-selection bias, this study adopts multiple matching methods for further robustness testing. Samples are divided into a treatment group (high ESG) and a control group (low ESG) based on the mean ESG score. Kernel matching is employed as the primary method, supplemented by entropy balancing for additional verification.
  • Kernel Matching
Kernel matching assigns continuous weights calculated by kernel functions to each observation in the control group, enabling smooth matching of propensity score distributions between the treatment and control groups. Compared with nearest-neighbor matching, this method makes fuller use of sample information and reduces matching variance. This study adopts the Epanechnikov kernel function, with all aforementioned control variables selected as matching covariates. The post-matching balance test results are reported in Table 6.
Overall, the standardized bias of most variables falls below 6% after matching, and t-test results are insignificant, indicating no systematic differences between groups and satisfying the balance requirement. However, the firm age variable performs less well in this matching. Its standardized bias reaches −146.1% before matching, indicating a substantial gap between groups. After kernel matching, the standardized bias decreases to −2.2%, with a corresponding t-test p-value of 0.24, which is no longer statistically significant. Although the bias is greatly reduced, firm age still exhibits the largest original difference and the highest adjustment pressure among all variables. The standardized bias of other variables, including firm size, management shareholding ratio, independent director ratio, and Tobin’s Q, is controlled within a reasonable range after matching, indicating satisfactory matching quality.
Figure 2 presents the common support of propensity scores before and after matching. The treatment and control groups show a high degree of overlap within the common support interval [0.25, 0.75], satisfying the common support assumption of the PSM model and indicating no severe sample truncation.
2.
Entropy Balancing
To further verify the robustness of the matching results and remedy the problem of large original differences in individual variables under kernel matching, entropy balancing is adopted as a supplementary test. Entropy balancing re-weights observations in the control group so that the moment conditions of covariates between the weighted control group and the treatment group meet preset balance standards. This method does not require iterative adjustment of matching parameters and exhibits stronger adaptability to variables with extreme differences. Given the large number of covariates in this study, imposing simultaneous constraints on both the first-order moment (mean) and the second-order central moment (variance) of all covariates leads to non-convergence in the optimization process. Following mainstream practice for handling high-dimensional covariates, this study imposes balance constraints on the first-order moment (mean) only and solves for optimal weights by maximizing information entropy. The regression results after kernel matching and entropy balancing are reported in Table 7. The coefficients of ESG on low-carbon technological innovation are all positive and significant at the 1% level, confirming that the core conclusion that ESG performance significantly promotes corporate low-carbon technological innovation remains robust across different sample balancing techniques. Meanwhile, entropy balancing effectively mitigates the interference caused by large original differences in variables such as firm age.
3.
Bootstrap Test
The Bootstrap method is adopted to test the average treatment effect (ATT). The kernel matching results show that ATT = 0.333 with a z-value of 8.28 (p < 0.001), indicating that the low-carbon technological innovation level of enterprises with high ESG performance is significantly higher than that of enterprises with low ESG performance. Regression based on matched samples shows that the coefficient of ESG on lnGPC is 0.1274 and significant at the 1% level, which is consistent with the baseline regression results.

6. Further Analysis

6.1. Sub-Dimensional Test of ESG

To further explore the differentiated effects of the three ESG sub-dimensions on low-carbon technological innovation, this study decomposes the overall ESG score into the environmental, social, and governance dimensions and examines their respective impacts. The regression results reported in Table 8 reveal notable structural differences. The environmental dimension exerts a significant positive effect on low-carbon innovation, serving as the core driving force behind corporate green technology R&D. The social dimension also shows a positive influence on low-carbon innovation. The governance dimension, however, does not yield a statistically significant direct effect. These findings suggest that the enabling role of ESG practices in corporate low-carbon transformation currently operates primarily through environmental and social responsibility, while governance mechanisms have not yet become an effective channel for promoting low-carbon innovation. This provides direction for firms seeking to optimize the structure of their ESG efforts. While maintaining a focus on environmental and social responsibilities, firms should further strengthen governance mechanisms and embed low-carbon objectives more deeply into corporate decision-making systems, so as to fully unlock the potential of the governance dimension in incentivizing green innovation.
In summary, the promotional effect of ESG on low-carbon technological innovation is primarily reflected in the environmental and social dimensions, with the environmental dimension playing a particularly prominent role, while the governance dimension shows no significant effect. This heterogeneous finding suggests that in promoting corporate low-carbon transformation, greater attention should be directed toward the fulfillment of environmental and social responsibilities, whereas governance mechanisms require further alignment with low-carbon innovation objectives.

6.2. Mechanism Tests

6.2.1. Mediating Effect of Financing Constraints

  • Theoretical Transmission Mechanism
As discussed in Section 3.2, ESG performance is expected to alleviate financing constraints by improving information transparency and strengthening firms’ reputation in capital markets, thereby facilitating greater investment in low-carbon technological innovation. To empirically verify whether financing constraints constitute an important transmission channel linking ESG performance and low-carbon technological innovation, this study follows Ju et al. [38] and estimates the following mediation model:
lnGP C i , t + 1   =   γ 0 + γ 1 PB _ ES G i , t + γ 2 M i , t + γ j Control s i , t + μ i + λ t + ε i , t
where the mediating variable M represents financing constraints and government support. Controls refer to all control variables. μ i and λ t denote firm fixed effects and year fixed effects, respectively. ε i , t is the random disturbance term. The Sobel Z test and Bootstrap sampling with 5000 iterations are adopted to test the significance of indirect effects. The mediating effect is confirmed to be significant if the 95% Bootstrap confidence interval does not contain 0 and the p-value of the Sobel test is less than 0.05.
2.
Empirical Result Analysis
To further clarify the internal mechanisms through which ESG performance affects low-carbon technological innovation, this study takes financing constraints (SA) as the mediating variable and tests the transmission paths of overall ESG and its sub-dimensions. The mediation test results are reported in Table 9.
SA plays a significant partial mediating role between overall ESG performance and low-carbon innovation. Stronger ESG performance is associated with a less negative SA index (i.e., weaker financing constraints), which in turn facilitates low-carbon technological innovation. After controlling for SA, the direct effect of ESG on low-carbon innovation remains significant, suggesting that other direct transmission channels also exist. This mediating path is verified as robust by both the Sobel test and the Bootstrap method.
At the sub-dimension level, the mediating role of financing constraints varies considerably. Environmental performance significantly alleviates financing constraints, which in turn promotes low-carbon innovation, and this indirect path coexists with a significant direct effect, confirming partial mediation. A similar pattern holds for the social dimension, where active social responsibility fulfillment also reduces financing constraints and thereby facilitates low-carbon innovation, with both the indirect and direct effects reaching strong statistical significance. The governance dimension, by contrast, shows no significant impact on financing constraints, nor does it exert a significant direct effect on low-carbon innovation after controlling for SA, indicating that the mediating mechanism does not operate through this channel.
In summary, the mediating effect of financing constraints is primarily reflected in overall ESG, environmental, and social dimensions. Firms alleviate financing constraints by improving environmental performance and fulfilling social responsibilities, thereby promoting low-carbon technological innovation. The transmission path through the governance dimension, however, does not pass the robustness tests.

6.2.2. Mediating Effect of Government Support

  • Theoretical Transmission Mechanism
As discussed in Section 3.3, firms with superior ESG performance are more likely to obtain government support, which helps offset the high costs and uncertainties associated with low-carbon R&D. To examine whether government support serves as another important transmission channel through which ESG performance promotes low-carbon technological innovation, the mediation model specified in Equation (3) is estimated using government support as the mediating variable.
2.
Empirical Results
Consistent with the baseline regression results, the overall effects of comprehensive ESG, environmental and social dimensions on low-carbon innovation are significantly positive, while the direct effect of the governance dimension is insignificant. This section further employs mediation tests to explore the transmission mechanism of government support. Due to missing government subsidy data for some firms, the sample size is slightly reduced. The results are presented in Table 10.
For overall ESG performance, corporate ESG ratings significantly raise the level of government support received, and government support in turn exerts a significant positive effect on low-carbon innovation. After controlling for government support, the direct impact of ESG performance remains statistically significant. Relevant tests confirm that government support plays a significant partial mediating role between overall ESG performance and low-carbon technological innovation, validating Hypothesis 3.
At the sub-dimension level, the mediating role of government support exhibits clear heterogeneity. In the environmental dimension, superior environmental performance significantly increases access to government support, which continues to drive low-carbon innovation, and the direct effect remains significant after accounting for government support. The Sobel test yields a Z-value of 2.16 (p < 0.05), and the bias-corrected Bootstrap 95% confidence interval excludes zero, confirming significant partial mediation. A similar pattern is observed in the social dimension, where active social responsibility fulfillment helps firms obtain greater government support, further promoting low-carbon innovation, with the direct effect also remaining significant. In the governance dimension, however, although corporate governance shows a weak positive association with government support, its direct effect on low-carbon innovation becomes insignificant after the inclusion of the government support variable. Both the Sobel test and Bootstrap results indicate that the mediating effect does not hold for this channel.
In summary, the mediating effect of government support is primarily reflected in the environmental and social dimensions. Firms that improve environmental performance and fulfill social responsibilities are more likely to obtain preferential government resources, which in turn advances low-carbon technological innovation. The transmission path through the governance dimension, by contrast, does not receive robust empirical support.

6.3. Heterogeneity Analysis

6.3.1. Ownership Type

Differences in ownership structure often lead to substantial variations in corporate behavior and managerial practices. In general, state-owned enterprises (SOEs) tend to assume stronger responsibilities for sustainable development and are expected to play a leading role in promoting environmental and social objectives. Such institutional characteristics may shape firms’ ESG orientation and, consequently, influence their low-carbon technological innovation activities. To further investigate whether the impact of ESG performance on low-carbon technological innovation varies across ownership structures, the sample is divided into SOEs and non-SOEs for subgroup regressions, and an interaction term between ESG performance and state ownership (SOE) is introduced into the full-sample model. The results are reported in Columns (1) and (2) of Table 11.
The subgroup regression results indicate that ESG performance significantly promotes low-carbon technological innovation in both SOEs and non-SOEs, suggesting that improved ESG performance contributes to higher levels of low-carbon innovation regardless of ownership type. This implies that ESG practices can effectively stimulate low-carbon R&D activities by enhancing corporate reputation, improving resource allocation efficiency, and strengthening stakeholder trust. To avoid drawing conclusions solely from differences in subgroup coefficients, this study further conducts a formal heterogeneity test by incorporating the interaction term. The estimated coefficient of PB_ESG × SOE is 0.0112 and significant at the 1% level, indicating that state ownership positively moderates the relationship between ESG performance and low-carbon technological innovation. The SUEST test yields a p-value of 0.0738, significant at the 10% level, providing additional evidence that the effect of ESG performance differs significantly across ownership types.
These findings suggest that the advantages associated with ESG performance are more readily translated into low-carbon innovation outcomes in SOEs than in non-SOEs. One possible explanation is that SOEs bear greater responsibilities for environmental governance and green transformation. Under China’s “dual carbon” goals, they are subject to stronger policy guidance and public scrutiny, providing stronger incentives to embed ESG principles into corporate development strategies. Furthermore, SOEs generally enjoy broader financing channels, stronger resource acquisition capabilities, and more stable external support systems [39]. Consequently, improvements in ESG performance are more likely to facilitate access to green credit, government subsidies, and innovation-related resources [40], thereby promoting low-carbon technological innovation. Non-SOEs, by contrast, face more severe financing constraints, which largely stem from market imperfections caused by conflicts of interest and information asymmetry between firms and external investors [41] and significantly hinder innovation activities. Ownership structure therefore serves as an important contextual factor moderating the effect of ESG performance on low-carbon technological innovation.

6.3.2. Firm Size

Given the substantial differences in resource endowments, financing capacity, and innovation foundations across firms of different sizes, the impact of ESG performance on low-carbon technological innovation may vary accordingly. Following common practice in the existing literature [42], this study classifies firms into large and small enterprises based on the annual median of firm size (Size). Firms above the median are categorized as large enterprises, and those below are classified as small enterprises. An interaction term between ESG and firm size is further introduced to test whether firm size moderates this relationship. The results are reported in Columns (3) and (4) of Table 11.
The subgroup regression results show that ESG performance promotes low-carbon technological innovation in both large and small firms, although the magnitude of the effect differs considerably. The coefficient of ESG is 0.0239 and significant at the 1% level for large enterprises, whereas the corresponding coefficient for small enterprises is 0.0085 and significant only at the 10% level, suggesting that ESG exerts a stronger innovation-enhancing effect among large firms. To formally assess the statistical significance of this difference, the interaction term PB_ESG × Size is incorporated into the full-sample regression. Its coefficient is 0.0021 and significantly positive at the 1% level, indicating that firm size positively moderates the relationship between ESG performance and low-carbon technological innovation. The SUEST coefficient difference test yields a p-value of 0.0698, significant at the 10% level, further confirming significant heterogeneity across firms of different sizes.
These findings suggest that as firm size increases, ESG advantages are more readily translated into low-carbon innovation outcomes. One possible explanation is that large enterprises generally possess more adequate financial reserves, more sophisticated governance structures, and more mature R&D systems, enabling them to effectively absorb and utilize the resource advantages generated by ESG practices. Moreover, strong ESG performance helps large firms gain greater recognition from capital markets and enhances external financing capacity, thereby providing sustained funding support for low-carbon R&D activities. Large firms are also subject to greater public scrutiny and regulatory pressure, which stimulates them to pursue green innovation as a means of strengthening competitiveness and achieving sustainable development. In contrast, although small firms may also benefit from ESG improvements, their ability to transform ESG advantages into innovation outcomes is often constrained by limited financial resources, insufficient technological capabilities, and lower risk-bearing capacity. Therefore, the larger the firm size, the more pronounced the marginal effect of ESG in promoting low-carbon technological innovation.

6.3.3. Pollution Intensity

In the context of sustainable and high-quality development, industries face varying degrees of environmental regulation, public scrutiny, and carbon-reduction responsibilities. Heavily polluting and lightly polluting firms therefore differ in both the motivation for and constraints on ESG transformation and low-carbon innovation. Following the Industry Classification Catalogue for Environmental Verification of Listed Companies issued by the China Securities Regulatory Commission (CSRC), the 2012 CSRC industry classification standard, and the latest industry classification guidelines of the China Association for Public Companies, this study reclassifies industries to ensure a scientifically rigorous grouping scheme. The results are presented in Columns (5) and (6) of Table 12.
The subgroup regression results reveal that ESG performance significantly promotes low-carbon technological innovation in both heavily polluting and lightly polluting industries, indicating that ESG practices can stimulate innovation under different environmental regulatory conditions. To further examine whether industry pollution intensity moderates the ESG–innovation relationship, an interaction term between ESG performance and the dummy variable for heavily polluting industries (HP) is included in the full-sample regression. The coefficient on PB_ESG × HP is 0.0059 and significant at the 5% level, suggesting that pollution intensity positively moderates the impact of ESG performance on low-carbon technological innovation. The SUEST coefficient difference test yields a p-value of 0.0049, significant at the 1% level, providing strong evidence of heterogeneity across industries with different pollution characteristics.
These findings indicate that ESG performance exerts a stronger innovation-promoting effect in heavily polluting industries than in lightly polluting industries. One possible explanation is that heavily polluting firms face stricter environmental regulations, greater emission reduction pressure, and more intensive public supervision. These firms must pursue technological innovation to achieve green transformation and meet both policy requirements and market expectations. When ESG performance improves, such firms are better positioned to signal their commitment to green development to governments, investors, and the public, thereby facilitating access to green financing, policy support, and market recognition, which further strengthens the incentive for low-carbon technological innovation. ESG advantages are therefore more readily translated into tangible innovation outcomes in industries subject to stronger environmental regulatory pressure.

6.3.4. Technology Intensity

The effectiveness of ESG performance in promoting low-carbon technological innovation may also vary across firms with different technological characteristics. Firms in technology-intensive industries generally possess stronger R&D capabilities and greater innovation capacity, whereas non-technology-intensive firms often rely more heavily on external support to enhance innovation performance. Under the requirements of energy conservation and emission reduction, firms with weaker technological foundations may be more inclined to adopt ESG strategies to reduce their environmental impact and drive low-carbon technological innovation. The results are reported in Columns (7) and (8) of Table 12.
The subgroup regression results show that ESG performance significantly promotes low-carbon technological innovation in non-technology-intensive firms, while its effect is statistically insignificant in technology-intensive firms, suggesting that firm technological characteristics influence the effectiveness of ESG practices. The interaction term PB_ESG × Tech yields a coefficient of −0.0097, significant at the 1% level, indicating that technology intensity negatively moderates the relationship between ESG performance and low-carbon technological innovation. The SUEST coefficient difference test yields a p-value close to zero, further confirming significant differences between the two groups.
These findings suggest that ESG performance has a stronger positive impact on low-carbon technological innovation among non-technology-intensive firms. A possible explanation is that technology-intensive firms already possess substantial R&D foundations, accumulated technological experience, and established innovation routines, so their innovation activities depend primarily on internal capabilities and long-term R&D investment, leaving relatively limited room for ESG-related improvements to generate additional benefits. Non-technology-intensive firms, by contrast, generally face weaker technological foundations and insufficient innovation resources. Improvements in ESG performance can enhance corporate reputation, strengthen stakeholder trust, broaden financing channels, and facilitate access to external support, thereby compensating for resource deficiencies and promoting low-carbon innovation. ESG therefore plays a more pronounced compensatory role in stimulating innovation among firms with relatively weak technological foundations.

7. Conclusions and Policy Implications

7.1. Conclusions

Using panel data from Chinese A-share listed firms over the period 2009 to 2024, this study systematically investigates the impact of corporate ESG performance on low-carbon technological innovation and its underlying mechanisms. The main conclusions are as follows.
First, corporate ESG performance significantly promotes low-carbon technological innovation. Results from baseline regressions, instrumental variable estimations, propensity score matching, and entropy balancing consistently confirm that improvements in ESG performance enhance firms’ low-carbon innovation capabilities. This suggests that ESG is not only an important manifestation of corporate environmental and social responsibility but also a critical driver of green transformation and innovation development. Superior ESG practices improve firms’ resource acquisition capacity, strengthen stakeholder trust, and further facilitate low-carbon R&D activities and innovation output.
Second, financing constraints and government support serve as important transmission channels through which ESG performance affects low-carbon technological innovation. Mechanism analyses demonstrate that improved ESG performance promotes low-carbon innovation by enhancing firms’ external financing conditions, alleviating financing constraints, and increasing government support. The mitigation of financing constraints provides firms with more stable and sustainable funding for R&D, while government support offers essential policy incentives and resource guarantees for low-carbon technological development. The Sobel and Bootstrap tests further confirm the robustness of these mediating mechanisms.
Third, the environmental and social dimensions of ESG significantly promote low-carbon technological innovation, whereas the governance dimension does not exhibit a statistically significant effect. This indicates that, under the current “dual carbon” strategy, firms’ environmental management capabilities and social responsibility performance are more readily translated into low-carbon innovation advantages, while the innovation-enhancing role of governance mechanisms has yet to be fully realized.
Fourth, the impact of ESG performance on low-carbon technological innovation exhibits significant heterogeneity across firm characteristics. Results from interaction-term regressions and SUEST coefficient difference tests indicate that ownership structure, firm size, industry pollution intensity, and technology intensity all moderate the effectiveness of ESG in promoting low-carbon innovation. Specifically, state-owned enterprises are more likely to translate ESG advantages into low-carbon innovation outcomes than their non-state-owned counterparts. Large firms benefit more from ESG improvements in driving low-carbon innovation, owing to their superior resource integration capabilities and R&D foundations. In heavily polluting industries, stricter environmental regulations and greater pressures for green transformation reinforce the innovation-promoting role of ESG. Moreover, among non-technology-intensive firms, the improvements in financing access and resource acquisition associated with ESG performance more effectively compensate for innovation resource shortages, thereby generating stronger incentives for low-carbon technological innovation.

7.2. Policy Implications

First, the ESG information disclosure system should be continuously improved to give full play to the resource allocation function of the capital market. Regulators should further unify ESG disclosure standards to enhance information transparency and comparability, and guide financial institutions to incorporate ESG performance into credit decision-making procedures, thereby reducing financing costs for firms with strong ESG performance and providing stable funding for low-carbon R&D.
Second, an ESG-oriented green fiscal incentive mechanism should be established. Governments should integrate ESG performance into the evaluation framework for green subsidies, green credit, tax incentives, and other policy tools, intensify targeted support for high-ESG firms, improve the allocation efficiency of fiscal resources, and leverage the catalytic role of government support in low-carbon innovation.
Third, firms should be encouraged to embed ESG governance deeply into their long-term innovation strategies. By incorporating environmental responsibility, social responsibility, and corporate governance requirements into overall development plans and by strengthening internal governance structures, environmental performance, and stakeholder management, firms can build a long-term mechanism for advancing low-carbon technological innovation.
Fourth, differentiated green governance policies should be implemented. For state-owned enterprises, heavily polluting firms, and non-technology-intensive enterprises, where the promotional effect of ESG is more pronounced, policy incentives should be appropriately intensified. For non-state-owned enterprises and technology-intensive firms, priority should be given to refining assessment mechanisms and innovation incentive systems to improve the conversion efficiency from ESG governance to innovation performance.
Finally, the finding that the governance dimension fails to drive low-carbon innovation reveals a disconnection between current corporate governance arrangements and green innovation strategies. Boards of directors should incorporate low-carbon transition objectives into corporate long-term strategic planning and performance appraisal systems, and establish matching incentive and restraint mechanisms to translate governance advantages into strengths in low-carbon technological innovation.
The two transmission mechanisms identified in this study may exhibit different degrees of applicability across institutional settings. The financing constraints channel is likely to have broader cross-national relevance. As discussed in the theoretical framework of this study, improved ESG performance reduces information asymmetry through signaling and broadens financing access through enhanced stakeholder trust, a logic that does not depend on any particular regulatory arrangement. Cross-country evidence confirms that mandatory ESG disclosure significantly improves firms’ information environments [43], providing further support for the generalizability of this channel. Under the EU’s CSRD mandatory disclosure framework, however, ESG reporting becomes a compliance obligation rather than a voluntary choice, which may narrow the differentiation advantage enjoyed by high-ESG firms. In North American markets, where ESG disclosure remains largely voluntary, firms under voluntary regimes exhibit lower overall levels of ESG disclosure than their counterparts under mandatory frameworks [44], yet voluntary disclosure itself may serve as a stronger quality signal, suggesting that the financing constraints channel still operates but potentially through different pathways. The government support channel, by contrast, is more context-dependent. China’s ESG policy framework centers on government-led green credit guidelines, carbon trading pilots, and industrial subsidies, whereby firms’ ESG performance is directly linked to access to policy resources. This mechanism is difficult to replicate in North American markets, where the government plays a relatively limited role. In Southeast Asian emerging economies, ESG disclosure has also been found to positively influence green innovation [45], a directional pattern broadly consistent with that observed in China, possibly because governments in the region are similarly engaged in driving decarbonization transitions. Overall, the financing constraints channel is more likely to hold across institutional contexts, whereas the government support channel more closely reflects China’s distinctive institutional advantages.

7.3. Limitations and Future Research

This study has several limitations. First, low-carbon innovation is measured solely by patent data, which may not fully capture tacit innovations in processes or management. Future studies could integrate multiple indicators to construct a more comprehensive evaluation framework. Second, the sample covers only Chinese A-share listed firms, limiting generalizability. Cross-country comparisons would help assess the external validity of the findings. Third, although instrumental variable estimation, propensity score matching, and entropy balancing are employed, unobserved confounders cannot be entirely ruled out. Future research could exploit quasi-natural experiments, such as mandatory ESG disclosure regulations, to strengthen causal identification. Finally, the model primarily adopts a static analytical framework and does not examine the dynamic evolution of the ESG–innovation relationship or the interactive effects across ESG sub-dimensions. Future research could employ threshold models, dynamic panel specifications, and spatial econometric techniques to uncover nonlinear characteristics and long-run dynamic effects.

Author Contributions

Conceptualization, J.G. and Z.Z.; methodology, J.L.; software, J.Y.; validation, W.Z. and J.L.; formal analysis, J.G.; resources, Z.Z.; data curation, J.Y.; writing—original draft preparation, J.G. and J.L.; writing—review and editing, Z.Z., W.Z. and J.Y.; supervision, Z.Z.; project administration, J.G. All authors have read and agreed to the published version of the manuscript.

Funding

This research was funded by the 2025 Annual Project of the Industry Research Institute for Carbon Peaking and Carbon Neutrality, Shanxi University of Finance and Economics (Project No. SCST2025N06), and the Youth Project of the National Natural Science Foundation of China, entitled “Cost–Benefit Evaluation of Joint Prevention and Control of Air Pollution in the Beijing-Tianjin-Hebei Region and Its Surrounding Areas” (Grant No. 72103113).

Institutional Review Board Statement

Not applicable.

Informed Consent Statement

Not applicable.

Data Availability Statement

Restrictions apply to the availability of these data. The data used in this study were obtained from the National Intellectual Property Administration of China, Bloomberg, the Huazheng ESG Rating Agency, CSMAR, and Wind. These data are available from the corresponding data providers subject to their terms and conditions. The processed data supporting the findings of this study are available from the corresponding author upon reasonable request, subject to the terms and conditions of the data providers.

Conflicts of Interest

The authors declare no conflicts of interest.

References

  1. Wang, H.; Lin, W.F. Environmental responsibility signaling: ESG and green investment attraction. Stat. Res. 2025, 42, 80–92. [Google Scholar]
  2. Friede, G.; Busch, T.; Bassen, A. ESG and Financial Performance: Aggregated Evidence from More than 2000 Empirical Studies. J. Sustain. Financ. Invest. 2015, 5, 210–233. [Google Scholar] [CrossRef]
  3. Fang, X.M.; Hu, D. Corporate ESG performance and innovation: Evidence from A-share listed firms. Econ. Res. J. 2023, 58, 91–106. [Google Scholar]
  4. Hu, J.; Yu, X.R.; Han, Y.M. Can ESG ratings promote corporate green transformation? Evidence from multi-period difference-in-differences. J. Quant. Tech. Econ. 2023, 40, 90–111. [Google Scholar]
  5. Li, J.; Li, S. Environmental protection tax, corporate ESG performance, and green technological innovation. Front. Environ. Sci. 2022, 10, 982132. [Google Scholar] [CrossRef]
  6. Liu, B.; Lu, J.R.; Ju, T. Formalism or substantialism: Green innovation under soft regulation of ESG ratings. Nankai Bus. Rev. 2023, 26, 16–28. [Google Scholar]
  7. Yang, G.C.; Liu, S.Q.; Pan, Y. Research on corporate ESG greenwashing: Manifestations, motivations and governance mechanisms. Foreign Econ. Manag. 2026, 48, 3–22. [Google Scholar]
  8. Zhang, D.M.; Yang, J.; Liu, Z.M. Empirical analysis of the impact of heterogeneous environmental policies on enterprises’ technological innovation capability—Based on two-way fixed effects model. Commer. Res. 2021, 4, 68–74. [Google Scholar]
  9. Zhang, C.Y.; Lv, Y. Green production regulation and enterprise R&D innovation—Influence and mechanism. Bus. Manag. J. 2018, 40, 71–91. [Google Scholar]
  10. Feng, Z.X.; Jia, N.T. Environmental regulation and technological innovation of heterogeneous enterprises—Evidence from listed companies in industrial sectors. Res. Econ. Manag. 2021, 42, 20–34. [Google Scholar]
  11. Zhou, X.R.; Xi, Y.P. Research on the impact of social responsibility performance of listed companies in manufacturing industry on financial performance. Hebei Enterp. 2025, 10, 26–29. [Google Scholar]
  12. Yang, Z.; Ling, H.C.; Chen, J. Economic policy uncertainty, corporate social responsibility and enterprise technological innovation. Stud. Sci. Sci. 2021, 39, 544–555. [Google Scholar]
  13. Wu, X.; Ren, S. Intertemporal interaction effect of green innovation behavior and esg responsibility performance: The moderating role of social supervision. Sci. Technol. Prog. Policy 2025, 42, 83–94. [Google Scholar] [CrossRef]
  14. Wu, Y.X.; Shan, F. ESG responsibility performance, green innovation and enterprise value. Stat. Decis. 2024, 40, 178–182. [Google Scholar]
  15. He, L.F.; Shi, Y.H.; Wang, Q.Y. ESG responsibility performance, executive compensation incentives and sustainability of corporate green innovation. Friends Acc. 2024, 3, 58–65. [Google Scholar]
  16. Shi, X.J.; Wang, A.R. The impact of unique corporate governance mechanisms on enterprise innovation—Global evidence from dual-class share structure of internet companies. Econ. Res. J. 2017, 52, 149–164. [Google Scholar]
  17. Wang, Y.X.; Sun, Z.Y. The impact of corporate governance on innovation strategy: Empirical research based on heterogeneity of R&D expenditure. Res. Financ. Econ. Issues 2018, 12, 113–121. [Google Scholar]
  18. Wu, Y.X.; Dong, L. Impact of capital market opening on technological innovation of China’s listed manufacturing enterprises: Based on mediation effect of corporate governance. Sci. Technol. Manag. Res. 2022, 42, 9–16. [Google Scholar]
  19. Zhang, Y.; Wang, C.Y.; Cai, L.X. Innovation strategy selection of high-energy-consuming enterprises under the goal of dual control of energy consumption: Independent R&D or technology introduction. Res. Econ. Manag. 2023, 44, 89–108. [Google Scholar]
  20. Zhang, S.H.; Zhou, X.J.; Du, J. Research on the impact of ESG management on enterprise innovation from the perspective of enterprise human capital. Sci. Technol. Manag. Res. 2026, 46, 125–133. [Google Scholar]
  21. Ma, L.Y.; Zhang, S.L. Literature review and frontier trend analysis of corporate ESG performance—A knowledge graph analysis based on CNKI and WOS databases. Mon. J. Financ. Account. 2023, 44, 1–8. [Google Scholar]
  22. Xie, X.M.; Zhu, Q.W. Influence mechanism of compliant and strategic green innovation on corporate green image: From the perspective of optimal distinctiveness theory. RD Manag. 2021, 33, 2–14. [Google Scholar]
  23. Zheng, L.L. Corporate employee social responsibility and innovation performance: Mechanism and evidence. Manag. Rev. 2024, 36, 84–97. [Google Scholar]
  24. Wu, G.Z.; You, D.M. Can margin trading and short selling promote corporate green innovation? China Soft Sci. 2022, 4, 172–182. [Google Scholar]
  25. Wan, J.Y.; Zhou, Q.; Xiao, Y. Digital finance, financing constraints and enterprise innovation. Econ. Rev. 2020, 1, 71–83. [Google Scholar]
  26. Sun, H.P.; Zhang, J.Y.; Meng, F.X. The impact of ESG ratings on corporate green innovation. China Popul. Resour. Environ. 2025, 35, 113–126. [Google Scholar]
  27. Wang, Y.Q.; Xie, M. The impact of ESG information disclosure on corporate financing costs—Empirical evidence from China’s A-share listed companies. Nankai Econ. Stud. 2022, 11, 75–94. [Google Scholar]
  28. Li, W.Y.; Wang, L.F.; Wang, Y. Does corporate ESG have an incentive effect on innovation sustainability?—Micro evidence from listed companies. Technol. Econ. 2026, 45, 104–115. [Google Scholar]
  29. Gu, L.L.; Guo, J.L.; Wang, H.Y. Corporate social responsibility, financing constraints and corporate financialization. J. Financ. Res. 2020, 2, 109–127. [Google Scholar]
  30. Wang, Z.G.; Li, L.; Yang, S.L. Research on government low-carbon regulation to guide enterprises’ low-carbon technological innovation under dynamic game. Chin. J. Manag. Sci. 2016, 24, 139–147. [Google Scholar]
  31. Li, W.J.; Li, Y.J.; Li, T.T. How does government support affect technological innovation performance of seed enterprises?—Analysis based on policy, organizational and market heterogeneity. Chin. Rural Econ. 2019, 9, 104–123. [Google Scholar]
  32. Du, G.; Yu, M.; Sun, C. Green innovation effect of emission trading policy on pilot areas and neighboring areas: An analysis based on the spatial econometric model. Energy Policy 2021, 156, 112431. [Google Scholar] [CrossRef]
  33. Eghbali, M.-A.; Rasti-Barzoki, M.; Altmann, J. An evolutionary game-theoretic approach to analysis the green innovation chain dynamics under government policies. Technol. Soc. 2024, 77, 102568. [Google Scholar] [CrossRef]
  34. Li, W.J.; Zheng, M.N. Substantive innovation or strategic innovation? The impact of macro industrial policy on micro enterprise innovation. Econ. Res. J. 2016, 51, 60–73. [Google Scholar]
  35. Lu, J.C.; Jiang, G.S. Can CEO’s green experience promote corporate green innovation? Bus. Manag. J. 2022, 44, 106–121. [Google Scholar]
  36. Hadlock, C.J.; Pierce, R.J. New evidence on measuring financial constraints: Moving beyond the KZ index. Rev. Financ. Stud. 2010, 23, 1909–1940. [Google Scholar] [CrossRef]
  37. Xie, H.J.; Lv, X. Responsible international investment: ESG and China’s OFDI. Econ. Res. J. 2022, 3, 83–99. [Google Scholar]
  38. Ju, X.S.; Lu, D.; Yu, Y.H. Financing constraints, working capital management and sustainability of enterprise innovation. Econ. Res. J. 2013, 48, 4–16. [Google Scholar]
  39. Xu, Z.Y.; Liu, S.Y.; Chen, Y. Research on the impact of data asset information disclosure. Res. Manag. 2026, 1–13. [Google Scholar]
  40. Zhang, Y. Does ESG performance affect enterprise innovation performance? A study on governance and resource effects. Sage Open 2025, 15, 3. [Google Scholar] [CrossRef]
  41. Demirgüç-Kunt, A.; Maksimovic, V. Law, finance, and firm growth. J. Financ. 1998, 53, 2107–2137. [Google Scholar] [CrossRef]
  42. Huang, Y.Y.; Gao, L.; Wang, S.G. The credit incentive effect of social insurance contributions in China: Empirical evidence from bank-insurance interaction. J. Quant. Tech. Econ. 2025, 42, 199–220. [Google Scholar]
  43. Krueger, P.; Sautner, Z.; Tang, D.Y.; Zhong, R. The Effects of Mandatory ESG Disclosure Around the World. J. Account. Res. 2024, 62, 1795–1847. [Google Scholar] [CrossRef]
  44. Rezaee, Z.; Homayoun, S.; Poursoleyman, E.; Rezaee, N.J. Comparative Analysis of Environmental, Social, and Governance Disclosures. Glob. Financ. J. 2023, 55, 100804. [Google Scholar] [CrossRef]
  45. Tripopsakul, S. ESG Practices, Green Innovation, and Financial Performance: Panel Evidence from ASEAN Firms. J. Risk Financ. Manag. 2025, 18, 467. [Google Scholar] [CrossRef]
Figure 1. Mechanism framework for the impact of ESG performance on corporate low-carbon technological innovation.
Sustainability 18 06849 g001
Figure 2. Kernel Density Plot of Propensity Scores after Propensity Score Matching.
Sustainability 18 06849 g002
Table 1. The indicator system.
Variable CategoryVariable NameMeasurement Method
Dependent Variable
Total low-carbon technological innovationlnGPCNatural logarithm of (total applications and authorizations of low-carbon patents + 1)
Substantive low-carbon innovationlnGPC1Natural logarithm of (applications and authorizations of low-carbon invention patents + 1)
Strategic low-carbon innovationlnGPC2Natural logarithm of (applications and authorizations of low-carbon utility model patents + 1)
Collaborative innovationlnCO_GPCNatural logarithm of (joint green patents + substantive innovation + 1)
Independent Variable
Corporate ESG performancePB_ESGOverall ESG score from Bloomberg Database
Huazheng ESG performanceHZ_ESGOverall ESG score from Huazheng Index
Mediating Variable
Financing constraintsSASA index
Government supportGSNatural logarithm of (total government subsidies + 1)
Control Variable
Firm sizesizeNatural logarithm of total assets
Asset-liability ratiolevTotal ending liabilities/Total assets
Fixed asset ratiofixedFixed assets/Total assets
Operating revenue growth rategrowth(Current operating revenue − Previous operating revenue)/Previous operating revenue
Net profit growth ratenet profit growth(Current net profit − Previous net profit)/Previous net profit
Management shareholding ratiomshareNumber of shares held by management/Total shares of the company
Independent director ratioindepNumber of independent directors/Total number of board members
Firm ageageObservation year − Establishment year + 1
Return on assetsroaNet profit/Average total assets
Return on equityroeNet profit/Average total owner’s equity
Board dualitydualEquals 1 if the chairman concurrently serves as general manager; otherwise equals 2
Ownership naturesoeEquals 1 for state-owned enterprises; equals 0 for non-state-owned enterprises
Tobin’s QTobinQMarket value/Total assets
Table 2. Descriptive statistics.
VariableObs.MeanStd. Dev.MinMax
lnGPC15,2124.1691.469 1.386 8.198
lnGPC115,2123.4151.577 0.693 7.501
lnGPC215,2120.6151.233 0.000 5.455
lnCO_GPC15,2121.8500.740 0.870 4.966
PB_ESG15,21231.863 11.359 11.570 63.313
HZ_ESG15,21274.294 5.659 57.180 88.050
SA15,212−3.834 0.299 −4.555 −2.860
GS15,21216.131 3.240 0.000 20.684
size15,21222.972 1.381 20.116 26.895
lev15,2120.462 0.205 0.059 0.928
fixed15,2120.231 0.174 0.002 0.736
growth15,2120.164 0.401 −0.521 2.601
Net profit growth15,212−0.215 3.326 −21.741 11.760
mshare15,2120.079 0.156 0.000 0.660
indep15,2120.376 0.055 0.333 0.571
age15,21210.500 4.610 3.000 18.000
roa15,2120.049 0.066 −0.191 0.255
roe15,2120.089 0.149 −0.682 0.519
dual15,2121.773 0.419 1.000 2.000
soe15,2120.486 0.500 0.000 1.000
TobinQ15,2121.981 1.354 0.801 8.511
Table 3. Baseline regression results.
Variable(1)
lnGPC
(2)
lnGPC
(3)
lnGPC
(4)
lnGPC
PB_ESG0.0120 ***0.0175 ***0.0039 **0.0094 ***
(3.5501)(4.8854)(2.0347)(3.6678)
size0.5414 ***0.5169 ***0.5154 ***0.6481 ***
(13.0945)(12.3098)(12.5171)(22.3763)
lev0.6606 ***0.6829 ***0.13460.0824
(3.297)(3.4007)(0.7374)(0.5144)
fixed−0.7700 ***−0.7314 ***−0.0408−0.1803
(−3.7845)(−3.5851)(−0.2001)(−1.0211)
growth−0.0186−0.0449−0.0567 **−0.0838 **
(−0.4066)(−0.9615)(−2.3271)(−2.3156)
net profit growth0.00670.0076 *0.00180.0017
(1.4539)(1.6708)(0.6963)(0.4536)
mshare0.5268 **0.5304 **0.8637 ***0.4680 **
(2.3525)(2.3626)(3.2136)(2.4830)
indep−0.0715−0.0597−0.0024−0.0529
(−0.1391)(−0.1161)(−0.0073)(−0.1460)
age−0.01330.0120−0.0578 ***−0.0090
(−1.4781)(1.2286)(−8.1079)(−1.1786)
roa0.09920.00060.8941 *0.1484
(0.1183)(0.0007)(1.9267)(0.2369)
roe0.05530.0525−0.22860.3031
(0.1645)(0.1552)(−1.4062)(1.3203)
dual−0.1017−0.1005−0.0460−0.0159
(−1.5045)(−1.4862)(−1.1978)(−0.3130)
soe−0.0850−0.07600.11550.2420 ***
(−1.0741)(−0.9619)(1.1288)(3.8205)
TobinQ0.0421 **0.0374 *0.00610.0131
(1.9862)(1.6620)(0.4964)(0.7736)
Constant0.0120 ***0.0175 ***0.0039 **0.0094 ***
(3.5501)(4.8854)(2.0347)(3.6680)
Year NOYESYESYES
Firm NONOYESNO
industryNONONOYES
N15,21215,21215,21215,212
Adj R20.289850.304890.470000.57744
Notes: t-statistics based on standard errors clustered at the firm level are reported in parentheses. *** p < 0.01, ** p < 0.05, and * p < 0.1.
Table 4. Robustness tests by replacing dependent and independent variables.
Variables(1)(2)(3)(4)
lnGPClnCO_GPClnGPC1lnGPC2
HZ_ESG0.0034 *
(1.7085)
PB_ESG 0.0040 **0.0046 **0.0105 ***
(2.0261)(2.1637)(4.8539)
size0.5117 ***0.2910 ***0.4953 ***0.2639 ***
(14.5417)(11.2918)(11.4629)(6.6387)
lev0.15840.11580.08590.0714
(1.1106)(1.0293)(0.4485)(0.5251)
fixed−0.2232−0.06620.1734−0.0071
(−1.3249)(−0.5862)(0.7691)(−0.0318)
growth−0.0807 ***−0.0459 **−0.0485 *−0.0248
(−3.9780)(−2.1954)(−1.8871)(−1.1458)
net profit growth0.0036 *0.00370.0004−0.0004
(1.7747)(1.5564)(0.1481)(−0.1590)
mshare0.4707 ***0.2417 **0.7084 ***0.4237 *
(2.7154)(2.4486)(2.6845)(1.8139)
indep−0.24660.14280.12400.2312
(−0.8850)(0.4980)(0.3564)(0.7556)
age−0.0529 ***0.0088−0.0486 ***−0.0289 ***
(−9.4690)(1.6248)(−6.4914)(−4.7967)
roa0.3794−0.14110.70930.4248
(0.9941)(−0.3367)(1.4115)(1.2017)
roe−0.0838−0.0271−0.1703−0.0478
(−0.6061)(−0.1342)(−0.9091)(−0.3616)
dual−0.0537 *−0.02660.0027−0.0112
(−1.6610)(−0.7427)(0.0644)(−0.3029)
soe0.03130.03260.1106−0.0483
(0.3676)(0.8911)(1.0503)(−0.4825)
TobinQ0.01280.01300.00380.0153
(1.3108)(1.2897)(0.2983)(1.5568)
Constant−7.7405 ***−5.3683 ***−8.4590 ***−5.6976 ***
(−8.9828)(−8.9315)(−7.9484)(−6.0675)
Year YESYESYESYES
Firm YESYESYESYES
N15,21215,21215,21215,212
Adj R20.49990.27410.39550.1757
Notes: t-statistics based on standard errors clustered at the firm level are reported in parentheses. *** p < 0.01, ** p < 0.05, and * p < 0.1.
Table 5. Endogeneity tests: instrumental variable method.
Variables(1)(2)(3)(4)(5)
PB_ESGlnGPClnGPC1lnGPC2lnCO_GPC
ESGFQ0.0430 ***
(3.0445)
PB_ESG 0.5365 ***0.5443 ***0.3241 ***0.1802 ***
(2.9141)(3.0682)(3.3071)(2.6578)
ControlYesYesYesYesYes
Year YesYesYesYesYes
Firm YesYesYesYesYes
Kleibergen-Paap rk Wald F9.24
N15,21215,21215,21215,21215,212
Notes: t-statistics based on standard errors clustered at the firm level are reported in parentheses. *** p < 0.01.
Table 6. Balance test of PSM.
VariableTreatmentMeanSd.t-Test
ControlTreatt-Valuep-Value
sizeUnmatched23.929023.081071.834.550.00
matched23.925023.9900−5.51.070.28
levUnmatched0.48960.4708−0.7−0.370.71
matched0.48970.46601.91.270.21
fixedUnmatched0.23940.22856.43.080.00
matched0.23940.23154.72.010.06
growthUnmatched0.16180.15970.60.310.76
matched0.16190.1630−0.3−0.200.84
net profit growthUnmatched−0.0755−0.17543.21.530.13
matched−0.0753−0.0574−0.6−0.290.77
mshareUnmatched0.06100.0729−8.5−4.090.00
matched0.06110.05891.60.800.43
indepUnmatched0.37930.372811.45.490.00
matched0.37910.37674.41.930.05
ageUnmatched6.413411.1230−146.1−69.960.00
matched6.41916.4897−2.2−1.170.24
roaUnmatched0.04870.0496−1.4−0.660.51
matched0.04880.04791.30.610.54
roeUnmatched0.09600.09470.90.450.65
matched0.09620.09600.10.050.96
dualUnmatched1.78211.7848−0.7−0.320.75
matched1.78241.7929−2.6−1.220.22
indepUnmatched0.52090.51890.40.190.85
matched0.52140.5364−3.0−1.420.16
TobinQUnmatched1.84311.9979−11.8−5.650.00
matched1.84341.8550−0.9−0.370.71
Table 7. Regression results after Kernel matching and Entropy Balancing weighting.
Variable(1)(2)
Kernel Matching (Baseline)Entropy Balancing (Robustness)
PB_ESG0.1274 ***0.0236 ***
(0.0392)(4.734)
size0.5562 ***0.4149 ***
(0.0338)(4.8114)
lev0.43649 ***0.8247 ***
(0.1654)(2.6114)
fixed−0.7461 ***−0.3732
(0.1787)(−1.4045)
growth−0.0300−0.0229
(0.0366)(−0.2773)
net profit growth0.0069 *0.0037
(0.0037)(0.4255)
mshare0.5180 ***0.6147 **
(0.1683)(2.1286)
indep−0.03690.1251
(0.4354)(0.1546)
age−0.0179 ***0.0361
(0.0055)(1.3320)
roa−0.3751−1.2600
(0.6881)(−0.7461)
roe0.34910.0656
(0.2780)(0.0971)
dual−0.0311−0.2073 **
(−0.7703)(−2.0142)
soe0.2644−0.0782
(1.4273)(−0.6366)
TobinQ0.0423 **−0.0129
(0.0199)(−0.1923)
Constant−9.0621 ***−6.7480 ***
(0.8068)(−3.253)
N92439243
Adj R20.32290.2388
Notes: Robust standard errors are reported in parentheses. *** p < 0.01, ** p < 0.05, and * p < 0.1.
Table 8. Regression results of the impact of ESG sub-dimensions on low-carbon technological innovation.
Variable(1)
lnGPC
(2)
lnGPC
(3)
lnGPC
Environment (E)0.0039 ***
(4.1988)
Society (S) 0.0032 *
(1.9102)
Governance (G) 0.0012
(0.7896)
Constant−8.6674 −8.633384 −8.6022
(−8.38)(−8.30)(−8.36)
ControlYesYesYes
YearYesYesYes
FirmYesYesYes
N15,21215,21215,212
Adj R20.42170.41960.4191
Notes: t-statistics based on standard errors clustered at the firm level are reported in parentheses. *** p < 0.01, and * p < 0.1.
Table 9. Mediating effect of financing constraints across ESG sub-dimensions.
Variable(1)(2)(3)(4)
X→SAX + SA→YE→SAE + SA→Y
SA0.0015 **0.0172 *** 0.3837 **
(2.2187)(4.7886) (2.5269)
E 0.0008 **0.0097 ***
(2.4436)(5.6345)
S
G
Constant −3.4260 ***−7.0919 ***
(−18.1820)(−6.8722)
Year YESYESYESYES
Firm YESYESYESYES
Sobel Z1.66
(p < 0.01)
1.7566
(p = 0.0790)
Bootstrap 95% CI[0.0005, 0.0009] [0.0003, 0.0004]
N10,15210,15210,15210,152
Adj R20.39150.30840.39120.3092
Variable(5)(6)(7)(8)
S→SAS + SA→YG→SAG + SA→Y
SA 0.3739 ** 0.3906 **
(2.4566) (2.5634)
E
S0.0021 ***0.0120 ***
(3.6333)(4.1434)
G 0.00080.0027
(1.5126)(0.8096)
Constant−3.4045 ***−7.2841 ***−3.4511 ***−7.5986 ***
(−18.3034)(−7.0796)(−18.8478)(−7.3659)
Year YESYESYESYES
Firm YESYESYESYES
Sobel Z2.0351
(p = 0.0418)
1.3027
(p = 0.1927)
Bootstrap 95% CI[0.0008, 0.0010] [0.0000, 0.0005]
N10,15210,15210,15210,152
Adj R20.39290.30570.39030.3014
Notes: t-statistics based on standard errors clustered at the firm level are reported in parentheses. *** p < 0.01, ** p < 0.05.
Table 10. Mediating effects of government support across ESG sub-dimensions.
Variable(1)(2)(3)(4)
X→GSX + GS→YE→GSE + GS→Y
PB_ESG0.0157 ***0.0171 ***
(2.9607)(4.9956)
GS 0.0400 *** 0.0404 ***
(6.9897) (7.0619)
E 0.0064 **0.0098 ***
(2.2689)(5.8280)
S
G
Constant−3.0484 ***−7.7118 ***−19.4634 ***−7.8592 ***
(−2.7361)(−8.2913)(−17.7932)(−8.4391)
YearYESYESYESYES
FirmYESYESYESYES
Sobel Z2.73
(p < 0.05)
2.1601
(p = 0.0308)
Bootstrap 95% CI[0.0003, 0.0013] [0.0001, 0.0006]
N9500950095009500
Adj R20.12010.29970.11970.3007
Variable(5)(6)(7)(8)
S→GSS + GS→YG→GSG + GS→Y
PB_ESG
GS 0.0405 *** 0.0411 ***
(6.9824) (7.0249)
E
S0.0099 **0.0120 ***
(2.1624)(4.3622)
G 0.0066 *0.0030
(1.6836)(0.9333)
Constant−19.5047 ***−8.0057 ***−19.6230 ***−8.3157 ***
(−17.8736)(−8.6330)(−18.0482)(−9.0002)
YearYESYESYESYES
FirmYESYESYESYES
Sobel Z2.0656
(p = 0.0389)
1.6372
(p = 0.1016)
Bootstrap 95% CI[0.0001, 0.0008] [−0.0001, 0.0005]
N9500950095009500
Adj R20.11970.29700.11930.2927
Notes: t-statistics based on standard errors clustered at the firm level are reported in parentheses. *** p < 0.01, ** p < 0.05, and * p < 0.1.
Table 11. Heterogeneity analysis: Ownership and firm size.
Variable(1)
SOEs
(2)
Non-SOEs
(3)
Small Firms
(4)
Large Firms
PB_ESG0.0149 ***
(6.3846)
0.0199 ***
(7.920)
0.0085 *
(1.9063)
0.0239 ***
(9.5060)
SOE−0.3030 **
(−2.3244)
PB_ESG_SOE0.01120 ***
(4.8153)
size 0.4410 ***
(9.4376)
PB_ESG_size 0.0021 ***
(3.5167)
Control YesYesYesYes
Year YesYesYesYes
Firm YesYesYesYes
SUEST p-value0.0738 0.0698
N517810,03410,5264666
Adj R20.32760.27880.08160.2261
Notes: t-statistics based on standard errors clustered at the firm level are reported in parentheses. *** p < 0.01, ** p < 0.05, and * p < 0.1.
Table 12. Heterogeneity analysis: Pollution intensity and technology intensity.
Variable(5)
Heavily Polluted
(6)
Lightly Polluted
(7)
Technology-Intensive
(8)
Non-Technology-Intensive
PB_ESG0.0232 ***
(6.25)
0.0140 ***
(9.7975)
0.0015
(0.5843)
0.0256 ***
(11.4888)
HP0.0028
(0.0174)
PB_ESG_HP0.0059 **
(2.2896)
Tech 0.3009 **
(2.5533)
PB_ESG_Tech −0.0097 ***
(−3.7588)
Control YesYesYesYes
Year YesYesYesYes
Firm YesYesYesYes
SUEST p-value0.0049 0.0000
N345111,76167718441
Adj R20.453190.263660.351340.30697
Notes: t-statistics based on standard errors clustered at the firm level are reported in parentheses. *** p < 0.01, ** p < 0.05.
Disclaimer/Publisher’s Note: The statements, opinions and data contained in all publications are solely those of the individual author(s) and contributor(s) and not of MDPI and/or the editor(s). MDPI and/or the editor(s) disclaim responsibility for any injury to people or property resulting from any ideas, methods, instructions or products referred to in the content.