


Abstract
Resource-based cities face complex land-use pressures. Examining the evolution of production–living–ecological spaces (PLESs) and the spatial conflicts associated with this evolution provides an important basis for reducing land-use tensions and promoting more coordinated and sustainable spatial development. Drawing on land-use records spanning 2000–2020, this study integrates a transfer-matrix approach, a PLES conflict assessment model, and spatial autocorrelation analysis to examine the spatiotemporal evolution of PLESs and their conflict patterns in Shenmu City, China. The results show that (1) industrial production land expanded more rapidly than any other land category, mainly through the conversion of agricultural production land. Agricultural production land continued to decrease as it was converted into both industrial production land and ecological land. Grassland served as an important transitional space between production and ecological spaces, with its evolution shifting from rapid expansion in the early period to relative stability in the later period. (2) In terms of spatial conflicts, moderate conflict remained the dominant category and generally increased over time. By contrast, strong and relatively strong conflicts decreased, while weak and relatively weak conflicts gradually increased. Spatially, conflict patterns shifted from highly concentrated areas in the southeastern resource-extraction zone to a more dispersed and balanced regional distribution. (3) Global Moran’s I decreased from 0.62 to 0.49, indicating a weakening of overall spatial clustering. High–High clusters contracted into fragmented patches, whereas Low–Low clusters continued to expand in the northwestern ecological zone, reflecting the gradual improvement of local environmental conditions. Overall, although spatial conflict intensity has decreased and strong conflicts have been substantially reduced, conflicts have shifted mainly toward moderate levels rather than being fully resolved. As the dominant and still expanding category, moderate conflict represents a potential risk that requires continuous monitoring and adaptive intervention. By focusing on a county-level resource-based city, this study provides a fine-grained empirical case. It identifies an evolutionary pattern characterized by the reduction in severe spatial conflicts and the accumulation of moderate conflicts, which differs from the patterns commonly observed in urbanization-driven cities. The findings suggest that spatial conflicts in resource-based cities are highly responsive to targeted ecological governance policies. Future sustainable spatial development should be promoted through differentiated zonal governance, ecological restoration, and the green transformation of the industrial structure.
1. Introduction
Land underpins human survival and development, and the long-term use and transformation of land resources have accompanied the advancement of human civilization [1]. The 2024 United Nations Pact for the Future further emphasizes progress toward the Sustainable Development Goals (SDGs), identifying the sustainable management of land and environmental resources as an important issue of global concern [2]. Driven by accelerated industrial concentration and urban expansion across China, structural strains on natural resources and environmental carrying capacities have continuously escalated. This systemic pressure has manifested as increasingly acute frictions among production–living–ecological spaces (PLESs). These conflicts constrain spatially balanced and sustainable regional development. Enforced to guide sustainable growth, the National Territorial Planning Outline (2016–2030) prioritizes the structural restructuring of regional domains and the institutional integration of ecological civility with balanced PLES configurations [3]. It also sets clear requirements for exploring sustainable land-use pathways in key development areas, including mineral-resource-based regions [4]. As a core component of territorial spatial optimization, the rational allocation of PLESs is essential for improving land-use efficiency and achieving multifunctional coordination [5]. Existing studies have mainly focused on the identification and classification of PLESs, as well as the assessment of their spatial evolution and functions. Regarding identification methods, most studies combine land-use classification with quantitative measurement approaches [6,7,8]. Geographically, mainstream spatial analyses exhibit a pronounced bias toward meso-level provincial or municipal granularities, whereas macro-tier examinations encompassing national territories remain noticeably scarce [9,10,11,12]. Research on spatial conflicts developed from studies of land-use conflict, which is mainly driven by the scarcity and multifunctionality of spatial resources [13]. International research has gradually expanded from early analyses of resource competition to topics such as ecosystem services [14,15,16]. Methodologically, both qualitative and quantitative approaches have been adopted, including Participatory Rural Appraisal (PRA), game theory, and multi-objective optimization [17,18,19]. In China, related research has developed rapidly by drawing on human–land relationship theory and by integrating models such as the Pressure–State–Response (PSR) model, mechanical equilibrium models, and landscape ecological risk assessment to quantify spatial conflicts [20,21,22]. For tracing territorial transformation processes and land change characteristics, both transition-matrix approaches and dynamic degree tools have found extensive application, particularly in geographical assessments of the Hexi Corridor [23]. Spatial autocorrelation analysis has also been applied to identify grid-scale clustering patterns in variables such as land-use intensity and ecosystem service value, as demonstrated in studies of the Huangshui River Basin [24]. In addition, Peng Jiajie put together a spatial conflict measurement model grounded in ecological security to gauge conflict levels in the Changsha–Zhuzhou–Xiangtan region [20]. Notwithstanding these significant strides, certain critical deficiencies in the existing literature persist. First, existing studies are still mainly concentrated on macro-scale regions, especially provinces and large urban agglomerations, while county-level resource-based cities have received insufficient attention at refined spatial resolutions. Second, previous studies have rarely examined the structural tensions of PLESs in resource-dependent economies in an explicit and systematic manner. Many studies focus separately on the ecological or social impacts of coal mining, but they often lack a rigorous and quantifiable index for measuring spatial conflict intensity. More importantly, the stage-specific evolution of spatial conflicts is often insufficiently linked with the historical implementation of public policies, which limits the understanding of the detailed driving mechanisms behind these conflicts. To address these gaps, this study investigates PLES conflicts in Shenmu City, a representative county-level resource-based city. By identifying its internal driving forces and comparing its evolutionary trajectory with those of different urban types, this study provides a more detailed comparative framework.
Shenmu City is a suitable case for this study. Characterized by its resource-dependent municipal economy, this county-level urban center occupies the critical ecotone where the topography shifts between the Loess Plateau and the Inner Mongolia Plateau. Its fragile ecological environment, combined with intensive coal development, has intensified tensions among production, living, and ecological spaces [25]. Accordingly, this study takes Shenmu City, Shaanxi Province, as the study area. Drawing on land-use data from 2000 to 2020, the analysis traces PLES evolution through a transfer matrix, measures conflict intensity with a purpose-built assessment model, and locates where conflicts cluster spatially through autocorrelation analysis. Based on this framework, the study addresses the following research questions: (1) What were the spatiotemporal evolutionary patterns of PLESs in Shenmu City from 2000 to 2020, and what were the main transition pathways among different spatial types? (2) How did the intensity and spatial distribution of PLES conflicts evolve, and did conflict characteristics differ significantly across different spatial types? (3) How did the spatial clustering characteristics of PLES conflicts change over time, and how were these changes related to resource extraction and ecological governance policies in Shenmu City? The contribution of this study lies in its fine-grained empirical analysis of a county-level resource-based city. It reveals a trajectory that differs from that of urbanization-driven cities, namely the reduction in severe spatial conflict alongside the accumulation of moderate conflict. These core analytical outcomes serve as a robust conceptual foundation designed to guide regulatory planning and sustainable spatial recalibration across typical resource-depleted municipal frameworks.
2. Materials and Methods
2.1. Overview of the Study Area
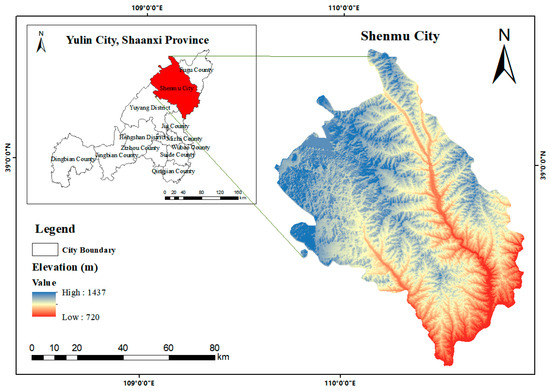
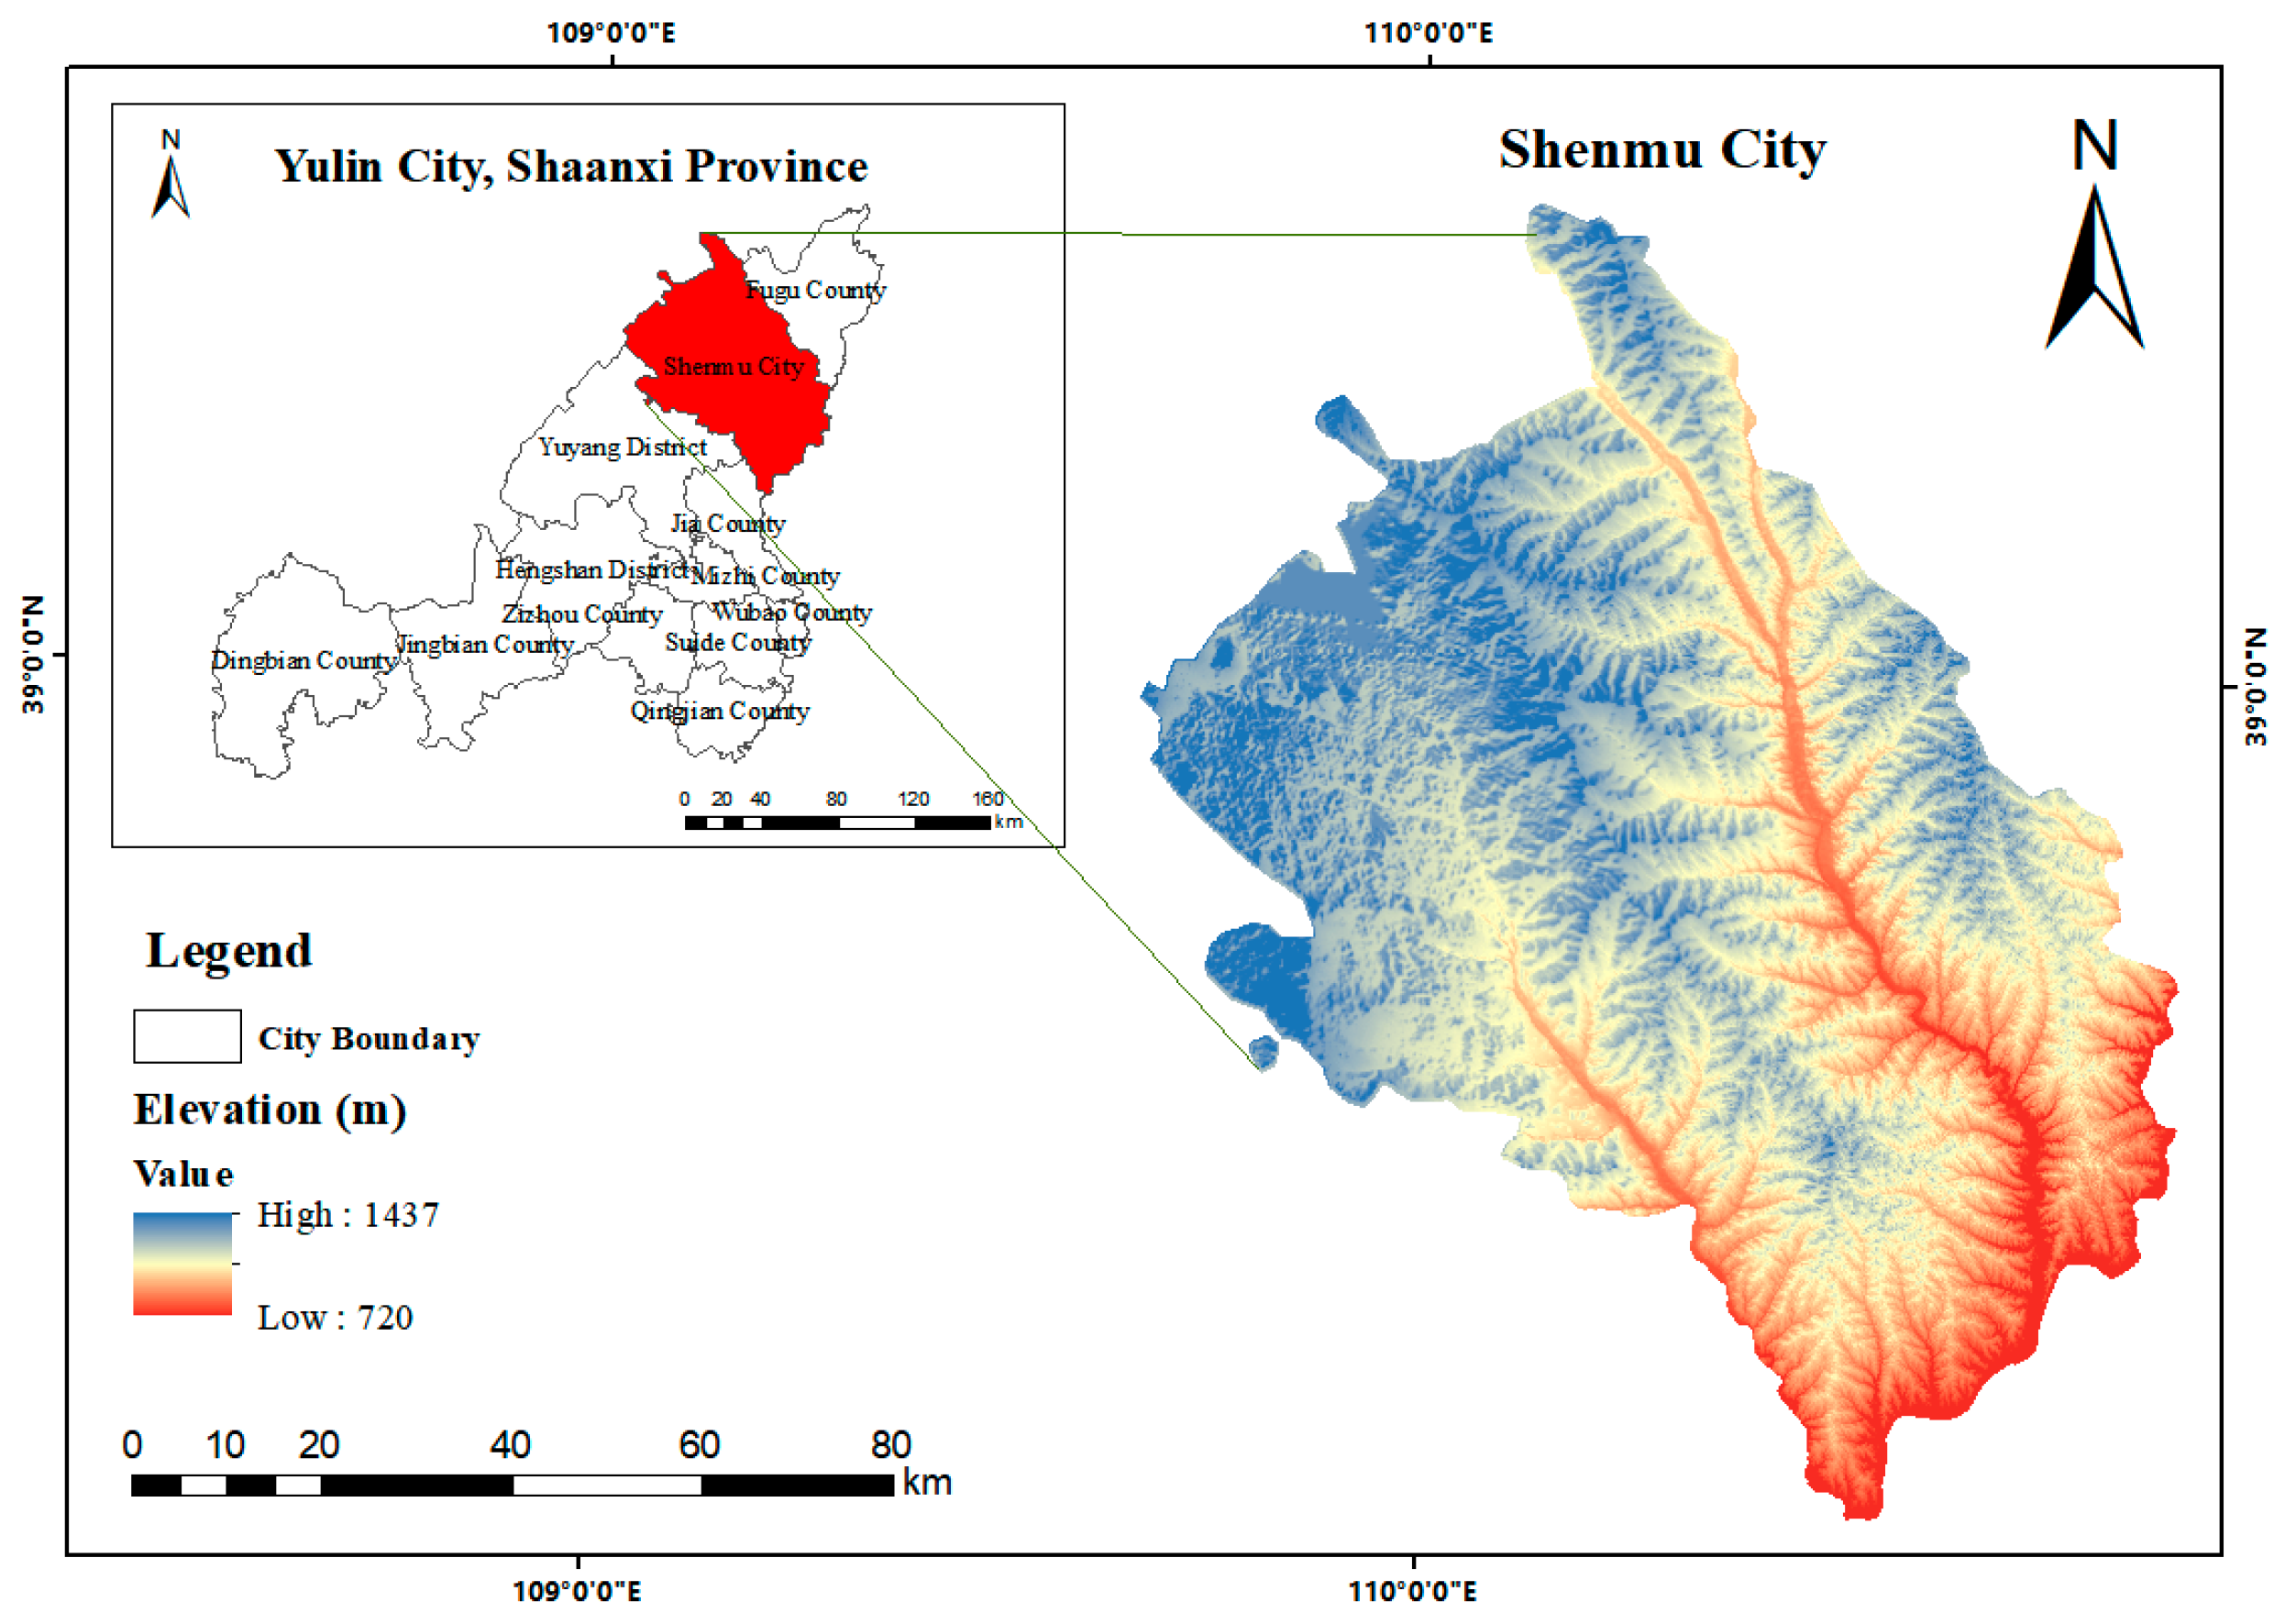
Shenmu City, administered by Yulin City, occupies the northernmost tip of China’s Shaanxi Province, covering an area of approximately 7635 km2. It lies in an ecologically sensitive transitional zone between the eastern margin of the Mu Us Sandy Land and the northern Loess Plateau (109°40′–110°54′ E, 38°13′–39°27′ N; Figure 1). The city has a temperate continental climate characterized by persistent dryness and limited precipitation. Its hilly and plateau-dominated terrain is vulnerable to soil degradation and desertification. Hydrologically, the Yellow River and the Kuye River form the main drainage system, with the terrain generally descending toward the southeast. Coal is the foundation of the local resource base. Shenmu City contains an estimated 50 billion tons of high-quality and readily mineable coal, along with other mineral resources. The rapid development of the energy sector has attracted industrial activities and population growth, but it has also increased pressure on land used for living and ecological functions [26]. In 2025, the city’s GDP increased by 5.5% year on year, and the value added of the secondary industry was RMB 204.422 billion. Industrial value added accounted for 83.2% of GDP, while the gross output value of large-scale industrial enterprises reached RMB 342.682 billion, and raw coal production reached approximately 340 million tons, indicating a coal-dominated industrial structure. By the end of 2024, the urbanization rate had reached 71.98%, with a permanent resident population of 584,100, including an urban population of approximately 120,000. Continued population concentration has further increased the demand for living space. In recent years, under the influence of the Western Development Strategy and ecological conservation policies, Shenmu City has entered a period of simultaneous industrial transformation and ecological restoration, during which conflicts among PLESs have become increasingly prominent.
Figure 1.
Administrative division map of Shenmu City.
2.2. Data Sources and Processing
The 30 m resolution land-use datasets for the three study years, namely 2000, 2010, and 2020, were obtained from the China National Land Use/Cover Change (CNLUCC) dataset compiled by the Resource and Environmental Science and Data Center of the Chinese Academy of Sciences [27] (https://www.resdc.cn/ (accessed on 22 June 2026)). This dataset has been validated through extensive nationwide field surveys and random sampling assessments, with a first-level classification accuracy of more than 95%, providing a reliable basis for spatial analysis [28]. The CNLUCC dataset is mainly produced through the visual interpretation of Landsat satellite imagery and covers multiple periods, including 2000, 2005, 2010, 2015, and 2018. To ensure strict alignment with the designated temporal scope, our empirical analysis integrates regional land-use profiles captured at decadal increments across 2000, 2010, and 2020. The administrative boundary data used in Figure 1 were obtained from CTAmap (https://www.shengshixian.com/ (accessed on 22 June 2026)). In addition, a 30 m digital elevation model (DEM) was acquired from the Geospatial Data Cloud (http://www.gscloud.cn/ (accessed on 22 June 2026)), and socioeconomic indicators were collected from the official website of the Shenmu Municipal People’s Government (https://www.sxsm.gov.cn/ (accessed on 22 June 2026)). To ensure analytical consistency, all geospatial layers were projected to the CGCS2000_3_Degree_GK_CM_111E coordinate system and standardized to a pixel size of 30 m × 30 m.
2.3. Research Methods
2.3.1. Classification of PLESs
Based on the dominant functions, service attributes, and spatial process characteristics of land use [29], and with reference to the multi-period Chinese land-use remote sensing dataset framework [30] and the National Standard for Classification of Current Land Use Status (GB/T 21010–2007) [31], a refined hierarchical classification system suitable for the study area was established (Table 1). On this basis, the secondary land-use datasets were reclassified and integrated using spatial analysis tools in ArcGIS 10.8.1 (Esri, Redlands, CA, USA).
Table 1.
Classification system of PLESs.
2.3.2. Methods for Spatiotemporal Evolution Analysis
- Dynamic degree index
This study quantified how quickly each PLES category changed over the study period by applying the land use dynamic degree index, computed at both the single-category and whole-system levels [23]. The equations are as follows:
where denotes the rate of change for a single land-use category; and point to the temporal start and completion magnitudes of the given land cover; and quantifies the spanning years of the investigation.
where measures the speed of land-use change summed across every category; refers to the total area shifting from category into any other category over the study period; is the area occupied by category at the outset; and again denotes the period length.
- 2.
- Transfer matrix model
To identify the transition pathways among different PLES categories across the three study periods, a transfer-matrix model was applied [32]. The equation is expressed as follows:
Specifically, signifies the area of spatial reallocation, capturing the movement from land type (early stage) to land type (later stage), and defines the total number of land-use categories involved.
2.3.3. Conflict Assessment Model
Borrowing the logic used in landscape ecological risk assessment, a PLES conflict assessment model was built around three dimensions, namely spatial complexity, spatial vulnerability, and spatial stability. Because land-use systems emerge from the interplay between natural processes and human activities, they inherently display complexity, vulnerability, and dynamic stability [33]. These three dimensions have also been widely used in studies of landscape ecological risk and spatial conflict [20]. Specifically, the spatial complexity index reflects the intensity of external spatial pressure and corresponds to the risk source dimension. The spatial vulnerability index describes the susceptibility of different spatial types to disturbance and corresponds to the risk receptor dimension. The spatial stability index represents the resilience and self-repair capacity of spatial units and corresponds to the risk effect dimension. In this framework, higher spatial complexity, greater vulnerability, and lower stability indicate a higher intensity of spatial conflict.
Following the conflict assessment framework proposed by Peng et al. [20] and subsequent related studies [34], equal weights were assigned to the three dimensions in this study. This approach was adopted because no definitive theoretical or empirical evidence currently indicates that any single dimension is inherently more important than the others in characterizing spatial conflict intensity. Equal weighting also improves methodological transparency and facilitates comparison with previous studies. Consequently, the Spatial Comprehensive Conflict Index (SCCI) is conceptualized as a composite metric, derived by aggregating the spatial complexity and vulnerability dimensions, and subsequently deducting the spatial stability component:
where is the combined PLES conflict score; represents the spatial complexity index; represents the spatial vulnerability index; represents the spatial stability index.
- Spatial complexity index [35]:
To ensure comparability, the index values were normalized [36]. The normalization formula is as follows:
- 2.
- Spatial vulnerability index [37]:
Urban and rural living spaces were assigned the lowest value because they are dominated by artificial built environments and are subject to continuous human management and maintenance, which provide relatively strong buffering capacity against external environmental disturbances. Forest ecological space and grassland ecological space were assigned a value of 2, reflecting their relatively high self-regulation capacity, although they remain affected by land-use pressure from adjacent production activities. Agricultural production space was assigned a value of 3 because it depends on stable soil and water conditions and is exposed to encroachment from nearby industrial expansion in Shenmu City. Water ecological space was assigned a value of 4 because it is highly sensitive to upstream land-use change and pollution and acts as a cumulative recipient of watershed-scale disturbances. Industrial production space was assigned a value of 5. Although it plays a dominant role in the local economy, it functions as both a major source and a recipient of land-use conflicts in this resource-based city, and its disturbances tend to have cumulative and compound effects. Other ecological spaces, including sandy land, saline-alkali land, and bare land, were assigned the highest value. This category has a fragile baseline condition and low ecological carrying capacity, and its natural recovery potential after disturbance is extremely weak. This feature is particularly evident along the margin of the Mu Us Desert, where Shenmu City is located.
To ensure comparability, the index values were normalized [36]. The normalization formula is as follows:
- 3.
- Spatial stability index [40]
This index was again normalized for cross-unit comparability [36]. The normalization formula is as follows:
FRAGSTATS 4.2 (University of Massachusetts, Amherst, MA, USA) was used to calculate the conflict indices using a grid-based method. In view of the size of the research zone, the spatial resolution of the datasets, and the requirements of the assessment, and referring to grid sizes commonly used in PLES conflict and landscape ecological risk studies [41], Shenmu City was divided into 1 km × 1 km grids. This grid size was selected because a 500 m × 500 m grid may contain too few pixels in individual units, leading to unstable landscape index calculations, whereas a 2 km × 2 km grid may over-smooth spatial heterogeneity and obscure the fine-scale distribution of local conflicts. By contrast, the 1 km × 1 km grid provides a sufficient number of pixels within each grid cell and ensures the statistical stability of landscape index calculations. Boundary grid cells that did not fully cover the study area were excluded, leaving 7152 valid units for analysis. To make conflict intensity comparable across the three time points, the normalized conflict index, ranging from 0 to 1, was classified using the equal interval method [13]. The frequency distribution of the conflict index across all 7152 grid units showed a unimodal pattern, and the selected breakpoints of 0.2, 0.4, 0.6, and 0.8 did not coincide with abrupt changes in the frequency distribution. This supports the suitability of the selected intervals. Consistent with previous conflict assessment studies [42], five equal-width classes of 0.2 were used: weak [0.0, 0.2), relatively weak [0.2, 0.4), moderate [0.4, 0.6), relatively strong [0.6, 0.8), and strong [0.8, 1.0). Because all conflict indices were normalized to the same range, the equal interval classification method allows for direct comparison of conflict levels across different years and avoids potential inconsistencies caused by data-dependent classification methods, such as natural breaks.
2.3.4. Spatial Autocorrelation Analysis
Global Moran’s I was used to evaluate the overall spatial autocorrelation of spatial conflict [43]:
where is the count of spatial units; and represent the conflict index values at locations and , respectively; represents the mean conflict index; and represents the spatial weight matrix. Values of Moran’s I exceeding zero signify a positive spatial dependency (clustering), while values below zero denote a negative spatial association (dispersion). An index of exactly zero implies a random spatial distribution, devoid of significant correlation.
The local indicator of spatial association (LISA) was further used to identify local clustering characteristics [44]:
where is the conflict index value observed at location ; represents the mean conflict index; and represents the spatial weight matrix. > 0 indicates that similar values are spatially clustered, whereas < 0 indicates that dissimilar values are spatially clustered. When = 0, no spatial clustering relationship exists.
The spatial weight matrix () used to calculate Global Moran’s I and was constructed based on the Queen contiguity criterion (CONTIGUITY_EDGES_CORNERS). Under this criterion, grid cells sharing either an edge or a vertex are defined as spatially adjacent. The weight matrix was then row-standardized to ensure that the sum of the spatial weights for each geographic unit equals 1.
3. Results
3.1. Spatiotemporal Evolution of PLESs
3.1.1. Changes in the Spatial Pattern of PLESs
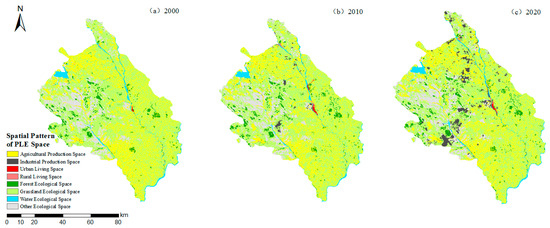
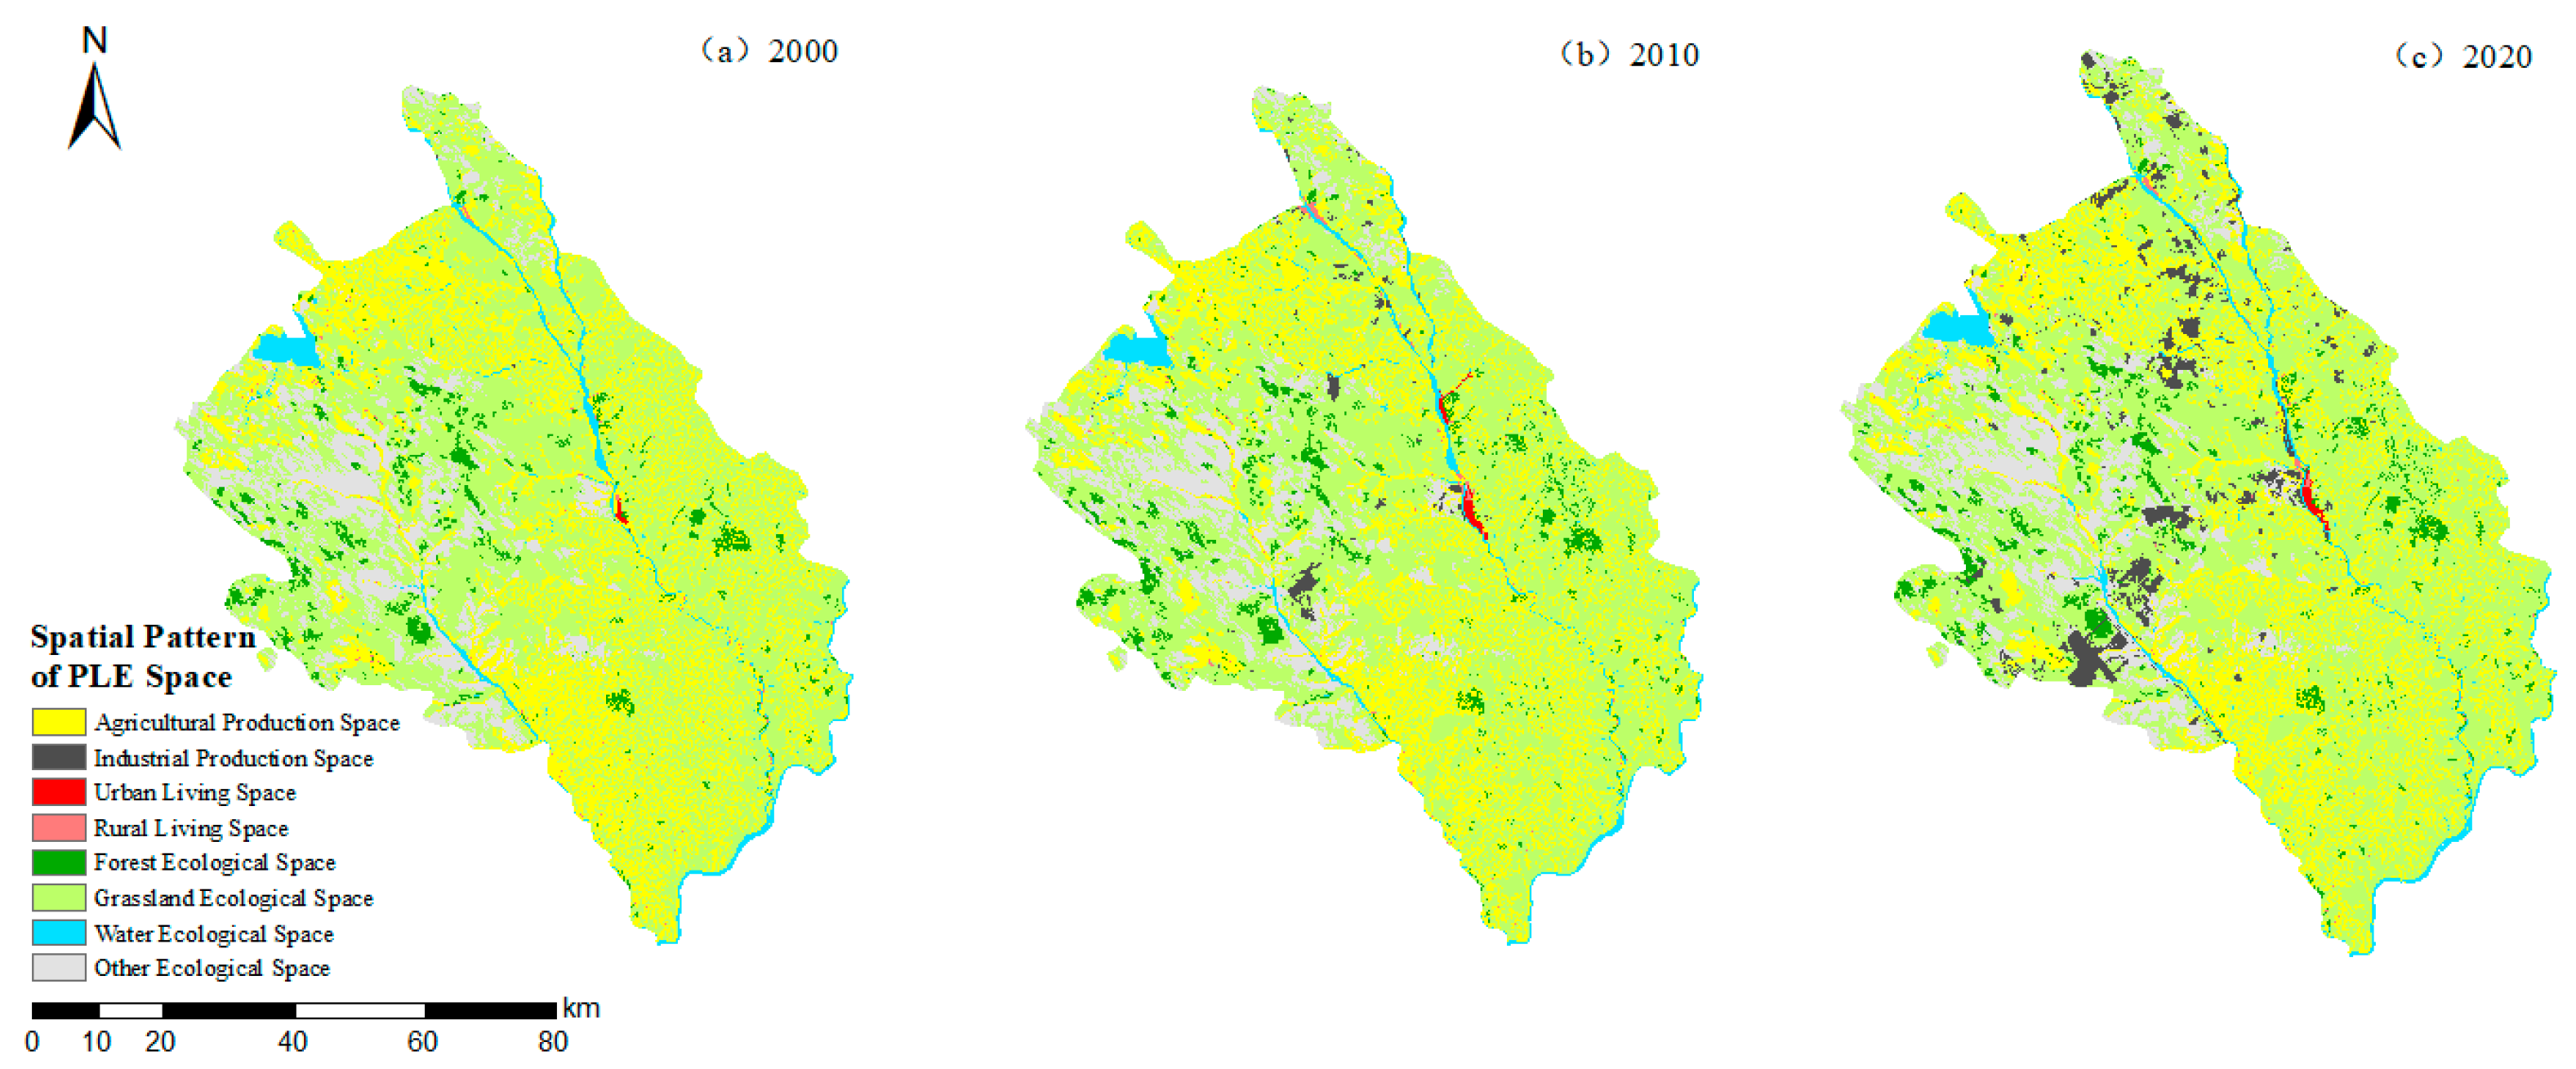
As illustrated in Table 2 and Figure 2, the PLES landscape of Shenmu City between 2000 and 2020 was characterized by the overarching dominance of grassland ecological space and agricultural production space. The former exhibited a pervasive footprint citywide, with particularly dense clustering across the northern and west–central territories. Urban living space was mainly concentrated around the city center, while industrial production space showed a point-like and linear distribution along transportation corridors and resource-rich areas. Other ecological space was mainly located in the western part of the study area.
Table 2.
Area and proportion of PLESs in Shenmu City from 2000 to 2020.
Figure 2.
Spatial distribution patterns of PLESs in Shenmu City from 2000 to 2020.
Industrial production space expanded more rapidly than any other category, with its share increasing from 0.02% in 2000 to 0.68% in 2010 and further to 3.58% in 2020. By contrast, agricultural production space declined steadily, with its proportion decreasing from 28.10% to 24.66%. Among ecological spaces, forest ecological space and grassland ecological space increased slightly, whereas other ecological space continued to decrease, with its share falling from 11.05% to 10.56%.
3.1.2. Changes in the Dynamic Degree of PLESs
Temporal shifts were most striking within the industrial production space during the evaluated period, with its single dynamic degree peaking at 4.98% (Table 3). This result reflects the important role of coal resource development in reshaping the spatial structure of Shenmu City. Living space showed an overall increasing trend, with urban living space recording the highest dynamic degree among living-space types at 3.10%. In contrast, agricultural production space and some ecological spaces experienced negative changes.
Table 3.
Single dynamic degree of PLESs in Shenmu City from 2000 to 2020 (%).
From 2000 to 2010, PLESs generally showed an increasing trend. Industrial production space and urban living space expanded rapidly, with dynamic degrees of 9.75% and 7.61%, respectively. Agricultural production space showed a negative dynamic degree, indicating a gradual weakening of traditional agricultural functions during the development of this resource-based city. From 2010 to 2020, the rate of change slowed across all spatial types. Industrial production space continued to expand, although at a reduced rate. During the same period, living space decreased noticeably, in contrast to its increase from 2000 to 2010. Among ecological spaces, water ecological space showed a positive dynamic degree of 0.53%, whereas the other three ecological space types showed negative dynamic degrees.
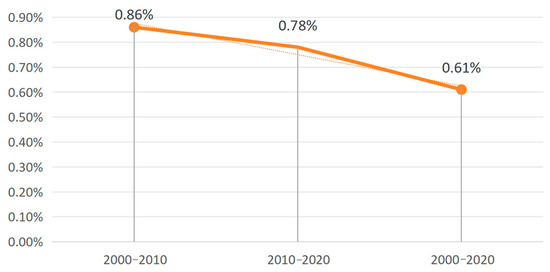
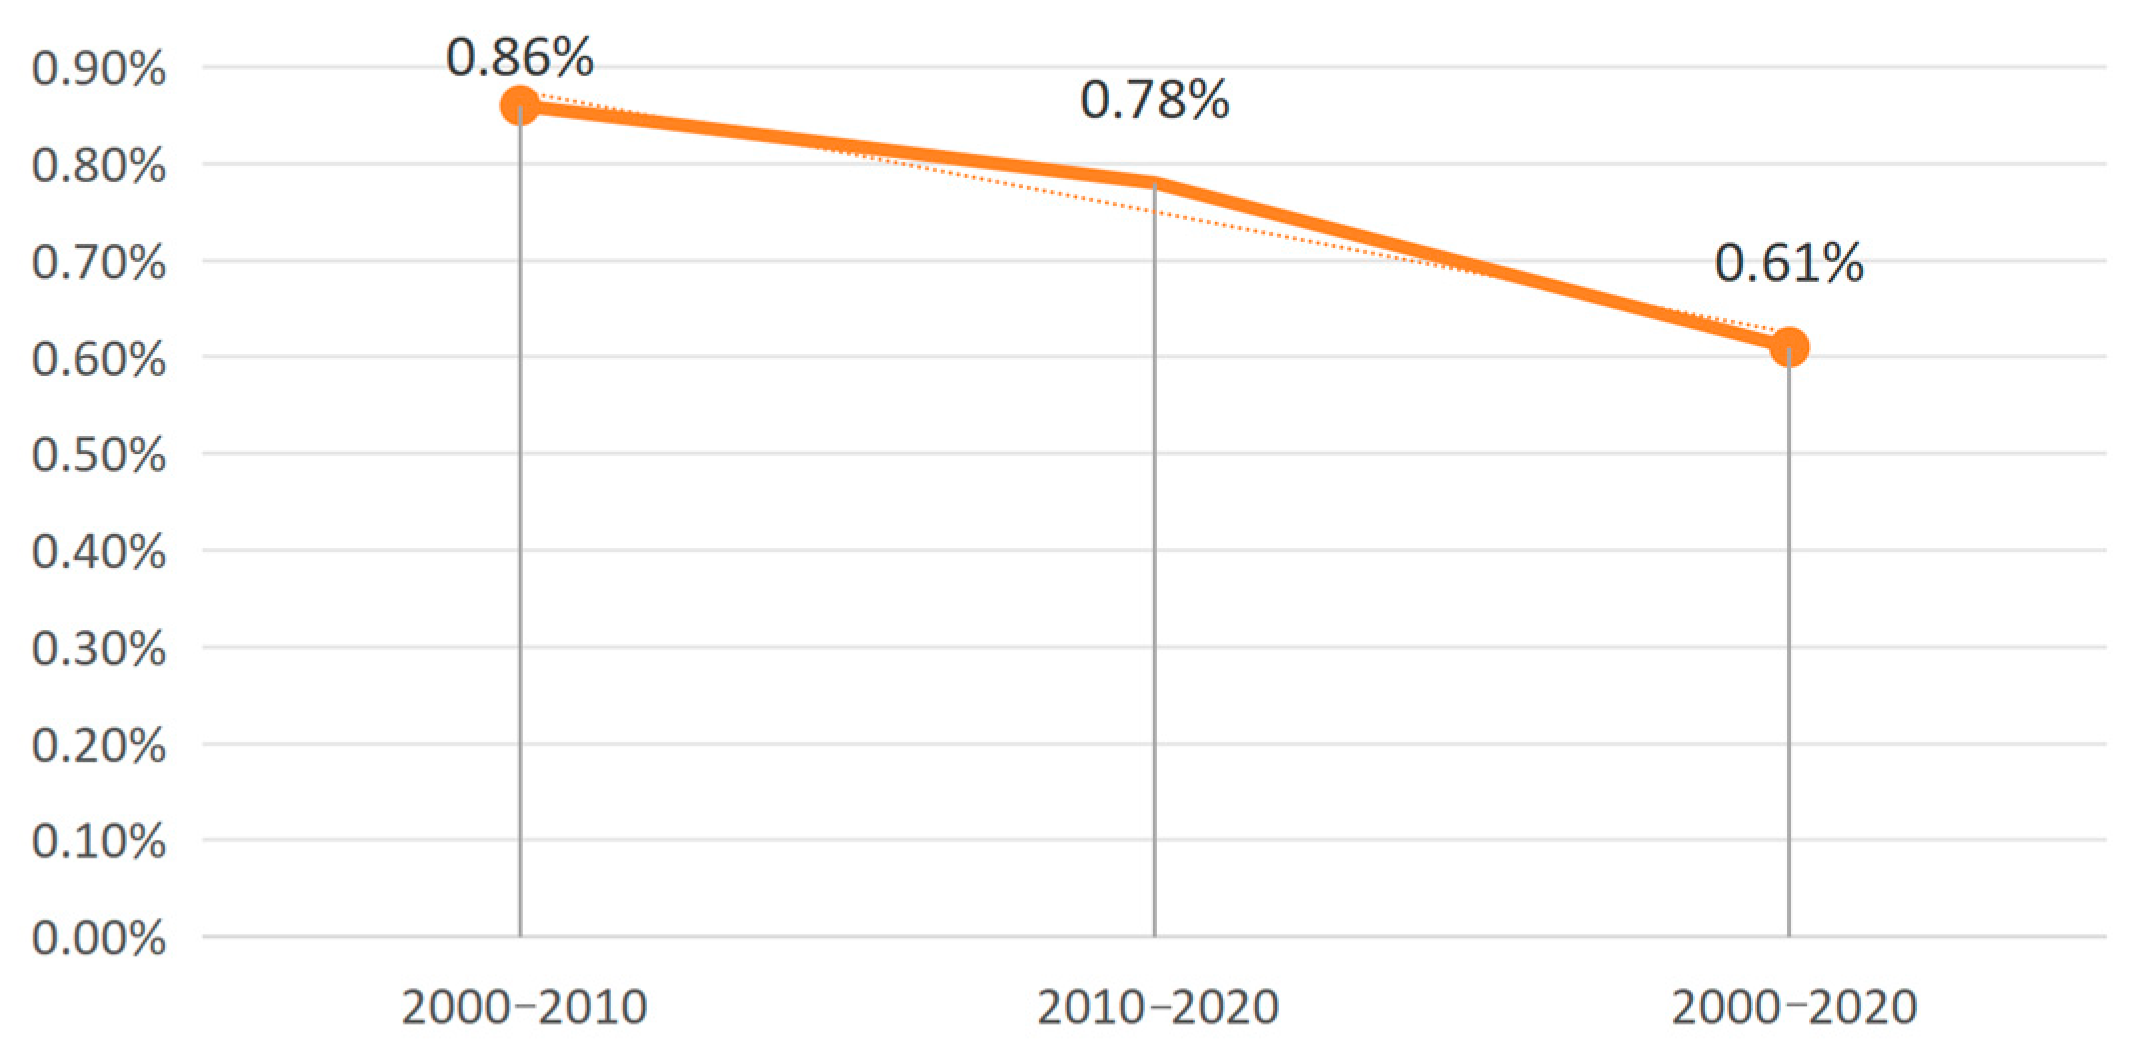
The comprehensive dynamic degrees of PLESs were 0.86%, 0.78%, and 0.61%, respectively (Figure 3), indicating a gradual downward trend. This indicates that land-use change in Shenmu City followed a pattern of rapid transformation in the early period and gradual stabilization in the later period.
Figure 3.
Comprehensive dynamic degree of PLESs in Shenmu City from 2000 to 2020 (%).
3.1.3. Analysis of the Transfer Characteristics of PLESs
The transfer matrix for 2000–2010 (Table 4) shows that bidirectional conversions between production space and ecological space were the dominant transition pattern. The largest transfer occurred from agricultural production space to grassland ecological space, reaching 28,927.45 ha, while a substantial reverse transfer was also observed. The expansion of industrial production space was mainly supported by conversions from grassland ecological space, other ecological spaces, and agricultural production space. Forest ecological space increased primarily by absorbing agricultural production space and grassland ecological space, which was consistent with the implementation of the Grain-for-Green Program during this period.
Table 4.
Transfer matrix of PLESs in Shenmu City from 2000 to 2010 (ha).
From 2010 to 2020 (Table 5), inflows into industrial production space increased substantially, reaching 26,752.50 ha. The main sources were grassland ecological space and agricultural production space, which contributed 14,768.05 ha and 3484.67 ha, respectively. This indicates that the continued expansion of the energy industry had a strong influence on land-use patterns. The results also highlight the need to establish spatial boundaries for industrial expansion in order to protect the remaining agricultural and ecological land. Compared with the previous period, inflows into living space decreased, while outflows increased.
Table 5.
Transfer matrix of the PLESs in Shenmu City from 2010 to 2020 (ha).
Over the full study period from 2000 to 2020 (Table 6), the long-term structural changes in PLESs in Shenmu City were closely related to the development pattern of a resource-dependent economy. Industrial production space showed continuous and substantial net expansion, making it the most rapidly growing land-use type. This reflects a structural transition from an agriculture-oriented land-use pattern toward more intensive industrial development. Agricultural production space played a dual role: it served as an important land source for industrial expansion while also providing land for ecological restoration. Within ecological space, grassland ecological space showed marked fluctuations and functioned as an important spatial buffer between productive and ecological functions. By contrast, living space remained relatively stable, with only limited structural fluctuations and relatively small cross-category conversions.
Table 6.
Transfer matrix of PLESs in Shenmu City from 2000 to 2020 (ha).
3.2. Conflict Assessment of PLESs
3.2.1. Analysis of the Evolution of Conflicts Among PLESs
From 2000 to 2020, conflicts among PLESs in Shenmu City generally shifted from strong spatial conflict toward moderate and relatively weak spatial conflict, indicating a gradual improvement in spatial configuration (Table 7). Moderate spatial conflict remained the dominant category throughout the study period and continued to increase, rising from 33.46% in 2000 to 42.18% in 2020. Weak and relatively weak spatial conflict also increased, reaching 15.44% and 28.72%, respectively. In contrast, relatively strong and strong spatial conflict decreased sharply, falling to 13.45% and 0.21%, respectively. This indicates a substantial reduction in the most severe conflict levels. In future spatial governance, attention should therefore shift from the elimination of extreme conflict to the management of the widespread accumulation of moderate spatial conflict.
Table 7.
Spatial conflict index of PLESs in Shenmu City from 2000 to 2020.
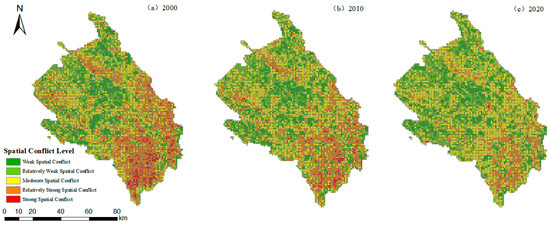
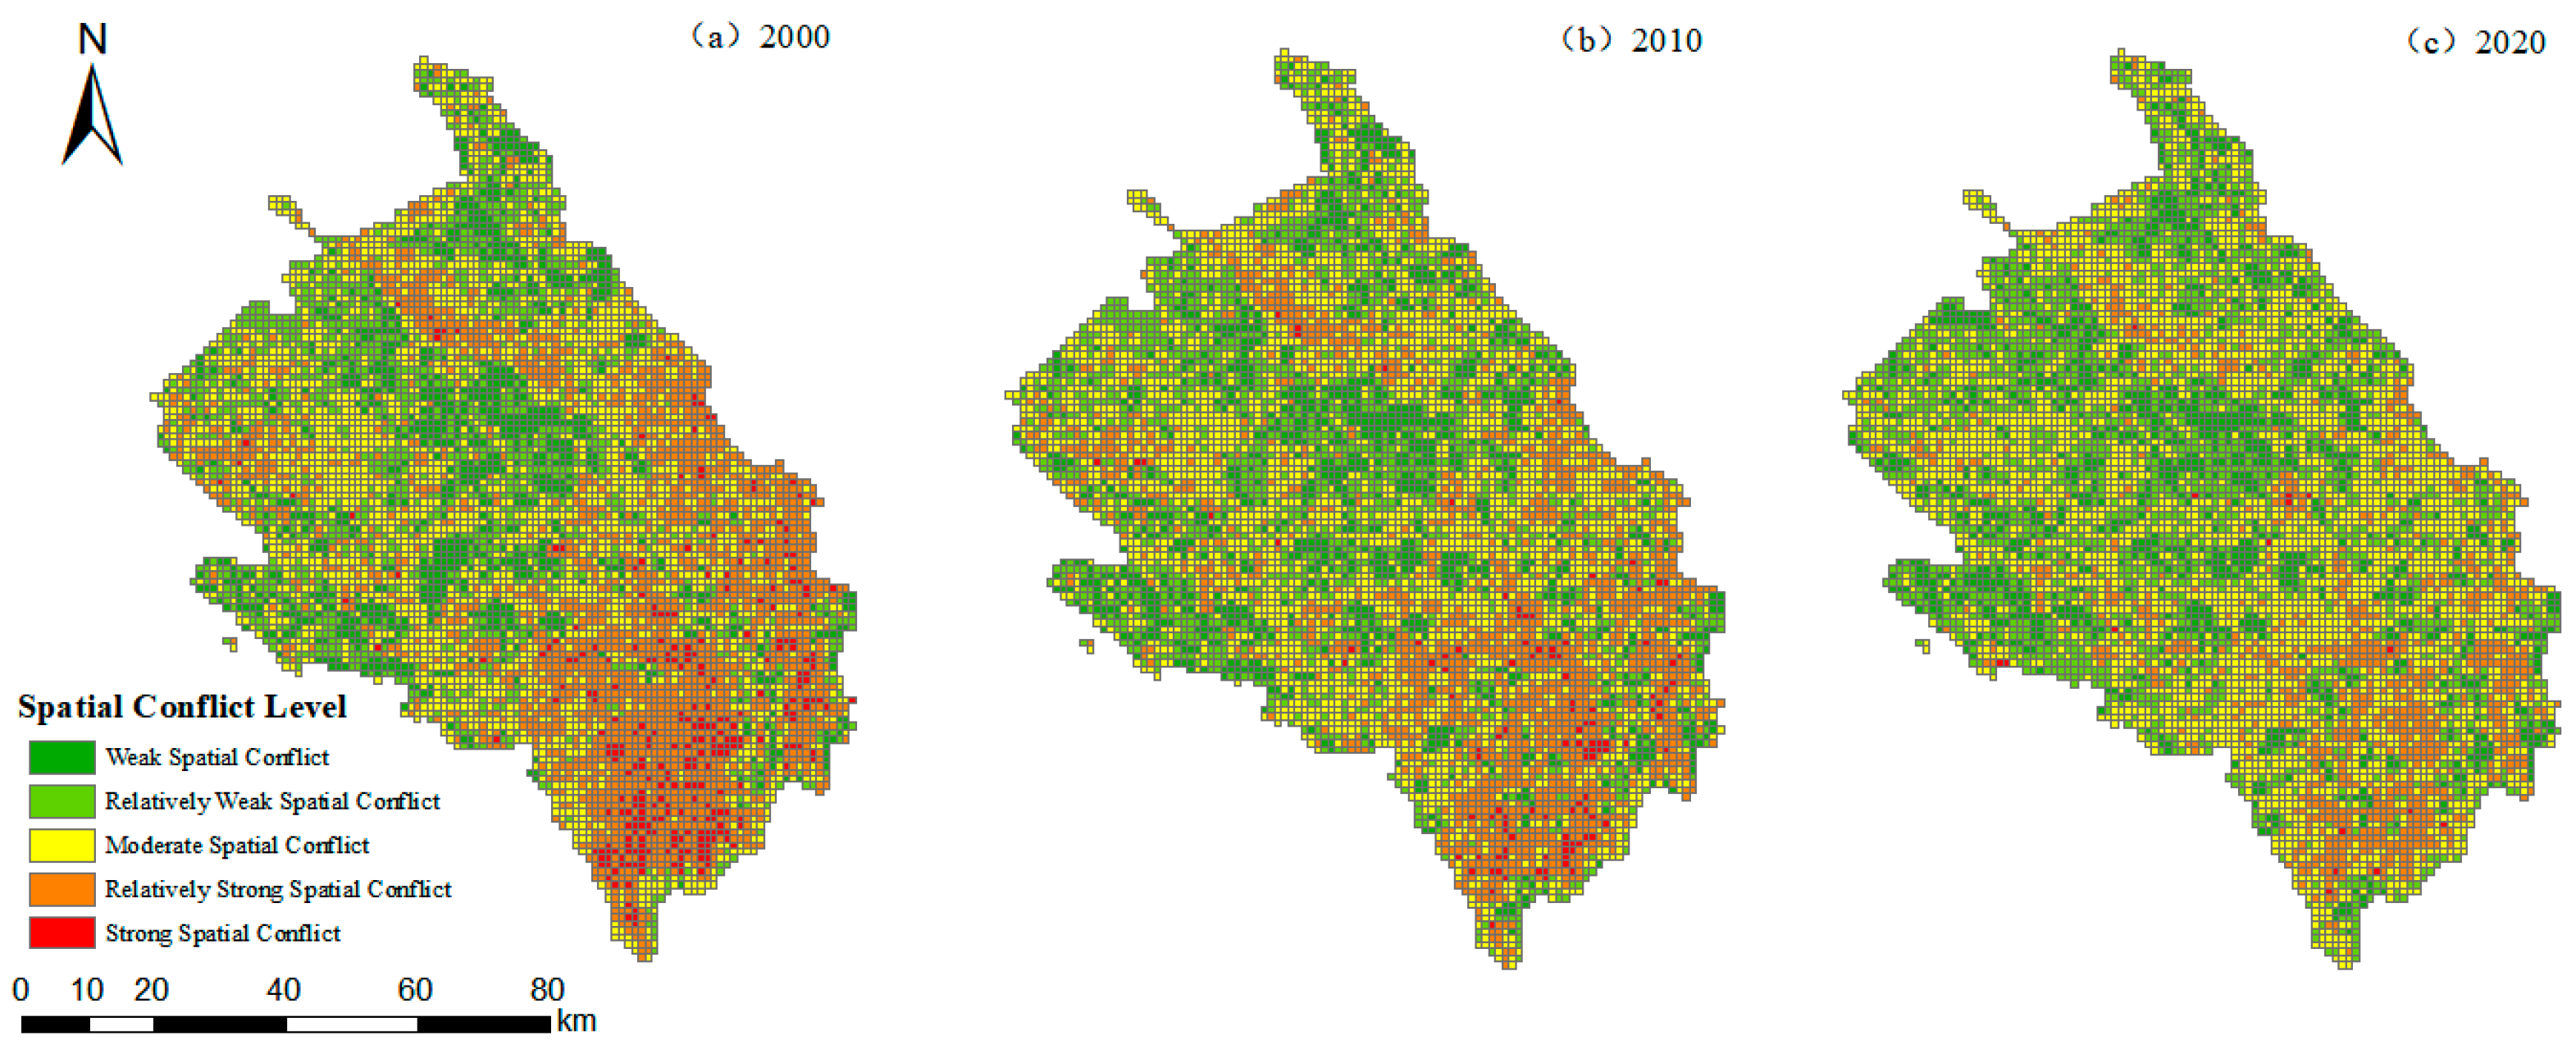
As shown in the spatial distribution of conflicts from 2000 to 2020 (Figure 4), the conflict pattern shifted from a concentrated distribution of high-intensity conflicts in the southeastern part of the city to a more balanced distribution across the study area by 2020.
Figure 4.
Spatial conflict patterns of PLESs in Shenmu City from 2000 to 2020.
Strong spatial conflict was mainly concentrated in the southeast, where eastern townships such as Wanzhen Town and Hejiachuan Town are located along the Yellow River and contain large-scale mining areas supported by abundant coal resources. In 2000, intensive coal extraction accelerated the expansion of industrial production space, causing substantial disturbance to soil and vegetation and triggering intense conflicts with agricultural production space and ecological space. At the same time, the Shendong Highway and the Baoshen Railway further intensified spatial conflicts through transport-related noise and landscape fragmentation. In 2010, the area of strong spatial conflict had decreased, but conflict intensity remained high in the core mining areas. By 2020, areas of strong spatial conflict had further contracted into scattered patches within the core mining districts, and most formerly strong-conflict areas had been transformed into areas of moderate spatial conflict.
The southern part of Shenmu City is mainly characterized by loess hills and gullies, where fragmented terrain and severe soil erosion are prominent. Agricultural production space is interwoven with forest ecological space and grassland ecological space, and the dominant conflict types are relatively strong and moderately strong spatial conflicts. Between 2000 and 2020, with continued urbanization, moderate spatial conflict expanded from isolated points to broader areas. The northwestern region is dominated by sandy grasslands with relatively flat terrain. From 2000 to 2010, forest and grassland ecological spaces were dominant, and conflict levels were mainly weak or relatively weak. From 2010 to 2020, ecological conditions improved further, and spatial conflict decreased accordingly.
To further examine the relative contributions of the three component indices to the SCCI, this study calculated the mean and standard deviation (SD) values of LCI, LFI, and LSI for 2000, 2010, and 2020 (Table 8). In terms of mean values, LSI was consistently higher than both LCI and LFI across all three periods. Since LSI is a subtractive term in the calculation of SCCI, its higher mean value had the strongest mitigating effect on the overall magnitude of SCCI. This suggests that LSI had the greatest influence on the overall numerical level of SCCI. In terms of standard deviation, LCI showed the largest variation among the three indices in all periods, remaining higher than both LFI and LSI. Because SCCI is calculated through the direct addition and subtraction of these three normalized indicators, the standard deviation of each component reflects its relative contribution to the spatial heterogeneity of SCCI. Therefore, LCI contributed most strongly to the variation in conflict index values among individual grid cells. Overall, LSI mainly determined the overall magnitude of SCCI, whereas LCI primarily shaped its spatial differentiation pattern.
Table 8.
Contribution analysis of individual conflict component indices to PLES conflicts in Shenmu City from 2000 to 2020.
3.2.2. Conflict Differentiation Characteristics of PLESs
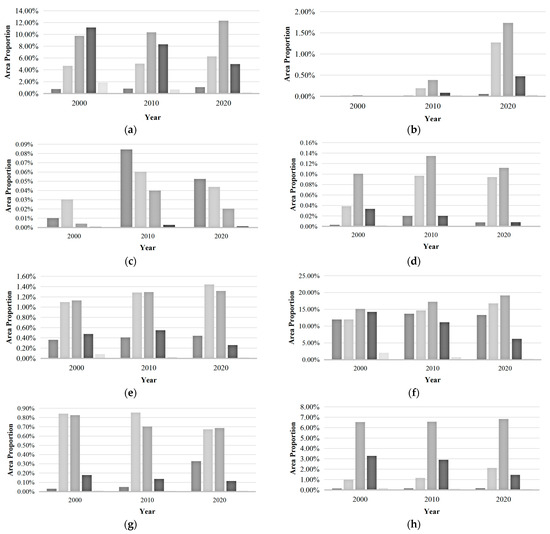
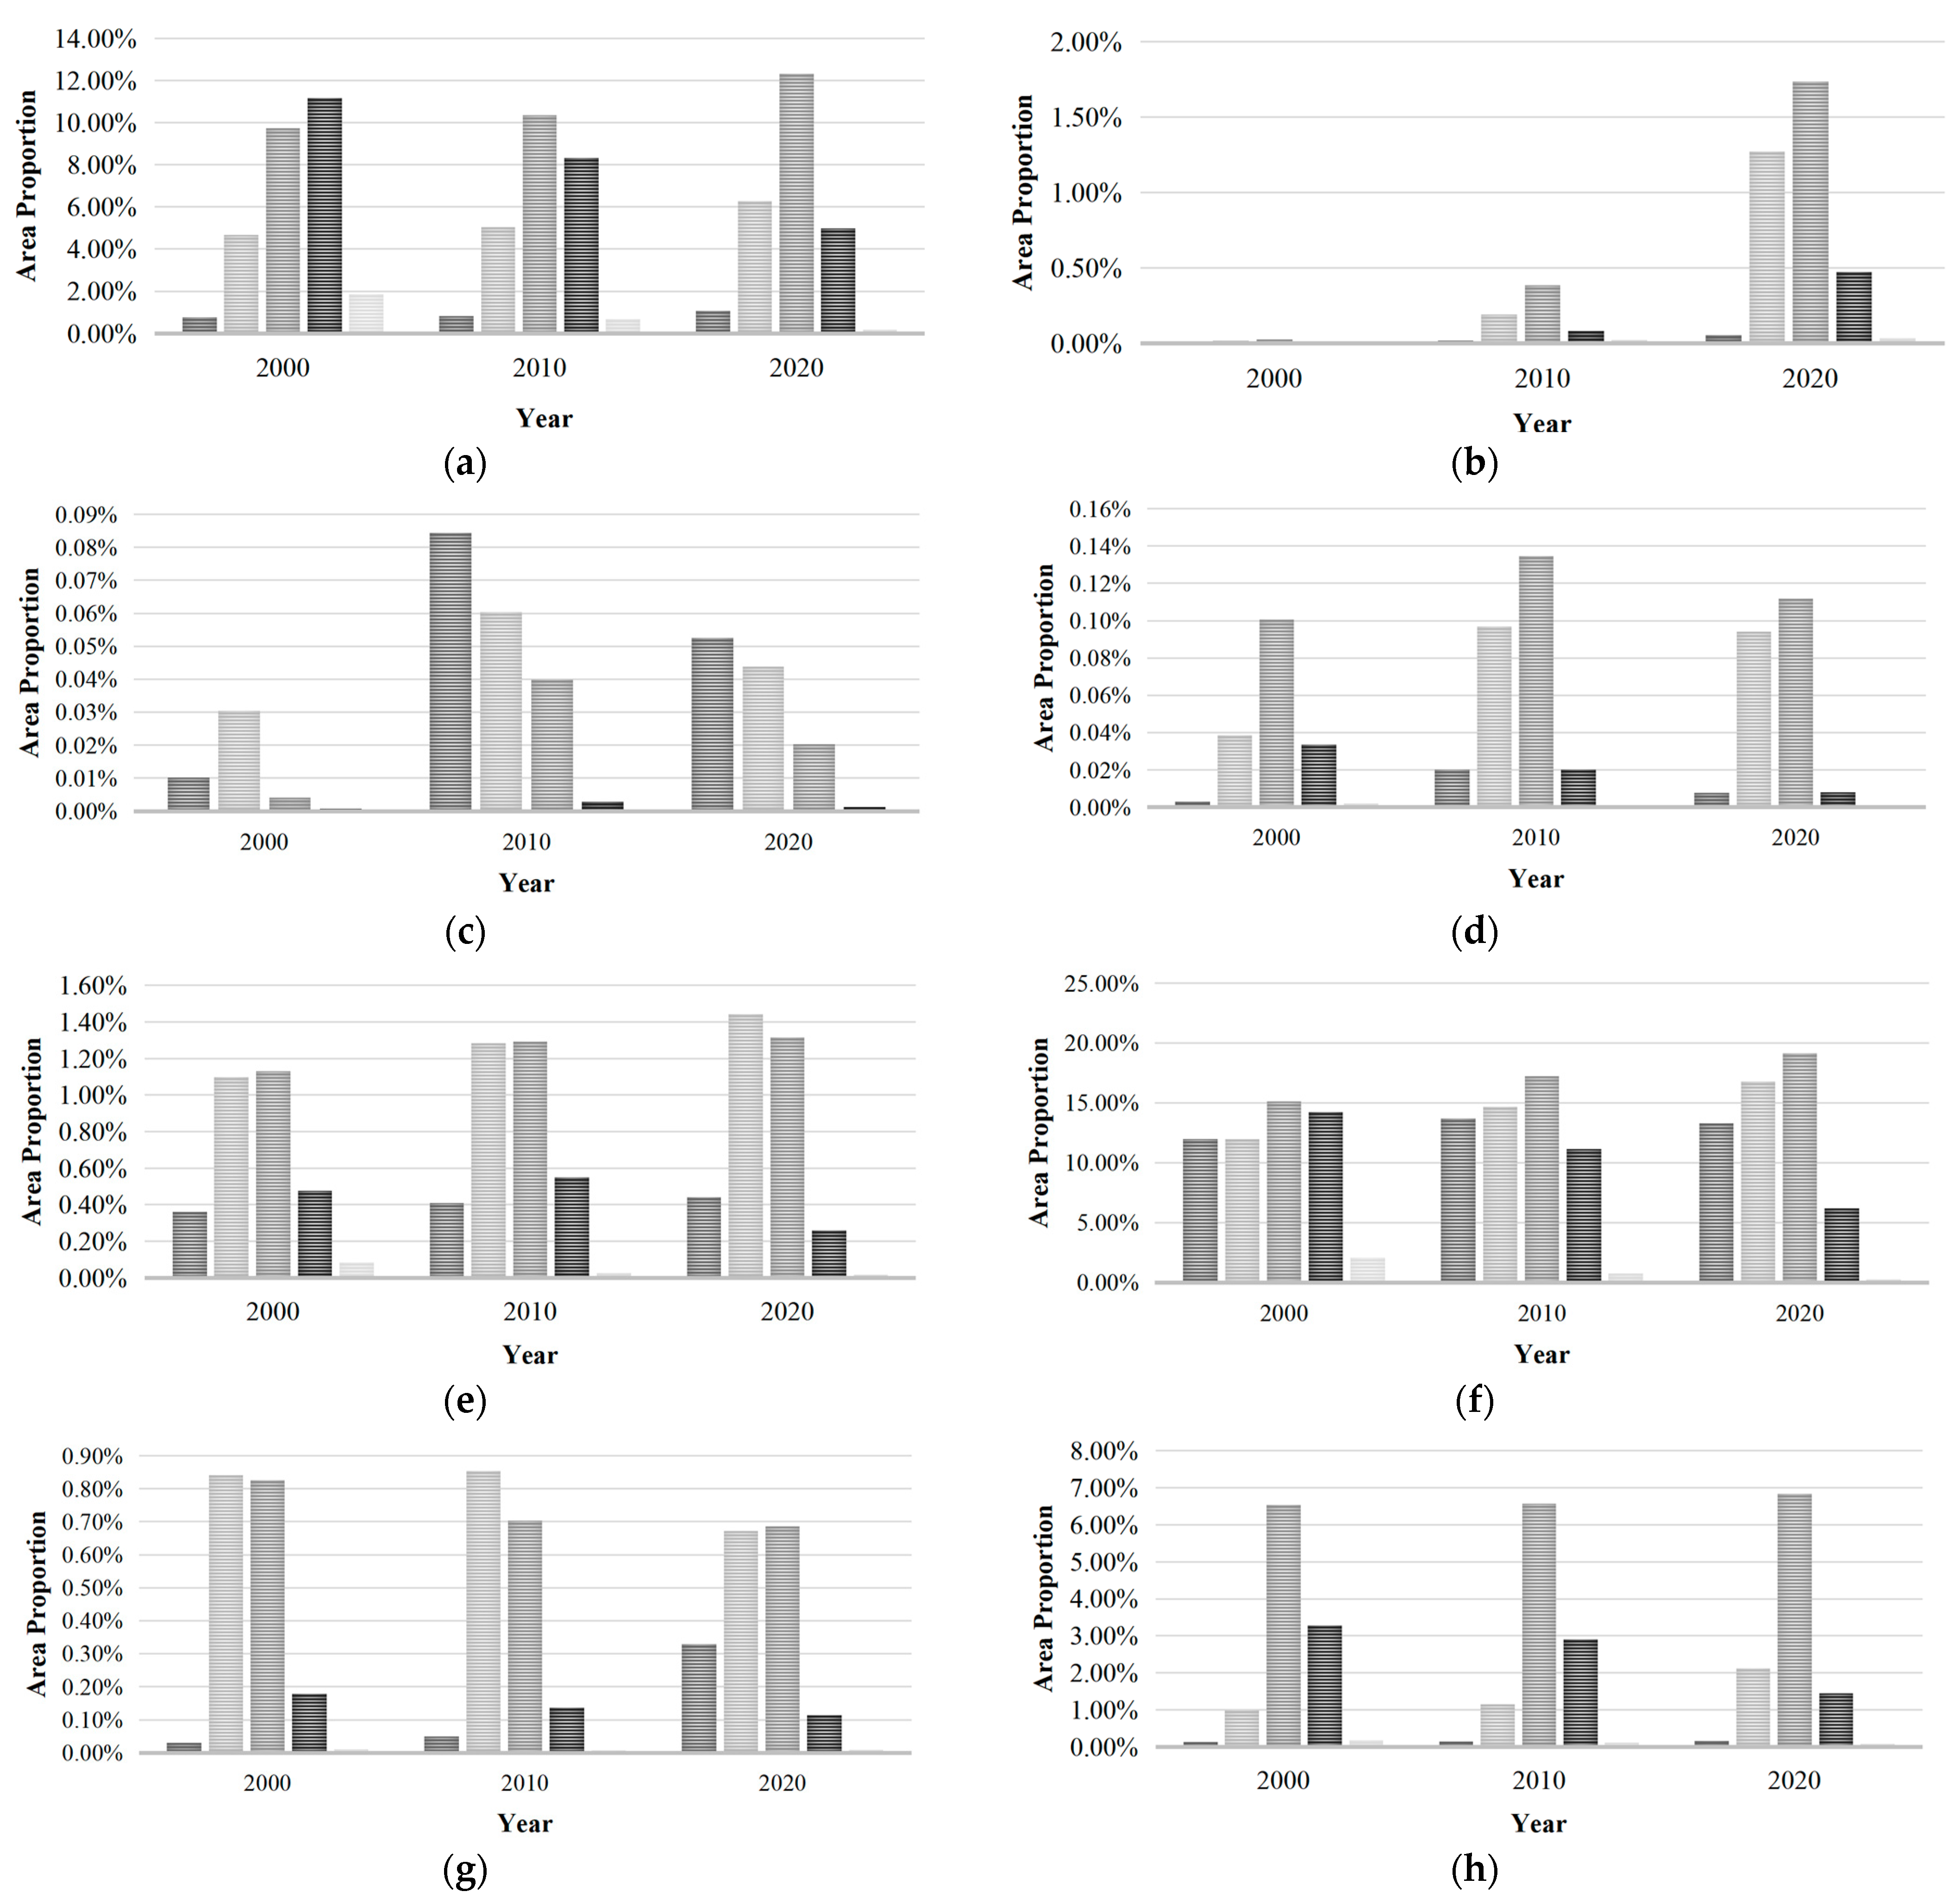
Clear differences in conflict characteristics were observed among different PLES types in Shenmu City (Figure 5), although all spatial types generally showed a tendency to shift from high-intensity conflict toward moderate spatial conflict. Within production space, agricultural production space accounted for a relatively high proportion of moderately strong spatial conflict in 2000 (11.18%), indicating that construction land had clearly encroached on agricultural production space under the influence of resource exploitation. By 2020, strong spatial conflict had nearly disappeared, while moderate spatial conflict had become the dominant type, rising to 12.33%. Although agricultural production space gradually stabilized, spatial competition remained evident. Industrial production space showed relatively low conflict levels in the early study period. However, as mining areas expanded and developed, spatial conflicts began to emerge around 2010. By 2020, the proportion of moderate spatial conflict had increased substantially to 1.73%.
Figure 5.
Changes in spatial conflict levels among different spatial types in Shenmu City from 2000 to 2020. (a) Agricultural production space; (b) industrial production space; (c) urban living space; (d) rural living space; (e) forest ecological space; (f) grassland ecological space; (g) water ecological space; (h) other ecological space.
The overall conflict level in living space remained low. Urban living space was dominated by weak and relatively weak spatial conflict throughout the three periods, indicating strong structural stability. Rural living space showed slightly higher conflict levels than urban living space, but it still remained at a generally low conflict level. From 2000 to 2010, the proportions of relatively weak and moderate spatial conflict increased, suggesting an increase in spatial functional mixing. However, the conflict structure became more stable in the subsequent period.
Conflict differentiation was most pronounced within ecological space. Forest ecological space and water ecological space maintained generally weak spatial conflict with limited fluctuations, mainly under the influence of natural constraints and ecological protection policies. Grassland ecological space showed relatively high conflict sensitivity. In the early period, moderate and relatively strong spatial conflicts accounted for relatively large proportions because of coal resource exploitation. Subsequently, relatively strong spatial conflict declined significantly, whereas moderate spatial conflict continued to accumulate and became dominant by 2020, accounting for 19.14%. Other ecological space was dominated by moderate spatial conflict throughout the study period. Although relatively strong spatial conflict accounted for a certain proportion in the early stage, it decreased from 3.28% to 1.45% by 2020.
3.2.3. Spatial Autocorrelation Characteristics of Conflicts in PLES
The results of the global spatial autocorrelation analysis (Table 9) show that the p-values for all three periods from 2000 to 2020 were less than 0.01, indicating that the significance tests were passed and that the spatial autocorrelation results were statistically reliable. Global Moran’s I values were 0.623537, 0.522040, and 0.492283 in the three years, respectively. All values were positive, confirming the presence of significant spatial clustering. However, the values showed a downward trend, with the largest decrease occurring between 2000 and 2010. This weakening of spatial clustering suggests that conflict management should not rely solely on a few concentrated high-conflict zones, but should adopt a more spatially distributed governance approach.
Table 9.
Results of global spatial autocorrelation of conflicts in PLESs in Shenmu City from 2000 to 2020.
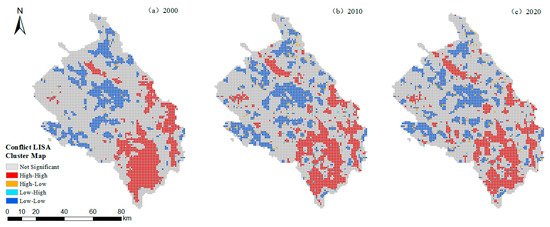
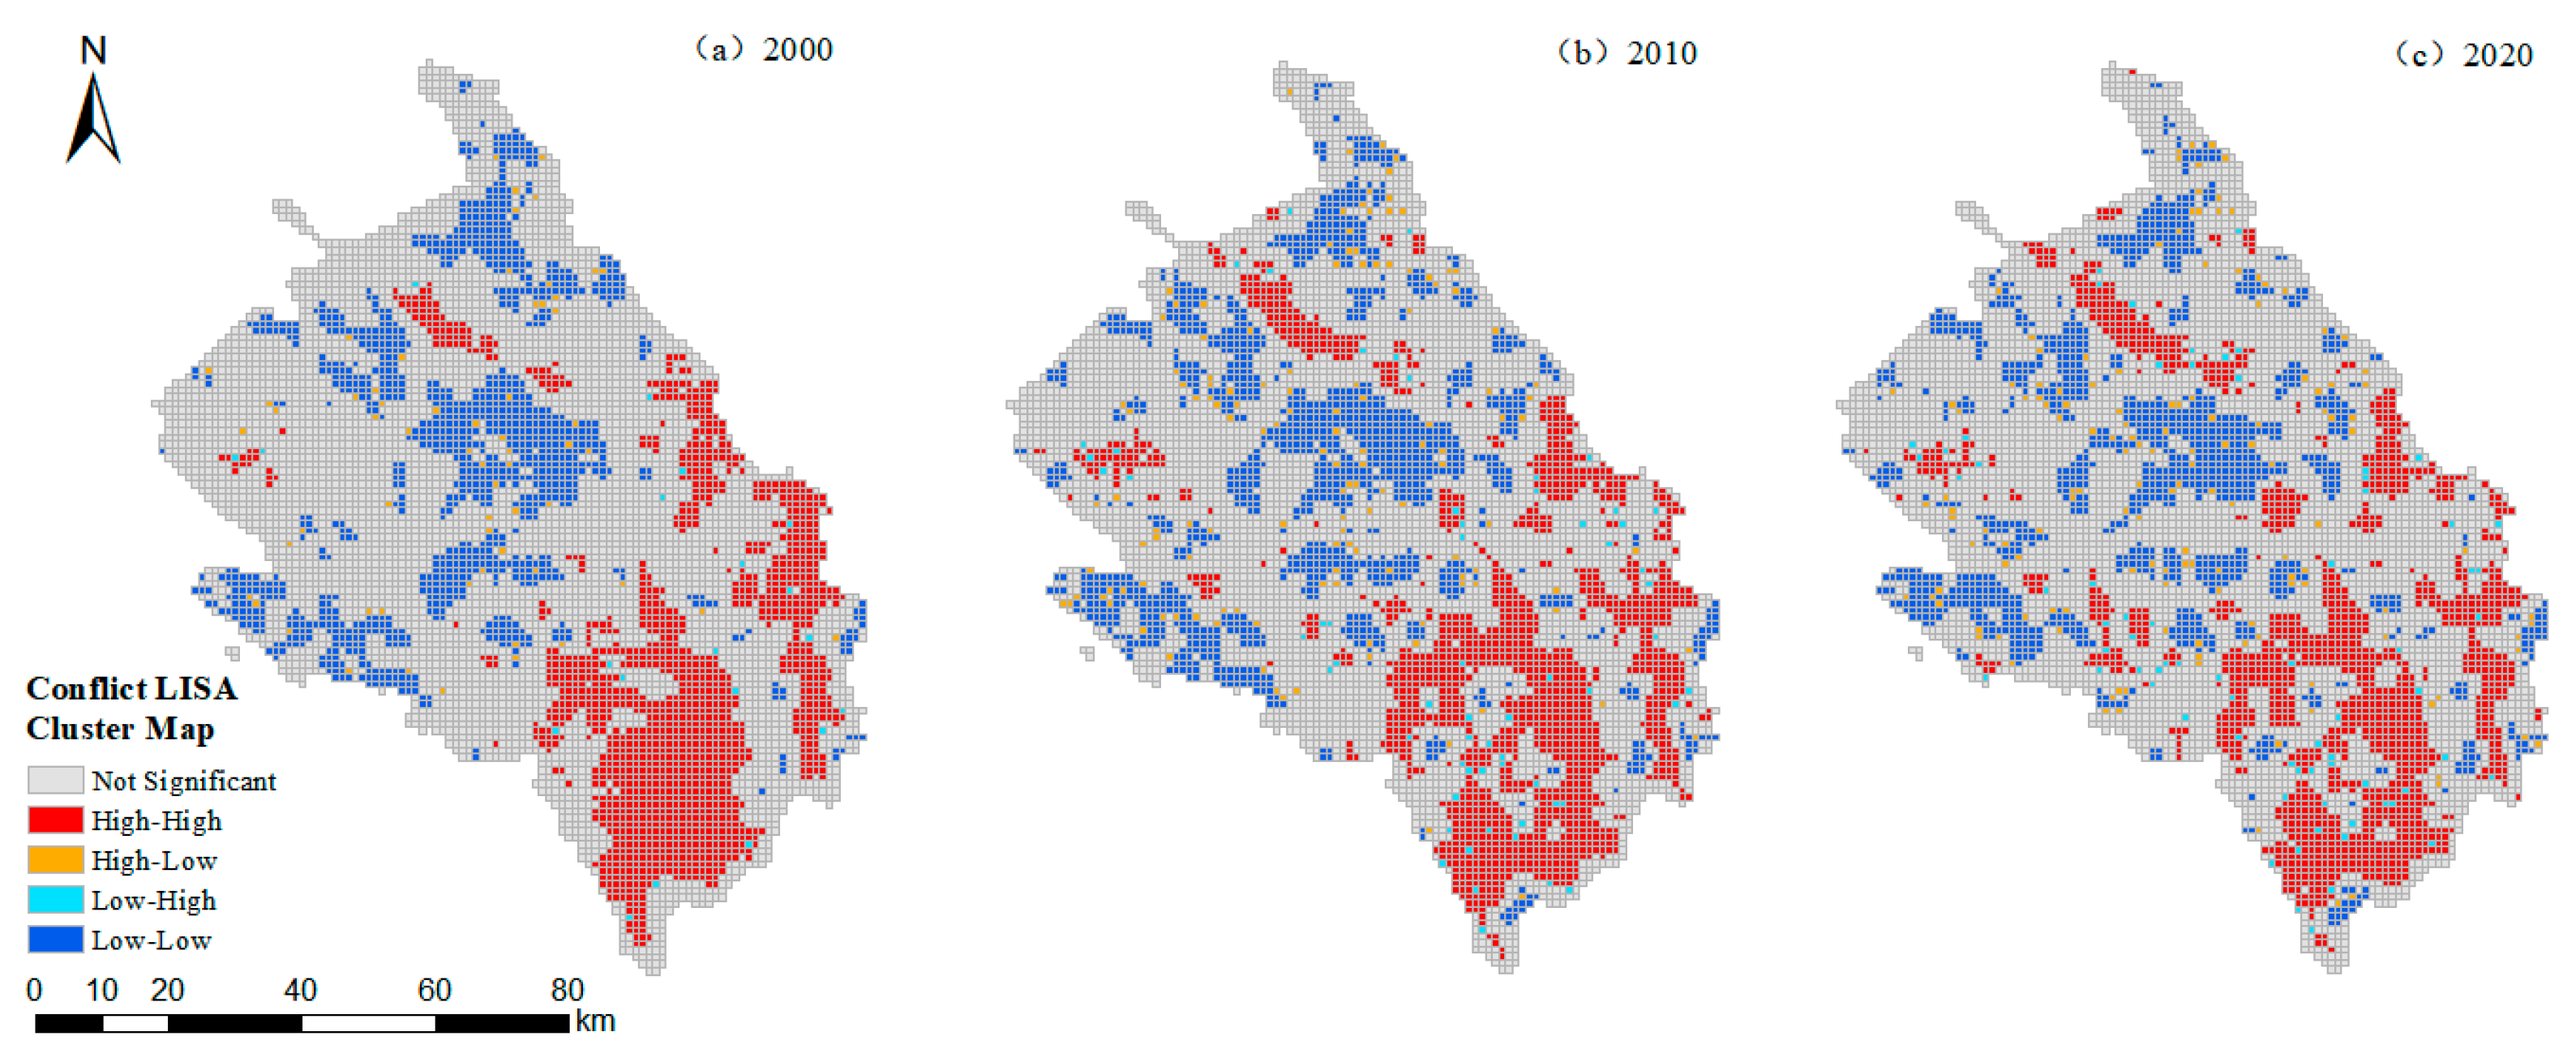
Local spatial autocorrelation further identified the locations of conflict clusters and the aggregation effects among different conflict units (Figure 6). High–High and Low–Low clusters were the dominant types, while High–Low and Low–High clusters appeared only sporadically. High–High conflict clusters were mainly concentrated in Hejiachuan Town and Wanzhen in the southeastern part of the city, as well as Daliuta Town and Jinjie Town in the central area. In these areas, frequent resource extraction and intensive land use generated strong spatial competition. From 2000 to 2010, driven by the rapid expansion of coal development, High–High cluster areas expanded markedly toward the southwest, although their spatial continuity weakened. By 2020, these areas had become more fragmented and increasingly patchy, with a decline in overall concentration. In contrast, Low–Low conflict clusters were mainly distributed in ecological space types in the northwestern part of the city, including Erlintu Town, Zhongji Town, and the marginal zone of the Mu Us Desert. These areas showed a contiguous spatial distribution pattern, and their spatial stability improved gradually over time.
Figure 6.
Local spatial autocorrelation of conflicts in PLESs in Shenmu City from 2000 to 2020.
4. Discussion
As a core component of the Northern Shaanxi Energy and Chemical Industry Base, Shenmu City provides a representative case for understanding the stage-specific evolution of PLES conflicts under the combined influence of resource exploitation and environmental governance. Resource-based cities, in their early years, tend to rely heavily on extractive industries to drive economic growth—a choice that can erode ecological stability and sharpen human–land conflict [45]. The period from 2000 to 2010 reflects this process. During this stage, the rapid expansion of industrial production space led to the pronounced clustering of high-intensity spatial conflicts. This pattern is consistent with the single land-use dynamic degree results: industrial production space increased rapidly, with a dynamic degree of 9.75%, indicating that coal extraction expanded strongly during the early energy-driven development stage. Although industrial production space continued to expand after 2010, its growth rate slowed compared with the previous decade, and the dynamic degree over the whole 2000–2020 period was 4.98%. This change suggests that standardized industrial zoning and ecological regulation under the 12th Five-Year Plan helped internalize some ecological externalities that had previously affected surrounding agricultural and ecological landscapes. Meanwhile, the continued contraction of agricultural production space reflects two concurrent pressures on the same land base: encroachment by mining activities and ecological conversion under the Grain for Green Project. Grassland ecological space, which first expanded and then gradually stabilized, indicates that afforestation and ecological restoration reached the limits of suitable land conversion over time. As a result, grassland ecological space functioned as a dynamic spatial buffer that absorbed part of the tension between production and ecological functions before the regional spatial system moved toward a new equilibrium.
As extractive activities entered a more mature stage, spatial governance and ecological regulation became increasingly institutionalized, guiding regional development toward structural optimization [46]. Since 2010, stricter environmental policies have promoted green mine remediation and ecological restoration programs. The fragmented distribution of restored areas suggests that mine restoration was implemented selectively rather than uniformly, with priority given to key mining areas such as Daliuta and Hejiachuan Towns. This localized focus helps explain why high-conflict hotspots contracted into isolated patches rather than declining evenly across the entire landscape. After Shenmu was transformed from a county into a county-level city in 2017, land-use stability was further strengthened, and conflict dynamics shifted from extensive expansion to a more balanced pattern of structural optimization. The finding that the landscape complexity index (LCI) was the main factor explaining grid-level variation in conflict intensity further supports this spatial pattern, as conflict hotspots remained highly localized. This indicates that local differences in landscape fragmentation were an important driver of spatial conflict. These results provide empirical support for differentiated spatial zoning as a key strategy for reducing land-use conflicts in resource-based cities.
Compared with studies of PLES conflicts in other regions, Shenmu City shows distinctive stage-specific characteristics associated with resource-based urban development. In urbanization-driven cities such as Qianjiang City, PLES conflicts generally show a continuous upward trend, with intense spatial conflicts gradually becoming dominant [47]. Such conflicts mainly result from the planar and incremental expansion of construction land into agricultural and ecological land, and they tend to increase as urbanization progresses. In contrast, conflicts in Shenmu City are driven primarily by intensive coal extraction. Industrial production space expanded in a point-like and linear pattern along transportation corridors and resource-rich zones, with high disturbance intensity but a more concentrated spatial distribution. This difference explains why targeted ecological policies, such as the Grain for Green Program and green mine construction, led to a clear reduction in severe conflicts and a corresponding accumulation of moderate conflicts in Shenmu City. This finding suggests that spatial conflicts in resource-based cities are highly responsive to targeted ecological governance policies. At the provincial scale, the expansion of industrial production space in Shanxi Province was far greater than that in Shenmu City, with urban living space expanding nearly fourfold and rural living space increasing by 1.6 times [48]. By comparison, changes in living space in Shenmu City were relatively moderate, indicating that conflict dynamics at the county scale are more directly shaped by local governance and ecological restoration policies. A similar contrast can be observed in spatial clustering. While spatial clustering in Shenmu City weakened steadily, the Xiamen–Zhangzhou–Quanzhou urban agglomeration showed the opposite pattern, with Global Moran’s I for PLES conflicts increasing from 2000 to 2020 and High–High clustering becoming more pronounced during the same period [49]. This contrast further confirms the different evolutionary mechanisms of PLES conflicts in resource-based cities and urbanization-driven cities. Resource-based cities may benefit more directly from targeted ecological governance policies, which can guide conflict patterns toward a more dispersed and balanced distribution. By contrast, urbanization-driven cities often experience more centralized and cumulative conflict dynamics because of sustained population pressure and continued economic development. Therefore, the pattern identified in this study, characterized by the reduction in severe spatial conflicts and the accumulation of moderate spatial conflicts, should not be regarded as a universal rule. Rather, it reflects the specific developmental stage of a resource-based city under the combined influence of ecological governance policies, highlighting the importance of fine-grained empirical research at the county scale.
Optimizing the spatial layout of PLESs is an important practical approach for reducing spatial conflicts and promoting sustainable territorial development [50]. Based on the findings of this study, three governance directions are proposed. First, localized spatial zoning and differentiated governance measures should be implemented according to conflict intensity [51]. Spatial hotspots characterized by High–High clustering, particularly Daliuta Town, should be treated as priority intervention zones. The traditional approach of “degrade first, remediate later” should be replaced by an integrated extraction–reclamation model. This model can support the restoration of exhausted open-pit mining sites, rebuild local ecological chains, promote green mining infrastructure, and maintain a functional balance between environmental disturbance and ecological rehabilitation [52]. At the same time, Low–Low conflict clusters in the northwestern arid grassland and wind-blown sand zone should continue to be protected through the Grain for Green Program in order to consolidate existing ecological resources and strengthen the regional ecological barrier. For moderate spatial conflict, which is currently the dominant conflict type in Shenmu City, governance should avoid indiscriminate suppression. Instead, moderate conflict should be managed as a transitional condition in the evolution of resource-based cities. A long-term monitoring framework based on a 1 km × 1 km spatial grid should be established to track peripheral ecotones where weak conflicts may develop into moderate conflicts, thereby preventing further deterioration into severe spatial conflicts. Second, the protection of ecological matrices should be strengthened to build a coherent regional ecological security pattern. Multifunctional greenway networks can be used to connect ecological corridors, hydrological systems, core agricultural zones, and post-mining landscapes. Integrating degraded mining areas into the broader greenway network can provide an adaptive framework for ecological restoration and help improve landscape connectivity [53]. Third, the green restructuring of the industrial sector should be promoted to address land-use conflicts at their source. The structural driver of PLES conflicts in resource-based cities lies in institutional path dependence on a single resource-based economy, together with the depletion risks associated with long-term extraction [54]. The observed slowdown in the growth of industrial production space indicates that Shenmu City has entered an important period for economic transition, during which its dependence on raw resource extraction is gradually weakening. Policy measures should therefore accelerate the reduction in coal-industry lock-in effects by developing alternative economic drivers, such as strategic emerging industries and modern service sectors. This would help reduce the continued expansion of mining land into agricultural and ecological spaces. In addition, a spatial conflict early-warning and continuous assessment mechanism should be established. Spatial conflict indices could be incorporated as quantitative thresholds in spatial planning decisions. Such institutional integration would support responsive and dynamic adjustment of functional layouts, prevent conflict accumulation in newly developed areas, and enable early intervention before moderate spatial conflicts escalate into severe conflicts.
5. Conclusions
Set against the backdrop of intensive energy development in Shenmu City, Shaanxi Province, this study drew on land-use data spanning 2000–2020 and combined transfer-matrix analysis, a purpose-built PLES conflict assessment model, and spatial autocorrelation analysis to trace how PLESs and their associated spatial conflicts evolved.
Ecological space and agricultural production space together accounted for most of the PLES pattern in Shenmu City, while industrial production space expanded rapidly. Agricultural production space continued to decline, serving both as a land source for industrial expansion and as an area for ecological conversion. Living space increased slightly, and grassland ecological space functioned as an important transitional space that helped stabilize the overall spatial structure. The intensity of spatial conflicts among PLESs generally shifted from high levels to moderate levels. Moderate spatial conflict remained the dominant category and continued to increase, whereas strong spatial conflict nearly disappeared. Although this indicates a marked decline in extreme conflicts, it also suggests a transfer of conflict intensity rather than a complete resolution of conflicts. The growing concentration of moderate spatial conflict in transitional zones among production, living, and ecological spaces represents a potential risk that requires continued monitoring and adaptive intervention, rather than being interpreted as evidence of full spatial coordination. Spatially, high-conflict areas changed from a concentrated distribution in the southeastern mining region to a fragmented and patch-like pattern, while the northwestern ecological region maintained a consistently stable low-conflict configuration. Conflict responses also varied significantly among spatial types. Grassland ecological space showed the highest sensitivity, whereas conflicts within industrial production space intensified to some extent. The conflict pattern showed significant positive spatial autocorrelation, mainly characterized by High–High and Low–Low clusters. Global Moran’s I continued to decline, indicating that the spatial clustering of conflicts weakened over time and gradually shifted from concentration toward a more balanced pattern. This study identifies an evolutionary trend in resource-based cities characterized by the attenuation of severe spatial conflicts and the accumulation of moderate spatial conflicts. This pattern provides a new scenario for PLES conflict research that differs from urbanization-driven mechanisms. The findings emphasize that an overall decline in conflict intensity does not necessarily indicate the fundamental resolution of conflicts; instead, it may reflect an emerging risk associated with the accumulation of moderate conflicts. This contributes to a better understanding of the phased characteristics of conflict evolution. Methodologically, this study integrates a conflict assessment model and spatial autocorrelation analysis with key stages of ecological governance policy implementation, providing a replicable framework for empirical research on similar resource-based cities and linking quantitative evaluation with policy mechanism analysis.
This study mainly assessed spatial conflicts based on land-use patterns using 30 m resolution data. However, it did not fully incorporate socioeconomic driving factors, and the assessment framework relied primarily on landscape ecological indicators. Future research should adopt approaches such as geographic detector models to identify multidimensional driving mechanisms and integrate ecosystem service value (ESV) assessment, thereby enabling a more comprehensive evaluation of the ecological impacts of spatial conflicts. In addition, this study used three time points, namely 2000, 2010, and 2020, to characterize long-term evolutionary trends over the past two decades. This temporal design may not fully capture nonlinear changes and short-term policy responses within each decadal interval. Future research could incorporate multi-temporal data with higher temporal resolution to more precisely identify the nonlinear processes of conflict evolution and the stage-specific effects of individual policies. Furthermore, this study did not conduct a systematic sensitivity analysis of model parameters, such as the weights of the three dimensions, vulnerability scores, and classification thresholds. Future research could test alternative weighting schemes and classification parameters to further assess the robustness of the conflict measurement results and strengthen the reliability of the conclusions.
Author Contributions
Conceptualization, N.S. and Y.L.; methodology, N.S.; software, N.S.; validation, N.S. and Y.L.; formal analysis, N.S.; investigation, N.S.; resources, Y.L.; data curation, N.S.; writing—original draft preparation, N.S.; writing—review and editing, Y.L.; visualization, N.S.; supervision, N.S.; project administration, Y.L.; funding acquisition, Y.L. All authors have read and agreed to the published version of the manuscript.
Funding
This research was funded by the National Key Research and Development Program of China, grant number 2024YFD2200900.
Institutional Review Board Statement
Not applicable.
Informed Consent Statement
Not applicable.
Data Availability Statement
The original contributions presented in this study are included in the article. Further inquiries can be directed to the corresponding author.
Acknowledgments
The authors would like to thank their colleagues at the College of Landscape Architecture, Northeast Forestry University, for their helpful discussions during this research, as well as the data providers and platforms (including the Resource and Environmental Science and Data Center of the Chinese Academy of Sciences) that supported the spatial analysis in this study. Disclaimer on AI Assistance: During the preparation of this manuscript, the authors used Claude 4 Sonnet (Anthropic) to assist with language editing and to improve the clarity and expression of the text. Following this assistance, the authors thoroughly reviewed, verified, and edited all content, and take full responsibility for the accuracy and integrity of this publication.
Conflicts of Interest
The authors declare that there are no conflicts of interest.
References
- Yu, B.; Lv, C. The progress and prospect of land use conflicts. Prog. Geogr. 2006, 25, 106–115. (In Chinese) [Google Scholar]
- Ahmad, J. Environmental aspects of the Pact for the Future. In Pathways to Sustainable Development; Edward Elgar Publishing: Cheltenham, UK, 2025; pp. 225–240. [Google Scholar]
- State Council of the People’s Republic of China. Notice of the State Council on Issuing the National Territorial Planning Outline (2016–2030); State Council: Beijing, China, 2017. (In Chinese)
- Guan, F.-J.; Liu, L.-H.; Liu, J.-W.; Fu, Y.; Wang, L.-Y.; Wang, F.; Li, Y.; Yu, X.-D.; Che, N.; Xiao, Y. Systematically promoting the construction of natural ecological protection and governance capacity: Experts comments on Master Plan for Major Projects of National Important Ecosystem Protection and Restoration (2021–2035). J. Nat. Resour. 2021, 36, 290–299. (In Chinese) [Google Scholar]
- Huang, J.; Lin, H.; Qi, X. A literature review on optimization of spatial development pattern based on ecological-production-living space. Prog. Geogr. 2017, 36, 378–391. (In Chinese) [Google Scholar]
- Zhang, Y.; Luan, Q.; Xiong, C.; Liu, X. Spatial heterogeneity evaluation and zoning of production-living-ecological space based on multi-source spatial data. Trans. Chin. Soc. Agric. Eng. 2021, 37, 214–223. (In Chinese) [Google Scholar]
- Li, M.; Yun, Y.; Chen, W.; Ma, Y.; Guo, R. Classification and spatial-temporal analysis of “production-living-ecological” spaces in Henan province. Chin. J. Agric. Resour. Reg. Plan. 2018, 39, 13–20. (In Chinese) [Google Scholar]
- Liu, J.; Liu, Y.; Li, Y. Classification evaluation and spatial-temporal analysis of “production-living-ecological” spaces in China. Acta Geogr. Sin. 2017, 72, 1290–1304. (In Chinese) [Google Scholar]
- Zhu, R.; Chen, S. Characteristics and optimization of territorial space in Fujian Province based on production-living-ecological functions. Bull. Soil Water Conserv. 2021, 41, 323–330. (In Chinese) [Google Scholar]
- Liu, H.; Wang, Y.; Xie, Y.; Hu, X.; Liu, M.; Li, M. Characteristics and Functions of Spatiotemporal Evolution of Production-living-ecological Space in Taiyuan Urban Agglomeration Region. Bull. Soil Water Conserv. 2020, 40, 310–318. (In Chinese) [Google Scholar]
- Liu, C.; Yang, Q.; Zhou, F.; Ai, R.; Cheng, L. Assessing production–living–ecological spaces and its urban–rural gradients in Xiangyang City, China: Insights from land-use function symbiosis. Environ. Sci. Pollut. Res. 2024, 31, 13688–13705. [Google Scholar]
- Dong, J.-X.; Peng, S.-Y.; Cui, B.-T.; Jin, R. Multiscale coupling characteristics and driving mechanisms of the production-living-ecological spaces in mountainous urban agglomerations. J. Nat. Resour. 2025, 40, 3182–3200. (In Chinese) [Google Scholar]
- Zhou, D.; Xu, J.; Wang, L. Land use spatial conflicts and complexity: A case study of the urban agglomeration around Hangzhou Bay, China. Geogr. Res. 2015, 34, 1630–1642. (In Chinese) [Google Scholar]
- Campbell, D.J.; Gichohi, H.; Mwangi, A.; Chege, L. Land use conflict in Kajiado district, Kenya. Land Use Policy 2000, 17, 337–348. [Google Scholar] [CrossRef] [Scilit]
- Adams, W.M.; Brockington, D.; Dyson, J.; Vira, B. Managing tragedies: Understanding conflict over common pool resources. Science 2003, 302, 1915–1916. [Google Scholar] [CrossRef] [Scilit] [PubMed]
- Verburg, P.H.; Schot, P.P.; Dijst, M.J.; Veldkamp, A. Land use change modelling: Current practice and research priorities. GeoJournal 2004, 61, 309–324. [Google Scholar] [CrossRef] [Scilit]
- Gormus, S.; Oguz, D.; Esbah, H. Sector conflicts in a protected area: Kapisuyu River, Kure Mountains National Park, Turkey. Fresenius Environ. Bull. 2017, 26, 1333–1351. [Google Scholar]
- Hui, E.C.; Bao, H. The logic behind conflicts in land acquisitions in contemporary China: A framework based upon game theory. Land Use Policy 2013, 30, 373–380. [Google Scholar] [CrossRef] [Scilit]
- Lubida, A.; Veysipanah, M.; Pilesjo, P.; Mansourian, A. Land-use planning for sustainable urban development in Africa: A spatial and multi-objective optimization approach. Geod. Cartogr. 2019, 45, 1–15. [Google Scholar] [CrossRef] [Scilit]
- Peng, J.-J.; Zhou, G.-H.; Tang, C.-L.; He, Y.-H. The analysis of spatial conflict measurement in fast urbanization region based on ecological security—A case study of Changsha-Zhuzhou-Xiangtan Urban Agglomeration. J. Nat. Resour. 2012, 27, 1507–1519. (In Chinese) [Google Scholar]
- Zhao, Y.; Zhang, Y.; Li, X. Evolution and spatial variation of land use conflict intensity in Qian-Gui karst mountainous areas. Carsologica Sin. 2017, 36, 492–500. (In Chinese) [Google Scholar]
- Fu, R.; Wan, W.; Qiao, L.; He, W.; Chen, F.; Chen, W. Research on the Evolution Characteristics and Interaction Mechanism Between Socio-Economy and the “Production-Living-Ecological” Functions of Land Use at the County Level: A Case Study of Henan Province. Land 2026, 15, 459. [Google Scholar]
- Tang, X.; Cai, L.; Du, P. Spatiotemporal evolution and driving forces of production-living-ecological space in arid ecological transition zone based on functional and structural perspectives: A case study of the Hexi Corridor. Sustainability 2024, 16, 6698. [Google Scholar]
- Shi, F.; Zhou, B.; Zhou, H.; Zhang, H.; Li, H.; Li, R.; Guo, Z.; Gao, X. Spatial autocorrelation analysis of land use and ecosystem service value in the Huangshui River Basin at the grid scale. Plants 2022, 11, 2294. [Google Scholar] [CrossRef] [Scilit] [PubMed]
- Sun, W.; Yu, Q.; Xu, C.; Zhao, J.; Wang, Y.; Miao, Y. Construction and optimization of ecological spatial network in typical mining cities of the Yellow River Basin: The case study of Shenmu City, Shaanxi. Ecol. Process. 2024, 13, 60. [Google Scholar] [CrossRef] [Scilit]
- Li, X.; Zheng, Y.; Chen, A.; Zhou, J.; Li, Q.; Hou, Q. Identification of ecological restoration priority areas based on ecological security patterns and risk assessment: A case study of Shenmu City. Acta Ecol. Sin. 2024, 44, 8784–8797. (In Chinese) [Google Scholar]
- Xu, X.; Liu, J.; Zhang, S.; Li, R.; Yan, C.; Wu, S. China’s Multi-Period Land-Use and Land-Cover Remote Sensing Monitoring Data Set (CNLUCC) [Dataset]; Resource and Environment Science and Data Center, Chinese Academy of Sciences: Beijing, China, 2018; Available online: https://www.resdc.cn/data.aspx?DATAID=184 (accessed on 22 June 2026).
- Liu, J.; Kuang, W.; Zhang, Z.; Xu, X.; Qin, Y.; Ning, J.; Zhou, W.; Zhang, S.; Li, R.; Yan, C.; et al. Spatiotemporal characteristics, patterns, and causes of land-use changes in China since the late 1980s. J. Geogr. Sci. 2014, 24, 195–210. [Google Scholar] [CrossRef] [Scilit]
- Duan, Y.; Fu, J.; Zhou, Y. Evolution characteristics of the “production-living-ecological” space and ecological effects in the water source area of the middle route of the South-to-North Water Diversion Project. China Popul. Resour. Environ. 2024, 34, 138–150. (In Chinese) [Google Scholar]
- Wang, Z.; Wang, P.; Zhi, L. Evolution and driving forces of ecological-productive-living space pattern in Dianchi Lake area during 2000–2020. Bull. Soil Water Conserv. 2021, 41, 265–273+281. (In Chinese) [Google Scholar]
- Chen, B.-M.; Zhou, X.-P. Explanation of current land use condition classification for national standard of the People’s Republic of China. J. Nat. Resour. 2007, 22, 994–1003. (In Chinese) [Google Scholar]
- Qiao, W.; Sheng, Y.; Fang, B.; Wang, Y. Land use change information mining in a highly urbanized area based on transfer matrix: A case study of Suzhou, Jiangsu Province. Geogr. Res. 2013, 32, 1497–1507. (In Chinese) [Google Scholar]
- Liao, L.; Dai, W.; Chen, J.; Huang, W.; Jiang, F.; Hu, Q. Spatial conflict between ecological-production-living spaces on Pingtan Island during rapid urbanization. Resour. Sci. 2017, 39, 1823–1833. (In Chinese) [Google Scholar]
- Wei, J.; Zhao, R.; Li, L.; Jia, Z. Study on the spatial and temporal evolution characteristics and spatial conflicts of the land for production-living-ecological in arid areas—A case study of the middle reaches of the Heihe River. Res. Soil Water Conserv. 2021, 28, 284–292. (In Chinese) [Google Scholar]
- Dai, Z.-Y.; Yang, C.-X.; Xin, G.-X.; Wei, Y.-H.; Xiong, X.-X. Evaluation of land use conflicts in hilly and mountainous areas and optimization of their control. J. Southwest Univ. (Nat. Sci. Ed.) 2019, 41, 82–91. (In Chinese) [Google Scholar]
- Ruhan, A.; Liu, D. Research on the carrying capacity of production, living and ecological space and its coupling coordination in Duolun County, Inner Mongolia. PLoS ONE 2024, 19, e0309615. [Google Scholar] [CrossRef] [Scilit] [PubMed]
- Ning, J.; Zhang, S.-W.; Wang, L.; Zhang, Y.-H. Sensitivity analysis of landscape in forest-agriculture ecotones: A case study of Mudanjiang in Heilongjiang Province. J. Northeast For. Univ. 2009, 37, 35–38. (In Chinese) [Google Scholar]
- Chen, B.; Xu, S.; Zhou, Y.; Wang, H.; Ye, Y. Evaluation and coupling coordination analysis of landscape ecological security of Yichang from the perspective of production-life-ecological space. Res. Soil Water Conserv. 2022, 29, 344–351. (In Chinese) [Google Scholar]
- Wang, J.; Liu, X. Recognizing and measuring spatial conflict of land use via “risk-effect”. Trans. Chin. Soc. Agric. Eng. 2022, 38, 291–300. (In Chinese) [Google Scholar]
- Qiu, G.; Niu, Q.; Wu, Z.; Guo, S.; Qin, L.; Wang, Y. Spatial evaluate and heterogeneity analysis of land use conflict in Su-Xi-Chang urban agglomeration. Res. Soil Water Conserv. 2022, 29, 5936. (In Chinese) [Google Scholar]
- Peng, J.; Dang, W.-X.; Liu, Y.-X.; Zong, M.-L.; Hu, X.-X. Review on landscape ecological risk assessment. Acta Geogr. Sin. 2015, 70, 664–677. (In Chinese) [Google Scholar]
- Dong, Z.; Yuan, Q.; Wang, Z.; Ren, P. Analysis and simulation prediction of the evolutionary characteristics of the living-production-ecological spatial conflicts in the agriculture-pastoral ecotone in western Sichuan: Taking four counties in Aba Prefecture as examples. Acta Ecol. Sin. 2023, 43, 6243–6256. (In Chinese) [Google Scholar]
- Moran, P.A. Notes on continuous stochastic phenomena. Biometrika 1950, 37, 17–23. [Google Scholar] [CrossRef] [Scilit] [PubMed]
- Anselin, L. Local indicators of spatial association—LISA. Geogr. Anal. 1995, 27, 93–115. [Google Scholar] [CrossRef] [Scilit]
- Guan, J.; Jiao, H.-F. The evolution process and influencing factors of urban-rural spatial structure in coal resource-based city: A case study of Huaibei city in Anhui province. J. Nat. Resour. 2021, 36, 2836–2852. (In Chinese) [Google Scholar]
- Zhang, W.-Z.; Yu, J.-H. Policy evolution and transformation effect analysis of sustainable development of resource-based cities in China. J. Nat. Resour. 2023, 38, 22–38. (In Chinese) [Google Scholar] [CrossRef] [Scilit]
- Xiao, P.; Xu, J.; Zhao, C. Conflict identification and zoning optimization of “production-living-ecological” space. Int. J. Environ. Res. Public Health 2022, 19, 7990. [Google Scholar] [PubMed]
- Li, H.; Zhang, P.; Zhang, L.; Yang, J.; An, X. Research on the evolutionary characteristics and mechanism of production-living-ecological space in Shanxi Province, China. Sci. Rep. 2024, 14, 31379. [Google Scholar] [PubMed]
- Li, C.; Chen, S.; Li, J.; Zhou, P. Evolution of spatio-temporal characteristics of land use conflict based on productional-living-ecological space—A case study at Xiamen-Zhangzhou-Quanzhou urban agglomeration. Bull. Soil Water Conserv. 2022, 42, 247–254, 262. (In Chinese) [Google Scholar]
- Li, J.; Sun, W.; Li, M.; Meng, L. Coupling coordination degree of production, living and ecological spaces and its influencing factors in the Yellow River Basin. J. Clean. Prod. 2021, 298, 126803. [Google Scholar] [CrossRef] [Scilit]
- Liu, C.; Zhang, Z.; Ji, X.; Tang, N.; Hao, M. Identification and optimization of production-living-ecological spaces based on the comparison of strengths and weaknesses of land functions: A case study of Xiangyang city. Resour. Sci. 2023, 45, 1366–1379. (In Chinese) [Google Scholar]
- Wang, H.-H.; Li, H.-T.; Xie, M.-M.; Xu, M.; Li, S.-L.; Bai, Z.-K. Construction of ecological security pattern for systematic restoration of industrial and mining land in resource-based cities. J. Nat. Resour. 2020, 35, 162–173. (In Chinese) [Google Scholar] [CrossRef] [Scilit]
- Faz, A.; Kabas, S.; Zornoza, R.; Martínez-Martínez, S.; Acosta, J.A. Multifunctional Greenway Approach for Landscape Planning and Reclamation of a Post-Mining District: Cartagena-La Unión, SE Spain. Land 2025, 14, 1657. [Google Scholar]
- Ruan, F.; Yan, L.; Wang, D. The complexity for the resource-based cities in China on creating sustainable development. Cities 2020, 97, 102571. [Google Scholar] [CrossRef] [Scilit]

Disclaimer/Publisher’s Note: The statements, opinions and data contained in all publications are solely those of the individual author(s) and contributor(s) and not of MDPI and/or the editor(s). MDPI and/or the editor(s) disclaim responsibility for any injury to people or property resulting from any ideas, methods, instructions or products referred to in the content. |
© 2026 by the authors. Licensee MDPI, Basel, Switzerland. This article is an open access article distributed under the terms and conditions of the Creative Commons Attribution (CC BY) license.