


Abstract
Enhancing the synergistic governance of pollution control and carbon emission reduction is essential for achieving high-quality development in the Yellow River Basin urban agglomerations. Based on the connotation of synergistic governance of pollution control and carbon emission reduction, we adopt the two-stage network SBM model to calculate the pollution and carbon emission reduction efficiency (PCRE) and synergistic governance efficiency (SGE) of 73 cities in the Yellow River Basin urban agglomerations during 2011–2023. Subsequently, the paper explores the spatiotemporal characteristics, regional disparities, and spatial evolution patterns of the two efficiencies. The results indicate that: (1) Both the PCRE and SGE present considerable fluctuations during the study period. (2) In terms of spatial characteristics, the PCRE and SGE show a spatial pattern of overall dispersion and local concentration. (3) There exist significant differences between PCRE and SGE. The PCRE shows a fluctuating trend and the interregional difference is the primary source of this disparity, while the SGE presents a steady evolutionary tendency, and the transvariation density is the significant factor contributing to the disparity. (4) The spatial analysis reveals significant positive spatial autocorrelation in PCRE. Both PCRE and SGE exhibit state persistence and path dependence in their spatial evolution, with a potential Matthew effect in some transition paths. Spatial Markov results further show that high-efficiency neighborhoods promote upward transitions in neighboring cities, whereas low-efficiency neighborhoods reinforce low-efficiency state persistence.
1. Introduction
The report of the 20th National Congress of the Communist Party of China emphasized the need to “actively address climate change and promote carbon reduction, pollution control, green expansion, and economic growth in a coordinated manner.” This strategic deployment reflects the ecological civilization philosophy that “lucid waters and lush mountains are invaluable assets.” It also provides important guidance for transforming the development mode and building a Beautiful China. China now faces dual pressures from environmental improvement and greenhouse gas reduction. Therefore, accelerating the synergistic governance of pollution and carbon emissions reduction has become essential for China’s comprehensive green transformation [1].
In this context, the Yellow River Basin holds a strategic position in China’s economic development, social progress, and ecological security. The urban agglomerations in the Yellow River Basin serve not only as a crucial ecological barrier but also as a major economic zone. In 2023, the Yellow River Basin Urban Agglomerations covered approximately 1.12 million square kilometers and accounted for about 14% of China’s GDP. The region is also rich in energy and mineral resources. Its coal and natural gas reserves accounted for approximately 75% and 61% of the national total, respectively [2]. Therefore, it serves as a key base for China’s energy, chemical, and basic industries. However, the Yellow River Basin urban agglomerations still face multiple challenges in the process of high-quality development. These include energy security risks, resource constraints, and ecological fragility. Hence, it is necessary to promote the coordinated advancement of pollution and carbon emissions reduction in this region. Also, it is important to narrow inter-city development disparities within the basin. Improving PCRE and SGE can provide an important foundation for ecological protection and high-quality development in the Yellow River Basin. A clear understanding of synergistic governance for pollution and carbon emissions reduction is a prerequisite for measuring PCRE and SGE. PCRE focuses on the efficiency of reducing pollutant emissions and carbon dioxide emissions [3]. By contrast, SGE emphasizes the coordinated governance of both objectives. It aims to reduce pollutant emissions while lowering carbon dioxide emissions, thereby generating integrated environmental and economic benefits [4]. The emissions of atmospheric pollutants and carbon dioxide primarily originate from the processes of energy production and consumption, which is highly overlapping at the source and share the same origin [5,6]. Accordingly, early studies mainly examined the synergistic effects of pollution and carbon emissions reduction from two perspectives. One focused on the co-benefits of pollution control for carbon reduction. The other examined the co-benefits of carbon reduction for pollution control [7,8]. These studies paid particular attention to the emission-reduction effects associated with either objective. The commonly used methods include synergistic control coordinate systems, computable general equilibrium models, coupling coordination degree models, and comprehensive evaluation index systems [4,9,10,11,12]. With the continuous advancement of research, scholars have increasingly regarded pollution and carbon emissions reduction as an integrated system [13]. As a result, quantitative studies have shifted from co-benefit analysis to the evaluation of synergistic effects. From an input-output perspective, many studies have used DEA models to assess the synergy between pollution and carbon emissions reduction [14,15]. The co-benefit perspective mainly emphasizes the joint reduction in pollutants and carbon emissions [16]. By contrast, DEA-based studies under the synergy perspective pay more attention to governance performance. However, some limitations remain. Although two-stage DEA models have been used to measure PCRE and SGE, most studies treat pollutant emissions and carbon dioxide emissions in the first stage only as undesirable outputs. These emissions are rarely incorporated into the second-stage governance process. This design essentially reflects a “no-governance” or “weak-governance” framework. It mainly captures improvements in resource input efficiency and emission reduction performance, rather than the coordinated governance of pollution and carbon emissions.
Furthermore, urban agglomerations are not merely the natural distribution or spatial aggregation of several cities within a given area. Their defining feature lies in the close spatial linkages among cities. Therefore, existing studies have examined the spatial patterns of SGE at different scales. These include the national scale, the provincial scale, and representative urban agglomerations, such as the Yangtze River Delta and the Beijing–Tianjin–Hebei urban agglomerations. In terms of methods, some studies have used hotspot analysis and standard deviation ellipse methods to describe spatiotemporal distribution patterns and dynamic evolution [17,18]. Others have applied exploratory spatial data analysis, such as global Moran’s I and local Moran’s I, to reveal spatial correlation and spatial heterogeneity [19,20]. In addition, the Dagum Gini coefficient has been used to decompose regional disparities and identify their sources [21]. Multiscale geographically weighted regression and spatial Markov chains have also been introduced to reveal the heterogeneous effects of driving factors and the spatial transition patterns of PCRE and SGE over time [22,23]. However, relatively few studies have integrated spatiotemporal distribution, spatial correlation, and spatial differentiation into a unified analytical framework, which constrains a comprehensive understanding of the spatial evolution of PCRE and SGE.
Against this background, this research evaluates PCRE and SGE from a full-process governance perspective and further investigates their spatiotemporal characteristics, regional disparities, and spatial evolution patterns across urban agglomerations in the Yellow River Basin. The main contributions are as follows. Firstly, this paper broadens the analytical perspective by incorporating the concept of full-process governance. Synergistic governance is divided into two connected stages: pollution and carbon emission reduction, followed by collaborative governance. Pollutant emissions and carbon dioxide emissions generated in the first stage are further incorporated as inputs in the second stage. This design enables a more explicit representation of the governance process, rather than simply treating emissions as undesirable outputs. Secondly, the research focuses its research subject on the Yellow River Basin Urban Agglomerations. As a key strategic region for ecological protection and high-quality development in China, this area provides a representative case for examining the coordinated improvement of PCRE and SGE. Thirdly, a two-stage network SBM model is employed to measure PCRE and SGE. Compared with a conventional single-stage framework, this approach can better capture the internal linkage between emission reduction and subsequent governance. Finally, multiple spatial analytical dimensions are integrated. Based on the spatiotemporal distribution of PCRE and SGE, this paper further explores their regional disparities and spatial transition patterns, thereby providing a more comprehensive understanding of the spatial evolution of synergistic governance in the Yellow River Basin urban agglomerations.
2. Research Methods and Data Sources
2.1. Measurement Indicator System
Against the background of the green and low-carbon transition, the traditional extensive development model with high pollution and high emissions is gradually being replaced. A new governance paradigm is emerging, which emphasizes green development, low-carbon transition, and synergistic efficiency improvement. Synergistic governance theory suggests that effective environmental governance should integrate resources, capacities, and governance tools related to different objectives into a systematic framework, thereby generating joint governance effects [24]. However, existing studies on PCRE and SGE often treat pollutant emissions and carbon dioxide emissions as final outputs. These emissions are rarely incorporated into the internal economic system for closed-loop governance [25]. Essentially, this reflects a weak-governance or governance-absent framework for pollution and carbon emissions.
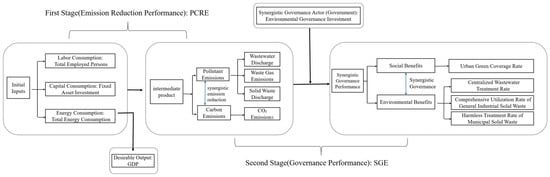
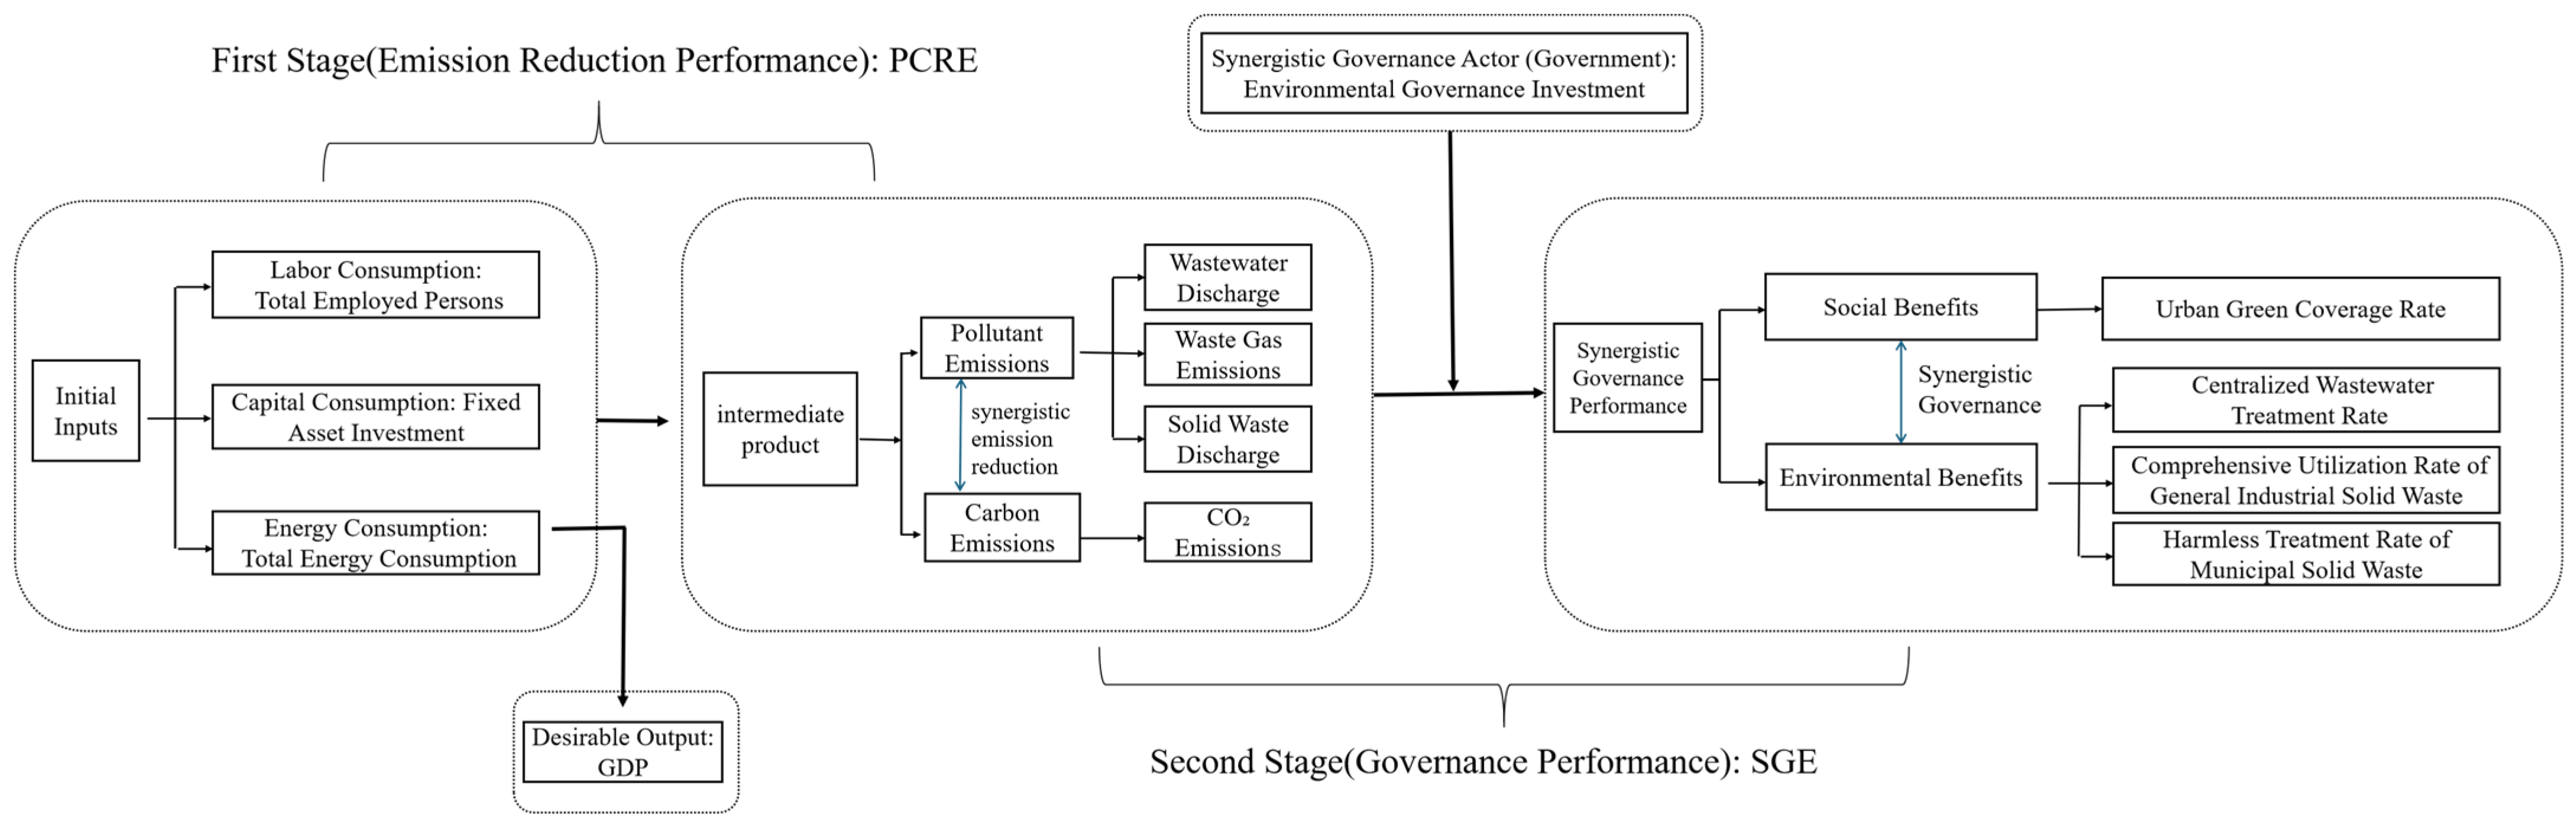
Guided by circular economy theory and sustainable development theory [26,27], this study adopts a full-process governance perspective. Synergistic governance of pollution and carbon emissions reduction is divided into two stages: pollution and carbon emissions reduction, and collaborative governance. Among them, the first stage is based on the perspective of emission, focusing on the synergistic emission efficiency of pollutants and carbon dioxide. Specifically, the PCRE is calculated using the input–output indicators commonly adopted in the academic literature [11]. Unlike existing studies, the second stage is based on the perspective of synergistic governance, incorporating the pollutants and carbon dioxide generated in the first stage as important input factors into the synergistic governance stage for closed-loop treatment [25]. Thus, a synergistic governance framework of “waste as a resource” is constructed at the theoretical level of the circular economy. Most existing studies regard pollutants and carbon dioxide as environmental public goods with significant non-rivalry and non-excludability, which makes it difficult for the market or the public to effectively achieve environmental governance. Therefore, the government is still considered the key actor in realizing effective environmental governance [15]. Hence, this study is based on the perspective of government governance, selecting government governance investment as a key input indicator for achieving the synergistic governance of pollution reduction and carbon mitigation. Regarding the outputs of environmental synergistic governance, no consensus has yet been reached in the academic community. However, many studies have shown that the synergistic governance of pollutants should follow the theories of sustainable development and 3E, ultimately realizing the core objective of coordinated coexistence among the economy, environment, and society [12]. Therefore, based on the perspective of the synergistic governance in environmental benefit and social benefit, this paper selects output indicators to calculate the SGE [28]. Specifically, the centralized treatment rate of wastewater treatment plants, the comprehensive utilization rate of general industrial solid waste, and the harmless treatment rate of domestic waste are selected as output indicators of environmental benefits, while the urban green coverage rate is used as a proxy output indicator of social benefits. These indicators are employed to reflect the synergistic governance of pollution reduction and carbon mitigation at the two output levels of environmental and social benefits. The theoretical analytical framework of the relationship between the two stages is shown in Figure 1.
Figure 1.
Theoretical analytical framework for measuring PCRE and SGE.
Based on the theoretical framework for measuring PCRE and SGE as shown in Figure 1, this article has established an input-output indicator system of PCRE and SGE in Table 1. Among them, fixed asset investment is estimated using the perpetual inventory method [29], and total energy consumption is proxied by nighttime light data [30]. GDP and capital consumption are deflated to 2003 constant prices to remove the influence of price changes.
Table 1.
Input-output indicator system for the synergistic governance of pollution and carbon emissions reduction.
Given the incomplete availability of city-level energy consumption data in certain years, this study employs nighttime light data as a proxy for total energy consumption. Although this approach has been widely adopted in the literature, it may still introduce measurement bias, particularly in heavy-industry-dominated cities, where the relationship between energy consumption and nighttime light intensity may not be strictly linear. To assess the validity of this proxy, nighttime light-based estimates are matched with urban energy consumption data for 2011–2021 compiled by Yang et al. The corresponding data are provided in Appendix A Table A1. The results show a Pearson correlation coefficient of 0.7355 and a Spearman rank correlation coefficient of 0.7497, both statistically significant at the 0.1% level (p < 0.001, N = 803), indicating strong consistency between the two measures in both magnitude and rank ordering.
In addition, a robustness check is conducted by replacing energy consumption with total electricity consumption. The re-estimated results for PCRE and SGE exhibit highly consistent temporal evolution patterns with the baseline findings, suggesting that the main conclusions are robust to alternative specifications of the energy consumption variable. The corresponding results are presented in Appendix A, Figure A1.
2.2. Research Methods
2.2.1. Network SBM Model
Current efficiency measurement methods can generally be classified into two categories: parametric methods and non-parametric methods. Among them, Stochastic Frontier Analysis (SFA) is a typical parametric approach that measures efficiency by constructing a stochastic production frontier and comparing the actual output of a decision-making unit (DMU) with the optimal frontier [31]. One of the major advantages of SFA is its ability to distinguish random errors from technical inefficiency, making it widely used in efficiency evaluation studies. However, SFA requires the prior specification of a production function as well as assumptions regarding the distributions of random error terms and inefficiency terms. When dealing with multiple inputs, multiple outputs, undesirable outputs, and complex production processes, model specification becomes challenging, and the estimation results may be sensitive to functional-form and parameter assumptions. Therefore, its applicability to the measurement of pollution reduction and carbon mitigation efficiency and synergistic governance efficiency is somewhat limited. In contrast, Data Envelopment Analysis (DEA), as a non-parametric method, does not require a predetermined production function and can simultaneously accommodate multiple inputs, multiple outputs, and undesirable outputs [32]. Consequently, it has been widely applied in studies of environmental efficiency, ecological efficiency, energy efficiency, and green development.
Traditional DEA models mainly include the CCR and BCC models, both of which are based on radial measurement and evaluate efficiency through proportional input reduction or output expansion. However, these models ignore the effects of slack variables, such as input redundancies and output shortfalls, which may lead to overestimation of efficiency. To overcome this limitation, Tone proposed the Slack-Based Measure (SBM) model [33], which directly incorporates input redundancies and output deficiencies into the objective function, thereby improving the accuracy of efficiency evaluation. Nevertheless, both traditional DEA and SBM models treat each decision-making unit (DMU) as an indivisible “black box,” providing only an overall efficiency score and failing to reveal the efficiency performance and interaction mechanisms of internal subprocesses.
As production and governance processes become increasingly complex, researchers have further developed the Network DEA model [33], which opens the “black box” of traditional DEA by decomposing a DMU into multiple interconnected stages. This framework enables the characterization of internal operational processes and inter-stage relationships. However, Network DEA still retains the radial measurement characteristics of conventional DEA models and cannot fully capture the slack improvement potential of inputs and outputs in each stage. To simultaneously overcome the limitations of radial measurement and the black-box assumption, Tone and Tsutsui further proposed the Network SBM model [34]. By integrating the slack-handling advantages of the SBM model with the structural advantages of Network DEA, the Network SBM model can not only identify efficiency losses caused by input redundancies and output deficiencies in different stages but also evaluate overall efficiency and stage-specific efficiency simultaneously, making it more suitable for complex production and governance systems.
According to different internal structural characteristics, the Network SBM model can be further extended into two-stage, multi-stage, and parallel network structures [34]. Among them, the two-stage Network SBM model can simultaneously characterize the efficiency performance of different stages and their interrelationships and has therefore been widely applied in studies of environmental governance, ecological efficiency, energy efficiency, and green development. Compared with conventional single-stage DEA models, the two-stage Network SBM model can not only evaluate overall efficiency but also identify stage-specific performance and improvement potential, thereby revealing the sources of efficiency loss. Therefore, this study employs a two-stage Network SBM model to measure pollution reduction and carbon mitigation efficiency (PCRE) and synergistic governance efficiency (SGE) in the Yellow River Basin urban agglomerations. Given the substantial heterogeneity among cities in terms of economic scale, resource endowment, and environmental governance capacity, PCRE and SGE are estimated under the assumption of variable returns to scale (VRS). Considering that the pollution reduction and carbon mitigation stage and the synergistic governance stage are equally important in the overall governance process, equal weights are assigned to the two stages, with (w1 = w2 = 0.5). The overall efficiency of a DMU in the Network SBM model is expressed as follows:
where the efficiency value of each stage is given as follows:
where denotes the link from stage k to stage h; represents the input of the k-th stage and satisfies ; while denotes the intermediate products and satisfies .
2.2.2. Spatial Autocorrelation
Spatial autocorrelation analysis captures the spatial dependence of a regional attribute across neighboring areas. It includes both global and local measures. In this study, Global Moran’s I and Local Moran’s I are used to identify the spatial correlation and local agglomeration patterns of PCRE and SGE in the Yellow River Basin urban agglomerations.
2.2.3. Dagum Gini Coefficient
The Dagum Gini coefficient and its decomposition method are important indicators for measuring regional development imbalance. The overall Gini coefficient can be decomposed into the inter-regional Gini coefficient (), the intra-regional Gini coefficient (), and the transvariation density (), satisfying . Referring to the studies of Chen [35], this paper applies the Dagum Gini coefficient to systematically analyze the regional disparities in PCRE and SGE across the Yellow River Basin urban agglomerations. It also identifies the main sources of these disparities.
2.2.4. Markov Chain
The above analyses based on the Gini coefficient and spatial autocorrelation examine the spatiotemporal disparities of PCRE and SGE in the Yellow River Basin from a static perspective, and thus fail to capture its dynamic evolutionary characteristics. To address this limitation, this study constructs a Markov transition probability matrix to analyze the dynamic evolution patterns of different types of cities within urban agglomerations in the Yellow River Basin across different periods, thereby revealing the state transitions and mobility of cities in terms of upward (or downward) movements among efficiency categories.
However, the traditional Markov chain does not account for the influence of spatial effects on transition processes. Existing studies across different periods and contexts have consistently shown that spatial spillovers arising from geographical proximity play a significant role in regional evolution [36]. Therefore, based on the traditional Markov transition probability matrix, this study further introduces the concept of spatial lag and constructs a spatial Markov chain to examine how the efficiency levels of neighboring cities affect the transition probabilities of local cities. This approach aims to uncover the spatial state transition dynamics of pollution PCRE and SGE in the Yellow River Basin.
2.3. Regional Overview and Data Sources
As the second largest river basin in China, the Yellow River Basin flows from west to east across nine provincial-level regions, including Qinghai, Gansu, Ningxia, Inner Mongolia, Sichuan, Shaanxi, Shanxi, Henan, and Shandong. Following the natural basin boundary defined by the Yellow River Conservancy Commission of the Ministry of Water Resources of China and related studies [37], this study identifies the research area. Cities with severe data deficiencies are excluded due to data availability. The final sample includes panel data for 73 cities in the Yellow River Basin urban agglomerations from 2011 to 2023. These cities are grouped into upstream, midstream, and downstream regions. The detailed results are presented in Appendix A Table A2.
City-level data for the Yellow River Basin urban agglomerations are obtained from the China City Statistical Yearbook, municipal statistical yearbooks, municipal statistical bulletins on national economic and social development, the EPS database, and the Emissions Database for Global Atmospheric Research (EDGAR). Missing values are filled using linear interpolation to ensure the completeness and continuity of the panel data.
3. Measurement and Spatiotemporal Characteristics of PCRE and SGE in the Yellow River Basin Urban Agglomerations
3.1. Comparison of PCRE and SGE Based on Network DEA and Conventional DEA
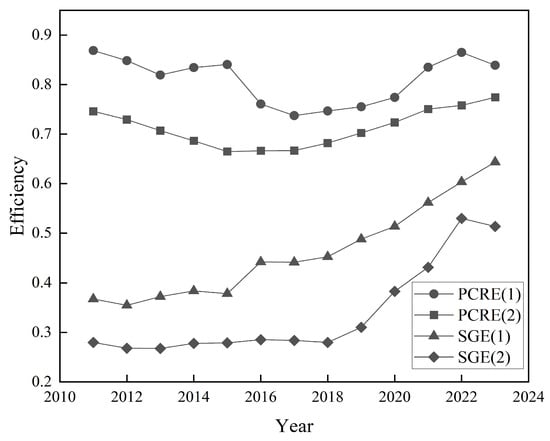
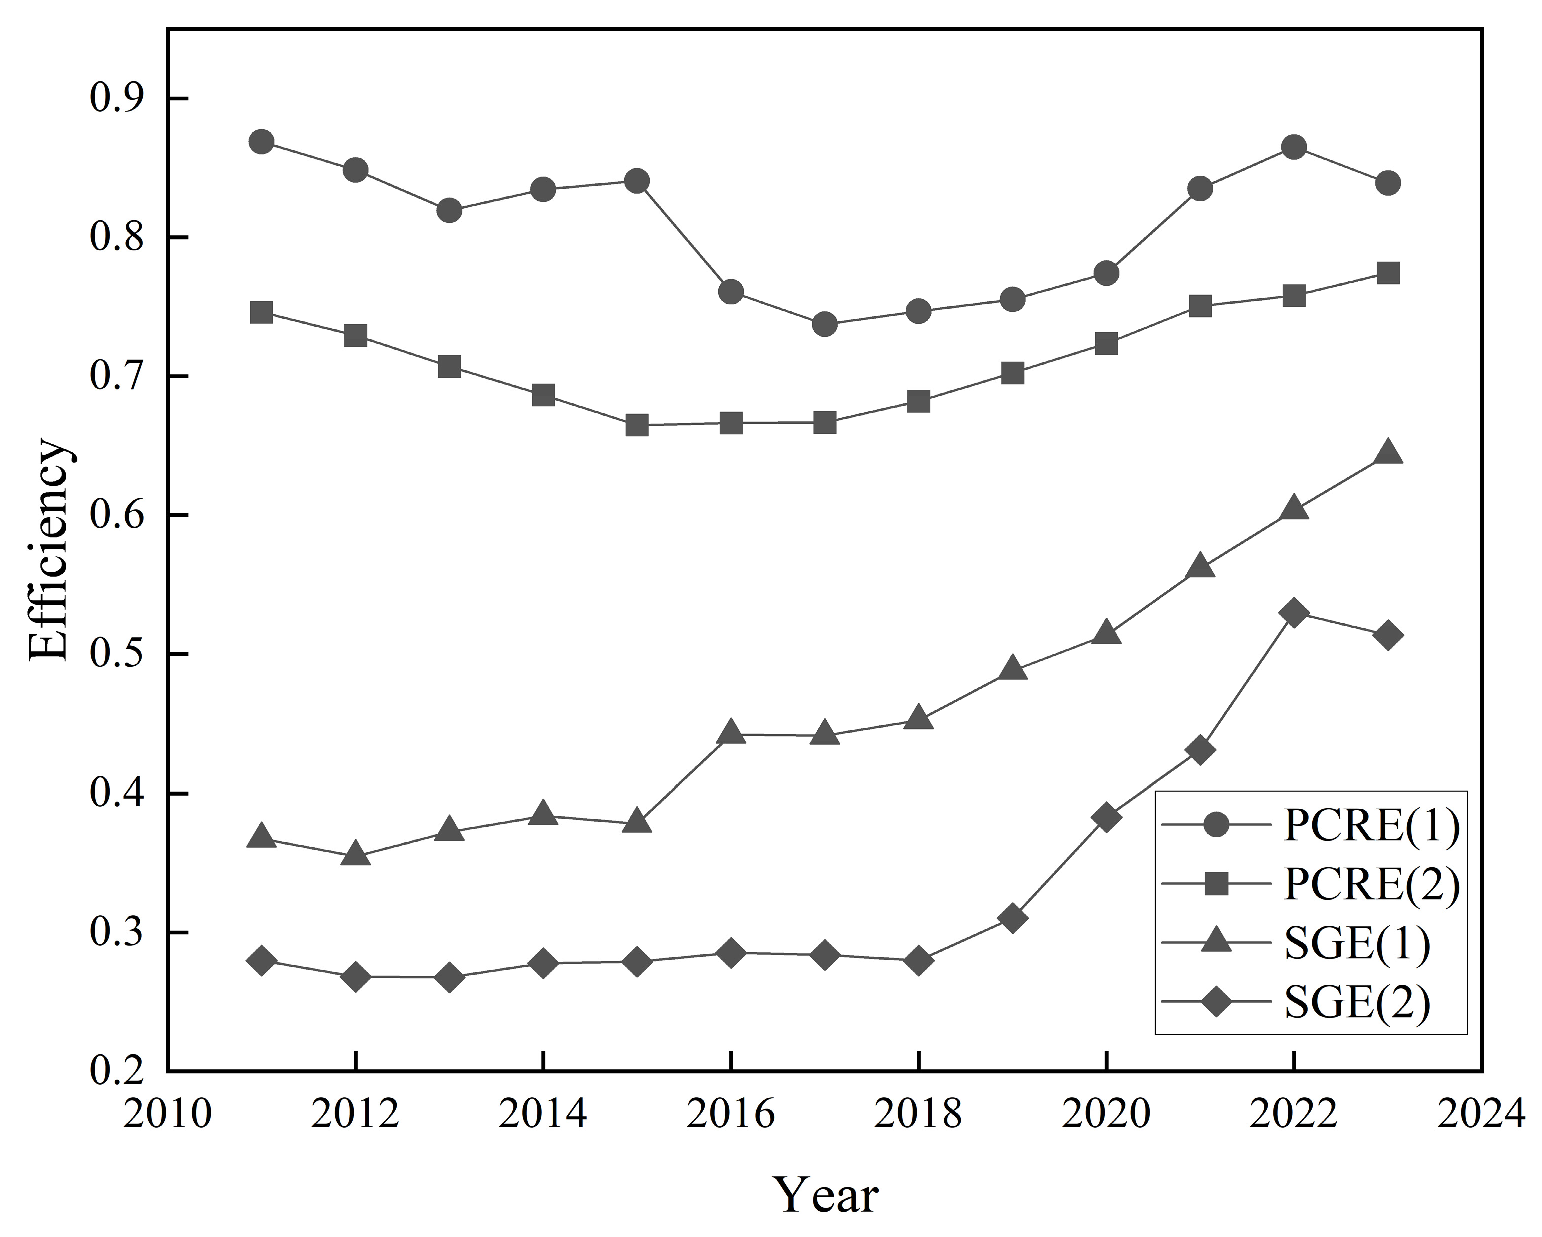
To examine whether model selection affects the efficiency estimates, this study re-estimates PCRE and SGE using a conventional DEA model and compares the results with those obtained from the two-stage Network SBM model, the result is shown in Figure 2. The results show that both methods identify a decline followed by a recovery in PCRE, while SGE generally exhibits an upward trend. Spearman’s rank correlation test further reveals significant positive correlations between the two sets of estimates, indicating a high degree of consistency in their temporal patterns and relative rankings. Although the efficiency scores generated by the Network SBM model are generally higher, this difference mainly reflects variations in the internal stage structure, production possibility set, and efficiency frontier constructed by the two models. Therefore, the consistency in trends and rankings provides further support for the robustness of the main findings, while the Network SBM model is more appropriate for this study because it can identify stage-specific efficiency and the sources of inefficiency.
Figure 2.
Temporal Trends of PCRE and SGE Estimated Using Network SBM and Conventional DEA.
3.2. Temporal Characteristics of PCRE and SGE in the Yellow River Basin Urban Agglomerations
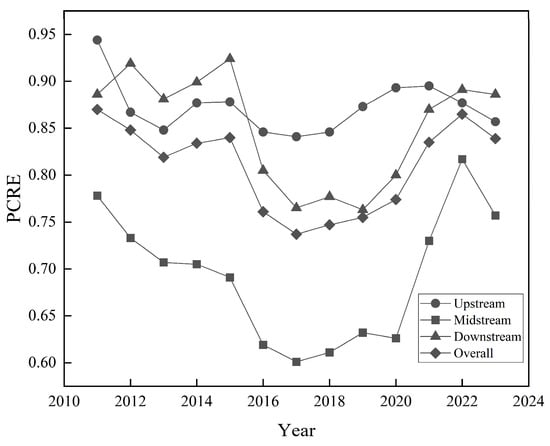
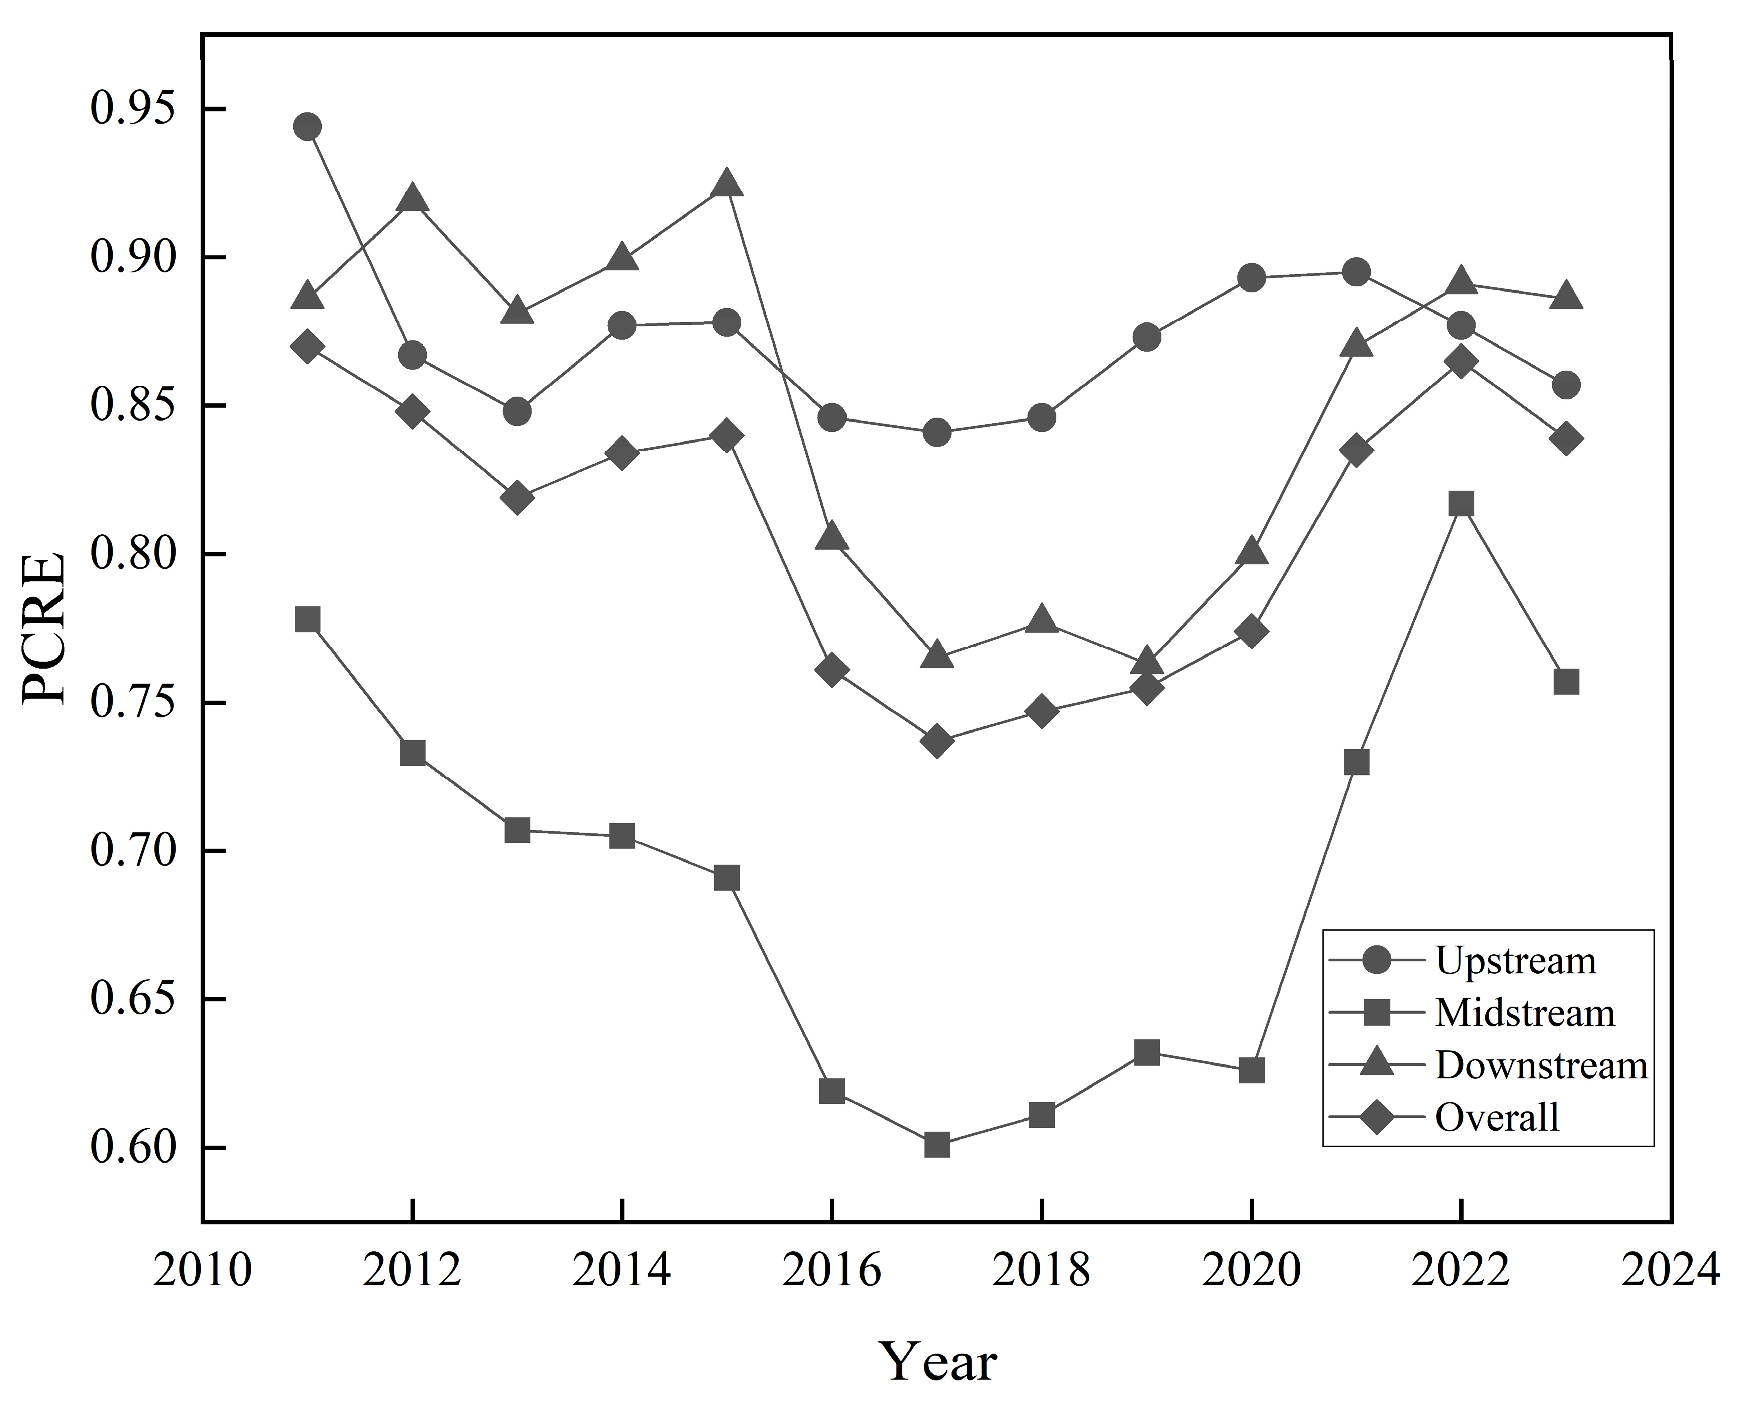
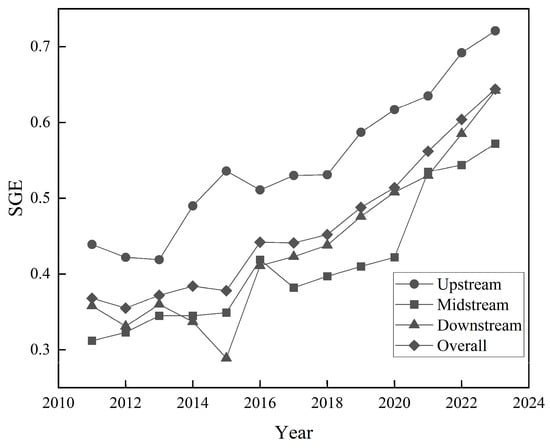
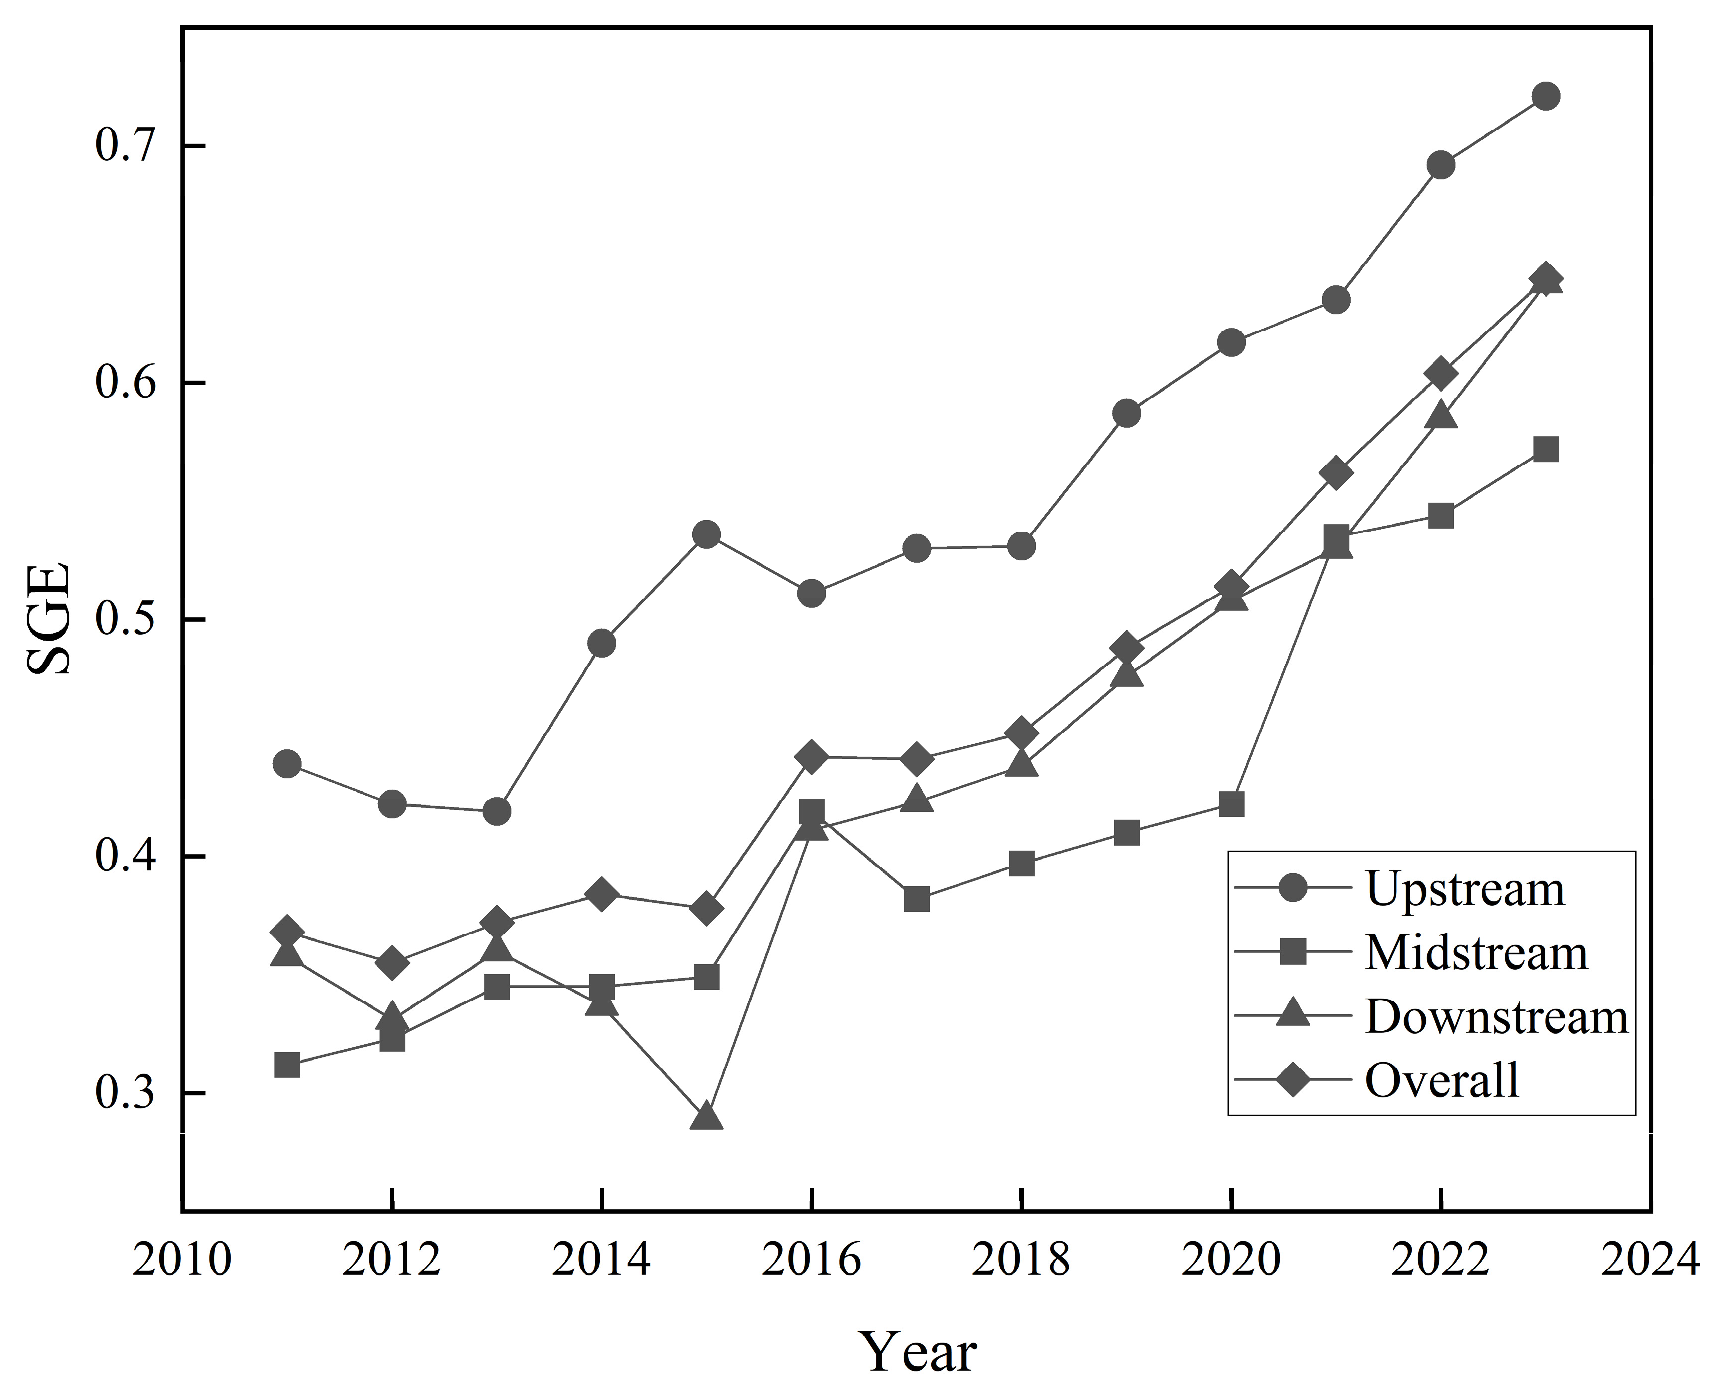
Based on the above indicator system for synergistic governance of pollution and carbon emissions reduction, this study uses the network SBM model to evaluate PCRE and SGE in the Yellow River Basin urban agglomerations. The results are presented in Figure 3 and Figure 4, respectively.
Figure 3.
Temporal Evolution of PCRE.
Figure 4.
Temporal Evolution of SGE.
Overall, both PCRE and SGE in the Yellow River Basin urban agglomerations fluctuated considerably during the study period. To assess the stability and variation range of the annual mean estimates, this study further calculated their 95% confidence intervals. The results show that the confidence interval for PCRE generally shifted downward before subsequently moving upward, whereas that for SGE continued to shift upward, broadly consistent with the stage-specific evolution of the two efficiency measures. The detailed results are presented in Appendix A Table A3. In addition, the Kruskal–Wallis H test indicates that the differences in both PCRE and SGE across years are statistically significant at the 1% level. PCRE first declined and then increased, whereas SGE showed a clear upward trend. This finding is consistent with Xu [38]. Specifically, PCRE declined slowly from 2011 to 2017, with an average annual decrease of 2.73%. It then increased at an average annual rate of 2.18%. This evolution is closely related to national policy implementation and changes in industrial and energy structures. During the 12th Five-Year Plan period, phased targets for pollution reduction were clearly proposed. However, the region still faced several constraints. These included downward economic pressure, slow industrial upgrading, diversified pollution sources, expanding pollution coverage, and persistent environmental impacts. As a result, PCRE showed a downward trend during this period. In contrast, during the 13th Five-Year Plan period, ecological civilization construction and high-quality development were further promoted. Environmental policies also began to generate more evident effects. These changes significantly improved PCRE in the Yellow River Basin urban agglomerations. In comparison, the overall mean value of SGE in the Yellow River Basin urban agglomerations was much lower than that of PCRE. However, SGE maintained a steady upward trend throughout the study period. This indicates that environmental governance performance in the Yellow River Basin has improved markedly. It also suggests that a coordinated mechanism for pollution and carbon emissions reduction has begun to take shape.
From the perspective of regional, clear disparities existed among the upstream, midstream, and downstream regions in both PCRE and SGE. For PCRE, the regional pattern showed distinct stage-specific changes. During the 12th Five-Year Plan period, the pattern was “downstream > upstream > midstream”. During the 13th and 14th Five-Year Plan periods, it shifted to “upstream > downstream > midstream”. This shift can be explained by changes in regional development and environmental governance. During the 12th Five-Year Plan period, the downstream region benefited from advantages in economic development, innovation capacity, and resource-driven growth. As a result, it showed stronger momentum in pollution and carbon emissions reduction. Later, regional coordinated development was further promoted. Meanwhile, the focus of environmental governance gradually shifted from end-of-pipe treatment to source prevention and control. Under this context, the upstream region gradually became a key area for coordinated pollution and carbon emissions reduction. By contrast, the midstream region remained relatively weak. It is a traditional heavy industrial base with many resource-based cities. These cities have long faced difficulties in balancing economic growth and environmental protection. Therefore, PCRE in the midstream region remained low during the study period. In terms of SGE, the Yellow River Basin urban agglomerations consistently followed the pattern of “upstream > downstream > midstream”. This suggests that environmental policy incentives generated greater governance benefits in the upstream region. The midstream region remains the key area for further improvement in collaborative governance.
3.3. Spatial Distribution Characteristics of PCRE and SGE in the Yellow River Basin Urban Agglomerations
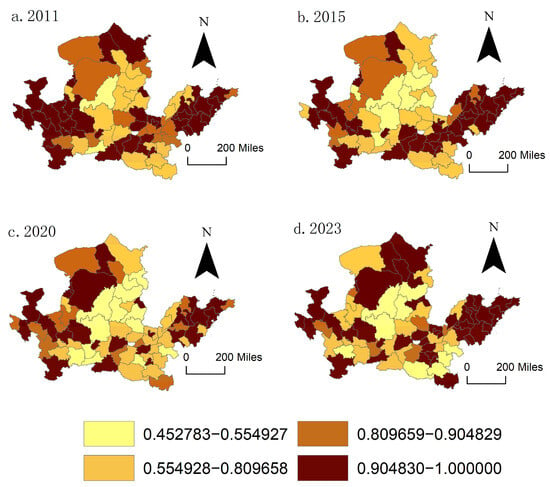
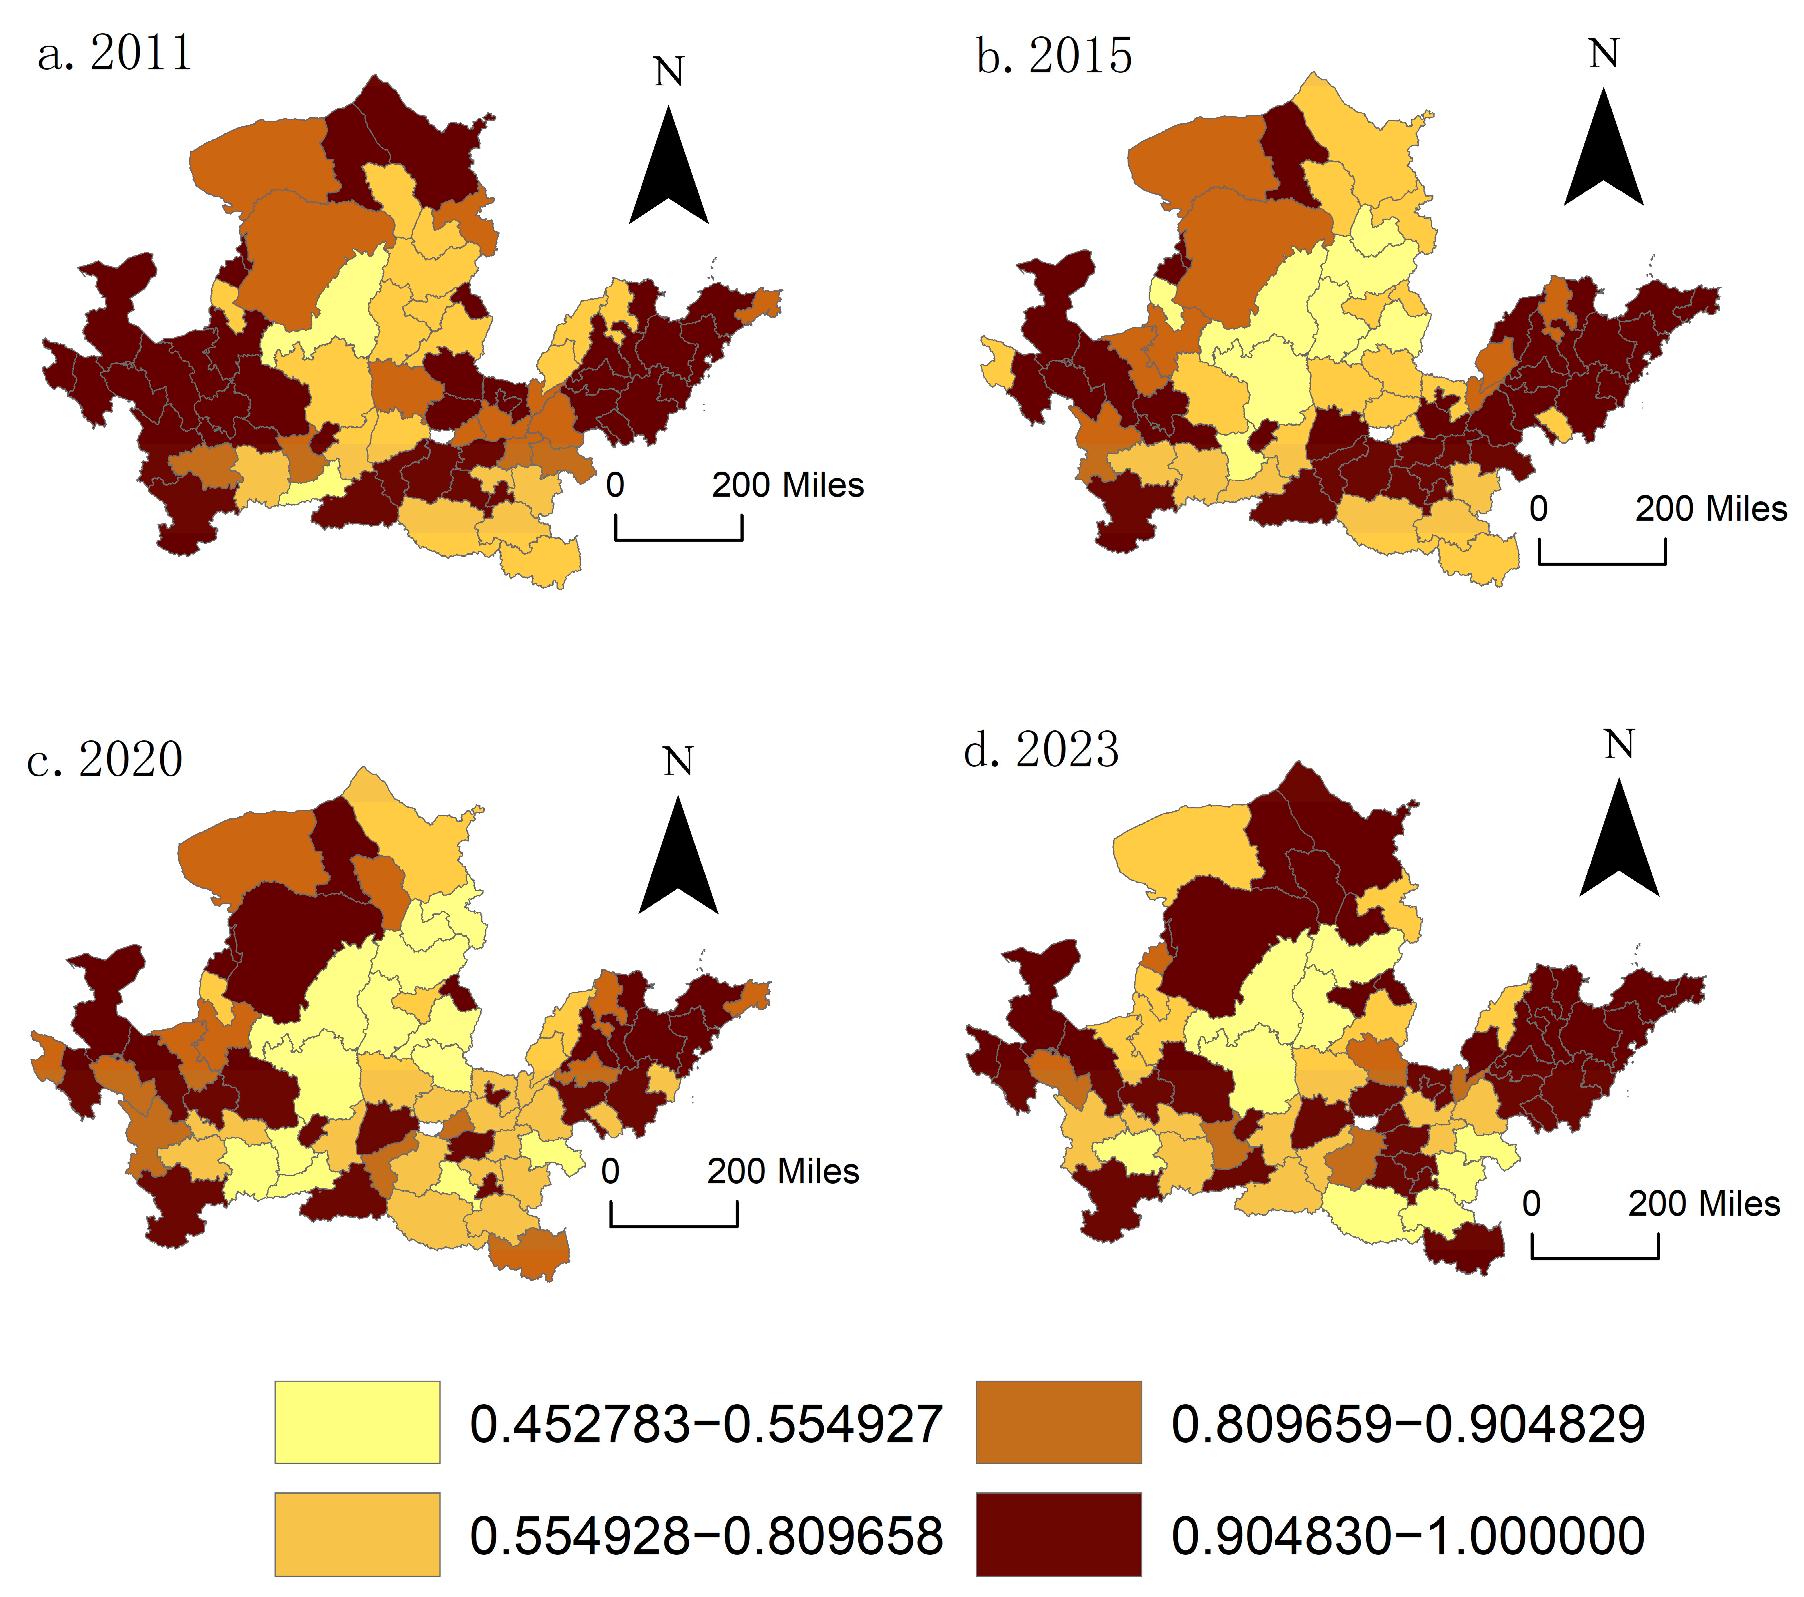
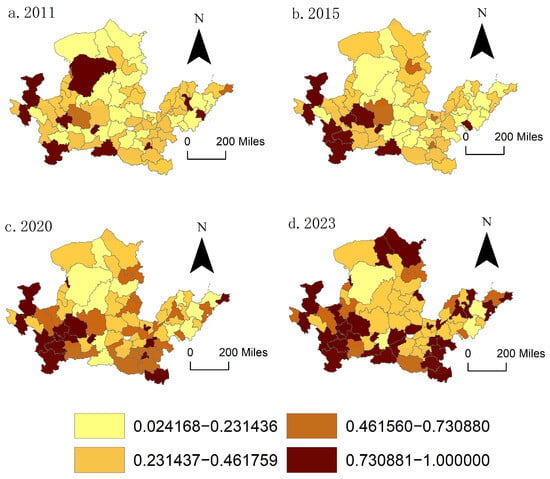
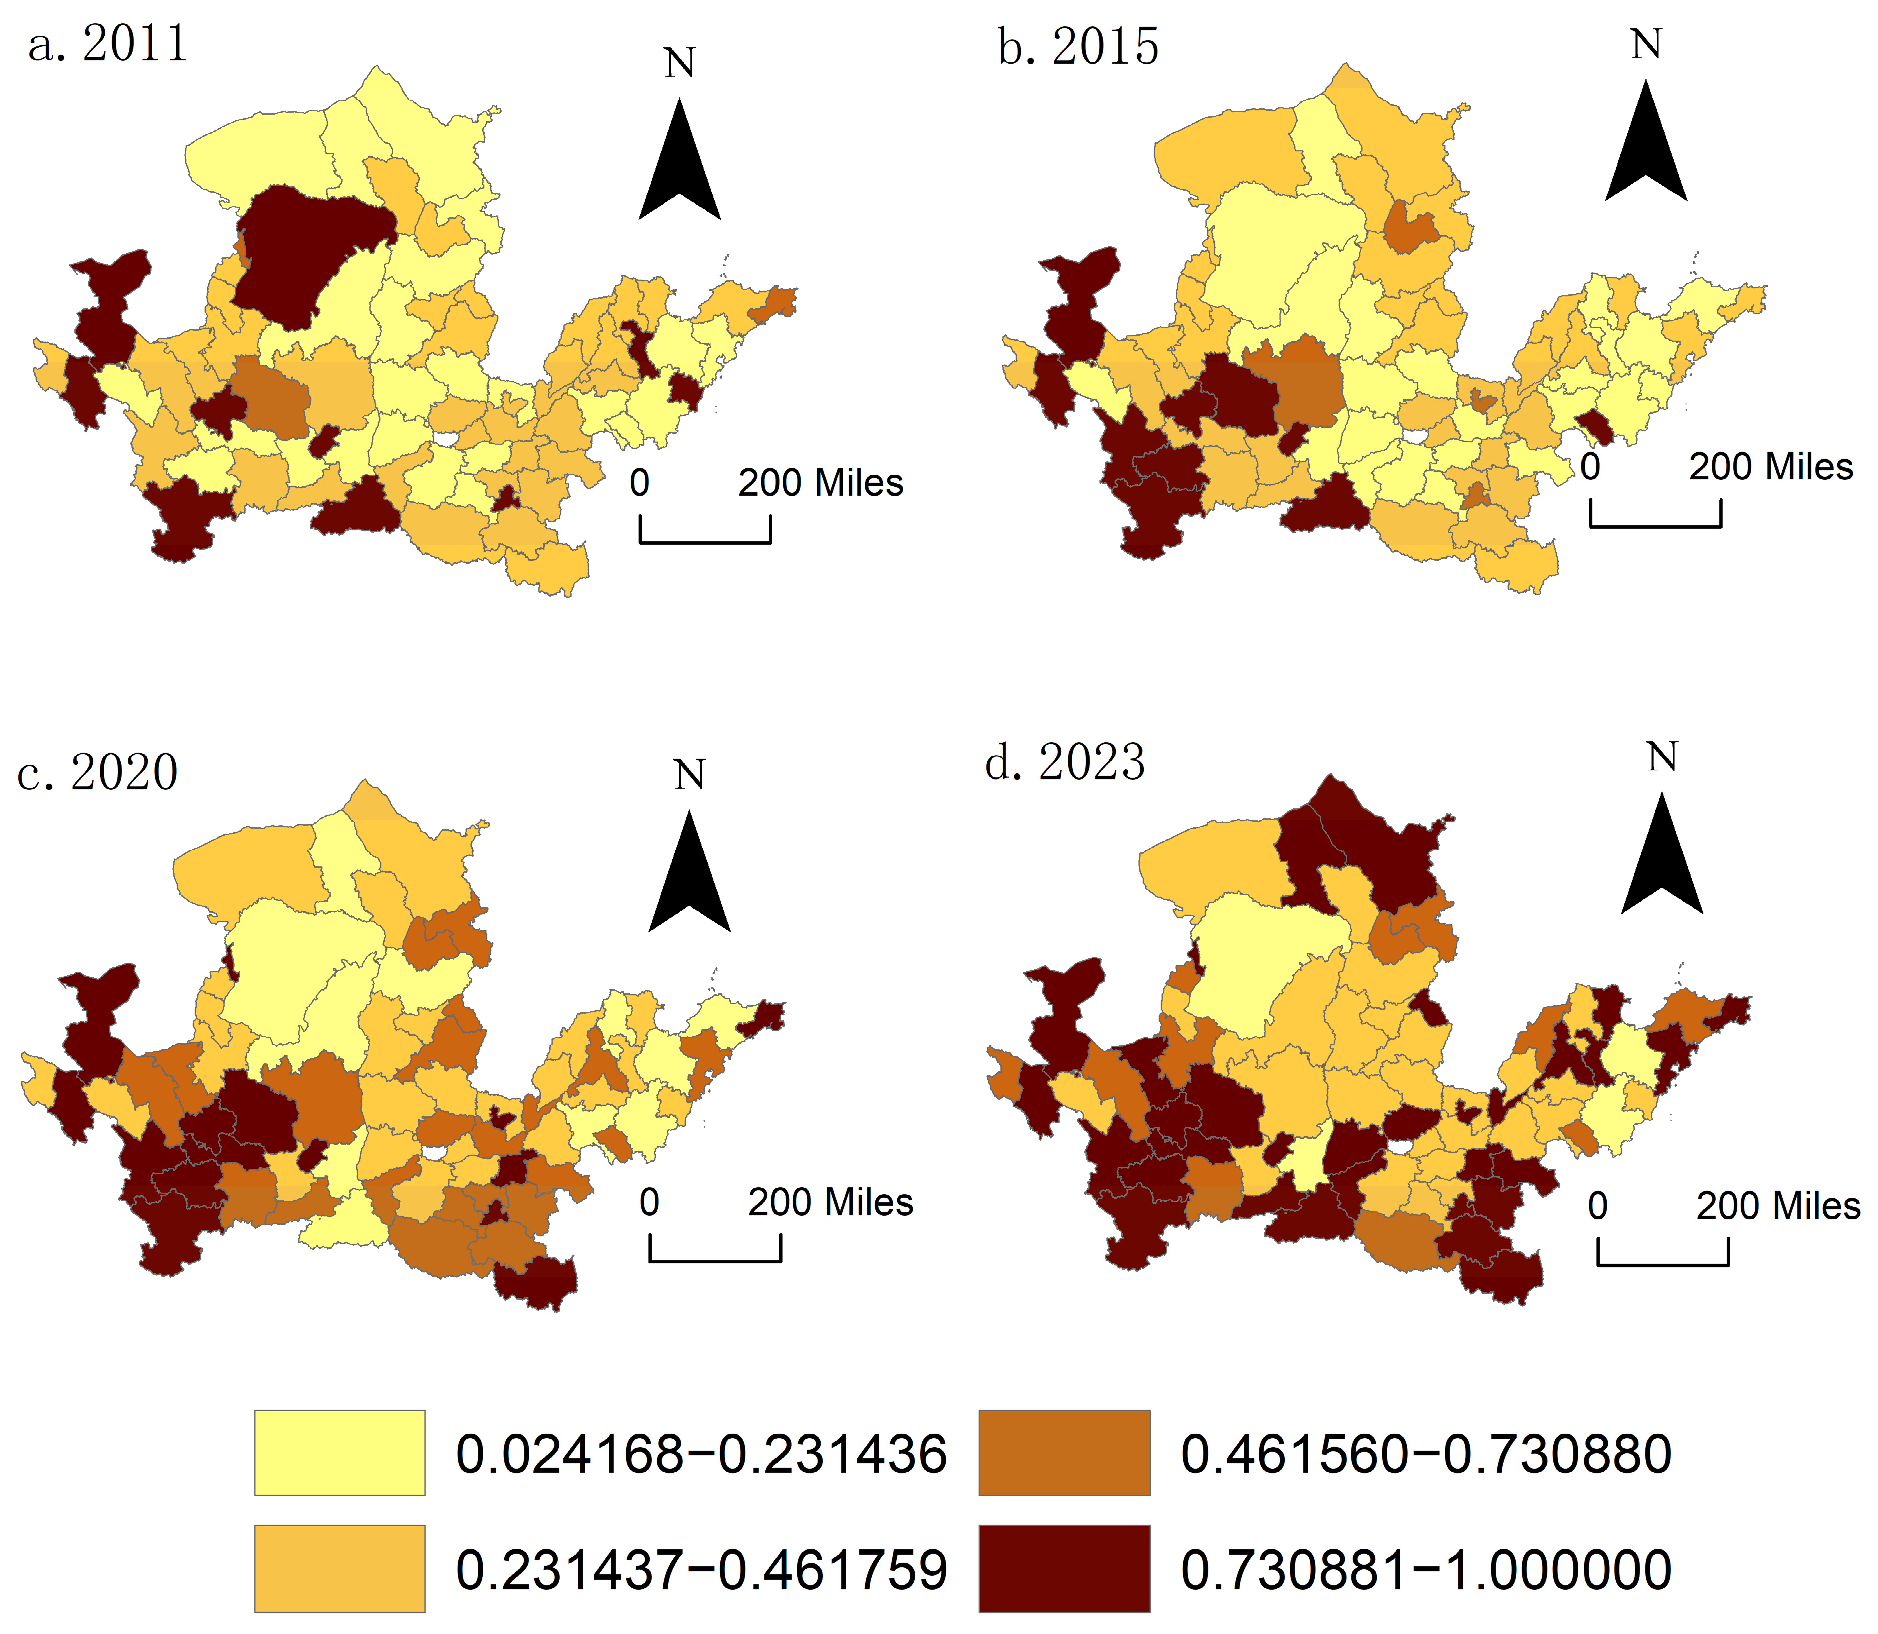
As shown in Figure 5 and Figure 6, PCRE and SGE in the Yellow River Basin urban agglomerations show a spatial pattern of overall dispersion and local clustering. Specifically, PCRE presents a clear spatial differentiation pattern of higher values in the north and lower values in the south. During the study period, PCRE in the northern region remained consistently higher than that in the southern region. In terms of spatial agglomeration, PCRE gradually formed a more evident clustering pattern in the eastern region. In 2011, it showed an initial pattern of east–west clustering. By 2015, a contiguous eastern cluster had formed in the downstream region. After a temporary shift toward regional dispersion in 2020, PCRE returned to a pronounced eastern clustering pattern in 2023. By contrast, SGE shows a spatial differentiation pattern of higher values in the southwest and lower values in the northeast. Throughout the study period, SGE in the southwestern region was significantly higher than that in the northeastern region. In terms of spatial agglomeration, SGE maintained a relatively stable southwestern clustering pattern.
Figure 5.
Spatial Distribution of PCRE. Note: This figure is produced based on the standard map downloaded from the Standard Map Service website of the Ministry of Natural Resources of China, with approval number GS (2024) 0650. The base map has not been modified.
Figure 6.
Spatial Distribution of SGE. Note: This figure is produced based on the standard map downloaded from the Standard Map Service website of the Ministry of Natural Resources of China, with approval number GS (2024) 0650. The base map has not been modified.
3.4. Two-Dimensional Distribution Characteristics of PCRE and SGE in the Yellow River Basin Urban Agglomerations
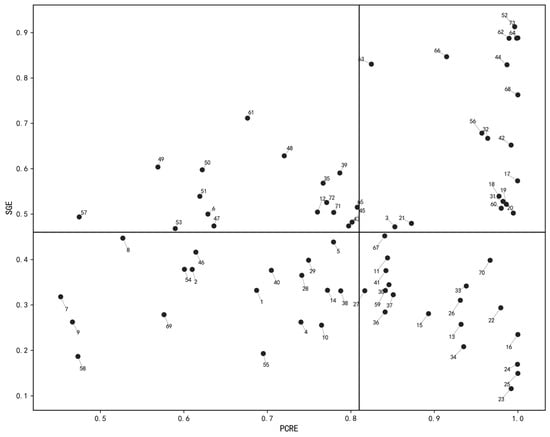
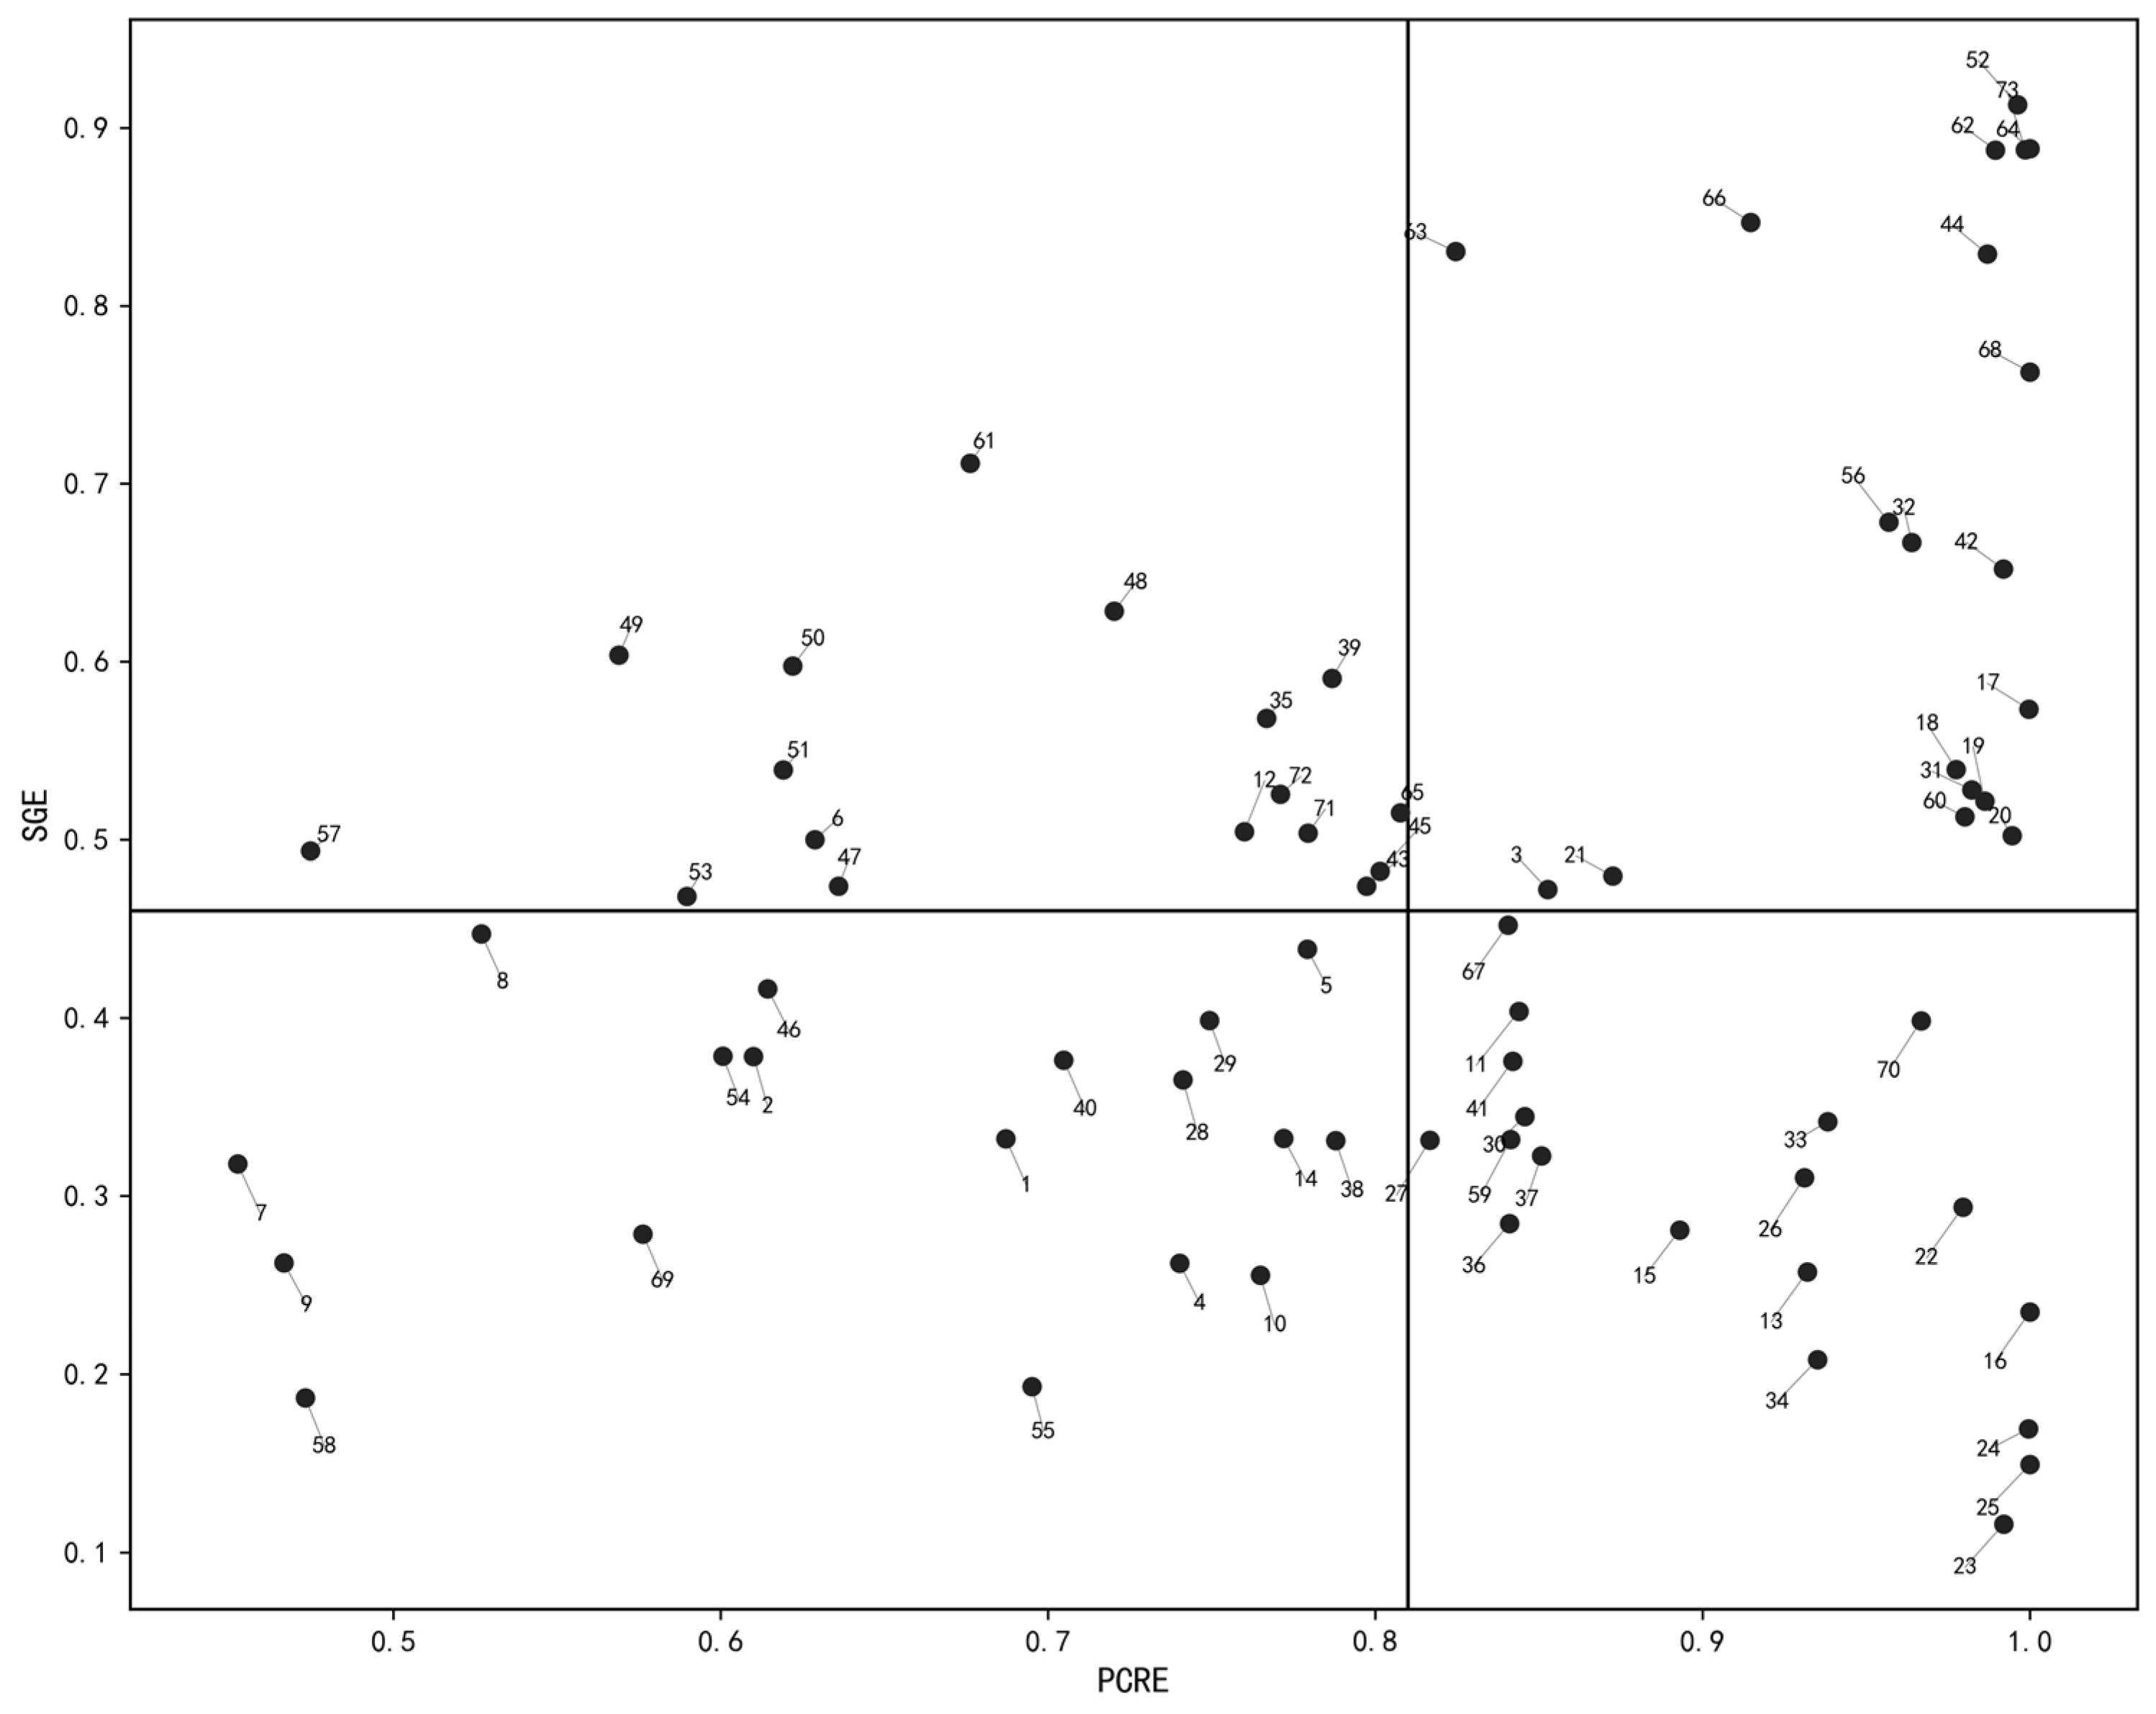
The above analysis examines the overall pattern of the Yellow River Basin urban agglomerations. To further reveal inter-city disparities, this section classifies the 73 cities according to their PCRE and SGE levels. The mean values of PCRE and SGE during the study period are used as classification thresholds. Based on this criterion, the cities are divided into four types: high PCRE–high SGE, high PCRE–low SGE, low PCRE–low SGE, and low PCRE–high SGE. Their spatial distribution is presented in Figure 7.
Figure 7.
Two-Dimensional Distribution of PCRE and SGE.
As shown in Figure 7, the 73 cities in the Yellow River Basin urban agglomerations are distributed across the four quadrants of the two-dimensional scatter plot of PCRE and SGE. The detailed results are presented in Appendix A Table A4. Cities with high PCRE and high SGE are mainly concentrated in the downstream region. By contrast, cities with low PCRE and low SGE are primarily clustered in the midstream region. Specifically, 19 cities, including Qingdao, Weihai, and Yangquan, fall into the high PCRE–high SGE category, accounting for 26.03% of the total sample. These cities can be regarded as benchmark cities for synergistic governance of pollution and carbon emissions reduction in the Yellow River Basin. In contrast, 18 cities, including Jinzhong, Xinzhou, and Lüliang, belong to the low PCRE–low SGE category. These cities face dual pressures from low emission-reduction efficiency and weak collaborative governance capacity. Therefore, they represent key areas for future improvement. The remaining cities fall into either the high PCRE–low SGE category or the low PCRE–high SGE category. These cities show a mismatch between emission-reduction performance and collaborative governance capacity. Therefore, they should accelerate the establishment of collaborative governance mechanisms. Technological innovation, industrial restructuring, and energy transition are also needed to improve SGE.
4. Regional Disparities and Sources of PCRE and SGE in the Yellow River Basin Urban Agglomerations
4.1. Overall Disparities and Intra-Regional Disparities of PCRE and SGE in the Yellow River Basin Urban Agglomerations
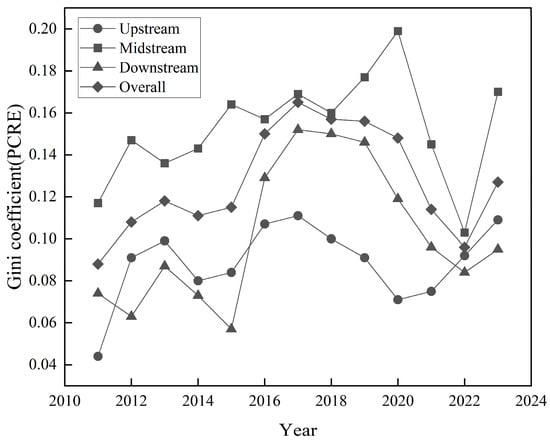
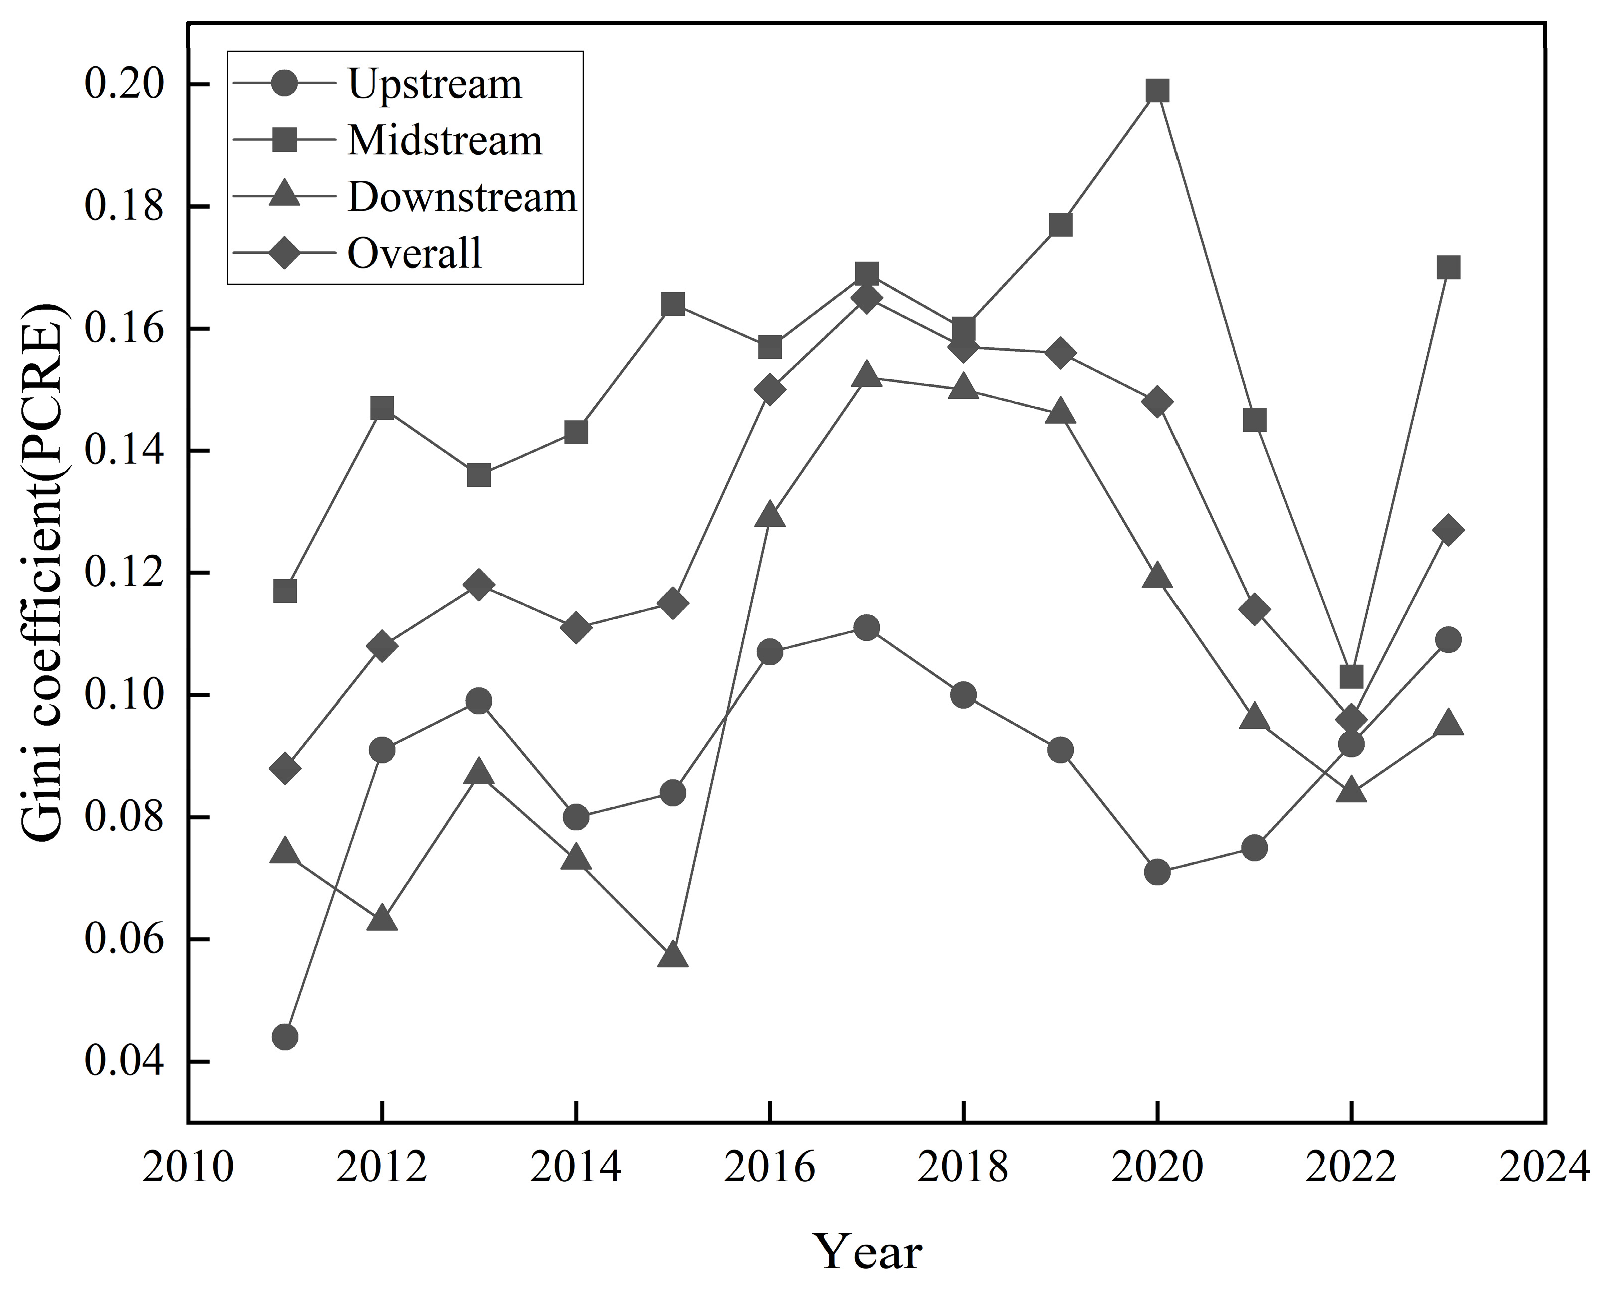
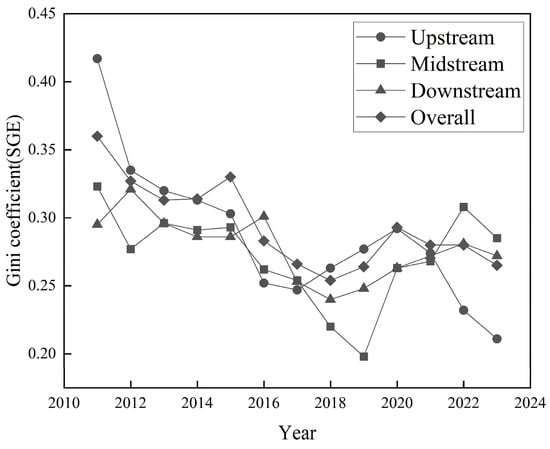
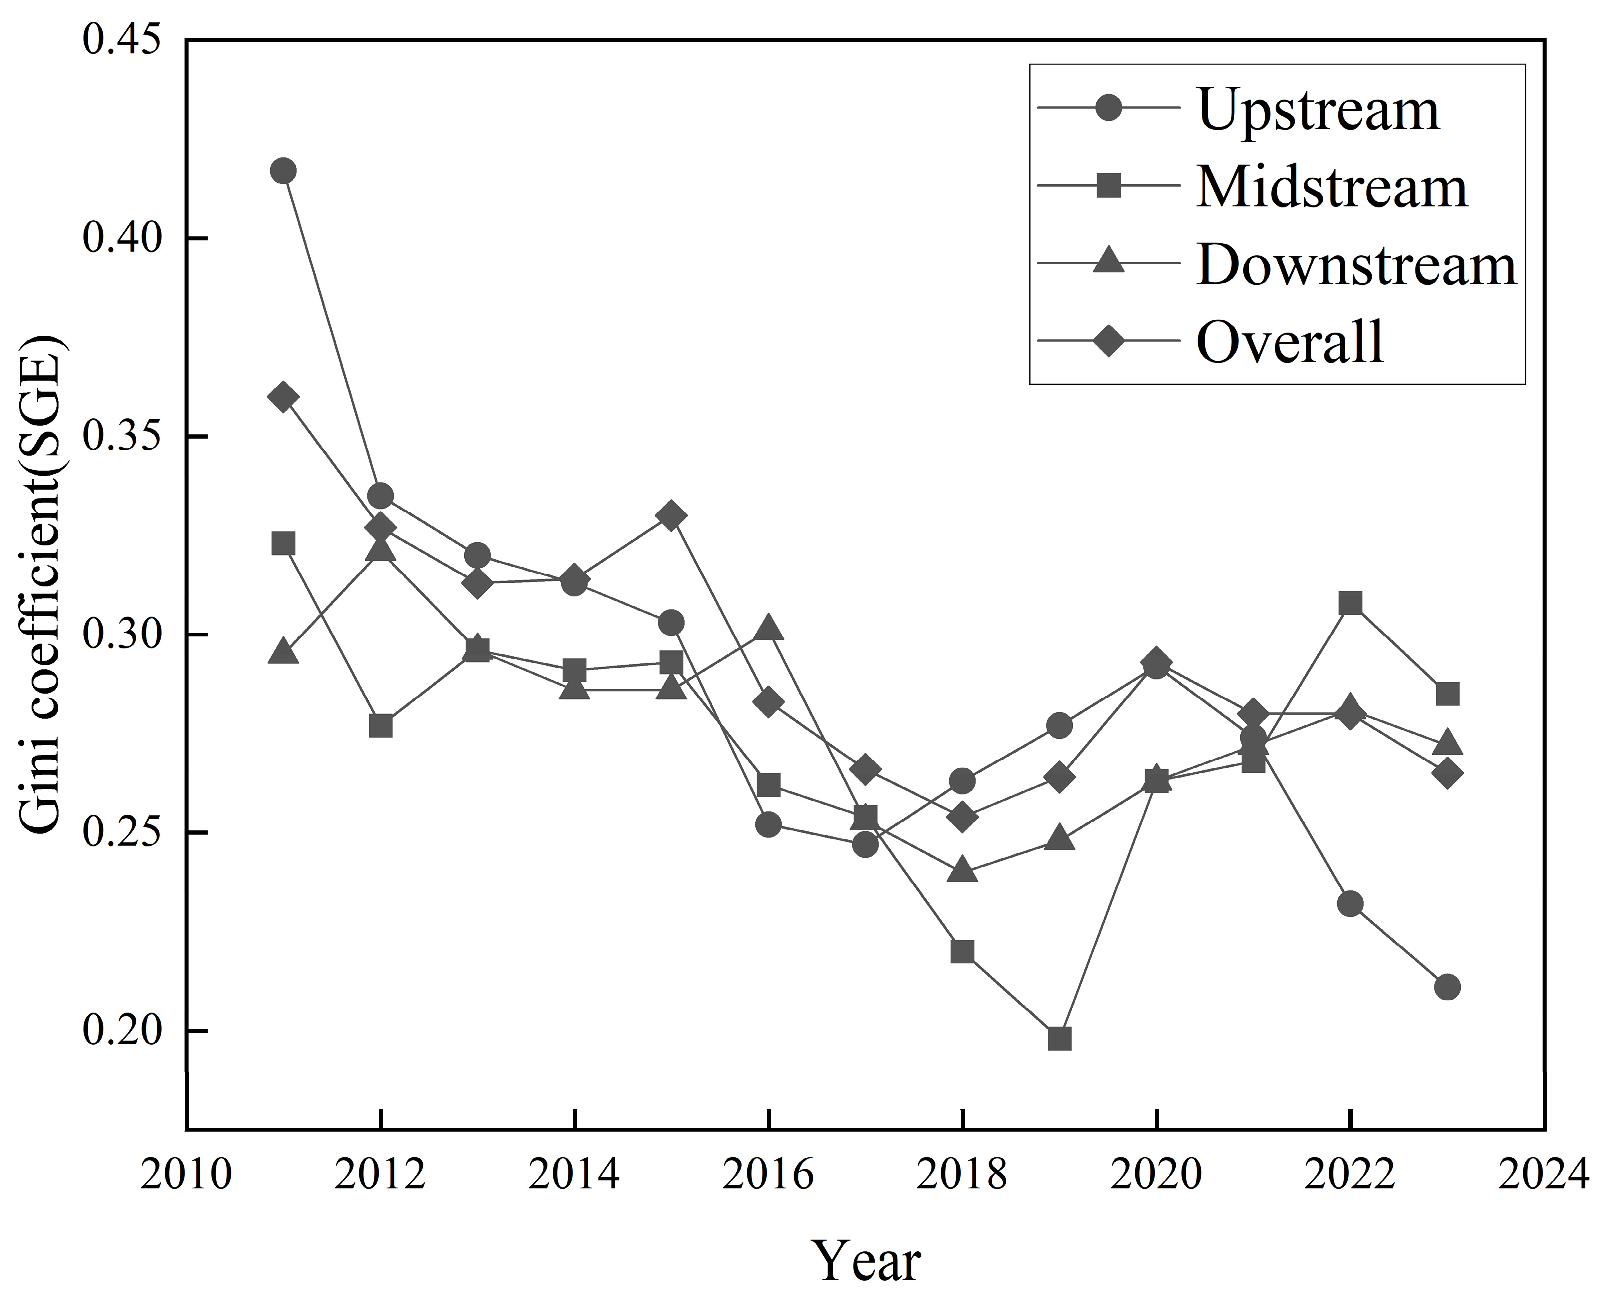
To further identify the sources of imbalanced development in the Yellow River Basin urban agglomerations, this study uses the Dagum Gini coefficient decomposition method to measure regional disparities of PCRE and SGE during the period 2011–2023. Their decomposition sources and contribution rates are also analyzed. The overall and intra-regional Gini coefficients of PCRE and SGE are presented in Figure 8 and Figure 9, respectively.
Figure 8.
Overall and intra-regional Gini coefficients of PCRE.
Figure 9.
Overall and intra-regional Gini coefficients of SGE.
According to Figure 8, the overall and intra-regional Gini coefficients of PCRE in the Yellow River Basin urban agglomerations fluctuated markedly during the study period. The overall Gini coefficient showed a clear pattern of fluctuation. It first increased, then declined, and then increased again. Its average annual growth rate was 2.98%. This indicates that the overall disparity in PCRE remained in a state of unbalanced development. For intra-regional disparities, the differences within the upstream, midstream, and downstream regions generally widened over time. Before 2015, the pattern was “midstream > upstream > downstream”. After 2015, it shifted to “midstream > downstream > upstream”. Among the three regions, the midstream region consistently showed the largest internal disparity. By contrast, intra-regional disparities in the upstream and downstream regions were relatively smaller. This may be related to their more favorable resource endowments and locational advantages. These conditions may have contributed to a more balanced internal distribution of PCRE in the upstream and downstream regions.
As shown in Figure 9, the overall and intra-regional Gini coefficients of SGE remained relatively stable during the study period. For the overall disparity, the aggregate Gini coefficient declined gradually before 2018 and then became stable. This suggests that regional disparities in SGE were progressively reduced and entered a relatively steady state. For intra-regional disparities, the pattern across the three regions was “upstream > downstream > midstream”. The upstream region initially showed the largest internal disparity. However, this gap narrowed over time, with an average annual reduction rate of 5.1%. This indicates a clear improvement in internal balance. This improvement may be related to the differentiated and targeted governance strategies implemented in the Yellow River Basin since the 18th National Congress of the Communist Party of China. These strategies helped reduce regional imbalances in collaborative governance.
4.2. Inter-Regional Disparities and Source Contribution Rates of PCRE and SGE in the Yellow River Basin Urban Agglomerations
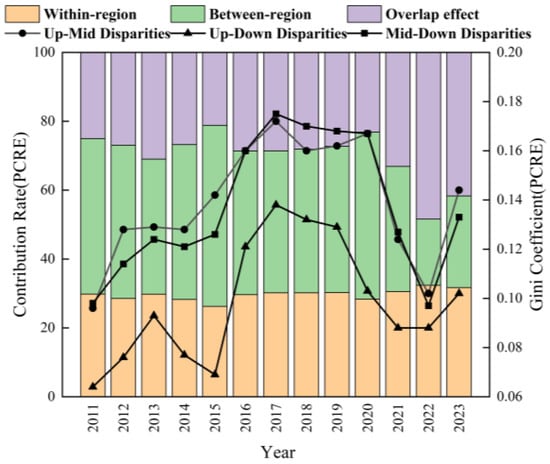
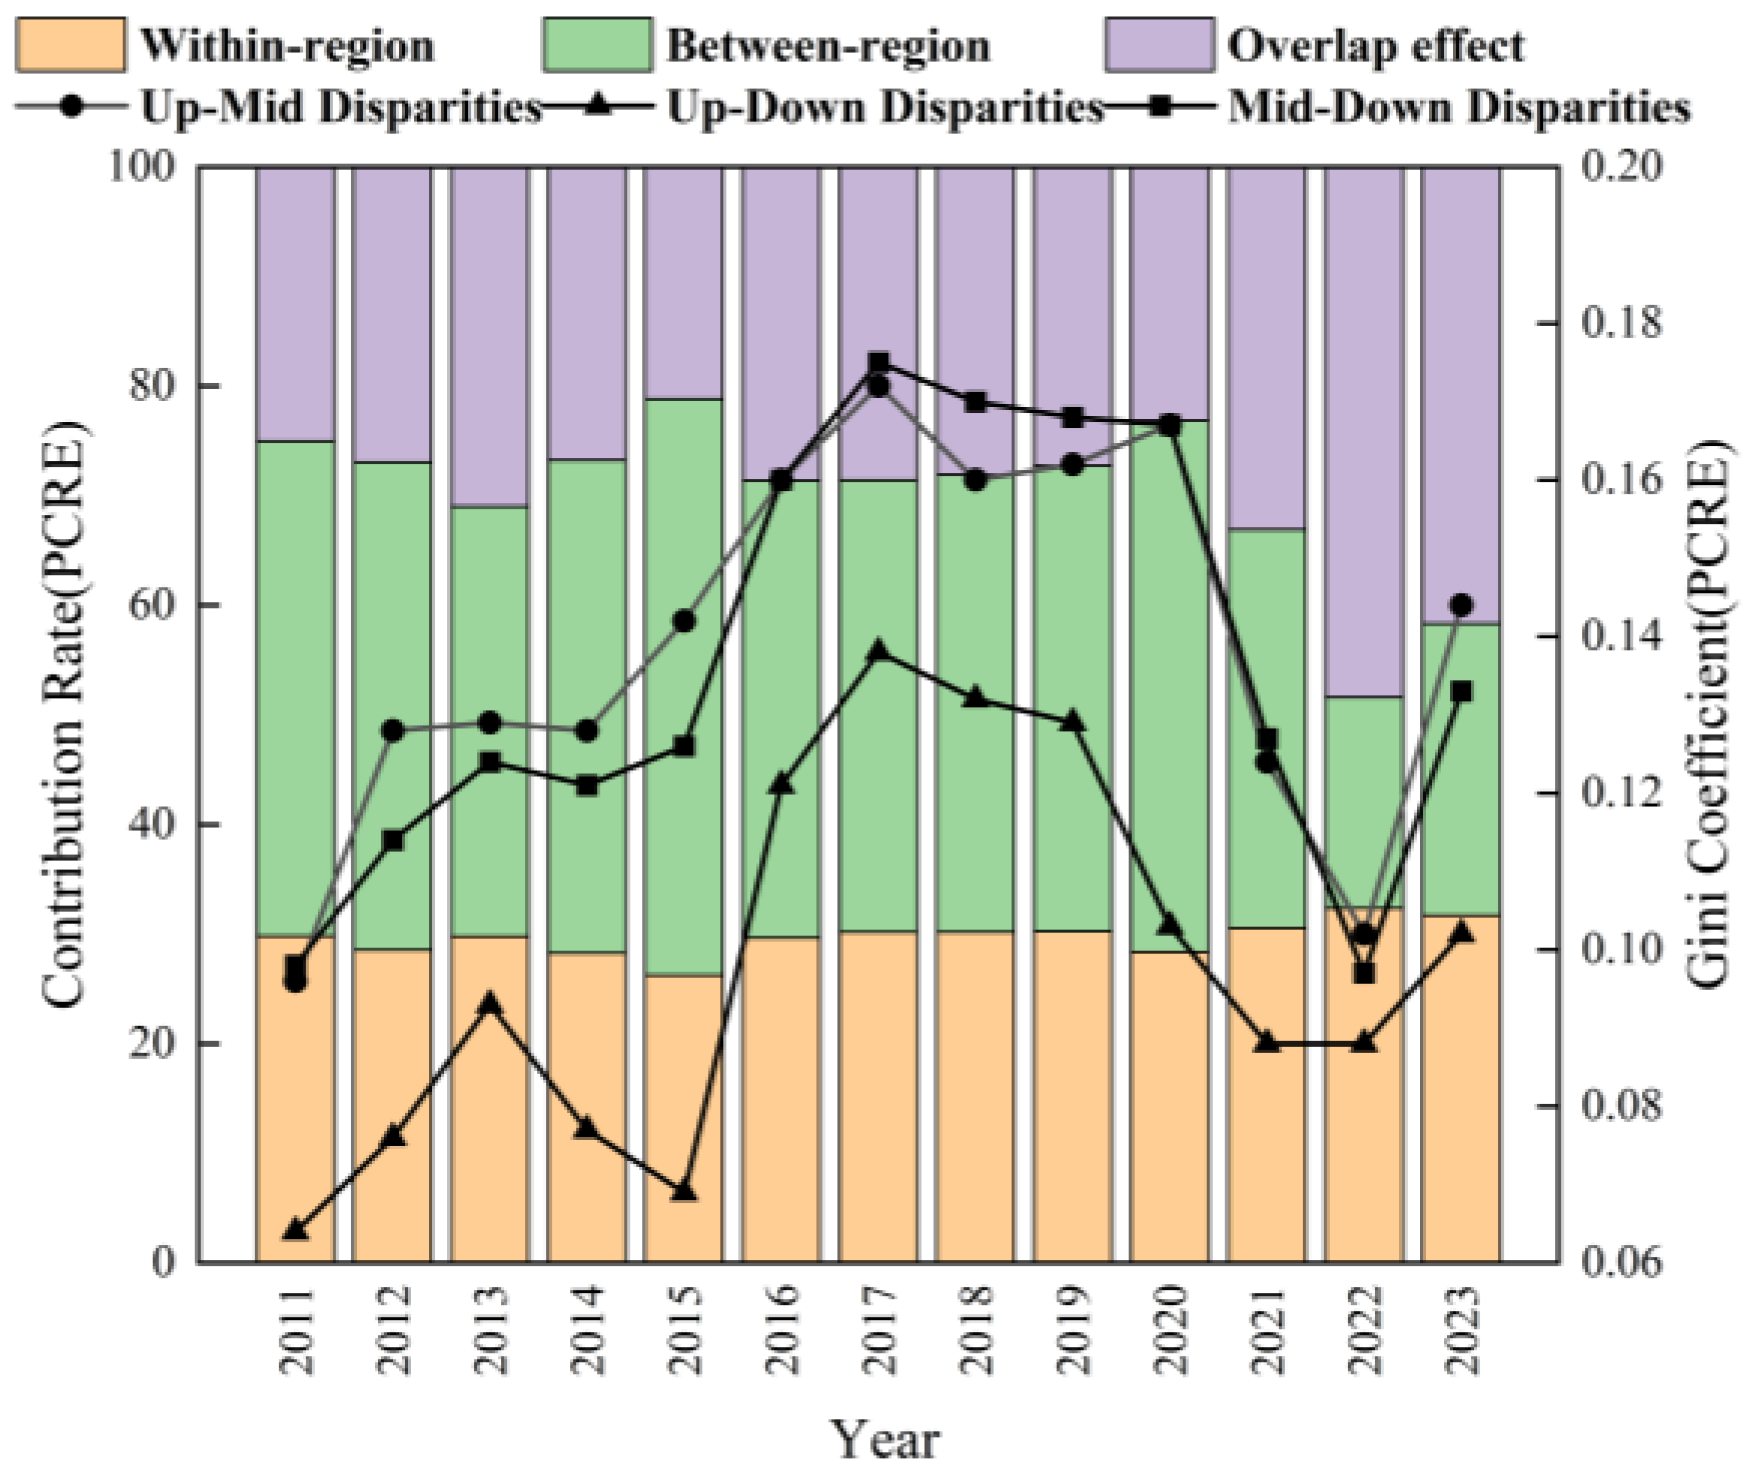
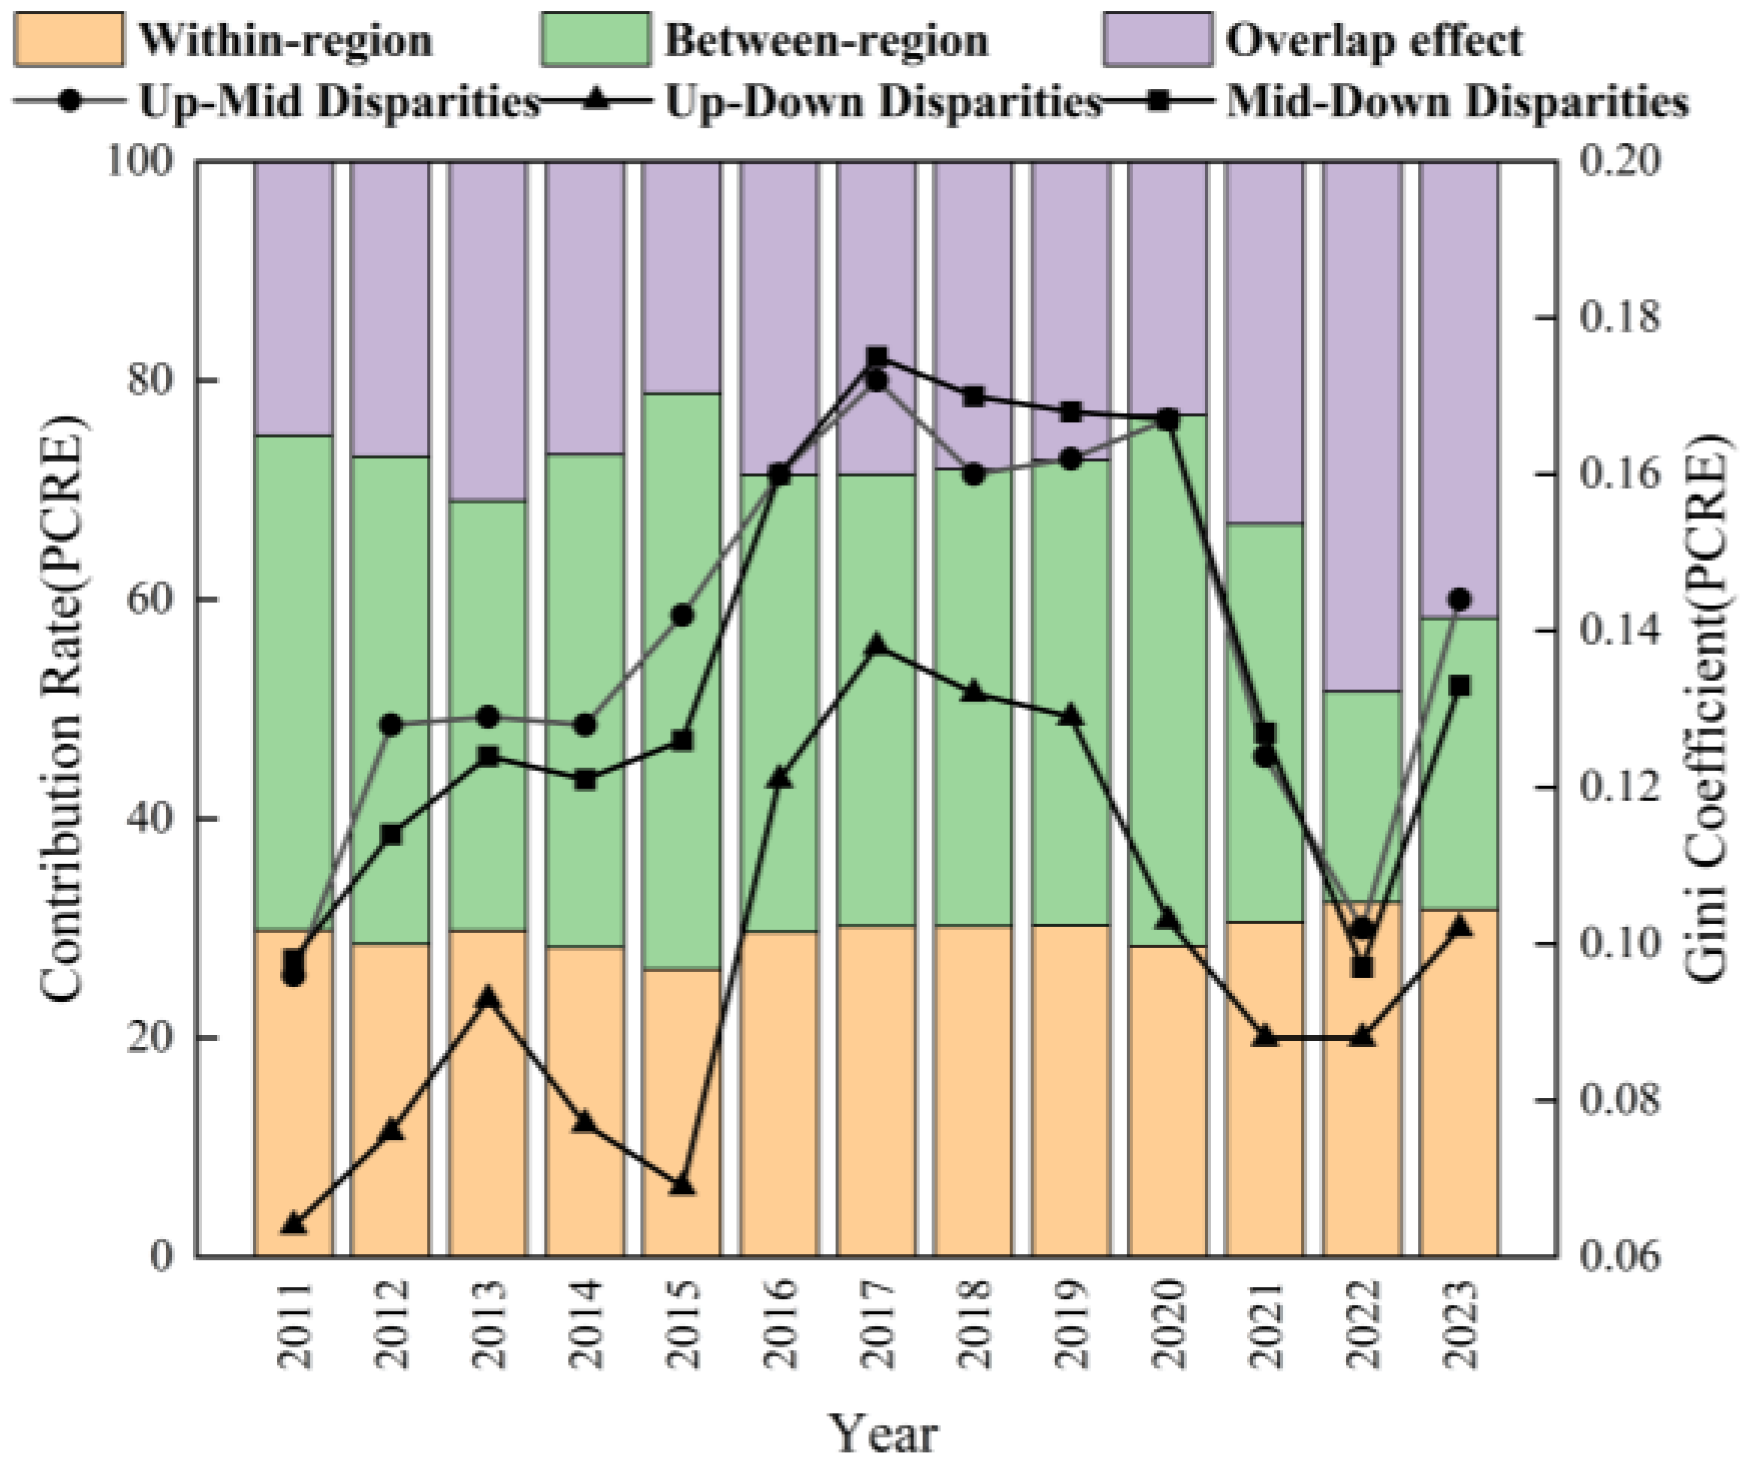
Building on the preceding analysis, this study further investigates inter-regional disparities in PCRE and SGE across the Yellow River Basin urban agglomerations. The contribution rates of different disparity sources are also examined. The results are shown in Figure 10 and Figure 11, respectively.
Figure 10.
Inter-regional differences and source contribution rates of PCRE.
Figure 11.
Inter-regional differences and source contribution rates of SGE.
According to Figure 10, inter-regional disparities are the main source of variation in PCRE in the Yellow River Basin urban agglomerations. In terms of temporal evolution, these disparities show a fluctuating pattern. They first increased, then declined, and then increased again. The inter-regional pattern is ranked as “midstream–downstream > upstream–midstream > upstream–downstream”. This indicates that the disparity between the midstream and downstream regions is the most pronounced. The decomposition results further show that inter-regional differences contributed the most to overall PCRE disparities. Their average annual contribution rate was 40.33%, which was higher than that of intra-regional differences (29.67%) and transvariation density (29.97%). This finding is consistent with Chen [39]. It suggests that inter-regional differences are the dominant source of PCRE disparities. This may be attributed to the evident gradient differentiation among different regions of urban agglomerations in the Yellow River Basin in terms of economic development level, industrial structure, resource endowment, and environmental governance capacity. The downstream areas are characterized by more advanced economic development, a higher-level industrial structure, and stronger technological capabilities, resulting in relatively higher PCRE. In contrast, the midstream and upstream areas still host a considerable number of coal-dependent and heavy-industry-oriented cities, where industrial transformation progresses more slowly and the pressure for coordinated pollution and carbon control remains relatively high. Consequently, the efficiency gap among regions is more likely to be amplified, becoming the primary source of overall disparity. Notably, the contribution rate of transvariation density showed an inverse relationship with inter-regional differences during the study period. This indicates that cross-regional overlap among different sub-regions increased over time. Meanwhile, the effect of pure inter-regional differentiation gradually weakened.
As shown in Figure 11, transvariation density is a key driver of disparities in SGE across the Yellow River Basin urban agglomerations. In terms of temporal evolution, it showed a fluctuating pattern, with an initial decline followed by an increase. Its spatial pattern was ranked as “upstream–midstream > upstream–downstream > midstream–downstream”. This indicates that the disparity between the upstream region and the other two regions was the most significant. The decomposition results further show that transvariation density has made the largest contribution to overall SGE disparities. Its average annual contribution rate was 48.41%, which is much higher than that of intra-regional differences (32.23%) and inter-regional differences (22.38%). This suggests that cross-regional overlap effects played a dominant role. Therefore, transvariation density was the primary source of SGE disparities. This is mainly due to the absence of a clear efficiency stratification structure among upstream and downstream urban agglomerations in the Yellow River Basin. Some ecologically prioritized cities in the upstream region exhibit relatively high governance performance, while certain industrial cities in the downstream area still show comparatively weak synergistic efficiency in pollution reduction and carbon mitigation. As a result, the efficiency distribution across regions presents a pronounced pattern of overlap and interweaving. Moreover, the contribution rates of transvariation density and inter-regional differences fluctuated over time. This indicates that there was no stable evolutionary relationship formed between these two components during the study period.
4.3. Heterogeneity Analysis of PCRE and SGE in the Yellow River Basin Urban Agglomerations
To further investigate the heterogeneity of PCRE and SGE disparities among sample cities, a subgroup comparison analysis is conducted. Given that the urban agglomerations in the Yellow River Basin span the upper, middle, and lower reaches, cities may exhibit considerable differences in economic structures, industrial compositions, and environmental policy implementation. Accordingly, the logarithm of GDP per capita is employed as an indicator of economic development level, and cluster analysis is applied to classify the sample cities into different groups. The efficiency performance of different city groups is then compared to identify the heterogeneity characteristics of PCRE and SGE across the Yellow River Basin urban agglomerations.
Using the K-means clustering method, the 73 sample cities in the Yellow River Basin are classified into three groups representing low, medium, and high levels of economic development. As shown in Table 2, the low-level economic development group contains 23 cities, the medium-level group contains 38 cities, and the high-level group contains 12 cities. The cluster centers of the three groups are 10.2041, 10.8590, and 11.6224, respectively, exhibiting a clear increasing gradient and indicating substantial heterogeneity in economic development levels among the sample cities.
Table 2.
Clustering results of cities based on economic development levels.
In terms of spatial distribution, the low-level economic development group mainly consists of cities located in Gansu, Ningxia, Qinghai, western Henan, and southwestern Shandong. The medium-level group primarily includes cities surrounding provincial capitals and traditional industrial cities within the Yellow River Basin. The high-level group is mainly composed of cities in the Shandong Peninsula, the Hohhot–Baotou–Ordos region, and core cities such as Zhengzhou. Overall, the clustering results are generally consistent with the economic development pattern of cities in the Yellow River Basin and effectively capture the differences among cities at different development stages, thereby providing a basis for further heterogeneity analysis of PCRE snd SGE.
To further examine whether significant efficiency differences exist among cities with different economic development levels, the Kruskal–Wallis nonparametric test was employed. The results are presented in Table 3. The H statistics for PCRE and SGE are 8.7759 and 9.9029, respectively, with corresponding p-values of 0.0124 and 0.0071, both passing the 5% significance level test. These findings indicate that significant differences exist in PCRE as well as SGE among cities at different economic development levels.
Table 3.
Heterogeneity test results based on economic development levels.
The results suggest that economic development heterogeneity is closely associated with efficiency performance. Cities with higher levels of economic development generally possess stronger technological innovation capabilities, more advanced industrial structures, and greater environmental governance capacity, which provide favorable conditions for improving pollution reduction, carbon mitigation, and SGE. Therefore, economic development level constitutes an important factor associated with the observed efficiency disparities across cities in the Yellow River Basin urban agglomerations.
5. Spatial Correlation and Evolutionary Characteristics of PCRE and SGE in the Yellow River Basin Urban Agglomerations
5.1. Global Spatial Autocorrelation of PCRE and SGE in the Yellow River Basin Urban Agglomerations
The global Moran’s I index is calculated using the spatial adjacency weight matrix (Wc) and the geographical distance matrix (Wd) to assess the overall spatial autocorrelation of PCRE and SGE in the Yellow River Basin Urban Agglomerations. The results are presented in Table 4.
Table 4.
Global Moran’s I of PCRE and SGE.
As shown in Table 4, both PCRE and SGE of the Yellow River Basin urban agglomerations exhibited positive spatial autocorrelation during the study period. The global Moran’s I values of PCRE remained positive throughout the study period and were statistically significant at the 1% level in all years. This indicates that PCRE was not randomly distributed across space but exhibited significant positive spatial autocorrelation, meaning that cities with similar efficiency levels tended to cluster geographically.
Although the global Moran’s I values of SGE were statistically significant at the 10% level in most years, the Moran’s I values for 2011–2014 and 2022–2023 failed to pass the significance test. One possible explanation is that during 2011–2014, the collaborative governance mechanism had not yet been fully established, and governance was still dominated by traditional fragmented approaches based on administrative sectors, regions, and river basin divisions. Consequently, a unified collaborative governance framework had not yet emerged. In contrast, the period after 2022 coincided with the intensive implementation of ecological protection and high-quality development policies in the Yellow River Basin. During this stage, the regional governance system was undergoing continuous adjustment and optimization, and the spatial spillover effects of collaborative governance had not yet been fully realized. As a result, the spatial correlation of SGE weakened and did not reach statistical significance in some years.
5.2. Local Spatial Autocorrelation of PCRE and SGE in the Yellow River Basin Urban Agglomerations
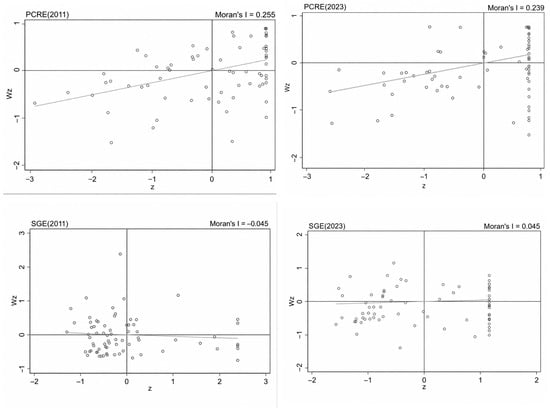
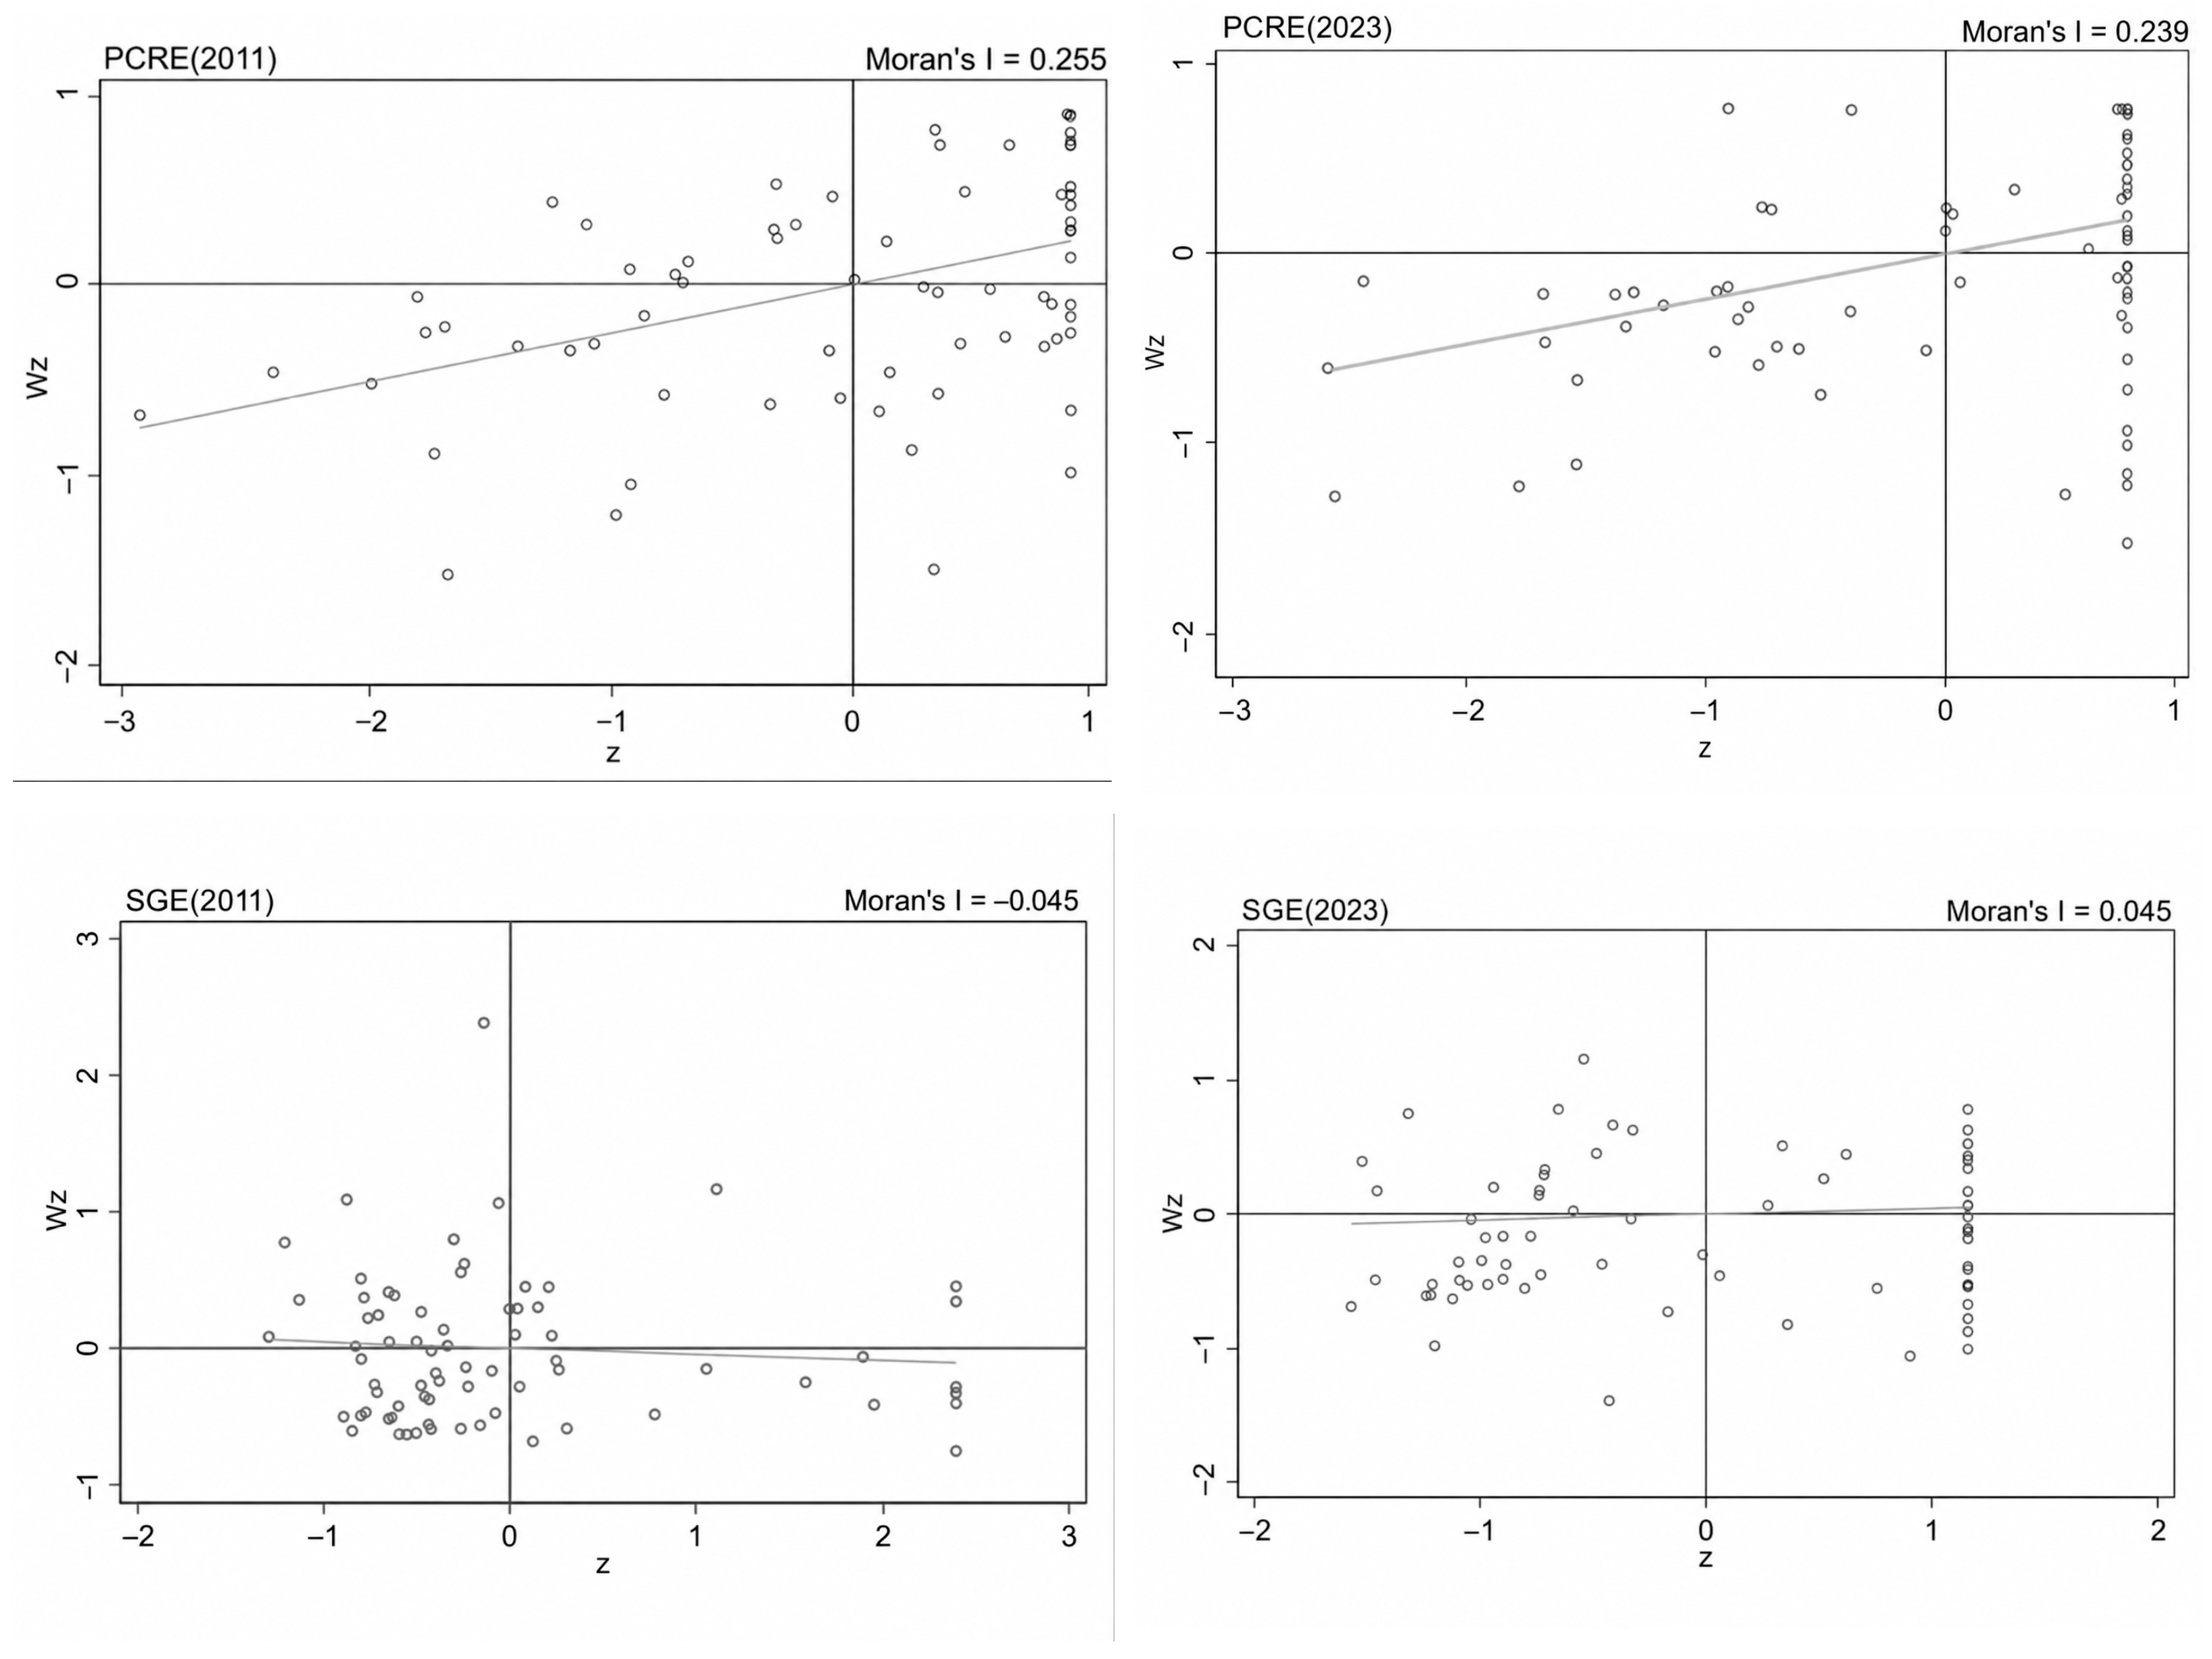
Building on the preceding analysis, this study further applies the local Moran’s I index to identify the local spatial autocorrelation patterns of PCRE and SGE in the Yellow River Basin urban agglomerations. Due to space limitations, the analysis presents only the local Moran scatter plots for 2011 and 2023, representing the initial and final years of the study period. The results are shown in Figure 12.
Figure 12.
Local Moran scatter plots of PCRE and SGE.
Figure 12 shows that PCRE in the Yellow River Basin urban agglomerations exhibits clear spatial clustering characteristics. During the study period, the fitted trend line of the local Moran scatter plot remained positive. This indicates a persistent positive spatial association. Compared with 2011, more cities were located in the first and third quadrants in 2023. This suggests that the spatial pattern of PCRE became increasingly dominated by high–high (HH) and low–low (LL) clusters. Specifically, HH clusters were mainly concentrated in the downstream region of the Yellow River Basin. By contrast, LL clusters were primarily distributed in the midstream region. Notably, cities such as Weihai, Liaocheng, and Jiaozuo showed clear spatial transitions during the study period. They shifted from the second quadrant, namely low–high (LH) clusters, to the first quadrant, namely high–high (HH) clusters. This indicates that the spillover and radiation effects of high-PCRE cities on surrounding areas were strengthened.
In contrast, SGE evolved from negative spatial autocorrelation to positive spatial autocorrelation. This indicates a shift from spatial divergence to spatial agglomeration. Compared with 2011, more cities were located in the first and third quadrants in 2023. Meanwhile, the number of cities in the second and fourth quadrants continued to decline. This suggests that spatial imbalance in SGE among cities in the Yellow River Basin gradually weakened. At the same time, inter-city spatial linkages became stronger.
5.3. Spatial Evolution Characteristics of PCRE and SGE in the Yellow River Basin Urban Agglomerations
This study constructs both a traditional Markov transition probability matrix and a spatial Markov transition probability matrix to examine the dynamic spatiotemporal evolution of PCRE and SGE in the Yellow River Basin Urban Agglomerations. The efficiency indicators are discretized into four categories—low (I), medium-low (II), medium-high (III), and high (IV)—using the quartile method. Transitions between adjacent categories are defined as upward (or downward) movements, while transitions across non-adjacent categories are defined as positive (or negative) leap transitions. In addition, by comparing the transition probabilities derived from the spatial Markov chain with those from the traditional Markov transition matrix, this study further identifies whether spatial dependence(particularly the influence of neighboring cities)affects the transition dynamics of local synergistic governance efficiency. The traditional Markov transition probability matrices of PCRE and SGE during the study period is shown in Table 5.
Table 5.
Traditional Markov transition matrix of PCRE and SGE.
As shown in Table 5, the evolutionary processes of PCRE and SGE in the Yellow River Basin Urban Agglomerations exhibits a high degree of consistency. Specifically, three main features can be identified.
Firstly, for both efficiency measures, the probabilities on the main diagonal are consistently higher than those on the off-diagonal, and the probabilities at both ends of the diagonal are markedly higher than those in the middle. In particular, the probabilities of persistence in the low-level and high-level states of PCRE are relatively high, at 80.54% and 74.91%, respectively, while the probabilities for the medium-low and medium-high states are comparatively lower. A similar pattern is observed for SGE. This suggests strong state persistence in both indicators, indicating a pronounced path dependence effect. Moreover, under this path-dependent mechanism, cities with higher efficiency levels exhibit greater stability than those in medium-low and medium-high categories. This finding further implies a polarization pattern driven by path dependence, i.e., a “club convergence” phenomenon, highlighting the long-term persistence of structural stability and regional disparities in both efficiency measures.
Secondly, regarding transition paths, cities in the medium-high category of PCRE, as well as those in the medium-low and medium-high categories of SGE, are more likely to experience upward rather than downward transitions. This indicates a general tendency for cities at intermediate-to-high levels to improve further and gradually move toward higher efficiency states. However, it is noteworthy that in terms of PCRE, cities in the medium-low category are more likely to experience downward rather than upward transitions. This suggests that development gaps among medium-low efficiency cities may widen over time, thereby exacerbating a “Matthew effect,” where medium-low efficiency cities tend to drift toward lower efficiency levels.
Thirdly, the probability of “jump” transitions across non-adjacent states between consecutive periods is relatively low. Specifically, the probability of cross-category transitions in PCRE is below 9%, while that the SGE is below 4%. This indicates that efficiency transitions are asymmetric and gradual, primarily occurring between adjacent categories. Due to local locking effects and path dependence, leapfrog transitions are relatively rare, and PCRE and SGE are largely characterized by incremental changes rather than abrupt shifts.
By incorporating a spatial lag term into the traditional Markov transition probability matrix, a spatial Markov transition probability matrix is constructed to examine the spatial evolutionary characteristics of PCRE and SGE in the Yellow River Basin urban agglomerations under different neighborhood interaction contexts. The results are presented in Table 6.
Table 6.
Spatial Markov transition matrix of PCRE and SGE.
As shown in Table 6, after incorporating spatial effects, the spatiotemporal transition characteristics and evolutionary patterns of PCRE and SGE remain highly consistent in the Yellow River Basin urban agglomerations. Specifically, three main findings can be identified.
Firstly, compared with the traditional Markov transition probability matrix, the transition probabilities across all pathways change significantly after introducing spatial dependence. This indicates that the evolution of both PCRE and SGE exhibits clear spatial effects. Incorporating spatial factors into the dynamic analysis helps better capture their evolutionary mechanisms and temporal–spatial dependence.
Secondly, regardless of neighborhood type, the probabilities on the main diagonal remain higher than those on the off-diagonal after adding spatial effects, indicating that persistence in the initial state of PCRE and SGE remains the most likely outcome. This also suggests that spatial factors alone cannot fully eliminate short-term spatial locking and path dependence in PCRE and SGE dynamics.
Thirdly, under high-neighborhood conditions, the probabilities of “leap” transitions in both PCRE and SGE are significantly higher than those in the traditional Markov framework, whereas under low-neighborhood conditions, the probabilities are markedly lower. For example, when surrounded by high-efficiency neighbors, the PCRE exhibit transition probabilities from low to medium-high and high levels of 20% each, substantially higher than the corresponding probabilities of 3.17% and 2.26% in the non-spatial model. Similarly, Both of the above-mentioned types of probabilities of SGE are 12.5%, compared with 3.45% and 2.16% in the baseline case. In contrast, under low-neighborhood conditions, the probabilities of upward transitions in PCRE are only 1.28% for both medium-high and high states, which are lower than those in the non-spatial model. A similar pattern is observed for SGE. These findings suggest that neighborhood conditions increase interaction opportunities among cities within the basin, thereby strengthening spatial linkages in efficiency dynamics. When a city is surrounded by high-efficiency neighbors, spatial viscosity is weakened, and leading cities can exert stronger demonstration and spillover effects, enhancing their radiative capacity and promoting leapfrog development in low-efficiency cities, thus narrowing regional disparities. Conversely, being surrounded by low-efficiency neighbors is unfavorable for balanced spatial development.
Notably, the impact of neighborhood conditions on “club convergence” differs substantially. Taking the PCRE as an example, the probability of remaining in the low-efficiency state under low-neighborhood conditions is 89.74%, higher than the 80.54% observed in the non-spatial case, indicating stronger spatial clustering of low-efficiency cities and more pronounced low-level club convergence. In other words, being surrounded by low-efficiency neighbors significantly strengthens spatial locking within low-efficiency clubs, exacerbating regional disparities. In contrast, the probability of remaining in the high-efficiency state under high-neighborhood conditions is 56.52%, lower than the 74.91% in the non-spatial model, suggesting that high-efficiency neighborhoods weaken high-level clustering and mitigate polarization, thereby enhancing spillover effects from high-efficiency cities and reducing regional disparities.
In contrast, for SGE, low-efficiency neighborhoods weaken low-level clustering, while high-efficiency neighborhoods strengthen high-level clustering, making low-level club convergence more pronounced. This suggests that synergistic governance in the Yellow River Basin is more likely to achieve coordinated development when surrounded by high-efficiency cities, whereas convergence is more difficult when surrounded by low-efficiency cities, implying a certain “Matthew effect,” where regions embedded in high-level neighborhoods are more likely to achieve higher levels of synergistic development.
6. Conclusions, Recommendations and Limitations
6.1. Conclusions
This paper focuses on the Yellow River Basin Urban Agglomerations. A two-stage network SBM model is constructed to measure pollution and carbon reduction efficiency (PCRE) and synergistic governance efficiency (SGE) from 2011 to 2023. Spatial autocorrelation, the Dagum Gini coefficient, and Markov chains are further employed to examine the spatiotemporal characteristics, regional disparities, and spatial evolution patterns of PCRE and SGE. The main conclusions are as follows. (1) The measurement results show that PCRE and SGE in the Yellow River Basin Urban Agglomerations exhibited noticeable fluctuations during the sample period. PCRE exhibited a “decline–rise” trend, whereas SGE showed a marked upward trajectory. (2) In terms of spatial distribution, PCRE and SGE presented a pattern of “overall dispersion and local concentration.” Specifically, PCRE showed a relatively clear clustering pattern in the eastern region in some years, while SGE tended to be more concentrated in the southwestern region. (3) Regional disparity analysis reveals that differences in PCRE followed a fluctuating pattern. Interregional disparities were the primary source of PCRE differences, whereas transvariation density played an important role in shaping SGE disparities. (4) The spatial correlation results suggest that PCRE exhibited significant positive spatial autocorrelation. Also, the spatial evolution results suggest that PCRE and SGE showed certain state persistence and path dependence characteristics, with a possible Matthew effect tendency in some transition paths. Moreover, under different neighborhood conditions, high-efficiency areas were associated with higher upward transition probabilities of neighboring cities, whereas low-efficiency neighborhoods tended to be associated with stronger state persistence in low-efficiency areas.
6.2. Recommendations
(1) Region-specific and differentiated strategies should be adopted to improve PCRE and SGE in the Yellow River Basin Urban Agglomerations. Targeted support should be provided to resource-dependent cities in the midstream region. In particular, environmental regulation should be strengthened, energy efficiency should be improved, and the construction of “waste-free cities” should be promoted. At the same time, the upstream and downstream regions should further leverage their comparative advantages. Specially, the upstream region should convert ecological endowments into green development capacity. On the contrary, the downstream region should enhance its leading role through technological innovation, pilot demonstrations, and policy diffusion, and may provide useful experience for regional synergistic improvement.
(2) Coordinated transition strategies should be implemented to gradually narrow regional disparities in PCRE and SGE. Given the structural constraints of resource-based industries in the midstream region and the ecological vulnerability of the upstream region, policy priorities should be differentiated. The upstream region should focus on ecological protection, ecological barrier construction, and integrated ecosystem restoration. The midstream region should accelerate green transformation by promoting low-carbon industrial upgrading, strengthening technological innovation, and improving policy enforcement. Meanwhile, industrial coordination and ecological compensation mechanisms should be explored to enhance regional balance and collaborative development.
(3) Spatial coordination mechanisms should be strengthened to enhance inter-regional linkages in PCRE and SGE. This requires coordinated environmental governance, joint pollution and carbon control mechanisms, and integrated governance across urban agglomerations. These measures can improve spatial interaction and policy coordination among cities. As a technological frontier, the eastern region should summarize and disseminate best practices in pollution and carbon governance. The southwestern region could explore the construction of demonstration zones for collaborative governance and gradually form replicable governance models. For the northeastern region, a zoned and targeted policy framework should be adopted. Greater fiscal and policy support is also needed to improve overall SGE.
6.3. Limitations
Improving PCRE and SGE in the Yellow River Basin urban agglomerations is essential for promoting China’s comprehensive green transition and high-quality development. Systematically examining their spatiotemporal evolution and spatial distribution is also of practical importance for implementing the “dual carbon” goals. Nevertheless, this study has several limitations that require further improvement in future research.
(1) This study uses prefecture-level cities as the research units for the spatiotemporal analysis. Although this scale provides useful evidence for policy-making at the level of the Yellow River Basin urban agglomerations, it may overlook spatial heterogeneity within cities. It may also obscure finer differences in pollution and carbon emissions reduction governance at the intra-city level. Future research could further refine the spatial scale of analysis by integrating prefecture-level data with district-and county-level statistics and county-level geospatial data. This would make it possible to construct a multi-scale city-county analytical framework and to explore the internal evolution of PCRE and SGE within the Yellow River Basin urban agglomerations in greater depth.
(2) This study uses the traditional network SBM model to measure PCRE and SGE and to analyze their spatiotemporal characteristics. The super-efficiency network SBM model is not adopted for further optimization or detailed ranking. The traditional network SBM model can effectively capture the multi-stage structure of the governance system. It can also open the internal “black box” and identify the slack improvement potential of inputs and outputs at each stage. However, this model has certain limitations. When several decision-making units are located on the efficiency frontier, the traditional network SBM model cannot further distinguish efficiency differences among these effective cities. As a result, it is difficult to identify more refined performance gaps and improvement priorities. Future research could introduce the super-efficiency network SBM model. This would help overcome the limitation that frontier-level decision-making units cannot be further ranked. It would also allow a more precise analysis of the differences and improvement paths of PCRE and SGE in the Yellow River Basin urban agglomerations.
Author Contributions
Conceptualization, J.G., R.Y. and Q.Z.; methodology, J.G., R.Y. and Q.Z.; software, J.G. and R.Y.; validation, J.G., R.Y. and Q.Z.; formal analysis, J.G. and R.Y.; investigation, Q.Z.; resources, J.G., R.Y., Q.Z. and Z.W.; data curation, J.G., R.Y., Q.Z. and Z.W.; writing—original draft preparation, J.G., R.Y., Q.Z. and Z.W.; writing—review and editing, J.G., R.Y., Q.Z. and Z.W.; visualization, J.G., R.Y., Q.Z. and Z.W.; supervision, J.G., R.Y., Q.Z. and Z.W.; project administration, J.G. All authors have read and agreed to the published version of the manuscript.
Funding
This research was funded by the National Social Science Fund of China, grant number 24CJY077. The APC was funded by the National Social Science Fund of China.
Institutional Review Board Statement
Not applicable.
Informed Consent Statement
Not applicable.
Data Availability Statement
The data presented in this study are available upon request from the corresponding author.
Conflicts of Interest
The authors declare no conflicts of interest.
Appendix A
Table A1.
Comparative energy data.
Figure A1.
Comparison of Efficiency Trends Based on Energy Data and Total Electricity Consumption.
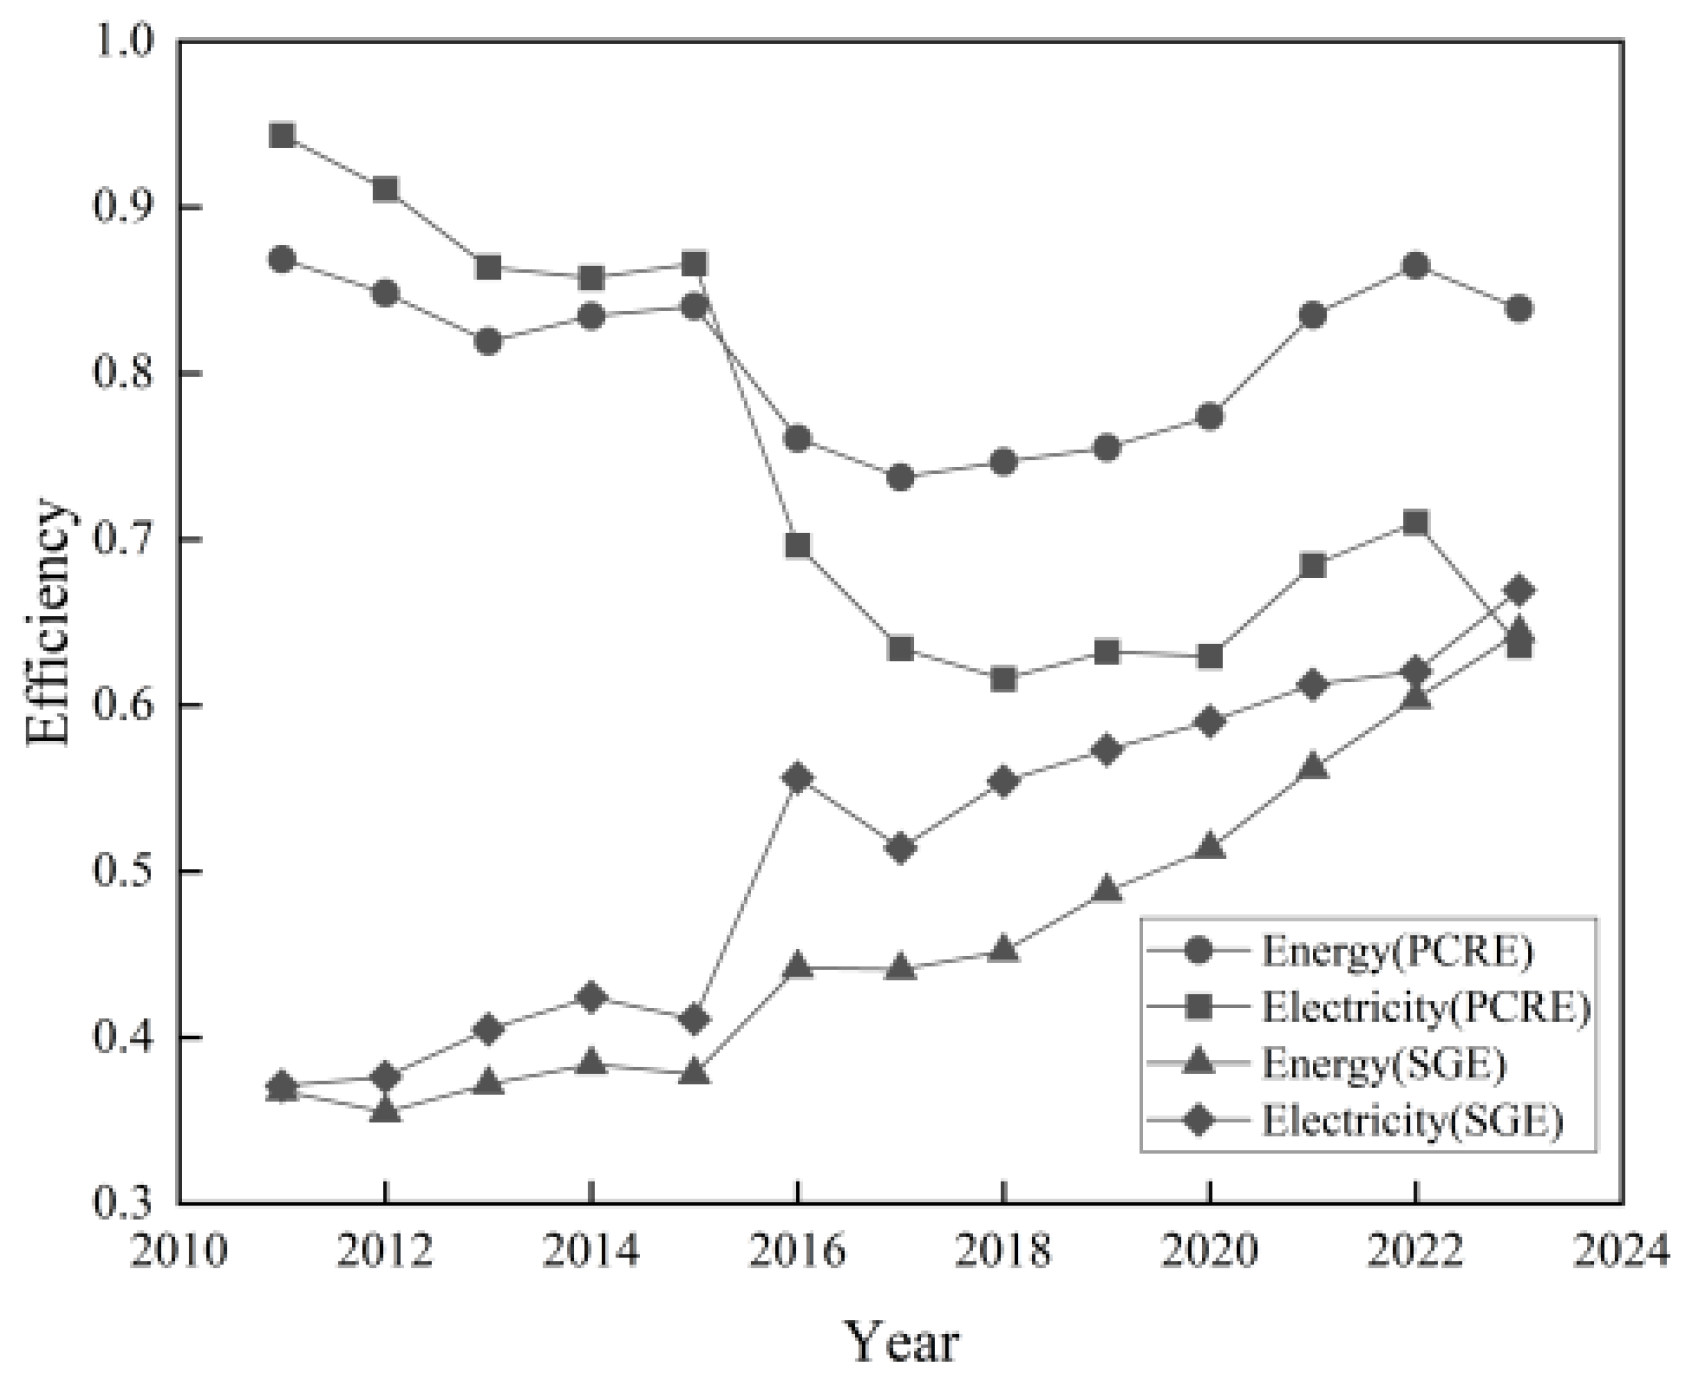
Table A2.
Upstream, midstream, and downstream cities.
Table A3.
Confidence interval of PCRE and SGE.
Table A4.
City Number-Name Correspondence.
References
- Yun, C.; Chen, X.; Zheng, Y.; Chen, C.; Song, X.; Feng, Y.; Liu, W.; Wen, Z.; Liu, Y.; Wang, H.; et al. Progress and performance in synergizing the reduction of pollution and carbon emissions in China from 2015 to 2022. Ecol. Indic. 2026, 186, 114869. [Google Scholar] [CrossRef] [Scilit]
- Wu, H.; Yang, Y.; Li, W. Analysis of spatiotemporal evolution characteristics and peak forecast of provincial carbon emissions under the dual carbon goal: Considering nine provinces in the Yellow River basin of China as an example. Atmos. Pollut. Res. 2023, 14, 101828. [Google Scholar] [CrossRef] [Scilit]
- Feng, Q.; Zhang, X.; Wu, J.; Fu, Z.; Wu, N.; Wang, Y. Provincial–level evaluation of pollution reduction and carbon mitigation in China based on Driving Force–Pressure–State–Impact–Response framework. Atmos. Pollut. Res. 2026, 17, 102855. [Google Scholar] [CrossRef] [Scilit]
- Yi, M.; Guan, Y.; Wu, T.; Wen, L.; Sheng, M.S. Assessing China’s synergistic governance of emission reduction between pollutants and CO2. Environ. Impact Assess. Rev. 2023, 102, 107196. [Google Scholar] [CrossRef] [Scilit]
- Du, C.; Yuan, Y.; Sun, L.; Fujii, M.; Song, W.; Yao, Y.; Ren, J. Achieving synergy between pollution reduction and carbon mitigation in the eco-industrial park: A multi-objective optimization framework. J. Environ. Manag. 2025, 390, 126257. [Google Scholar] [CrossRef] [Scilit] [PubMed]
- Qian, H.; Xu, S.; Cao, J.; Ren, F.; Wei, W.; Meng, J.; Wu, L. Air pollution reduction and climate co-benefits in China’s industries. Nat. Sustain. 2021, 4, 417–425. [Google Scholar] [CrossRef] [Scilit]
- Shi, Q.; Zheng, B.; Zheng, Y.; Tong, D.; Liu, Y.; Ma, H.; Hong, C.; Geng, G.; Guan, D.; He, K.; et al. Co-benefits of CO2 emission reduction from China’s clean air actions between 2013–2020. Nat. Commun. 2022, 13, 5061. [Google Scholar] [CrossRef] [Scilit] [PubMed]
- Dong, F.; Yu, B.; Pan, Y. Examining the synergistic effect of CO2 emissions on PM2.5 emissions reduction: Evidence from China. J. Clean. Prod. 2019, 223, 759–771. [Google Scholar] [CrossRef] [Scilit]
- Nam, K.-M.; Waugh, C.J.; Paltsev, S.; Reilly, J.M.; Karplus, V.J. Carbon co-benefits of tighter SO2 and NOx regulations in China. Glob. Environ. Change 2013, 23, 1648–1661. [Google Scholar] [CrossRef] [Scilit]
- Nie, C.; Lee, C.-C. Synergy of pollution control and carbon reduction in China: Spatial–temporal characteristics, regional differences, and convergence. Environ. Impact Assess. Rev. 2023, 101, 107110. [Google Scholar] [CrossRef] [Scilit]
- Zha, Q.; Liu, Z.; Wang, J. Spatial pattern and driving factors of synergistic governance efficiency in pollution reduction and carbon reduction in Chinese cities. Ecol. Indic. 2023, 156, 111198. [Google Scholar] [CrossRef] [Scilit]
- Zhang, Q.; Yin, Z.; Lu, X.; Gong, J.; Lei, Y.; Cai, B.; Cai, C.; Chai, Q.; Chen, H.; Dai, H.; et al. Synergetic roadmap of carbon neutrality and clean air for China. Environ. Sci. Ecotechnol. 2023, 16, 100280. [Google Scholar] [CrossRef] [Scilit] [PubMed]
- Burtraw, D.; Krupnick, A.; Palmer, K.; Paul, A.; Toman, M.; Bloyd, C. Ancillary benefits of reduced air pollution in the US from moderate greenhouse gas mitigation policies in the electricity sector. J. Environ. Econ. Manag. 2003, 45, 650–673. [Google Scholar] [CrossRef] [Scilit]
- Liu, K.; Ren, G.; Dong, S.; Xue, Y. The synergy between pollution reduction and carbon reduction in Chinese cities and its influencing factors. Sustain. Cities Soc. 2024, 106, 105348. [Google Scholar] [CrossRef] [Scilit]
- Li, Z.; Bai, T.; Tang, C. How does the low-carbon city pilot policy affect the synergistic governance efficiency of carbon and smog? Quasi-experimental evidence from China. J. Clean. Prod. 2022, 373, 133809. [Google Scholar] [CrossRef] [Scilit]
- Sun, L.; Deng, W.; Gao, H.; Nie, Z. Environmental Governance Pressure and the Co-Benefit of Carbon Emissions Reduction: Evidence from a Quasi-Natural Experiment on 2012 Air Standards. Sustainability 2025, 17, 8863. [Google Scholar] [CrossRef] [Scilit]
- Hu, C.; Ma, X.; Yang, L.; Chang, X.; Li, Q. Spatial-temporal variation and driving forces of the synergy of “pollution reduction, carbon reduction, green expansion and economic growth”: Evidence from 243 cities in China. Front. Ecol. Evol. 2023, 11, 1202898. [Google Scholar] [CrossRef] [Scilit]
- Chen, S.; Tan, Z.; Mu, S.; Wang, J.; Chen, Y.; He, X. Synergy level of pollution and carbon reduction in the Yangtze River Economic Belt: Spatial-temporal evolution characteristics and driving factors. Sustain. Cities Soc. 2023, 98, 104859. [Google Scholar] [CrossRef] [Scilit]
- Li, L.; Mi, Y.; Lei, Y.; Wu, S.; Li, L.; Hua, E.; Yang, J. The spatial differences of the synergy between CO2 and air pollutant emissions in China’s 296 cities. Sci. Total Environ. 2022, 846, 157323. [Google Scholar] [CrossRef] [Scilit] [PubMed]
- Zhang, T.; Zhang, Z.; Zhang, X.; Zhou, L.; Yao, J. Study on the Spatial–Temporal Characteristics and Influencing Factors of the Synergistic Effect of Pollution and Carbon Reduction: A Case Study of the Chengdu–Chongqing Region, China. Sustainability 2025, 17, 8365. [Google Scholar] [CrossRef] [Scilit]
- Guan, J.; Guan, Y.; Liu, X.; Zhang, S. Impact Mechanisms and Empirical Analysis of Urban Network Position on the Synergy Between Pollution Reduction and Carbon Mitigation: A Case Study of China’s Three Major Urban Agglomerations. Sustainability 2025, 17, 5842. [Google Scholar] [CrossRef] [Scilit]
- Jiang, F.; Chen, B.; Li, P.; Jiang, J.; Zhang, Q.; Wang, J.; Deng, J. Spatio-temporal evolution and influencing factors of synergizing the reduction of pollution and carbon emissions—Utilizing multi-source remote sensing data and GTWR model. Environ. Res. 2023, 229, 115775. [Google Scholar] [CrossRef] [Scilit] [PubMed]
- Qin, P.; Ren, C.; Li, L.; Lei, Y.; Wu, S. Evaluation of PM2.5 and CO2 synergistic emission reduction and its driving factors in China. J. Clean. Prod. 2023, 428, 139296. [Google Scholar] [CrossRef] [Scilit]
- Ansell, C.; Gash, A. Collaborative Governance in Theory and Practice. J. Public Adm. Res. Theory 2008, 18, 543–571. [Google Scholar] [CrossRef] [Scilit]
- Ghisellini, P.; Cialani, C.; Ulgiati, S. A review on circular economy: The expected transition to a balanced interplay of environmental and economic systems. J. Clean. Prod. 2016, 114, 11–32. [Google Scholar] [CrossRef] [Scilit]
- Kirchherr, J.; Reike, D.; Hekkert, M. Conceptualizing the circular economy: An analysis of 114 definitions. Resour. Conserv. Recycl. 2017, 127, 221–232. [Google Scholar] [CrossRef] [Scilit]
- Geissdoerfer, M.; Savaget, P.; Bocken, N.M.P.; Hultink, E.J. The Circular Economy—A new sustainability paradigm? J. Clean. Prod. 2017, 143, 757–768. [Google Scholar] [CrossRef] [Scilit]
- Sun, G.; Shao, Z.; Xu, Y.; He, X.; Shi, K.; Pan, H.; Xu, N.; Cao, X.; Wei, C.; He, Y.; et al. Synergistic Pathways and Potential Assessment for Pollution and Carbon Reduction in Typical Coastal Cities: A Case Study of Haishu District Ningbo. Sustainability 2025, 17, 9180. [Google Scholar] [CrossRef] [Scilit]
- Zhang, J. Estimation of China’s provincial capital stock (1952–2004) with applications. J. Chin. Econ. Bus. Stud. 2008, 6, 177–196. [Google Scholar] [CrossRef] [Scilit]
- Shi, K.; Yu, B.; Huang, Y.; Hu, Y.; Yin, B.; Chen, Z.; Chen, L.; Wu, J. Evaluating the Ability of NPP-VIIRS Nighttime Light Data to Estimate the Gross Domestic Product and the Electric Power Consumption of China at Multiple Scales: A Comparison with DMSP-OLS Data. Remote Sens. 2014, 6, 1705–1724. [Google Scholar] [CrossRef] [Scilit]
- Aigner, D.; Lovell, C.A.K.; Schmidt, P. Formulation and estimation of stochastic frontier production function models. J. Econom. 1977, 6, 21–37. [Google Scholar] [CrossRef] [Scilit]
- Charnes, A.; Cooper, W.W.; Rhodes, E. Measuring the efficiency of decision making units. Eur. J. Oper. Res. 1978, 2, 429–444. [Google Scholar] [CrossRef] [Scilit]
- Tone, K. A slacks-based measure of efficiency in data envelopment analysis. Eur. J. Oper. Res. 2001, 130, 498–509. [Google Scholar] [CrossRef] [Scilit]
- Tone, K.; Tsutsui, M. Network DEA: A slacks-based measure approach. Eur. J. Oper. Res. 2009, 197, 243–252. [Google Scholar] [CrossRef] [Scilit]
- Chen, M.; Yue, H.; Hao, Y.; Liu, W. The spatial disparity, dynamic evolution and driving factors of ecological efficiency in the Yellow River Basin. J. Quant. Tech. Econ. 2021, 38, 25–44. [Google Scholar] [CrossRef] [Scilit]
- Liao, Z.; Bai, Y.; Jian, K.; Chalermkiat, W. The Spatial Spillover Effect and Mechanism of Carbon Emission Trading Policy on Pollution Reduction and Carbon Reduction: Evidence from the Pearl River–West River Economic Belt in China. Sustainability 2024, 16, 10279. [Google Scholar] [CrossRef] [Scilit]
- Chen, X.; Meng, Q.; Wang, K.; Liu, Y.; Shen, W. Spatial patterns and evolution trend of coupling coordination of pollution reduction and carbon reduction along the Yellow River Basin, China. Ecol. Indic. 2023, 154, 110797. [Google Scholar] [CrossRef] [Scilit]
- Xu, Y.; Cheng, Y.; Zheng, R.; Wang, Y. Spatiotemporal Evolution and Influencing Factors of Carbon Emission Efficiency in the Yellow River Basin of China: Comparative Analysis of Resource and Non-Resource-Based Cities. Int. J. Environ. Res. Public Health 2022, 19, 11625. [Google Scholar] [CrossRef] [Scilit] [PubMed]
- Chen, X.; Meng, Q.; Shi, J.; Liu, Y.; Sun, J.; Shen, W. Regional Differences and Convergence of Carbon Emissions Intensity in Cities along the Yellow River Basin in China. Land 2022, 11, 1042. [Google Scholar] [CrossRef] [Scilit]

Disclaimer/Publisher’s Note: The statements, opinions and data contained in all publications are solely those of the individual author(s) and contributor(s) and not of MDPI and/or the editor(s). MDPI and/or the editor(s) disclaim responsibility for any injury to people or property resulting from any ideas, methods, instructions or products referred to in the content. |
© 2026 by the authors. Licensee MDPI, Basel, Switzerland. This article is an open access article distributed under the terms and conditions of the Creative Commons Attribution (CC BY) license.