1. Introduction
As the impacts of climate change and global warming intensify, the transition toward low-carbon transportation has become increasingly critical in the transport sector. According to the Paris Agreement, global emissions must be reduced by 45% by 2030 and reach 0 by 2050 to limit global warming to 1.5 °C [
1]. Low-carbon transportation plays a pivotal role in achieving 0 emissions [
2]. Due to their rapid responsiveness and low-carbon energy efficiency, electric vehicles (EVs) are regarded as the most promising alternative to conventional internal combustion engines [
3]. According to the International Energy Agency, global EV sales exceeded 17 million units in 2024, representing a 25% increase over 2023 [
4]. By 2030, EVs are expected to account for more than 40% of total vehicle sales, and the number of EVs on global roads will reach 245 million [
4]. However, EVs present significant challenges because their charging behavior is highly intermittent and stochastic [
5]. With the rapid growth in EV numbers, large-scale, uncoordinated charging may increase the stresses on the power grid and cause peak-load superposition, and pose unprecedented challenges to grid operation.
Regional Integrated Energy System (RIES) provides an innovative energy-management paradigm for coordinating multi-energy resources at the regional level. By integrating distributed energy resources, loads, energy storage systems, EVs, and other flexible assets, it is an effective way to consolidate clean energy, advancing the low-carbon transformation of energy structures [
6] and alleviating grid burdens [
7]. RIES integrates emerging low-carbon technologies such as EVs and Vehicle-to-Grid (V2G). From the perspective of energy integration, these technologies effectively enhance system energy efficiency and reduce carbon emissions [
8]. V2G leverages the storage flexibility of EVs batteries to enable bidirectional energy exchange between EVs and the grid. This approach supports demand response and provides reliability support for RIES dispatch [
9]. As the primary carriers of V2G applications, EVs have dual attributes as controllable loads and distributed energy-storage devices [
10]. Their integration into V2G can mitigate system stress levels and improve operational flexibility. However, there is a challenge to efficient system operation in coordinating the complex interests of entities within RIES, particularly the Integrated Energy System Operator (IESO), Energy Supplier (ES), Charging Station Operator (CSO), and Electric Vehicle Aggregator (EVA). Therefore, more targeted incentive strategies are needed to coordinate the interests of generation, storage, sales, and consumption entities and to promote optimal resource allocation.
In order to better characterize the interaction mechanisms among V2G participants, various modeling methods have been increasingly introduced into this field. Wu et al. (2025) [
11] proposed an incentive strategy that enables the IESO to set optimal electricity prices by integrating reinforcement learning with privacy-preserving mechanisms. Wang et al. (2020) [
12] examined how ES can influence other stakeholders by designing rational energy-pricing strategies that account for the bounded rationality of EV users. From both non-cooperative and cooperative game perspectives, Chen and Leung (2020) [
13] proposed an incentive strategy in which EVA determines electricity transaction prices to motivate EVs to provide frequency regulation services to the grid. Hou et al. (2022) [
14] developed an incentive strategy that jointly considers pricing and incentive demands, thereby reducing load fluctuations and EV dispatch costs. Li et al. (2021) [
15] proposed a dynamic pricing mechanism that combines traditional time-of-use (TOU) pricing with real-time electricity pricing. They established a bi-level optimal dispatch model involving EVA and RIES to achieve a mutually beneficial equilibrium. However, most studies focused on how charging and discharging prices influence EV behaviors, neglecting the impact of charging and discharging service fees on system operation management in real-world scenarios.
Therefore, to further explore interactions among V2G transaction participants, recent studies have gradually shifted focus to studying how charging and discharging service fees incentivize EV participation. Zhang et al. (2024) [
16] proposed a multi-agent evolutionary game model to examine how charging service fees influence EV users’ participation in V2G behavior and to analyze their regulatory effects on user behavior and market transaction power. Dong et al. (2024) [
17] analyzed compensation pricing strategies for charging and discharging service fees from the perspective of EV users’ response willingness. They further compared the regulatory effects of charging prices and service fees and explored how charging service fees affect EV behaviors in V2G transactions. Hou et al. (2025) [
18] analyzed the effects of incentive discounts on Charging Station Operators’ overall benefits, EV behaviors, and market electricity transactions. Jin et al. (2025) [
19] showed that CSO can further unlock the V2G potential of EVs by encouraging users to participate in load adjustment through contractual agreements and economic compensation. However, most studies focused on incentivizing EV users while neglecting or simplifying the revenue and incentive mechanisms for CSO in this process.
Several studies are closely related to the research focus of this paper. Cao et al. (2025) [
20] indicated the impact of dynamic service fees on the behavior of various RIES participants by considering EV charging preferences. Their proposed strategy reduces EV charging costs and increases market-traded electricity. However, the optimization objective of their model mainly focuses on incentivizing EV users and increasing market transaction power, while neglecting how to simultaneously motivate CSO to participate in V2G transactions. Pang et al. (2025) [
21] proposed a strategy combing subsidies and rewards for EVs, more effectively stimulating user engagement and increasing V2G market transaction power. However, this strategy overlooks the resulting changes in CSO profit.
Stackelberg game models have been widely used to characterize sequential decision-making among V2G participants. In the games, each decision-maker formulates its strategy to maximize its own utility [
15]. Recent studies often construct scenario-specific games to solve complex scheduling problems and achieve system-wide optimization [
18,
20,
21,
22,
23]. Yang, Xie, and Vasilakos (2016) [
22] employed a Stackelberg game approach to construct a transaction model between aggregators and EVs under demand uncertainty. Chen et al. (2018) [
24] used Stackelberg games to analyze interactions among participants during EV grid discharging and proved the existence of a unique equilibrium solution. Tushar et al. (2012) [
23] designed a Stackelberg game for scheduling EV charging.
Although recent studies have examined V2G incentive mechanisms from the perspectives of electricity pricing, subsidies, and service fees, they primarily focus on stimulating EV-side participation. The economic motivation of CSO, which serves as intermediaries between the IESO-ES and EVA, is often simplified or insufficiently linked to V2G transaction power. However, CSO plays an important role in providing charging and discharging services, organizing EV users, and transmitting transaction information in V2G transaction. If CSO profit is not properly coordinated with EV-side incentives, the overall effectiveness of V2G participation may be limited.
To address this issue, this paper proposes a commission-based service fee mechanism under a V2G subsidy and reward framework. In the proposed mechanism, the IESO-ES provides subsidies to the EVA to encourage EV participation and rewards to the CSO to support its intermediary role. Under this incentive framework, the CSO selects a commission-based service-fee strategy that links its revenue to V2G transaction power. Because the decisions of the IESO-ES, the CSO, and the EVA are made sequentially, a Stackelberg game is developed to characterize their hierarchical interactions. The IESO-ES acts as the leader by determining subsidy and reward strategies, while the CSO and the EVA act as followers by determining the service fee strategy and V2G trading response, respectively.
The main contributions of this paper are summarized as follows:
- (1)
Based on reference point-dependent theory, an EV participation willingness model is developed by considering the discharging electricity price, subsidy, and service fee. This model is used to identify EV users who are eligible and willing to participate in V2G discharging.
- (2)
A commission-based service fee mechanism is proposed for CSO under the subsidy and reward framework provided by the IESO-ES. This mechanism links CSO profit to V2G transaction power and provides a more flexible benefit-allocation method among the IESO-ES, the CSO, and the EVA.
- (3)
The decision-making process is modeled as a Stackelberg game composed of the IESO-ES, the CSO, and the EVA. Comparative case studies are conducted to evaluate different combinations of subsidies, CSO rewards, fixed service fees, and commission-based service fees.
- (4)
This work analyzed the effects of the reward rate, commission rate, and subsidy. The results provide managerial insights into how these parameters should be set within reasonable ranges to balance stakeholder interests, improve V2G market liquidity, and support the long-term economic sustainability of the energy systems.
The remainder of this paper is organized as follows:
Section 2 presents the structure of RIES and the mathematical models for each entity.
Section 3 provides a solution method for the Stackelberg game model with one leader and multiple followers. A case study is presented in
Section 4. Finally, conclusions are drawn in
Section 5.
2. Problem Description and Modeling
In this section, the interactions among entities within the RIES and the research problem are described in detail. Then, a model of each entity of the system is formulated.
2.1. System Structure
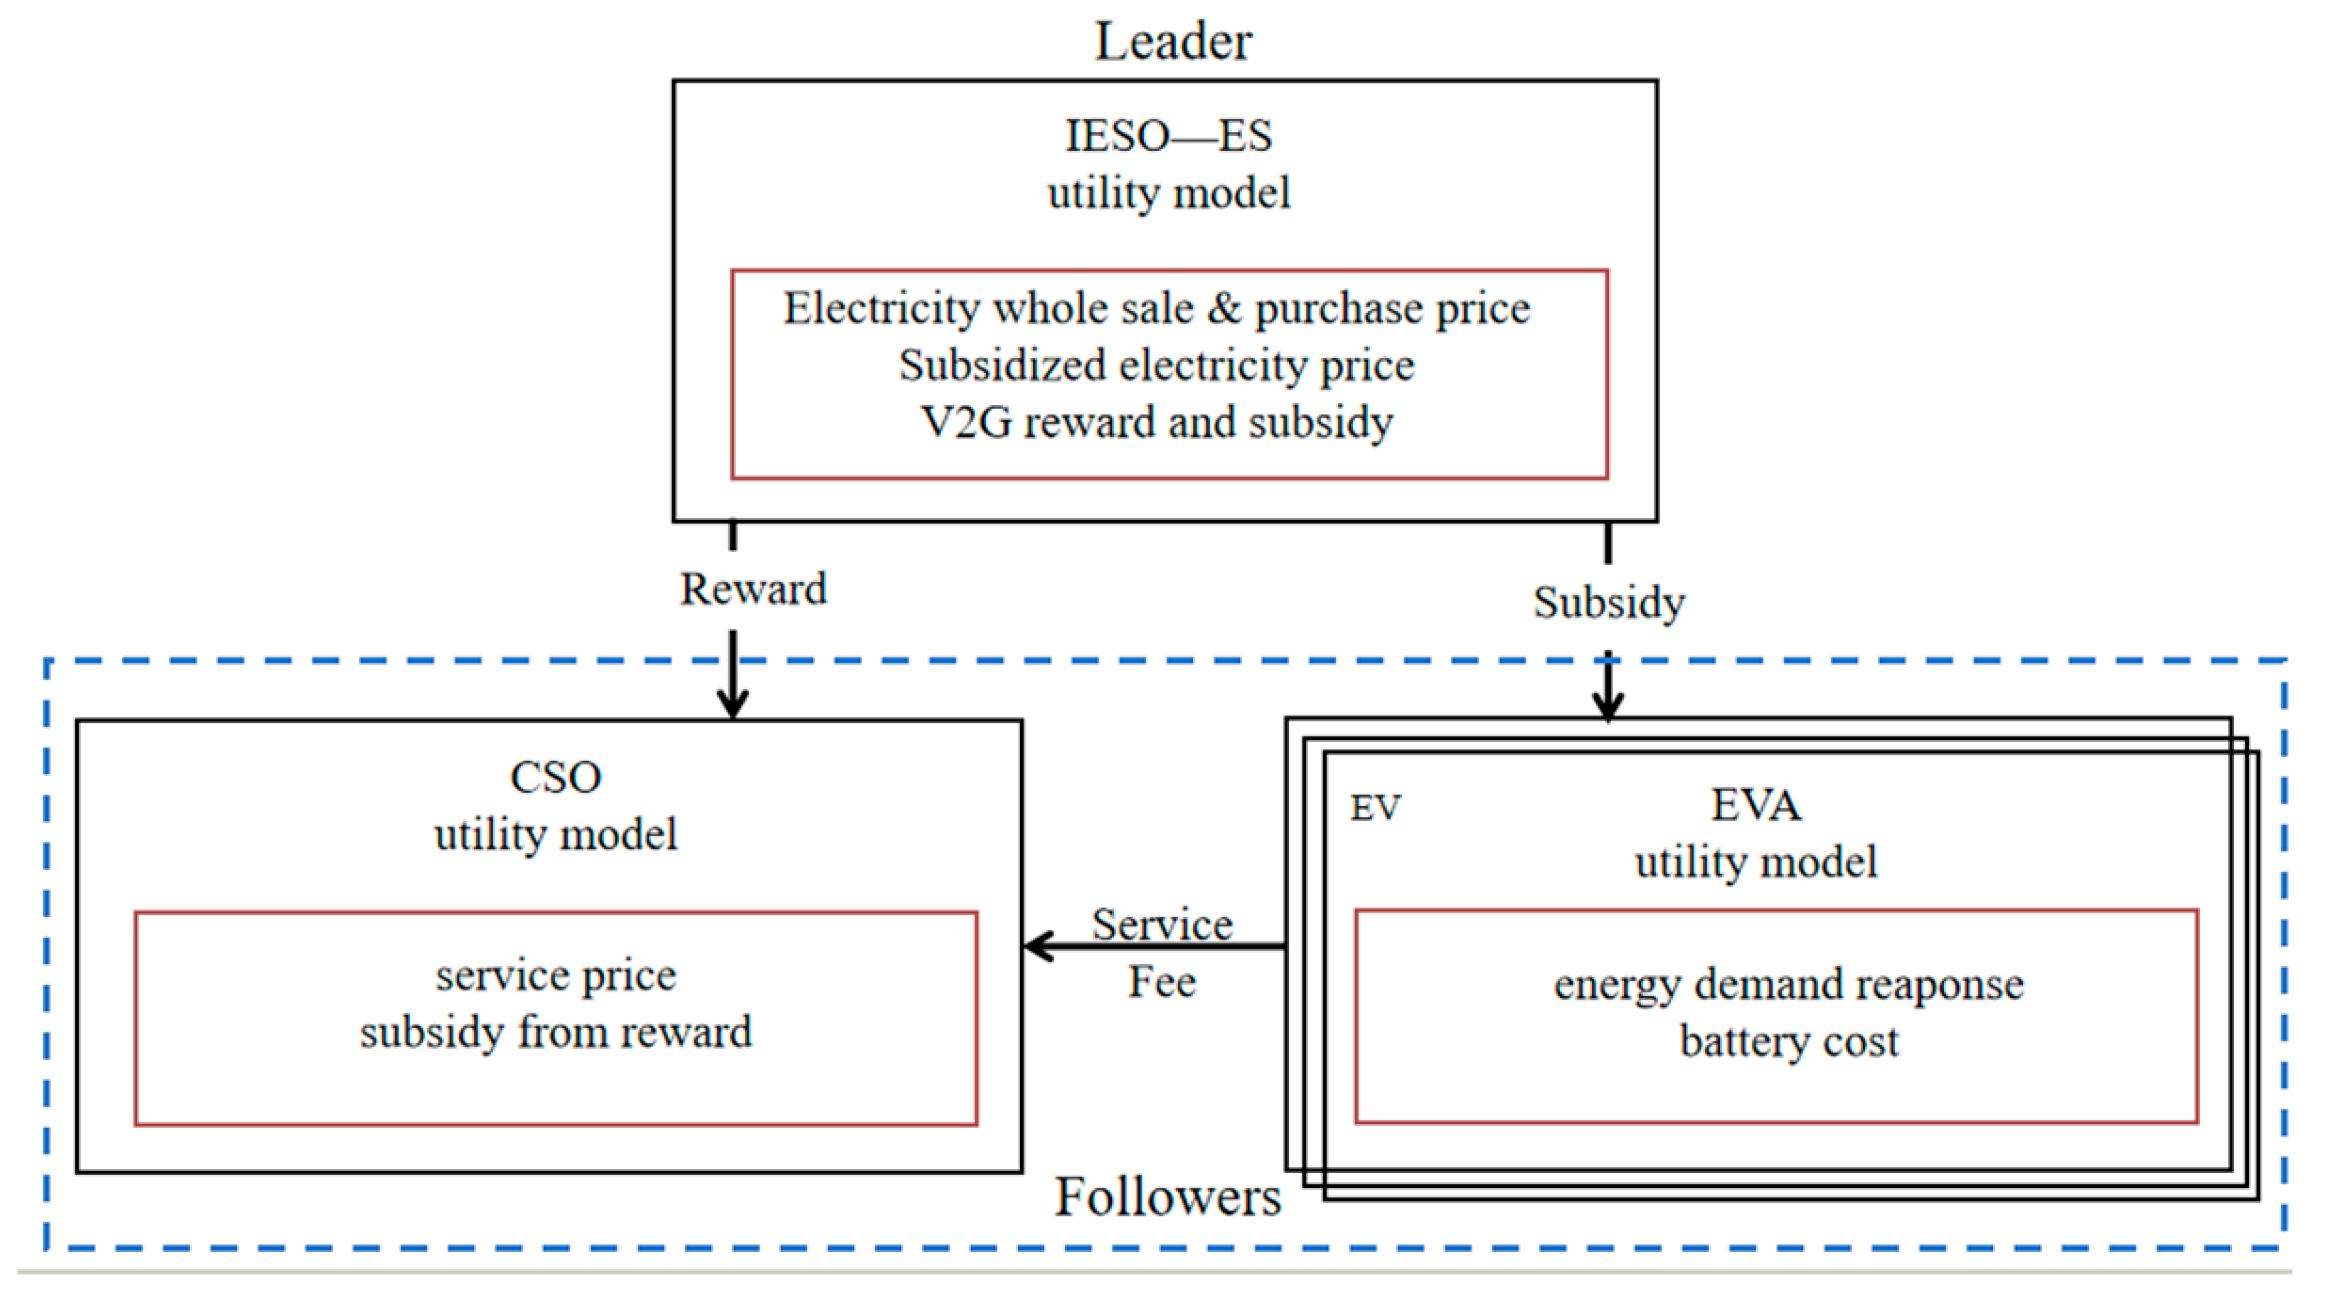
In this work, the RIES primarily consists of three components. The upper layer comprises the IESO and the ES, which together form the IESO-ES. This layer determines the charging price, discharging price, subsidy, and the reward for CSO. At the lower level, the CSO determines the service fees charged to the EVA. The lower-level EVA, which aggregates multiple EVs, determines the power in the market based on the incentive parameters (
Figure 1).
The IESO-ES operates photovoltaic plants, wind turbines, solar-thermal plants, and energy-storage facilities to coordinate the conversion, storage, and dispatch of multiple energy resources. The generated electricity is sold to the EVA for EV charging. The CSO is responsible for transmitting charging and discharging transaction information and providing charging and discharging services between the IESO-ES and the EVA. Accordingly, the CSO determines the service-fee strategy for charging and discharging services. The EVA is the combination of EVs and represents them in V2G market transactions. Because the transaction power of an individual EV is relatively small, this paper aggregates EV users to the EVA, which participates in market transactions on behalf of dispersed EV users.
In the proposed mechanism, the IESO-ES first announces electricity prices, the subsidy for the EVA, and the reward for the CSO. Based on these upper-level decisions, the CSO determines its service fee strategy. In particular, under the commission-based service fee mechanism, CSO profit is linked to the V2G transaction power and the incentive level provided by the IESO-ES. The EVA then responds to the effective discharging revenue and service fee by adjusting the aggregated charging and discharging decisions of EVs. The resulting V2G transaction power is fed back to the IESO-ES and affects the revenues of all participants.
Based on the risk-neutral trading characteristics of the V2G market within the RIES [
25], all entities in the RIES pursue the maximization of their own expected profits. It is further assumed that all entities within the RIES can access real-time electricity charging and discharging prices, thereby enabling information sharing among participants. In this study, V2G transaction power refers to the total electricity transacted through V2G charging and discharging activities over the scheduling horizon, and it is measured in kWh.
2.2. IESO-ES Objective and Constraints
The objective function of the IESO-ES is shown in Equation (1). It consists of four components: the revenue from V2G transactions
, the equipment generation costs
, the reward costs for CSO
, and the subsidy costs for EVA participation in V2G
. They are formulated as Equations (2)–(5).
where
represents the electricity traded by EVA within the regional energy system;
indicates the discharging power of EVA;
indicates the charging power of EVA;
signifies the charging price;
signifies the discharging price;
signifies the reward rate granted by IESO-ES to CSO for V2G;
,
represent the optimized output power of wind turbines, photovoltaic systems, and concentrated solar power units at time t, respectively;
is the efficiency of converting CSP output into electricity;
is the charging and discharging loss rate of the energy storage system;
,
are the discharging and charging power of the ES, respectively;
is the equivalent energy-supply cost coefficient. These are constrained by Equations (6)–(12)
where
represents the charging price from the external grid;
stands for the IESO reward for CSO, which ranges between 0.1 and 0.3 [
20];
denotes the maximum subsidy price offered by the IESO-ES to the EVA;
,
represent the maximum output limits of wind power, photovoltaic generation, and concentrating solar power, respectively. Constraint (6) reflects the requirement that the EVA participates in V2G transactions through the RIES rather than trading directly with the external grid. Constraint (12) ensures that the charging demand served by the IESO-ES does not exceed the available regional energy supply, considering renewable generation and energy storage operation.
2.3. CSO Objective and Constraints
To further analyze the impact of different CSO service fee models on the RIES, two types of CSO service fee mechanisms are considered for comparison: a fixed service fee mechanism and a commission-based service fee mechanism. Under the fixed service-fee mechanism, the CSO charges the EVA a fixed unit service fee for charging and discharging power. In this case, CSO profit is mainly determined by V2G transaction power and the fixed service-fee parameters.
Under the commission-based service-fee mechanism, the CSO charges a proportional service fee based on the effective V2G discharging revenue received by the EVA. This mechanism is implemented under the subsidy and reward framework provided by the IESO-ES. Specifically, the IESO-ES provides the subsidy to the EVA to encourage EV participation and the reward to the CSO to support its intermediary role in V2G transactions. The CSO then determines the commission rate for the service fee strategy.
The objective function of CSO is shown in Equation (13), which consists of three components: the service fee revenue of CSO
, the reward from the IESO-ES
, and the cost for V2G participation
. The relevant revenue and cost terms are introduced in Equations (14)–(16).
where
represents the commission rate determined by CSO for the service fee charged to the EVA;
is the service fee for charging;
is the service fee for discharging;
denotes the unit operation cost coefficients of the CSO for charging and discharging services [
20].
where
and
denote the lower and upper bounds of the commission rate, respectively. In this study,
is set to 0.1 [
20].
2.4. EVA Response Willingness Model
The EVA response-willingness model characterizes EV users’ willingness to participate under different revenue levels. Based on this willingness, the model weights controllable power to reflect the actual electricity traded by the EVA within the RIES.
In V2G trading scenarios, EV users’ participation in discharging transactions primarily depends on their subjective expectations of discharging prices. According to the reference point-dependence theory [
26], EV users exhibit reference-point dependence to participate in V2G transactions. In the RIES, entities such as the IESO-ES and the CSO jointly determine the comprehensive incentive level for EV users through price incentives and benefit allocation. Consequently, the threshold value
for EV participation in V2G to discharge can be expressed by Equation (18).
where
is the maximum value of
. The reward provided by the IESO-ES to the CSO encourages the CSO to provide better services to EV users. Stevens’ law states that the magnitude of the sensation is directly proportional to the power of the stimulus quantity, the psychological quantity is a power function of the physical quantity.
represents EV users’ service satisfaction associated with the reward provided by the IESO-ES to the CSO. The coefficient of users’ sensitivity to the improvement of the services from the CSO
.
is the equivalent benefit coefficient of service satisfaction [
20]. The user discharging engagement [
17]
is described in Equation (21).
When a user’s expected benefit is no less than the threshold, the EV participates in V2G discharging transactions. Otherwise, the EV discharging power is set to 0. Only when the expected benefit is no less than the reference threshold does one EV proceed to the subsequent discharge decision phase.
Based on the on-grid state of the EV,
is used to indicate whether the EV has discharging response capability,
is used to indicate whether the EV has charging response capability,
indicates that the EV neither charges nor discharges, as described in Equations (22) and (25).
where
denotes the initial SOC of EVs;
represents the energy storage of the EV departure, which follows the normal distribution
is the on-grid state of the EV and expressed in Equation (25). Thus, the discharging power can be expressed by the following Equation (26).
where
represents the discharging power of EVs. EVs are classified into two types: daytime EVs and nighttime EVs. The more detailed information about EVs will be introduced in
Section 4.
2.5. EVA Charging Load Model
The arrival time and departure time of EVs are normally distributed within the range of [0, 24], and its probability density function can be expressed as Equations (27) and (28).
where
is the arrival time for duty of the private EV;
and
represent the mean and standard deviation of the arrival time, respectively.
is the departure time of the private EV;
and
represent the mean and standard deviation of the departure time, respectively.
This paper assumes that the initial SOC value of EVs follows a normal distribution, whose probability density function is expressed in Equation (29).
where
and
represent the mean and variance of the initial SOC, respectively. The SOC of each EV participating in the scheduling satisfies Equation (30).
where
and
represent the charging and discharging power of each EV, respectively;
and
represent the charging and discharging efficiency of EVs, respectively. To ensure battery safety and users’ travel demand, the SOC must satisfy the following constraints:
where
and
represent the minimum and maximum energy storage of the EV;
represent the maximum charging and discharging power of the EV in each time period, respectively.
2.6. EVA Objective and Constraints
The objective function of the EVA is to minimize its total cost, as shown in Equation (35). It consists of three components: the discharging revenue of the EVA
, the battery degradation cost caused by discharging
, and the cost for charging
as formulated in Equations (36)–(39).
where
represents the reference depth of discharge;
are the fitting parameters obtained from experimental data;
is the battery cycle life under standard test conditions;
denotes the cost of the battery [
27].
where
represents the maximum discharging power accepted by the RIES;
is the maximum charging power supplied by the RIES. Ambient temperature primarily affects the rate of reactions within the battery, thereby altering its internal resistance and influencing battery lifespan. In this study, the temperature acceleration factor is assumed to remain constant [
27].
3. Model Solution Method and Process
3.1. Formulation of the Stackelberg Game
Based on the description of the RIES in
Section 2, the upper-layer IESO-ES leads market direction through incentive strategies, while the lower-layer CSO and EVA make nested optimal responses under given constraints. During the transactions, profit conflicts arise between the upper-layer IESO-ES and the lower-layer CSO, as well as between the CSO and the EVA. Because the three parties make decisions sequentially, their interactions can be formulated as a Stackelberg game with one leader and multiple followers. The game model comprises the following three components.
- (1)
Participants: IESO-ES, CSO, and EVA. The participant set is represented as:
- (2)
Strategy: The IESO-ES determines the reward for the CSO and the subsidy for the EVA in the V2G market, represented by . The CSO determines the service-fee strategy, represented by . The EVA determines the V2G transaction power according to the resulting revenues, represented by .
- (3)
Payoffs: The payoff of each participant is defined by the corresponding objective function in
Section 2.
A Stackelberg equilibrium is reached when all followers respond optimally to the leader’s strategy and the leader has no incentive to deviate from its decision. In this paper, the final Stackelberg equilibrium strategy obtained by the proposed solution procedure is unique under the specified model parameters. The theoretical proof is provided in
Appendix A.
3.2. Optimization Process and Solution
To solve the hierarchical Stackelberg game, the problem is formulated as a bi-level iterative optimization framework. At the upper layer, the Non-dominated Sorting Genetic Algorithm II (NSGA-II) [
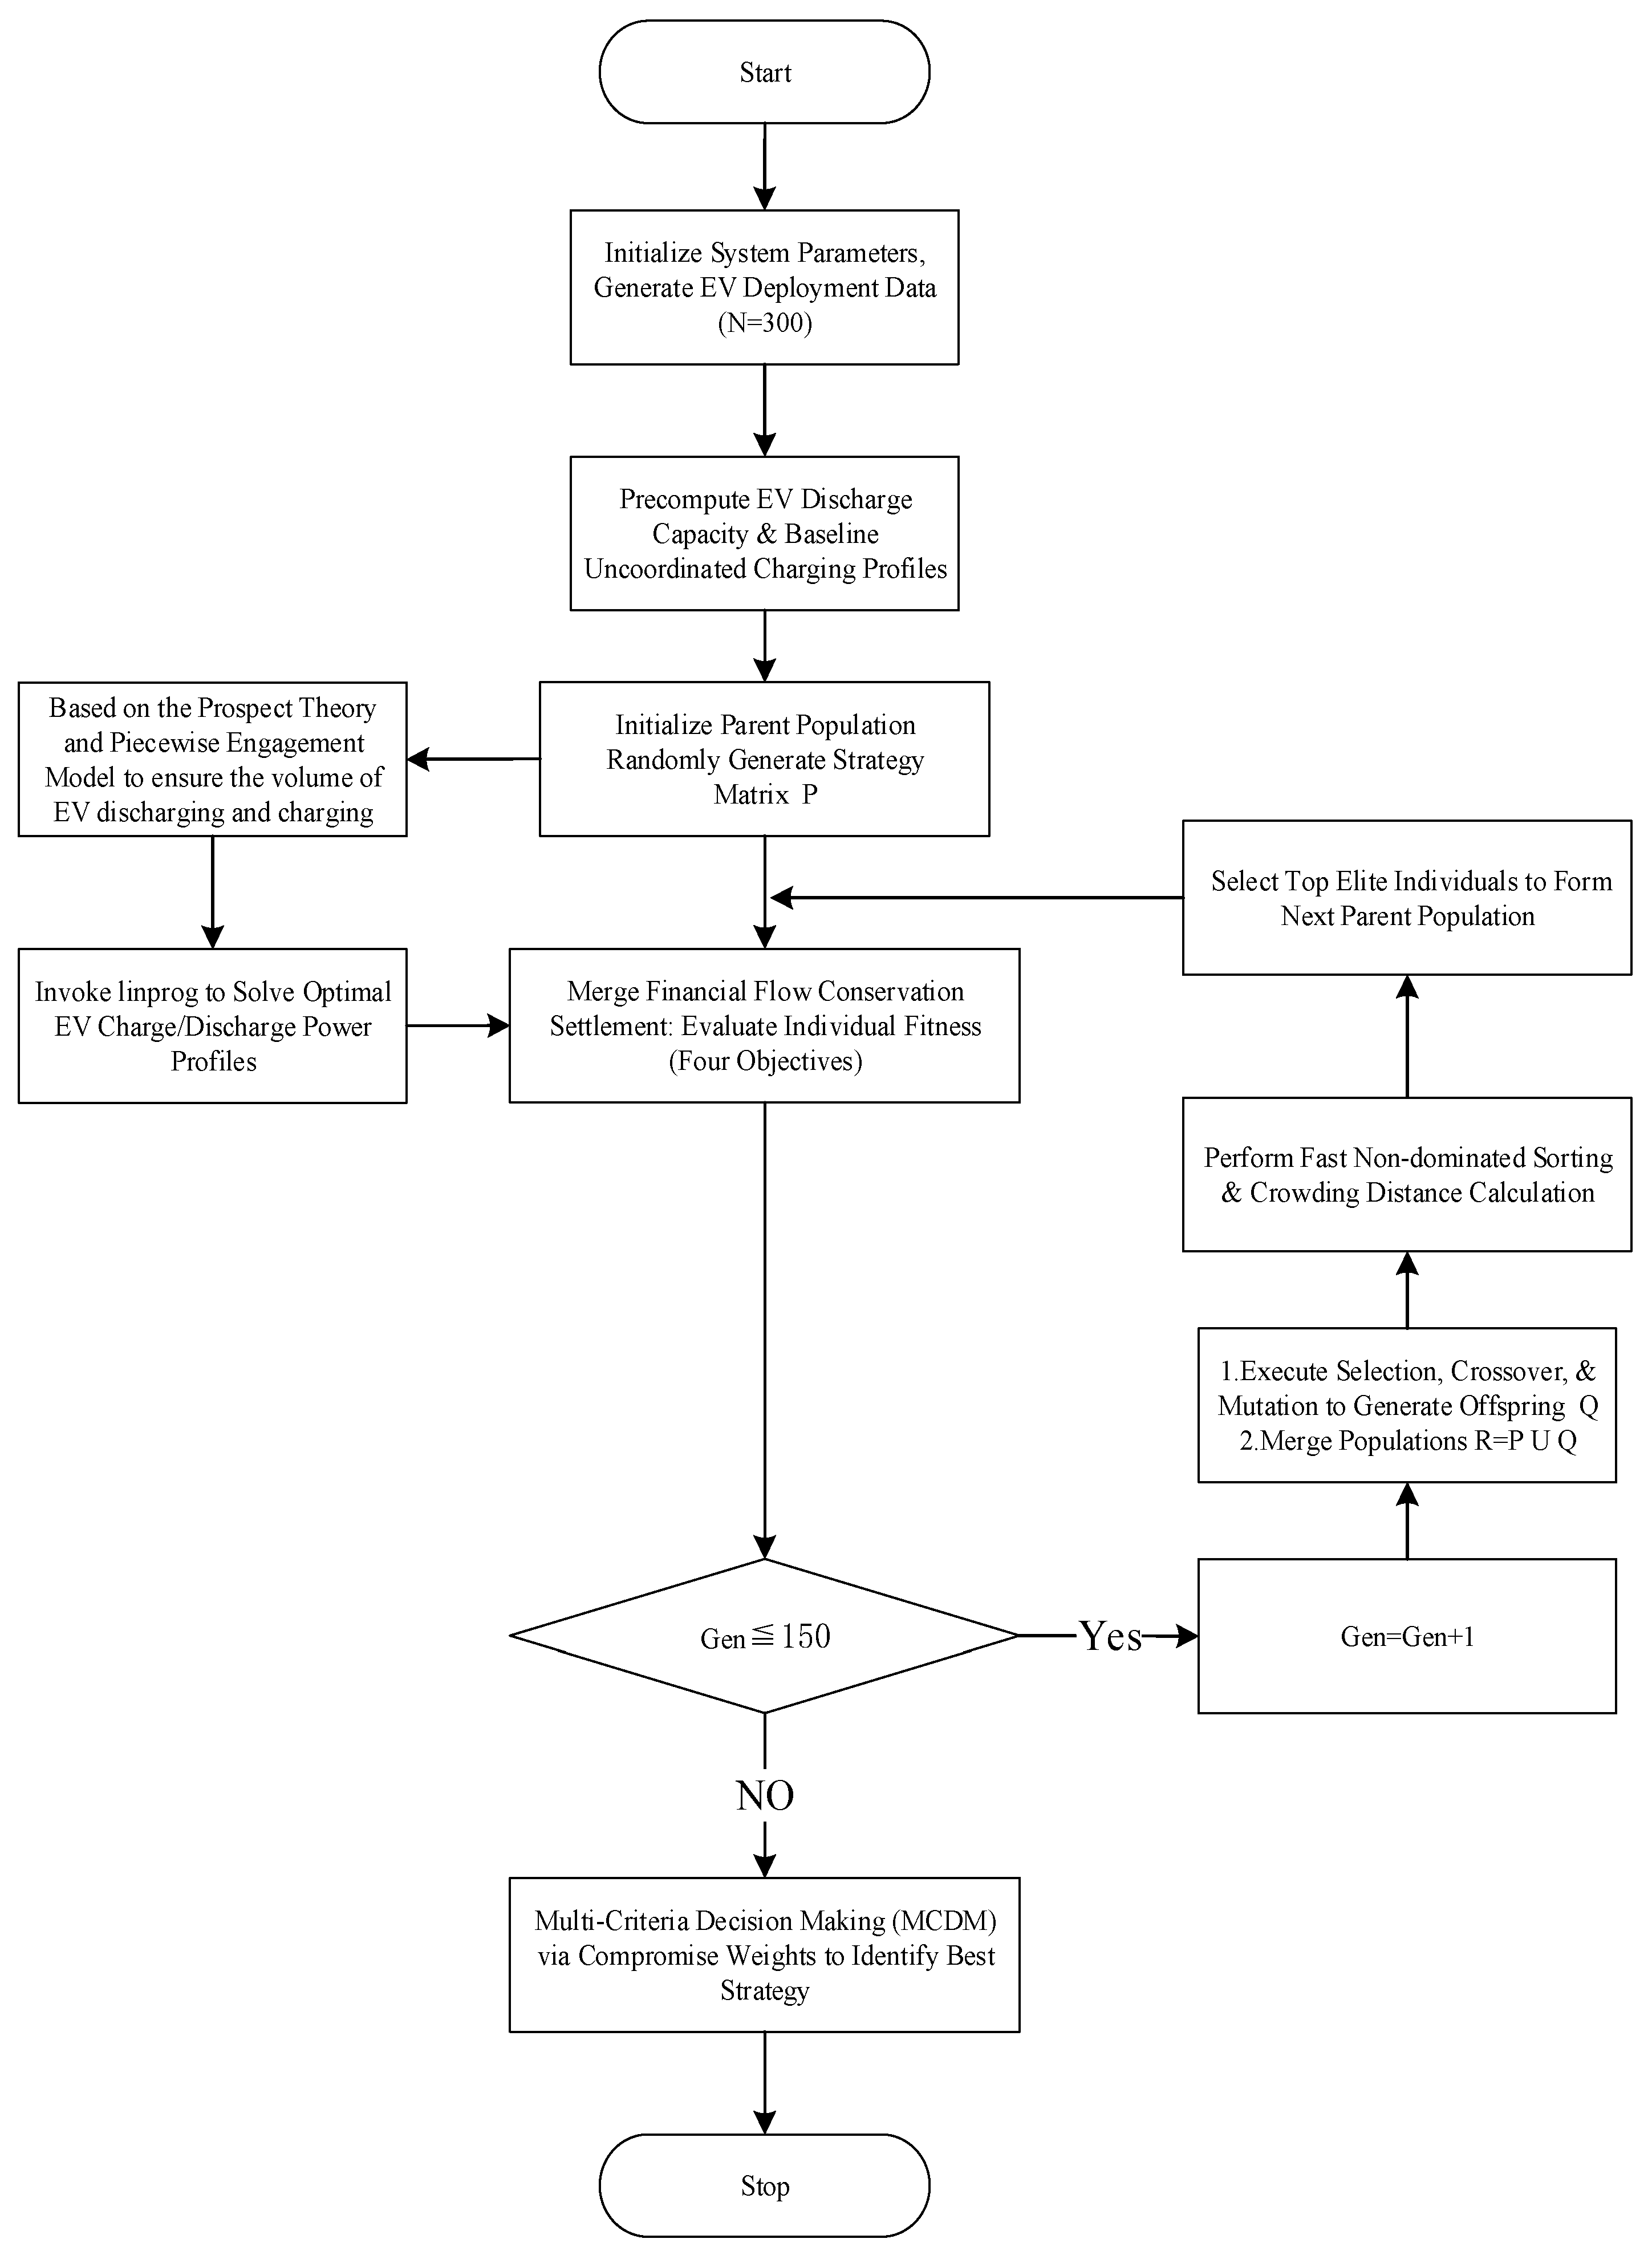
28] is used to search the leader’s decision space and update candidate strategies for the IESO-ES subsidy and reward decisions and the CSO commission-based service-fee strategy. For each generated upper-level strategy, the lower-level problem, namely the EVA response, is solved using an optimization solver. This bi-level procedure is repeated through closed-loop feedback until the objective functions at both layers converge. The flowchart of the proposed strategies is shown in
Figure 2.
Step 1: Input the relevant system parameters, including the charging service fee, EV travel demand, battery capacity, initial SOC, arrival and departure time, and other EV behavior parameters. Then generate the EV deployment data, based on the specified EV population size.
Step 2: Precompute the available EV discharging capacity, baseline charging demand, and uncoordinated charging profiles. These results are used as the reference state for subsequent coordinated charging and discharging optimization.
Step 3: Randomly initialize the parent population of NSGA-II. Each individual represents a candidate strategy matrix, including the reward rate, commission rate, and subsidy.
Step 4: Based on prospect theory and the EV engagement model, evaluate EV users’ willingness to participate in discharging services.
Step 5: Solve the linear programming model to obtain the optimal EV charging and discharging power profiles under the current strategy variables. The resulting schedules must satisfy SOC constraints, travel-demand constraints, charging and discharging power limits, and energy-balance constraints.
Step 6: For each individual in the population, incorporate the financial-flow conservation and settlement rules. Then, calculate the fitness values of the four objective functions: the discharging power of EVA, the cost of EVA, CSO profit, and IESO-ES profit.
Step 7: Determine whether the maximum number of generations has been reached. If yes, proceed to Step 10; otherwise, proceed to Step 8.
Step 8: Perform NSGA-II evolutionary operations, including selection, crossover, and mutation, to generate the offspring population. Then merge the parent and offspring populations.
Step 9: Perform fast non-dominated sorting and crowding-distance calculation on the merged population. Based on Pareto rank and crowding distance, select the elite individuals to form the next parent population. Then, return to Step 4 for the next iteration.
Step 10: After the iterative process is completed, use a multi-criteria decision-making method based on comprehensive weights to select the best compromise solution from the Pareto optimal solution set.
Step 11: Output the optimal pricing and incentive strategy, including the optimal reward coefficient, commission rate, the discharging power of EVs, the cost of EVA, CSO profit, and the benefit of IESO-ES. Finally, generate the corresponding optimization results and convergence curves.
4. Case Studies
4.1. Parameter Settings
To validate the effectiveness of the proposed strategy, this paper draws on parameter settings and empirical data from [
23,
29,
30]. The travel patterns of EVs were generated using Monte Carlo sampling. It is assumed that the EVA manages a fleet of 300 EV, which are classified into two types according to their travel schedules: “daytime working” and “nighttime working.” The detailed parameter settings are presented in
Table 1. The IESO-ES specifies the time periods during which EVs are allowed to discharge. Only vehicles that are connected to the grid during the discharging period and whose current state of charge (SOC) exceeds the target SOC are eligible for discharging. Moreover, the maximum allowable discharging capacity of each EV is limited by the difference between its current SOC and the target SOC. The optimization ranges for discharging compensation prices and other parameter settings in this paper are listed in
Table 2. To ensure reliable optimization performance, the key operational parameters of the NSGA-II framework are calibrated through repeated simulations, as detailed in
Table 3.
4.2. Effectiveness Comparison of Incentive Strategies with Commission Service Fee and Reward Mechanisms
To evaluate the effects of commission-based service fees and reward on EV discharging power, EVA cost, CSO revenue, and IESO-ES profit, six strategies are designed while all other parameters remain unchanged. Strategy 4 is the proposed strategy of this manuscript:
Strategy 1: The IESO-ES provides a subsidy to the EVA but no reward to the CSO, and the CSO selects a fixed service-fee mechanism.
Strategy 2: The IESO-ES provides both a subsidy to the EVA and a reward to the CSO, while the CSO selects a fixed service-fee mechanism.
Strategy 3: The IESO-ES provides a subsidy to the EVA but no reward to the CSO, and the CSO selects a commission-based service-fee mechanism.
Strategy 4: The IESO-ES provides both a subsidy to the EVA and a reward to the CSO, while the CSO selects a commission-based service-fee mechanism.
Strategy 5: The IESO-ES provides neither a subsidy to the EVA nor a reward to the CSO, and the CSO selects a fixed service-fee mechanism.
Strategy 6: The IESO-ES provides neither a subsidy to the EVA nor a reward to the CSO, and the CSO selects a commission-based service-fee mechanism.
The relative performance of each strategy is evaluated using the revenues of the three entities and V2G transaction power as key metrics. Comparative analysis of these metrics under different strategies is presented in
Table 4.
In Strategy 1, CSO profit is lower than that in Strategy 2. This indicates that even when an EVA subsidy is provided, the absence of a CSO reward limits the CSO’s motivation to improve service quality and promote higher discharging power. Strategy 1 is suitable when the policy objective is to directly incentivize EV participation while keeping the mechanism simple. Strategy 2 strengthens CSO engagement and can therefore improve operational reliability. This strategy is suitable when the system operator seeks to enhance CSO participation through a direct reward mechanism while maintaining a simple and stable service-fee structure.
In Strategy 3, IESO-ES profit is the highest; whereas, CSO profit is approximately equal to that in Strategy 2. The commission mechanism links CSO profit to V2G transaction power, encouraging the CSO to promote V2G participation. The high IESO-ES profit arises because the increase in transaction power offsets the subsidy cost, while no additional CSO profit is paid. This strategy is suitable when system-wide profit maximization is prioritized while EV incentives are retained. In Strategy 4, EV discharging power and CSO profit reach their highest levels, while EVA cost reaches its lowest level. The strategy improves coordination among all participants by balancing system efficiency, operator motivation, and EV participation. It is suitable when multi-agent collaboration and market discharging power are prioritized, even though it slightly reduces short-term IESO-ES profit.
In Strategies 5 and 6, the absence of incentives leaves EV users with insufficient motivation to participate, resulting in 0 V2G discharging power. These strategies indicate the critical role of incentives: service fees alone are insufficient to drive V2G participation. These two strategies serve as baseline cases for assessing the policy effects of subsidy and reward. The identical results of Strategies 5 and 6 support the validity of the parameter choices in the model. They confirm that the simulation captures the need for direct EV incentives to stimulate V2G participation. The results are consistent with economic intuition. Without direct benefits for EV users, the type of service-fee mechanism alone does not affect participation. This suggests that the parameter settings yield realistic and reliable behavior across strategies.
Compared with the other strategies, Strategy 4 achieves the highest V2G discharging power, the highest CSO profit, and the lowest EVA cost. Although IESO-ES profit under Strategy 4 is slightly lower than in Strategy 3, this reduction results from the additional reward paid to the CSO, which strengthens its motivation to organize EV users and promote discharging. As a result, more EV users participate in V2G transactions, increasing the discharging power and reducing EVA cost, thereby improving system efficiency and user satisfaction. The slight reduction in IESO-ES profit reflects a redistribution of benefits toward the CSO and the EVA to improve multi-agent coordination. In contrast, Strategy 3 maximizes IESO-ES profit by avoiding CSO rewards, but this comes at the cost of lower discharging power and less balanced benefit allocation. Therefore, from a coordination perspective, Strategy 4 is more appropriate because it balances the interests of the system operator, the CSO, and the EVA while increasing V2G market activity. These results indicate that Strategy 4 is the most effective strategy for promoting sustainable and active V2G operation.
4.3. Convergence and Performance of Strategy 4
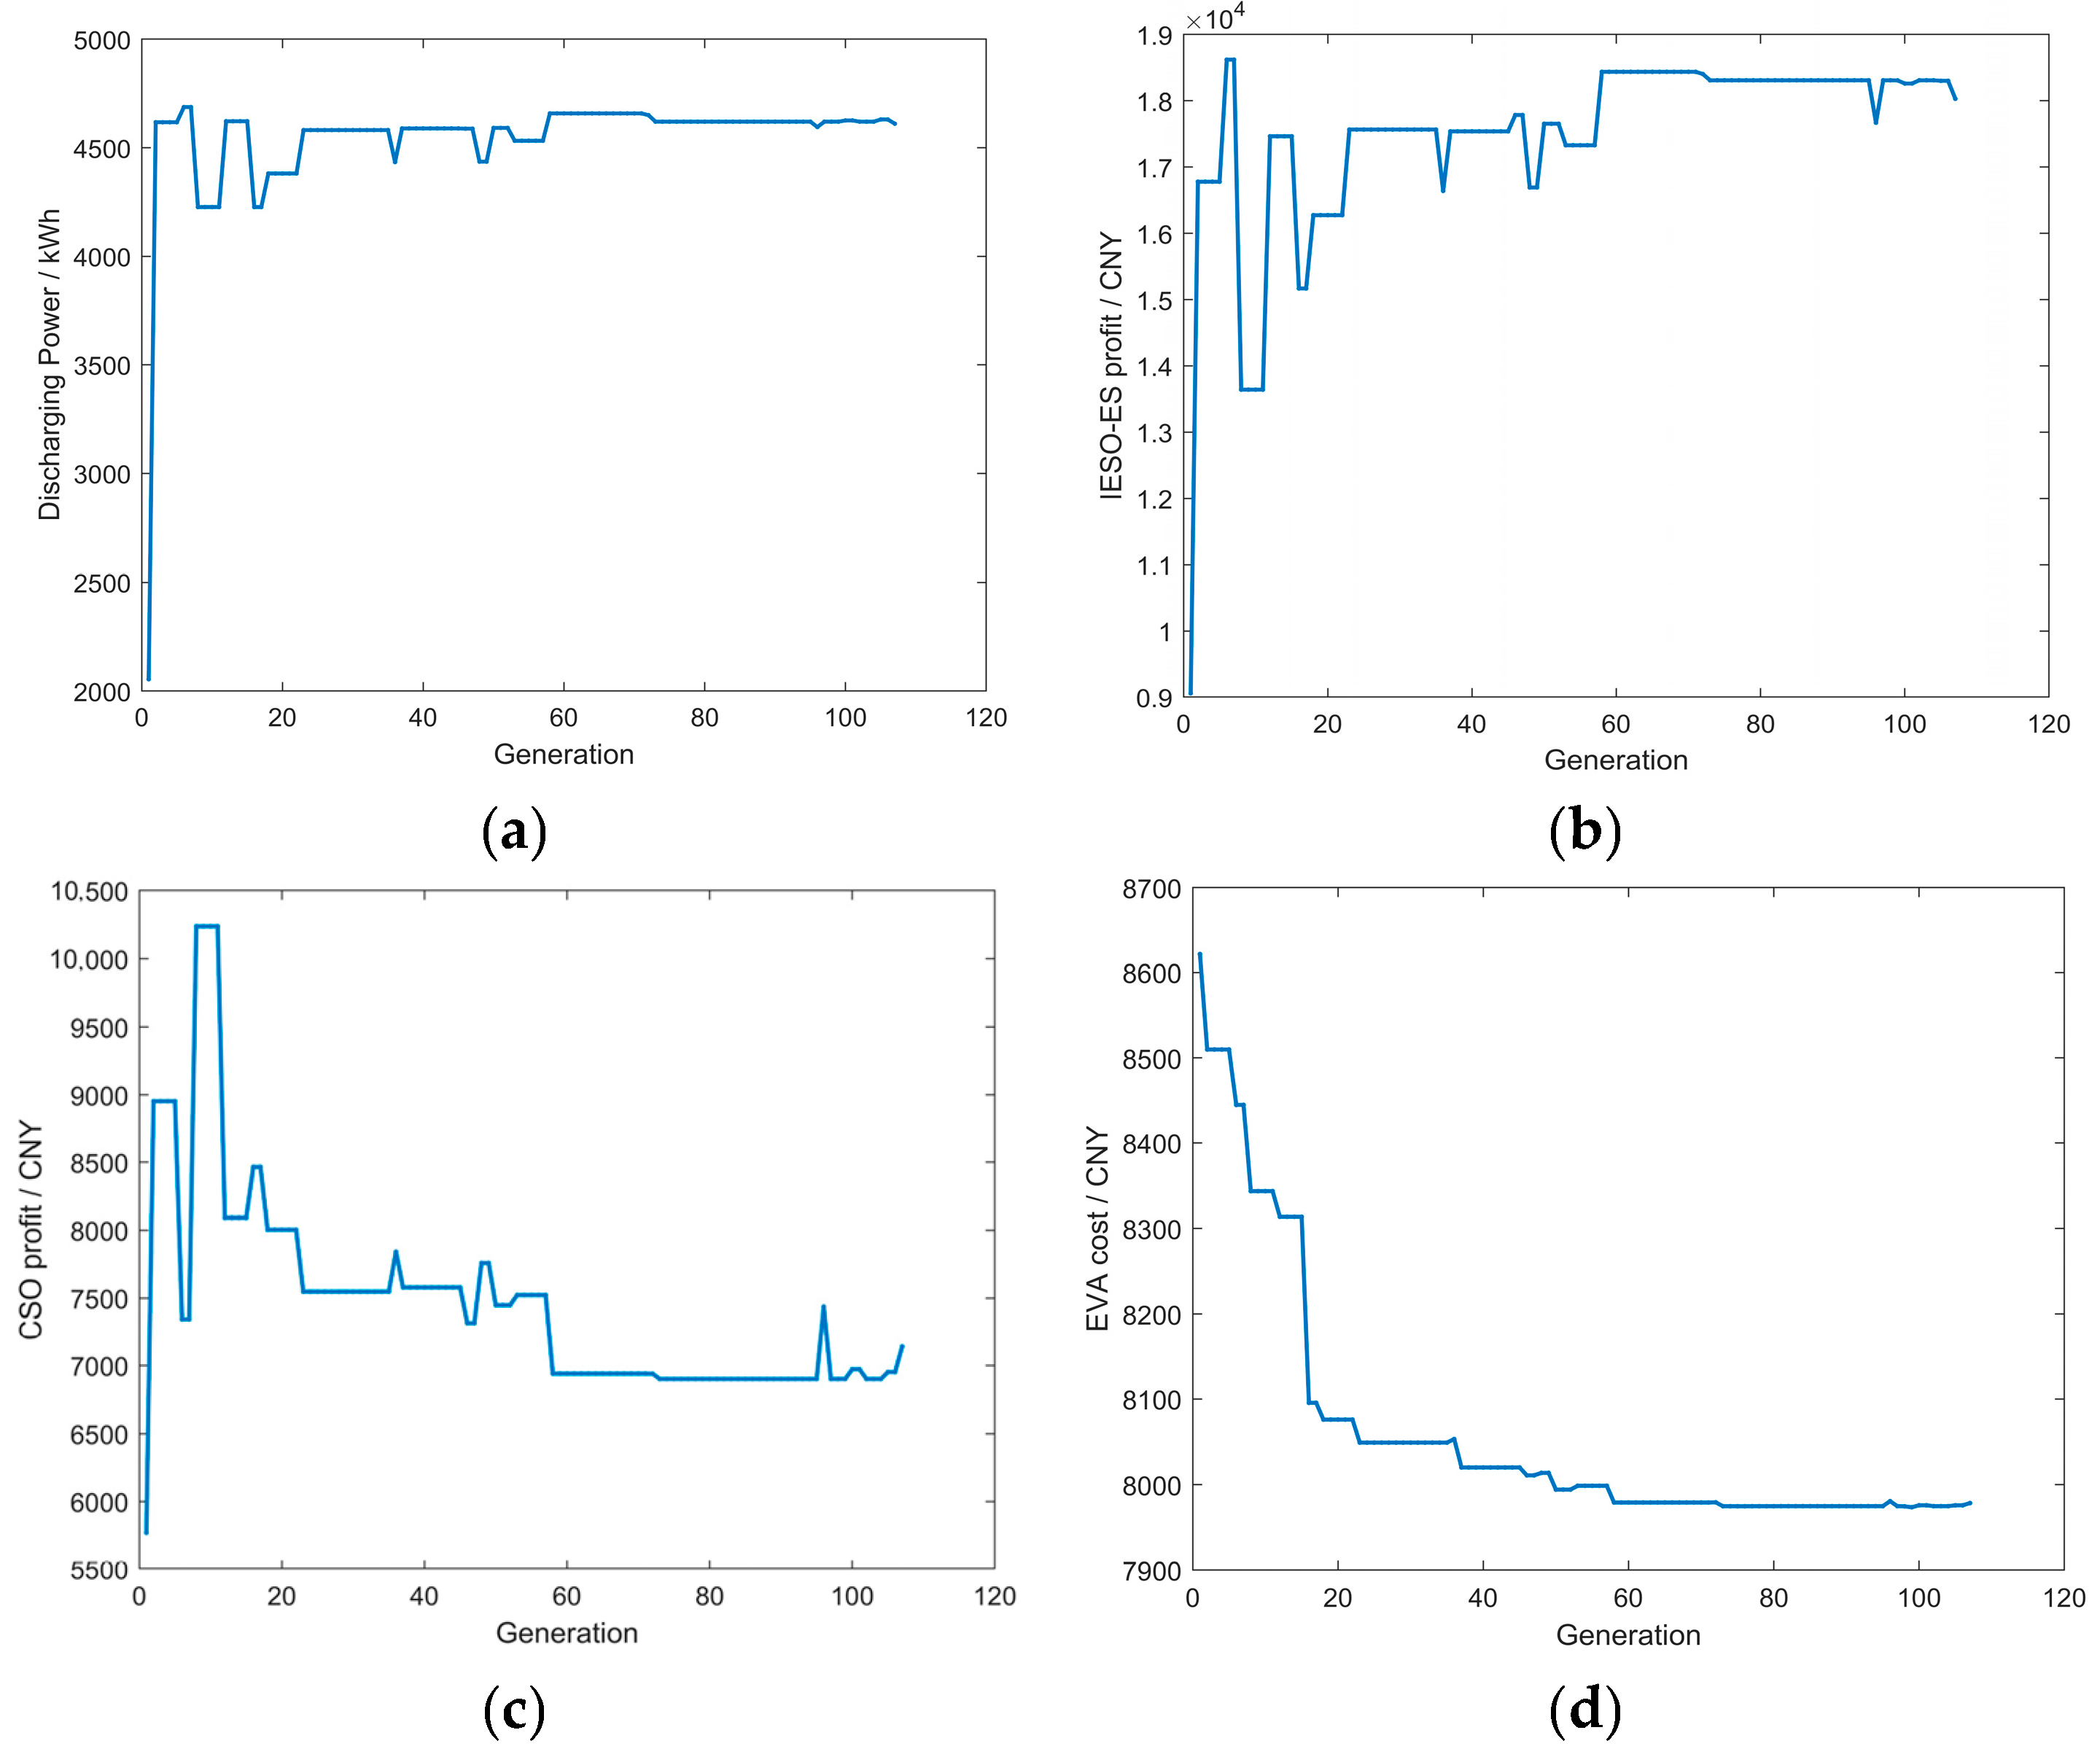
In order to verify the stability of the optimization process and examine the operational advantages of the commission-based service-fee mechanism, this section investigates the iterative convergence behavior of Strategy 4 and analyzes its practical performance. As the number of generations increases, the optimization results under Strategy 4 gradually converge, as shown in
Figure 3. In the initial stage of the iteration, the objective values fluctuate significantly because NSGA-II explores a broad solution space to identify feasible strategy combinations. After approximately 60 generations, EV discharging power, IESO-ES profit, CSO profit, and EVA cost become relatively stable, indicating that the proposed optimization process has reached a stable compromise solution.
Specifically, the EV discharging power increases rapidly at the beginning and then stabilizes at about 4600 kWh. This indicates that the combination of the subsidy, reward, and commission-based service fee mechanism can effectively encourage EV users to participate in V2G transactions. IESO-ES profit also converges to approximately 18,000 CNY, showing that higher V2G transaction volume can generate stable system-level economic benefits. Meanwhile, CSO profit gradually stabilizes at around 6900 CNY. Although CSO profit fluctuates during the early iterations, it eventually converges as the commission ratio and reward strategy are optimized. This result indicates that the proposed mechanism can maintain the economic motivation of the CSO while promoting V2G transactions.
In addition, the EVA cost decreases continuously during the early stage of optimization and finally converges to approximately 8000 CNY. This trend indicates that the optimized subsidy and service fee strategy can reduce the cost of EVA while satisfying EV charging demand and discharging constraints. Overall, the convergence results verify the effectiveness of Strategy 4. By jointly considering the EVA subsidy, CSO reward, and commission-based service-fee mechanism, Strategy 4 achieves a stable balance among V2G transaction power, IESO-ES profit, CSO profit, and EVA cost, thereby improving the coordination performance of multiple participants in the RIES.
4.4. Reward Rate Analysis
To examine the sensitivity of V2G market activity to upper-level incentives, this section evaluates system performance under different reward rates. As shown in
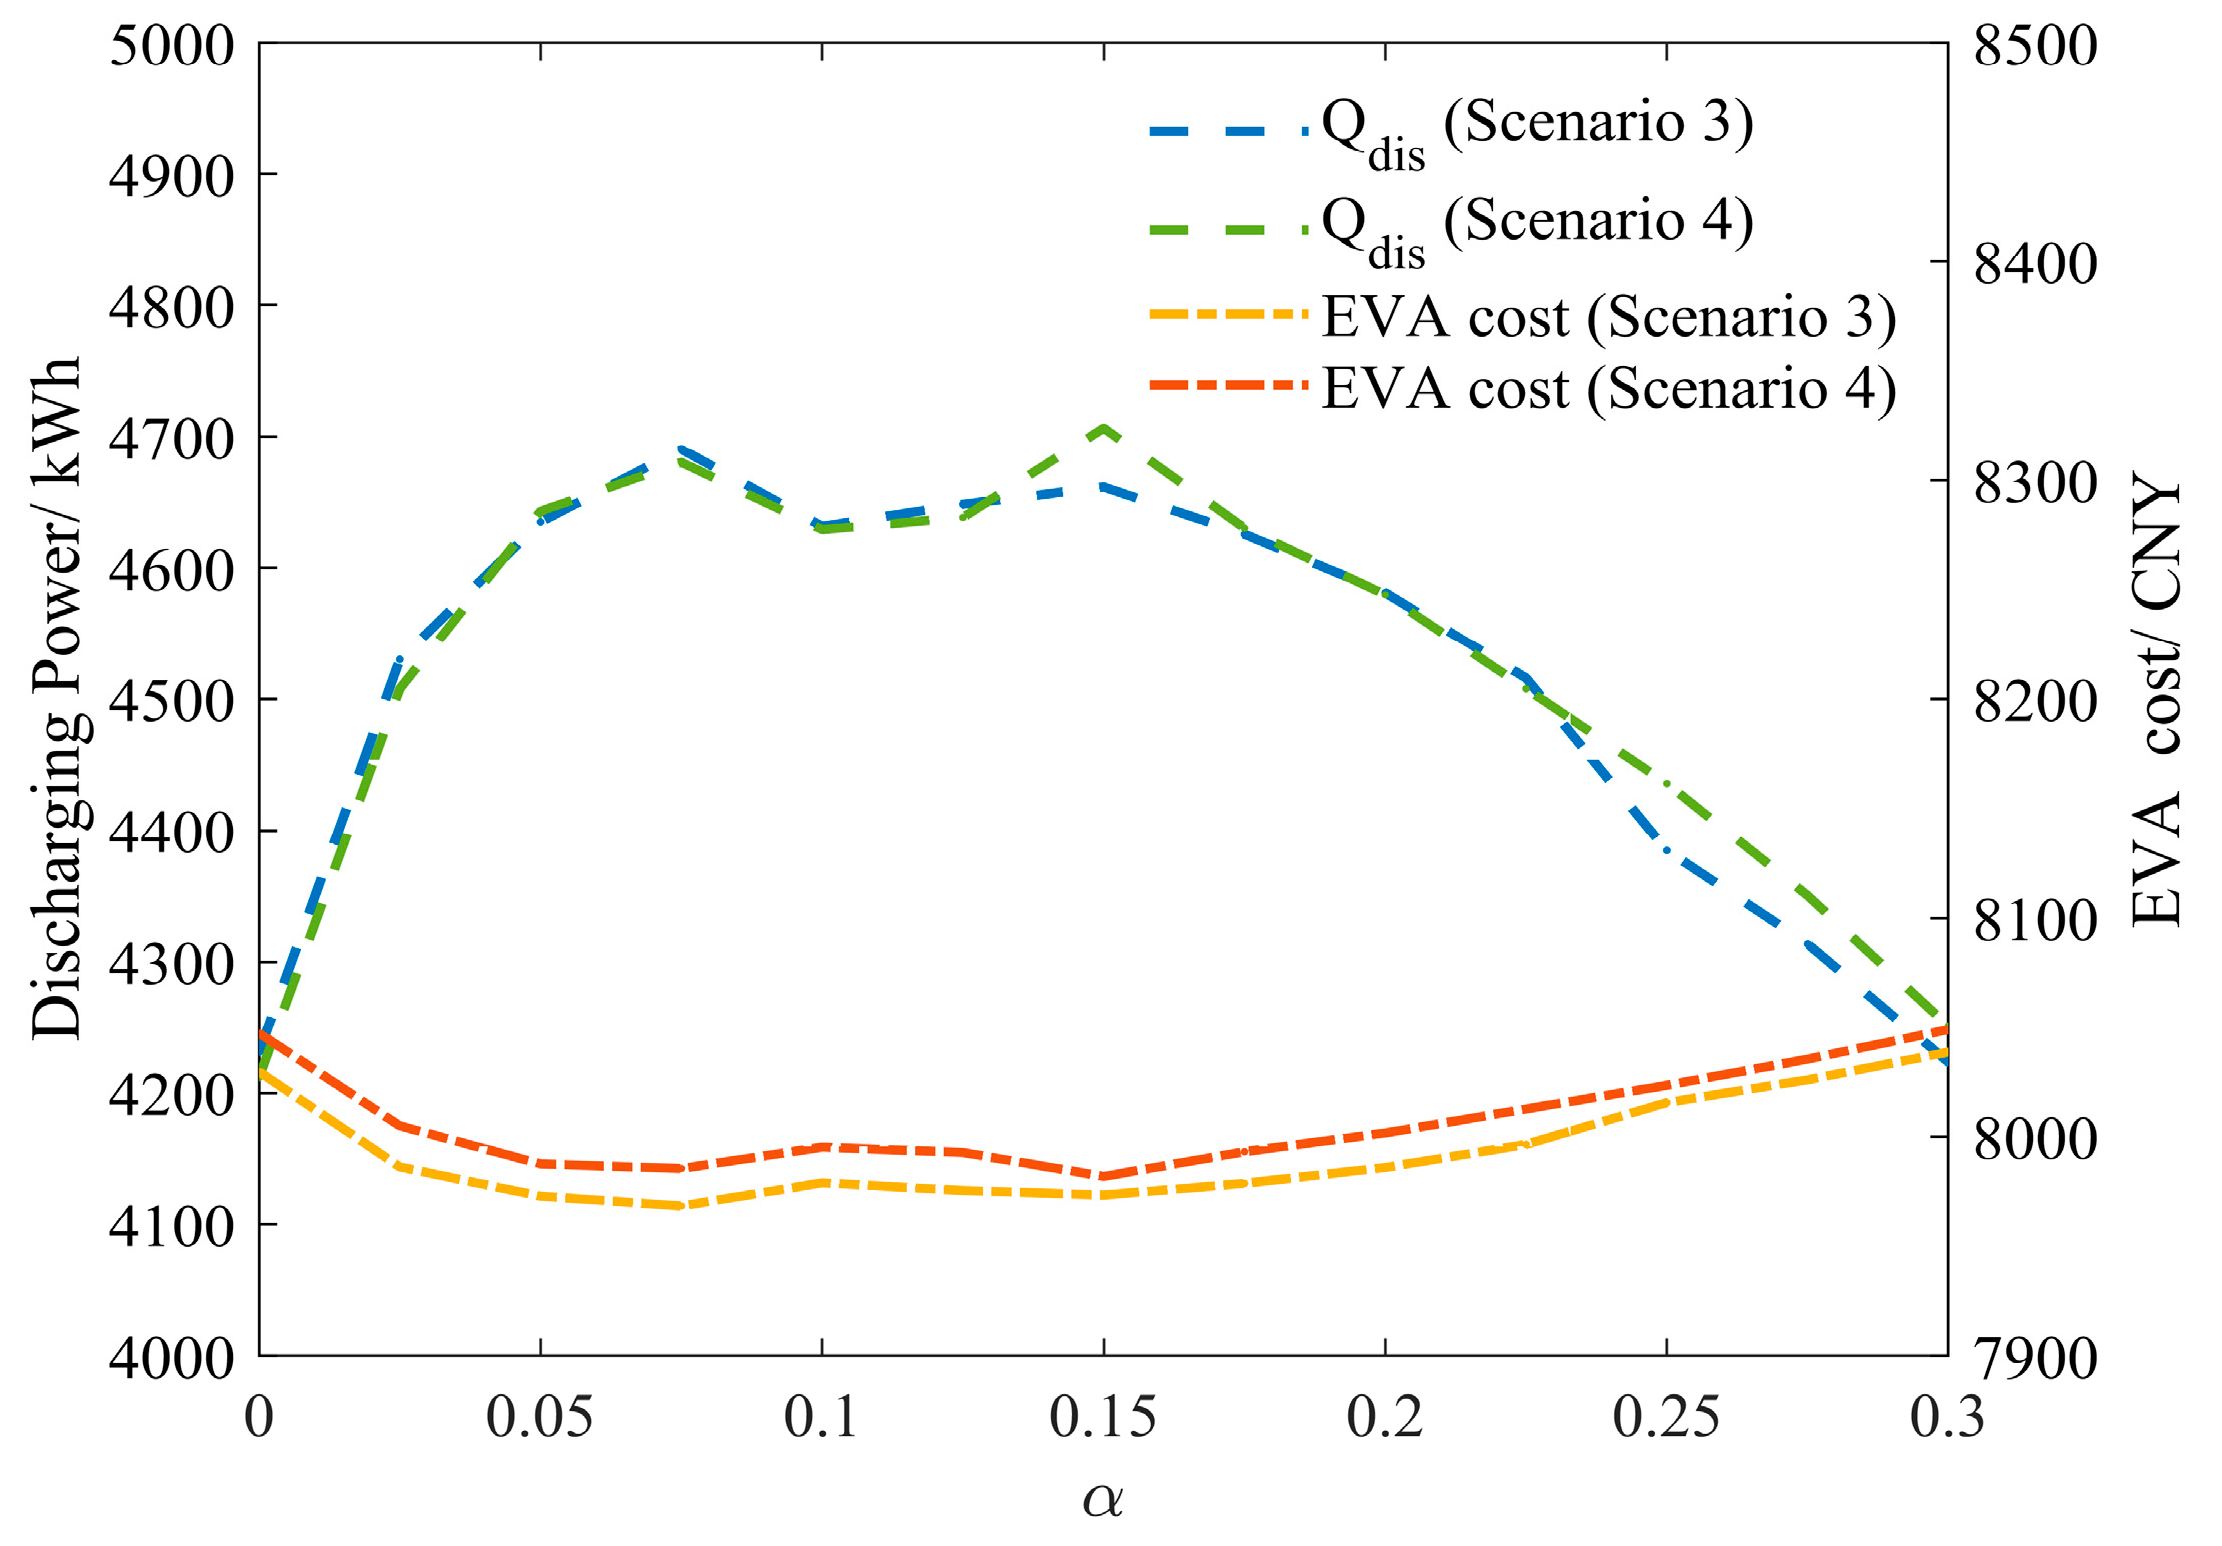
Figure 4, the reward rate
has a nonlinear influence on V2G transaction power and multi-agent benefits. Strategy 3 is used as the benchmark for comparison. When
increases from 0 to 0.07, the reward provided to CSO strengthens its incentive to organize EV users and improve participation in V2G services. As a result, the discharging power of both Strategy 3 and Strategy 4 increases rapidly from approximately 4200 kWh to a peak of nearly 4700 kWh, while EVA cost decreases to its minimum of about 8000 CNY. This indicates that setting the reward rate within the range of 0.07 to 0.15 can effectively encourage EV discharging behavior and improve user-side economic performance.
However, once exceeds the threshold of 0.15, the marginal effect of the reward gradually weakens. The discharging power begins to fluctuate and then decline, falling back toward 4250 kWh at 0.3. At this stage, most responsive EV capacity has already been activated; additional rewards primarily redistribute benefits among stakeholders rather than further increasing transaction power.
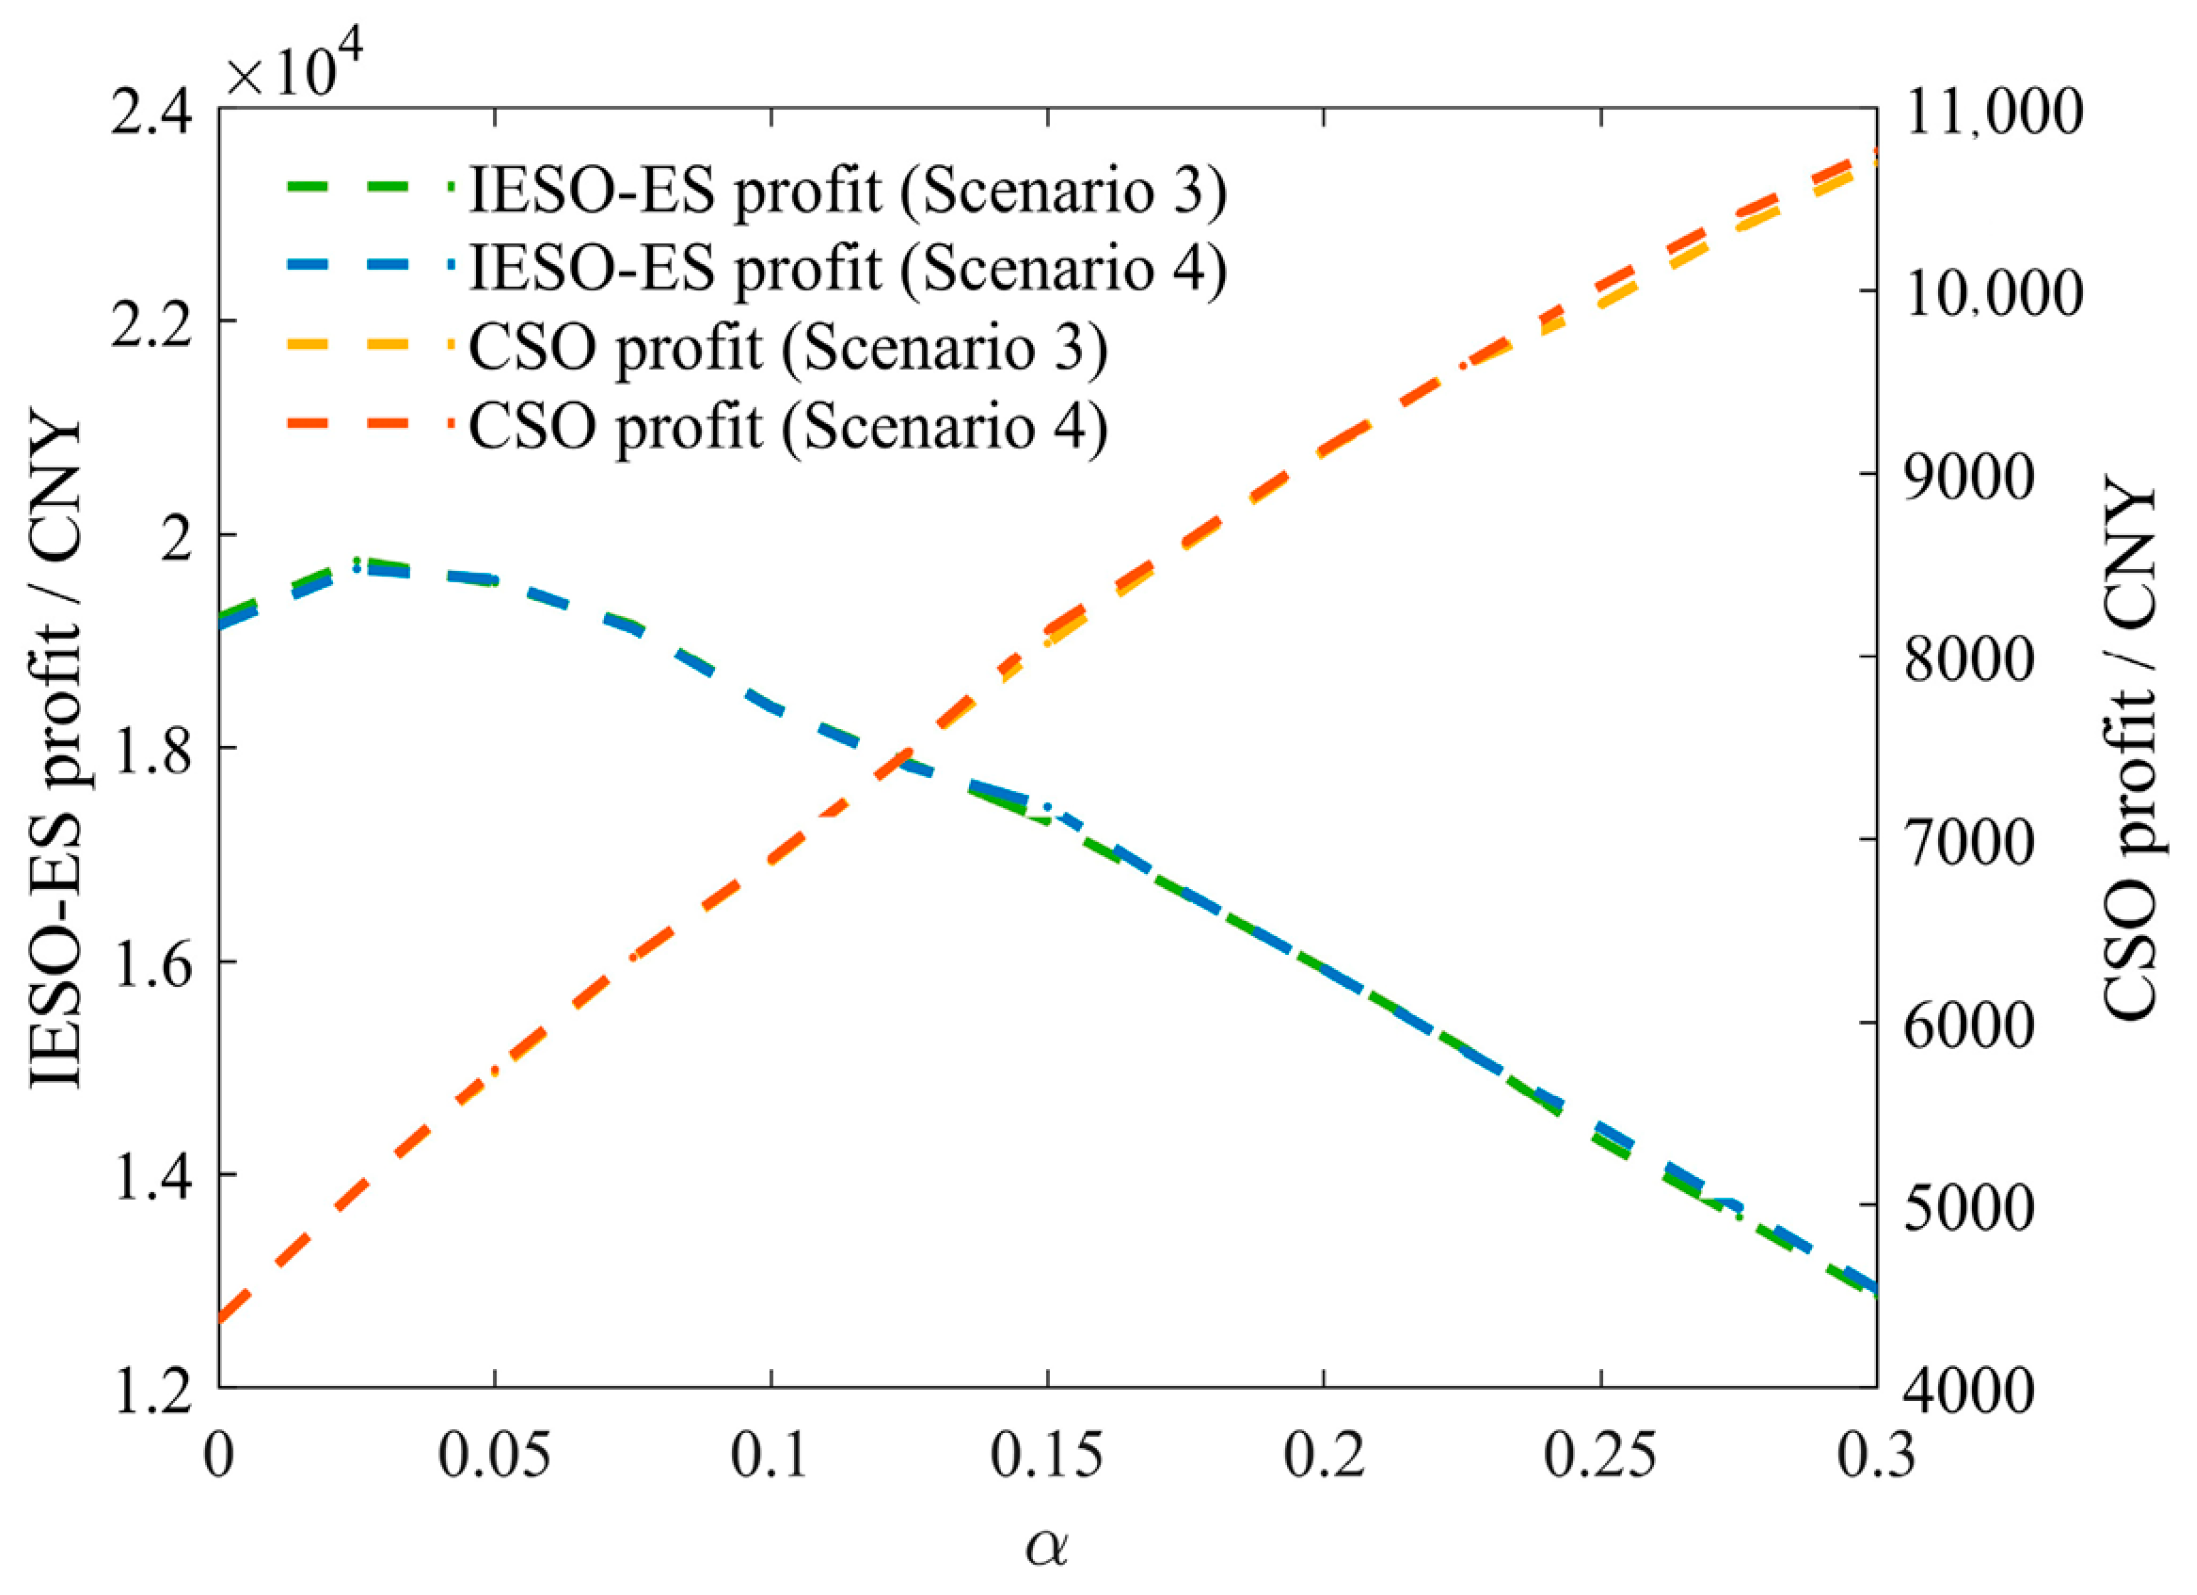
This pattern is also reflected in the profit curves. As shown in
Figure 5, IESO-ES profit first increases slightly, reaching its maximum of approximately 19,500 CNY, but then decreases monotonically to 13,000 CNY because of the increasingly larger reward payments to CSO. In contrast, CSO profit increases continuously from 5300 CNY to over 10,500 CNY with the growth of
, indicating that a higher reward rate transfers more benefits from IESO-ES to CSO. Therefore, the reward rate should be maintained within a reasonable range of 0.07 to 0.15. A calibrated
within this interval can promote V2G participation and improve coordination; whereas, an excessively high value of
greater than 0.15 may reduce IESO-ES profitability by up to 33.3% without producing additional discharge benefits.
4.5. Commission Rate Analysis
To examine the sensitivity of V2G market activity to lower-level pricing mechanisms, this section evaluates system performance under different commission rates.
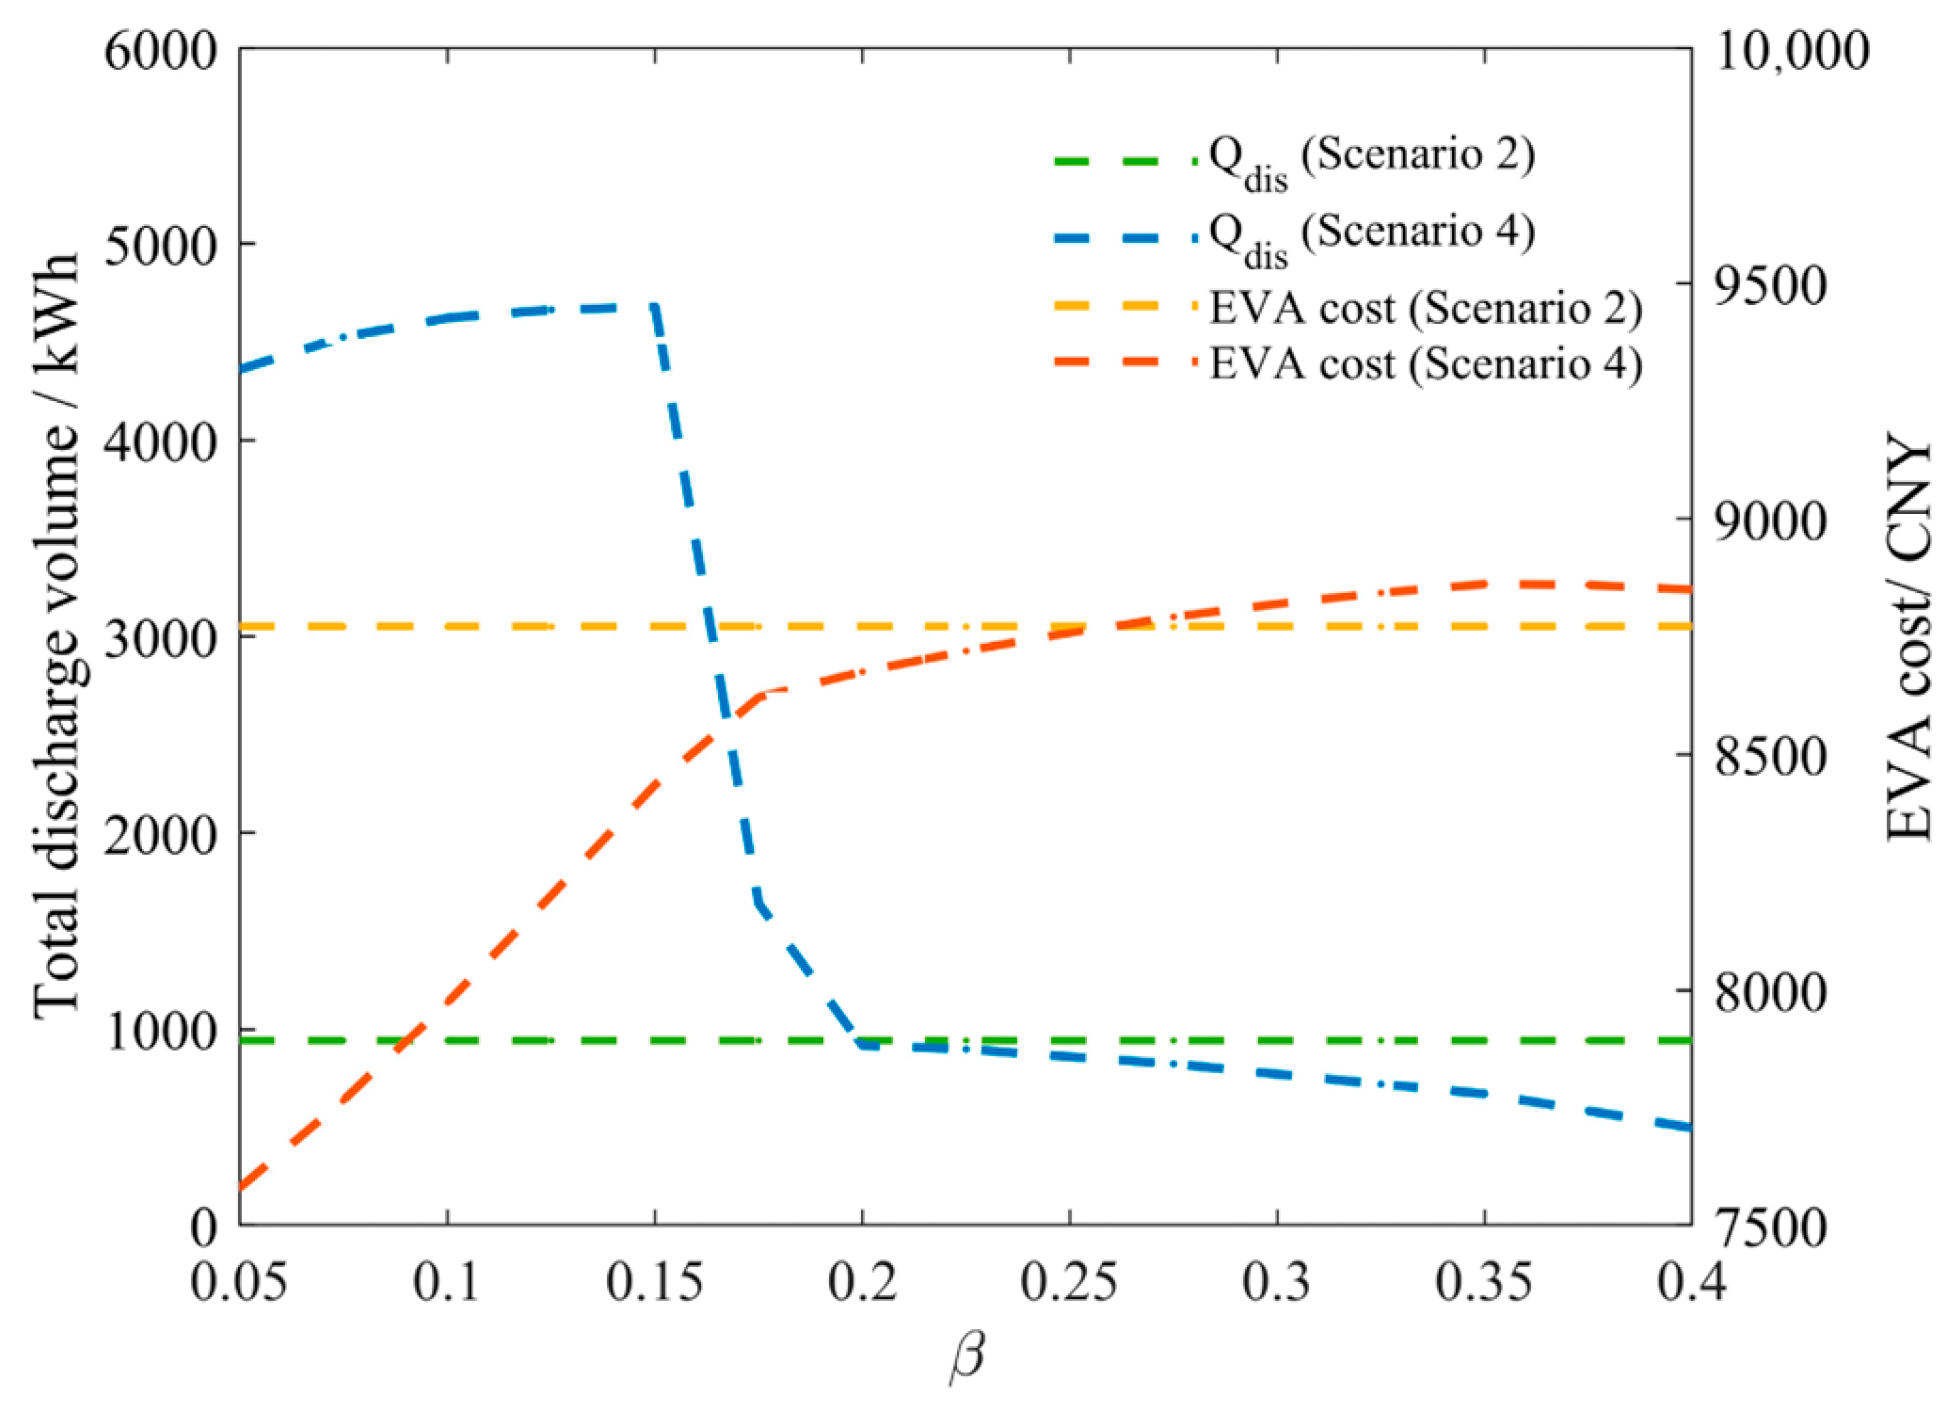
Figure 6 shows how the commission-based service fee affects V2G participation and benefit allocation. Strategy 2 is used as the benchmark for comparison. When
increases from 0.05 to 0.1, the commission mechanism strengthens the linkage between CSO profit and V2G transactions. In Strategy 4, the discharging power first increases slightly to 4600 kWh, indicating that a moderate commission rate can encourage CSO to promote EV participation more actively. At this stage, both IESO-ES profit and CSO profit also increase, because the growth in transaction power brings additional system benefits.
However, when β exceeds the threshold of approximately 0.15, the negative effect on the EVA becomes dominant. A higher commission rate reduces the effective discharging revenue received by the EVA, thereby weakening its willingness to participate in V2G transactions. As a result, the discharging power under Strategy 4 drops sharply from 4650 kWh to 1000 kWh after β reaches approximately 0.15. Meanwhile, EVA cost increases because the user-side economic benefit from discharging reduced.
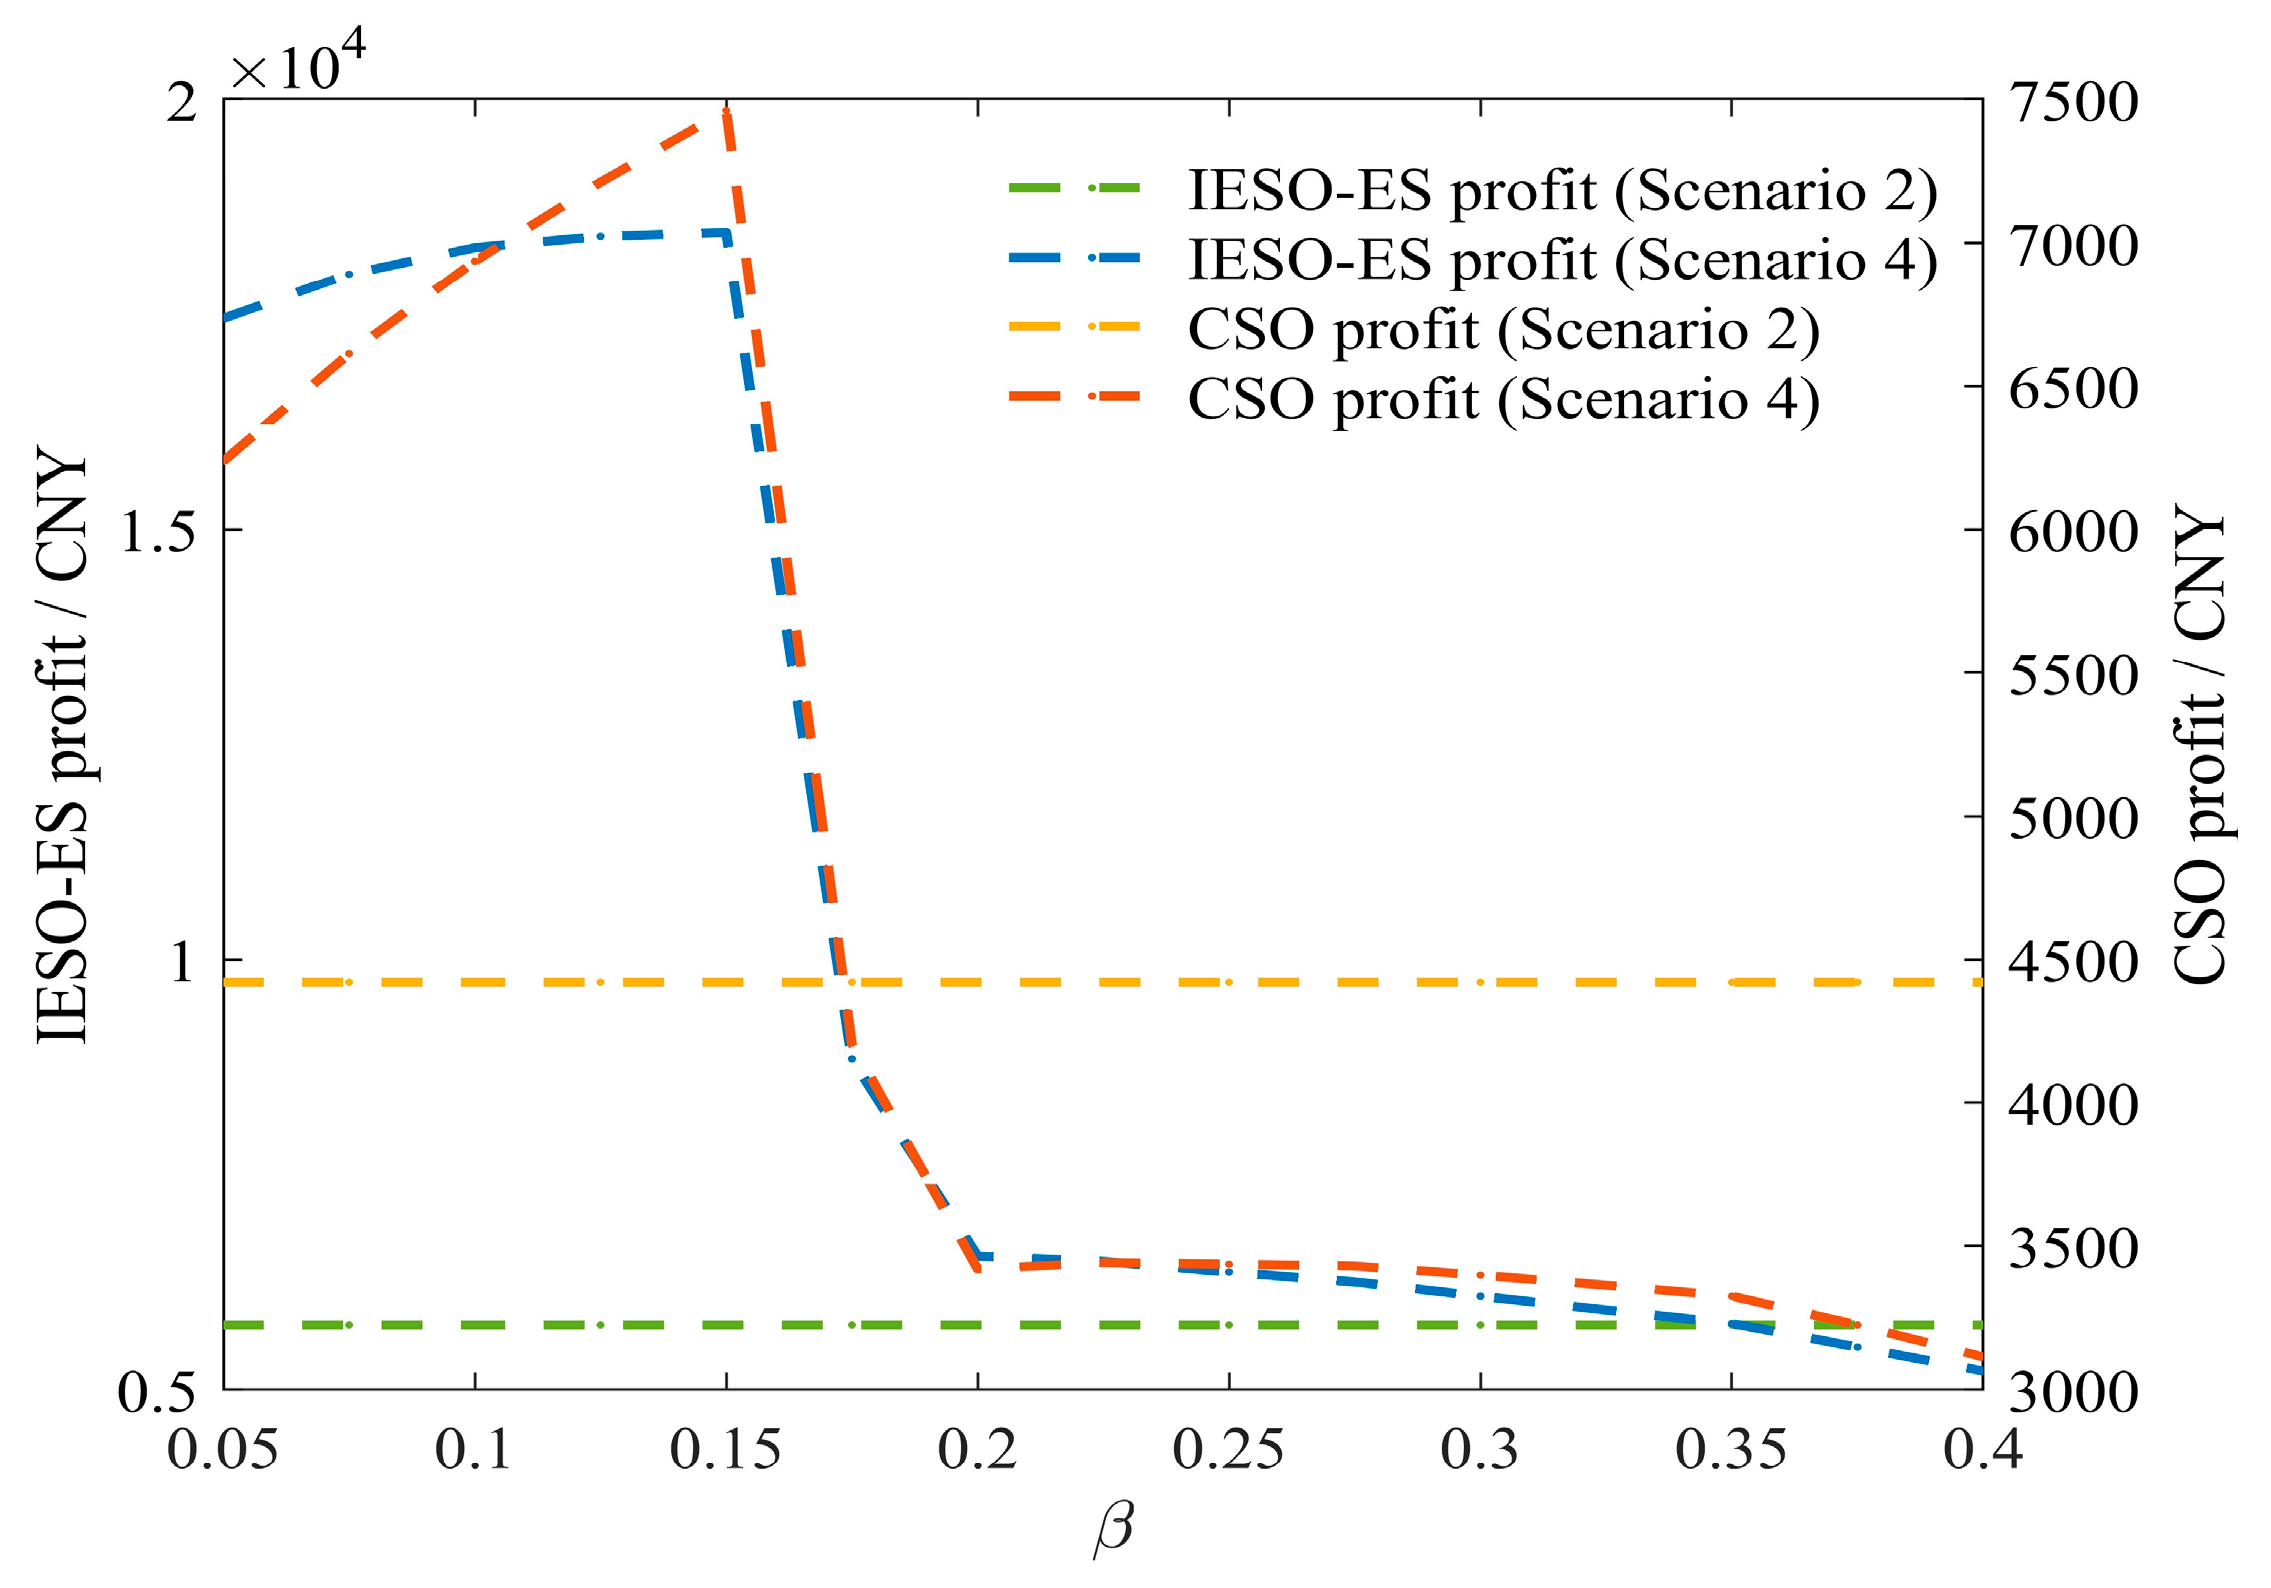
As shown in
Figure 7, IESO-ES profit declines significantly from its peak of 18,500 CNY to less than 6000 CNY because of the reduction in transaction volume. CSO profit also decreases from its maximum of approximately 7300 CNY to around 3300 CNY because the shrinking transaction scale offsets the benefit of a higher commission rate. In contrast, Strategy 2 remains almost unchanged at a constant discharging power of 939.33 kWh and fixed CSO profit of 4421.1 CNY because it selects a fixed service fee and is not directly affected by
β. Overall, the results indicate that the commission rate should be set within a moderate range. An appropriate
β can improve CSO incentives and market activity; whereas, an excessive value greater than 0.15 severely suppresses EV participation and reduces overall system efficiency.
4.6. Subsidy Analysis
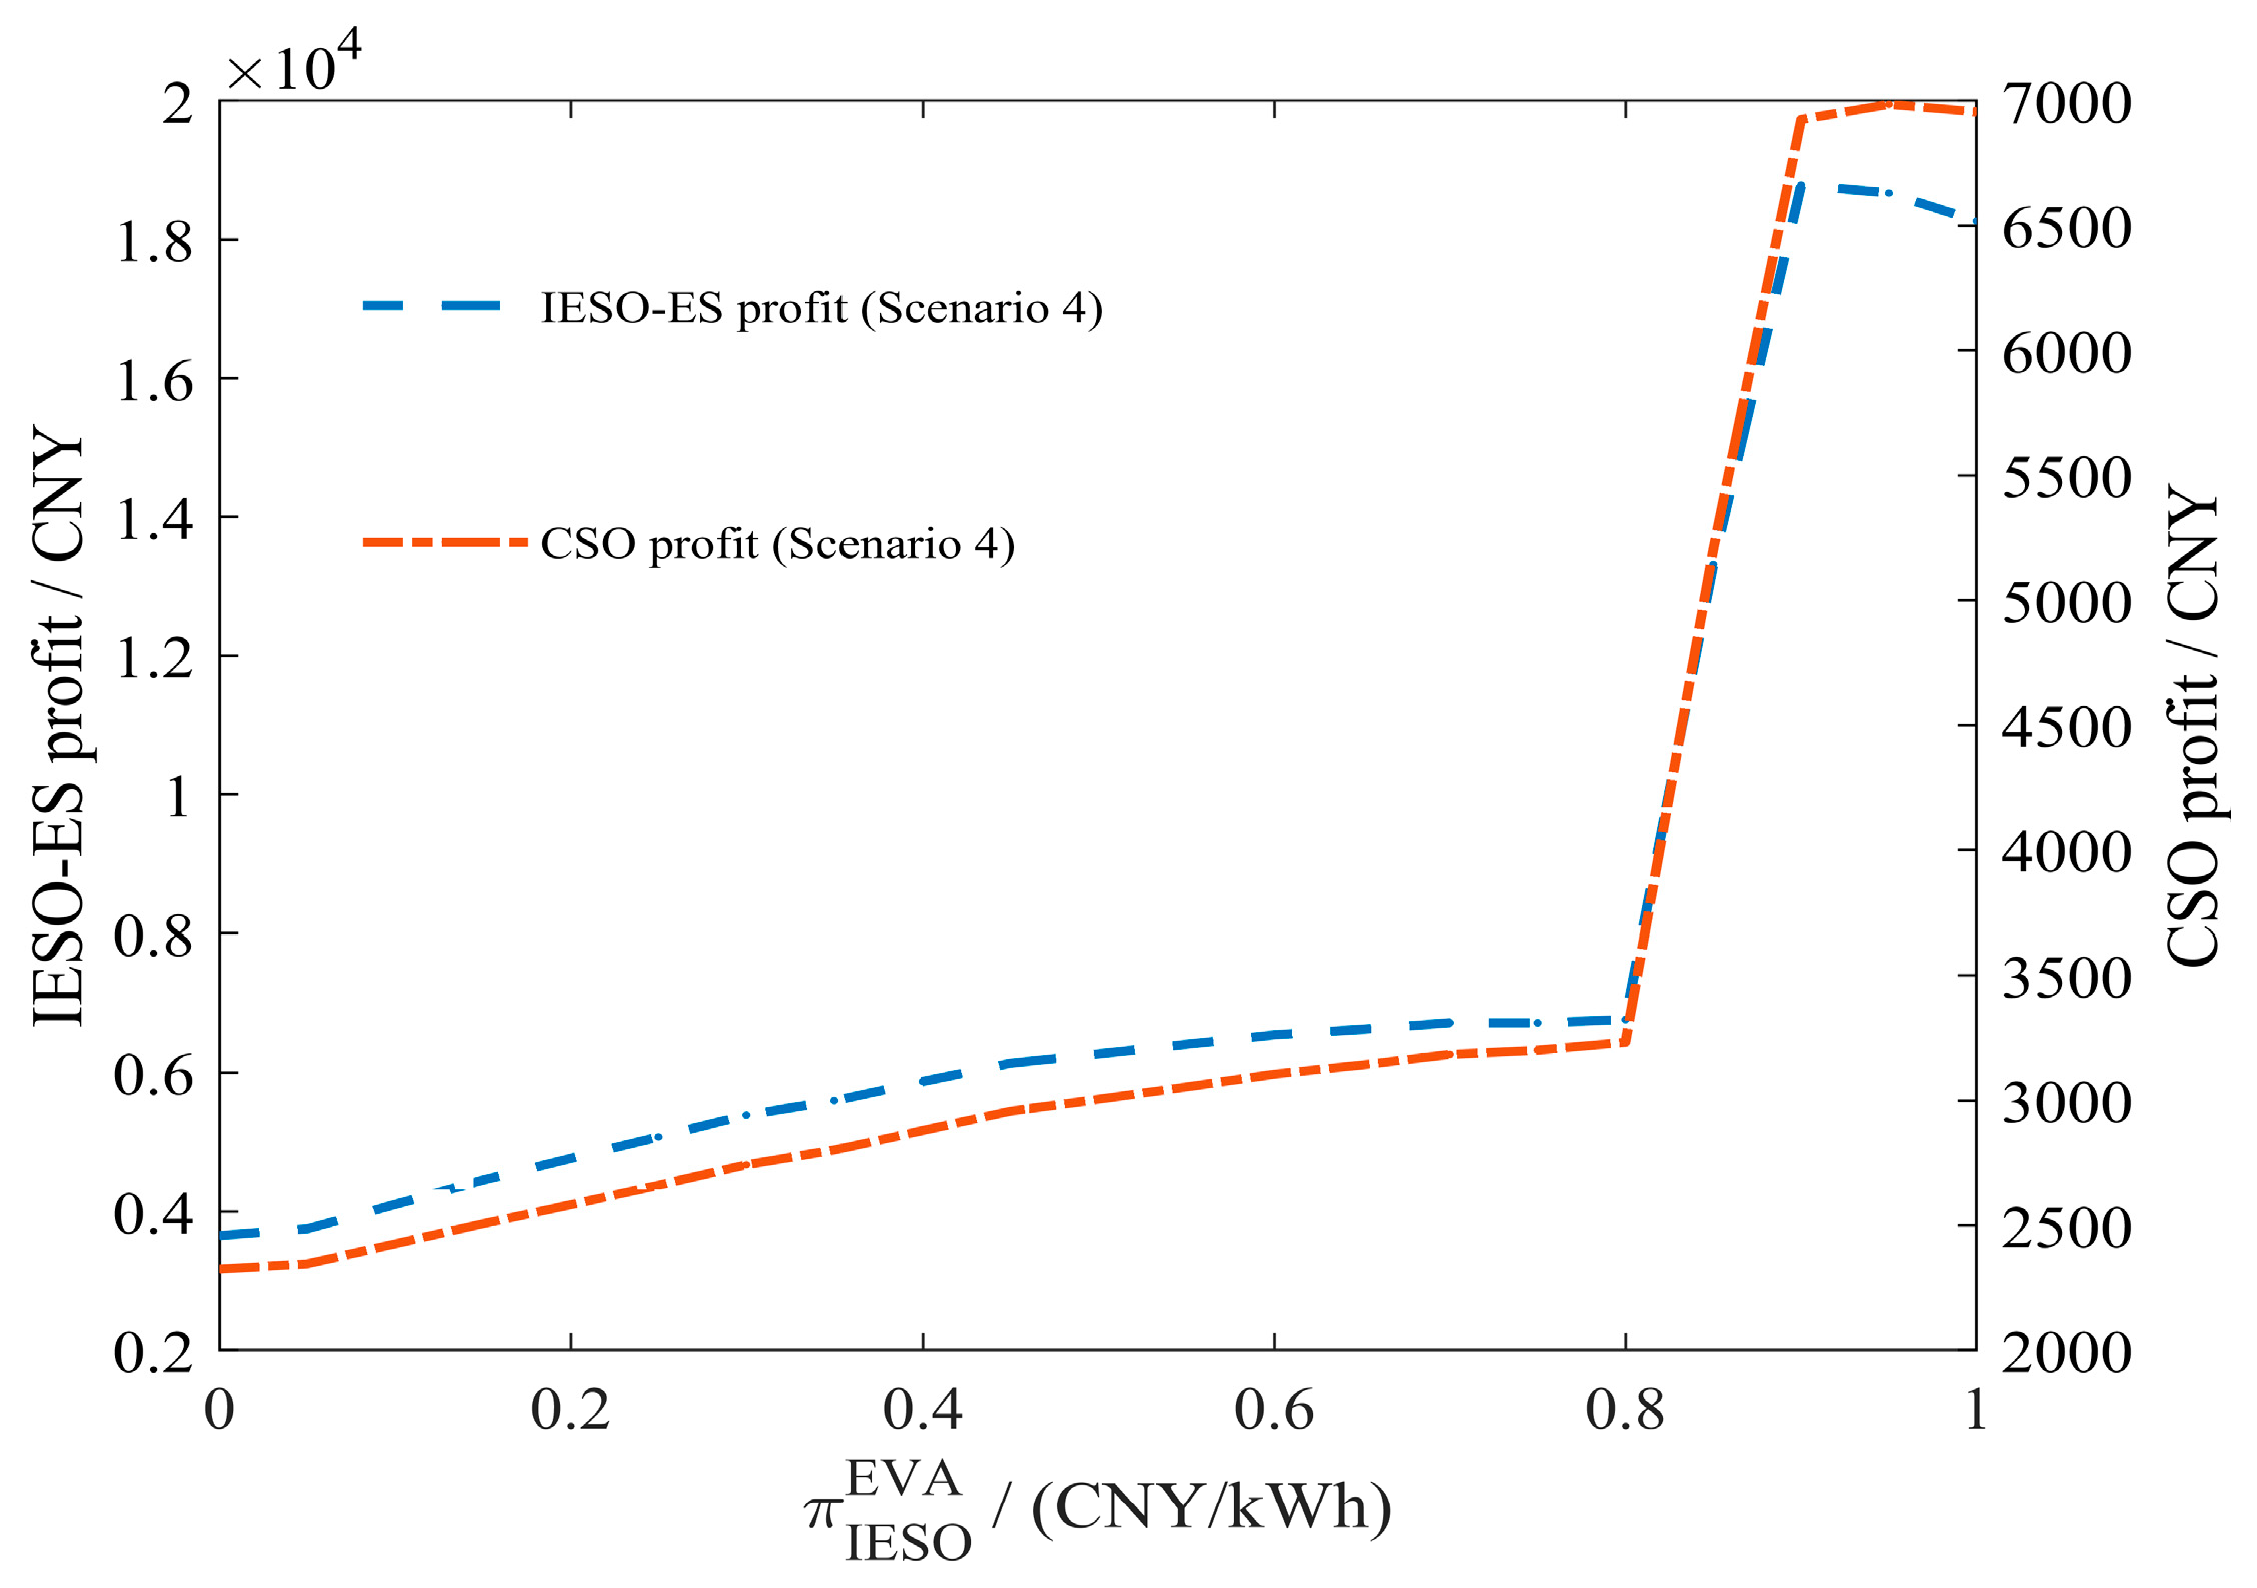
To examine the effect of the upper-level subsidy mechanism, this section evaluates system performance under different discharging subsidy levels. The results are shown in
Figure 8 and
Figure 9.
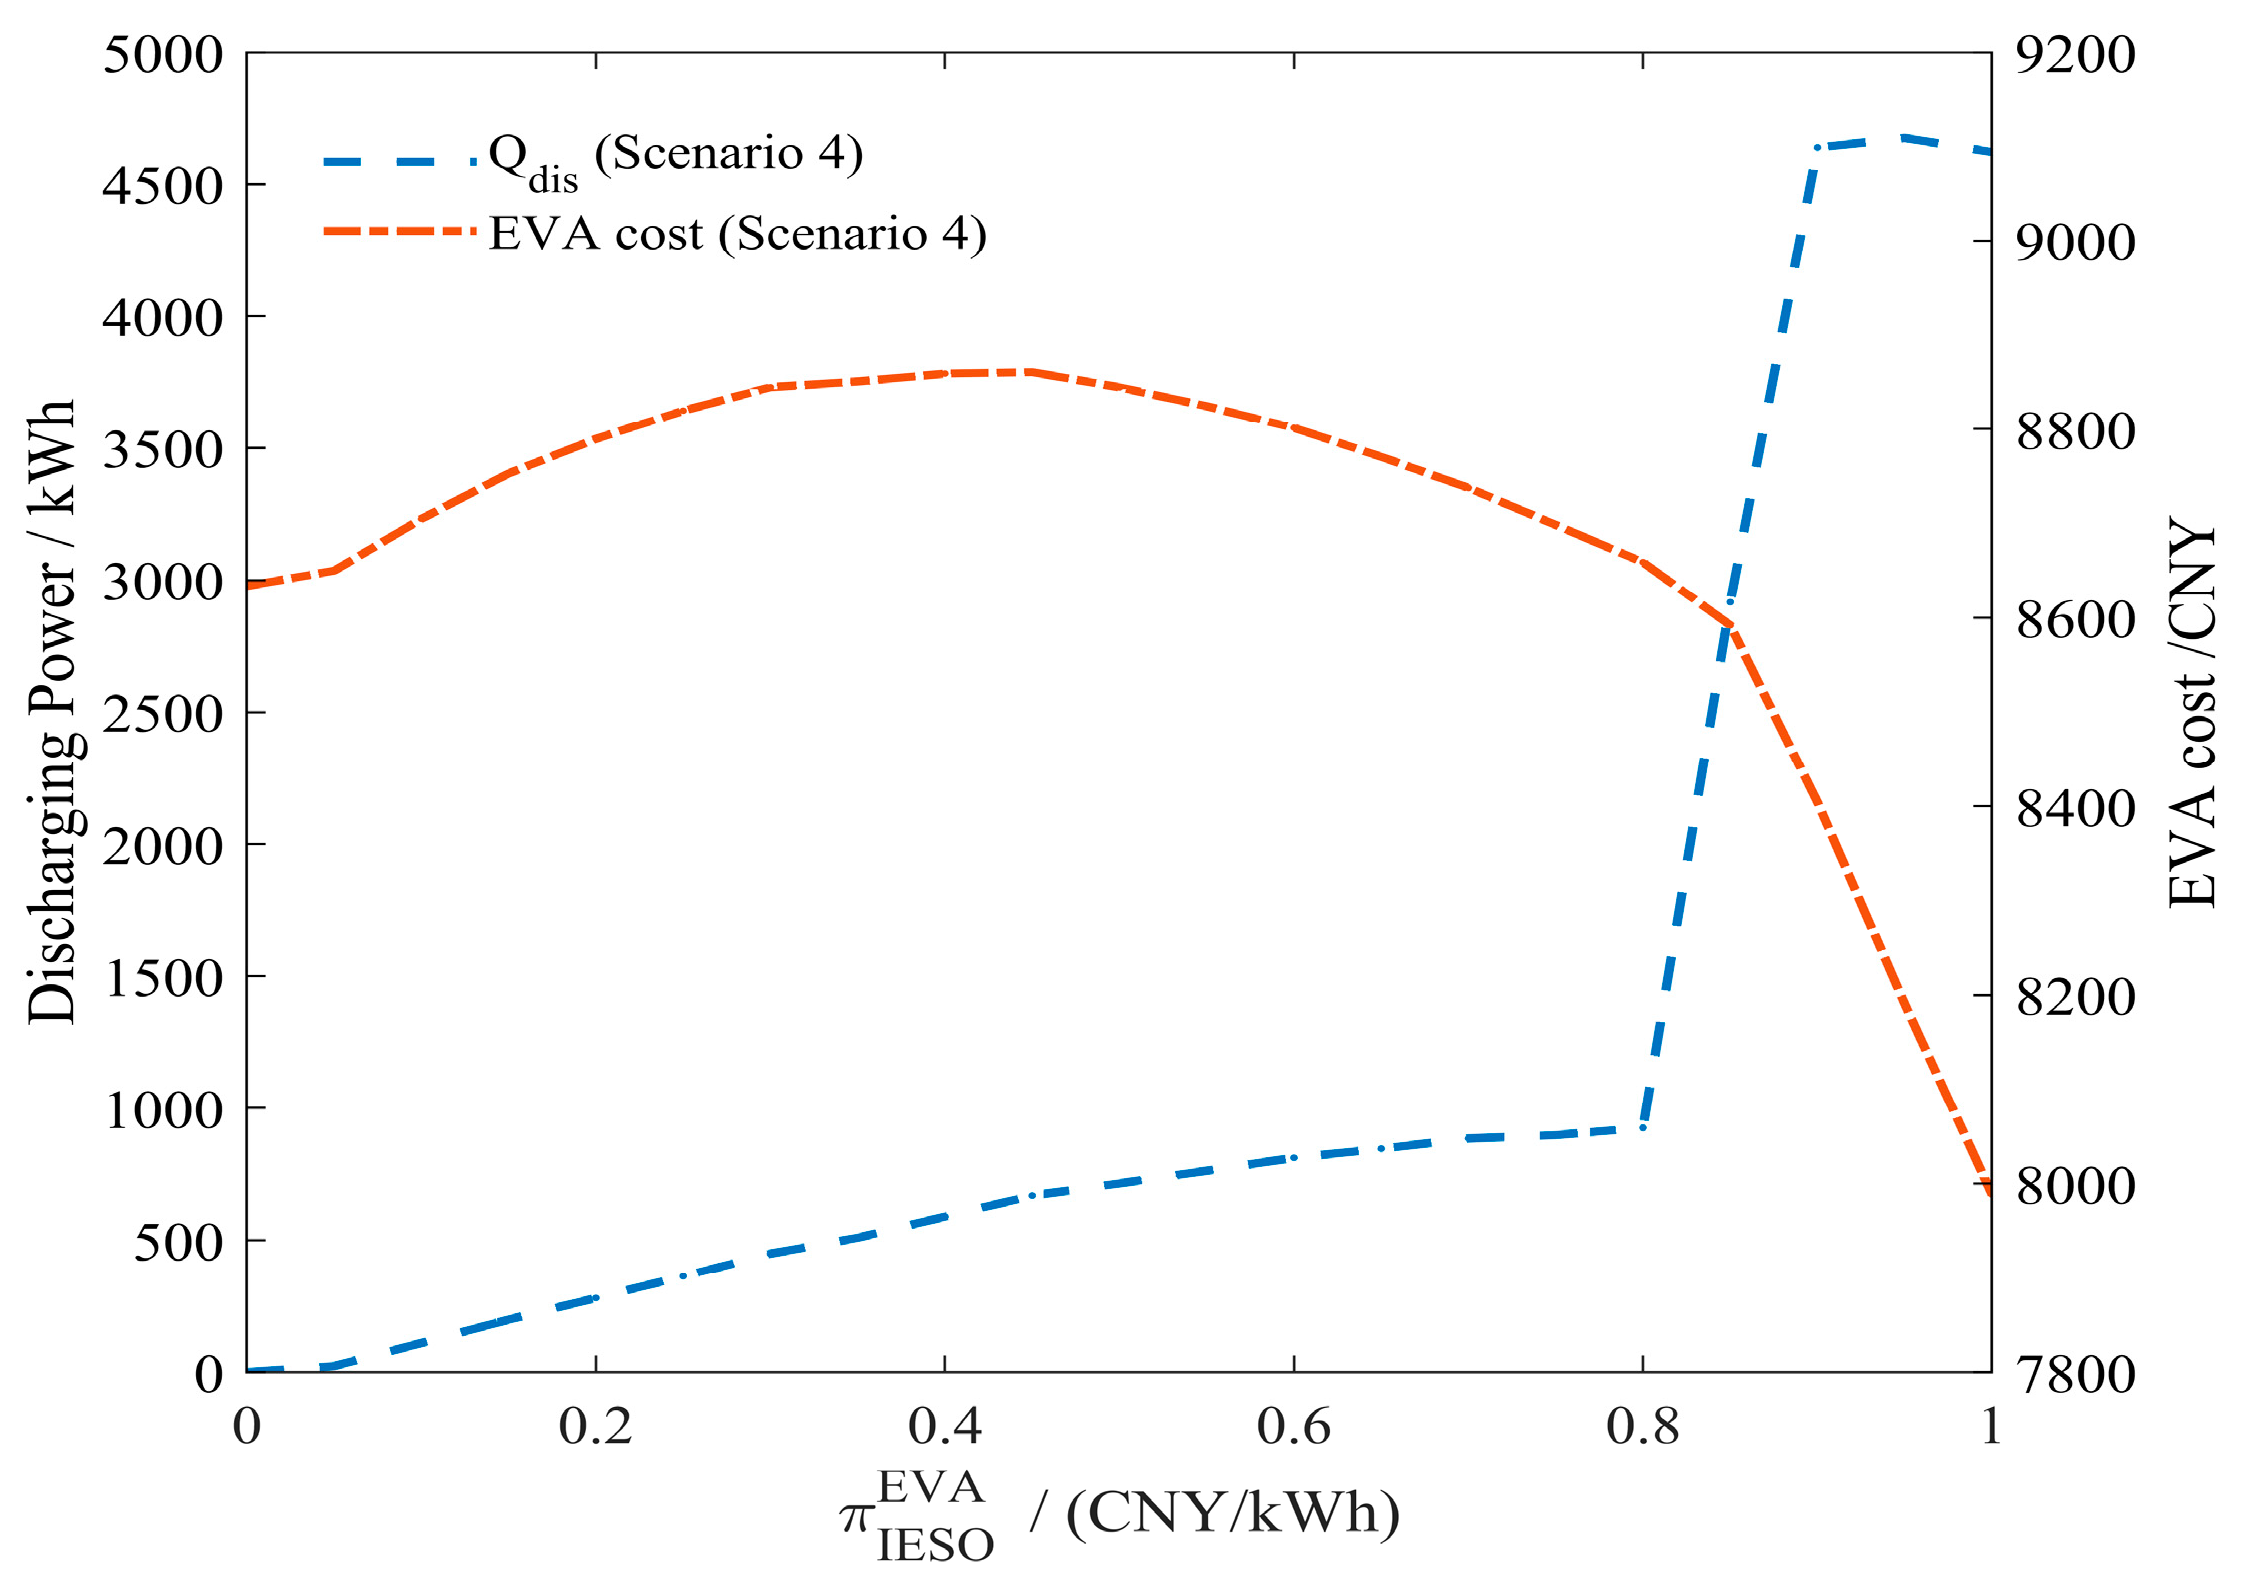
As shown in
Figure 8, when
is low, ranging from 0 to 0.4 CNY/kWh, the effective discharging income of EV users is insufficient to compensate for battery degradation and participation costs. Therefore, the discharging power under all strategies remains relatively limited, and the differences among strategies are not significant. When
exceeds 0.4 CNY/kWh, the economic attractiveness of discharging improves, leading to a gradual increase in V2G transaction power. This effect is particularly evident in Strategy 4, where the commission-based mechanism further links CSO profit with transaction power and strengthens the incentive to promote EV participation.
However, the response to the subsidy is nonlinear. When exceeds the threshold of approximately 0.8 CNY/kWh, the discharging power of Strategy 4 increases sharply from approximately 1000 kWh to a peak of nearly 4650 kWh, indicating that the subsidy activates a larger group of responsive EVs. At the same time, EVA cost generally decreases from 8600 CNY to its lowest point of about 7990 CNY at high subsidy levels near 1.0 CNY/kWh, because the additional discharging income offsets part of the charging and battery degradation costs. This confirms that the subsidy is the most direct policy instrument for improving EV users’ willingness to participate.
As
increases, IESO-ES profit rises significantly in
Figure 9. This is because the expansion of V2G transaction volume generates higher system-level benefits. Meanwhile, CSO profit also increases, especially in Strategy 4, reaching a maximum of approximately 6986.5 CNY because of the combined effect of reward and transaction-related service revenue. Overall, the results indicate that the subsidy level should be maintained within the range of 0.8 to 1.0 CNY/kWh to effectively stimulate V2G transactions, reduce EVA cost and improve the benefits of both the IESO-ES and the CSO. Among the four strategies, Strategy 4 shows the strongest response to subsidy changes, demonstrating its advantage in coordinating EV user incentives, CSO motivation, and system-level benefits.
5. Conclusions
To address the incentive coordination problem among multiple participants in V2G transactions within RIES, this paper develops a Stackelberg game-based optimization model that incorporates a commission-based service fee mechanism for the CSO. In the proposed framework, the IESO-ES acts as the upper-level leader by determining subsidy and reward strategies, while the CSO and EVA respond as lower-level followers by determining the service fee strategy and V2G transaction power, respectively. Based on the comparative analysis of different incentive and service fee strategies, the main conclusions are as follows.
(1) The commission-based service-fee mechanism strengthens the linkage between CSO profit and V2G transaction power. Compared with the fixed service fee mechanism, the commission-based mechanism encourages the CSO to participate more actively in organizing EV users and promoting discharging transactions. This mechanism enhances the intermediary role of the CSO and provides a more flexible way to redistribute transaction benefits among the IESO-ES, the CSO, and the EVA.
(2) The proposed Strategy 4, in which the IESO-ES provides subsidies to the EVA and rewards to the CSO while the CSO selects a commission-based service fee mechanism, achieves the best overall coordination performance among the compared strategies. Under this strategy, the V2G transaction power and CSO profit reach their highest levels, while the EVA cost is the lowest. Although the IESO-ES profit is slightly lower than that under Strategy 3, this reduction is mainly caused by the additional reward paid to the CSO. From a multi-agent coordination perspective, this benefit redistribution is acceptable because it improves CSO motivation, increases EV participation, and enhances the overall V2G market activity.
(3) The case studies show that the reward rate, commission rate, and subsidy level all have nonlinear effects on V2G transaction performance and benefit allocation. A moderate reward rate can enhance CSO participation and increase transaction power; whereas, an excessive reward rate may reduce the profitability of the IESO-ES without producing additional discharging benefits. Similarly, an appropriate commission rate can strengthen the incentive effect of the CSO, but an excessively high commission rate reduces the effective profit received by EV users and suppresses their willingness to participate. Therefore, the reward and commission parameters should be optimized within reasonable ranges. The subsidy acts as a direct activation mechanism for EV participation, and large-scale EV response can be stimulated only when the subsidy exceeds the minimum compensation threshold required to offset battery degradation and participation costs.
(4) The findings suggest that policymakers should consider incentive frameworks that simultaneously support EV users and Charging Station Operators, rather than focusing exclusively on EV-side subsidies. Such coordinated incentive mechanisms can improve the sustainability of V2G markets, strengthen private-sector participation, and support the sustainable operation of RIES.
Future research can extend the proposed model by incorporating more detailed EV heterogeneity, renewable-energy uncertainty, dynamic electricity-market conditions, and differentiated incentive policies. The robustness and reliability of the model can also be examined using alternative optimization methods, such as PSO, GA, and reinforcement learning-based approaches. In addition, incorporating multiple energy carriers and more practical operational constraints may further improve the applicability of the proposed mechanism in real-world Regional Integrated Energy Systems.