1. Introduction
The article examines the current state of traffic detection technologies, offering a detailed discussion of the use of UAVs and Big Data. The primary objective of the study is to assess the advantages and limitations of both approaches in the context of traffic flow monitoring and analysis. In this regard, the research aims to outline an operational strategy and a reference system structure capable of integrating multiple technological approaches for road infrastructure monitoring [
1,
2]. This study presents a comparative analysis of heterogeneous data sources in traffic monitoring, focusing on UAV-derived data and Big Data methodologies, which are generally treated as separate approaches in the literature, highlighting their complementary strengths and limitations under specific operational conditions. The collection of vehicle flow data is generally a fundamental component of urban planning, traffic management, and road safety improvement [
3].
The Federal Highway Administration (FHWA) [
4] identifies several traditional vehicle flow detection devices. The traditional devices consider pneumatic tubes, inductive loops, ultrasonic sensors, active infrared sensors, and cameras. Detection methods comprise manual techniques based on direct observation, the use of mobile devices, and continuous monitoring through permanent stations [
4].
Traditional survey methods include traffic counts, traveller surveys, and traffic behaviour surveys. Traffic counting refers to recording the number of vehicles passing a specific road section during a defined time interval. Traveller surveys collect data on users’ travel preferences and habits through mathematical models estimating mobility demand or through direct interviews with a sample of users [
5]. Traffic behaviour surveys aim to analyse driving patterns, typically conducted using cameras [
6]. Recent technological advancements, including UAV-based video acquisition, Big Data analytics, and AI-enhanced image processing, now enable the automated extraction of traffic counts. The present study focuses on three closely related research aspects: the complementarity between UAV-based observations and Big Data traffic-monitoring technologies, the extent to which such complementarity can help overcome the limitations associated with the individual use of each approach, and the reliability and practical applicability of the resulting traffic-flow estimates when validated against manual traffic counts in two real-world case studies.
2. Literature Review
Over the last two decades, rapid technological evolution has fundamentally reshaped the monitoring of vehicular traffic flows. Traditional data-collection methods, such as manual traffic counts, pneumatic tubes, inductive loops, and other fixed intrusive sensors, provided essential baseline information but were inherently limited in scope, accuracy, and operational flexibility. Manual counts were labour-intensive, prone to human error, and restricted to short observational intervals.
Similarly, inductive loops and pneumatic tubes, though widely deployed, often required disruptive installation procedures, incurred recurrent maintenance costs, and offered data constrained to single cross-sections of the roadway. These legacy technologies, while historically important, were unable to capture the dynamic and multidimensional nature of modern mobility systems. Contemporary digital technologies have significantly simplified and enhanced the monitoring of traffic flows, enabling more efficient, scalable, and accurate systems. Big Data analytics, in particular, constitutes a paradigm shift in mobility observation.
The increasing ubiquity of smartphones, connected vehicles, digital navigation platforms, and mobile-network infrastructures has led to the continuous generation of vast amounts of anonymised mobility data. These datasets allow analysts to infer traffic volumes, speeds, congestion levels, and origin-destination patterns with unprecedented temporal continuity and network-wide coverage. Unlike traditional point-based sensors, Big Data provides a systemic understanding of mobility behaviour, supporting predictive modelling and proactive traffic-management strategies. Furthermore, its passive and non-intrusive nature eliminates the operational disruptions typically associated with hardware-based monitoring devices.
In parallel, advancements in camera technologies and computer-vision techniques have introduced powerful tools for the real-time monitoring of road networks. Fixed roadside cameras equipped with automated detection algorithms can perform continuous vehicle counting, classification, trajectory extraction, and behavioural analysis. Compared with earlier visual-based methods, current camera systems offer higher accuracy, robust performance in complex environments, and the ability to scale across large urban networks. In this study, fixed roadside cameras were considered only as a reference technology within the literature review for comparative purposes; however, they were not implemented or tested as part of the experimental methodology.
2.1. Innovative Technological Approaches for Enhanced Traffic Monitoring and Road Infrastructure Management
The increasing complexity of road transportation systems and the growing variability of mobility patterns have accelerated the demand for more sophisticated, accurate, and adaptive methodologies for traffic monitoring and infrastructure management. Traditional data collection tools, such as inductive loops, pneumatic tubes, and fixed roadside sensors, have historically supported traffic flow measurement. However, their inherent constraints in terms of spatial uniformity, temporal continuity, and operational flexibility increasingly limit their suitability for modern mobility environments. As urban areas move toward smart city paradigms and transportation agencies embrace data-driven governance, the integration of multiple sensing technologies has become a strategic imperative.
UAVs provide high-resolution aerial perspectives capable of capturing detailed traffic interactions, origin-destination movements, conflict patterns, and fine-grained trajectory data. However, UAV operations remain subject to regulatory constraints, weather conditions, limited battery life, and the need for qualified personnel.
Fixed roadside camera systems complement UAV observations by offering continuous, long-term data collection and enabling automated traffic monitoring through computer-vision algorithms. These systems support classification, speed estimation, queue detection, and behaviour analysis. Their limitations relate mainly to occlusions, lighting variability, privacy constraints, and maintenance requirements. Conversely, Big Data sources, including anonymised mobile phone locations, GNSS traces, smart-card logs, and application-based mobility data, provide extensive spatiotemporal coverage, enabling macro-scale traffic behaviour assessments, long-term pattern detection, and population-level mobility analytics. Although these datasets support broad trend analysis, their aggregation and anonymisation may restrict the granularity required for micro-level traffic evaluations.
2.2. Benefits and Criticalities of Using Video Cameras for Vehicular Traffic Flow Monitoring
Video cameras represent one of the most widely adopted technologies for traffic monitoring due to their ability to capture rich, continuous, and high-resolution information about vehicular movements. In [
7], the authors present a survey on traffic congestion management techniques in intelligent transportation systems (ITS), covering estimation and control methods based on machine learning, optimisation, fuzzy logic, and hybrid approaches. However, despite their extensive capabilities, the use of video surveillance systems also presents significant technical, operational, regulatory, and environmental challenges.
In consideration of the data summarised in
Table 1, it is evident that video cameras provide high-resolution traffic monitoring capabilities [
6]. In addition, their coverage area is limited when compared to Big Data approaches [
8,
9].
2.3. Benefits and Limitations of UAVs for Vehicular Traffic Monitoring
The use of UAVs for monitoring vehicular traffic flows has gained increasing attention due to their flexibility, rapid deployment, and ability to acquire high-resolution spatiotemporal data over wide roadway segments. Their aerial vantage point allows for collecting detailed trajectory data that would be difficult or impossible to obtain using ground-based sensors. However, UAV-based monitoring presents several operational and regulatory challenges. Flight endurance is limited by battery capacity, reducing usable mission time and requiring multiple sorties for extended coverage. Weather conditions such as fog, wind, and rain can significantly affect data quality and operational safety. Moreover, UAV operations are subject to stringent airspace regulations, particularly in urban environments, which may restrict flight altitude, proximity to populated areas, and permissible mission frequencies. Data processing also requires advanced computer vision algorithms and robust communication links to ensure real-time transmission and synergy with other monitoring technologies.
As demonstrated in
Table 2, UAVs provide high-resolution traffic monitoring, accessing areas that are inaccessible to fixed sensors [
10,
11,
12]. However, their functionality is limited by regulatory requirements, operational complexities, and environmental factors [
13,
14,
15].
2.4. Benefits and Limitations of Big Data for Vehicular Traffic Monitoring
The complementary use of Big Data in vehicular-traffic monitoring represents a fundamental evolution in the way mobility systems are analysed, predicted, and managed. Unlike traditional sensor-based approaches or direct observational methods, Big Data analytics exploits large-scale, heterogeneous information sources, such as mobile-network cell data, GPS probe data, floating-car data, crowdsourced platforms, and connected-vehicle streams, to generate continuous, system-wide insights into traffic conditions. These data enable real-time estimation of traffic volumes, speeds, and congestion patterns, offering significantly broader spatial and temporal coverage than conventional monitoring technologies. However, as highlighted in the following table, the adoption of Big Data also raises several methodological and operational challenges.
As illustrated by
Table 3, Big Data sources offer extensive spatial and temporal coverage that extends well beyond the capacity of fixed sensors [
8,
9]. However, challenges such as data heterogeneity, dependency on third-party providers, and privacy regulations have been identified as significant obstacles to data harmonisation, availability, and analytical precision [
5,
16,
17].
2.5. Strengths and Limitations of Traffic Monitoring Technologies
As illustrated in
Table 4, fixed cameras provide continuous data and support automated analysis, but their effectiveness is affected by environmental conditions and maintenance needs [
6]. Unmanned aerial vehicles allow for high-resolution and adaptable traffic monitoring. However, their deployment is constrained by regulatory, environmental, and operational limitations [
11,
12,
15]. On the other hand, Big Data approaches provide large-scale, non-intrusive mobility monitoring with extensive spatiotemporal coverage; however, this is achieved at the cost of reduced spatial granularity and micro-level accuracy due to data aggregation and anonymisation [
5,
8,
9].
The manual counting activity for traffic detection presents several critical challenges, including the subjective interpretation of data by operators and the difficulty of systematically replicating measurements. In this context, sensors such as magnetic loops, piezoelectric cables and pneumatic tubes can be integrated into the road surface, while microwave and ultrasonic sensors, installed on the road, detect the presence of vehicles as they enter the detection area [
18].
2.6. Advantages of Traditional Detection Methods
Traditional methods, of which the collected traffic data constitute a statistically representative sample, are relatively simple to implement [
8]. According to the Traffic Monitoring Guide [
4], pneumatic tubes offer several advantages, including the ability to detect vehicle axle counts, low cost, and minimally invasive installation. Detection using inductive loops is notable for its insensitivity to weather conditions and its capability to provide key parameters such as volume, presence, occupancy, speed, headway, and gap when a pair of consecutive loops is installed. Moreover, this method ensures high accuracy in data collection. Ultrasonic and active infrared sensors also provide the advantage of operating across multiple lanes and offer the benefit of non-intrusive installation [
4].
2.7. Disadvantages of Traditional Detection Methods
The main disadvantages associated with conventional sensing methodologies include the high time and economic demands of data processing, significant investment costs, and limited spatial and temporal coverage. The investment costs of traditional systems are highly dependent on the area to be monitored due to the limited mobility of the sensors [
8,
19]. Furthermore, these devices present critical installation and maintenance challenges that could interfere with traffic flow, as well as a limited capacity to detect a wide range of parameters.
According to the Traffic Monitoring Guide [
4], the detection system through inductive loops has several limitations. These include the need to temporarily close lanes for installation and maintenance, reduced detection accuracy in the presence of diverse vehicle classes, and the inability to directly detect the number of vehicle axles. Similar limitations can be observed in the case of the pneumatic tubes, which also require lane closures for installation and maintenance, cannot measure overall vehicle length, and exhibit reduced efficiency under conditions of high, slow, or congested traffic. The functionality of ultrasonic and active infrared sensors can be impacted by meteorological conditions. In the case of sensors installed on the roadway, lane closures for maintenance purposes are necessary.
In the view of Khan et al. [
11], collecting traffic data using traditional technologies, such as manual counters, induction loops, and fixed cameras, is both costly and complex. This process requires the installation of numerous sensors or devices, or the involvement of a significant number of operators to ensure comprehensive coverage of the entire network. Moreover, such data are not sufficient to estimate densities or to analyse more complex traffic flow dynamics, such as queue accumulation and dissipation processes at intersections.
2.8. The Survey of Road Flows: Fixed Camera Survey Techniques
As observed by Harikrishnan et al. [
18], visual detection systems have achieved a notable level of popularity in recent years due to their advantageous characteristics, such as ease of installation, maintenance and management. These systems have found application in a variety of domains, including vehicle tracking, tracing, counting and classification. In these systems, the movement of vehicles is treated as foreground objects against a static background. Conventional methodologies for separating foreground and background include frame difference, background subtraction, and optical flow. Once the foreground is extracted, techniques such as contour detection or connected component analysis are applied to accurately determine the spatial boundaries of vehicles. The coordinates of these boundaries, extracted from frames, play a key role in precise vehicle tracking [
18].
In the field of vehicle detection methodologies, Perafan-Villota et al. [
6] used a convolutional neural network (CNN) to detect vehicles recorded by traffic cameras. Subsequently, vehicles were tracked using an algorithm developed by the same authors and based on Kalman filters.
2.9. Advantages of Fixed Camera Detection Methods
A video-based detection system enables a non-intrusive implementation, eliminating the necessity for direct operations on the roadway. This method facilitates the simultaneous monitoring of multiple lanes and provides comprehensive and detailed traffic data [
4]. In the domain of automated toll collection and traffic flow monitoring, the identification of vehicle licence plates using artificial intelligence-based techniques, such as deep learning, plays a crucial role [
20]. Furthermore, the ability to record traffic scenes enables images to be reviewed after the event, including subsequent analysis and further investigation when necessary.
2.10. Disadvantages of Fixed Camera Detection Methods
As the Traffic Monitoring Guide [
4] reports, the use of fixed cameras for traffic monitoring has certain limitations. The main disadvantages include the need for temporary lane closures during installation and maintenance, especially for cameras installed on the road, and exposure to adverse weather conditions which can influence system performance. In the context of a non-automated monitoring system, the deployment of a larger number of cameras necessitates more frequent human intervention, consequently impeding traffic authorities’ capacity to optimise the utilisation of the information collected by these cameras [
6]. Cameras, in contrast to other monitoring systems, are unable to directly provide the value of the traffic flow without the implementation of a suitable system for the processing of the collected data. Alternatively, the processing of data may require a high level of expertise and involve significant costs. Finally, this methodological approach does not allow the number of vehicle axles to be determined [
4].
3. Methodology
The technological developments of the last two decades, especially in communication networks and mobile device localisation, have enabled the development of transport management applications [
9]. In this context, Willumsen L. [
8] underlines that Big Data, derived from mobile phone data, public transport smart cards, mobile applications, navigation systems, Bluetooth and Wi-Fi technologies, is revolutionising the management and optimisation of transport systems. According to the author, the two main data sources for tracking door-to-door movements are those related to the data generated by the mobile network operator and those coming from the GNSS (Global Navigation Satellite System) microchip integrated in all smartphones, including GPS, which is the most widely used satellite navigation system. With regard to data sources from mobile applications, many smartphone apps use location data to improve the service itself [
8].
An example of the application of Big Data to estimate the average daily traffic volume on sections of the Maryland road network was used by Yang et al. [
9], obtaining a good correlation from the calibrations conducted on traffic volumes according to the type of road considered.
Big Data has the potential to significantly enhance soft mobility planning. In Seattle, Big Data has been used to calibrate estimation models for pedestrian and bicycle traffic volumes [
16]. These models incorporate pedestrian and cyclist flow data, GPS-based application information, and variables related to land use, road infrastructure, and socioeconomic factors. Additionally, data from the Strava Metro app (
https://metro.strava.com/) was integrated to support bicycle traffic estimation. This application anonymously collects and aggregates GPS data, providing valuable insights for mobility analysis. In addition, a comparison was conducted between a cycling model integrated with Strava data and other models based on alternative data sources. The results obtained from both models showed high similarity. However, the integration of Strava data enhanced the alignment between estimated and actual data, demonstrating a significant improvement in predicting the annual average daily number of cyclists. According to the authors, the integration of Big Data with traditional traffic sensing methodologies enabled the development of more accurate and robust prediction models [
16]. In a different study, Tan et al. [
21] utilised Big Data to predict customer affluence in future commercial activities, highlighting the scalability advantages of this approach compared to traditional field sensing methods. Specifically, pedestrian mobility data came from GPS-enabled devices, while road network information was derived from OpenStreetMap (OSM). The integration of these two datasets resulted in more accurate and reliable estimates of customer affluence, significantly improving predictions compared to conventional methods.
In the area of soft mobility and the relationship between vehicle traffic flow and air pollutants, Big Data was used in Dublin to identify the most environmentally sustainable itineraries for pedestrians and cyclists. Air quality data provided by Google Air Quality and data collected by an electric vehicle equipped with an air pollution detection platform were used. Sensors installed on the vehicle recorded pollution levels on roads at one-second intervals as the vehicle travelled at normal traffic speeds [
22]. In the context of optimising energy consumption, Ijemaru et al. [
23] applied Big Data to waste management by simulating a large-scale wireless sensor network typical of future smart cities. The adoption of a waste management model based on Big Data, integrated with vehicle mobility models, has the potential to reduce the traffic impact caused by waste collection vehicles, decreasing air pollution and optimising data collection and transmission processes compared to traditional battery-powered sensors. However, the implementation of these sensors is limited by their memory, processing, and storage capacities, which compromise the efficient management of significant data volumes associated with waste management in smart cities [
23].
In the context of implementing enhanced strategies for the charging of plug-in hybrid electric vehicles, Andrenacci et al. [
24] conducted a study aimed at ensuring the stability and efficiency of the urban electric grid. In this study, large datasets from a company specialising in the collection and processing of vehicle operation data were analysed. Each monitored vehicle was equipped with a GPS receiver, an accelerometer, and a GSM/GPRS transceiver for transmitting data to a control centre. The system recorded trip start and end times, as well as vehicle location data, with variable sampling frequencies: typically, every two kilometres on urban roads and every 30 s on highways.
Big Data has been used to monitor abnormal traffic conditions, such as the impact of adverse weather conditions on mobility. In the US, for example, Big Data was used to analyse the spatial and temporal impact of a winter storm on road conditions [
17]. A speed limit of 45 mph was used to assess this impact. According to the authors, vehicles travelling on interstate highways at speeds below this threshold were likely influenced by the adverse weather conditions caused by the storm. The use of Big Data enables scalable monitoring of traffic on road infrastructure of different importance, reducing the traditional dependence on sensors to detect traffic conditions [
17]. In the context of abnormal traffic conditions, [
25] developed an artificial neural network to predict travel times in work zones using Big Data for calibration. The model integrated different types of data, including environmental, meteorological, traffic and time data. It also used data from sensor vehicles, such as those collected by applications like Google and Waze, to estimate travel times during work based on historical data. The travel time estimates were generally found to be accurate in most cases, although some inaccuracies were found in areas with poor mobile network coverage or problems with the accuracy of the positioning system [
26].
In the context of processing data from mobile phones, mobile network operators and smartphone applications, according to Willumsen L. [
8], there are five key stages, each of which contributes significantly to the accuracy and reliability of the final result. Specifically, the first stage involves pre-processing and data cleaning, which is removing inconsistent or irrelevant information to provide the dataset for subsequent analysis. The next step is the selection of a representative sample, excluding phones that do not generate relevant or significant data for the study context. The third step is to detect motion sequences and user activities to reproduce individual behavioural patterns. Once this analysis is complete, the fourth stage consists of extending the sample to represent the entire population. During this phase, techniques are applied to correct any possible biases in the initial data. Finally, in the fifth stage, the data—now representative of the entire population—is post-processed to generate the required outputs, such as origin-destination matrices, with the necessary spatial and temporal resolution to meet the research objectives.
In the context of data processing, artificial intelligence techniques have been applied by various researchers. For example, as previously mentioned, Morshedzadeh et al. [
25] developed an artificial neural network to predict travel times in work zones. Furthermore, map-matching techniques and statistical inference can be implemented to determine both the mode of transport and the itinerary chosen by users [
8]. For the purposes of this research, traffic flow analysis was conducted using GPS probe data. These data are collected from GPS-enabled devices, including smartphones and in-vehicle navigation systems. The GPS probes considered in this study include all devices that traverse the study intersection.
GPS probe data are collected from heterogeneous sources at a high temporal sampling rate (one-second intervals). Their spatial representation is not directly point-based but is derived through map-matching and data-fusion procedures applied to the road network, resulting in traffic information aggregated at the road-segment level. Consequently, spatial granularity depends on probe density, data source, and processing steps rather than a fixed spatial resolution. In this case, both spatial and temporal resolutions vary due to the heterogeneity of data sources (smartphones and vehicles). The data are available in real time and are used to analyse the study intersection at 60 s intervals, providing estimates of delays, usual delays, queue lengths, travel times, usual travel times, free-flow travel time, estimated hourly volume, and sample size.
3.1. Advantages of the Big Data Approach
Tools that manage and process large volumes of data in real time provide a comprehensive and detailed view of traffic conditions throughout large areas, offering a level of detail and speed that surpasses traditional monitoring methods. Data derived from location-based systems such as Wi-Fi, Bluetooth, mobile phone towers and GPS probe data provide a higher level of detail due to their ability to provide frequent and continuous updates [
9]. One of the main advantages of Big Data is its ability to automatically analyse large datasets, facilitating the monitoring and analysis of road networks on a large scale, ensuring extensive and detailed spatial coverage. Furthermore, access to historical datasets enables a more advanced analysis of mobility both during the planning phase and during the execution of events [
17]. Data from mobile phones can be collected and validated in a relatively short time. Considering the increasing popularity of such devices and the fact that they are generally carried by users while on the move, the information derived from them represents a valuable resource for door-to-door movement analysis [
8].
3.2. Disadvantages of the Big Data Approach
Cellular data has certain limitations regarding spatio-temporal resolution, as its accuracy is influenced by the density of towers and user behaviour [
9]. In the case of the exclusive use of Big Data, it is not possible to determine the representativeness of the monitored sample in relation to the universe of users. Privacy management, in alignment with the processes of data cleansing and validation, constitutes a fundamental consideration [
5]. To ensure the integrity of personal data, a procedure of anonymisation is employed to mitigate any potential risk of re-identification [
8].
In recent years, an increase in the use of UAVs has also been observed in the civil field. This development has generated increasing interest from companies around the world in this technology. In traffic engineering, UAVs emerge as a promising tool for monitoring traffic flow.
UAVs are unmanned aircraft whose flight is managed by a remote pilot through a dedicated control system. The use of UAVs is well-established in both military and a variety of civil applications due to their versatility and efficiency. A crucial component for the operation of these systems is the battery, generally of the LiPo (lithium polymer) type, which offers a high ratio of power output to weight, thus ensuring efficient powering of UAVs. Among the onboard sensors, the GPS receiver is fundamental for the continuous monitoring of the UAV’s position, being particularly useful when the radio link with the control station is temporarily interrupted due to environmental factors or distance.
Under the European Union Aviation Safety Agency regulatory framework, UAVs are divided into five classes (C0–C4) according to their maximum take-off mass, ranging from less than 250 g to 25 kg [
13].
Regulation (EU) 2019/947 further categorises UAV operations into three operational classes—open, specific, and certified—based on the level of operational risk and the corresponding safety requirements [
14].
UAVs are widely discussed in scientific literature. Kampf et al. [
12] suggest that UAVs can be used for traffic flow monitoring through video recording. However, the use of UAVs necessitates that the remote pilot be in possession of the required permissions for research purposes. In cases where operations occur in areas with restrictions or prohibitions on UAV usage, it is obligatory to obtain authorisation from the National Civil Aviation Authority. In addition, adherence to UAV flight regulations is essential, including maintaining a safe distance from buildings, roads, and areas with high human traffic. When monitoring is conducted in proximity to infrastructure such as highways or railways, it is necessary to establish a designated safe area for UAV take-off and landing [
12].
Bachechi et al. [
5] proposed the installation of a network of traditional sensors for urban traffic monitoring, providing data on traffic flows and average speeds. However, traditional technologies, such as inductive loops, have limitations related to their installation in fixed and specific locations. In contrast, a system based on UAVs and cameras offers greater flexibility in detection, overcoming the spatial limitations of traditional solutions [
5].
In order to achieve continuous sensing with UAVs, Kampf et al. [
12] developed an experimental system using a UAV designed to record 3 h-long videos from a height of 20 m. This configuration involved a UAV, a camera stabilisation system, a ground power unit equipped with a voltage converter, a mechanism for managing the connection cable, and other accessories. The implemented solution necessitated a constant connection between the UAV and the ground station via cable, which poses a significant challenge when considering the implementation on an industrial scale due to the physical presence of the cable.
As asserted by Khan et al. [
11], one of the foremost challenges associated with UAVs regards the longevity of their batteries. The authors employed a UAV to analyse traffic flows over the duration of a 15 min video, excluding the time required for take-off and landing manoeuvres. It was observed that under conditions of increasing wind intensity, necessary to ensure the stability of the aircraft, and varying propeller sizes, a possible impact on battery consumption was observed. Given the continuous and growing technological development of UAV batteries and propulsion systems, it is widely anticipated that detection durations of more than 15 min will become a reality soon. Consequently, there is a strong probability of a significant expansion in the use of UAVs for traffic monitoring operations. As flight altitude increases, it becomes essential to use high-resolution data to obtain useful information for analysing vehicle trajectories, lane-change manoeuvres and vehicle interactions [
10]. The shapes and orientations of filmed objects vary significantly at different altitudes and camera angles, necessitating specific techniques for their management [
15]. The camera installed on the UAV is subject to involuntary rotations and movements during recording [
27]. To ensure the stability of the images during filming, specific devices have been developed that can maintain the high stability and quality of the captured images.
According to Li et al. [
26], the performance of vehicle detection and counting systems at night is inferior to those recorded under daytime conditions, mainly due to variations in lighting conditions.
One potential application of UAVs involves the monitoring of vehicular traffic through the acquisition and analysis of video records obtained from an on-board camera. This technique facilitates the acquisition of detailed information on traffic flows and the behaviour of road users, offering a strategic and non-invasive vantage point. The following steps delineate the process of AI-based traffic monitoring using UAVs: image/video acquisition, data processing, processing using AI/DL techniques, and output to specified users or management centres [
28].
In this work, commercial software was used for video processing. The utilisation of video-processing software enabled the classification of the vehicles.
3.3. Advantages of the UAV Video Approach
Compared to traditional ground-based methods, the UAV detection methodology has significant advantages, including a reduction in video systems, radar and ultrasonic sensors [
29]. In addition, recording from a UAV in flight over a specific road area allows objective data to be obtained without influencing driver behaviour. Other significant advantages include high flexibility of use, excellent manoeuvrability, high operational efficiency and superior spatial resolution [
30], the number of personnel required, wider territorial coverage and the absence of interference with the flow of traffic. Its mobility and significantly lower operating costs compared to manned systems make it a more cost-effective solution than traditional technologies such as inductive loop detectors.
3.4. Disadvantages of the UAV Video Approach
In the context of operational limitations, as highlighted by Zhu et al. [
10], video recording by a UAV at low altitude over urban areas poses significant privacy issues. Operational conditions for detection are strongly related to atmospheric conditions [
12]. Limited capacity and restrictions imposed by flight operations regulations may be further limitations of this methodology. The presence of intensive traffic may complicate vehicle tracking, increasing the probability of errors [
31]. Battery life could also be a limiting factor [
11].
Table 5 summarises the main characteristics of the tracking methodologies discussed in this scientific research.
The qualitative performance indicators (High, Low, Variable) are based on a synthesis of the literature cited in the “References” column.
Specifically,
Table 5 shows that the accuracy of Big Data is strongly related to the representativeness of the analysed sample (1). The temporal resolution is very low in manual counting methods, while it is medium-low when using automated sensors (2). In the case of UAVs, temporal resolution is high because the data is acquired at a high frequency (3); however, due to their high flexibility, they enable monitoring of areas with varying extensions (4). Real-time data acquisition capability is very low in manual counting methods, whereas it is medium-low when employing automated sensors (5). Additionally, traffic flow analysis through cameras or UAVs requires a data processing phase, which results in limited real-time operational capacity for these techniques (6).
The case studies analysed highlighted that the accuracy of data obtained through UAV video-processing software is dependent on the camera angle and, consequently, on the UAV’s position. The positioning of a UAV in a direction that is not aligned with the vertical axis passing through the centre of the road intersection introduces perspective distortion, which has the potential to significantly impact data accuracy. Conversely, data accuracy is maximised when the UAV is optimally positioned (7).
From an analysis of the scientific literature, it is observed that traffic flow surveys have been conducted both with Big Data and with UAV video. Despite this, no study has been found that compared the outputs of the two methods. In this work, the results of both methods have been compared, identifying some limitations of these methodologies. Furthermore, a comparative analysis was conducted between traffic flow estimates obtained from Big Data sources, those generated by UAV video-processing software, and those derived from manual counting of UAV video footage.
Table 6 provides a summary of research works by various authors.
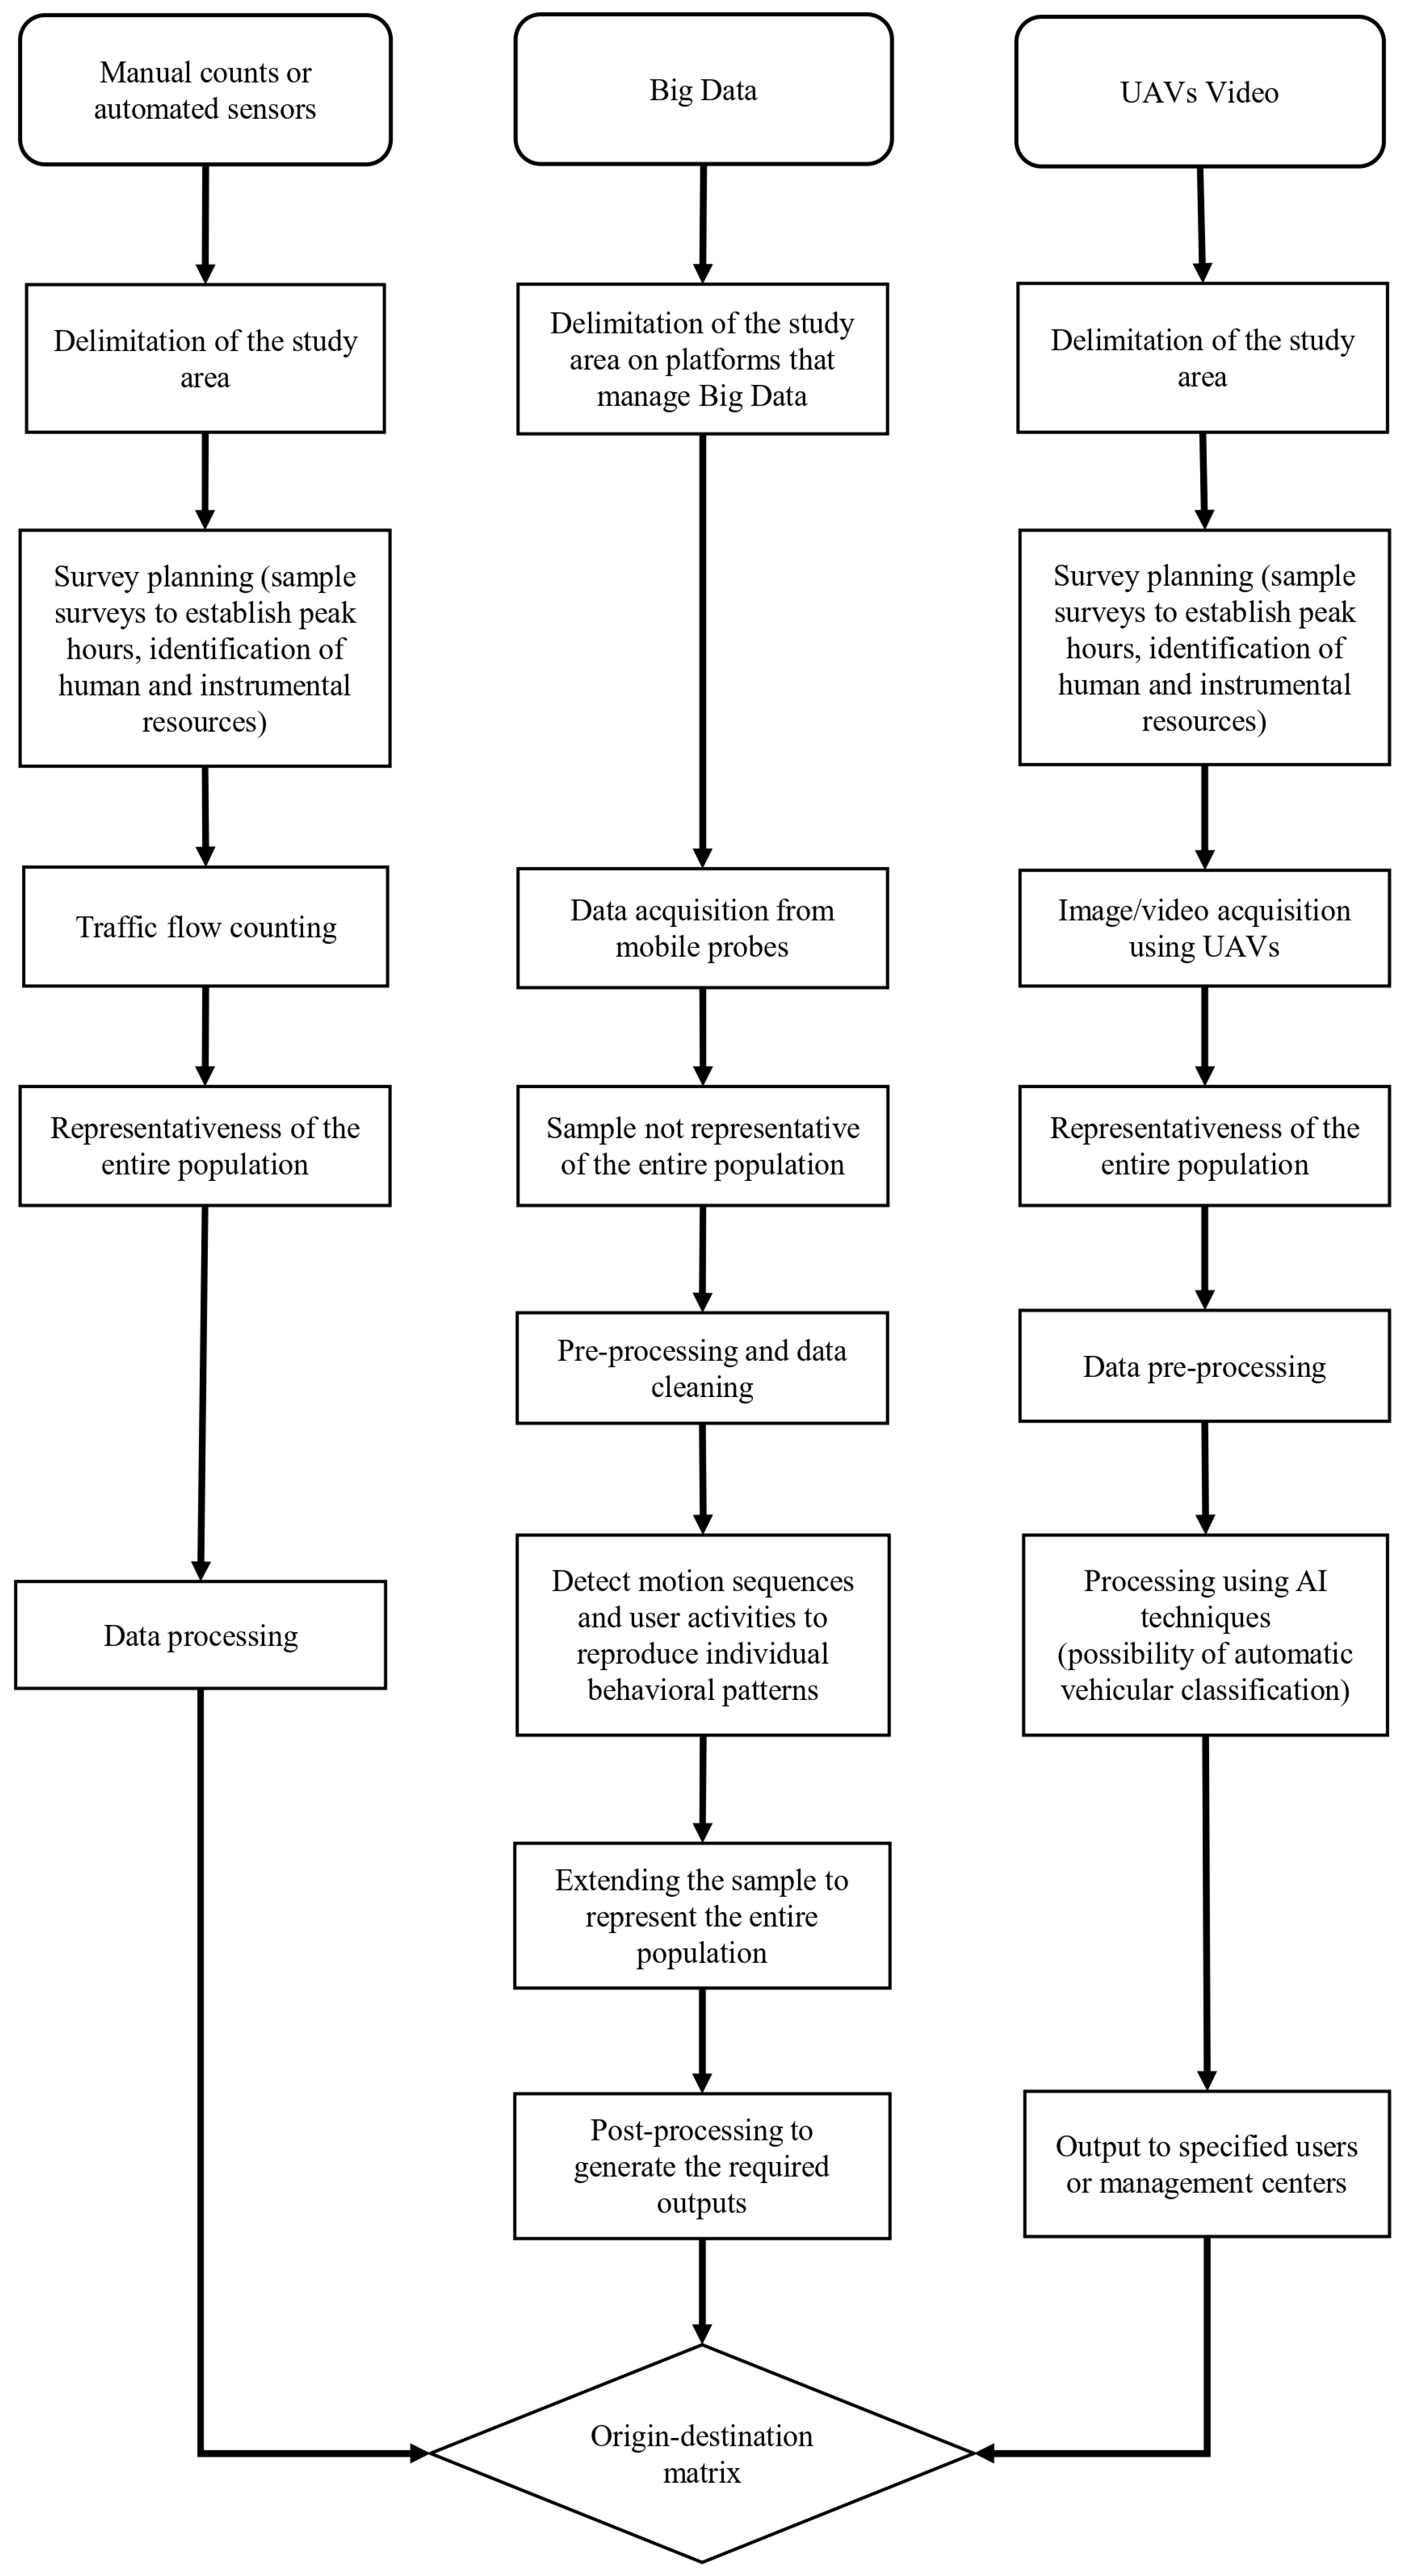
Figure 1 shows a flowchart comparing the three different traffic survey methodologies analysed in this study.
4. Data Sources and Traffic Flow Detection Technologies for the Case Studies
In this study, two case studies were examined. The TomTom Move platform (
https://move.tomtom.com, accessed on 20 June 2026) has been used to collect the Big Data. In both cases, traffic flows were analysed using Big Data derived from GPS probe data. GPS probe data is collected, validated, and integrated from various sources, including TomTom devices, automotive systems (Daimler, BMW, Audi, Toyota), truck fleets (Sygic, Webfleet), and apps (TomTom, Uber). The data is recorded at one-second intervals and shared with TomTom for the calculation of real-time speeds. Key steps in the process include map matching, where GPS data is aligned with TomTom’s internal map to filter out outliers, and real-time speed calculation, which combines current and historical data to determine the accurate speed of each road segment. GPS probe data also detects traffic jams, identifying congestion locations, delay times, and start/end points. Finally, it predicts the duration of traffic jams by analysing historical patterns and real-time traffic data. Automated actions are carried out every 30 s, ensuring that the data remains current and accurate for optimal route planning. The expansion from sampled probe observations to aggregated traffic volumes is performed within the TomTom Move data processing environment, which relies on proprietary data fusion and scaling algorithms. Since these algorithms are not publicly disclosed, the study does not provide explicit formulations for determining expansion factors.
In this study, the IntuVision VA software, a commercial tool with undisclosed recognition algorithms (
https://www.intuvisiontech.com/, accessed on 20 June 2026). For clarity and consistency, the video-processing software used in this study is hereafter referred to as ”UAV video processing software”. A specific timestamp marking the start of the manual counting was established, corresponding to the video recording start time as indicated by the timestamp embedded in the 4K video file. The same timestamp was also used for the TomTom Move application. The comparison time window for each method was 20 min for the first case study and 19 min for the second case study. For each detection technology, the comparison time window was the same across both case studies.
Battery life constraints, together with the overall survey costs (including equipment depreciation, pilot fees, and ENAC authorisations), suggest that video-based surveys may be restricted to the critical observation period only. The limited duration of video recordings is also attributable to current technological constraints related to the battery capacity of commercially available UAVs. For each case study, absolute and relative errors were calculated between the manual counts and the automatic counts in order to quantify the accuracy of the traffic flow detection technologies. Vehicle counting based on video recordings ensures data repeatability. Specifically, the manual counts were performed independently by four authors, each of whom examined the entire video to ensure consistency in the results. Subsequently, a fifth author compared the counts to identify any discrepancies. The level of agreement among the counters exceeded 95%, with discrepancies limited to a small number of observations. In cases of divergence, the counts were re-evaluated until a final consensus was reached, and the agreed-upon counts were used as the reference values for all subsequent analyses. For an aggregated assessment of estimation accuracy, the Mean Absolute Error (MAE) and the Mean Absolute Percentage Error (MAPE) were computed. The absolute error was defined as the absolute value of the difference between the estimated count (obtained via UAV video processing or Big Data) and the manual reference count. The relative error, in turn, was expressed as the percentage deviation with respect to the manual count. The MAPE allows quantifying the relative deviation between estimated and observed values in a normalised form. However, MAPE values can become disproportionately large when the reference count is very low, since even small absolute differences may result in high percentage errors. For this reason, MAPE results associated with low-count observations should be interpreted with caution. The MAE was also adopted because it does not depend on the observed value in the denominator and is therefore more stable and less sensitive to very low heavy-vehicle flow volumes. Importantly, the research conducted within this study aims to conceptualise a comprehensive complementary use of UAV observations and Big Data in order to identify potential limitations of the systems under specific operational constraints.
5. Case Study 1 Results
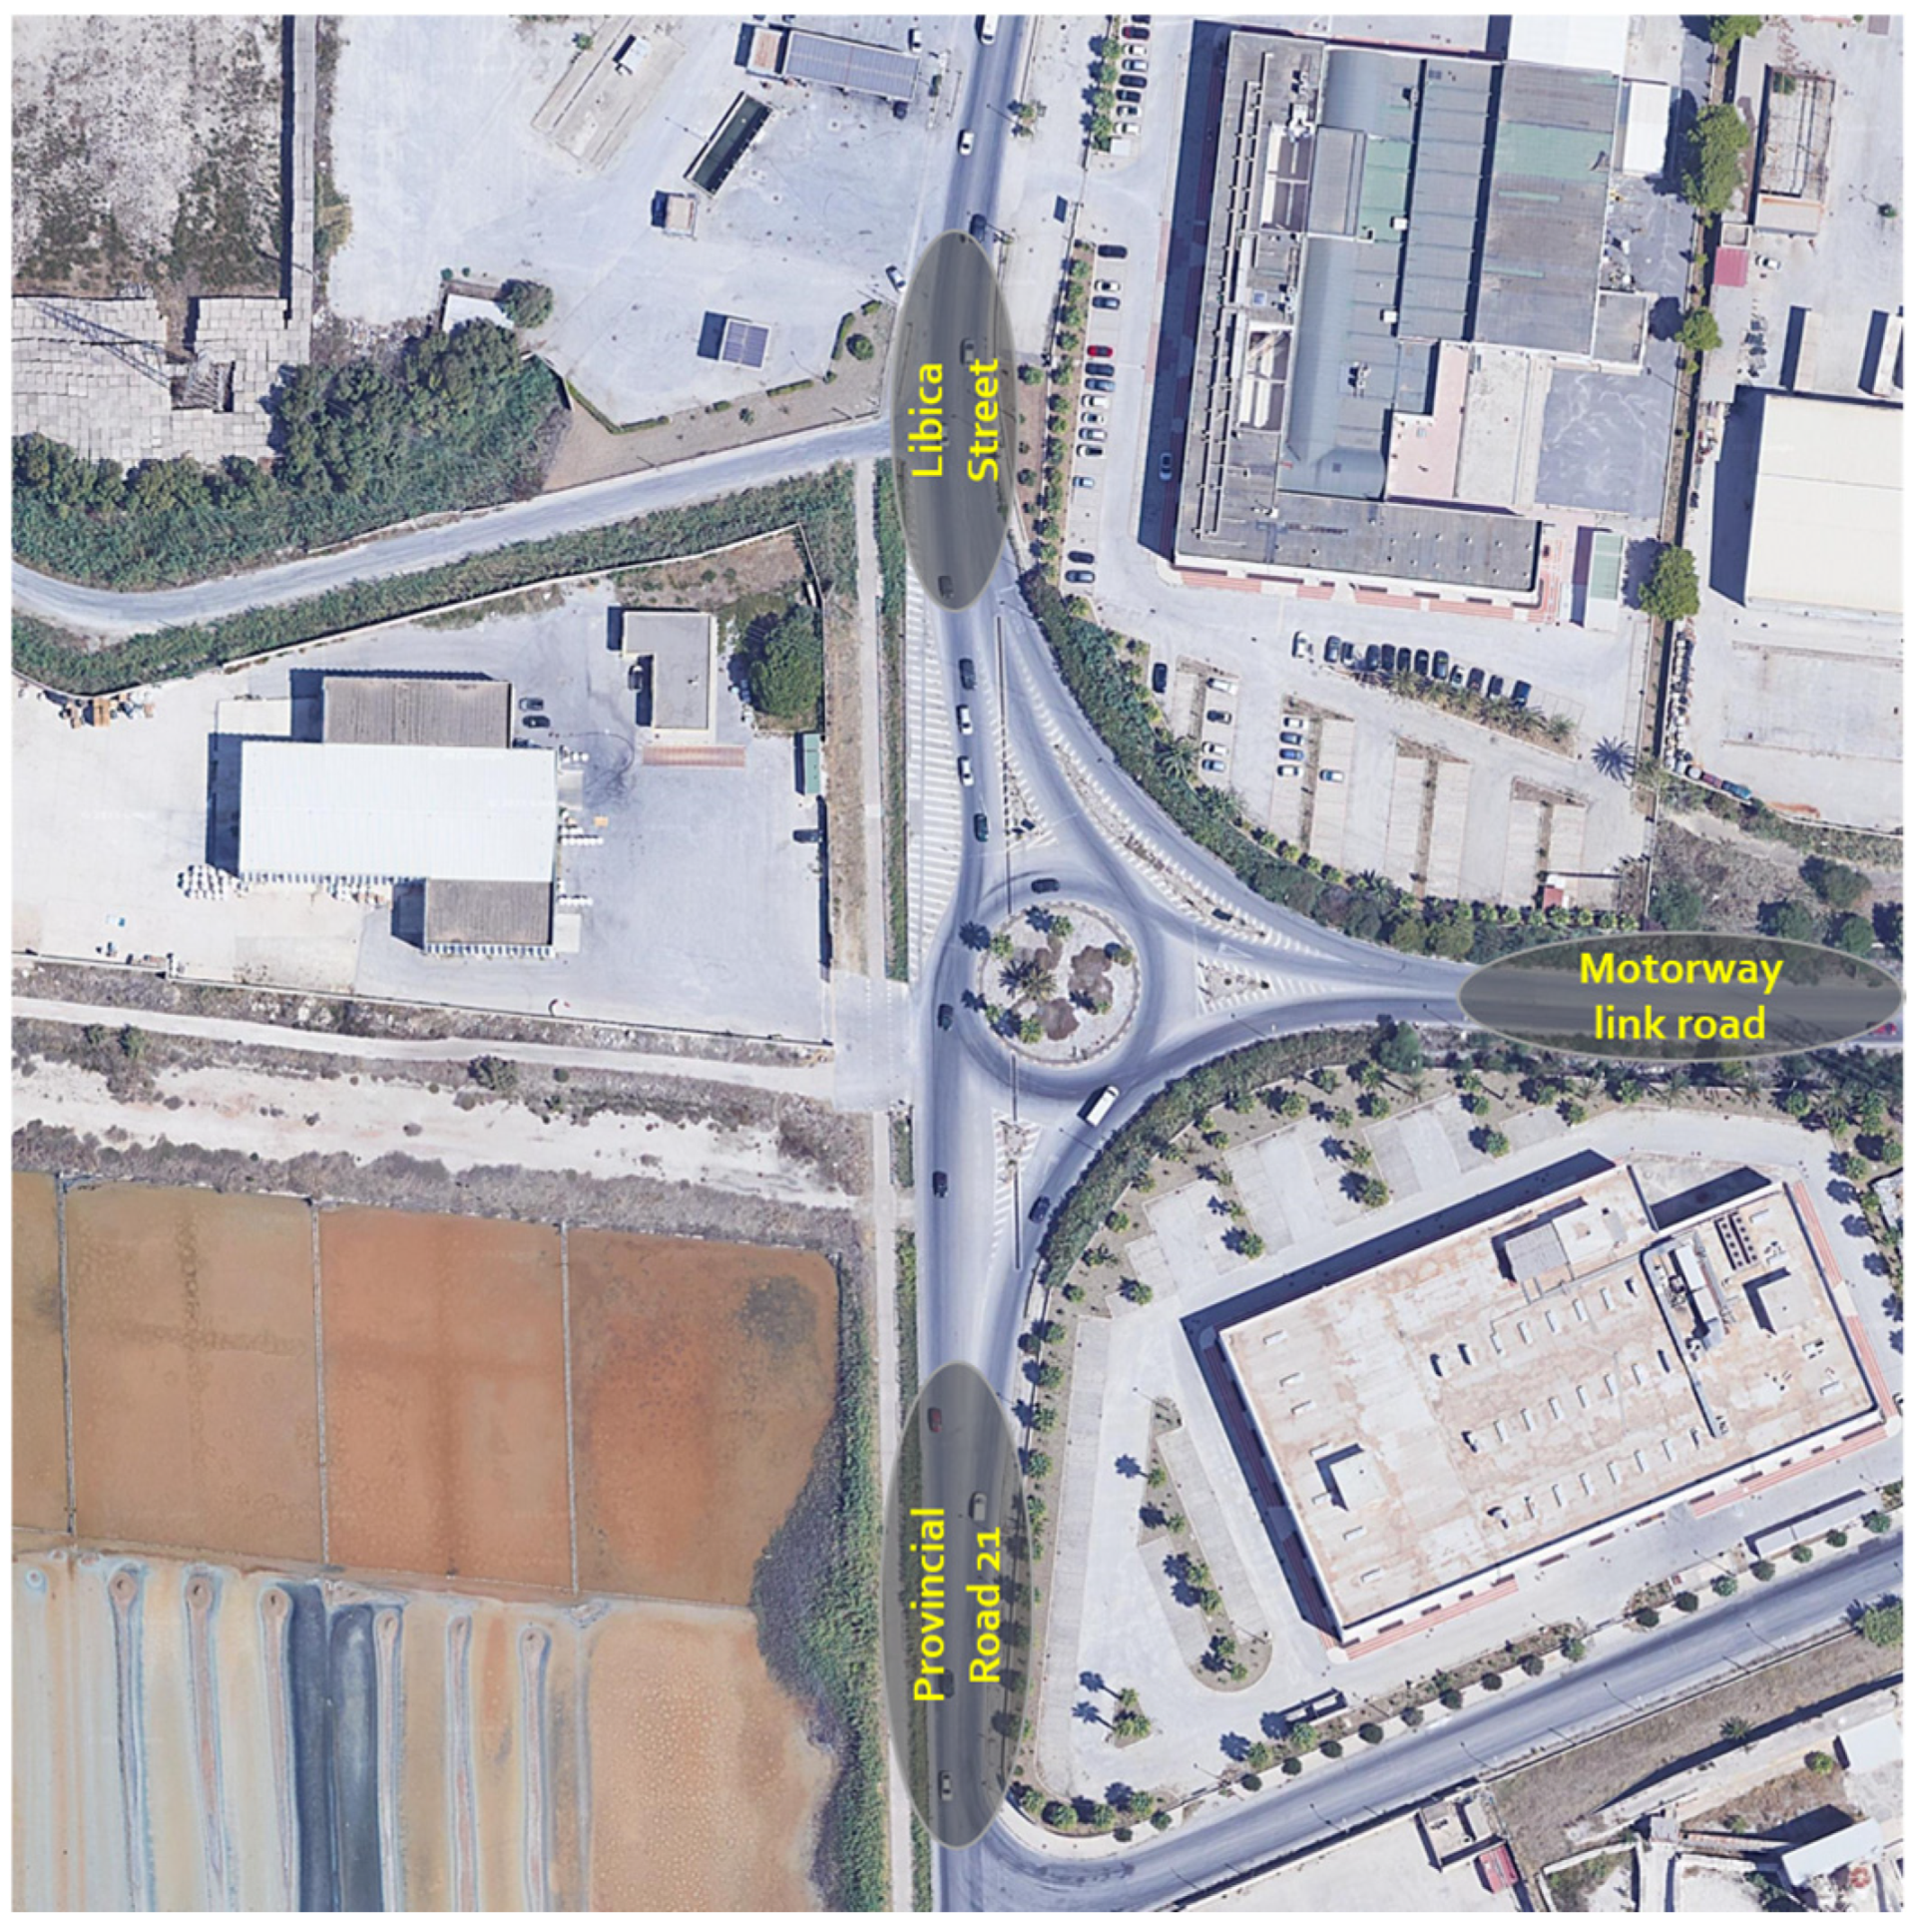
The first case study consists of a roundabout intersection bounded by “Libica Street” to the north, “Motorway link road” to the east, and “Provincial Road 21” to the south (
Figure 2). A pre-analysis was conducted from 15 January 2025 to 20 January 2025 to understand which were the peak hours. The knowledge of the peak hours was useful to determine when to carry out the UAV detection. The effective flight duration, excluding time allocated for landing, take-off, and UAV positioning, was 20 min. The UAV video was conducted in stationary flight at an altitude of 30 metres. Specifically, the UAV video recording was initiated at 08:43 and concluded at 09:03 on 26 February 2025 (Wednesday). The UAV deployed had an MTOM (Maximum Take Off Mass) of 720 g.
Figure 2 offers a detailed illustration of the intersection of the case study.
This study deployed a simplified nomenclature for intersection legs (
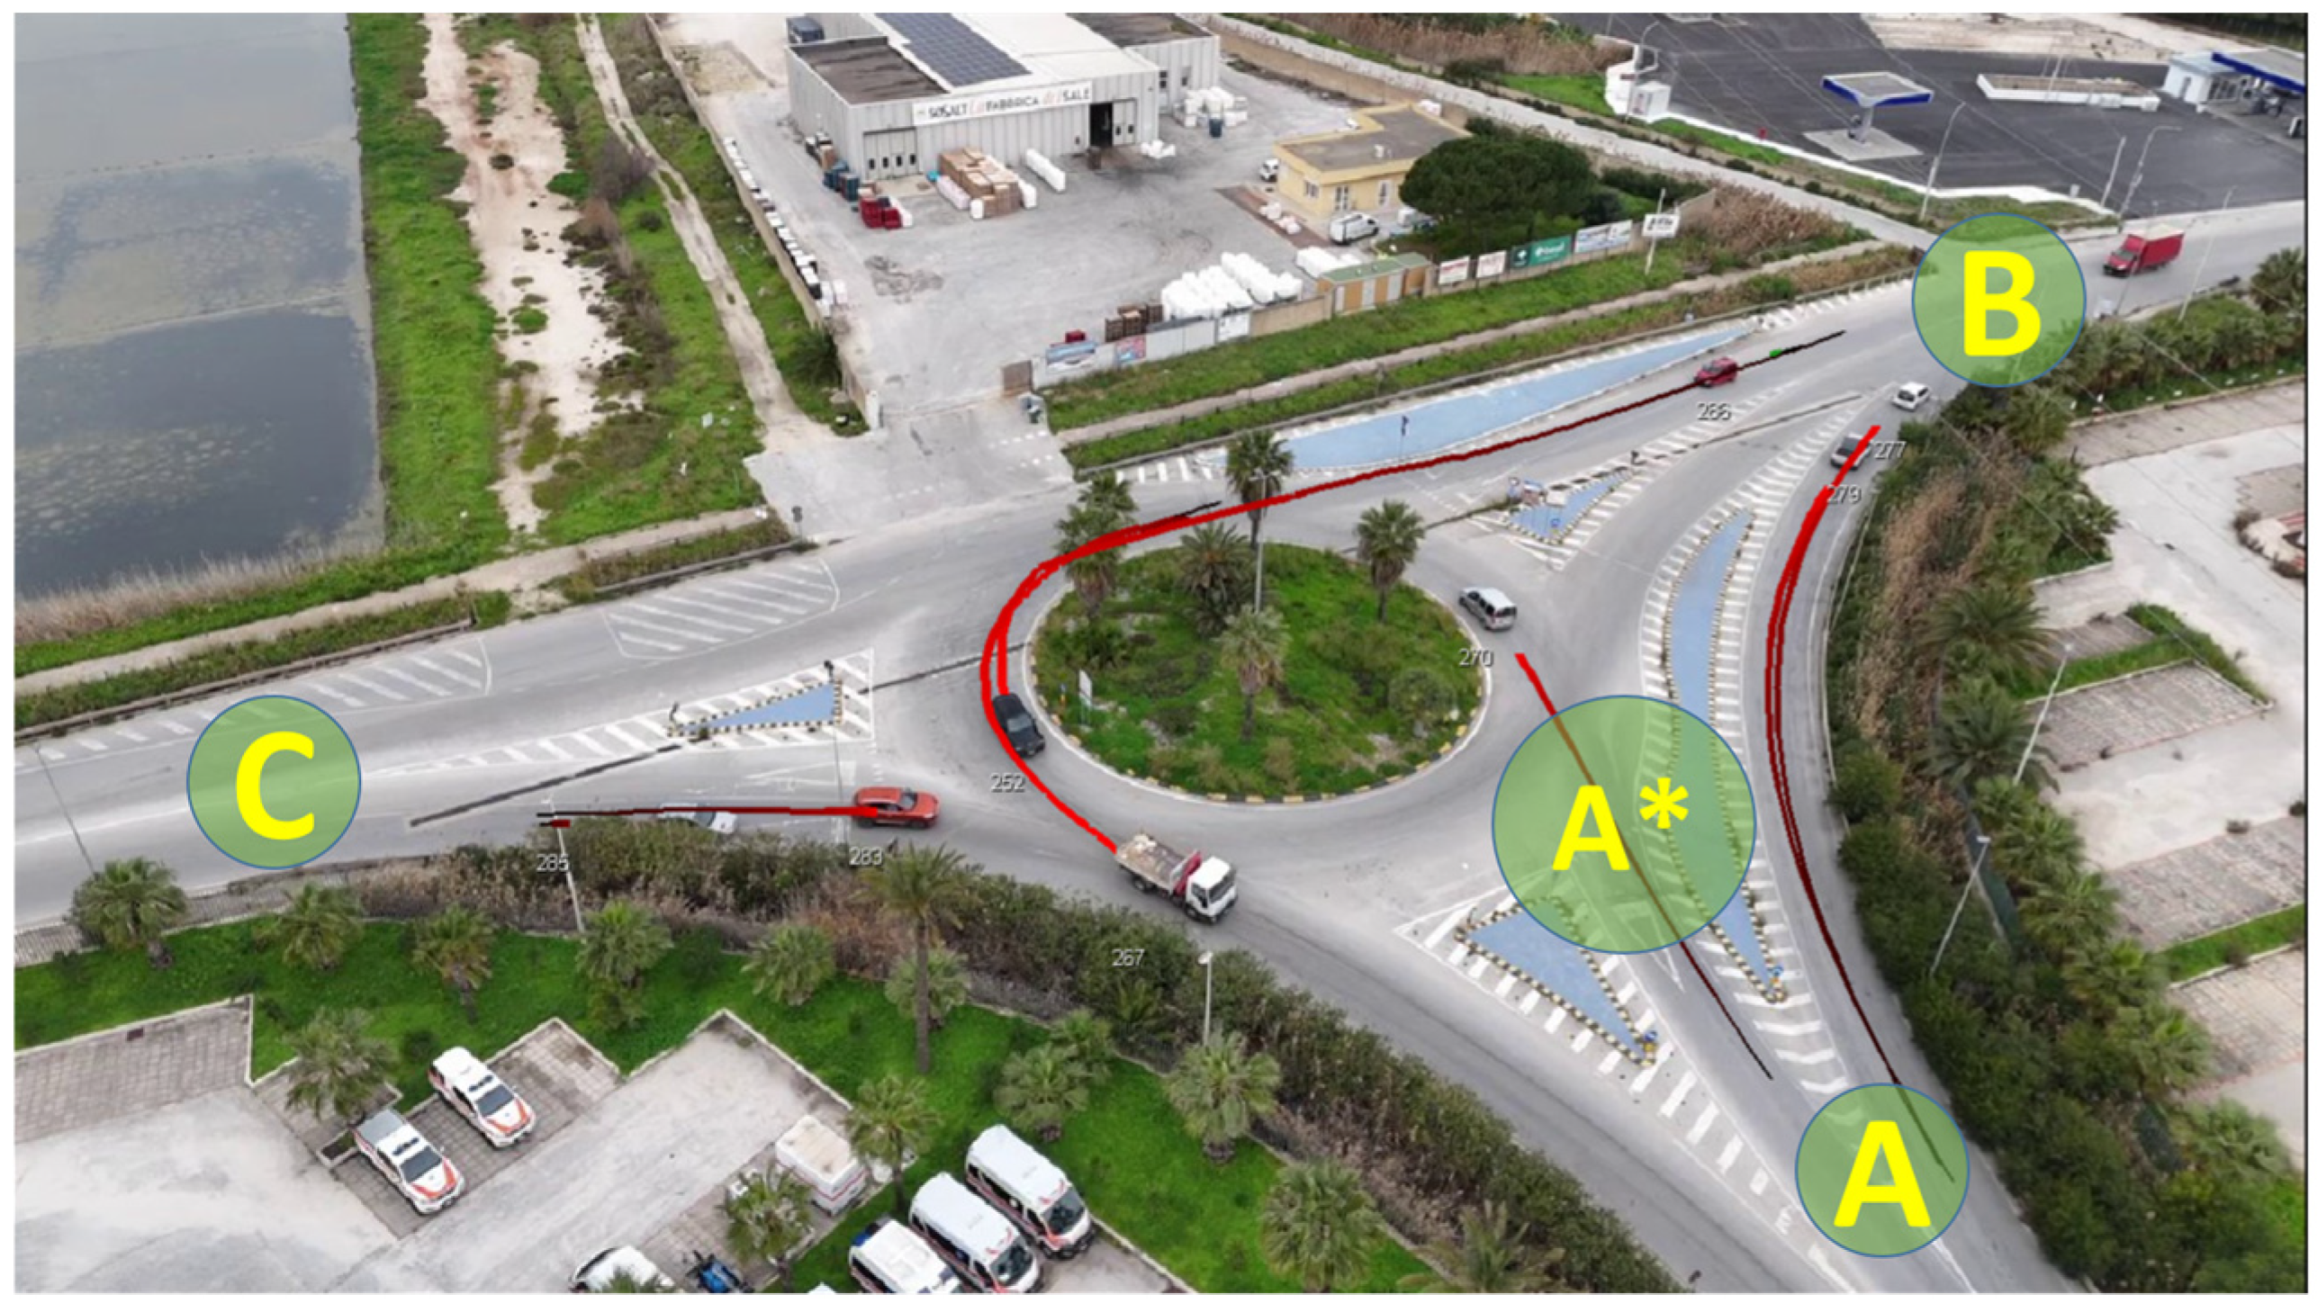
Figure 3). For the purposes of clarity and conciseness in the analysis, “Motorway link road”, “Libica Street” and “Provincial Road 21” have been relabelled as A, B and C, respectively.
The case study is represented by a 3-leg roundabout intersection. In legs B and C, there is only one entry lane, while in leg A, there is a bypass. In
Figure 3, vehicles approaching Leg A are categorised into two distinct traffic flows: flow A*, representing vehicles entering the circular roadway, and bypass flow, comprising vehicles utilising the direct bypass route. Furthermore, the red lines represent the trajectories of the vehicles identified by the software.
5.1. Big Data Results
A real-time updated traffic flow database was employed. Traffic flows, delays, and queue lengths are provided for a sample of the overall traffic demand.
A preliminary analysis of vehicular flow characteristics at the different intersection approaches was carried out by processing GPS probe data over multiple days of a generic week, with the purpose of identifying peak traffic hours that could be used for UAV-based surveys within a single day and understanding the distribution of flows over the course of a week (
Figure 4). This preliminary analysis enabled the identification of optimal timing for a UAV-based survey. In order to ensure a consistent comparison between the two methodologies, data collection was conducted within the same time interval. To ensure clarity and conciseness throughout the analysis, the road segments were previously renamed A, B, and C, respectively. It has been observed that significant peaks can be seen in the evening hours on Saturdays and Sundays. In contrast, weekday peaks are concentrated in the morning, from 8:00 to 9:00, and in the lunchtime period, from 12:30 to 13:30.
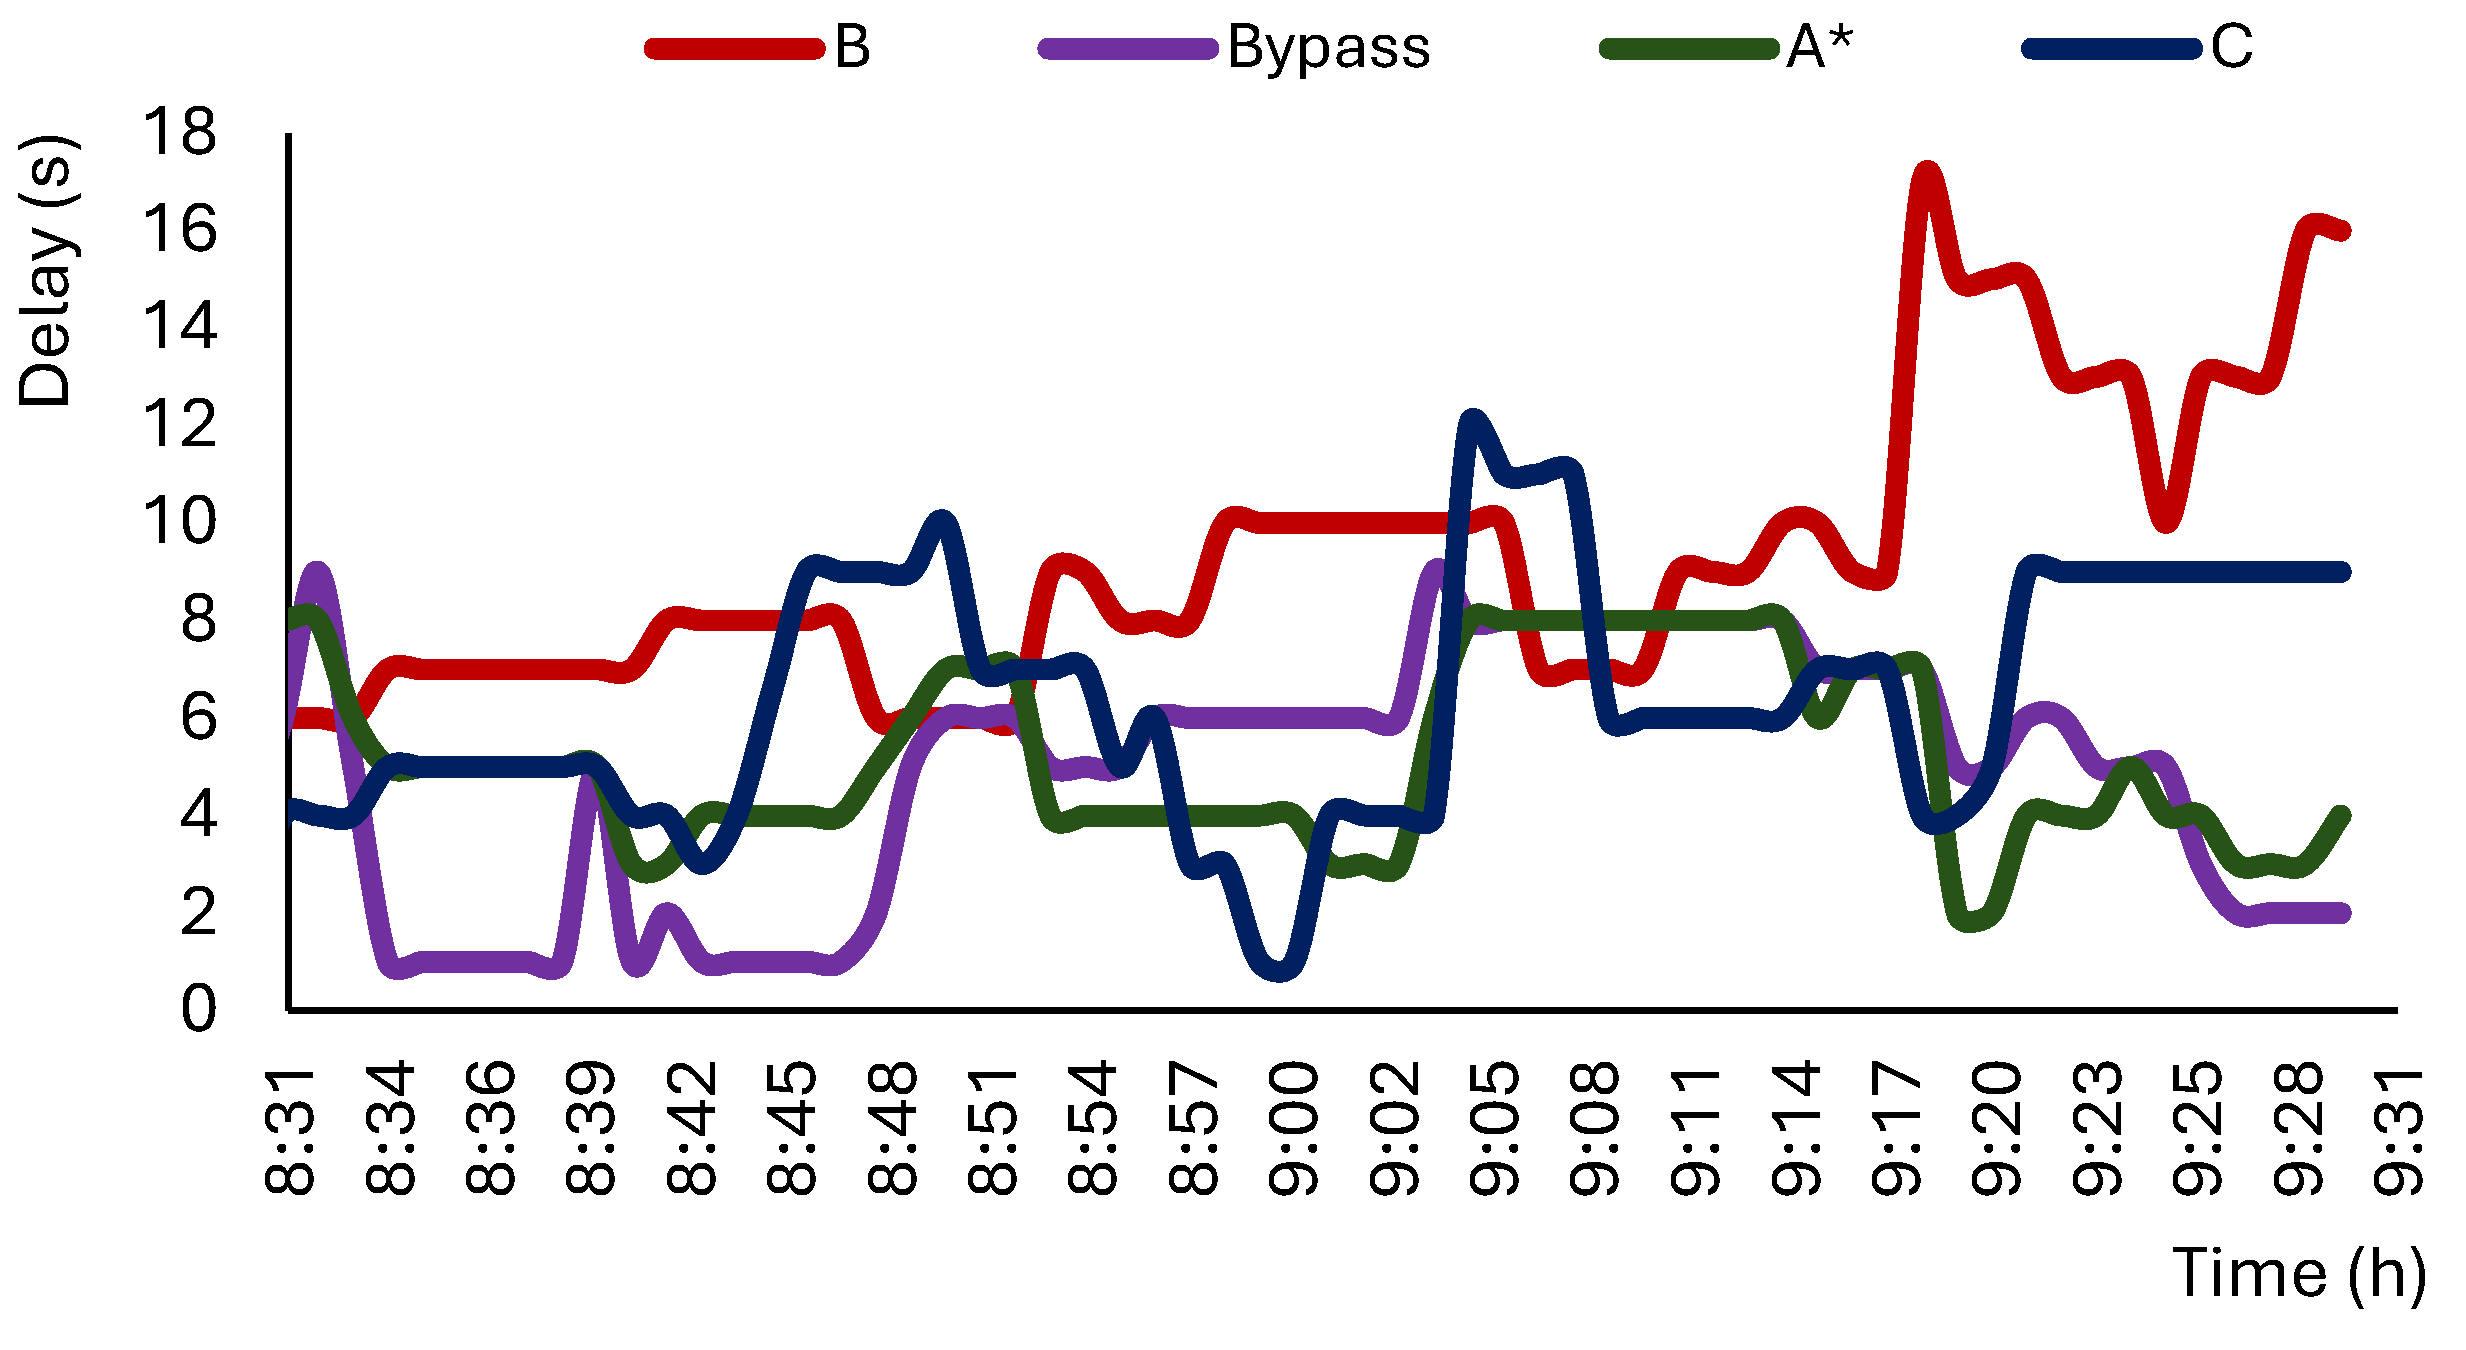
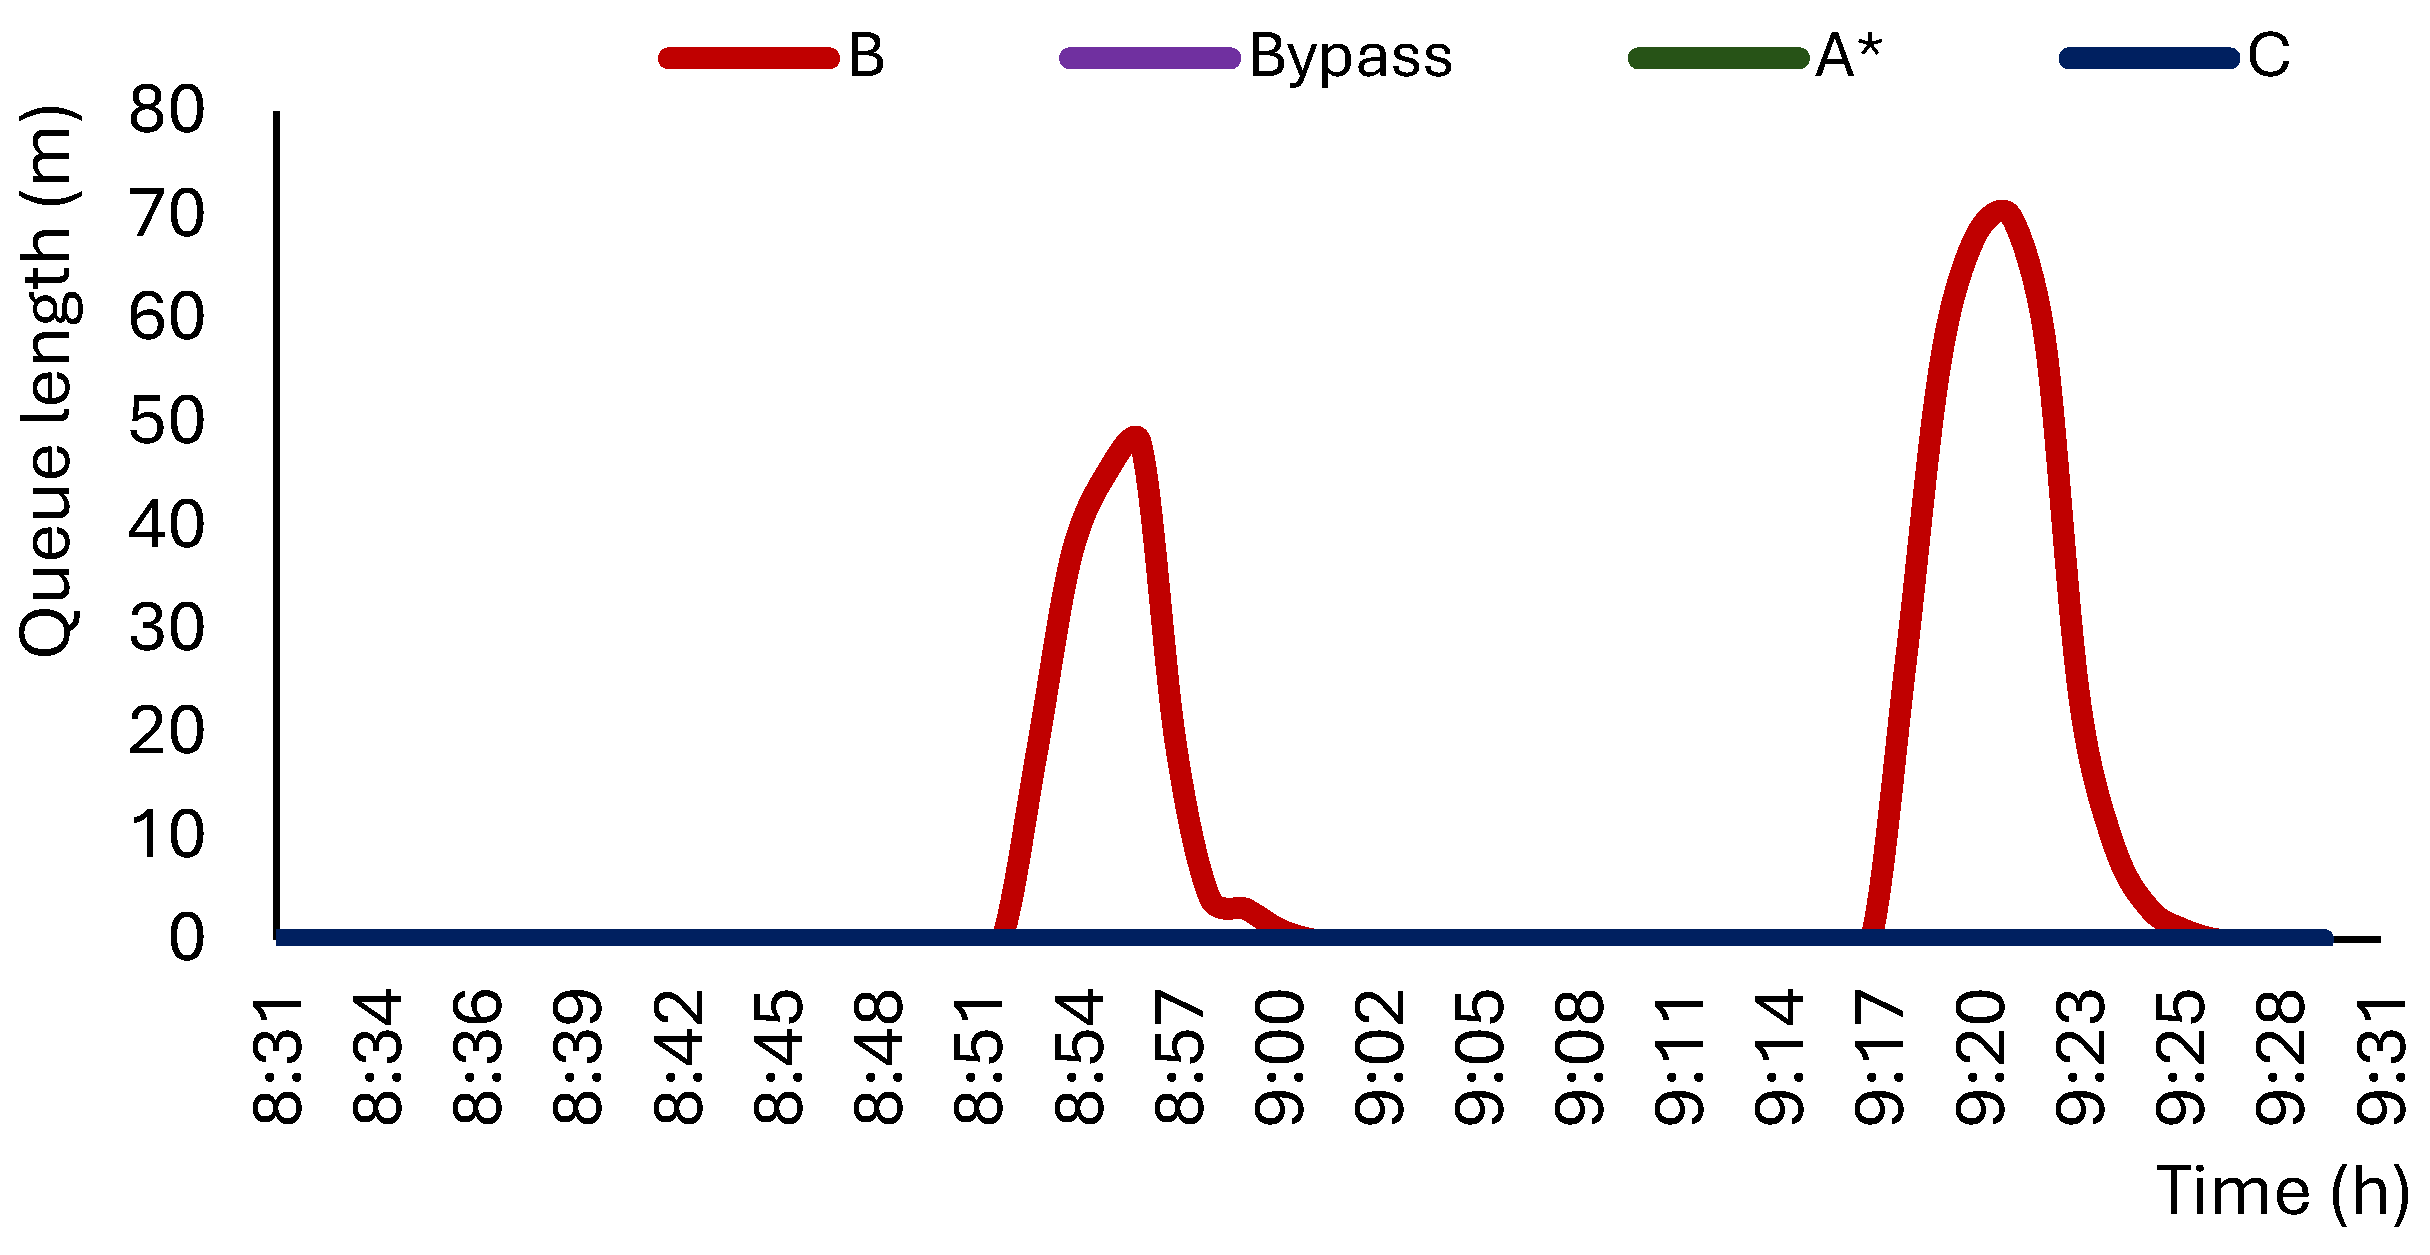
The analysis produced time-series diagrams illustrating vehicular delay (
Figure 5) and queue length (
Figure 6).
In the analyzed case, non-zero queue lengths are observed only for approach B. The remaining approaches have zero queue lengths; therefore, their curves overlap in the figure and cannot be distinguished.
Table 7 and
Table 8 present the sample representativeness in terms of the origin–destination matrix and at the level of each individual approach, respectively.
Table 9 reports the number of vehicles estimated by the TomTom Move platform.
Table 10 is based on the origin–destination matrix structures obtained from both the manual counts and the Big Data estimates. It also reports the corresponding absolute and relative errors between the two methodologies, which are used to compute the MAE and MAPE metrics.
In
Table 11, the MAE and MAPE metrics were computed for the entire set of approaches with respect to the Big Data approach.
5.2. UAV Video and Manual Count Results
With regard to the UAV video, the utilisation of video-processing software enabled the classification of the vehicles.
In the following study, the manual counting of vehicles was employed as a reference methodology. The manual counting of vehicles was performed due to the area covered by the video UAV, which ensured visibility of all turning movements.
Table 12 presents the origin–destination matrix derived from the manual count of all vehicles.
The manual counts were performed by four authors, each of whom independently examined the entire video to ensure consistency in the results. Subsequently, a fifth author compared the data collected by the various authors to identify any discrepancies or errors. In case of any divergences, the counts were re-evaluated until a final consensus was reached. In this work, vehicles were classified into two main categories: car and truck. The truck category included long trucks, trucks with trailers, buses, vans, and cars with trailers. While video-processing software can typically discriminate a more detailed vehicle classification, this simplified categorisation was adopted to align with the study’s objectives.
Table 13 is based on the origin–destination matrix structures derived from both the manual counts and the UAV video-processing software estimates. It provides a detailed vehicle-class disaggregation (cars and trucks) and reports the corresponding absolute and relative errors between the two counting methods, which are used to compute the MAE and MAPE metrics.
Very high relative errors were observed for some truck origin/destination pairs (e.g., up to 738%), which can be observed in
Table 13. It is evident across all three approaches that the UAV video software has significantly overestimated the number of heavy vehicles. When a UAV captures images of vehicles from a non-vertical angle, the geometry of the resulting image becomes distorted. As the vehicles move within the scene, their projection onto the image plane continuously changes. Depending on their position relative to the camera and the angle of capture, they may appear longer, wider, or partially distorted. This variability has created challenges for accurate recognition and classification. For total vehicles, the UAV video-processing software provided results with errors ranging from 12% to 21% for all O/D pairs not affected by vegetation (shadowed areas).
Due to authorisation restrictions, the UAV could not be flown directly over the intersection and was instead positioned in the southeastern area of the site. This operational constraint may represent a methodological limitation, as the oblique viewing angle could affect data accuracy.
Table 14 reports the number of vehicles estimated by UAV video processing software.
The results reported in
Table 15 show that the UAV video-processing software achieved lower errors for total vehicle counts than for individual truck origin/destination streams.
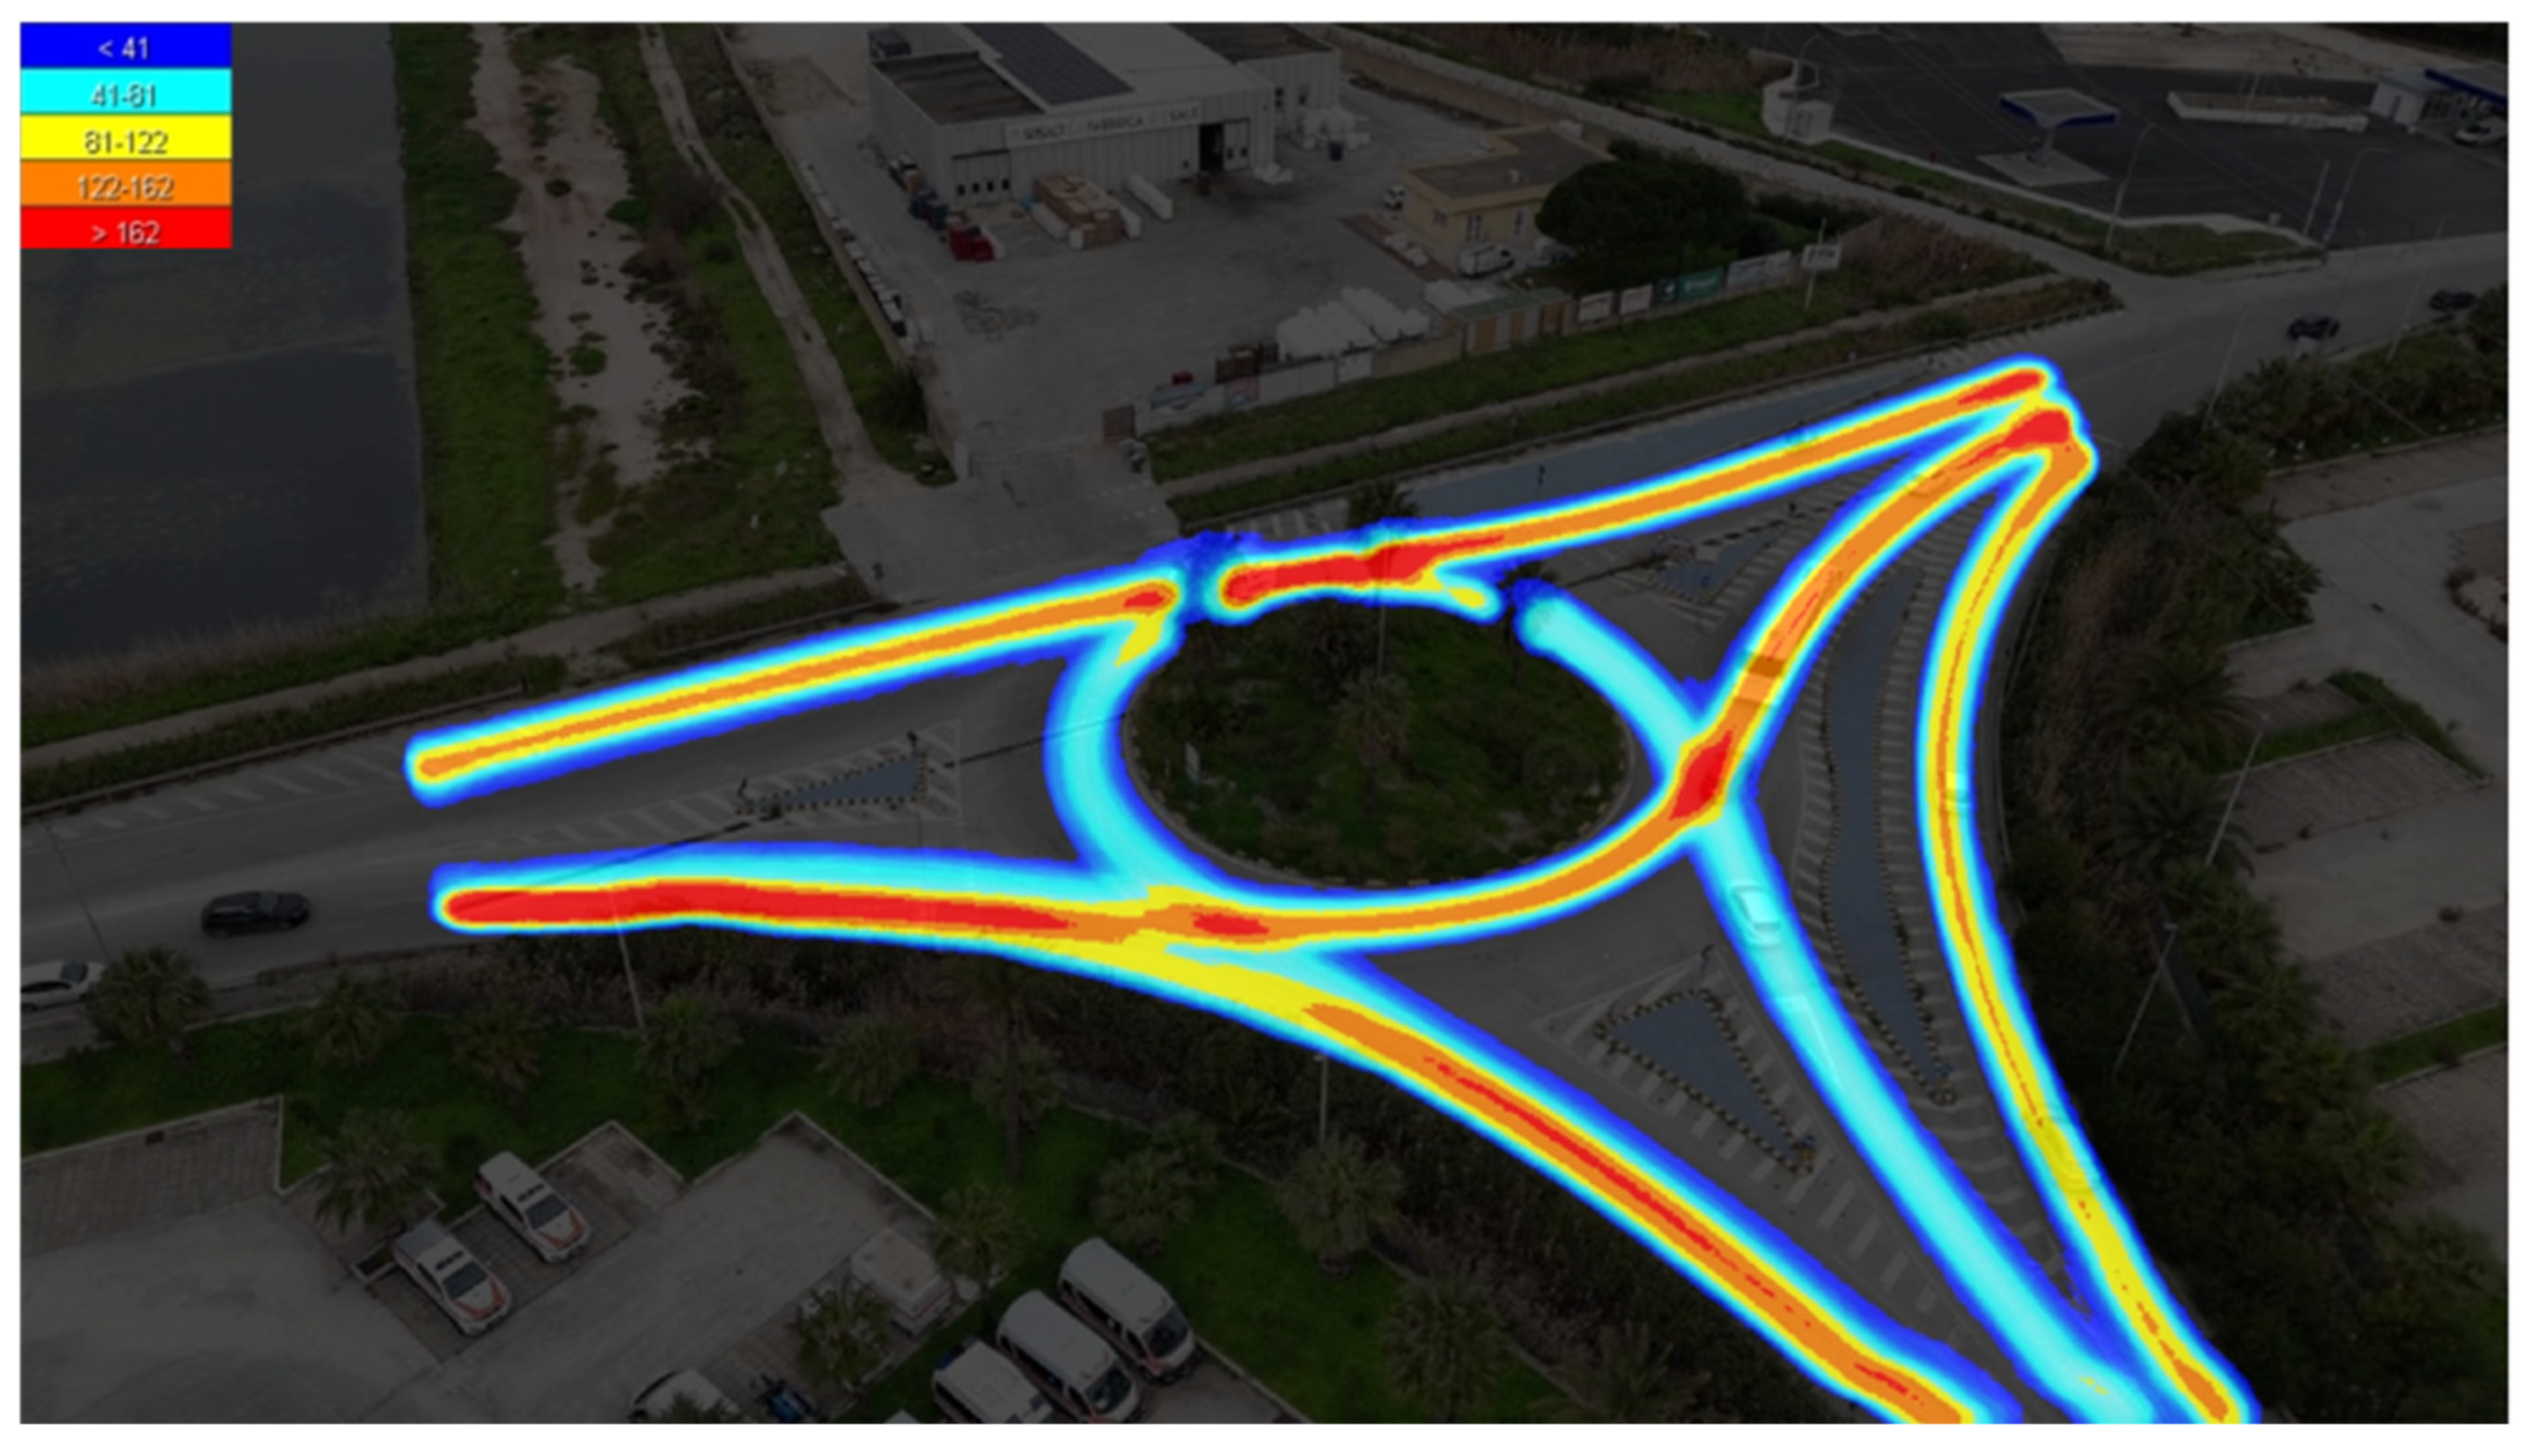
The heat map illustrated in
Figure 7 was generated using video-processing software and represents the intensity of traffic flows during the UAV video recording (20 min). In particular, red areas indicate the highest traffic flow intensities.
5.3. Flow Comparison
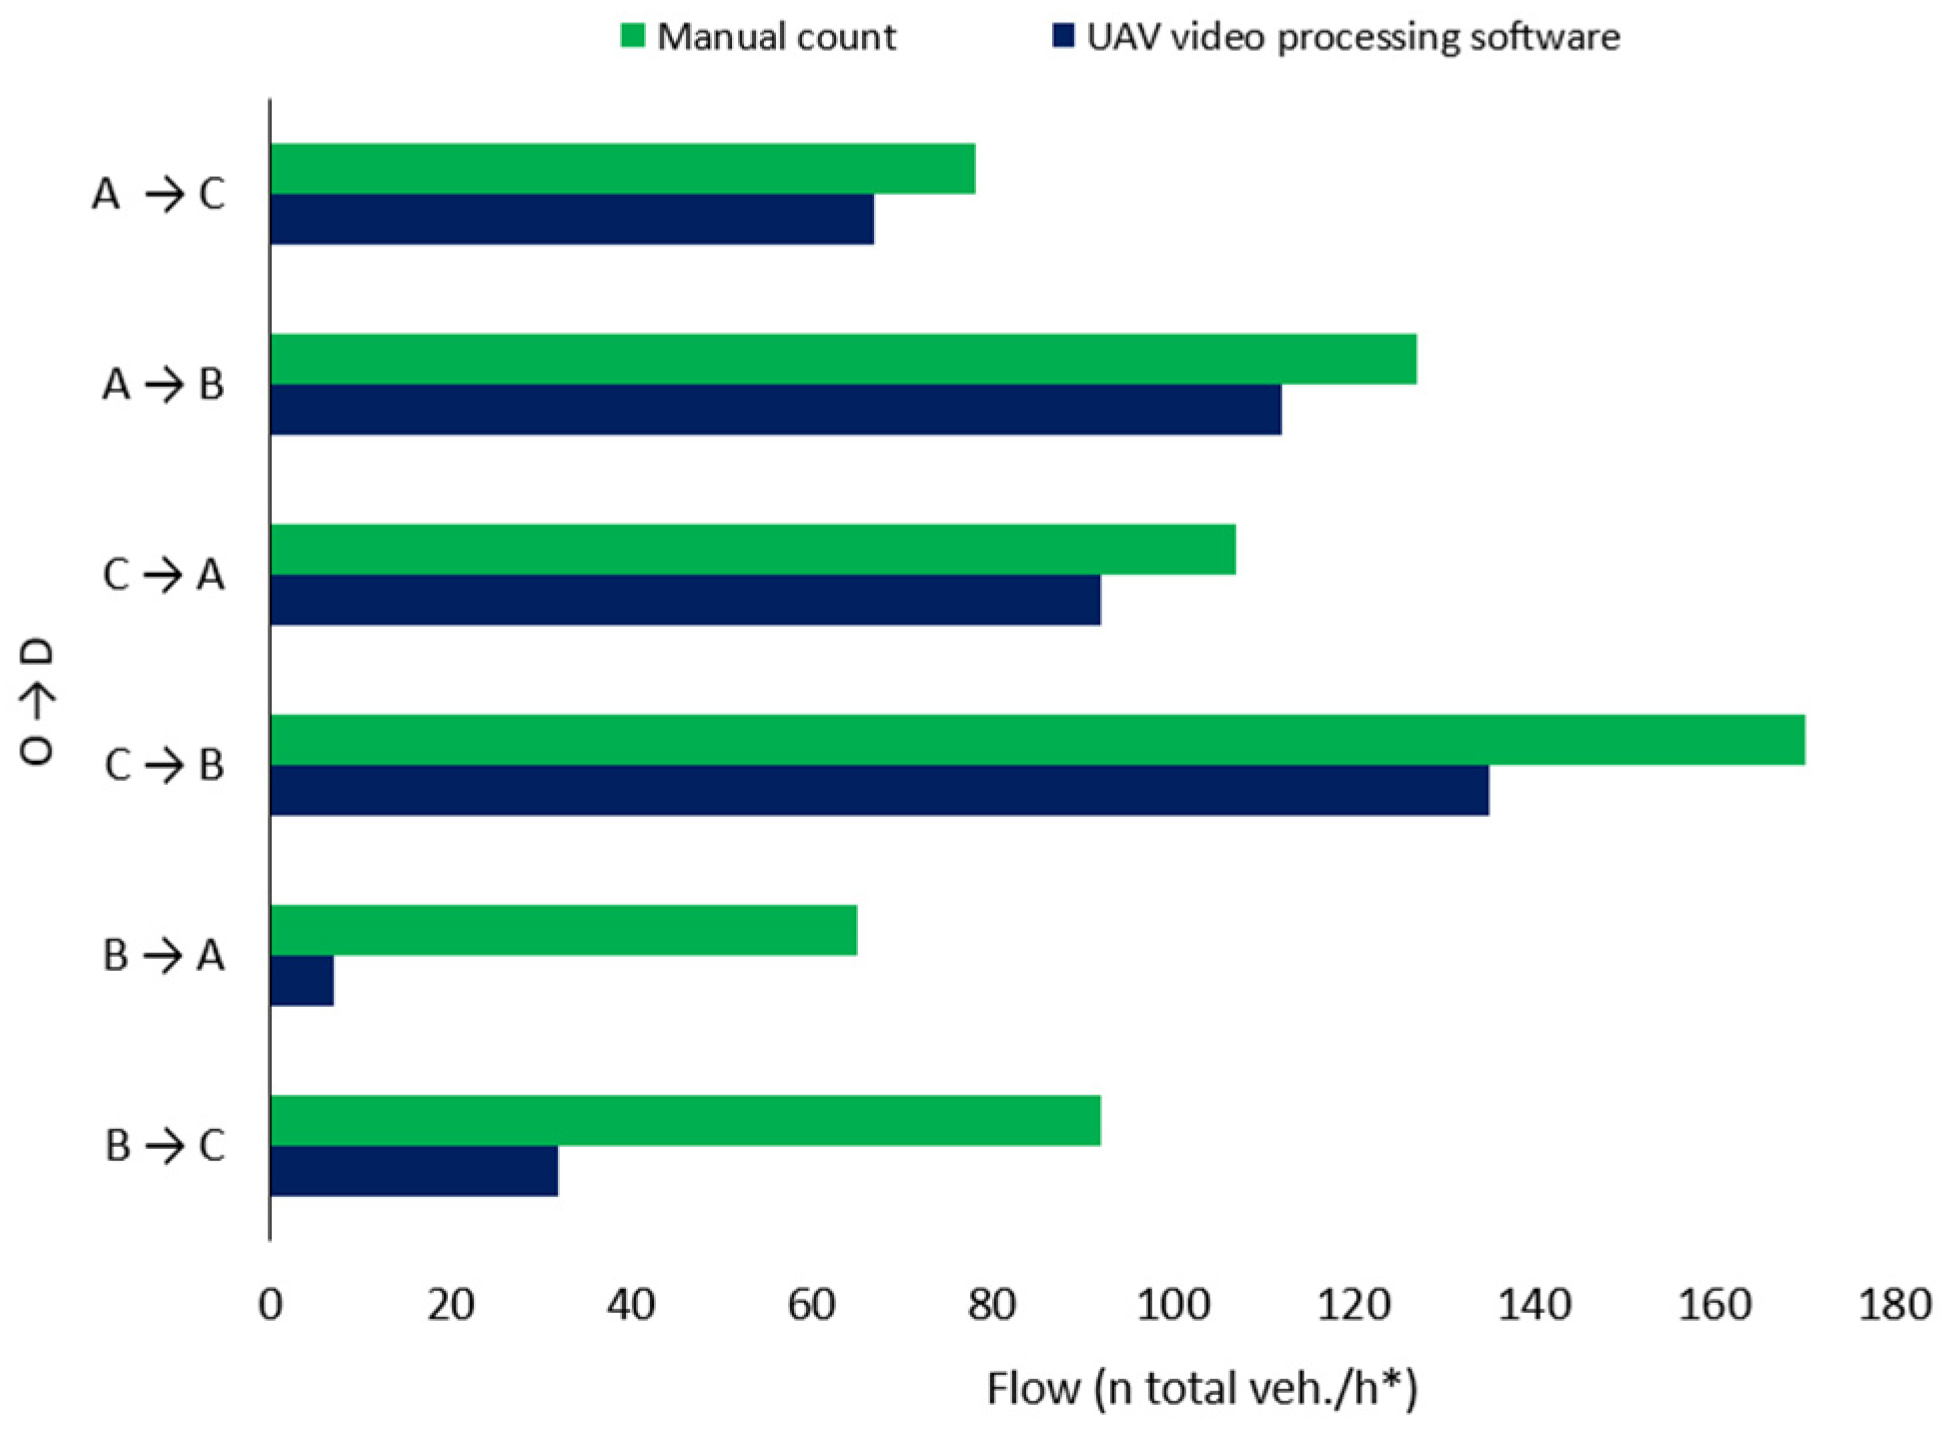
A comparative analysis of the two traffic volume detection methodologies is presented in
Figure 8.
It has emerged that there is a discrepancy between the traffic volume estimated with Big Data algorithms and that determined manually. This outcome is attributable to the intrinsic relationship between the data accuracy of Big Data and the representativeness of the analysed sample. With regard to the UAV video-processing software, it is possible to observe some discrete correlations. However, significant gaps are evident for some turning movements (B towards A and for B towards C), probably because the UAV was not optimally positioned. In consideration of the acquisition configuration, an angle of about 50° was found between the vertical axis, passing through the centre of the intersection, and the UAV observation point. In reference to this last concept, several vehicles were obscured by vegetation. Vegetation obstructions caused temporary occlusions of vehicles, decreasing tracking algorithm accuracy.
6. Case Study 2 Results
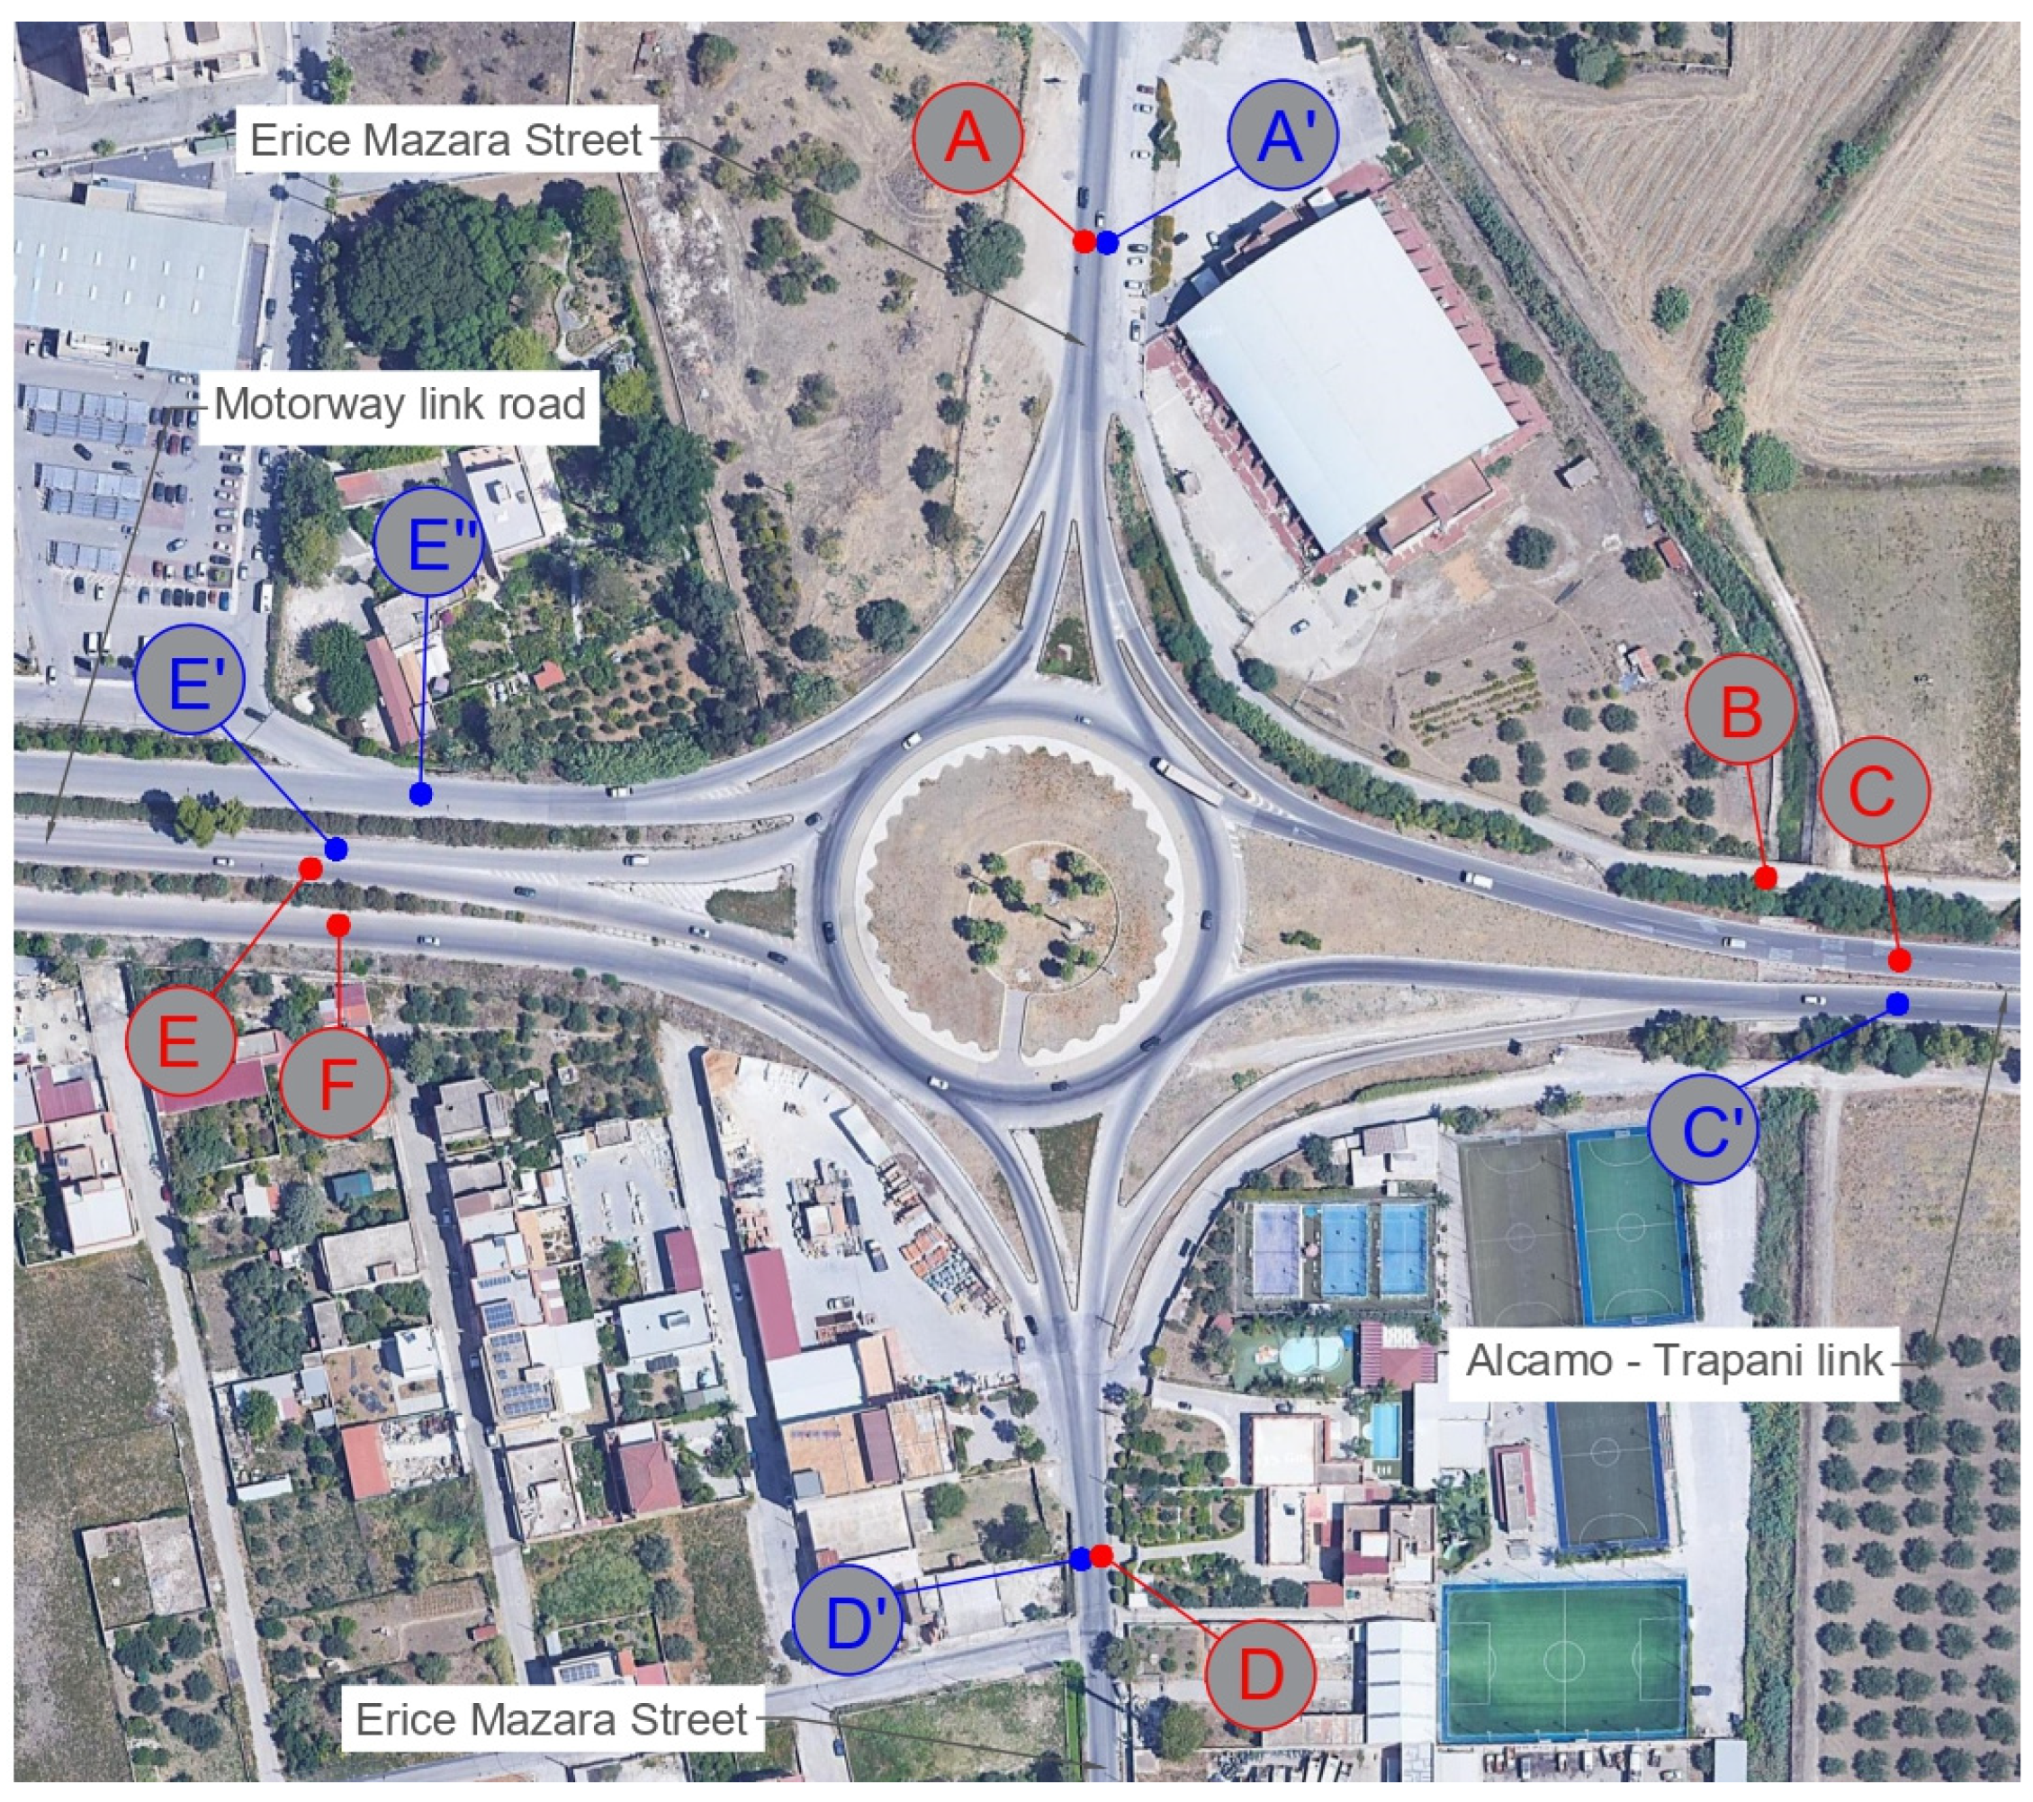
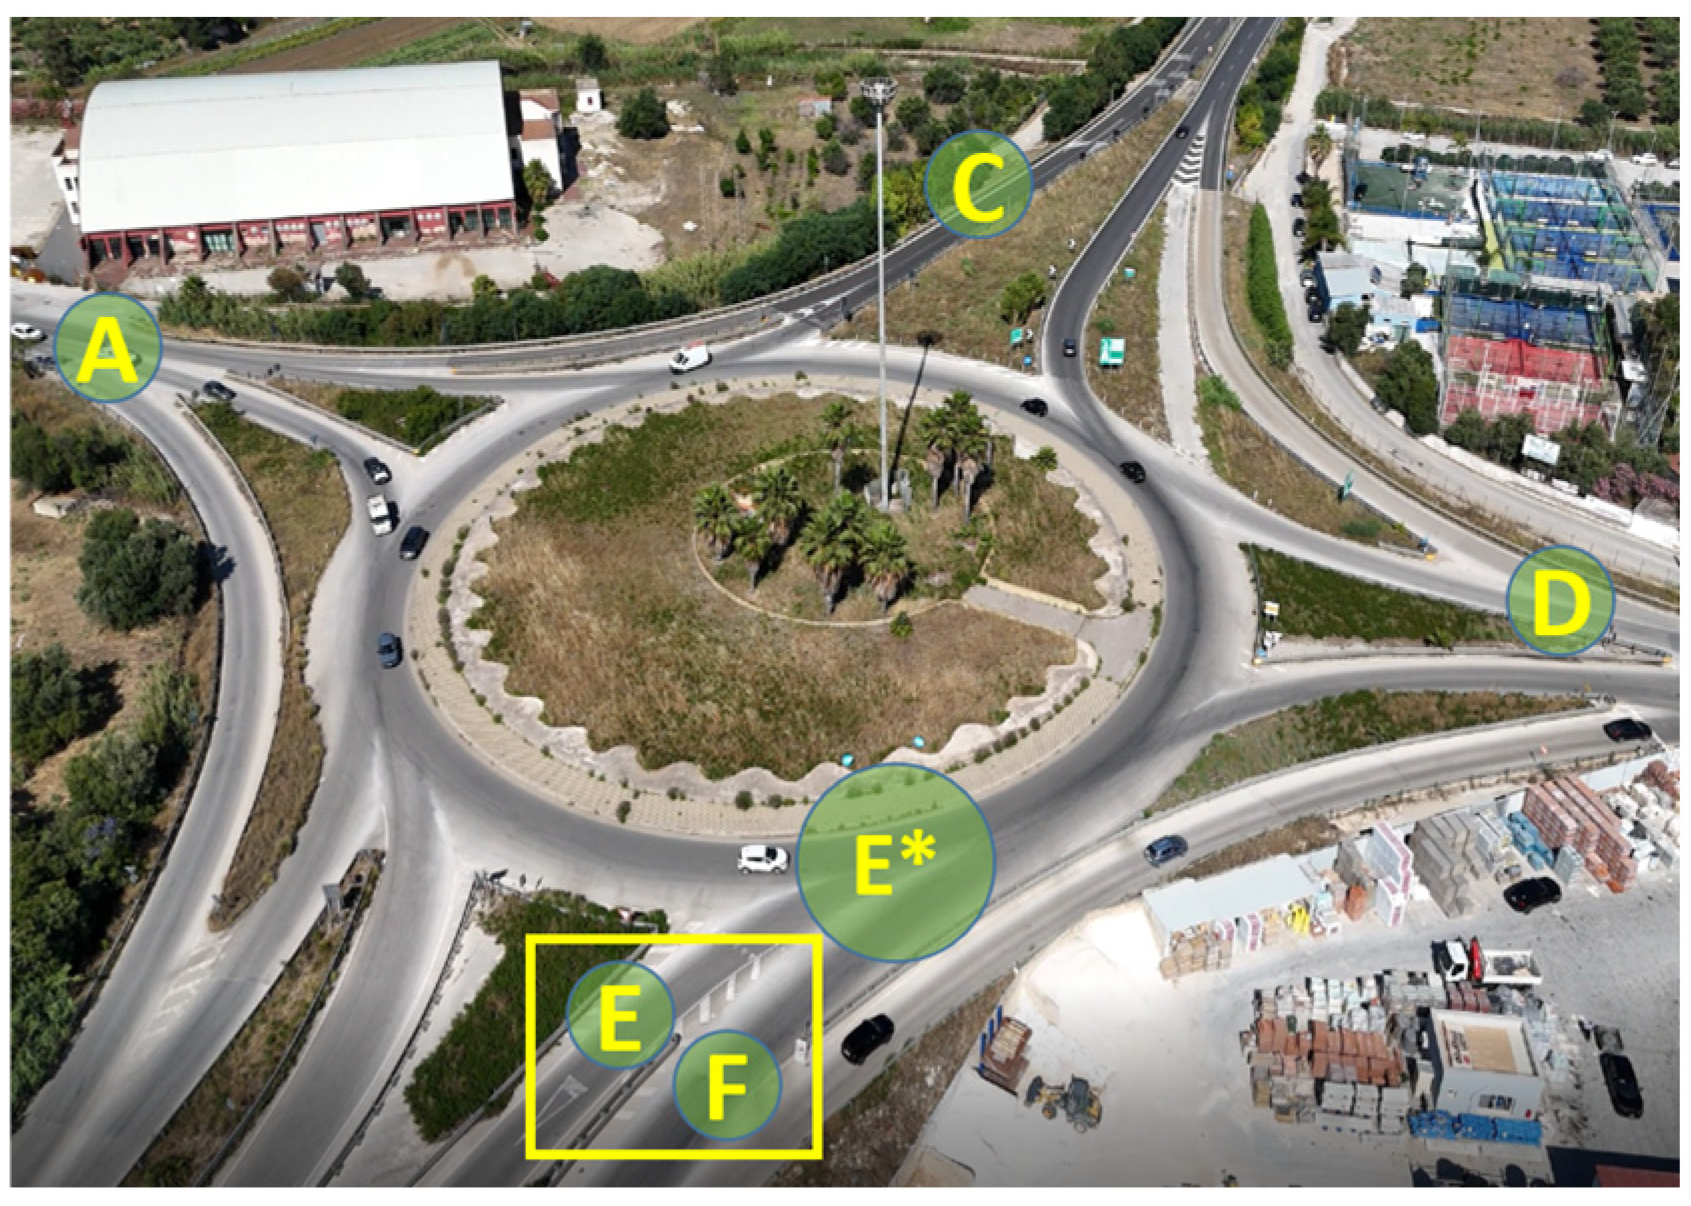
The second case study focuses on a four-arm approach at the roundabout. To the east, it is bordered by the “Alcamo—Trapani link” (C); to the west, by the “Motorway link road” (E and F); and to the north and south, by “Erice Mazara Street” (A and D). The roundabout has four bypass lanes.
Figure 9 highlights the directions of the roundabout’s flow of traffic.
The “Alcamo—Trapani link” involves two separate one-way carriageways, each with two lanes. The Erice Mazara Street has a single carriageway with two lanes for bidirectional traffic. The western branch comprises three carriageways that connect to the roundabout. The central carriageway has two lanes for two-way traffic and merges directly into the circulatory ring. Each lateral carriageway has two lanes and is only accessible in one direction. In addition to connecting to the roundabout, they are equipped with bypass lanes that link to adjacent branches.
The outer diameter of the roundabout is 100 metres. The second case study is more complex than the first due to the inclusion of an additional junction, a larger roundabout diameter, and the presence of four bypass lanes.
6.1. Big Data Results
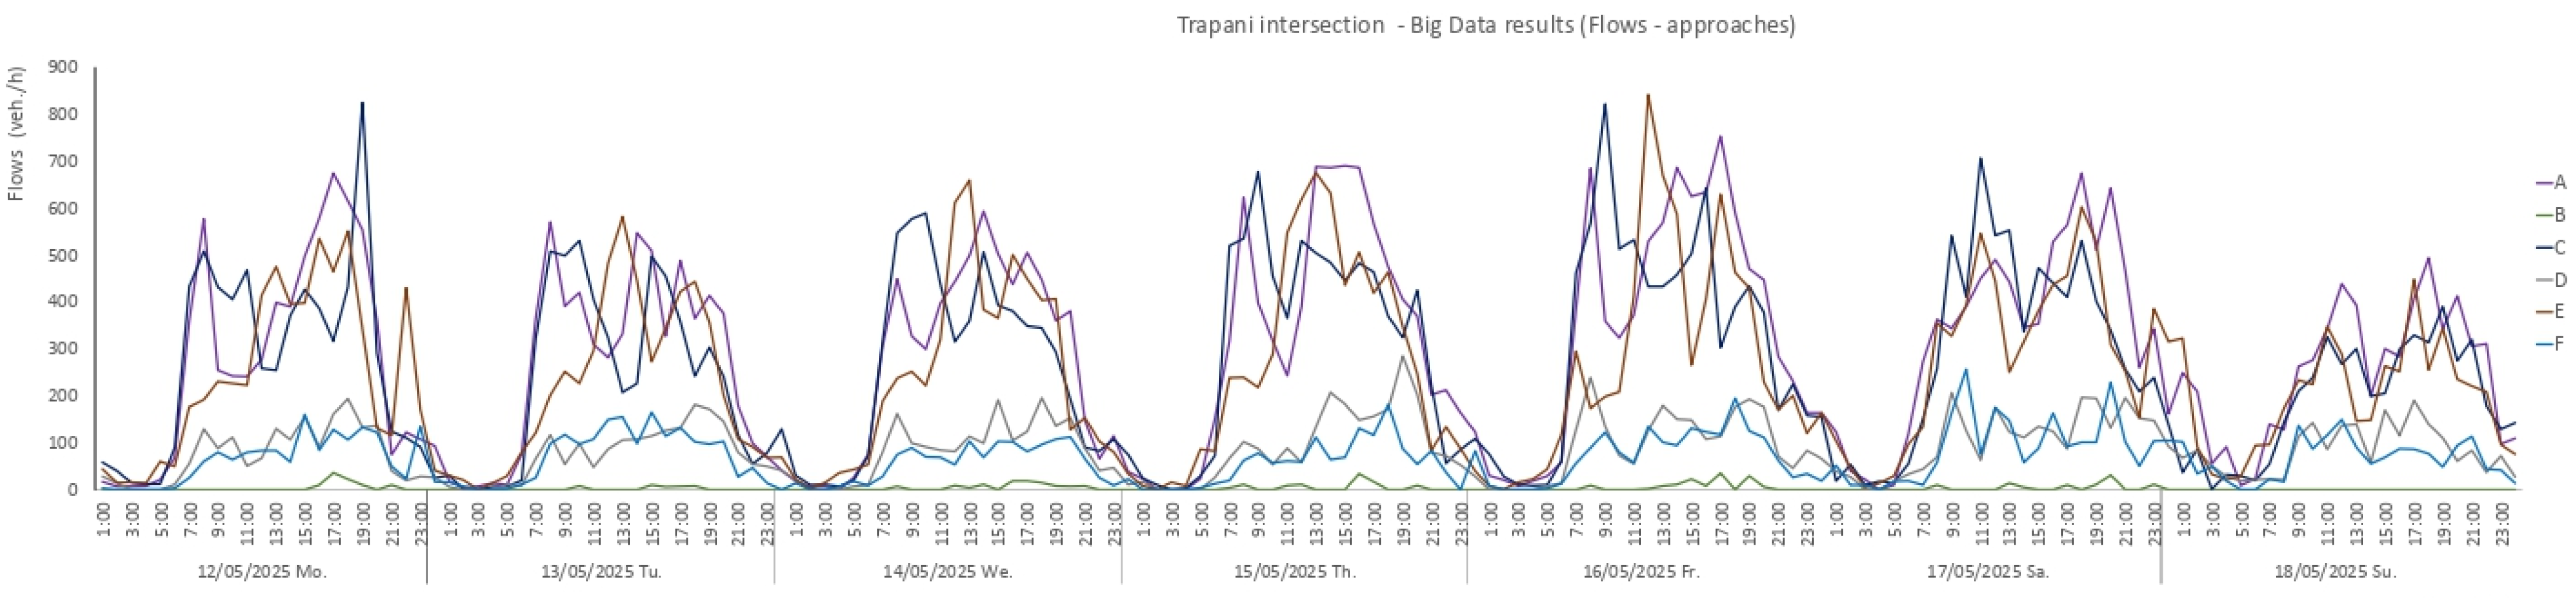
Prior to conducting the UAV-based survey, a preliminary analysis was conducted using GPS probe data to identify peak traffic hours specific to the selected case study. The analysis covered the period from 12 to 18 May 2025. The resulting traffic trend graph is presented in
Figure 10.
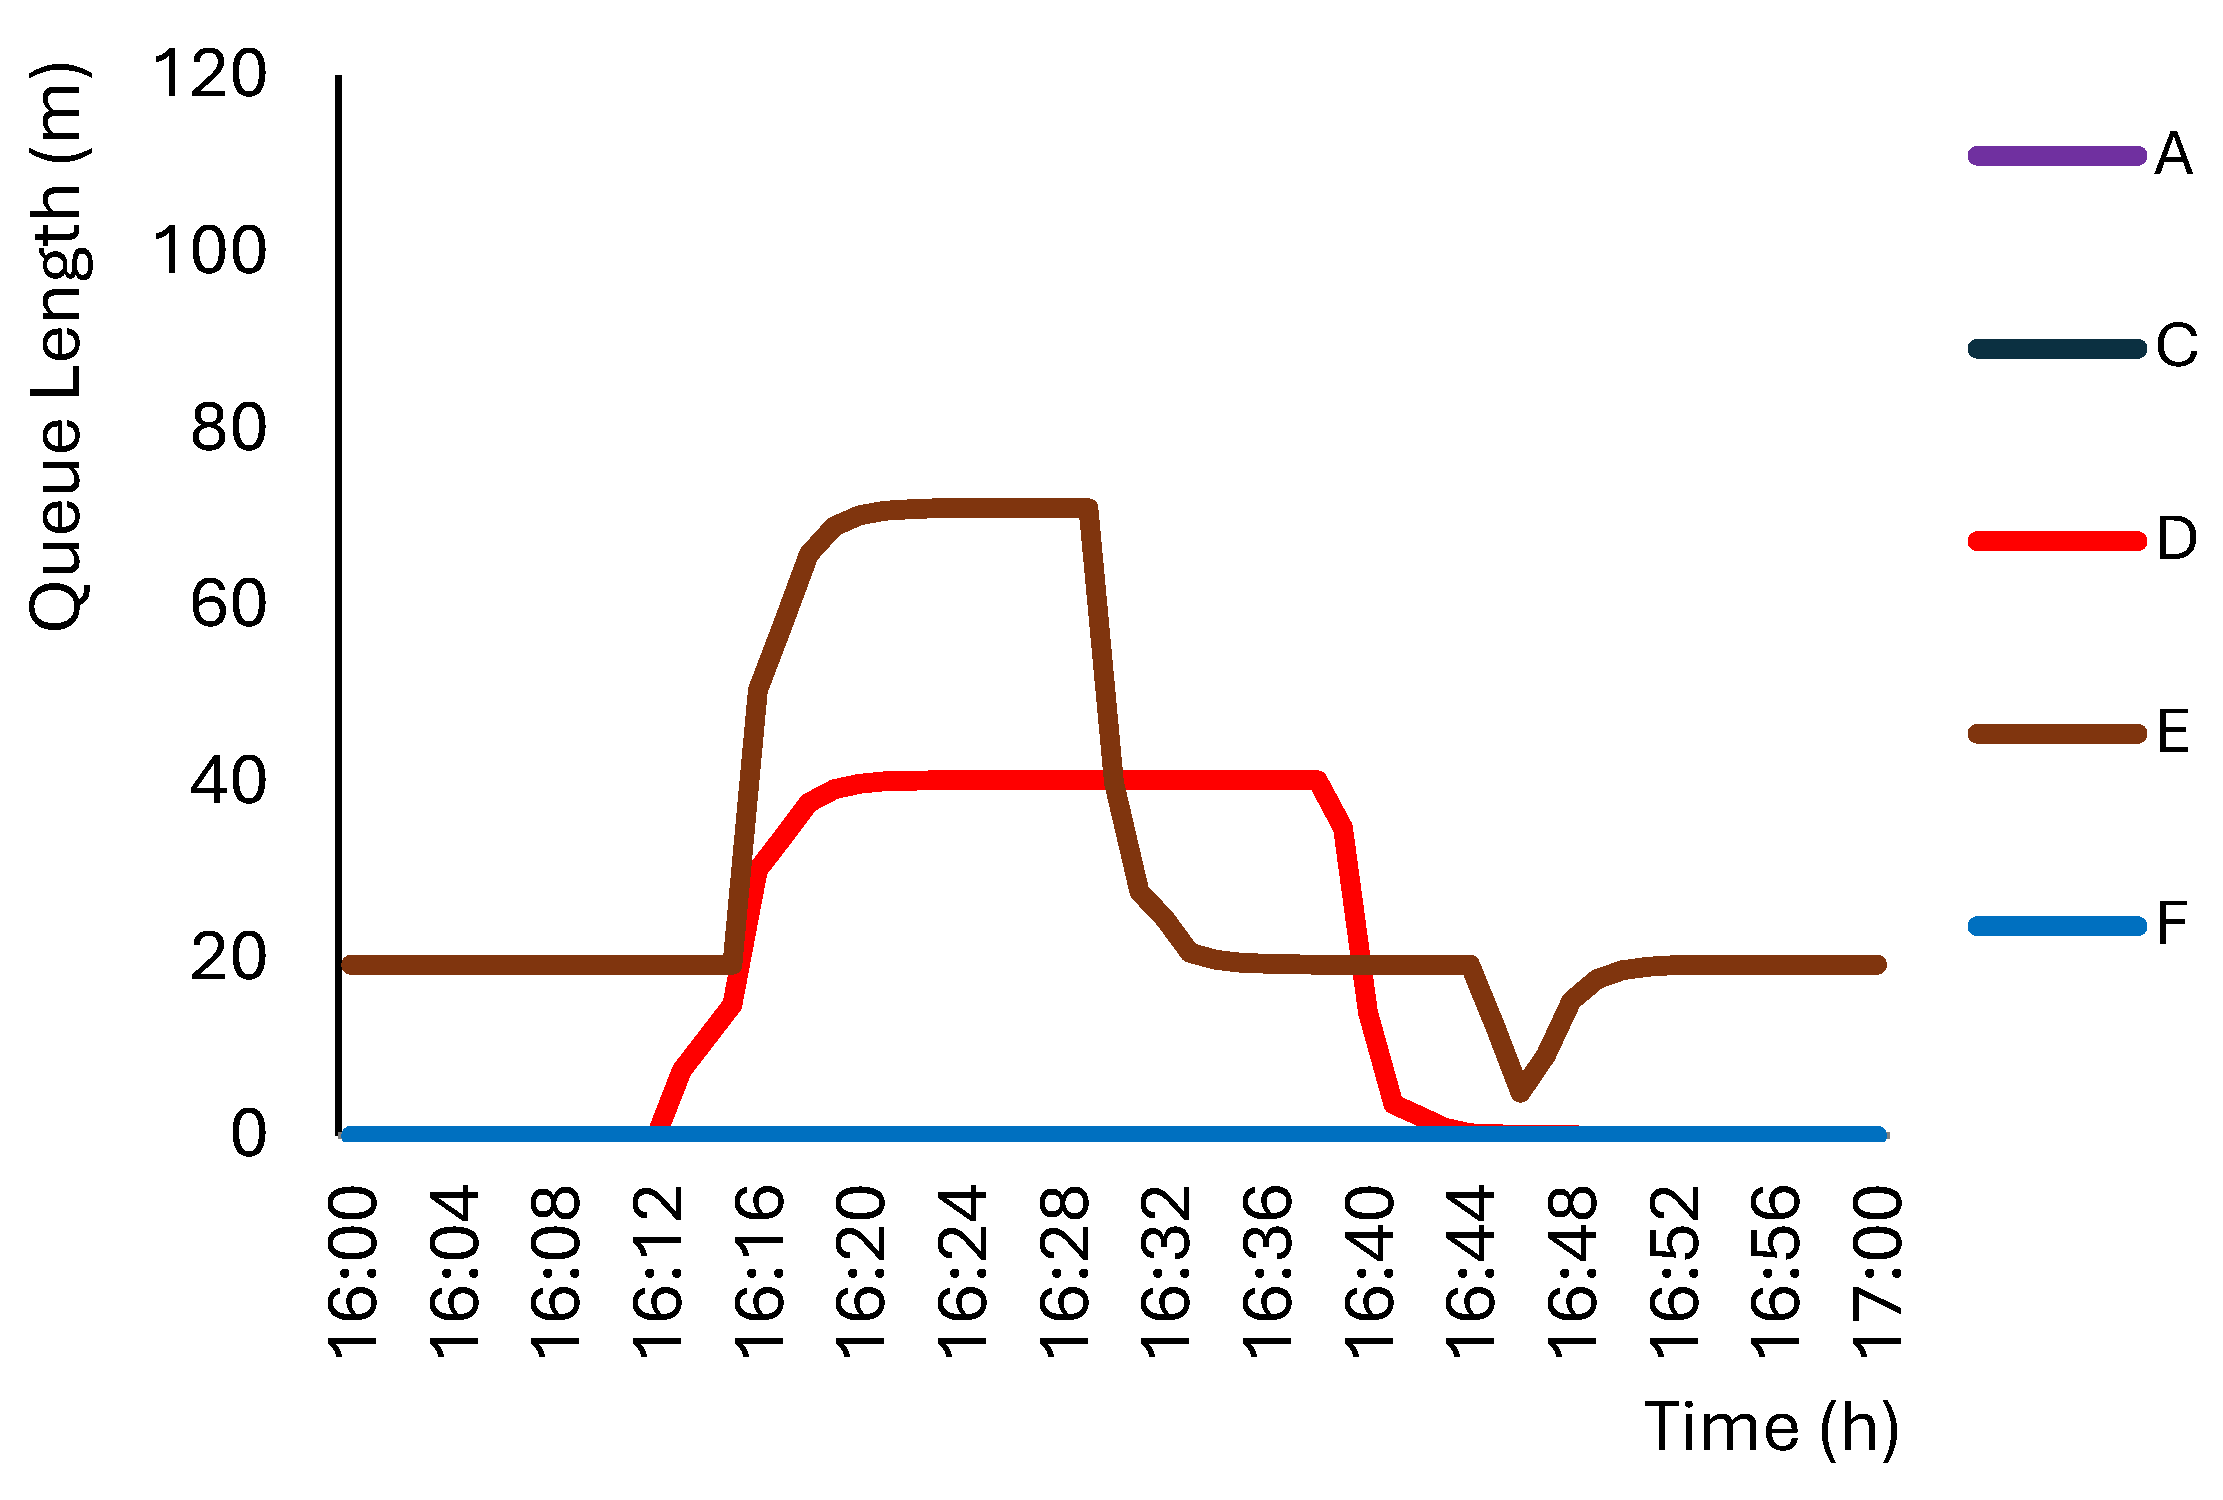
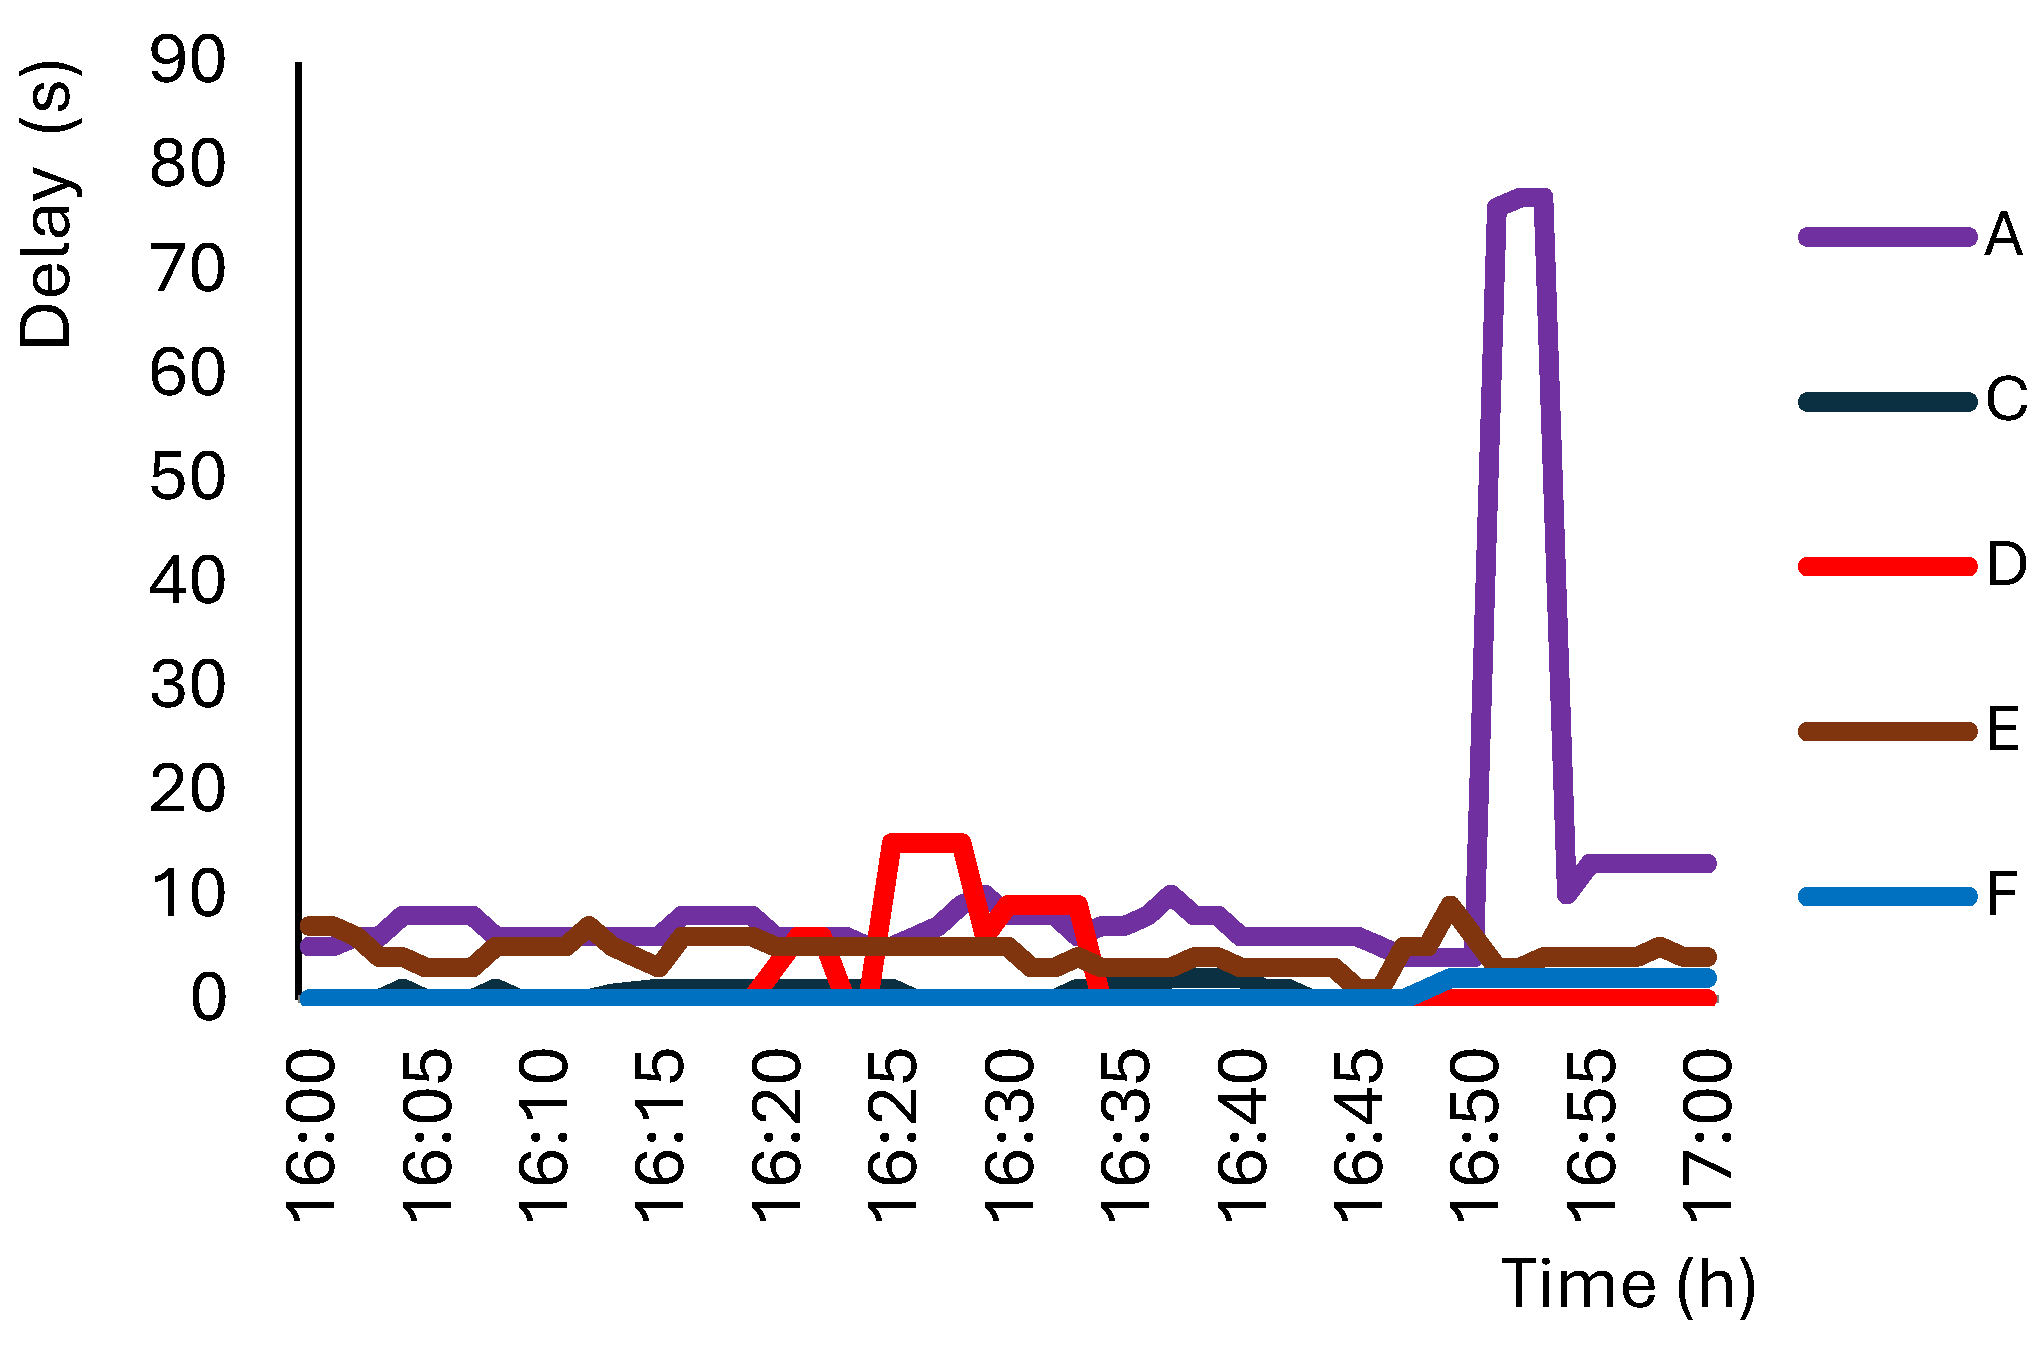
Big Data analysis was used to understand how delays (
Figure 11) and queues (
Figure 12) vary over time. The present phase concentrated on the time interval between 16:00 and 17:00 on 4 June 2025.
Figure 10 shows the identified peak traffic hours. For the analyzed case, non-zero tail lengths are observed only for approaches D and E. The remaining approaches exhibit zero tail lengths; therefore, their corresponding curves overlap in the figure and cannot be distinguished. For the UAV-based survey, the time interval between 16:00 and 17:00 was selected (Italian time zone). The UAV footage was recorded on Wednesday, 4 June 2025, from 16:34 to 16:53 (
Table 16).
For the vehicle counting analysis, approaches E and F were combined into a single approach, denoted as E*. A detailed explanation of E* is provided in
Section 6.2.
Table 17 and
Table 18 present the sample representativeness in terms of the origin–destination matrix and at the level of each individual approach, respectively.
Table 19 reports the number of vehicles estimated by the TomTom Move platform.
Table 20 is based on the origin–destination matrix structures obtained from both the manual counts and the Big Data estimates. It also reports the corresponding absolute and relative errors between the two methodologies, which are used to compute the MAE and MAPE metrics.
In
Table 21, the MAE and MAPE metrics were computed for the entire set of approaches with respect to the Big Data approach.
6.2. UAV Video and Manual Count Results
The survey’s flight altitude was estimated to be approximately 50 metres. Also in this case, the flight was conducted within the airspace defined by the NOTAM (Notice to Air Missions).
The UAV video was recorded from 16:34 to 16:53 (Italian time zone) on Wednesday, 4 June 2025. The UAV was positioned off-centre with respect to the axis passing through the roundabout’s centre. An angle of about 50° is evident in relation to the vertical axis passing through the centre of the roundabout intersection.
Figure 13 illustrates approaches A, C, D, E, and F.
It is also important to highlight that approaches E and F were aggregated into a single approach, called E*, for the purpose of vehicle counting. This decision was motivated by the spatial proximity of the approaches; being physically very near to each other, the data collected through Big Data technologies revealed an overlap in the detected traffic flows. This overlap rendered it challenging to accurately distinguish vehicles belonging to each individual approach, causing ambiguity in flow estimation. The aggregation based on E* was applied consistently to the manual counts, the results of the UAV video-processing software, and the Big Data traffic flow estimates, ensuring that all methods were compared on the same basis.
Table 22 reports the number of vehicles obtained from manual counts. The manual count was conducted using the video recorded by the UAV. The manual count was conducted between 16:34 and 16:53 (Italian time zone) on Wednesday, 4 June 2025. The utilisation of an aerial point of view facilitated the identification of the origin-destination pair for each vehicle approaching the roundabout.
Given the unreliable results of the first case study, we decided not to rely on the full O/D matrix and instead focus exclusively on the evaluation of the approaches.
In
Table 23, the MAE and MAPE metrics were computed for the entire set of approaches with respect to the UAV video-processing software approach. Even in this case study, the UAV video-processing software clearly overestimates heavy vehicle counts due to perspective distortion from non-vertical camera angles.
In
Table 23, the data processing confirmed a good estimate for approach E*, likely due to reduced angular distortion. For the remaining approaches, the percentages range from 43% to 67%. Based on the obtained results, it can be observed that the UAV camera position strongly influences the estimation of traffic flows.
6.3. Flow Comparison
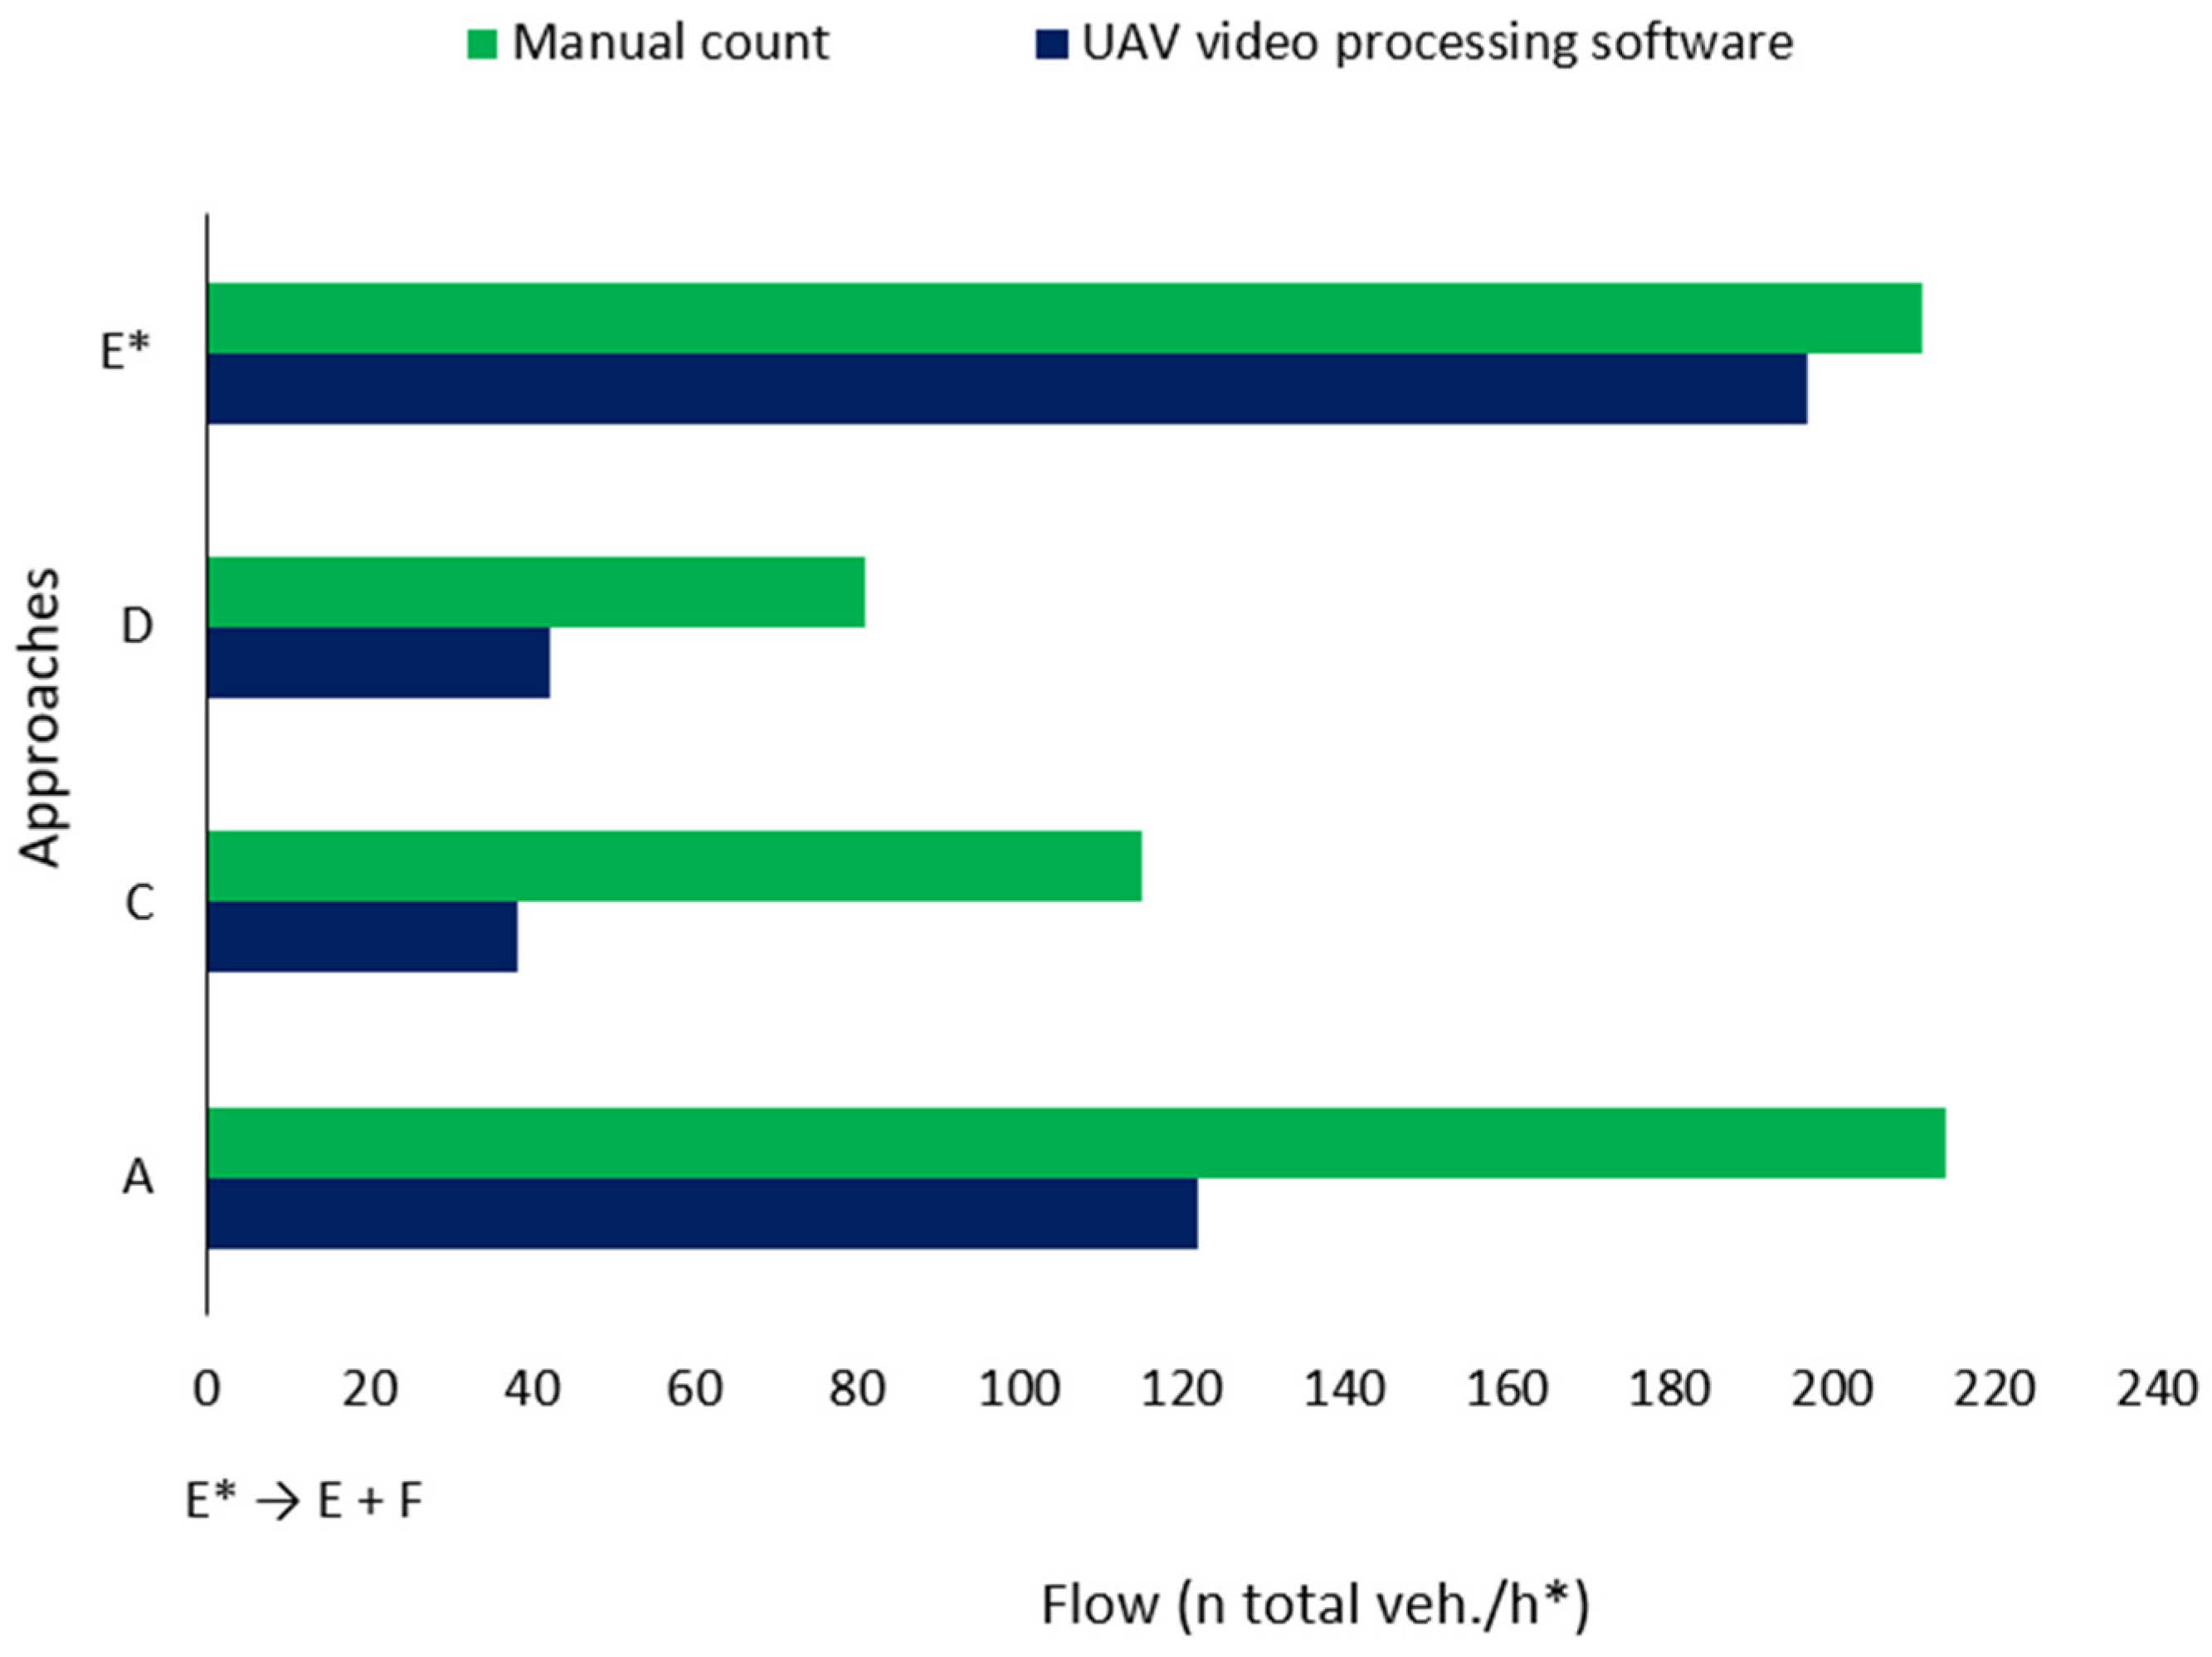
A comparative analysis of the two traffic volume detection methodologies is presented in
Figure 14.
7. Discussion
The discussion is framed around three closely related research aspects: the complementarity between UAV-based observations and Big Data traffic-monitoring technologies, the extent to which such complementarity can help mitigate the limitations associated with the individual use of each approach, and the reliability and practical applicability of the resulting traffic-flow estimates when compared with manual traffic counts. The findings from the two case studies are discussed in relation to these aspects.
A comparison of the traffic flows estimated using the two methodologies with those obtained through manual counting indicates a certain degree of discrepancy between the data derived from Big Data and those recorded manually. This discrepancy occurs because the Big Data approach analyses a sample rather than the entire population. Consequently, the statistical representativeness of the sample determines the accuracy of the results.
For the UAV-based survey, the study compared the counts produced by the UAV video-processing software with those obtained manually. In the interest of operational simplicity, this study has focused exclusively on two vehicle categories. The terms “car” and “truck” are used in this text to represent vehicles.
For the first case study (roundabout with an outer diameter of 40 m), a greater perspective distortion can be observed for approach B. The traffic movements involving approach B (B → A and B → C) were also affected by temporary vehicle occlusions caused by vegetation.
The second case study was selected to avoid potential issues in the video-processing software due to vegetation. However, in both case studies, it was not possible to eliminate the negative effects related to perspective distortion because of regulatory constraints, namely the prohibition of flying directly over road infrastructure and limitations on the maximum flight altitude. In the second case study, approaches A, C, and D show a higher degree of perspective distortion. This resulted in difficulties in vehicle recognition, as changes in vehicle shape negatively affected the performance of the video-processing software. Consequently, perspective distortion prevented the tracking of the origin-destination (OD) matrix for the second case study. Despite the complexity of the roundabout intersection (outer diameter equal to 100 m), approach E* exhibits lower perspective distortion, yielding results that are engineering-wise meaningful. Overall, the analysed case studies highlight that current UAV flight regulations represent a significant limitation to the large-scale replicability of this methodology. The study demonstrates that the utilisation of Big Data does not enable vehicle classification. The complementary use of UAVs and Big Data has been shown to support the optimisation of traffic flow estimation processes, contributing to more informed urban mobility management. In this study, two UAV flights were conducted with a viewing angle of approximately 50° from the vertical. The determination of optimal acquisition angle thresholds is left to future research. It should also be noted that regulatory constraints often prevent ideal UAV positioning (e.g., directly above the roadway), which may affect data accuracy in similar studies.
The concepts of scalability and replicability are of particular importance in this context. In terms of scalability, the use of Big Data allows for the extension of analyses to large and diverse territorial contexts. Conversely, single UAV technologies are subject to greater variability, influenced by factors such as operating conditions, flight duration, and visual coverage of the area of interest.
Regarding replicability, the Big Data approach offers a high degree of methodological replicability, as it enables the acquisition of comprehensive and continuously updated datasets through a standardised processing framework. This facilitates the timely assessment of traffic conditions and supports the identification of appropriate mitigation measures. However, the traffic volume estimates derived from TomTom Move depend on proprietary data-fusion and expansion algorithms whose formulation is not publicly disclosed. Consequently, the absolute traffic volumes reported in this study cannot be independently reproduced from the underlying probe observations, representing a limitation of the reproducibility of the Big Data-derived results. Furthermore, the combined use of the analysed technologies may present additional constraints in data acquisition, as measurements can be influenced by external factors such as weather conditions, physical obstacles, or operational limitations. Given the small sample of approximately 20 min for each traffic flow video, the application of statistical tests may not be appropriate. Therefore, the comparison between traffic flow detection technologies was primarily conducted through qualitative analysis, highlighting general trends and instances of agreement or divergence between manual and automatic counts. In the future, it is recommended to collect a larger sample in order to apply rigorous, standardised quantitative tests with greater reliability and to generalise the results. For the use of Big Data in constructing origin–destination matrices, it is necessary to consider a statistically significant time interval. OD matrices derived from only 20 min of observation do not constitute a sufficiently representative sample, as the estimated flows exhibit considerable variability. To ensure greater robustness, longer observation periods are recommended in order to improve data quality.
The comparison among the methods, in addition to enabling the estimation of origin–destination (OD) matrices, suggests that their combined use may also find application in safety-related assessments. Similarly, the complementary use of the three approaches can be framed within the broader context of economic sustainability, as it may potentially reduce the time required compared to traditional survey techniques. However, these aspects should be regarded as potential fields of application rather than outcomes directly demonstrated in the present study.
Local regulations can also impact the repeatability of the survey under identical conditions. Consequently, the scalability and replicability of the combined approach are highly dependent on the UAV technology and its application to varying contexts and boundary conditions. This study relies on commercial licences. In the case studies, the UAV flight altitude ensured privacy protection by preventing the identification of vehicle licence plates and individuals’ faces.
8. Conclusions
The use of Big Data is characterised by the ability to rapidly process large, heterogeneous datasets, enabling the identification of macroscopic traffic patterns and temporal dynamics. Conversely, UAV-based monitoring provides high spatial resolution and supports the real-time observation of localised and complex traffic behaviours.
Big Data analytics supports the identification of peak-period demand and the extraction of kinematic flow descriptors. In parallel, UAV-based video analysis, when processed using the IntuVision VA software adopted in this study, provided vehicle classification and counting estimates whose reliability depended on the quality of the video acquisition conditions. The advantages associated with the combined use of technologies highlight their complementarity in enabling the optimal use of outputs from vehicle flow monitoring.
Technological advances in the UAV image acquisition phase, such as improved angular resolution, will strengthen the correlations between manual vehicle counting and automated UAV-based video processing outputs. For future methodological extensions, congestion phenomena may be qualitatively assessed through heat-map visualisation. One implementation involves thermal imaging cameras, which detect infrared radiation independently of lighting conditions. Applied to transportation systems, thermal imagery allows the identification of highly congested areas. In this context, Li et al. [
26] employed heat maps generated by Baidu using Big Data, integrating air-pollution monitoring data with population-speed and density metrics to derive spatiotemporal distributions of average population concentration. UAVs equipped with infrared sensors represent a promising solution for high-fidelity traffic monitoring, enabling detailed and dynamic assessments of operating conditions.
Big Data facilitated the identification of daily peak periods. However, it proved insufficient for constructing a statistically meaningful O/D matrix. Consequently, the complementary use of UAV-based traffic-flow surveys is recommended. The complementary use of Big Data methodologies and UAV-derived video processing makes it possible to overcome the limitations associated with each individual traffic monitoring technology, helping to fill the gaps. Additionally, UAV footage supports real-time visual inspection and offers a level of repeatability unattainable through manual surveys. The aerial field of view ensures complete coverage of all entry and exit movements at the roundabout, a prerequisite for generating a reliable O/D matrix. In the second case study (
Section 6), significant discrepancies were observed between Big Data-derived traffic estimates and field-measured flows. Due to the limited duration of the UAV video, the proportionality across O/D pairs could not be verified, further confirming that Big Data alone cannot accurately infer O/D distributions. Despite these limitations, the analysis of large datasets remains valuable for extracting kinematic features of vehicular flows (e.g., queue lengths, delays) and for identifying peak periods, thereby informing the planning of UAV-based surveys. Even without advanced video-processing software, UAV footage provided comprehensive visual information on the roundabout geometry and traffic movements, enabling O/D matrix reconstruction (
Section 6.2). However, manual processing of UAV footage is generally onerous; in the second case study, analysing a 20 min video required approximately 18 continuous hours. UAV recordings typically span approximately 60 min due to battery-replacement constraints occurring every 30 min. This reinforces the impracticality of manual counting for large-scale or complex scenarios. Although automated image processing substantially reduces this burden, the resulting estimates were reliable exclusively for approach E*, whereas other approaches suffered from perspective distortion due to camera-positioning constraints imposed by flight-authorisation protocols. Video processing requires downloading a CSV file containing extracted vehicle trajectories and performing subsequent analysis. The temporal requirements of Big Data analysis are largely associated with data preparation within a database, where a CSV file is downloaded and pre-processed prior to analysis. Once the dataset is structured, computation is rapid. From an economic standpoint, Big Data applications incur costs related to dataset acquisition, whereas UAV-based surveys involve expenses linked to flight operations and the acquisition of video-processing software. Manual surveys incur costs that scale with the size and complexity of the study area, often requiring larger field teams and complicating O/D matrix reconstruction. Likewise, deploying fixed cameras or traditional sensors necessitates a large number of devices when monitoring complex geometries. An appropriate UAV positioning aimed at reducing perspective distortion, together with the analysis of less extensive and complex intersections or infrastructure elements, would likely allow the achievement of globally engineering-significant results.
In conclusion, the findings of this study confirm the complementary nature of UAV-based observations and Big Data traffic-monitoring technologies while highlighting the conditions under which such complementarity can mitigate the limitations associated with the individual use of each approach. Considering the MAE and MAPE values obtained in the two case studies, together with the specific survey conditions under which the data were collected, the results indicate that the benefits of this complementary use are not universal but strongly depend on the quality and suitability of the information provided by each technology. UAV-based monitoring provides reliable traffic-flow measurements under favourable survey conditions, particularly when perspective distortions and vehicle occlusions are limited. Conversely, the accuracy of Big Data estimates is influenced by the representativeness of the sampled population, although such data remain valuable for characterising mobility patterns, identifying peak traffic periods (
Section 5.1 and
Section 6.1), and supporting survey design. Therefore, the combined use of these approaches should be regarded as context-dependent, with their integration offering the greatest potential when UAV surveys can be conducted under suitable observation conditions.




 ,
,