


Abstract
Against the background of global green transition and industrial chain restructuring, the new energy vehicle (NEV) industry chain faces systemic challenges, including high resource dependence, technological constraints, and geopolitical risks. It is therefore necessary to build a sustainable resilience framework that reflects security, controllability, green development, and long-term transformation. Drawing on the resource-based view, dynamic capability theory, institutional theory, and national innovation system theory, this study constructs an integrated indicator framework based on four-dimensional capabilities and a three-level structure. The framework includes four dimensions, namely resistance, adaptive recovery, autonomous controllability, and sustainable innovation, and three structural levels, namely the node, chain, and network levels. A total of 23 secondary indicators are developed. Using the Decision-Making Trial and Evaluation Laboratory–Interpretive Structural Modeling (DEMATEL–ISM) method and scoring data from 15 industry experts, this study systematically examines the influence relationships and hierarchical structural relationships among the indicators. The results show that sustainable resilience in the NEV industry chain is not shaped by a single capability, but by the structural coordination among basic protection, adaptive recovery, autonomous controllability, and sustainable innovation. Autonomous controllability occupies a core linkage position in the framework, while network-level indicators provide important foundational support across different dimensions. This study further suggests that resilience improvement should move beyond short-term emergency response and place greater emphasis on long-term capability building, including supply security, coordinated recovery, technological autonomy, and green innovation governance. The findings provide theoretical insights and practical references for strengthening the security, controllability, and sustainability of the NEV industry chain.
1. Introduction
Against the backdrop of accelerated global green transition and deepening industrial chain restructuring, the new energy vehicle (NEV) industry has become a key field connecting transportation transformation, energy transition, and green growth. Compared with the traditional automobile industry, however, the NEV industry chain depends more heavily on critical minerals and core technologies, and is therefore more vulnerable to external shocks. On the one hand, geopolitical conflicts, trade barriers, extreme climate events, and fluctuations in resource prices have jointly disrupted the global supply of critical minerals such as lithium and cobalt, as well as core components such as power batteries and automotive chips. These disruptions have exposed the structural fragility of the industry chain, which is characterized by high dependence, high complexity, and low redundancy. The International Energy Agency points out that the global battery industry is highly concentrated in its supply of critical resources such as lithium and cobalt, with the top five supplying countries accounting for more than 80% of the market share. This means that the NEV industry chain is highly susceptible to sudden geopolitical risks. On the other hand, amid the regional restructuring of global industrial chains, the United States and Europe have strengthened resource control, technological barriers, and industrial reshoring through local-priority policies such as the Inflation Reduction Act and the Critical Raw Materials Act. These policies have further intensified the external constraints faced by China’s NEV industry in securing critical resources, achieving breakthroughs in core technologies, and maintaining supply chain security. As a result, the risks facing the NEV industry chain are no longer merely local or short-term. Instead, they have evolved into systemic shocks marked by suddenness, transmissibility, and persistence.
In this context, traditional supply chain resilience analysis, which centers on shock absorption and post-shock recovery, can no longer fully explain how the NEV industry chain maintains stable operations under long-term uncertainty [1,2]. For such a complex industrial system, which is resource-intensive, technology-intensive, and closely linked to green transition, an exclusive emphasis on recovery capacity is insufficient to support long-term development. By contrast, sustainable resilience places greater emphasis on the integration of stress resistance, adaptive capacity, and long-term evolutionary capability under external disturbances. It therefore provides a more appropriate analytical perspective for understanding how the NEV industry chain can achieve a dynamic balance among risk prevention, green transition, and technological upgrading. For the NEV industry, building sustainable resilience is not only related to the risk governance capacity of green supply chains, but also to the coordinated realization of low-carbon transition, industrial upgrading, and strategic security objectives [3,4,5,6].
Existing studies have discussed this issue from the perspectives of supply chain resilience, sustainable supply chain resilience, and the security and resilience of the NEV industry chain. These studies provide an important basis for understanding how complex industrial systems respond to external shocks. However, three limitations remain [7,8,9,10,11]. First, the capability dimensions are still insufficient. Existing studies mainly focus on traditional resilience capabilities, such as redundancy allocation, flexible response, and emergency recovery. They pay less attention to autonomous controllability and sustainable innovation, which are especially important for the NEV industry. As a result, these studies cannot fully respond to the dual requirements of short-term disruption resistance and long-term transformation. Second, the hierarchical relationship remains unclear. Many studies have identified important factors, such as policy support, R&D investment, and supply diversification. However, most of them do not further clarify the influence relationships and hierarchical relationships among different factors. Therefore, it is still difficult to determine which factors serve as fundamental supports, which factors are only external manifestations, and where resilience improvement should begin. Third, the structural perspective remains incomplete. Existing research generally lacks an analytical framework that embeds resilience capabilities into the three-level structure of nodes, chains, and networks. It has not fully integrated firm-level resource endowments and innovation capabilities, industry-level operating mechanisms and institutional support, and network-level ecological coordination and structural linkages within a unified framework. This also makes it difficult to identify the interactions among different levels.
Based on the above limitations, this study focuses on the following core questions. What key capability dimensions should constitute the sustainable resilience of the NEV industry chain? How should these capability dimensions be embedded into the node level, chain level, and network level to form a systematic analytical framework that reflects the operating characteristics of the industry chain? In the context of intertwined multidimensional capabilities and multi-level structures, are there clear influence relationships and hierarchical structural relationships among different indicators? To answer these questions, this study draws on the resource-based view, dynamic capability theory, institutional theory, and national innovation system theory. It constructs a four-dimensional capability framework consisting of resistance, adaptive recovery, autonomous controllability, and sustainable innovation. This framework is further embedded into a three-level structure of the node level, chain level, and network level, forming a comprehensive evaluation framework for the sustainable resilience of the NEV industry chain. On this basis, this study identifies 23 secondary indicators that capture the key factors shaping the sustainable resilience of the NEV industry chain through literature review and expert consultation. It then applies the integrated DEMATEL–ISM method to examine the influence relationships and hierarchical structural relationships among these indicators. Finally, this study provides practical suggestions for improving the sustainable resilience of China’s NEV industry chain.
The contributions of this study are mainly reflected in three aspects. First, this study focuses on the NEV industry chain, a typical strategic emerging industry. It extends sustainable resilience research from general supply chain contexts to a complex industrial setting shaped by resource constraints, technological competition, and green transition. Second, this study proposes a comprehensive analytical framework of “four-dimensional capabilities × three-level structure.” This framework integrates short-term disruption resistance, long-term adaptation, strategic autonomy, and green innovation into a unified analytical system. It therefore expands the analytical scope of existing resilience research in terms of both capability dimensions and structural levels. Third, this study applies the DEMATEL–ISM method to examine the influence relationships and hierarchical structural relationships among the 23 indicators. This helps clarify the role and position of different indicators in the sustainable resilience system of the NEV industry chain. It also provides more targeted practical evidence for resilience improvement. Overall, this study develops a sustainable resilience framework tailored to the NEV industry chain, providing insights for addressing the challenges of global supply chain restructuring and strengthening industry chain resilience during the green transition.
2. Literature Review
2.1. From Traditional Resilience to Sustainable Resilience
The concept of resilience has evolved from engineering resilience to ecological resilience and then to social-ecological resilience. Early engineering resilience emphasizes the ability of a system to maintain stability and quickly return to its original equilibrium after external shocks, with resistance, recovery, and return as its core logic [12]. Ecological resilience further focuses on the ability of a system to shift among multiple stable states, suggesting that external shocks are not only short-term disturbances but may also lead to deeper changes in system structure and operating logic [13]. Social-ecological resilience research incorporates adaptation, learning, self-organization, and transformation into the analytical framework, extending the meaning of resilience from “post-shock recovery” to the capacity of a system to adjust and restructure under uncertainty [14].
In the field of supply chain management, early resilience research mainly focused on disruption risk management and emphasized improving shock resistance through redundancy, supply diversification, flexible production, and rapid response [15]. Existing studies have explained how firms and supply chain systems respond to risks such as natural disasters, public health crises, armed conflicts, and logistics disruptions from the perspectives of robustness, recovery, flexibility, and adaptability [16,17]. In recent years, as climate change, resource constraints, and green transition pressures have intensified, scholars have gradually recognized that supply chain resilience should not only serve short-term recovery, but should also consider long-term goals such as economic efficiency, environmental responsibility, and social equity. Sustainable supply chain resilience has therefore become a new research direction. It no longer only asks whether a system can recover, but further asks how the system recovers and whether the recovered system becomes more sustainable [4,5].
Compared with traditional supply chain resilience, sustainable supply chain resilience is not limited to functional recovery after disruptions. It places greater emphasis on how supply chains respond to shocks while maintaining broader development goals. In other words, traditional resilience focuses more on whether a system can recover, whereas sustainable resilience further concerns how recovery is achieved and whether the system becomes more stable, adaptive, and sustainable after recovery. Existing studies have developed this topic along three main lines. First, from the perspective of capability dimensions, scholars have described sustainable supply chain resilience in terms of resistance, recovery, adaptation, and transformation. This view suggests that supply chains should not only defend against shocks, but also learn, adjust, and evolve through them [4]. Second, from the perspective of performance goals, researchers argue that resilience improvement should not focus only on efficiency or short-term stability. It should also consider broader goals such as environmental responsibility, social value, long-term competitiveness, and sustainable transformation [5]. Third, from the perspective of complex systems and governance, recent studies have incorporated network structure, multi-actor coordination, institutional environment, feedback learning, and governance capacity into the analytical framework [18]. These studies show that supply chain resilience is not only a firm-level capability, but also a systemic property formed through interactions among multiple actors.
Although existing studies have shifted supply chain resilience research from risk response toward sustainable development, their explanatory power remains limited in the context of strategic emerging industries. Most existing sustainable resilience frameworks are developed for general manufacturing industries or common supply chains, and they usually treat external shocks as sudden and recoverable disturbances, such as natural disasters, pandemic shocks, or logistics disruptions. However, the uncertainty faced by the NEV industry chain is not only a short-term disruption, but also a structural constraint shaped by the concentration of critical resources, dependence on core technologies, industrial policy competition, and pressure for low-carbon transition. In this context, rapid recovery remains important, but it is more critical for the industry chain to maintain stable operations under resource constraints, strengthen autonomous capability in technological competition, and develop continuous innovation capability during the green transition. Therefore, the NEV industry chain requires a broader understanding of sustainable resilience that reflects strategic security, dynamic adaptation, and sustainable development.
2.2. Industry-Specific Characteristics and Research Progress of Sustainable Resilience in the NEV Industry Chain
The challenges faced by the NEV industry chain are different from general supply chain disruptions. Compared with traditional manufacturing supply chains, the NEV industry chain has stronger resource dependence, higher technological complexity, and closer upstream and downstream linkages. Its upstream sector depends heavily on critical minerals such as lithium, cobalt, nickel, and graphite, as well as key components such as separators, electrolytes, cathode and anode materials, and automotive-grade chips. The midstream sector involves power battery manufacturing, vehicle integration, intelligent manufacturing, and electronic control systems. The downstream sector extends to sales and services, charging and battery-swapping infrastructure, power battery recycling, and cascade utilization. This closely connected industrial structure means that the resilience of the NEV industry chain depends not only on the risk resistance of individual firms, but also on the global resource supply pattern, the autonomy of key technologies, the efficiency of industry chain coordination, the policy and institutional environment, and the green innovation ecosystem [10]. More importantly, the NEV industry chain itself undertakes the task of low-carbon transition. Its resilience building cannot focus only on supply stability and production recovery. It must also address resource recycling, environmental impacts, green innovation, and long-term sustainable development. Therefore, the resilience of the NEV industry chain has clear sustainability characteristics.
Based on these features, existing studies have discussed the vulnerability and resilience building of the NEV industry chain from several perspectives. First, some studies focus on the security of upstream critical minerals and core materials. They mainly examine the global distribution, trade dependence, and potential supply disruption risks of strategic resources such as lithium, cobalt, and nickel. They also discuss response measures such as resource source diversification, import diversification, local substitution, recycling, and strategic reserves [19,20,21,22]. These studies provide an important basis for understanding resource security in the NEV industry chain. However, they still focus mainly on resource supply risks themselves. Less attention has been paid to how control over critical minerals affects industry chain stability, technological autonomy, resource recycling, and green transition at the same time.
Second, studies on the battery supply chain and core technologies further reveal the strategic vulnerability of the NEV industry chain. The NEV industry chain depends not only on critical minerals, but also on key links such as power batteries, drive motors, electronic control systems, automotive-grade chips, battery management systems, intelligent driving, operating systems, and charging technologies. Power batteries determine the cost structure, driving range, safety performance, and technological route of NEVs. Their supply chain also involves material research and development, cell manufacturing, module assembly, battery management systems, and recycling. Existing studies have discussed battery supply chain resilience from the perspectives of capacity layout, cost control, supply security, recycling, and green manufacturing. They have also examined the chokepoint risks caused by technological blockades, standards barriers, and trade restrictions [23,24,25,26,27]. However, this line of research still focuses more on single technological links or local governance issues. It pays insufficient attention to the systematic connections among the battery supply chain, vehicle manufacturing, resource recycling, infrastructure, policy systems, and green performance.
Third, industrial policy and the institutional environment are also important topics in research on NEV industry chain resilience. The NEV industry is strongly policy-oriented. Subsidy policies, dual-credit policies, green finance, innovation funds, charging infrastructure construction, carbon emission regulations, and international trade rules all affect firms’ R&D investment, capacity layout, and supply chain choices [28,29]. Related studies suggest that changes in the institutional environment influence the localization of key technologies, the internal circulation capacity of supply chains, and firms’ strategic positions in global value chains [30,31]. These studies show the important role of policy and institutional factors. However, it remains necessary to further explain how policy support, institutional adaptation, and industry chain coordination jointly affect the autonomy, controllability, and sustainable development capacity of the industry chain.
Finally, studies on green transition, recycling, and sustainable supply chain resilience provide important insights into the long-term resilience of the NEV industry chain. NEVs are closely related to low-carbon transition, but their industry chain is not naturally sustainable. Energy consumption in power battery production, environmental impacts from critical mineral extraction, waste battery recycling and treatment, and the energy structure of charging infrastructure may all affect the green performance of the NEV industry [10,26]. Existing studies have emphasized that sustainable supply chain resilience should balance multiple goals, including supply stability, economic efficiency, environmental responsibility, social value, and long-term transformation. They also point out that green innovation is an important mechanism for achieving long-term sustainable transformation [5,15]. However, most of these studies focus on general supply chains. They do not fully explain how supply security, technological autonomy, recycling, green innovation, and environmental performance jointly support sustainable resilience in the NEV industry chain.
Overall, existing studies have identified important issues in the resilience building of the NEV industry chain from the perspectives of critical minerals, battery supply chains, core technologies, industrial policy, and green transition. However, this research remains somewhat fragmented. On the one hand, different studies often focus on a specific link in the industry chain or a specific type of risk. They lack an integrated analysis covering resources, technologies, institutions, and green innovation. On the other hand, existing research is mainly conducted from the perspective of firm management or single-link governance. It pays limited attention to the interactions among the global macro environment, the meso-level industry structure, and firm-level capabilities. At the same time, although some studies have begun to discuss green transition and recycling, most research still focuses on supply security and recovery capacity. There is still a lack of systematic discussion on how sustainability goals and resilience goals can be coupled. Therefore, the sustainable resilience of the NEV industry chain goes beyond risk resistance and production recovery, reflecting broader requirements for resource security, technological autonomy, network coordination, green innovation, and low-carbon transition.
2.3. Theoretical Resources for Constructing Sustainable Resilience in the NEV Industry Chain
Several classic theories in management and political economy provide useful theoretical resources for addressing the above gaps from different perspectives.
First, the resource-based view helps explain the resilience foundation under critical resource constraints. This theory argues that firms’ sustained competitive advantage comes from resources that are valuable, rare, difficult to imitate, and difficult to substitute [32,33,34]. This perspective is directly relevant to understanding resource security in the NEV industry chain. When firms face price fluctuations in critical minerals, import restrictions, or logistics disruptions, their financial reserves, inventory buffers, localized supply systems, and capacity to secure key components directly affect their ability to maintain basic operations in the early stage of a shock [6,35,36]. From the perspective of sustainable development, a stable resource base is not only a source of short-term shock resistance, but also a precondition for green technology R&D, recycling system development, and long-term industrial upgrading.
Second, dynamic capability theory helps explain adjustment and recovery under uncertainty. Teece (2007) points out that firms need to respond to environmental changes through sensing, seizing, and reconfiguring [37]. Unlike the resource-based view, which focuses on “what resources a firm owns”, dynamic capability theory pays more attention to “how resources are mobilized and reconfigured”. In the NEV industry chain, external shocks are often not one-time disturbances. They may be accompanied by demand changes, supply restructuring, technological iteration, and policy adjustment. Whether firms can quickly adjust production plans, optimize resource allocation, rebuild supply channels, and restore market response reflects their dynamic adaptive capability [38,39]. At the same time, the NEV industry chain has close upstream and downstream linkages, so the recovery process also depends on systemic mechanisms such as logistics scheduling, supplier coordination, emergency sharing, and cross-node resource allocation [24,40]. Therefore, sustainable resilience in the NEV industry chain should not remain at the level of “returning to the original state.” It should also consider whether the industry chain can achieve resource reconfiguration, structural optimization, and continuous adaptation during recovery.
Third, institutional theory helps explain the formation of operating conditions and strategic autonomy in the industry chain. Scott (2013) points out that organizational behavior is jointly shaped by formal rules, informal norms, and the institutional environment [41]. The NEV industry chain is strongly policy-oriented and strategic. Breakthroughs in core technologies, substitution of key materials, green finance support, and localized supply system development do not depend only on firms’ own capabilities. They are also influenced by industrial policies, innovation funds, local institutional arrangements, and international trade rules [28,29]. Against the background of technological blockades, trade barriers, and stronger global industrial policy competition, the institutional environment directly affects the localization of key technologies, the internal circulation capacity of supply chains, and the strategic initiative of the industry chain [30,31]. Sustainable resilience in the NEV industry chain needs to go beyond firm efficiency and supply recovery, and should include institutional adaptation, policy support, and strategic autonomy in the analysis.
Finally, national innovation system theory helps explain the mechanism of continuous innovation under the pressure of green transition. This theory argues that innovation is not an isolated activity of a single firm, but a systemic process involving firms, governments, universities, research institutions, financial institutions, and other actors. Its core lies in knowledge flows, institutional support, and collaborative networks. The green transition of the NEV industry involves many fields, including power batteries, intelligent manufacturing, charging infrastructure, low-carbon materials, recycling, and the coordination of clean energy. It is difficult for a single firm to complete such systemic innovation alone. Existing studies also show that green innovation capability is reflected not only in firms’ R&D investment and patent output, but also in upstream and downstream coordination, the diffusion of innovation culture, and knowledge sharing among multiple actors [8,42,43]. Therefore, sustainable resilience in the NEV industry chain does not only mean maintaining stable operations. It also means achieving long-term transformation through green technological progress, knowledge diffusion, and collaborative innovation.
Overall, the above theories reveal the expanded meaning of sustainable resilience in the NEV industry chain from different levels. The resource-based view emphasizes resource security and basic capabilities. Dynamic capability theory emphasizes adjustment and reconfiguration under environmental change. Institutional theory emphasizes institutional conditions and strategic autonomy. National innovation system theory emphasizes collaborative innovation in the green transition. Together, these theories suggest that resilience in the NEV industry chain should not be limited to risk resistance and functional recovery in traditional supply chain research. It should also focus on the coordination among resources, capabilities, institutions, and innovation. Based on this theoretical logic, future analysis needs to build a sustainable resilience framework that reflects the requirements of stable operation, dynamic adjustment, strategic autonomy, and green transition at the same time.
2.4. Research Gaps
Based on the above literature, two main research gaps can be identified. First, existing studies have not fully explained sustainable resilience in the NEV industry chain by taking its industry-specific characteristics into account. Although research has extended traditional supply chain resilience to sustainable supply chain resilience, most studies still focus on general dimensions such as robustness, recovery, flexibility, and adaptability. They pay insufficient attention to the specific needs of the NEV industry chain, including resource security, technological autonomy, institutional adaptation, and green innovation [4,5]. At the same time, studies on critical minerals, battery supply chains, industrial policy, and green transition have revealed different sources of risk in the NEV industry chain. However, most of these studies focus on a single link or a single issue. A comprehensive framework that can explain resource security, technological autonomy, institutional competition, and green innovation at the same time has not yet been fully developed. This makes it difficult for existing research to explain why the NEV industry chain should not only pursue recovery efficiency, but also place greater emphasis on autonomy, controllability, and sustainable innovation.
Second, the identification of levels within the industry chain and the influence relationships among resilience-related factors remains insufficient. Existing studies often start from the perspective of firms or a single link in the industry chain. They separately discuss factors such as resource reserves, manufacturing recovery, logistics substitution, policy support, R&D investment, and recycling. Few studies integrate the node, chain, and network levels into a unified analytical framework [18]. In addition, although existing studies have identified various resilience-related factors, the influence relationships and hierarchical structure among these factors have not been fully revealed [15]. As a result, existing research can often answer which factors are important, but it is less able to explain which factors are more fundamental and through which structural paths the sustainable resilience of the NEV industry chain can be improved.
To address these gaps, this study constructs an indicator framework for the sustainable resilience of the NEV industry chain. The framework responds to the specific requirements of the NEV industry chain. On this basis, this study identifies key indicators through literature review and expert consultation, and applies the DEMATEL–ISM method to examine the influence relationships and hierarchical structure among these indicators. The resulting framework provides a systematic basis for the theoretical analysis and practical improvement of sustainable resilience in the NEV industry chain.
3. Construction of the Sustainable Resilience Indicator Framework and Research Method
3.1. Construction of a Sustainable Resilience Indicator Framework Based on Four-Dimensional Capabilities and a Three-Level Structure
The above analysis suggests that the sustainable resilience of the NEV industry chain may involve not only stable operation under short-term shocks, but also dynamic adjustment under uncertainty, autonomous control over key links, and continuous innovation during the green transition. Based on this understanding, we construct a four-dimensional capability framework consisting of resistance, adaptive recovery, autonomous controllability, and sustainable innovation. At the same time, considering that the resilience of the new energy vehicle industry chain is reflected not only in firm-level resources and capabilities, but also in the efficiency of upstream and downstream linkages and the level of industrial network coordination, we further embed the four-dimensional capabilities into a three-level structure of nodes, chains, and networks. In doing so, it develops a four-dimensional capability and three-level structure indicator system for the sustainable resilience of the NEV industry chain. From the dual perspectives of functional dimensions, including static defense, dynamic recovery, autonomous controllability, and green innovation, and structural levels, including nodes, chains, and networks, this indicator framework identifies the key indicators of industry chain resilience. The meaning and theoretical support of each indicator are further clarified through literature review.
- (1)
- Resistance
Resistance measures the static defense and buffering capacity of a system when it faces sudden external shocks, such as pandemics, geopolitical conflicts, and raw material price fluctuations [6,44]. The resource-based view emphasizes that the scarce and inimitable resources owned by firms, such as production capacity, technology, and human capital, are key to building competitive advantage and resisting risks [33,35,45]. Supply chain resilience theory further suggests that redundancy, such as diversified suppliers and local spare parts reserves, together with flexibility and risk perception mechanisms, constitute the core pillars of resistance [38,46,47,48,49].
At the node level, firms’ main business revenue and profit levels represent their ability to mobilize internal resources and serve as important indicators for evaluating financial robustness. Barney (1991) argues that financial and asset strength, as scarce resources, form the foundation of firms’ risk resistance capacity [32]. The empirical study by Yusuf et al. (2014) [50] shows that financial health is the “first line of defense” for improving system stability. Inventory turnover reflects firms’ emergency reserve capacity and operational flexibility [50]. Although high inventory may increase cost pressure, it can provide a crucial buffer in disruption scenarios [16,51]. Torres-Rivera (2023) further proposes that through a “dynamic redundancy” management strategy, key component firms can strike a balance between efficiency and security [10]. The localization rate measures the system’s degree of external dependence. A higher level of localization can reduce uncertainty caused by geopolitical risks or import restrictions [21,22,52].
At the chain level, resistance is influenced by the flexibility of industrial organization and the diversity of supply sources. Product entry thresholds reflect the openness of the system to new entrants. Grumiller et al. (2021) propose adjusting regulations and institutions to accelerate the market entry of new producers [53]. The import and export market environment, such as customs clearance convenience, tariff systems, and international cooperation, directly affects the recovery efficiency of supply chains [54]. Pettit et al. (2010) point out that in highly uncertain environments, a redundant chain structure is a key strategy for maintaining system stability [47].
At the network level, the system’s pressure-bearing and recovery capacity depends on network structure and the distribution of node roles. A higher collaborative network density indicates stronger alternative path availability and resource coordination capacity, which helps maintain continuous system operations [55,56]. Structural concentration can be measured by degree centrality, which reflects the distribution of key nodes [18,57,58]. If supply dependence is excessively concentrated, disruption to a core node may substantially weaken overall resistance and generate a bottleneck effect.
- (2)
- Adaptive Recovery
Adaptive recovery reflects the system’s ability to quickly repair production networks, restore supply, and respond to market demand after a shock. Dynamic capability theory emphasizes that firms need to possess environmental sensing, opportunity seizing, and resource reconfiguring capabilities in order to respond flexibly and maintain continuous adaptation [37,59]. Ponomarov and Holcomb (2009) point out that recovery capability derives not only from firms’ internal capabilities, but also from multi-actor coordination mechanisms, including emergency response, resource sharing, logistics scheduling, and trust mechanisms [38].
At the node level, NEV sales and their year-on-year growth rate directly reflect market recovery and the pace of firms’ resumption of work and production, thereby indicating their ability to maintain operations during crises [17,60,61]. The production recovery period is a key indicator that measures the time span from production suspension to capacity reconstruction, and provides an important reference for designing post-disruption recovery pathways [6,62,63].
At the chain level, recovery capability is constrained by the completeness of the industrial and trade environment, as institutional support and resource accessibility determine recovery efficiency [6,64,65,66]. At the same time, technological distance and spatial distance reflect the degree of chain coupling. Knowledge relatedness and geographical proximity can improve the efficiency of collaborative recovery [67,68,69]. The substitutability of logistics channels reflects the supply chain’s capacity for flexible reconfiguration under transportation disruption or regulatory control, and is a key guarantee for diversifying recovery pathways [70,71].
At the network level, recovery depends on the system structure’s capacity for coordinated resource scheduling. Resource scheduling capacity represents the network’s ability to rapidly allocate labor, materials, and other resources across different nodes. It is critical for responding to sudden disturbances and reconfiguring operational mechanisms [72]. This capacity can generally be measured using closeness centrality, which captures the average length of the shortest paths among nodes. An improvement in closeness centrality helps accelerate the flow of information and resources and thereby promotes the recovery process.
- (3)
- Autonomous Controllability
Autonomous controllability emphasizes the system’s ability to achieve local substitution and strategic control when facing external rule restructuring, technological barriers, and trade blockades [73,74,75]. From an institutional perspective, policy support, institutional arrangements, and industry rules are key guarantees for strengthening system autonomy [76].
At the node level, dependence on imported raw materials measures the system’s vulnerability to external markets. In the NEV industry, import dependence on critical resources such as lithium, cobalt, and nickel has become a major hidden risk that constrains system security [9,19,20]. The share of self-developed key core technologies serves as a pathway for addressing bottleneck problems. It directly reflects firms’ autonomous control over key components and control systems, and is a strategic indicator for achieving local substitution in core segments [25,26,27].
At the chain level, trade competitive advantage and the revealed comparative advantage index can be used to identify firms’ structural position and bargaining power in the global division of industrial labor [77]. At the same time, financial service capacity acts as a supporting guarantee for autonomous controllability, determining whether the system has the financial foundation needed for technological R&D and scale expansion [8,78,79,80].
At the network level, betweenness centrality reflects the resource-channel position of firms in the overall industry chain network. A higher value indicates that a firm plays a more important hub role in information flows and resource flows, and thus possesses stronger resource coordination and strategic guidance capacity [18,81].
- (4)
- Sustainable Innovation
Sustainable innovation evaluates the system’s ability to conduct green R&D, promote technology commercialization, and support talent development in the context of green transition [5,15,82,83]. National innovation system theory argues that innovation is a systemic process jointly advanced by multiple actors, including firms, research institutions, governments, and financial organizations [84]. Green innovation theory and ESG concepts further emphasize that environmental friendliness and institutional coordination are core mechanisms for achieving high-quality green development.
At the node level, firms’ R&D input and output capacity are important indicators for measuring green technology accumulation and commercialization. Among them, the number of patents and the patent commercialization rate reflect the practical implementation capacity of R&D outputs [5,85,86,87]. In addition, talent development reveals the speed of innovation resource accumulation and the level of talent pipeline construction from the perspectives of human capital and financial input. It reflects firms’ endogenous innovation potential in the green transition [88,89], and can be measured by the proportion of R&D personnel and the proportion of employees with master’s or doctoral degrees. Green enterprise certification can also be used to reflect firms’ environmental compliance and ESG governance performance [90,91].
At the chain level, the institutional and resource environment constitutes a key foundation for innovation diffusion. The intensity of industrial policy support, such as fiscal, tax, and financial incentives, is a core external driver of innovation [92,93,94]. Infrastructure completeness determines the technological and logistical accessibility of green R&D, and serves as a material prerequisite for supporting the long-term evolution of innovation [95,96].
At the network level, the diffusion rate of innovation culture reflects the breadth and depth of the spread of environmental concepts and technical standards within the industrial network. It is a key indicator for measuring the efficiency of green knowledge diffusion and the vitality of the innovation ecosystem [97,98,99].
In summary, this study constructs a sustainable resilience indicator framework for the NEV industry chain, including four primary dimensions and 23 secondary indicators, as shown in Table 1. Detailed definitions, theoretical roles, measurement logic, and dimension-level assignment rationales for all indicators are provided in Appendix A.
Table 1.
Sustainable Resilience Indicator Framework and Indicator Descriptions for the NEV Industry Chain.
3.2. Research Method
To deeply examine the internal relationships and mechanisms among the dimensions and specific indicators of resilience in the NEV industry chain, this study adopts an integrated system analysis method combining DEMATEL, namely the Decision-Making Trial and Evaluation Laboratory, and ISM, namely Interpretive Structural Modeling. This approach fully leverages the complementary advantages of the two methods. The sustainable resilience of the NEV industry chain has the characteristics of a complex system, including multidimensionality, strong interdependence, and nested hierarchy. Therefore, the focus of this study is not to estimate the marginal effect of a single factor, but to identify key driving factors and their transmission pathways. DEMATEL can capture the direction and strength of influence among different indicators and identify the core drivers within the system [100]. ISM can further reveal the hierarchical relationships and structural levels among these indicators [101]. By combining the two methods, this study can identify both the relative importance and influence relationships of the indicators and the hierarchical progression logic within the system. Therefore, the integrated DEMATEL-ISM approach is well suited to the structured analysis of sustainable resilience in the NEV industry chain [101,102,103].
The specific implementation process is based on the 23 secondary resilience indicators constructed in this study. First, experts from the new energy vehicle industry, including corporate executives, researchers from research institutes, and experts from industry associations, are invited to form an expert consultation panel. Detailed information on the expert consultation panel is provided in Appendix B. Through expert consultation, the pairwise influence relationships among all indicators are evaluated, and the arithmetic mean of expert scores is used to construct the initial direct influence matrix. Second, the direct influence matrix is normalized to eliminate differences in scale, and the total influence matrix is then calculated. On this basis, the influencing and influenced degrees, centrality, and causality are obtained, which helps clarify the importance and the influence relationships among indicators in the resilience framework. Finally, the reflexive total influence matrix and reachability matrix are constructed. By setting a threshold value λ, weak influence relationships are removed, and the hierarchical levels of the indicators are identified. This process ultimately reveals the internal relationships and hierarchical distribution of the indicators in the sustainable resilience system of the NEV industry chain. The detailed operational steps of the integrated DEMATEL–ISM analysis are provided in Appendix C.
4. Results Analysis
Based on the DEMATEL-ISM method, this study first invited 15 experts from the new energy vehicle industry to form an expert consultation panel. Through the combination of expert consultation and scientific calculation, the direct influence matrix was constructed. The matrix was then transformed into the normalized influence matrix and the total influence matrix according to the relevant calculation formulas. Based on the calculation results, the influencing factors were further classified into different hierarchical levels to clarify their interaction relationships and structural hierarchy.
4.1. Overall Analysis of the Four Dimensions
4.1.1. DEMATEL Results for the Four Dimensions
This section first analyzes the relationships among the four primary indicators, namely resistance (R1), adaptive recovery (R2), autonomous controllability (R3), and sustainable innovation (R4). The arithmetic mean of the scores assigned by all experts to each factor was first calculated. The values were then rounded to four decimal places, resulting in the direct influence matrix shown in Table 2, Panel A.
Table 2.
Influence Matrix of the Four Dimensions.
To improve computational efficiency, the initial direct influence matrix was normalized to ensure the stability of the calculation process and the reliability of the results. Specifically, the initial direct influence matrix was standardized using the maximum row-sum normalization method, generating the normalized influence matrix shown in Table 2, Panel B.
The total influence matrix was then obtained, as shown in Table 2, Panel C. The total influence matrix reflects both direct and indirect influence relationships among the indicators. It provides the basis for calculating the influencing and influenced degrees, centrality, and causality.
After obtaining the total influence matrix, we calculate the influencing and influenced degrees, centrality, and causality of each indicator to evaluate its relative importance and classify its attribute within the sustainable resilience indicator framework. The results are shown in Table 3.
Table 3.
DEMATEL Calculation Results for the Four Dimensions.
Based on the DEMATEL results, autonomous controllability (R3, 27.9907) ranks first in terms of centrality (D + R). This indicates that it serves as a core linkage dimension in the industry chain resilience framework and has strong interactions with the other dimensions. Adaptive recovery (R2, 26.1132) and resistance (R1, 25.1724) follow, suggesting that they play important roles in responding to external shocks and supporting system recovery. Sustainable innovation (R4, 24.7142) has a relatively lower centrality value, but it remains closely related to long-term green transition and continuous upgrading.
In terms of causality (D − R), resistance (R1, +1.6884) and adaptive recovery (R2, +1.4772) can be regarded as relatively active-influence dimensions. Resistance forms the “first line of defense” through node redundancy and localized configuration, while adaptive recovery reflects firms’ rapid response and capacity rebuilding capabilities. In the expert judgment matrix, these two dimensions tend to exert stronger influence on the other dimensions. By contrast, autonomous controllability (R3, −1.5069) and sustainable innovation (R4, −1.6586) can be regarded as relatively affected dimensions, indicating that their formation depends more on the joint support of other capabilities. Further observation of the total influence matrix shows a relatively strong relationship between adaptive recovery and autonomous controllability. This suggests that dynamic recovery capability may be an important condition for supporting the formation of strategic autonomy. Overall, the four dimensions show a structural relationship in which basic protection and dynamic adjustment support strategic autonomy and green innovation. This reflects the extension of sustainable resilience in the NEV industry chain from short-term stable operation to long-term security and green transition.
4.1.2. ISM Results for the Four Dimensions
Based on the above DEMATEL results, we further introduce a threshold λ to remove weak influence relationships. In DEMATEL–ISM studies, λ is commonly determined based on the mean and standard deviation of the total influence matrix, or through repeated experimental comparisons [101,104]. Following the threshold-setting approach adopted by Yang et al. (2026), this study sets the threshold as the mean of the total influence matrix plus 0.5 times its standard deviation [101]. Unless otherwise specified, the thresholds used in the subsequent ISM analyses are determined according to the same rule. This setting provides a reasonable balance between filtering weak influence relationships and retaining the main structural links. The reachability matrix constructed using this threshold is then used to identify the hierarchical structure of the four dimensions within the framework. The specific hierarchical classification is shown in Table 4.
Table 4.
ISM Hierarchical Results of the Four Dimensions.
- (1)
- Foundational support indicators
Resistance and adaptive recovery serve as the front-end support of the resilience framework. Through the combination of static defense and dynamic recovery, they provide the foundation for improving the overall resilience capacity of the system. Resistance strengthens the basis for shock resistance through “static buffering capacity.” It reduces external resource dependence and mitigates the initial damage caused by sudden shocks, such as geopolitical supply disruptions, through the localization of key components and the optimization of collaborative networks. Its influence on both autonomous controllability and sustainable innovation exceeds the threshold, indicating that it can provide a stable operating environment for technological breakthroughs and green transition, and help prevent basic supply disruptions from interrupting capacity building.
Adaptive recovery accelerates system repair and optimization through “dynamic adjustment capacity.” By improving the industrial environment and coordinating network resources, it supports resource integration and capacity recovery after shocks. It also creates conditions for capability upgrading. Its influence on autonomous controllability is the strongest among the four dimensions, suggesting that adaptive recovery acts as a key link between “defensive loss reduction” and “capability upgrading.”
- (2)
- Direct manifestation indicators
Autonomous controllability and sustainable innovation are direct manifestation indicators within the sustainable resilience framework. Autonomous controllability has the highest centrality value (27.9907), making it the core dimension of the system’s “strategic control capacity.” The development of independent core technologies and the construction of network hub positions depend on the resource support provided by resistance, such as the stable supply of domestic components, as well as the dynamic efficiency provided by adaptive recovery, such as rapid supply chain adjustment to secure R&D inputs. Therefore, autonomous controllability can be understood as a key structural component that connects basic protection, adaptive adjustment, and strategic control within the resilience framework. It indicates the shift of the industry chain from passive risk defense to more active security control.
Sustainable innovation is a key dimension reflecting the system’s long-term adaptive and transformative potential. The improvement of R&D investment and the development of green firms depend on a stable supply chain supported by resistance, such as the continuous supply of green production materials, and on the industrial environment supported by adaptive recovery, such as policy adaptation that reduces innovation costs. Therefore, the sustainable resilience of the NEV industry chain is not simply reflected in the speed of post-shock recovery. Rather, it reflects the structural coordination among basic protection, dynamic adjustment, strategic autonomy, and green innovation.
4.2. Analysis of Sub-Indicators Under the Resistance Dimension
4.2.1. DEMATEL Results for the Resistance Dimension
To avoid repeatedly presenting the calculation steps, the subsequent analysis of sub-indicators under each dimension reports only the total influence matrix, DEMATEL results, and ISM hierarchical classification results in the main text. The direct influence matrix and normalized direct influence matrix are moved to the Appendix D. The total influence matrix for the resistance dimension is shown in Table 5.
Table 5.
Total Influence Matrix of the Resistance Dimension.
Based on the total influence matrix, we further calculate the influencing and influenced degrees, centrality, and causality of each indicator. Table 6 shows the results.
Table 6.
DEMATEL Calculation Results for the Resistance Dimension.
From the perspective of centrality (D + R), the localization rate of key components (R1.3, 16.1838) has the highest value. This indicates that it has strong systemic connections within the resistance dimension and tends to exert influence on other indicators. A higher localization rate of key components can reduce external risks such as cross-border logistics disruptions and overseas policy restrictions by improving the spatial controllability of supply chain resources. Under sudden shocks, it helps form a domestic closed loop between supply and demand.
Collaborative network density and structural concentration (R1.6) also functions as a cause factor. This suggests that the structure of the industry chain collaboration network plays an important supporting role in the formation of resistance. Although the number of NEV supply chain participants (R1.5) has a causality close to zero and appears as an effect factor, its centrality is relatively high. This indicates that the diversification of supply chain participants has a strong linking role within the resistance dimension. Main business revenue and profit (R1.1), inventory turnover rate (R1.2), and adaptability to import and export market regulations (R1.4) mainly reflect firm-level and operational manifestations of system stability. Overall, the essence of the resistance dimension is not simply to increase firm redundancy. Rather, it is to reduce the initial damage of external shocks to the industry chain through the localization of key components, the diversification of supply chain participants, and the optimization of collaborative networks.
4.2.2. ISM Results for the Resistance Dimension
We further apply ISM to classify the six indicators under the resistance dimension into hierarchical levels. The classification results are shown in Table 7.
Table 7.
ISM Hierarchical Results for the Resistance Dimension.
- (1)
- Foundational support indicators
The localization rate of key components (R1.3) is the most central foundational support indicator in the resistance dimension. By improving localized production capacity in the industry chain, it reduces dependence on imported key components at the source and strengthens the basis for shock resistance. Collaborative network density and structural concentration (R1.6) also belong to the foundational support layer. A supply network with higher redundancy and stronger structural coordination can improve the flexibility of resource allocation, strengthen structural resilience, and reduce the impact of local risks on the overall industry chain. Although the number of NEV supply chain participants (R1.5) is classified as an effect factor in the DEMATEL analysis, the ISM results place it in the foundational support layer. This suggests that the scale and stability of supply chain participants are closely related to the performance of the first two foundational indicators, and changes in this indicator may also be reflected in the system’s risk resistance capacity.
- (2)
- Direct manifestation indicators
By contrast, main business revenue and profit (R1.1), inventory turnover rate (R1.2), and adaptability to import and export market regulations (R1.4) are located in the direct manifestation layer. They mainly reflect the external manifestations of resistance building, or more specifically, the firm-level manifestations of resistance.
This hierarchical structure suggests that resistance in the NEV industry chain cannot be understood only through firm-level inventory or financial indicators. Firm-level operational stability and inventory buffers are important, but they rely more deeply on structural support from key component localization, alternative supply sources, and industrial collaboration networks.
4.3. Analysis of Sub-Indicators Under the Adaptive Recovery Dimension
4.3.1. DEMATEL Results for the Adaptive Recovery Dimension
The adaptive recovery dimension (R2) reflects the ability of the NEV industry chain to respond rapidly, restore production capacity, and maintain operational stability after sudden disturbances. Based on the DEMATEL method, the total influence matrix for the adaptive recovery dimension is shown in Table 8.
Table 8.
Total Influence Matrix of the Adaptive Recovery Dimension.
The DEMATEL calculation results are shown in Table 9.
Table 9.
DEMATEL Calculation Results for the Adaptive Recovery Dimension.
Table 9 shows that network resource scheduling capacity (R2.6) has the highest centrality, indicating that it occupies a core linkage position within the adaptive recovery dimension and has strong interactions with the other indicators. The maturity of the industrial and trade environment (R2.3) has the highest causality and appears as a cause factor. This suggests that the industrial environment, trade facilitation, and institutional support play an important influence role in the formation of adaptive recovery. The causality of technological distance and geographical distance (R2.4) is also positive, indicating that technological linkages and spatial connectivity may affect resource sharing, information transmission, and coordination efficiency during the recovery process.
By contrast, NEV sales volume and year-on-year growth rate (R2.1) and production recovery period (R2.2) appear as effect factors. They mainly reflect the direct manifestations of adaptive recovery at the market and production levels. Although the causality of R2.5 is slightly negative, its centrality remains at a moderate level, suggesting that logistics channel substitution still plays an important linking role in the recovery process.
Overall, the adaptive recovery dimension is not simply a matter of how quickly individual firms resume production. Rather, it reflects a process in which environmental support strengthens resource scheduling, and resource scheduling further supports system recovery. Together, these elements shape the dynamic recovery capacity of the NEV industry chain.
4.3.2. ISM Results for the Adaptive Recovery Dimension
We further apply ISM to classify the six indicators under the adaptive recovery dimension into hierarchical levels. The results are shown in Table 10.
Table 10.
ISM Hierarchical Results for the Adaptive Recovery Dimension.
- (1)
- Foundational support indicators
The maturity of the industrial and trade environment (R2.3) is located in the foundational support layer and represents the “starting capacity” of adaptive recovery. This suggests that adaptive recovery first depends on relatively mature industrial supporting conditions, trade facilitation, policy support, and the institutional environment. A sound industrial and trade environment can provide basic conditions for resource reorganization, supply coordination, and market recovery after shocks.
- (2)
- Hub coordination indicators
Network resource scheduling capacity (R2.6) acts as a coordinating hub that links the lower and upper layers. Its high centrality reflects its key role in coordinating resources and connecting different links. After a shock, the industry chain often faces multiple pressures, such as resource shortages, production bottlenecks, and logistics disruptions. Strong network resource scheduling capacity can support multi-node and multi-path resource allocation. When a core supplier is disrupted, an efficient resource scheduling system can activate alternative suppliers or substitute capacity within a short period, helping prevent local risks from spreading to the whole industry chain.
- (3)
- Intermediate transmission indicators
Technological distance and geographical distance (R2.4), together with substitutability of logistics channels (R2.5), are located in the intermediate transmission layer. This indicates that knowledge linkages, spatial proximity, and diversified logistics routes jointly affect coordination efficiency and path flexibility during the recovery process.
- (4)
- Direct manifestation indicators
NEV sales volume and year-on-year growth rate (R2.1) and production recovery period (R2.2) are direct manifestation indicators. They reflect adaptive recovery at the market and production levels, respectively. R2.1 reflects market feedback and is influenced by resource scheduling, logistics substitution, and the industrial environment. The recovery of sales can further promote market-side repair. R2.2 measures production efficiency, and its length depends on resource access, capacity restart, and upstream and downstream coordination. These two indicators are not merely passive responses. They may also encourage firms to expand capacity layout, strengthen market confidence, and form a positive internal cycle within the system.
These results suggest that the governance of adaptive recovery should move beyond emergency response by individual firms. It should further include industrial environment building, resource scheduling, and channel substitution mechanisms at the industry chain level.
4.4. Analysis of Sub-Indicators Under the Autonomous Controllability Dimension
4.4.1. DEMATEL Results for the Autonomous Controllability Dimension
The autonomous controllability dimension (R3) focuses on the core capability of the NEV industry chain to maintain system control and stability under external uncertainty, such as technological blockades, raw material supply disruptions, and international trade frictions. In essence, autonomous controllability aims to reduce dependence on the external environment through the coordination of technology, resources, finance, and networks, thereby enabling the industry chain to achieve autonomous decision-making, autonomous security, and autonomous competition. This section further measures the collaborative relationships among its five core sub-indicators. The specific results are shown in Table 11.
Table 11.
Total Influence Matrix of the Autonomous Controllability Dimension.
The DEMATEL calculation results are shown in Table 12.
Table 12.
DEMATEL Calculation Results for the Autonomous Controllability Dimension.
Table 12 shows that revealed comparative advantage and trade competitive advantage (R3.3) has the highest centrality, indicating that it is most closely connected with the other indicators in the autonomous controllability dimension. Financial service capacity (R3.4) and network betweenness centrality (R3.5) both have positive causality values, suggesting that financial support and network hub positions play important influence roles in the formation of autonomous controllability. The share of self-developed key core technologies (R3.2) also appears as a cause factor, but its causality is relatively small. This suggests that it not only influences other indicators to some extent, but is also shaped by financial support and network coordination conditions.
Overall, autonomous controllability cannot be achieved simply through technological breakthroughs by individual firms. It requires coordination among financial supply, core technology development, network coordination, and trade competitive advantage. Dependence on imported raw materials (R3.1), as an effect factor, reflects changes in resource-side vulnerability under the combined effects of these indicators.
4.4.2. ISM Results for the Autonomous Controllability Dimension
We further apply ISM to classify the five indicators under the autonomous controllability dimension into hierarchical levels. The results are shown in Table 13.
Table 13.
ISM Hierarchical Results for the Autonomous Controllability Dimension.
- (1)
- Foundational support indicators
Financial service capacity (R3.4) and network betweenness centrality (R3.5) are located in the foundational support layer of the autonomous controllability dimension. Financial service capacity (R3.4) supports key technology R&D through improved financial mechanisms, such as supply chain finance, green credit, and industrial funds. It also strengthens upstream and downstream resource procurement and market expansion, thereby enhancing the strategic autonomy of the system. Network betweenness centrality (R3.5) reflects the coordinating hub position of the industry chain. Firms with higher betweenness centrality can coordinate information flows, capital flows, and logistics flows across the industry chain, promote upstream and downstream collaboration, and dynamically allocate resources under external shocks. This helps balance supply chain control and autonomy.
- (2)
- Direct manifestation indicators
Dependence on imported raw materials (R3.1), share of self-developed key core technologies (R3.2), and revealed comparative advantage and trade competitive advantage (R3.3) are located in the upper layer of the structure and serve as direct manifestation indicators. The share of self-developed key core technologies (R3.2) reflects the core of technological self-reliance. Increasing this share can help reduce external dependence in key areas such as battery management systems and high-voltage electric drive control chips, and mitigate chokepoint risks. Revealed comparative advantage and trade competitive advantage (R3.3) reflects the market and trade manifestations of autonomous innovation and industry chain coordination. Strong trade competitiveness helps firms gain greater initiative in global supply chains and reduce risks from external market fluctuations. Dependence on imported raw materials (R3.1) reflects resource-side vulnerability, such as dependence on imported lithium, cobalt, and nickel. Its changes are jointly related to technological breakthroughs, financial support, and network coordination, and it directly reflects a weak point in autonomous controllability.
The hierarchical structure of this dimension shows that improving autonomous controllability cannot rely only on firm-level technology R&D. It also requires foundational support from the financial system and the industrial network structure. In other words, autonomous controllability is the result of the joint effects of resources, technology, finance, and networks.
4.5. Analysis of Sub-Indicators Under the Sustainable Innovation Dimension
4.5.1. DEMATEL Results for the Sustainable Innovation Dimension
The sustainable innovation dimension (R4) reflects the ability of NEV firms to promote green technology R&D, technology commercialization, and talent support during the green transition. Based on the DEMATEL calculation results, the total influence matrix for the sustainable innovation dimension is shown in Table 14.
Table 14.
Total Influence Matrix of the Sustainable Innovation Dimension.
The DEMATEL calculation results are shown in Table 15.
Table 15.
DEMATEL Calculation Results for the Sustainable Innovation Dimension.
Table 15 shows that R&D input and output capacity (R4.1) has the highest centrality, indicating that it is the most closely connected indicator within the sustainable innovation dimension. Industrial innovation policy support (R4.4), maturity of scientific, technological, and digital infrastructure (R4.5), and diffusion rate of innovation culture (R4.6) are all cause factors. This suggests that sustainable innovation is supported not only by firms’ own R&D input, but also by the policy environment, technological platforms, and the innovation network atmosphere. By contrast, R&D input and output capacity (R4.1), talent development (R4.2), and green enterprise certification (R4.3) appear as effect factors. This indicates that green innovation activities, talent accumulation, and green governance performance are more likely to be associated with the joint support of policy incentives, infrastructure development, and network-based knowledge diffusion. Overall, the sustainable innovation dimension presents a structural relationship in which policy and infrastructure support, knowledge diffusion, and innovation implementation are closely connected. This reflects the systemic and ecological nature of green innovation capability.
4.5.2. ISM Results for the Sustainable Innovation Dimension
We further apply ISM to classify the six indicators under the sustainable innovation dimension into hierarchical levels. The results are shown in Table 16.
Table 16.
ISM Hierarchical Results for the Sustainable Innovation Dimension.
- (1)
- Foundational support indicators
Table 16 shows that industrial innovation policy support (R4.4), maturity of scientific, technological, and digital infrastructure (R4.5), and diffusion rate of innovation culture (R4.6) are located in the foundational support layer. Together, they form the institutional, infrastructural, and network foundations of sustainable innovation. Industrial innovation policy support guides the concentration of innovation resources through fiscal incentives, green finance, and support for technology transformation. The maturity of scientific, technological, and digital infrastructure provides basic conditions for R&D, testing, data flows, and intelligent manufacturing. The diffusion rate of innovation culture reflects the diffusion capacity of green concepts, technical standards, and innovation knowledge within the industry network.
- (2)
- Direct manifestation indicators
R&D input and output capacity (R4.1), talent development (R4.2), and green enterprise certification (R4.3) are located in the direct manifestation layer. They can be understood as firm-level manifestations of sustainable innovation practices. R&D input and output capacity (R4.1) reflects the efficiency of innovation resource allocation and the level of output transformation. It is a core manifestation of technological breakthroughs and market innovation. Talent development (R4.2) measures the supply capacity of high-level innovative talent. It reflects the “human resource reserve” for innovation and is closely related to policy incentives and infrastructure support. It also provides continuous support for subsequent R&D input and affects the continuity of technology development and the innovation ecosystem. Green enterprise certification (R4.3) reflects the degree to which firms integrate innovation strategy with green transition. It reflects the “sustainable value” of innovation and serves as a direct indicator for evaluating sustainable development capacity. The foundational support indicators jointly support these three direct manifestation indicators, which together represent the micro-level manifestations of sustainable innovation practices.
4.6. Analysis of the Overall Hierarchical Structure of the Sustainable Resilience Framework
Based on the DEMATEL–ISM results for the indicators under each dimension, we construct the overall hierarchical structure model of sustainable resilience indicators, as shown in Figure 1. In the model, directed lines represent the reachability relationships among indicators. Lower-level indicators play more foundational roles and may influence upper-level indicators through hierarchical transmission, while upper-level indicators are the direct manifestations of sustainable resilience.
Figure 1.
Overall Hierarchical Structure Model.
From the three-level structure of nodes, chains, and networks, the distribution of indicators in the hierarchical structure model shows a relatively clear pattern. The specific analysis is as follows.
- (1)
- Network-level indicators are mostly concentrated in the foundational support layer
As indicators at the macro-level industrial ecosystem, network-level indicators are mainly located in the foundational support layer of the hierarchical structural model. Examples include R1.6, collaborative network density and structural concentration; R2.6, network resource scheduling capacity; R3.5, network betweenness centrality; and R4.6, diffusion rate of innovation culture. This result suggests that the sustainable resilience of the NEV industry chain does not mainly depend on the isolated defense capacity of individual firms. Instead, it relies more on whether the industrial network can provide diversified connections, alternative paths, resource scheduling, and knowledge diffusion mechanisms. The core value of network-level indicators lies in building a macro-level collaborative ecosystem. Their role is foundational, and they need to be optimized through top-level design so that they can provide continuous support for the chain level and the node level.
- (2)
- Chain-level indicators are mainly distributed in the foundational support layer and the intermediate layer
As meso-level indicators connecting the macro network and micro nodes, chain-level indicators mainly play deep support and transmission roles in the hierarchical structural model. They also serve as important channels linking network-level coordination with node-level practices and operational conditions. These indicators act as the resource scheduling hubs and institutional linkage mechanisms of the resilience framework. Examples include R1.3, localization rate of key components; R2.3, maturity of the industrial and trade environment; and R4.4, industrial innovation policy support. These indicators help transform macro-level network capacity into meso-level chain capacity by optimizing resource allocation, reducing institutional barriers, strengthening policy guidance, and supporting technology platform development. In this way, they provide structural support for maintaining the stable operation of the NEV industry chain under external shocks.
- (3)
- Node-level indicators are mainly concentrated in the direct manifestation layer
As micro-level firm indicators, node-level indicators represent the implementation end of the resilience framework. Most of them are located in the direct manifestation layer of the hierarchical structural model. Examples include R1.1, main business revenue and profit; R2.1, NEV sales volume and year-on-year growth rate; R3.1, dependence on imported raw materials; and R4.3, green enterprise certification. This indicates that, after short-term shocks, the resilience status of the industry chain is more directly reflected in firm-level manifestations such as operating performance, market response, and green transition. This does not mean that firm-level resilience is unimportant. Rather, it suggests that firm-level resilience is often the external manifestation of network coordination and chain-level support. Firms are the main actors that implement resilience capabilities, but their performance is jointly shaped by upstream resources, supply networks, the institutional environment, financial support, and the innovation ecosystem.
Overall, the hierarchical structural relationships of sustainable resilience in the NEV industry chain follow a basic logic in which network coordination provides the foundation, chain-level mechanisms serve as the transmission channel, and node-level capabilities constitute the implementation side of the framework. This result indicates that resilience governance should not remain limited to the inventory, financial, and production recovery capacity of individual firms. It should move toward collaborative governance across firms, regions, and industry chain links. In particular, network-based governance is needed in areas such as critical mineral security, core technology breakthroughs, logistics channel substitution, battery recycling networks, and green innovation platform development, so as to improve the overall security, controllability, and sustainability of the industry chain.
5. Conclusion and Discussion
5.1. Research Conclusions
Through literature review and expert consultation, this study develops a sustainable resilience indicator framework for the NEV industry chain, including four dimensions, namely resistance, adaptive recovery, autonomous controllability, and sustainable innovation, and 23 secondary indicators. Based on scoring data from 15 industry experts, this study further applies the integrated DEMATEL–ISM method to analyze the influence relationships and hierarchical structure among these indicators. The main conclusions are as follows.
First, the formation of sustainable resilience in the NEV industry chain is not the result of improving a single capability. Instead, it follows an evolutionary logic of “basic protection, dynamic recovery, strategic autonomy, and continuous iteration”. Resistance and adaptive recovery constitute the basic capabilities that help the industry chain maintain stable operation and make dynamic adjustments under external shocks. Autonomous controllability and sustainable innovation reflect higher-level capabilities through which the industry chain moves from passive recovery toward strategic security and green transformation. These four capabilities show clear progressive and coordinated relationships.
Second, the four dimensions show differentiated structural paths. Specifically, the resistance dimension reflects a path of “localized and diversified resources-optimized network collaboration-firm operational stability.” The adaptive recovery dimension reflects a hierarchical structural relationship of “policy environment support-network resource scheduling-market recovery.” The autonomous controllability dimension reflects a structural relationship of “financial support-technological breakthroughs-trade competitive advantage.” The sustainable innovation dimension reflects a path of “policy and infrastructure support- knowledge diffusion-firm-level innovation implementation.” These findings suggest that different resilience capabilities are not homogeneous. Instead, they perform different functions in resource assurance, recovery coordination, strategic control, and green transition.
Third, the three-level structure of “nodes, chains, and networks” shows a relatively clear hierarchical distribution in the sustainable resilience framework of the NEV industry chain. Network-level indicators mostly act as foundational support indicators. Chain-level indicators mainly perform transmission and linkage functions. Node-level indicators are more often direct manifestation indicators. This indicates that improving resilience in the NEV industry chain cannot rely only on optimizing the capabilities of individual firms. It requires coordinated efforts across the industrial network ecosystem, chain-level coordination mechanisms, and node-level implementation performance. Firms are the main actors that implement resilience capabilities, but firm-level operational recovery, technological breakthroughs, and green transition often depend on network coordination and chain-level support.
Fourth, network structure indicators play an important foundational support role in the sustainable resilience framework of the NEV industry chain. Network-level indicators, such as collaborative network density and structural concentration, network resource scheduling capacity, network betweenness centrality, and diffusion rate of innovation culture, show strong foundational or coordinating roles across different dimensions. This suggests that resilience improvement in the NEV industry chain should not be understood only as a matter of internal firm risk management. It should also be examined from the perspective of industrial network governance. Issues such as critical mineral security, logistics channel substitution, core technology platform coordination, battery recycling networks, and green knowledge diffusion all require collaborative governance across firms, regions, and industry chain links. Therefore, the focus of sustainable resilience governance in the NEV industry chain should move from passive defense by individual firms toward systematic coordination at the industry chain network level.
Fifth, autonomous controllability occupies a core linkage position in the sustainable resilience framework of the NEV industry chain. The overall analysis of the four dimensions shows that autonomous controllability has the highest centrality, indicating that it has strong interactions with resistance, adaptive recovery, and sustainable innovation. Autonomous controllability does not only mean reducing import dependence or increasing the share of self-developed key technologies. Rather, it is a comprehensive capability formed through the joint support of resource assurance, technological capability, financial support, network coordination, and trade competitive advantage. For the NEV industry chain, autonomous controllability reflects the requirement of security and controllability, and also provides important support for green innovation and long-term sustainable development.
5.2. Theoretical Contributions
The theoretical contributions of this study are mainly reflected in the following three aspects.
First, from the perspective of sustainable resilience, this study constructs an integrated analytical framework of four-dimensional capabilities and three-level structures for the NEV industry chain. In doing so, it advances industry chain resilience research from the identification of individual capabilities toward the analysis of system structure. Existing classic studies often define supply chain resilience as a system’s capability to prevent, respond to, and recover from disruption shocks, with a focus on vulnerability control, recovery efficiency, and redundancy allocation [38,105,106]. This research tradition provides an important foundation for understanding how supply chains respond to disturbances. However, it remains largely centered on the shock-recovery logic, while paying relatively limited attention to the long-term evolutionary dimensions of industry chains, such as green transition, technological substitution, and strategic control. Building on these studies, this study incorporates resistance, adaptive recovery, autonomous controllability, and sustainable innovation into a unified framework, and further embeds them into a three-level structure of nodes, chains, and networks. In this way, the resilience of the NEV industry chain is defined as a systemic capability that combines defense, recovery, control, and continuous evolution. This framework not only extends the recovery-oriented perspective of traditional resilience research, but also responds to the recent theoretical trend in international research toward the integration of supply chain resilience and sustainable development.
Second, this study constructs a sustainable resilience indicator framework that better fits the resource dependence, technological intensity, and low-carbon transition requirements of the NEV industry chain. It therefore enriches the contextualized measurement of sustainable resilience. Existing studies have begun to examine the measurement of supply chain resilience and have operationalized it through dimensions such as flexibility, redundancy, visibility, and collaboration [17,81]. However, many indicator systems are still based on general manufacturing industries or common supply chains. They pay insufficient attention to the critical resource dependence, core technology bottlenecks, green governance pressure, and recycling requirements faced by strategic emerging industries. The sustainable resilience of the NEV industry chain is not only a matter of supply security or production recovery. It also involves the stability and recycling of critical minerals, power battery recycling, green technology innovation, low-carbon infrastructure, green enterprise certification, innovation talent development, and collaborative governance across the industry chain. Based on this context, this study incorporates indicators such as the localization rate of key components, network resource scheduling capacity, green enterprise certification, and diffusion rate of innovation culture into the framework. This makes the measurement of resilience more consistent with the actual operating logic of the NEV industry chain. The framework captures not only industrial security and operational stability, but also green transition, resource recycling, governance coordination, and long-term innovation capacity. In this sense, this study places NEV industry chain resilience in the broader context of sustainable transformation. It also responds to theoretical concerns in ESG, SDGs, and sustainable supply chain transformation research regarding environmental responsibility, innovation capacity, and collaborative governance [107,108,109,110].
Third, based on the DEMATEL–ISM method, this study conducts exploratory modeling of the relative influence relationships and hierarchical structural relationships among sustainable resilience indicators in the NEV industry chain. This provides a new analytical perspective for understanding the internal structure of resilience in complex industry chains. Existing studies usually explain the sources of resilience from the perspectives of resource redundancy, supply diversification, coordination mechanisms, and dynamic adjustment capabilities. However, relatively limited attention has been paid to the interrelationships and hierarchical structural positions of different capability elements in complex industry chain systems. The analysis in this study shows that autonomous controllability has high centrality in the four-dimensional capability framework and serves as a key linkage between basic protection capabilities and sustainable innovation capabilities. At the same time, network structure indicators, such as collaborative network density and structural concentration, network resource scheduling capacity, network betweenness centrality, and diffusion rate of innovation culture, show strong foundational support roles across different dimensions. These findings suggest that resilience in the NEV industry chain is not a simple aggregation of several firm-level capabilities. Rather, it should be understood as a systemic property associated with the management of key dependencies, the capacity for resource integration and reconfiguration, and the structure of industrial networks. These findings echo the classic view of dynamic capability theory on resource sensing, integration, and reconfiguration [37]. They also connect with discussions in social network theory and regional resilience research on network position, structural linkages, and system adaptation [111,112]. Therefore, this study advances the contextual application of these classic theories in research on sustainable resilience in the NEV industry chain.
5.3. Management Implications
Based on the above findings, the governance of sustainable resilience in the NEV industry chain should form a collaborative path with a clear division of responsibilities. Different actors should make use of their respective resource, technology, logistics, policy, and financial levers.
First, vehicle manufacturers and leading firms in the industry chain should strengthen supply source diversification, key component localization, and coordination across the industry chain. The results show that the localization rate of key components, the number of supply chain participants, and the collaborative network structure play important foundational support roles in the resistance dimension. Therefore, leading firms should not rely only on short-term inventory or single-supplier management to improve resilience. Instead, they should enhance the stable operation of the industry chain through multi-supplier arrangements, localized core components, alternative key materials, and upstream and downstream coordination mechanisms.
Second, battery firms and key component suppliers should improve sustainable resilience around resource security, self-developed technologies, and recycling. Power batteries, automotive-grade chips, electronic control systems, and key materials are important bottleneck links in the NEV industry chain. Relevant firms should strengthen the supply assurance of critical minerals, material substitution, battery management system R&D, domestic substitution of core components, and waste battery recycling. Resource security, technological autonomy, and recycling should be integrated into long-term capability building.
Third, logistics providers and supply chain service providers should improve route substitutability, emergency coordination, and cross-regional resource scheduling capacity. The results for the adaptive recovery dimension show that network resource scheduling capacity and the substitutability of logistics channels are important factors affecting recovery efficiency. Therefore, logistics and supply chain service providers should establish combined transport plans involving railways, roads, waterways, and air transport. They should also improve the ability to switch among different transport channels and use digital platforms to enhance the visibility of orders, inventories, transportation, and production capacity information.
Fourth, technology suppliers, universities, research institutions, and innovation platforms should promote R&D cooperation, green technology diffusion, and the construction of common technology platforms. The results for the sustainable innovation dimension show that industrial innovation policy support, scientific, technological, and digital infrastructure, and the diffusion rate of innovation culture are important supports for green innovation. Therefore, actors in the innovation system should promote joint R&D, testing and validation platforms, open laboratories, and knowledge-sharing mechanisms in areas such as low-carbon materials, battery recycling, intelligent manufacturing, the industrial internet, and green technology standards.
Fifth, policymakers, financial institutions, and industry associations should provide institutional, financial, and collaborative governance support for sustainable resilience in the industry chain. Government departments can improve the external support environment through critical mineral security strategies, power battery recycling standards, carbon footprint accounting, green manufacturing standards, industrial funds, and green credit. Financial institutions can provide long-term funding for key technology R&D, green manufacturing, and supply chain coordination. Industry associations and industrial alliances can serve as platforms for standard setting, information sharing, risk warning, and cross-firm collaboration.
Overall, the governance of sustainable resilience in the NEV industry chain should shift from passive defense by individual firms to system-wide coordination involving multiple actors. Different actors should work together based on their respective governance levers to improve the security, controllability, and sustainability of the industry chain.
5.4. Limitations and Future Research
Although this study constructs an analytical framework for the resilience of the NEV industry chain, it still has the following limitations.
First, this study has limitations in terms of data sources, indicator validation, expert consensus, and reliability assessment. The direct influence matrix was mainly constructed based on expert scoring. Although expert consultation can reflect industry experience and professional judgment, the professional background, knowledge structure, and subjective cognition of different experts may still affect the stability of the results. The indicator framework was developed through literature review, theoretical classification, and expert consultation. However, this study did not conduct a formal multi-round Delphi procedure, calculate a content validity index, or report quantitative agreement and reliability measures such as Kendall’s W or Cronbach’s alpha. This is mainly because the expert scoring process was designed for DEMATEL-based directional pairwise influence judgments rather than for psychometric scale validation or simple item-importance rating. Each score represents the perceived directional influence between two indicators, rather than repeated responses to interchangeable measurement items.
In addition, this study did not conduct formal expert-group comparison analysis. Although the expert panel included participants from firms, universities and research institutes, and industry associations or consulting institutions, the number of experts in each subgroup was relatively small. Therefore, subgroup-level comparison may produce unstable results and may also weaken the anonymity of the expert consultation process. For this reason, this study used the averaged expert judgment matrix as the basis for the DEMATEL–ISM analysis. Nevertheless, the absence of quantitative validity, agreement, reliability, and expert-group difference tests limits the statistical validation of the proposed framework. Future research can expand the expert sample and adopt Delphi procedures, content validity analysis, expert agreement tests, and expert-group comparison analysis to further validate and refine the indicator framework.
Second, in terms of research methods, the DEMATEL–ISM method used in this study is more suitable for revealing perceived influence relationships and hierarchical structures within the system based on expert judgment. It cannot establish empirical causal relationships in a statistical, temporal, or experimental sense. Therefore, the influence paths identified in this study should be interpreted as expert-evaluated structural relationships rather than verified causal mechanisms. In addition, this method remains limited in capturing the dynamic evolution of industry chain resilience under specific sudden shocks. Future research can combine system dynamics, longitudinal data, event study methods, or multi-stage case analysis to further examine capability evolution, feedback mechanisms, and causal relationships in the NEV industry chain before, during, and after shocks.
Third, in terms of research context, the indicator framework in this study is mainly constructed based on the development background of China’s NEV industry. It does not fully consider differences in institutional environments, industrial organization modes, and green governance models across countries and regions. Future research can test the applicability of this indicator framework in cross-regional or cross-national comparative settings, so as to improve the external explanatory power and international comparative value of the study.
Fourth, in terms of sustainability scope, this study mainly develops an industry-chain-oriented indicator framework for sustainable resilience in the NEV industry. The framework is constructed based on the industry-specific characteristics discussed above, including strong dependence on critical resources, high technological complexity, close upstream and downstream linkages, supply chain coordination requirements, green innovation pressure, resource circularity, and low-carbon transition. These issues are central to the sustainable transition of the NEV industry chain and are closely related to the industrial and technological foundations of resilience. However, we acknowledge that the indicator framework remains primarily focused on industrial, technological, and environmental dimensions of sustainable resilience. It gives relatively limited attention to the social dimension of sustainability, such as labor conditions, occupational welfare, community resilience, environmental justice, regional inclusiveness, consumer responsibility, and social equity. This limitation is partly related to the research objective of this study. Specifically, this study aims to construct a context-specific indicator framework based on the current characteristics of the NEV industry chain and to identify the hierarchical structural relationships among key sustainable resilience factors through DEMATEL–ISM analysis. It does not aim to develop a comprehensive ESG- or SDG-based sustainability assessment system. Therefore, the proposed framework should be interpreted as an industry-chain-oriented sustainable resilience framework for the NEV industry chain, rather than as a full sustainability evaluation framework. Future research can extend the framework by incorporating social sustainability indicators that are more closely related to the NEV industry chain, such as labor protection, occupational safety, community impacts, regional inclusion, and consumer responsibility. This would allow future studies to examine more comprehensively how environmental, social, and governance factors jointly shape sustainable resilience in the NEV industry chain.
Author Contributions
Conceptualization, C.Z., X.X., Q.D. and B.W.; methodology, C.Z. and X.X.; formal analysis, X.X.; investigation, X.X., Q.D. and B.W.; data curation, X.X.; validation, Q.D.; visualization, Q.D.; writing—original draft preparation, C.Z. and X.X.; writing—review and editing, C.Z., Q.D. and B.W.; supervision, C.Z., Q.D. and B.W.; funding acquisition, C.Z. and Q.D. All authors have read and agreed to the published version of the manuscript.
Funding
This research was funded by the Humanities and Social Science Fund of the Ministry of Education of China, grant numbers 24YJC630202 and 24YJAZH020.
Institutional Review Board Statement
Ethical review and approval were waived for this study by Institution Committee because it is a non-medical, non-interventional expert consultation and scoring study in industrial management and sustainable development, involving no human biological samples, health records, disease information, or sensitive personal data; all expert scoring data are anonymized and aggregated for academic research only, and participants are fully informed of their voluntary participation and right to withdraw. The study therefore does not fall within the scope of the Measures for Ethical Review of Life Science and Medical Research Involving Human Subjects (Guo Wei Ke Jiao Fa [2023] No. 4) and poses minimal risk, meeting the criteria for exemption from formal ethical review.
Informed Consent Statement
Informed consent for publication was obtained from all identifiable human participants.
Data Availability Statement
The original expert questionnaires are not publicly available due to the confidentiality commitment made to the participating experts and privacy considerations. The processed data, intermediate matrices, and calculation results supporting the conclusions of this study are included in the article. Further inquiries can be directed to the corresponding authors.
Acknowledgments
The authors would like to thank the experts who participated in the consultation and scoring process. The authors also thank the editor and anonymous reviewers for their constructive comments and suggestions.
Conflicts of Interest
The authors declare no conflicts of interest.
Appendix A. Detailed Definitions, Measurement Logic, and Assignment Rationale for the Sustainable Resilience Indicators of the NEV Industry Chain
Table A1.
Detailed Definitions, Measurement Logic, and Assignment Rationale for the Sustainable Resilience Indicators of the NEV Industry Chain.
Appendix B. Composition of the Expert Consultation Panel, Selection Criteria, and Scoring Procedure
To improve the transparency of the expert judgment data used in the DEMATEL–ISM analysis, this appendix provides additional information on the composition of the expert consultation panel, expert selection criteria, expert sources, geographic distribution, scoring procedure, and potential conflicts of interest. A total of 15 experts related to the NEV industry chain were invited to participate in the scoring process, including six industry experts, five academic and research experts, and four experts from industry associations and consulting institutions.
Table A2.
Composition of the Expert Consultation Panel.
The experts were selected based on the following criteria:
- (1)
- They had practical, research, or consulting experience related to the NEV industry chain, supply chain management, industrial policy, green innovation, technological innovation, or sustainable development;
- (2)
- They were familiar with one or more key segments of the NEV industry chain, such as vehicle manufacturing, power batteries, key materials, core component supply, logistics services, recycling, industrial policy, or technological innovation;
- (3)
- They were able to understand the judgment requirements for assessing directional influence relationships among indicators and independently complete the expert scoring questionnaire.
In terms of expert sources, this study considered the complementarity of industry experts, academic and research experts, and experts from industry associations and consulting institutions in terms of knowledge structure and practical experience. Specifically,
- (1)
- Industry experts mainly came from leading Chinese NEV firms and related firms in the industry chain, including vehicle manufacturers such as BYD and NIO, as well as firms related to power batteries, key materials, and core components.
- (2)
- Academic and research experts mainly came from Chinese key universities and research institutions, including universities formerly included in China’s Project 985 and Project 211, which were national initiatives for developing leading universities and key disciplines. Their research areas included supply chain resilience, the NEV industry chain, industrial economics, green innovation, and sustainable development.
- (3)
- The experts from industry associations and consulting institutions mainly came from automobile industry associations, local NEV industry associations, industrial research institutions, and industrial consulting institutions, such as the Guangdong New Energy Vehicle Industry Association and relevant industrial consulting institutions in the Yangtze River Delta region.
In terms of geographic distribution, the experts were mainly from regions where China’s NEV industry chain is relatively concentrated, including the Yangtze River Delta, the Pearl River Delta, and major NEV-related industrial areas in Central China. These regions have relatively strong industrial foundations in vehicle manufacturing, power batteries, key materials, core components, automotive electronics, intelligent connected vehicles, and supporting industrial services. The participation of experts from different regions helps reflect, to some extent, regional differences in industrial layout, supporting capacity, market environment, and policy support within China’s NEV industry chain.
During the scoring process, all experts were provided with the expert scoring questionnaire entitled “Evaluation of Influencing Indicators of Industry Chain and Supply Chain Resilience in NEV Firms” and the corresponding indicator descriptions. The experts were asked to assess the directional pairwise influence relationships among indicators within the same level based on their professional judgment. A 0–4 scale was used, where 0 indicates no influence, 1 indicates weak influence, 2 indicates moderate influence, 3 indicates relatively strong influence, and 4 indicates strong influence. In the scoring process, the row indicator was always treated as the influencing indicator and the column indicator as the influenced indicator. That is, experts judged the extent to which the row indicator influenced the column indicator. Since the influence relationship between two indicators does not have to be symmetric, experts were required to assess the influence intensity of A on B and B on A separately. The diagonal elements of each matrix were uniformly set to zero. Each expert assessed the influence relationships among the primary indicators and the influence relationships among the secondary indicators within each dimension.
Regarding potential conflicts of interest, all experts participated in the consultation voluntarily. The expert scores were used only for academic research. The research team did not disclose any expected research conclusions to the experts and did not ask them to make specific judgments. It was confirmed that the participating experts had no direct financial interest in the findings of this study, and no major conflicts of interest that could affect the independence of their judgments were identified.
To protect expert privacy, this study does not disclose expert names, full institutional affiliations, specific positions, or other personally identifiable information. Expert types were classified mainly based on their institutional background, work experience, and professional fields.
Appendix C. Specific Steps of DEMATEL-ISM
At the operational level, this study follows seven steps to implement the integrated DEMATEL-ISM analysis:
- (1)
- Expert scoring and construction of the direct influence matrix.
Experts are invited to perform pairwise comparisons of resilience indicators by evaluating the influence of indicator on . The diagonal values of the direct influence matrix are set to zero. To ensure objectivity, the final value assigned to each indicator is calculated as the arithmetic mean of expert scores. The structure of the direct influence matrix is expressed as Formula (A1):
- (2)
- Matrix normalization.
The direct influence matrix is normalized using the row sum maximum method to facilitate the calculation of the total influence matrix and related influence metrics. The normalized matrix is calculated using Formula (A2):
- (3)
- Calculation of the total influence matrix.
According to the DEMATEL method, both direct and indirect effects are incorporated to obtain the total influence of each factor on the system. The total influence matrix is computed as shown in Formula (A3):
- (4)
- Identification of influence relationships.
For each factor, four values are extracted: influence degree , influenced degree , centrality , and causality . The influence degree is the row sum of the total influence matrix, while the influenced degree is the column sum. Centrality reflects the overall degree of association between an indicator and the system. Causality reflects whether an indicator is more inclined to exert influence on other indicators or to receive influence from them. A positive causality indicates that the indicator can be regarded as a cause factor, while a negative value indicates that it can be regarded as an effect factor.
- (5)
- Construction of the self-feedback matrix.
The self-feedback matrix is obtained by adding the identity matrix to the total influence matrix, which serves as a foundation for the subsequent reachability matrix.
- (6)
- Reachability matrix construction and identification of structural relationships.
The influence information derived from DEMATEL is processed through the ISM method. A threshold is set to eliminate weak relationships, which facilitates the identification of hierarchy levels. A binary reachability matrix is generated, indicating directional reachability relationships among indicators.
- (7)
- Hierarchical classification.
Based on the reachability matrix , the reachable set and the antecedent set for each factor are derived. When , the factor is classified into the current upper level of the system. After the upper-level indicators are removed, the same procedure is repeated to identify the second level, the third level, and the remaining levels until all indicators are classified. Through this hierarchical classification, foundational support indicators, intermediate transition indicators, and direct manifestation indicators can be identified.
The core value of the integrated DEMATEL–ISM method lies in its ability to overcome the limitations of using a single method that either emphasizes qualitative judgment while giving insufficient attention to quantitative analysis, or emphasizes quantification while neglecting structural interpretation. It can identify key indicators and clarify hierarchical relationships at the same time, thereby providing a scientific and operational basis for developing strategies to improve the resilience of the NEV industry chain.
Appendix D. Supplementary Matrices for the DEMATEL–ISM Analysis
This appendix reports the supplementary matrices used in the DEMATEL-ISM analysis. Panel A reports the direct influence matrix based on the arithmetic mean of expert scores. Panel B reports the normalized influence matrix obtained using the maximum row-sum normalization method. Panel C reports the total influence matrix, which reflects both direct and indirect influence relationships among the indicators. Panel D reports the reachability matrix used for the ISM-based hierarchical classification. The threshold for each reachability matrix is calculated separately based on the corresponding total influence matrix, using λ = mean + 0.5 × standard deviation. These matrices provide the calculation basis for the DEMATEL results and hierarchical classification reported in the main text.
Table A3.
Supplementary Matrices for the Four Primary Dimensions.
Table A4.
Supplementary Matrices for the Resistance Dimension.
Table A5.
Supplementary Matrices for the Adaptive Recovery Dimension.
Table A6.
Supplementary Matrices for the Autonomous Controllability Dimension.
Table A7.
Supplementary Matrices for the Sustainable Innovation Dimension.
References
- Cohen, M.; Cui, S.; Doetsch, S.; Ernst, R.; Huchzermeier, A.; Kouvelis, P.; Lee, H.; Matsuo, H.; Tsay, A. Understanding global supply chain and resilience: Theory and practice. In Creating Values with Operations and Analytics: A Tribute to the Contributions of Professor Morris Cohen; Springer: Cham, Switzerland, 2022; Volume 19, pp. 287–311. [Google Scholar]
- Warmbier, P.; Kinra, A.; Ivanov, D. Supply chain sustainability and resilience-relationship and congruent capability analysis based on paradox theory. IFAC-Pap. Online 2022, 55, 311–316. [Google Scholar] [CrossRef] [Scilit]
- Ivanov, D. Revealing interfaces of supply chain resilience and sustainability: A simulation study. Int. J. Prod. Res. 2018, 56, 3507–3523. [Google Scholar] [CrossRef] [Scilit]
- Kazancoglu, I.; Ozbiltekin-Pala, M.; Mangla, S.K.; Kazancoglu, Y.; Jabeen, F. Role of flexibility, agility and responsiveness for sustainable supply chain resilience during COVID-19. J. Clean. Prod. 2022, 362, 132431. [Google Scholar] [CrossRef] [Scilit]
- Negri, M.; Cagno, E.; Colicchia, C.; Sarkis, J. Integrating sustainability and resilience in the supply chain: A systematic literature review and a research agenda. Bus. Strategy Environ. 2021, 30, 2858–2886. [Google Scholar] [CrossRef] [Scilit]
- Chowdhury, M.M.H.; Quaddus, M. Supply chain readiness, response and recovery for resilience. Supply Chain Manag. Int. J. 2016, 21, 709–731. [Google Scholar] [CrossRef] [Scilit]
- Li, Y.; Sukhotu, V. Enhanced Digital Capabilities for Building Resilient Supply Chains: Exploring Visibility, Collaboration, and Resilience in China’s Electric Vehicle Industry. World Electr. Veh. J. 2025, 16, 63. [Google Scholar] [CrossRef] [Scilit]
- Zhou, M.; Li, X.; Shi, Y. Study on the resilience measurement of the new energy vehicle industry chain. Sustainability 2024, 16, 5184. [Google Scholar] [CrossRef] [Scilit]
- Shao, L.; Jin, S. Resilience assessment of the lithium supply chain in China under impact of new energy vehicles and supply interruption. J. Clean. Prod. 2020, 252, 119624. [Google Scholar] [CrossRef] [Scilit]
- Torres-Rivera, A.D.; Mc Namara Valdes, A.d.J.; Da Silva, R.F. The resilience of the renewable energy electromobility supply chain: Review and trends. Sustainability 2023, 15, 10838. [Google Scholar] [CrossRef] [Scilit]
- Huang, Z.; Shi, Y. Risk perception, innovation, and supply chain resilience in China’s new energy vehicle industry. Int. J. Automot. Technol. Manag. 2024, 24, 217–244. [Google Scholar] [CrossRef] [Scilit]
- Yodo, N.; Wang, P. Engineering resilience quantification and system design implications: A literature survey. J. Mech. Des. 2016, 138, 111408. [Google Scholar] [CrossRef] [Scilit]
- Dakos, V.; Kéfi, S. Ecological resilience: What to measure and how. Environ. Res. Lett. 2022, 17, 043003. [Google Scholar] [CrossRef] [Scilit]
- Li, Y.; Peng, L.; Li, S.; Yue, Y.; Wang, K. Integrating transfer entropy and network analysis to explore social-ecological resilience evolution: A case study in South China Karst. J. Clean. Prod. 2025, 518, 145926. [Google Scholar] [CrossRef] [Scilit]
- Carissimi, M.C.; Creazza, A.; Colicchia, C. Crossing the chasm: Investigating the relationship between sustainability and resilience in supply chain management. Clean. Logist. Supply Chain 2023, 7, 100098. [Google Scholar] [CrossRef] [Scilit]
- Kamalahmadi, M.; Shekarian, M.; Mellat Parast, M. The impact of flexibility and redundancy on improving supply chain resilience to disruptions. Int. J. Prod. Res. 2022, 60, 1992–2020. [Google Scholar] [CrossRef] [Scilit]
- Ivanov, D. Two views of supply chain resilience. Int. J. Prod. Res. 2024, 62, 4031–4045. [Google Scholar] [CrossRef] [Scilit]
- Zhao, P.; Li, Z.; Han, X.; Duan, X. Supply chain network resilience by considering disruption propagation: Topological and operational perspectives. IEEE Syst. J. 2022, 16, 5305–5316. [Google Scholar] [CrossRef] [Scilit]
- Liu, W.; Li, X.; Liu, C.; Wang, M.; Liu, L. Resilience assessment of the cobalt supply chain in China under the impact of electric vehicles and geopolitical supply risks. Resour. Policy 2023, 80, 103183. [Google Scholar] [CrossRef] [Scilit]
- George, A.S. Strategic battery autarky: Reducing foreign dependence in the electric vehicle supply chain. Partn. Univers. Int. Res. J. 2024, 3, 168–182. [Google Scholar] [CrossRef]
- Hong, J.; Liang, F.; Yang, J.; Li, K. New energy vehicle industry and technology development status. Sci. Technol. Rev. 2023, 41, 49–59. [Google Scholar] [CrossRef]
- He, Y.; Yang, Y.; Wang, S. Network and mechanism of China’s new energy vehicle industry from the perspective of value chain. J. Geogr. Sci. 2024, 34, 779–803. [Google Scholar] [CrossRef] [Scilit]
- Mubarik, M.S.; Khan, S.A. Disruptive Digital Technologies and Contemporary Supply Chains. In The Theory, Methods and Application of Managing Digital Supply Chains; Emerald Publishing Ltd.: Leeds, UK, 2024; pp. 15–39. [Google Scholar]
- Rinaldi, M.; Caterino, M.; Riemma, S.; Macchiaroli, R.; Fera, M. Emergency Supply Chain Resilience Enhanced Through Blockchain and Digital Twin Technology. Logistics 2025, 9, 43. [Google Scholar] [CrossRef] [Scilit]
- Tian, H. Challenges and Breakthrough Strategies for China’s Manufacturing Industry Upgrading under the Background of Global Industrial Chain Reconstruction. Front. Econ. Policy Model. 2025, 1, 11–16. [Google Scholar] [CrossRef] [Scilit]
- Lyu, R.; Arisian, S.; Li, Z. Strategic battery procurement in new energy vehicle supply chains. Int. J. Prod. Res. 2025, 63, 8540–8569. [Google Scholar] [CrossRef] [Scilit]
- Zhang, W.; Zhao, F.; Liu, Z. How Does China Explore the Synergetic Development of Automotive Industry and Semiconductor Industry with the Opportunity for Industrial Transformation? Sustainability 2025, 17, 1753. [Google Scholar] [CrossRef] [Scilit]
- Yang, T.; Xing, C.; Li, X. Evaluation and analysis of new-energy vehicle industry policies in the context of technical innovation in China. J. Clean. Prod. 2021, 281, 125126. [Google Scholar] [CrossRef] [Scilit]
- Jiang, Z.; Xu, C. Policy incentives, government subsidies, and technological innovation in new energy vehicle enterprises: Evidence from China. Energy Policy 2023, 177, 113527. [Google Scholar] [CrossRef] [Scilit]
- Herold, D.M.; Marzantowicz, Ł. Neo-institutionalism in supply chain management: From supply chain susceptibility to supply chain resilience. Manag. Res. Rev. 2024, 47, 1199–1220. [Google Scholar] [CrossRef] [Scilit]
- Sjöstedt, M. Resilience revisited: Taking institutional theory seriously. Ecol. Soc. 2015, 20, 23. [Google Scholar] [CrossRef] [Scilit]
- Barney, J. Firm resources and sustained competitive advantage. J. Manag. 1991, 17, 99–120. [Google Scholar] [CrossRef] [Scilit]
- Madhani, P.M. Resource Based View (RBV) of Competitive Advantage: An Overview. In Resource Based View: Concepts and Practices; Icfai University Press: Hyderabad, India, 2010; pp. 3–22. [Google Scholar]
- Lockett, A.; Thompson, S.; Morgenstern, U. The development of the resource-based view of the firm: A critical appraisal. Int. J. Manag. Rev. 2009, 11, 9–28. [Google Scholar] [CrossRef] [Scilit]
- Cheng, J.-H.; Lu, K.-L. Enhancing effects of supply chain resilience: Insights from trajectory and resource-based perspectives. Supply Chain Manag. Int. J. 2017, 22, 329–340. [Google Scholar] [CrossRef] [Scilit]
- Kalaitzi, D.; Matopoulos, A.; Clegg, B. Managing resource dependencies in electric vehicle supply chains: A multi-tier case study. Supply Chain Manag. Int. J. 2019, 24, 256–270. [Google Scholar] [CrossRef] [Scilit]
- Teece, D.J. Explicating dynamic capabilities: The nature and microfoundations of (sustainable) enterprise performance. Strateg. Manag. J. 2007, 28, 1319–1350. [Google Scholar] [CrossRef] [Scilit]
- Ponomarov, S.Y.; Holcomb, M.C. Understanding the concept of supply chain resilience. Int. J. Logist. Manag. 2009, 20, 124–143. [Google Scholar] [CrossRef] [Scilit]
- Kurtz, D.J.; Varvakis, G. Dynamic capabilities and organizational resilience in turbulent environments. In Competitive Strategies for Small and Medium Enterprises: Increasing Crisis Resilience, Agility and Innovation in Turbulent Times; Springer: Cham, Switzerland, 2016; pp. 19–37. [Google Scholar]
- Kramarz, M. Logistics coordination in building the resilience of the distribution network. Sci. Pap. Silesian Univ. Technol. Organ. Manag. Ser. 2023, 2023, 233–248. [Google Scholar] [CrossRef] [Scilit]
- Scott, W.R. Institutions and Organizations: Ideas, Interests, and Identities, 4th ed.; Sage Publications: Los Angeles, CA, USA, 2013. [Google Scholar]
- Wu, A. Collaborative eco-innovation and green knowledge acquisition: The role of specific investments in Chinese new energy vehicle industry. Bus. Strategy Environ. 2023, 32, 2245–2260. [Google Scholar] [CrossRef] [Scilit]
- Cao, X.; Zhang, X.; Xing, Z. Exploring the formation mechanism of new energy vehicle industry-university-research innovation network: The role of structural, cognitive and relational social capital. Scientometrics 2024, 129, 3045–3065. [Google Scholar] [CrossRef] [Scilit]
- Laidoune, A.; Zid, C.; Sahraoui, N. Innovate and overcome resistance to change to improve the resilience of systems and organizations. J. Knowl. Econ. 2022, 13, 2986–3001. [Google Scholar] [CrossRef] [Scilit]
- Barney, J.B. Resource-based theories of competitive advantage: A ten-year retrospective on the resource-based view. J. Manag. 2001, 27, 643–650. [Google Scholar] [CrossRef]
- Fertier, A.; Martin, G.; Barthe-Delanoë, A.-M.; Lesbegueries, J.; Montarnal, A.; Truptil, S.; Benaben, F.; Salatge, N. Managing events to improve situation awareness and resilience in a supply chain. Comput. Ind. 2021, 132, 103488. [Google Scholar] [CrossRef] [Scilit]
- Pettit, T.J.; Fiksel, J.; Croxton, K.L. Ensuring supply chain resilience: Development of a conceptual framework. J. Bus. Logist. 2010, 31, 1–21. [Google Scholar] [CrossRef] [Scilit]
- Tukamuhabwa, B.R.; Stevenson, M.; Busby, J.; Zorzini, M. Supply chain resilience: Definition, review and theoretical foundations for further study. Int. J. Prod. Res. 2015, 53, 5592–5623. [Google Scholar] [CrossRef] [Scilit]
- Um, J.; Han, N. Understanding the relationships between global supply chain risk and supply chain resilience: The role of mitigating strategies. Supply Chain Manag. Int. J. 2021, 26, 240–255. [Google Scholar] [CrossRef] [Scilit]
- Yusuf, Y.Y.; Gunasekaran, A.; Musa, A.; Dauda, M.; El-Berishy, N.M.; Cang, S. A relational study of supply chain agility, competitiveness and business performance in the oil and gas industry. Int. J. Prod. Econ. 2014, 147, 531–543. [Google Scholar] [CrossRef] [Scilit]
- Simchi-Levi, D.; Wang, H.; Wei, Y. Increasing supply chain robustness through process flexibility and inventory. Prod. Oper. Manag. 2018, 27, 1476–1491. [Google Scholar] [CrossRef] [Scilit]
- Deng, X.; Xiao, Y. Supply chain synergy in the electric vehicle industry between China and ASEAN. East Asian Policy 2025, 17, 38–55. [Google Scholar] [CrossRef] [Scilit]
- Grumiller, J.; Grohs, H.; Reiner, C. Increasing Resilience and Security of Supply Production Post-COVID-19: From Global to Regional Value Chains; Austrian Foundation for Development Research (ÖFSE): Vienna, Austria, 2021; pp. 1–63. [Google Scholar]
- Brookbanks, M.; Parry, G.C. The impact of Industry 4.0 technologies on the resilience of established cross-border supply chains. Supply Chain Manag. Int. J. 2024, 29, 731–754. [Google Scholar] [CrossRef] [Scilit]
- Cho, M.; Kim, Y.-L. Do inter-firm networks sustain the resilience of regional industrial ecosystems? A network-based analysis of the South Korean automotive industry. Reg. Stud. Reg. Sci. 2023, 10, 569–580. [Google Scholar] [CrossRef] [Scilit]
- Carnovale, S.; DuHadway, S.; Patrucco, A.S.; Yeniyurt, S. Balancing risk and resilience: How network structures and firm strategies mitigate supply chain disruptions. Int. J. Phys. Distrib. Logist. Manag. 2025, 55, 761–790. [Google Scholar] [CrossRef] [Scilit]
- Choudhary, N.A.; Ramkumar, M.; Schoenherr, T.; Rana, N.P. Assessing supply chain resilience during the pandemic using network analysis. IEEE Trans. Eng. Manag. 2021, 71, 12297–12310. [Google Scholar] [CrossRef] [Scilit]
- Rha, J.S. Trends of research on supply chain resilience: A systematic review using network analysis. Sustainability 2020, 12, 4343. [Google Scholar] [CrossRef] [Scilit]
- Cavusgil, S.T.; Deligonul, S.Z. Dynamic capabilities framework and its transformative contributions. J. Int. Bus. Stud. 2025, 56, 33–42. [Google Scholar] [CrossRef] [Scilit]
- Salam, M.A.; Bajaba, S. The role of supply chain resilience and absorptive capacity in the relationship between marketing–supply chain management alignment and firm performance: A moderated-mediation analysis. J. Bus. Ind. Mark. 2023, 38, 1545–1561. [Google Scholar] [CrossRef] [Scilit]
- Stentoft, J.; Mikkelsen, O.S.; Wickstrøm, K.A. Supply chain resilience and absorptive capacity: Crisis mitigation and performance effects during Covid-19. Supply Chain Manag. Int. J. 2023, 28, 975–992. [Google Scholar] [CrossRef] [Scilit]
- Ivanov, D.; Dolgui, A.; Sokolov, B.; Ivanova, M. Literature review on disruption recovery in the supply chain. Int. J. Prod. Res. 2017, 55, 6158–6174. [Google Scholar] [CrossRef] [Scilit]
- Paul, S.K.; Chowdhury, P. A production recovery plan in manufacturing supply chains for a high-demand item during COVID-19. Int. J. Phys. Distrib. Logist. Manag. 2021, 51, 104–125. [Google Scholar] [CrossRef] [Scilit]
- Xia, Q.; Quan, M.; Li, H.; Hao, X. Is environmental regulation works on improving industrial resilience of China? Learning from a provincial perspective. Energy Rep. 2022, 8, 4695–4705. [Google Scholar] [CrossRef] [Scilit]
- Duan, W.; Madasi, J.D.; Khurshid, A.; Ma, D. Industrial structure conditions economic resilience. Technol. Forecast. Soc. Change 2022, 183, 121944. [Google Scholar] [CrossRef] [Scilit]
- Zavitsas, K.; Zis, T.; Bell, M.G. The impact of flexible environmental policy on maritime supply chain resilience. Transp. Policy 2018, 72, 116–128. [Google Scholar] [CrossRef] [Scilit]
- Chumnangoon, P.; Chiralaksanakul, A.; Chintakananda, A. How closeness matters: The role of geographical proximity in social capital development and knowledge sharing in SMEs. Compet. Rev. Int. Bus. J. 2023, 33, 280–301. [Google Scholar] [CrossRef] [Scilit]
- Hu, Q.; Yu, H.; Wu, H.; Chen, J. Impacts of cognitive and social distances on supply chain capability: The moderating effect of information technology utilization. Int. J. Logist. Manag. 2024, 35, 233–255. [Google Scholar] [CrossRef] [Scilit]
- Capaldo, A.; Petruzzelli, A.M. Partner geographic and organizational proximity and the innovative performance of knowledge-creating alliances. Eur. Manag. Rev. 2014, 11, 63–84. [Google Scholar] [CrossRef] [Scilit]
- Song, M.; Ma, X.; Zhao, X.; Zhang, L. How to enhance supply chain resilience: A logistics approach. Int. J. Logist. Manag. 2022, 33, 1408–1436. [Google Scholar] [CrossRef] [Scilit]
- Russell, D.; Ruamsook, K.; Roso, V. Managing supply chain uncertainty by building flexibility in container port capacity: A logistics triad perspective and the COVID-19 case. Marit. Econ. Logist. 2020, 24, 92. [Google Scholar] [CrossRef] [Scilit]
- Pavlov, A.; Ivanov, D.; Pavlov, D.; Slinko, A. Optimization of network redundancy and contingency planning in sustainable and resilient supply chain resource management under conditions of structural dynamics. Ann. Oper. Res. 2025, 349, 495–524. [Google Scholar] [CrossRef] [Scilit]
- King, A.; He, W. The Resilience of Self-reliance in China: Autonomy, Interdependence and Order-shaping. China Q. 2026, 1–18. [Google Scholar] [CrossRef] [Scilit]
- March, C.; Schieferdecker, I. Technological sovereignty as ability, not autarky. Int. Stud. Rev. 2023, 25, viad012. [Google Scholar] [CrossRef] [Scilit]
- Chen, X.; Ma, G. China’s Manufacturing OFDI & Independent and Controllable Industrial Chain: Based on the Perspective of “Technology Seeking”. Acad. J. Bus. Manag. 2024, 6, 1–13. [Google Scholar] [CrossRef] [Scilit]
- Greenwood, R.; Hinings, C.R.; Whetten, D. Rethinking institutions and organizations. J. Manag. Stud. 2014, 51, 1206–1220. [Google Scholar] [CrossRef] [Scilit]
- Qingyu, W. Research on the Trade Competitiveness of China’s New Energy Vehicle Industry. Acad. J. Bus. Manag. 2025, 7, 209–216. [Google Scholar] [CrossRef] [Scilit]
- Popa, V. The financial supply chain management: A new solution for supply chain resilience. Amfiteatru Econ. J. 2013, 15, 140–153. Available online: https://hdl.handle.net/10419/168782 (accessed on 25 June 2026).
- Lu, Q.; Lu, W.; Jiang, Y.; Zhang, Q. Impacts of supply chain finance on supply chain resilience: Empirical evidence from a dynamic capability perspective. J. Manuf. Technol. Manag. 2025, 36, 534–552. [Google Scholar] [CrossRef] [Scilit]
- Lu, Q.; Wang, X.; Wang, Y. Enhancing supply chain resilience with supply chain governance and finance: The enabling role of digital technology adoption. Bus. Process Manag. J. 2023, 29, 944–964. [Google Scholar] [CrossRef] [Scilit]
- Yang, Z.; Wu, M.; Sun, J.; Zhang, Y. Aligning redundancy and flexibility for supply chain resilience: A literature synthesis. J. Risk Res. 2024, 27, 313–335. [Google Scholar] [CrossRef] [Scilit]
- Rajesh, R. On sustainability, resilience, and the sustainable–resilient supply networks. Sustain. Prod. Consum. 2018, 15, 74–88. [Google Scholar] [CrossRef] [Scilit]
- Malindretos, G.; Binioris, S. Supply chain resilience and sustainability. Invest. Res. Anal. J. 2014, 5, 15–40. [Google Scholar]
- Lundvall, B.-A. User-Producer Relationships, National Systems of Innovation and Internationalisation. In National Systems of Innovation: Toward a Theory of Innovation and Interactive Learning; Anthem Press: London, UK, 2010; pp. 47–70. [Google Scholar]
- Cheng, L.; Wu, L. Firms’ Position in the Supply Chain Network, R&D Input, and Innovation Output: Striving for the Top or Settling in the Corner? Implications for Sustainable Growth and Adaptive Capacity. Sustainability 2025, 17, 1729. [Google Scholar] [CrossRef] [Scilit]
- Huang, M.C.; Liou, M.-H.; Iwaki, Y. The impact of R&D and innovation on global supply chain transition: GTAP analysis on Japan’s public R&D investment. J. Soc. Econ. Dev. 2021, 23, 447–467. [Google Scholar] [CrossRef] [Scilit] [PubMed]
- Feng, B.; Jalali, M. The Influence of Technological Innovation Capability on Sustainable Supply Chain Management Implementation—Evidence from Patent-Intensive Industries. Sustainability 2024, 16, 5183. [Google Scholar] [CrossRef] [Scilit]
- Zheng, L.; Song, G.; Song, S.; Huang, N.; Cheng, T. How do talent and technology factors affect supply chain robustness and resilience? Evidence from Chinese manufacturers. Ind. Manag. Data Syst. 2025, 125, 899–920. [Google Scholar] [CrossRef] [Scilit]
- Chen, Y.-H.; Chen, C.-A.; Chien, C.-F. Logistics and supply chain management reorganisation via talent portfolio management to enhance human capital and resilience. Int. J. Logist. Res. Appl. 2024, 27, 2571–2594. [Google Scholar] [CrossRef] [Scilit]
- Yang, M.; Li, H.; Li, J. The Theory and Practice of Evaluating Green Factories in China. South Asian J. Soc. Stud. Econ. 2021, 10, 24–33. [Google Scholar] [CrossRef] [Scilit]
- Wang, W.; Zhang, Q.; Hao, J. How Does Green Factory Certification Affect Corporate Sustainability Performance: Evidence from China. Sustainability 2025, 17, 61. [Google Scholar] [CrossRef] [Scilit]
- Fan, R.; Wang, Y.; Chen, F.; Du, K.; Wang, Y. How do government policies affect the diffusion of green innovation among peer enterprises?-An evolutionary-game model in complex networks. J. Clean. Prod. 2022, 364, 132711. [Google Scholar] [CrossRef] [Scilit]
- Ma, Y.; Zhao, H. Green technology innovation guiding policies under the synergy of government and financial institutions. Sustain. Oper. Comput. 2024, 5, 269–277. [Google Scholar] [CrossRef] [Scilit]
- Pandey, N.; de Coninck, H.; Sagar, A.D. Beyond technology transfer: Innovation cooperation to advance sustainable development in developing countries. Wiley Interdiscip. Rev. Energy Environ. 2022, 11, e422. [Google Scholar] [CrossRef] [Scilit]
- Singh, S.; Ru, J. Goals of sustainable infrastructure, industry, and innovation: A review and future agenda for research. Environ. Sci. Pollut. Res. 2023, 30, 28446–28458. [Google Scholar] [CrossRef] [Scilit] [PubMed]
- Wu, J.; Zhang, Y.; Shi, Z. Crafting a sustainable next generation infrastructure: Evaluation of China’s new infrastructure construction policies. Sustainability 2021, 13, 6245. [Google Scholar] [CrossRef] [Scilit]
- Chen, R.; Chen, X. Cultural sustainability through social networks: A moderated mediation model exploring the psychological dimensions of cultural dissemination. Front. Psychol. 2025, 15, 1514693. [Google Scholar] [CrossRef] [Scilit] [PubMed]
- Nielsen, A.E.; Thomsen, C. Sustainable development: The role of network communication. Corp. Soc. Responsib. Environ. Manag. 2011, 18, 1–10. [Google Scholar] [CrossRef] [Scilit]
- Wallner, H.P. Towards sustainable development of industry: Networking, complexity and eco-clusters. J. Clean. Prod. 1999, 7, 49–58. [Google Scholar] [CrossRef] [Scilit]
- Liang, Y.; Wang, H.; Zhao, X. Analysis of factors affecting economic operation of electric vehicle charging station based on DEMATEL-ISM. Comput. Ind. Eng. 2022, 163, 107818. [Google Scholar] [CrossRef] [Scilit]
- Yang, Y.; Li, W.; Shi, J. Uneven gains: Tourism and income distribution. Manag. Decis. 2026, 1–29. [Google Scholar] [CrossRef] [Scilit]
- He, Y.; Kang, J.; Pei, Y.; Ran, B.; Song, Y. Research on influencing factors of fuel consumption on superhighway based on DEMATEL-ISM model. Energy Policy 2021, 158, 112545. [Google Scholar] [CrossRef] [Scilit]
- Wang, J.; Liu, M.; Chen, Y.; Yu, M. Influencing factors on green supply chain resilience of agricultural products: An improved gray-DEMATEL-ISM approach. Front. Sustain. Food Syst. 2023, 7, 1166395. [Google Scholar] [CrossRef] [Scilit]
- Li, Q.; Ma, L.; Zhang, Y.; Zhao, X. The Key Influencing Factors and Action Paths of the Digital Divide for the Elderly Based on DEMATEL-ISM. Inf. Sci. 2025, 43, 74–85. [Google Scholar] [CrossRef]
- Christopher, M.; Peck, H. Building the resilient supply chain. Int. J. Logist. Manag. 2004, 15, 1–14. [Google Scholar] [CrossRef] [Scilit]
- Pettit, T.J.; Croxton, K.L.; Fiksel, J. Ensuring supply chain resilience: Development and implementation of an assessment tool. J. Bus. Logist. 2013, 34, 46–76. [Google Scholar] [CrossRef] [Scilit]
- Kim, J.; Yang, W. Environmental, social, and governance (ESG) research: A systematic review of recent trends (2020–2024). Sustain. Dev. 2026, 34, 1872–1900. [Google Scholar] [CrossRef] [Scilit]
- Durczak, K.; Sala, D.; Liashenko, O.; Pyzalski, M.; Pavlov, K.; Pavlova, O.; Romaniuk, R.; Sujak, A. Governance Matters: Evidence from Global Analysis on Environmental Sustainable Development Goals. Sustainability 2026, 18, 1140. [Google Scholar] [CrossRef] [Scilit]
- Alkaraan, F.; Elmarzouky, M.; de Sousa Jabbour, A.B.L.; Jabbour, C.J.C.; Gulko, N. Maximising sustainable performance: Integrating servitisation innovation into green sustainable supply chain management under the influence of governance and Industry 4.0. J. Bus. Res. 2025, 186, 115029. [Google Scholar] [CrossRef] [Scilit]
- Mahar, A.S.; Zhang, Y.; Sadiq, B.; Gul, R.F. Sustainability transformation through green supply chain management practices and green innovations in Pakistan’s manufacturing and service industries. Sustainability 2025, 17, 2204. [Google Scholar] [CrossRef] [Scilit]
- Martin, R. Regional economic resilience, hysteresis and recessionary shocks. J. Econ. Geogr. 2012, 12, 1–32. [Google Scholar] [CrossRef] [Scilit]
- Burt, R.S.; Kilduff, M.; Tasselli, S. Social network analysis: Foundations and frontiers on advantage. Annu. Rev. Psychol. 2013, 64, 527–547. [Google Scholar] [CrossRef] [Scilit] [PubMed]
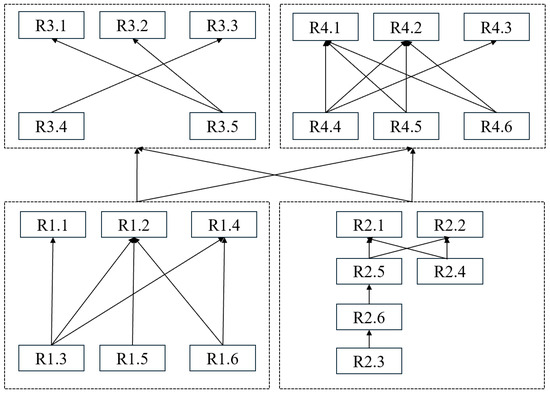
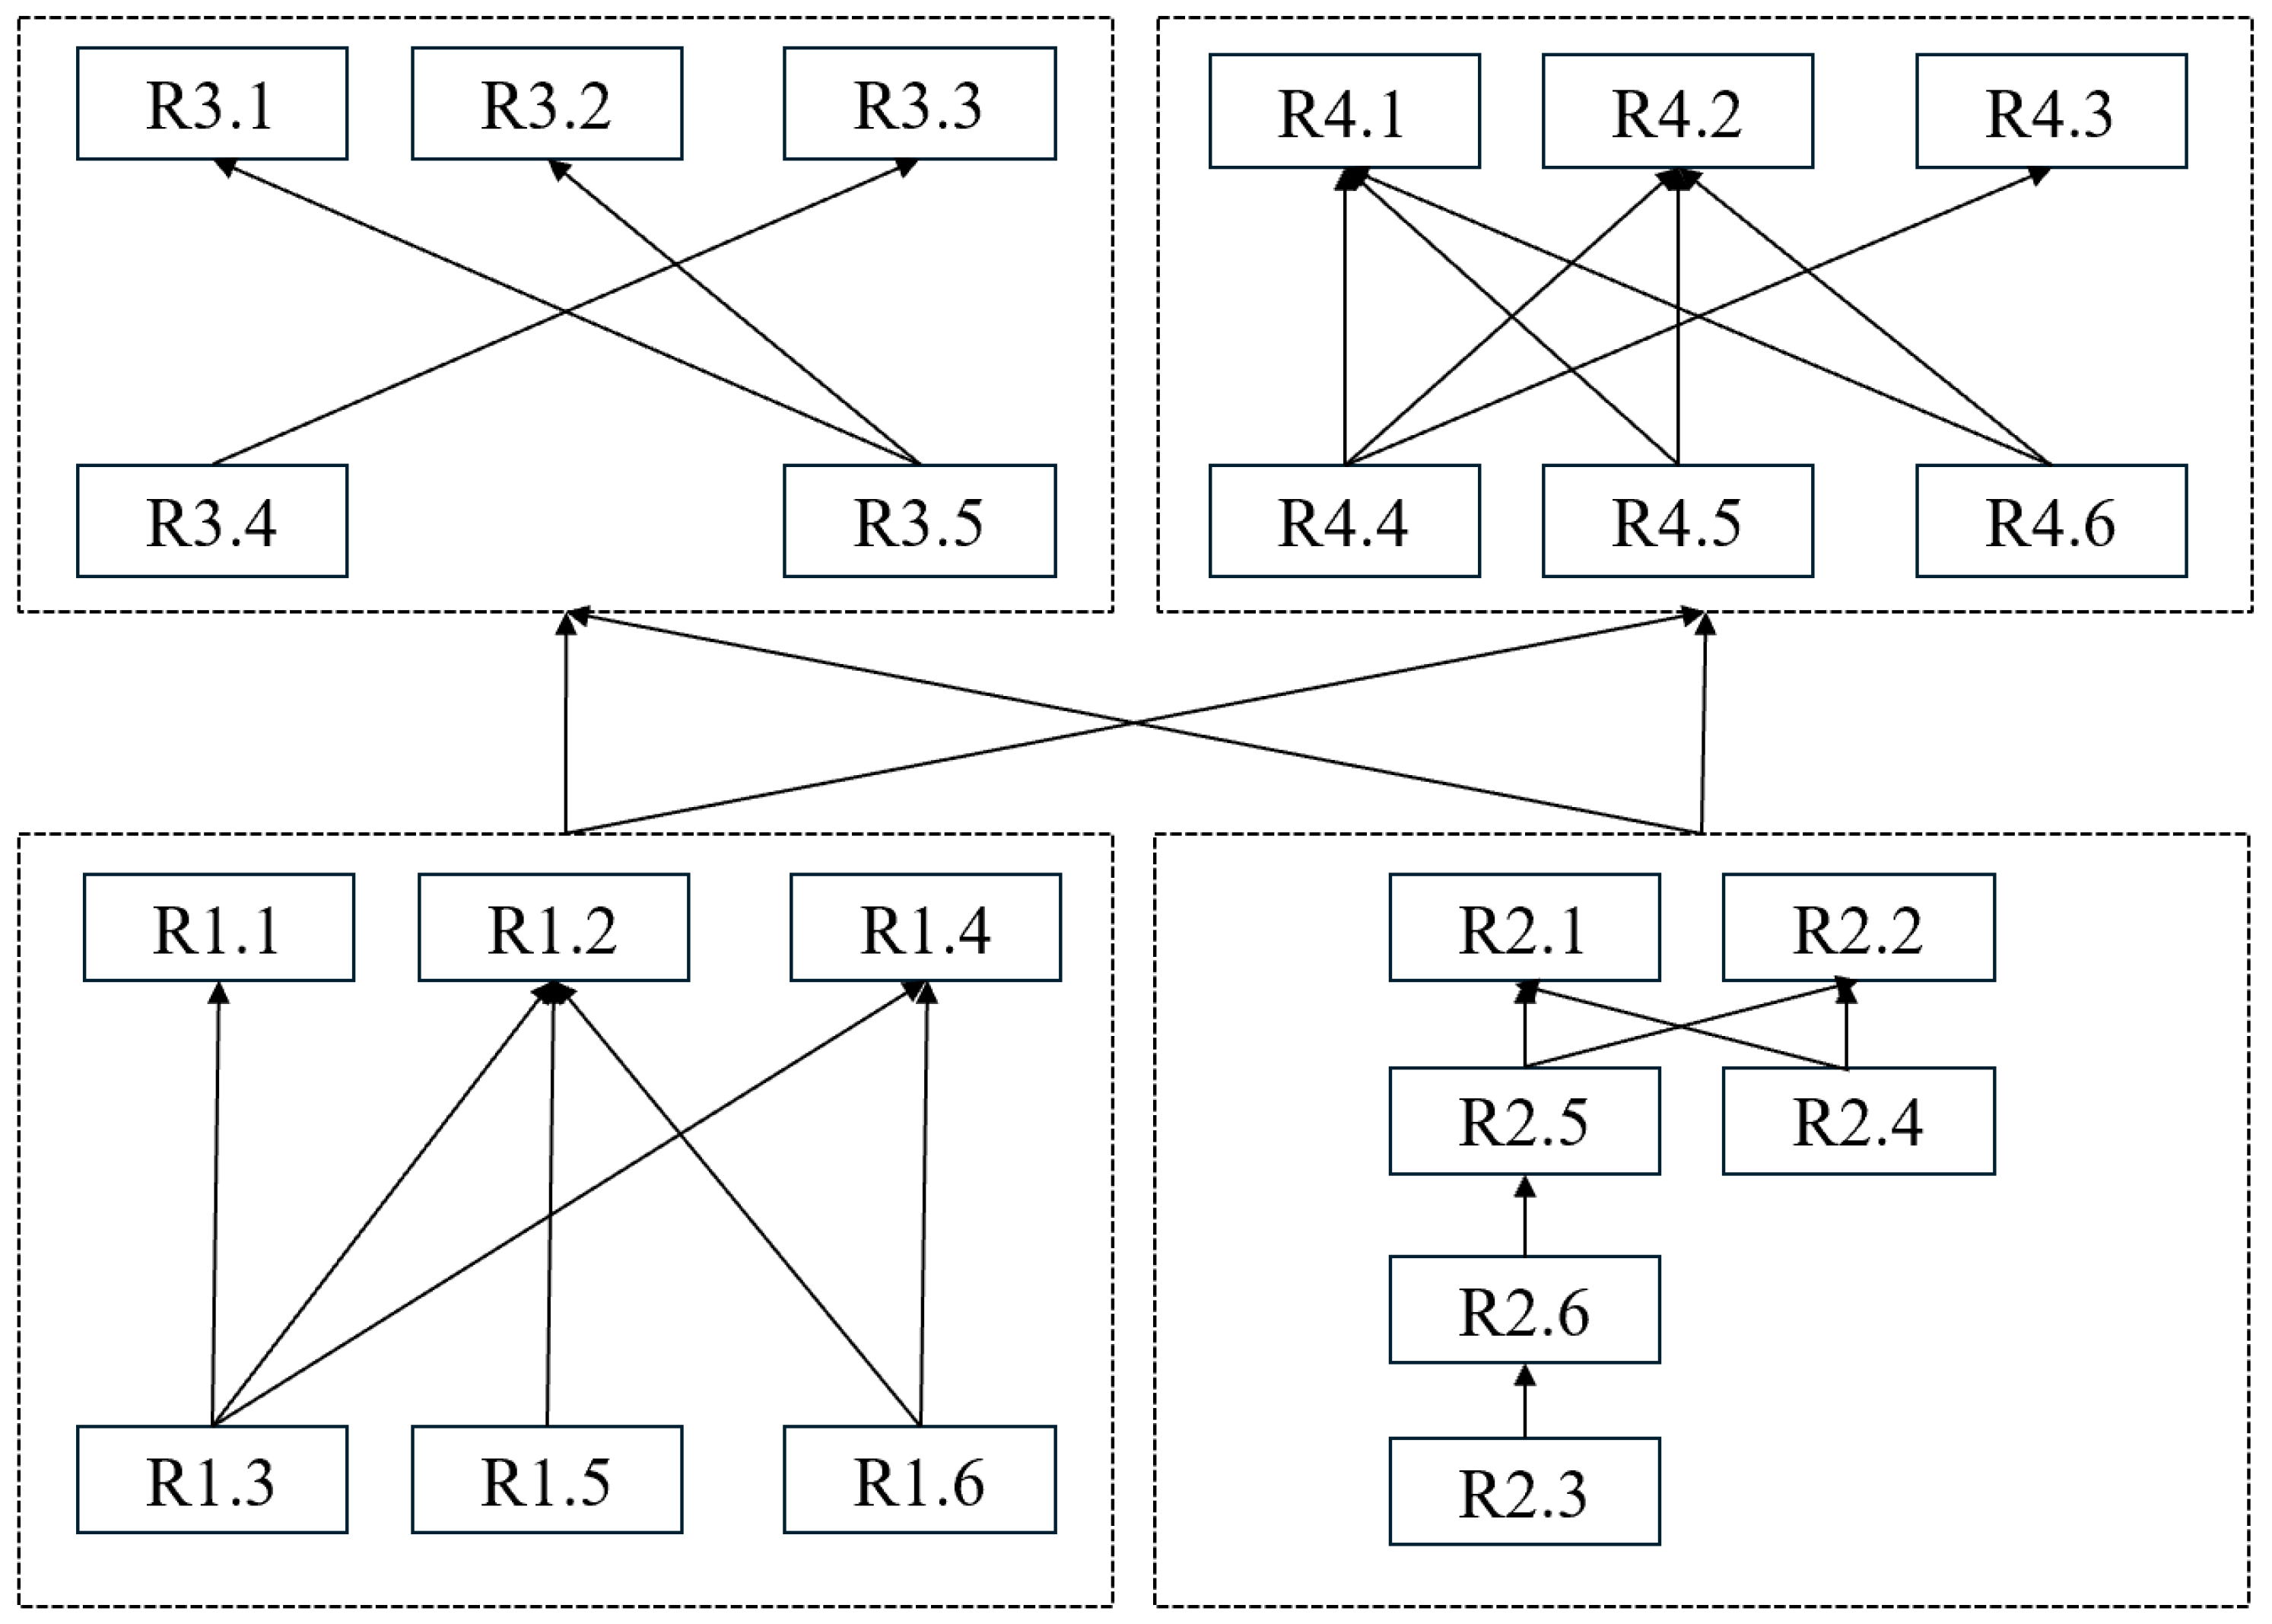

Disclaimer/Publisher’s Note: The statements, opinions and data contained in all publications are solely those of the individual author(s) and contributor(s) and not of MDPI and/or the editor(s). MDPI and/or the editor(s) disclaim responsibility for any injury to people or property resulting from any ideas, methods, instructions or products referred to in the content. |
© 2026 by the authors. Licensee MDPI, Basel, Switzerland. This article is an open access article distributed under the terms and conditions of the Creative Commons Attribution (CC BY) license.