


Abstract
While terrestrial carbon storage is vital for achieving global carbon neutrality, its spatiotemporal evolution in ecologically fragile regions—such as the Pisha sandstone area—is complicated by intense erosion and complex environmental drivers. Widely known as the Pisha sandstone area, often referred to as the “Earth’s ecological cancer” due to its unique geological instability (“hard as rock when dry, soft as mud when wet”), this area is a critical but vulnerable carbon sink in the Yellow River Basin. This study aims to clarify these dynamics and identify their non-linear driving mechanisms by integrating a coupled PLUS–InVEST model with an XGBoost–SHAP framework to simulate land-use cover change and quantify carbon sequestration potential from 1990 to 2040. Our results reveal: (1) a robust path dependence in land use, where grassland remained the dominant landscape matrix (>75%), which partly explains the stable regional carbon-stock structure and the moderate FoM value of the PLUS validation; (2) carbon storage followed a fluctuating but overall increasing trajectory, projected to reach a peak of 3.19 × 105 tC by 2040 under the Ecological Conservation Scenario (ECS), which significantly outperforms the economic-driven and natural growth modes; (3) hot spot analysis showed that statistically notable low-carbon cold spots were concentrated mainly along valley corridors, marginal transition zones, and locally disturbed patches, whereas high-carbon hot spots were spatially limited; and, (4) crucially, XGBoost–SHAP results should be interpreted as model-based associations rather than direct causal proof; the whole-region model and the regional models jointly suggest that topography, water availability, socioeconomic pressure, and erosion-related factors contribute differently across bare, loess-covered, and sand-covered Pisha sandstone units. These findings support differentiated land-use and restoration strategies rather than uniform regional management. The findings suggest that future management in the Pisha sandstone area should transition from general restoration toward targeted and differentiated regulation to improve regional ecosystem services.
1. Introduction
Terrestrial ecosystem carbon storage is a critical component of the land carbon sink and an important basis for climate change mitigation and carbon-neutrality strategies [1,2,3,4]. In dryland and ecologically fragile regions, land-use change can rapidly alter vegetation cover, erosion sensitivity, and carbon sequestration capacity, making the carbon consequences of restoration and development especially pronounced [5,6,7,8,9]. In the Yellow River Basin, where ecological protection and high-quality development must be coordinated, understanding how land-use transitions reshape carbon storage is, therefore, both a scientific and a practical priority [10,11].
Viewed in the context of international research on land-use change and ecosystem carbon storage, the remaining challenge is to move beyond quantifying carbon-stock changes and toward explaining where these changes occur and why their drivers differ across fragile landscapes. Although coupled land-use simulation and ecosystem-service models, especially PLUS–InVEST, have been widely used to quantify carbon-storage responses to future land-use scenarios, most studies still focus on changes in total carbon stocks under alternative policy settings [3,4,12]. Comparatively less attention has been paid to how non-linear interactions among topography, climate, erosion-related constraints, and human disturbance shape carbon-storage patterns, particularly in fragile dryland systems. As a result, scenario-based carbon accounting is often stronger in projection than in mechanism-based interpretation.
This limitation is especially important in typical fragile regions where severe erosion, harsh environmental conditions, and human disturbance interact strongly. In such settings, carbon-storage change is unlikely to be controlled by a single factor or a simple linear relationship. Traditional analytical methods, such as linear regression or Geodetector [13,14,15,16,17], are useful for identifying broad associations, but they may not fully capture non-linear responses, threshold effects, and interactions among ecological and socioeconomic drivers [18,19,20]. Therefore, interpretable machine learning approaches with strong non-linear fitting capacity, such as XGBoost–SHAP [21,22,23], provide a useful complementary tool for linking carbon-storage patterns with potential driving mechanisms [24,25,26].
The Pisha sandstone area in the Yellow River Basin is not merely another ecologically fragile region; it is also a geomorphological unit where fragile lithology, severe erosion, sparse vegetation, and policy-driven restoration interact directly with carbon-storage dynamics. Its material properties, often described as hard when dry and soft when wet, make slopes and gullies highly sensitive to water, wind, and freeze–thaw erosion. At the same time, the region is a key source area of coarse sediment in the Yellow River and is divided into bare, loess-covered, and sand-covered Pisha sandstone units with different soil-retention capacity, vegetation recovery potential, and land-use constraints. However, existing research largely focuses on the physical processes of soil and water conservation, lacking a systematic perspective on the “carbon storage–land use–driving mechanisms” nexus. In addition, multi-scenario dynamic simulations that integrate the region’s unique geological characteristics with development policies remain scarce. These features make the area a suitable and necessary case for examining how carbon storage responds to land-use transition under both ecological protection and high-quality development objectives.
Although PLUS–InVEST has been widely used in land-use and carbon-storage studies, three issues remain insufficiently addressed for the Pisha sandstone area. First, many studies emphasize total carbon-storage change but provide limited spatial guidance on where restoration or protection should be prioritized. Second, scenario settings are often transferred from general regional planning frameworks and do not fully reflect the constraints of cropland protection, grassland dominance, erosion control, and ecological restoration in this specific area. Third, driver analysis commonly reports a whole-region ranking, which can mask the contrasting mechanisms of bare, loess-covered, and sand-covered Pisha sandstone units. Therefore, a framework that links scenario simulation, carbon accounting, hot spot identification, and regional interpretable machine learning is needed to transform model outputs into management-relevant evidence.
Accordingly, this study establishes an integrated PLUS–InVEST, hot spot-analysis, and XGBoost–SHAP framework for the Pisha sandstone area. The study aims to: (1) characterize the spatiotemporal evolution of land use and carbon storage from 1990 to 2020; (2) compare carbon-storage potential under four policy-oriented 2040 scenarios; (3) identify cold spot and hot spot clusters that indicate priority restoration and protection areas; and (4) interpret the relative model contributions of natural, socioeconomic, and erosion-related variables at both the whole-region and subregional scales. The value of this work lies in providing a region-specific basis for differentiated carbon sink management rather than simply adding another generic PLUS–InVEST application.
2. Overview of the Study Area
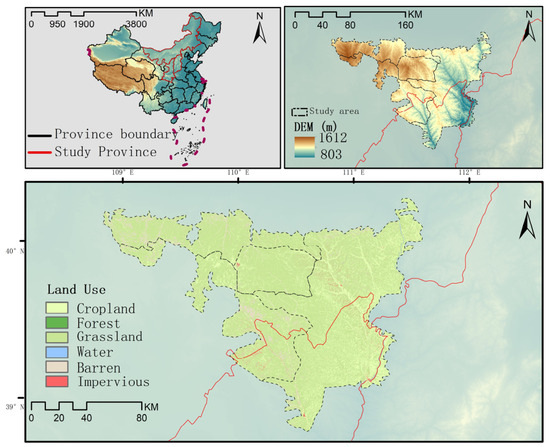
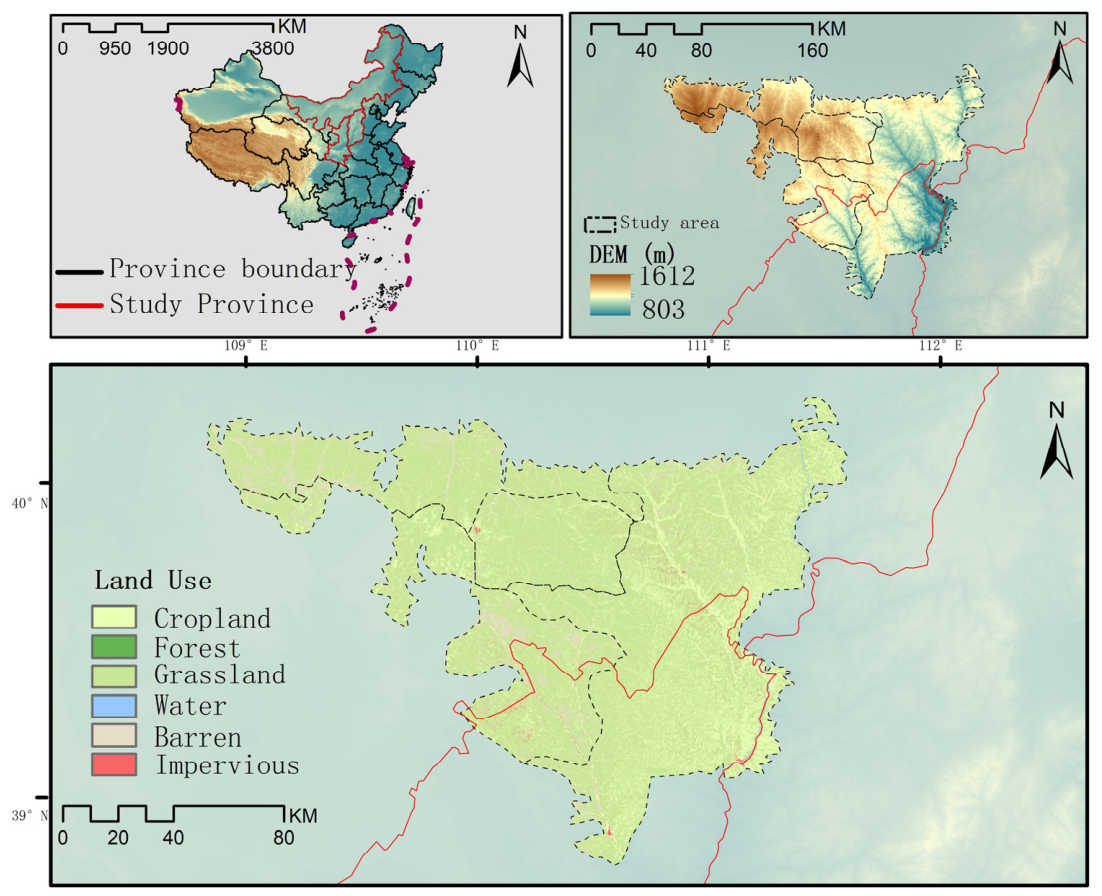
The Pisha sandstone area (1.67 × 10⁴ km2) is located at the junction of Shanxi, Shaanxi, and Inner Mongolia in the Yellow River Basin (Figure 1). Characterized by a semi-arid monsoon climate (7.2 °C, 400 mm precipitation), the region features a unique “binary” lithology—unstable clastic rocks that are “hard when dry and soft when wet.” Combined with thin regolith (<30 cm) and sparse vegetation (<30%), this creates an extremely fragile ecosystem. The topography descends from northwest to southeast (774–1648 m). Driven by wind, water, and freeze–thaw forces, the area suffers from intense compound erosion (modulus: 30,000–55,000 t/km2·a). Based on surface cover, the region is divided into soil-covered, sand-covered, and bare zones. These zones exhibit significant heterogeneity in soil retention capacity and carbon sequestration potential, which makes refined spatial analysis essential for regional ecological management [17].
Figure 1.
Location of this study.
3. Data and Methods
3.1. Data Sources
The datasets employed in this study primarily consist of land-use data, carbon density data, and driving-factor data. Detailed information regarding these sources is as follows: Land-use data spanning seven periods from 1990 to 2020 were acquired from the Resource and Environmental Science Data Registration and Publication System, with a spatial resolution of 30 m × 30 m. Carbon density data were derived from existing datasets (with some values obtained via interpolation strategies) [27]. The driving-factor data comprise both socioeconomic and natural environmental variables. Specific sources and descriptions for all datasets are presented in Table 1.
Table 1.
Sources of data.
3.2. Research Methods
3.2.1. Land-Use Transition Matrix
The land-use transition matrix represents the directional shifts and quantitative changes between initial land-use types and final land-use categories within the study period. The formula is expressed as follows [28,29,30,31]:
In the formula, n denotes the total number of land-use types in the study area, while i and j (i, j = 1, 2, ..., n) represent the land-use types at the beginning and end of the study period, respectively, and Sij denotes the area converted from type i to type j.
3.2.2. InVEST-Based Carbon-Storage Estimation
This study employs the Carbon Storage and Sequestration module of the InVEST model to calculate carbon storage by integrating land-use and carbon density data. The formula is expressed as follows [32,33,34]:
where C denotes total ecosystem carbon storage (t·hm−2) and Cabove, Cbelow, Csoil, and Cdead represent aboveground vegetation, belowground vegetation, soil organic carbon, and dead organic matter carbon pools, respectively. Our study evaluated whether the treatment of the dead organic matter carbon pool would affect the reliability of the research conclusions. A sensitivity comparison was conducted by setting Cdead to 0 in the baseline calculation and by assigning alternative proportional Cdead values to the non-dead carbon pools of each land-use class. The comparison showed that changing Cdead mainly caused proportional changes in the absolute carbon-stock values, while the spatial distribution pattern, the relative scenario ranking, and the key conclusion that ECS has the highest carbon-storage potential remained unchanged. This stability is mainly related to the land-cover structure of the Pisha sandstone area. Therefore, setting Cdead to 0 does not have a decisive influence on the main results of this study. Carbon density coefficients for each land-use category were derived from literature and are summarized in Table 2 (unit: t·hm−2).
Table 2.
Carbon density coefficients of different land-use types (Unit: t·hm−2).
3.2.3. Multi-Scenario Prediction Based on PLUS Model
This study employed the PLUS model, which integrates the Land Expansion Analysis Strategy (LEAS) and a Cellular Automata model based on multi-type random patch seeds, to simulate future land-use patterns in the Pisha sandstone area. The model can identify the contribution of driving factors to historical land expansion and allocate future land-use demand spatially according to neighborhood effects and transition rules. In this study, land-use data from 2010 and 2020 were used as the calibration period, and the 2020 land-use pattern was simulated and compared with the observed 2020 land-use map for accuracy assessment [35,36].
The driving factors used in the simulation included natural, topographic, soil, accessibility, and socioeconomic variables, such as DEM, slope, aspect, temperature, precipitation, soil texture, erosion intensity, population density, GDP, and distances to major roads. All raster data were unified to the same coordinate system and spatial resolution before model input. The main PLUS parameters were set as follows: the number of decision trees was 20, the sampling rate was 0.01, and mTry was set to 12. The validation results showed that the simulated 2020 land-use pattern achieved a Kappa coefficient of 0.787, an overall accuracy of 0.817, and a Figure of Merit (FoM) value of 0.134. The relatively modest FoM is partly related to the spatial resolution and classification accuracy of the land-use data, as FoM is sensitive to the exact location of simulated change patches. It is also influenced by the grassland-dominated and path-dependent land-use structure of the Pisha sandstone area, where land-use changes are relatively small and scattered. In such persistence-dominated landscapes, Kappa and overall accuracy can indicate acceptable reproduction of the dominant land-use structure, whereas FoM is more conservative because it evaluates changed areas only. Therefore, the simulation results are interpreted as scenario-based projections rather than deterministic predictions of future land-use distribution. Four development scenarios were constructed for 2040: the Natural Development Scenario (NDS), Cultivated Land Protection Scenario (CLPS), Ecological Conservation Scenario (ECS), and High-Quality Development Scenario (HQDS). These scenarios were designed with reference to the ecological protection and high-quality development strategy of the Yellow River Basin, national cultivated land protection requirements, and the ecological restoration needs of the Pisha sandstone area [2,37,38]. Under the Natural Development Scenario (NDS), historical land-use transition trends and neighborhood weights were maintained, and no additional ecological or development constraints were imposed. This scenario was used as the baseline to reflect future land-use evolution under existing development inertia. Under the Cultivated Land Protection Scenario (CLPS), the conversion of cropland to other land-use types was restricted to reflect the requirements of permanent basic farmland protection and food security. Under the Ecological Conservation Scenario (ECS), ecological land types, especially grassland, forest land, and water bodies, were given higher protection priority, while the conversion of ecological land to impervious surfaces was restricted. Considering the severe erosion sensitivity of the Pisha sandstone area, the conversion of barren land to grassland or other ecological land was encouraged in this scenario. Under the High-Quality Development Scenario (HQDS), moderate expansion of impervious land was allowed in areas with stronger socioeconomic and accessibility advantages, while ecological constraints were retained to avoid uncontrolled occupation of key ecological spaces.
For each scenario, land-use demand and transition rules were adjusted according to the corresponding policy orientation. The NDS maintained historical transition probabilities; the CLPS strengthened cropland retention; the ECS increased the probability of ecological restoration, especially the conversion of barren land to grassland; and the HQDS increased the probability of construction land expansion under socioeconomic development constraints. The simulated 2040 land-use maps under the four scenarios were then coupled with the InVEST carbon-storage module to estimate future carbon storage and compare the carbon effects of different development pathways [39,40].
3.2.4. Hot Spot Analysis and XGBoost–SHAP Attribution Framework
To further identify priority areas for carbon sink enhancement and interpret the spatial drivers of carbon storage, this study integrated hot spot analysis with the XGBoost–SHAP attribution framework. The hot spot analysis was first used to detect spatial clusters of carbon-storage change and carbon sink potential, and the XGBoost–SHAP model was then applied to quantify the relative contribution and non-linear effects of natural and socioeconomic factors on the spatial differentiation of carbon storage.
Based on the InVEST carbon-storage results and the 2040 multi-scenario simulation outputs, raster difference analysis was conducted to calculate carbon-storage changes at the grid scale. The spatial clustering characteristics of carbon increase and decrease were then identified using hot spot analysis. Specifically, high-value clusters were interpreted as carbon sink enhancement hot spots or priority conservation areas, whereas low-value clusters and significant carbon loss areas were regarded as key restoration or management intervention zones. By combining historical carbon-storage changes with future scenario differences, the hot spot analysis provided a spatial basis for identifying areas where ecological conservation, barren land restoration, and land-use optimization should be prioritized.
To explore the driving factors behind these spatial patterns, an XGBoost–SHAP framework was constructed. XGBoost is an ensemble learning algorithm based on gradient-boosted decision trees, which can effectively capture complex non-linear relationships and interactions among multiple variables. In this study, carbon storage estimated by the InVEST model was used as the dependent variable, while natural, topographic, soil, accessibility, and socioeconomic factors were used as explanatory variables. These included DEM, slope, aspect, annual precipitation, annual temperature, soil texture indicators, erosion intensity, population density, GDP, and distances to major roads. Considering that carbon storage in the InVEST model is directly calculated from land-use type and carbon density coefficients, land-use category itself was not included as an explanatory variable in the XGBoost model in order to reduce circular interpretation and avoid the model simply reproducing the carbon assignment rules embedded in the InVEST model.
All explanatory variables were resampled to a consistent spatial resolution and spatially matched with the carbon-storage raster. A total of 15,905 sample points were extracted for model training and validation. The dataset was divided into training and testing sets at a ratio of 8:2, and 5-fold cross-validation was used to evaluate model stability. Model performance was assessed using the coefficient of determination (R2) and root mean square error (RMSE). Although this validation strategy provides a basic assessment of model fitting ability, spatial autocorrelation may still affect model performance estimation. Therefore, the attribution results were interpreted as model-based associations rather than direct causal evidence.
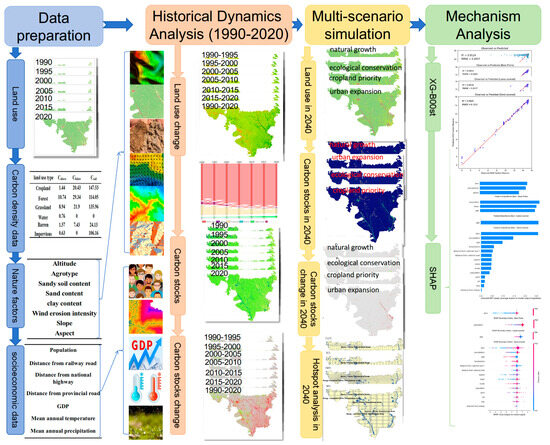
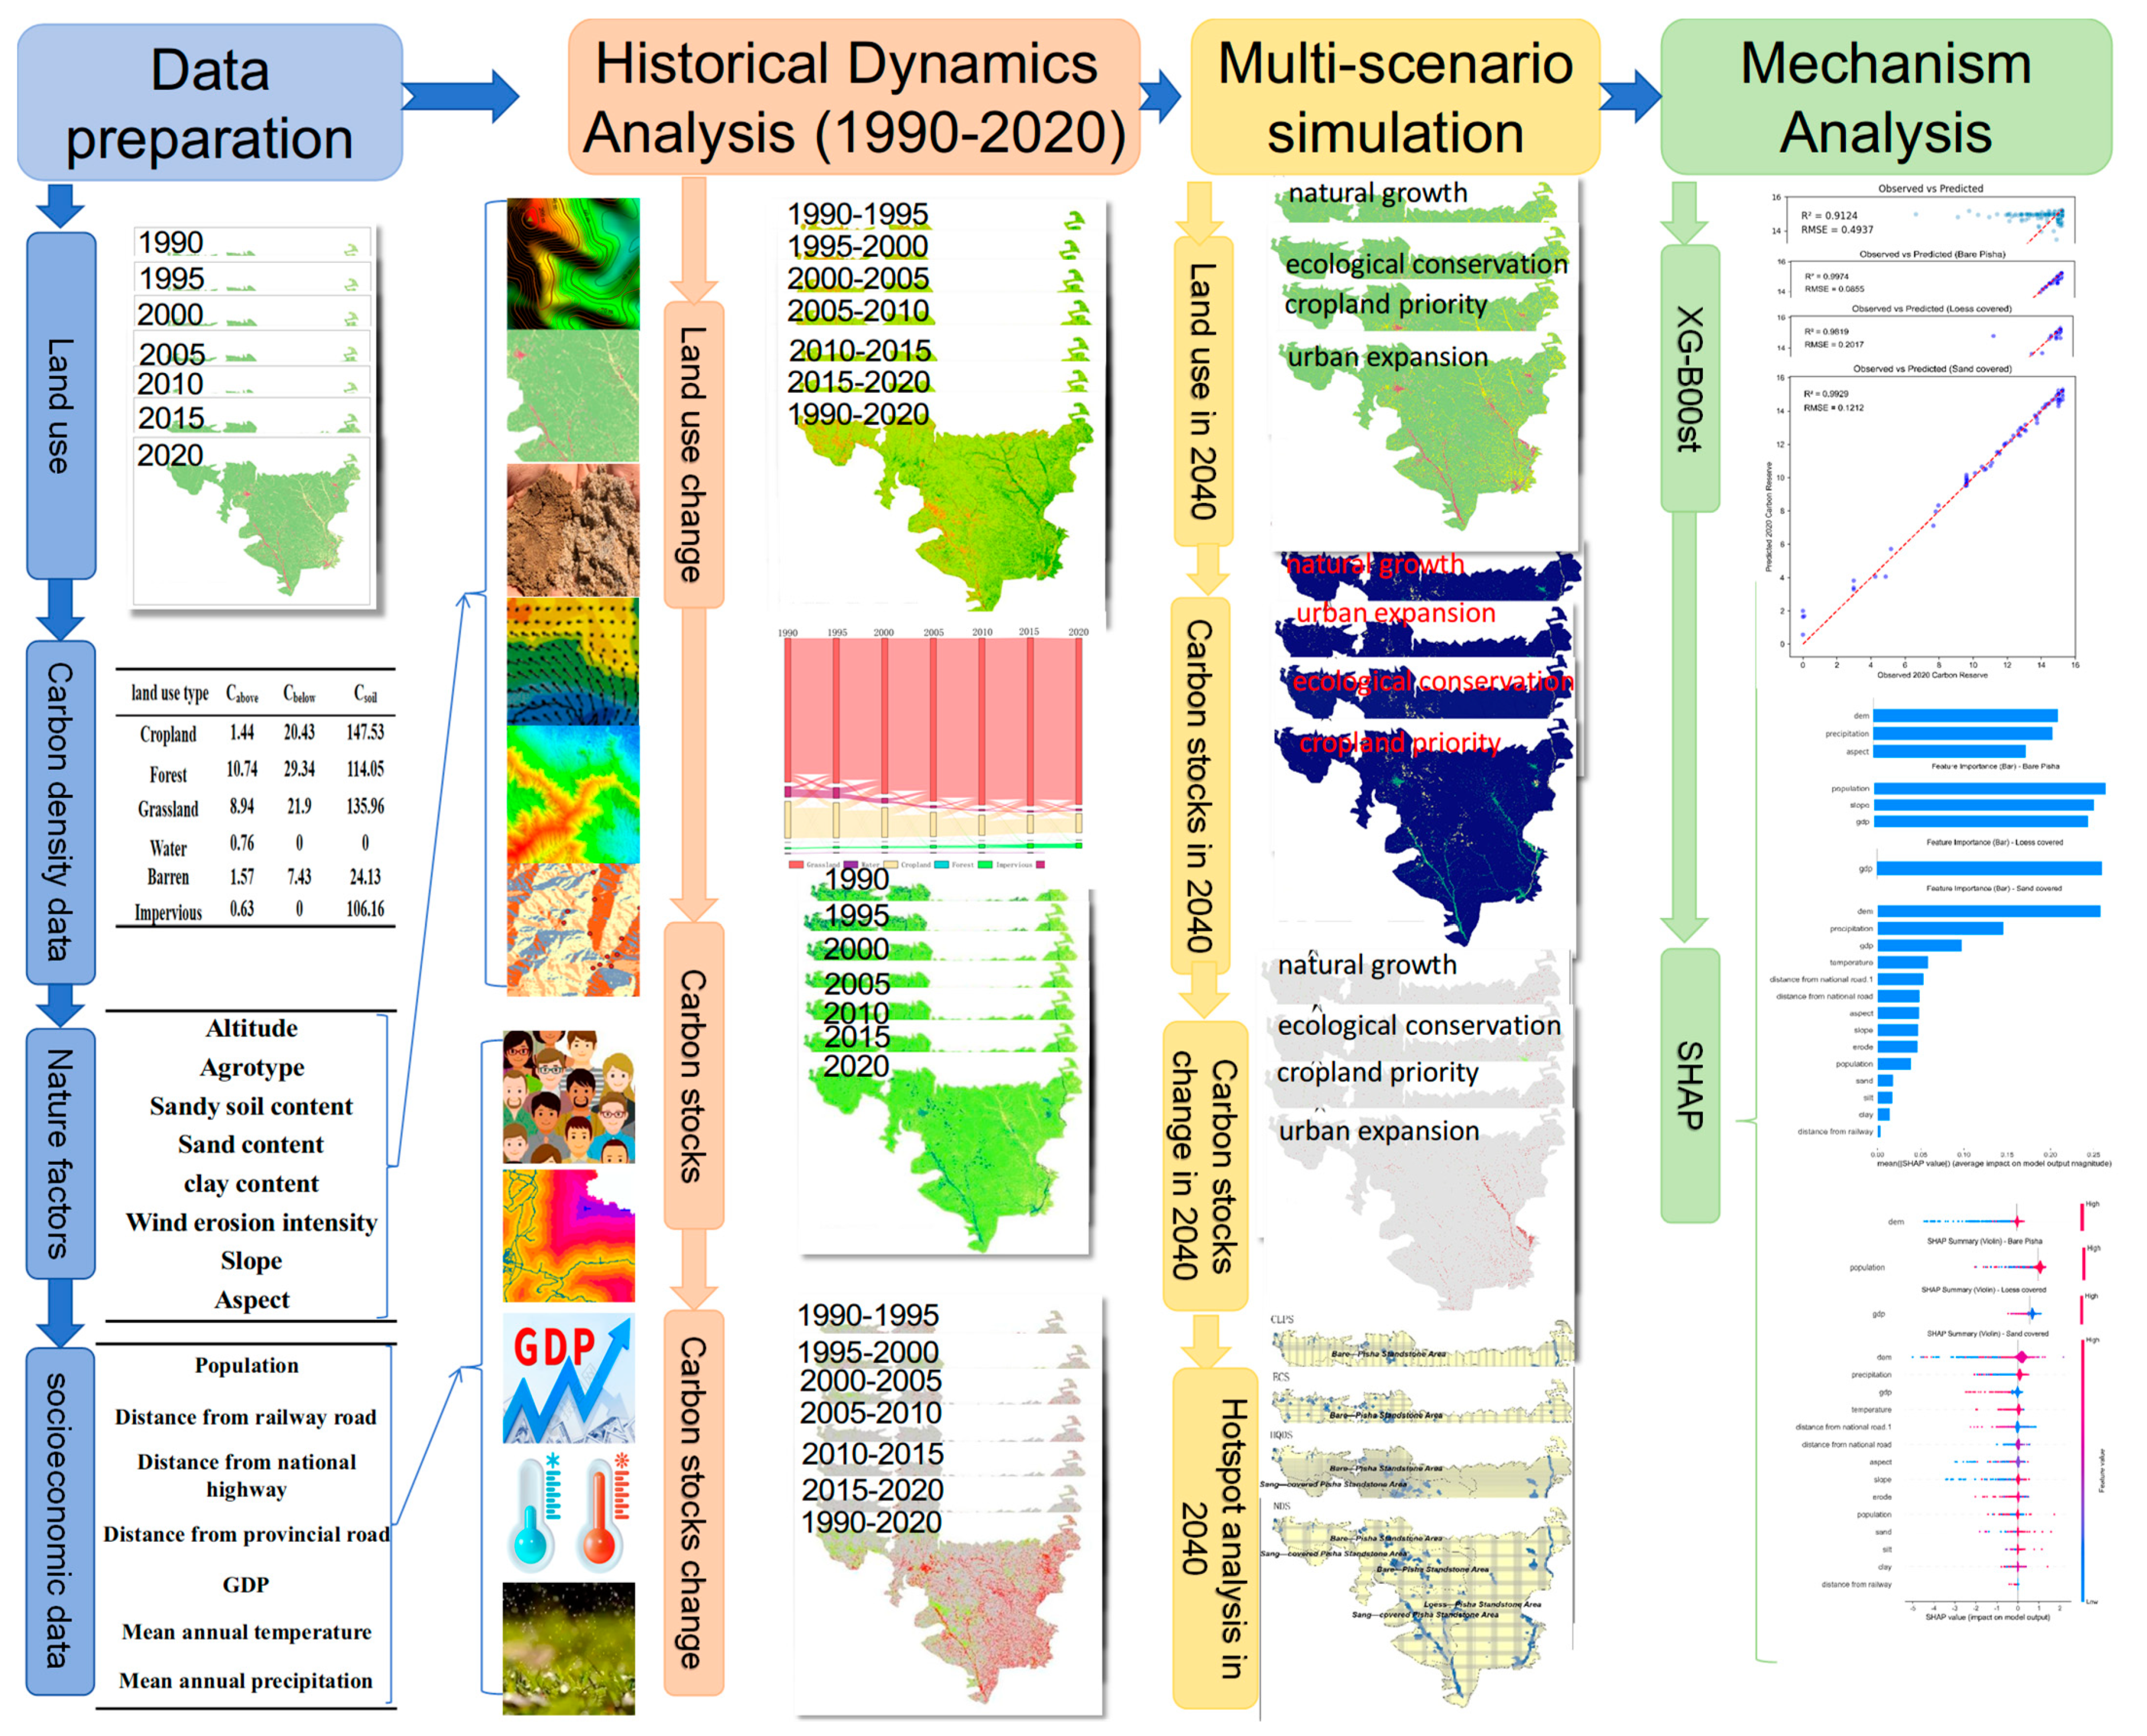
After model training, SHapley Additive exPlanations (SHAP) was introduced to interpret the contribution of each factor to the XGBoost prediction results. The mean absolute SHAP value was used to rank the global importance of driving factors, while SHAP summary plots were used to identify the direction and non-linear characteristics of each factor’s influence on carbon storage. In addition, SHAP dependence and local explanation results were used to further reveal how specific variables affected carbon storage under different environmental and socioeconomic conditions. This framework enabled this study to link spatial hot spot identification with driver attribution, thereby supporting differentiated carbon sink management in the Pisha sandstone area. The comprehensive research methodology is illustrated in the flowchart in Figure 2.
Figure 2.
Flow process diagram.
4. Results and Analysis
4.1. Land-Use Change Pattern in the Pisha Sandstone Area from 1990 to 2020
As shown in Table 3, the land-use structure of the Pisha sandstone area changed noticeably from 1990 to 2020, although the overall landscape composition remained relatively stable. Grassland was consistently the dominant land-use type, and its proportion remained above 75% after 1995. The areal hierarchy of land-use types was generally maintained as grassland > cropland > barren land > impervious land > water > forest land. This pattern reflects the typical land-cover structure of the semi-arid Pisha sandstone area, where grassland serves as the main ecological land type and plays an important role in maintaining soil and water conservation functions.
Table 3.
Scale of land-use types.
During the study period, cropland decreased from 3178.31 km2 in 1990 to 1657.27 km2 in 2020, while grassland increased from 12,441.65 km2 to 14,372.62 km2. Barren land decreased markedly, from 920.01 km2 to 172.47 km2, which indicates that part of the exposed and degraded land was converted into vegetation-covered land. By contrast, impervious land increased from 125.80 km2 to 444.98 km2, which suggests that construction expansion and human activities gradually intensified. Forest land and water bodies accounted for relatively small proportions of the total area, but forest land showed a slight increase after 2010. Overall, land-use change in the Pisha sandstone area was characterized by grassland expansion, cropland reduction, barren land restoration, and moderate expansion of impervious surfaces.
4.2. Spatial Transfer Characteristics of Land Use from 1990 to 2020
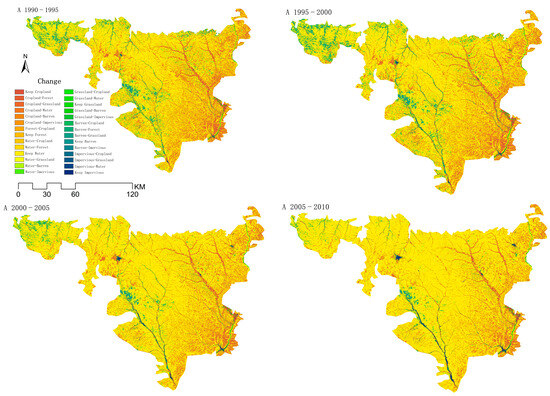
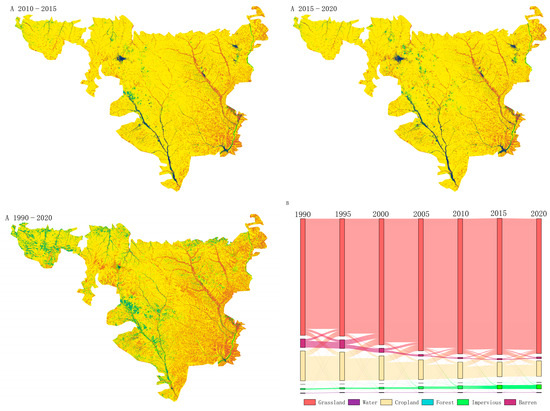
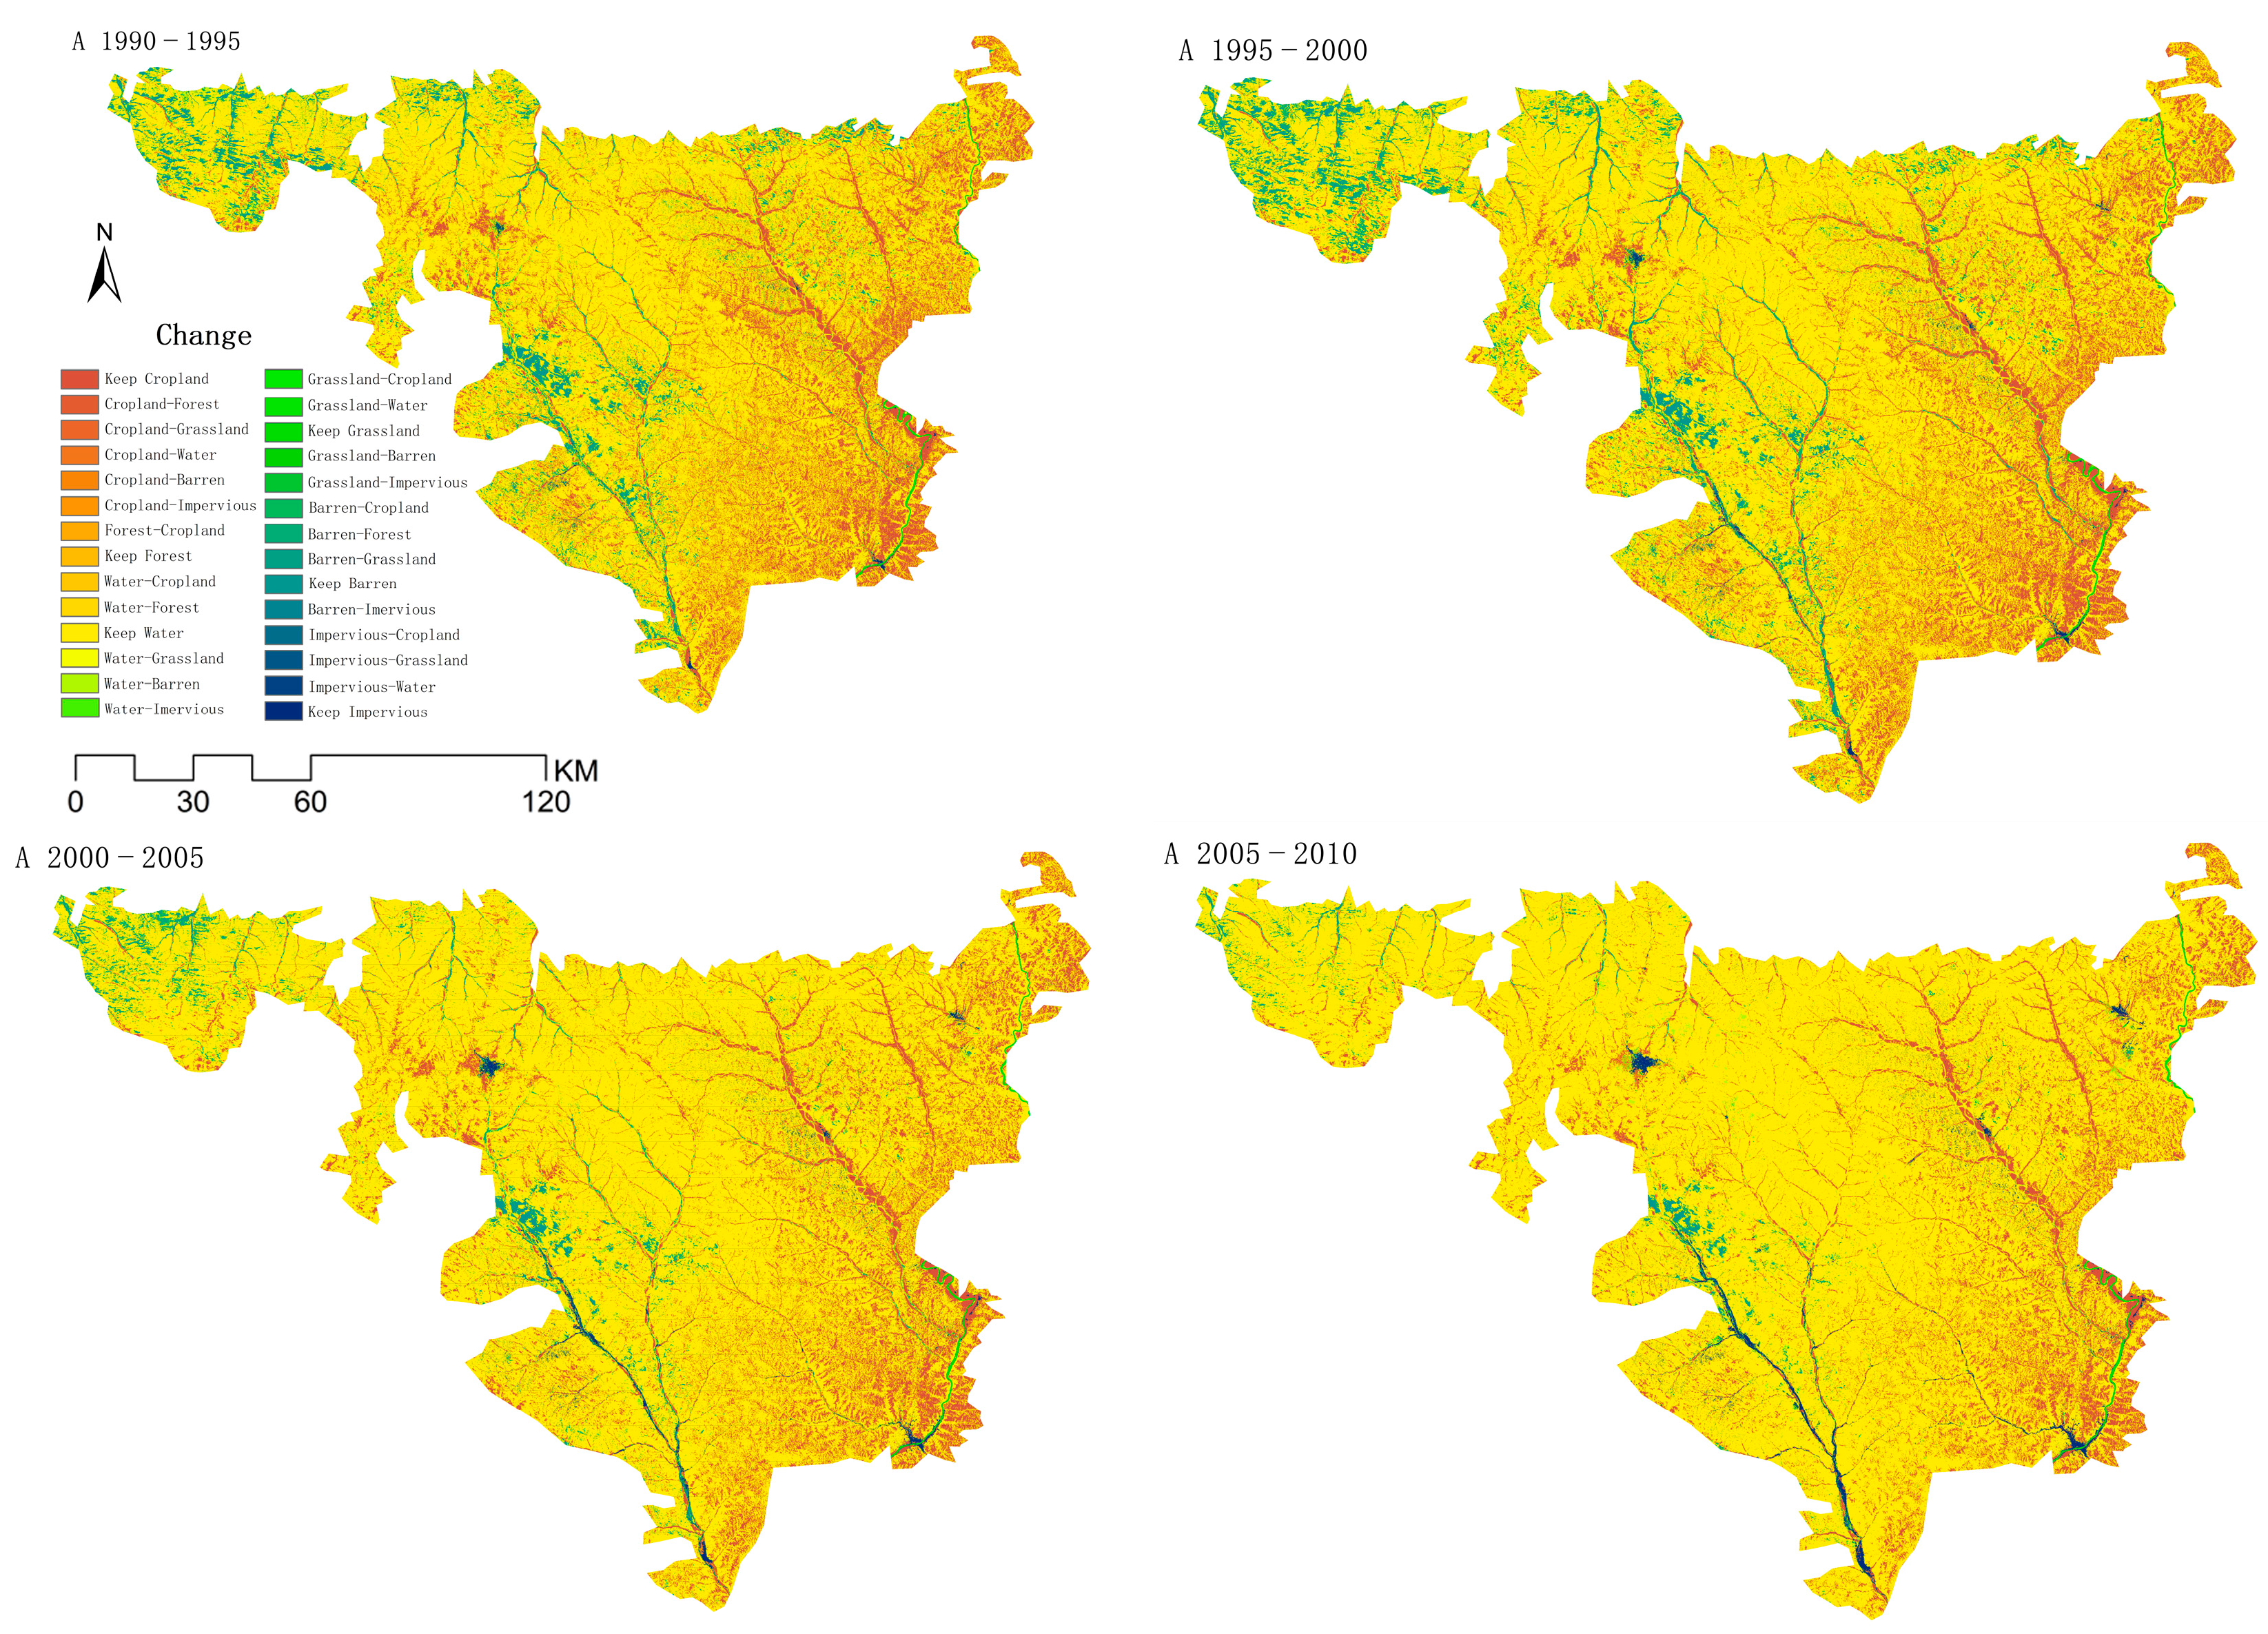
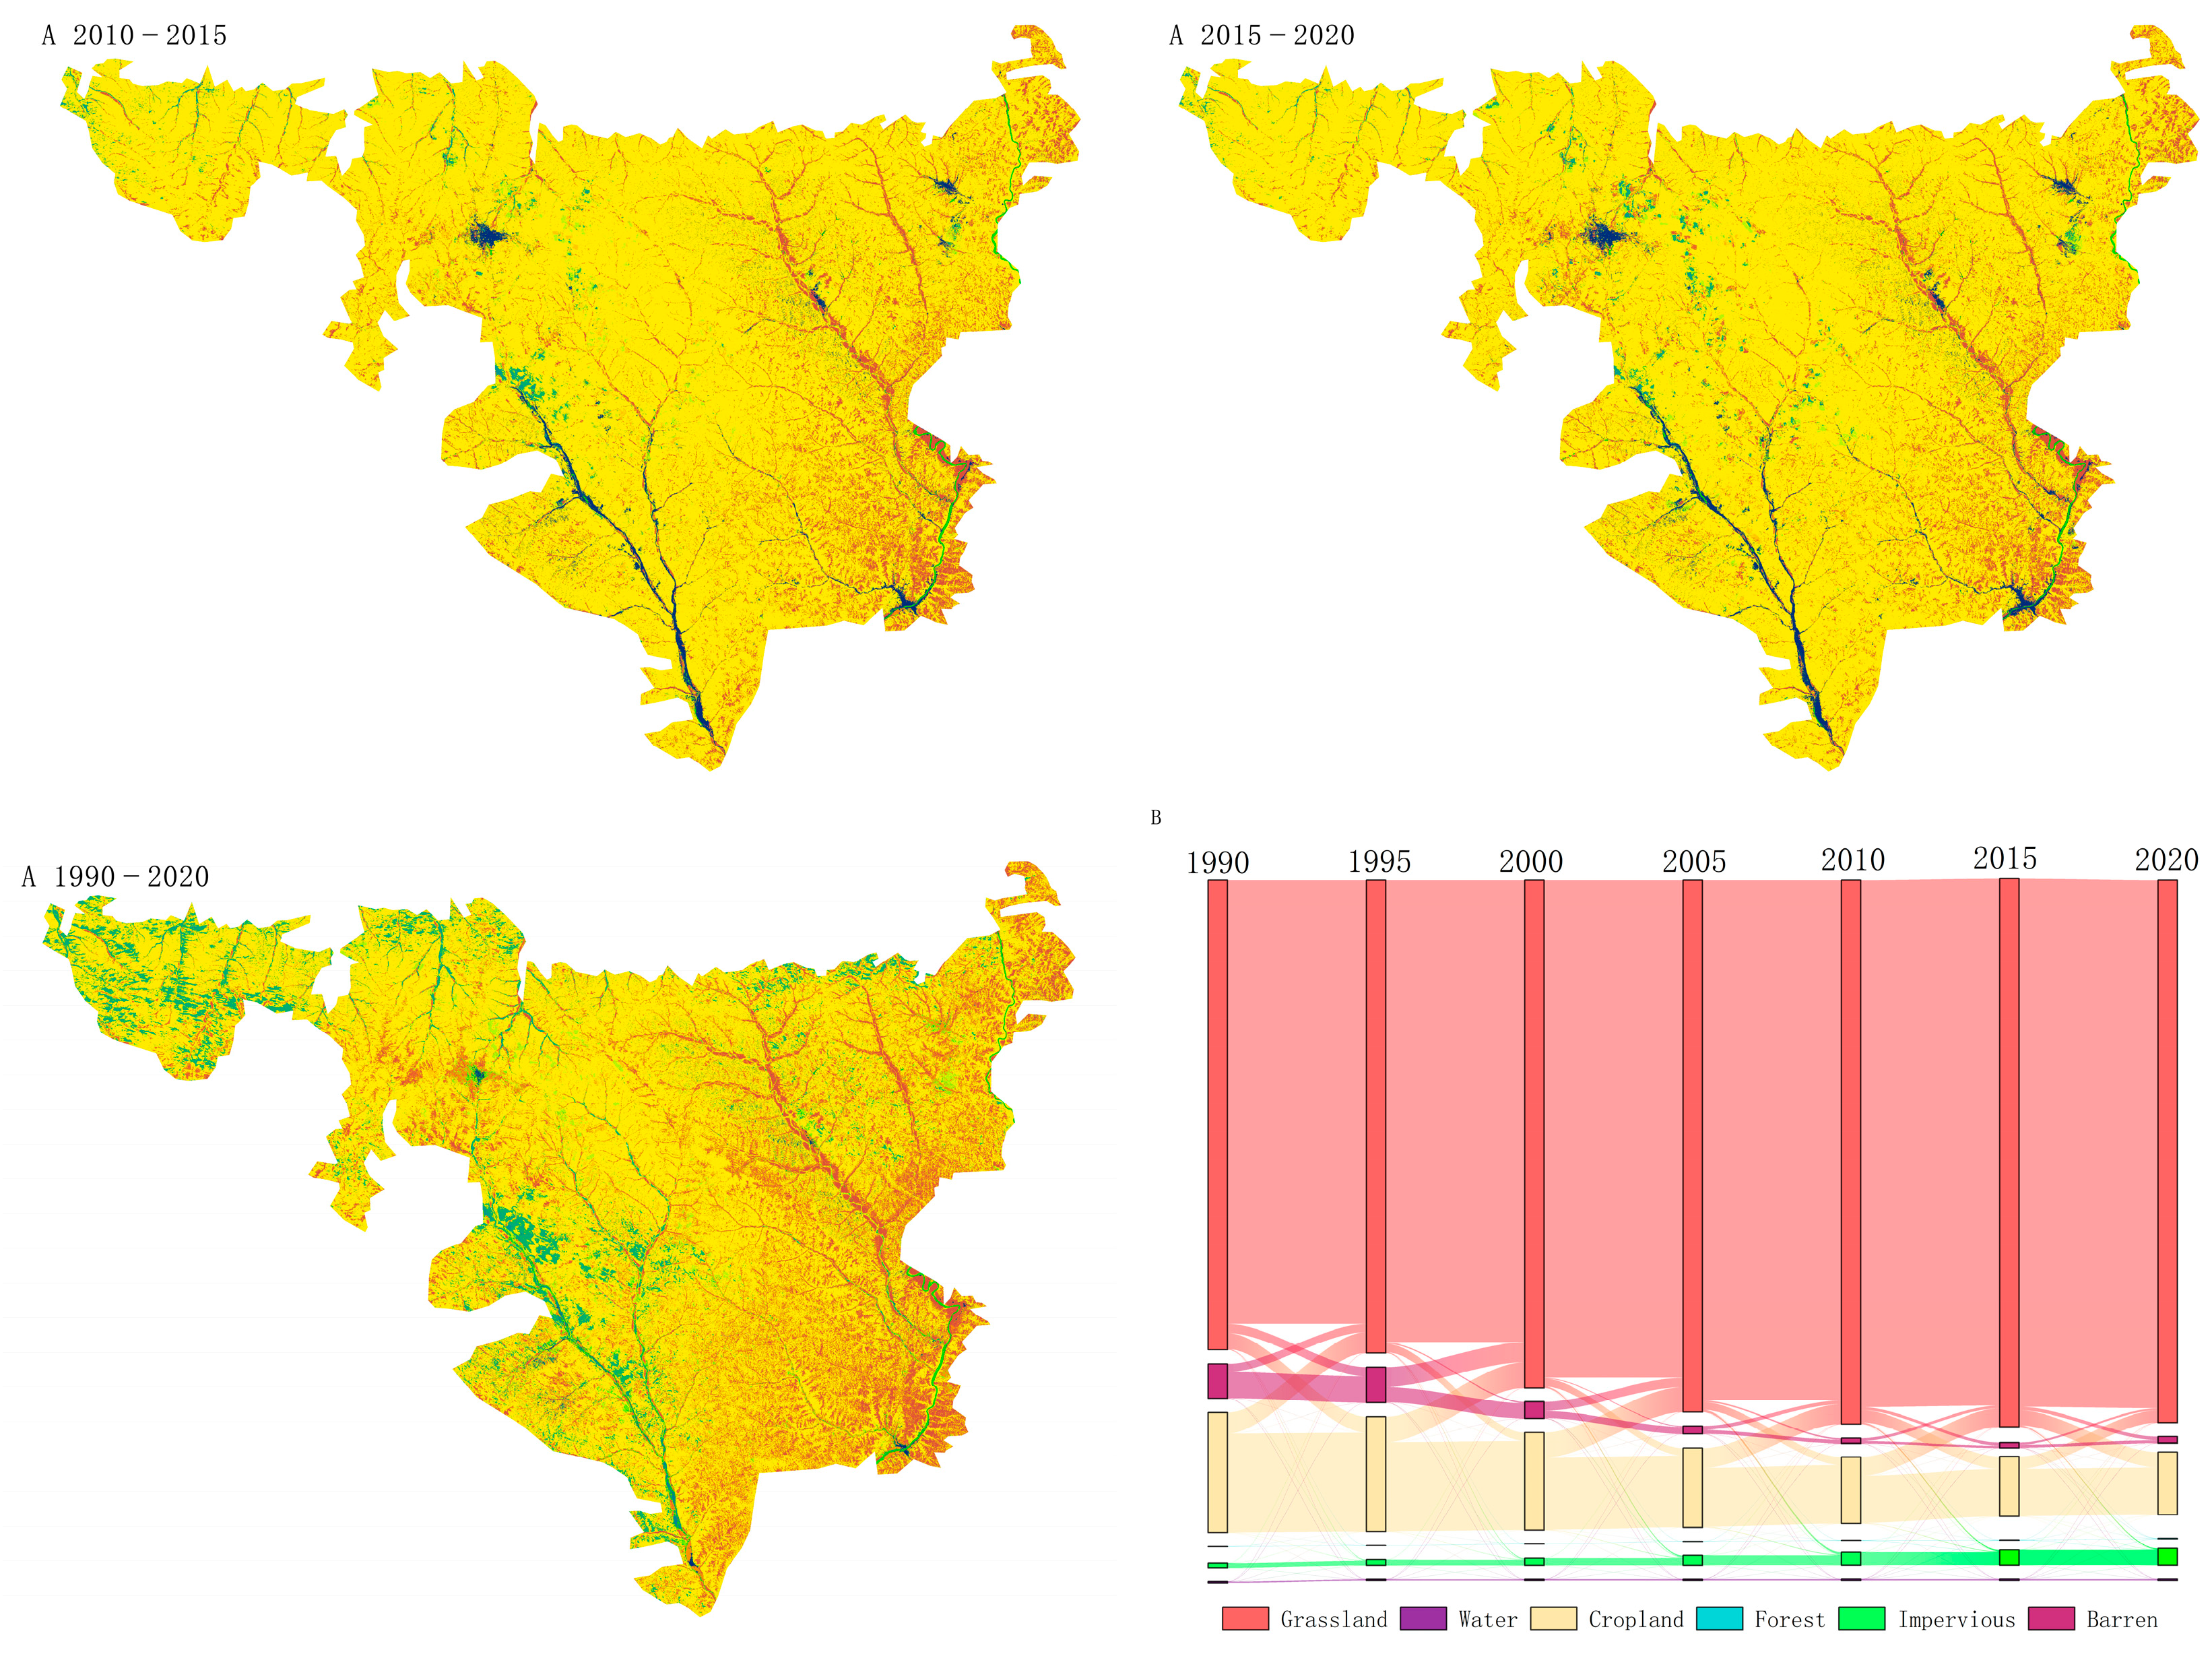
The land-use transfer matrix and Sankey diagram further reveal the main conversion pathways among different land-use types (Figure 3 and Table 4). From 1990 to 2020, grassland showed strong stability, with 81.01% of its initial area remaining unchanged. This indicates that grassland was not only the dominant land-use type but also the most stable landscape matrix in the study area.
Figure 3.
(A) Land-use transfer map of the Pisha sandstone area; (B) Sankey diagram of land-use transfer.
Table 4.
Land-use transfer matrix of Pisha sandstone area from 1990 to 2020.
Cropland experienced substantial conversion during the study period. A large proportion of cropland was converted to grassland, which reflects the influence of ecological restoration and land consolidation policies. Barren land showed the most pronounced transformation, with more than 88% of its initial area converted mainly to grassland. This conversion pathway indicates that vegetation restoration on exposed or degraded land was a major contributor to the improvement of regional ecological conditions. In comparison, water bodies and forest land showed relatively limited spatial changes because of their small initial areas. Impervious land remained spatially limited, but its expansion was mainly associated with the conversion of cropland and grassland around areas of stronger human activity.
These transfer characteristics suggest that the historical land-use change in the Pisha sandstone area was jointly shaped by ecological restoration and socioeconomic development. The conversion of barren land to grassland contributed positively to ecological recovery, whereas the expansion of impervious land represented a potential pressure on carbon storage and ecosystem stability.
4.3. Spatiotemporal Changes in Carbon Storage
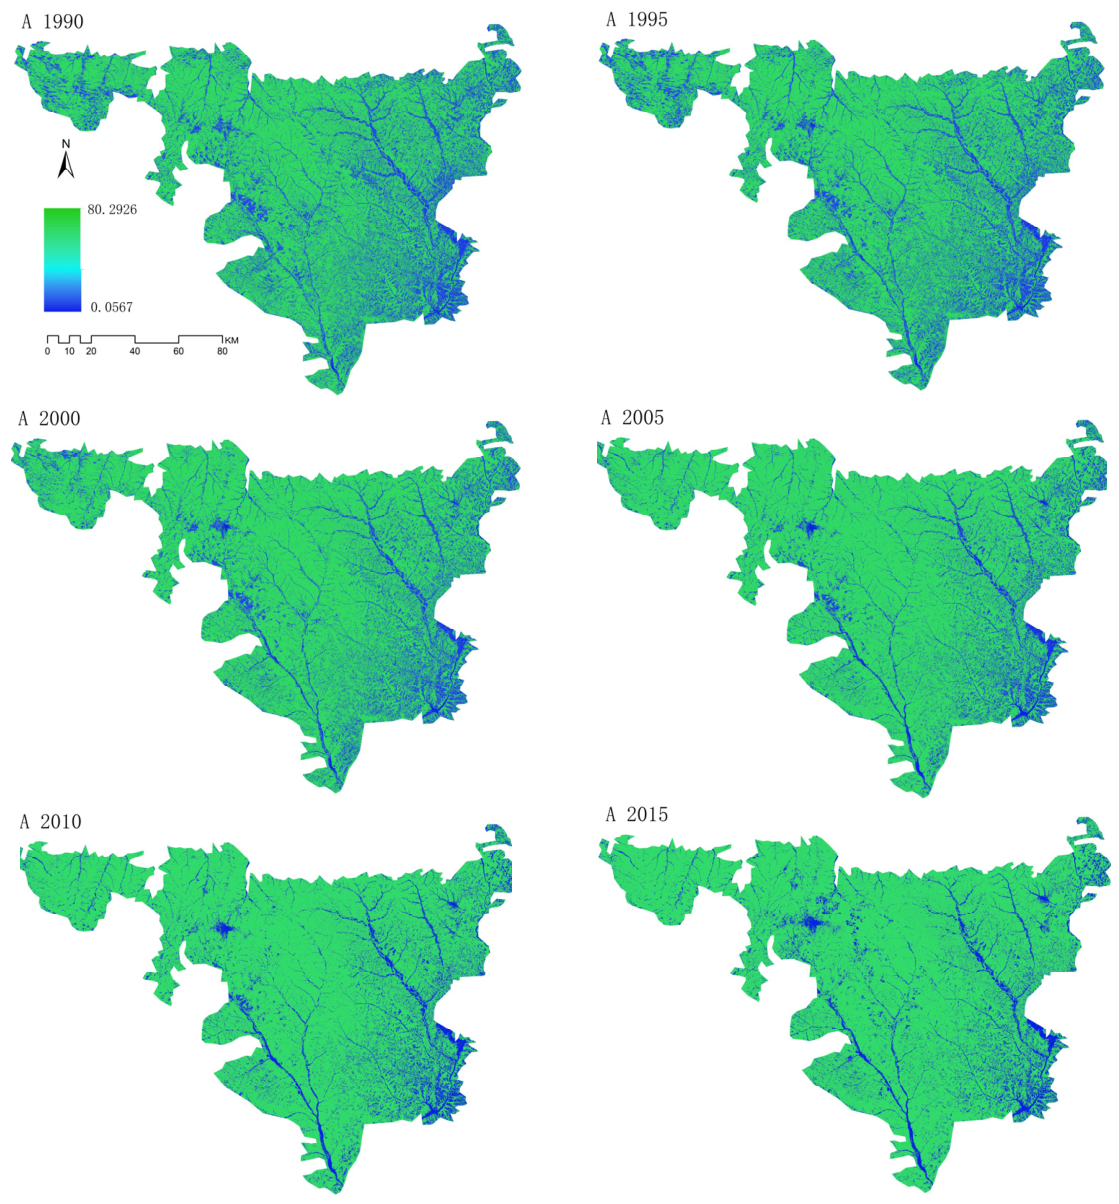
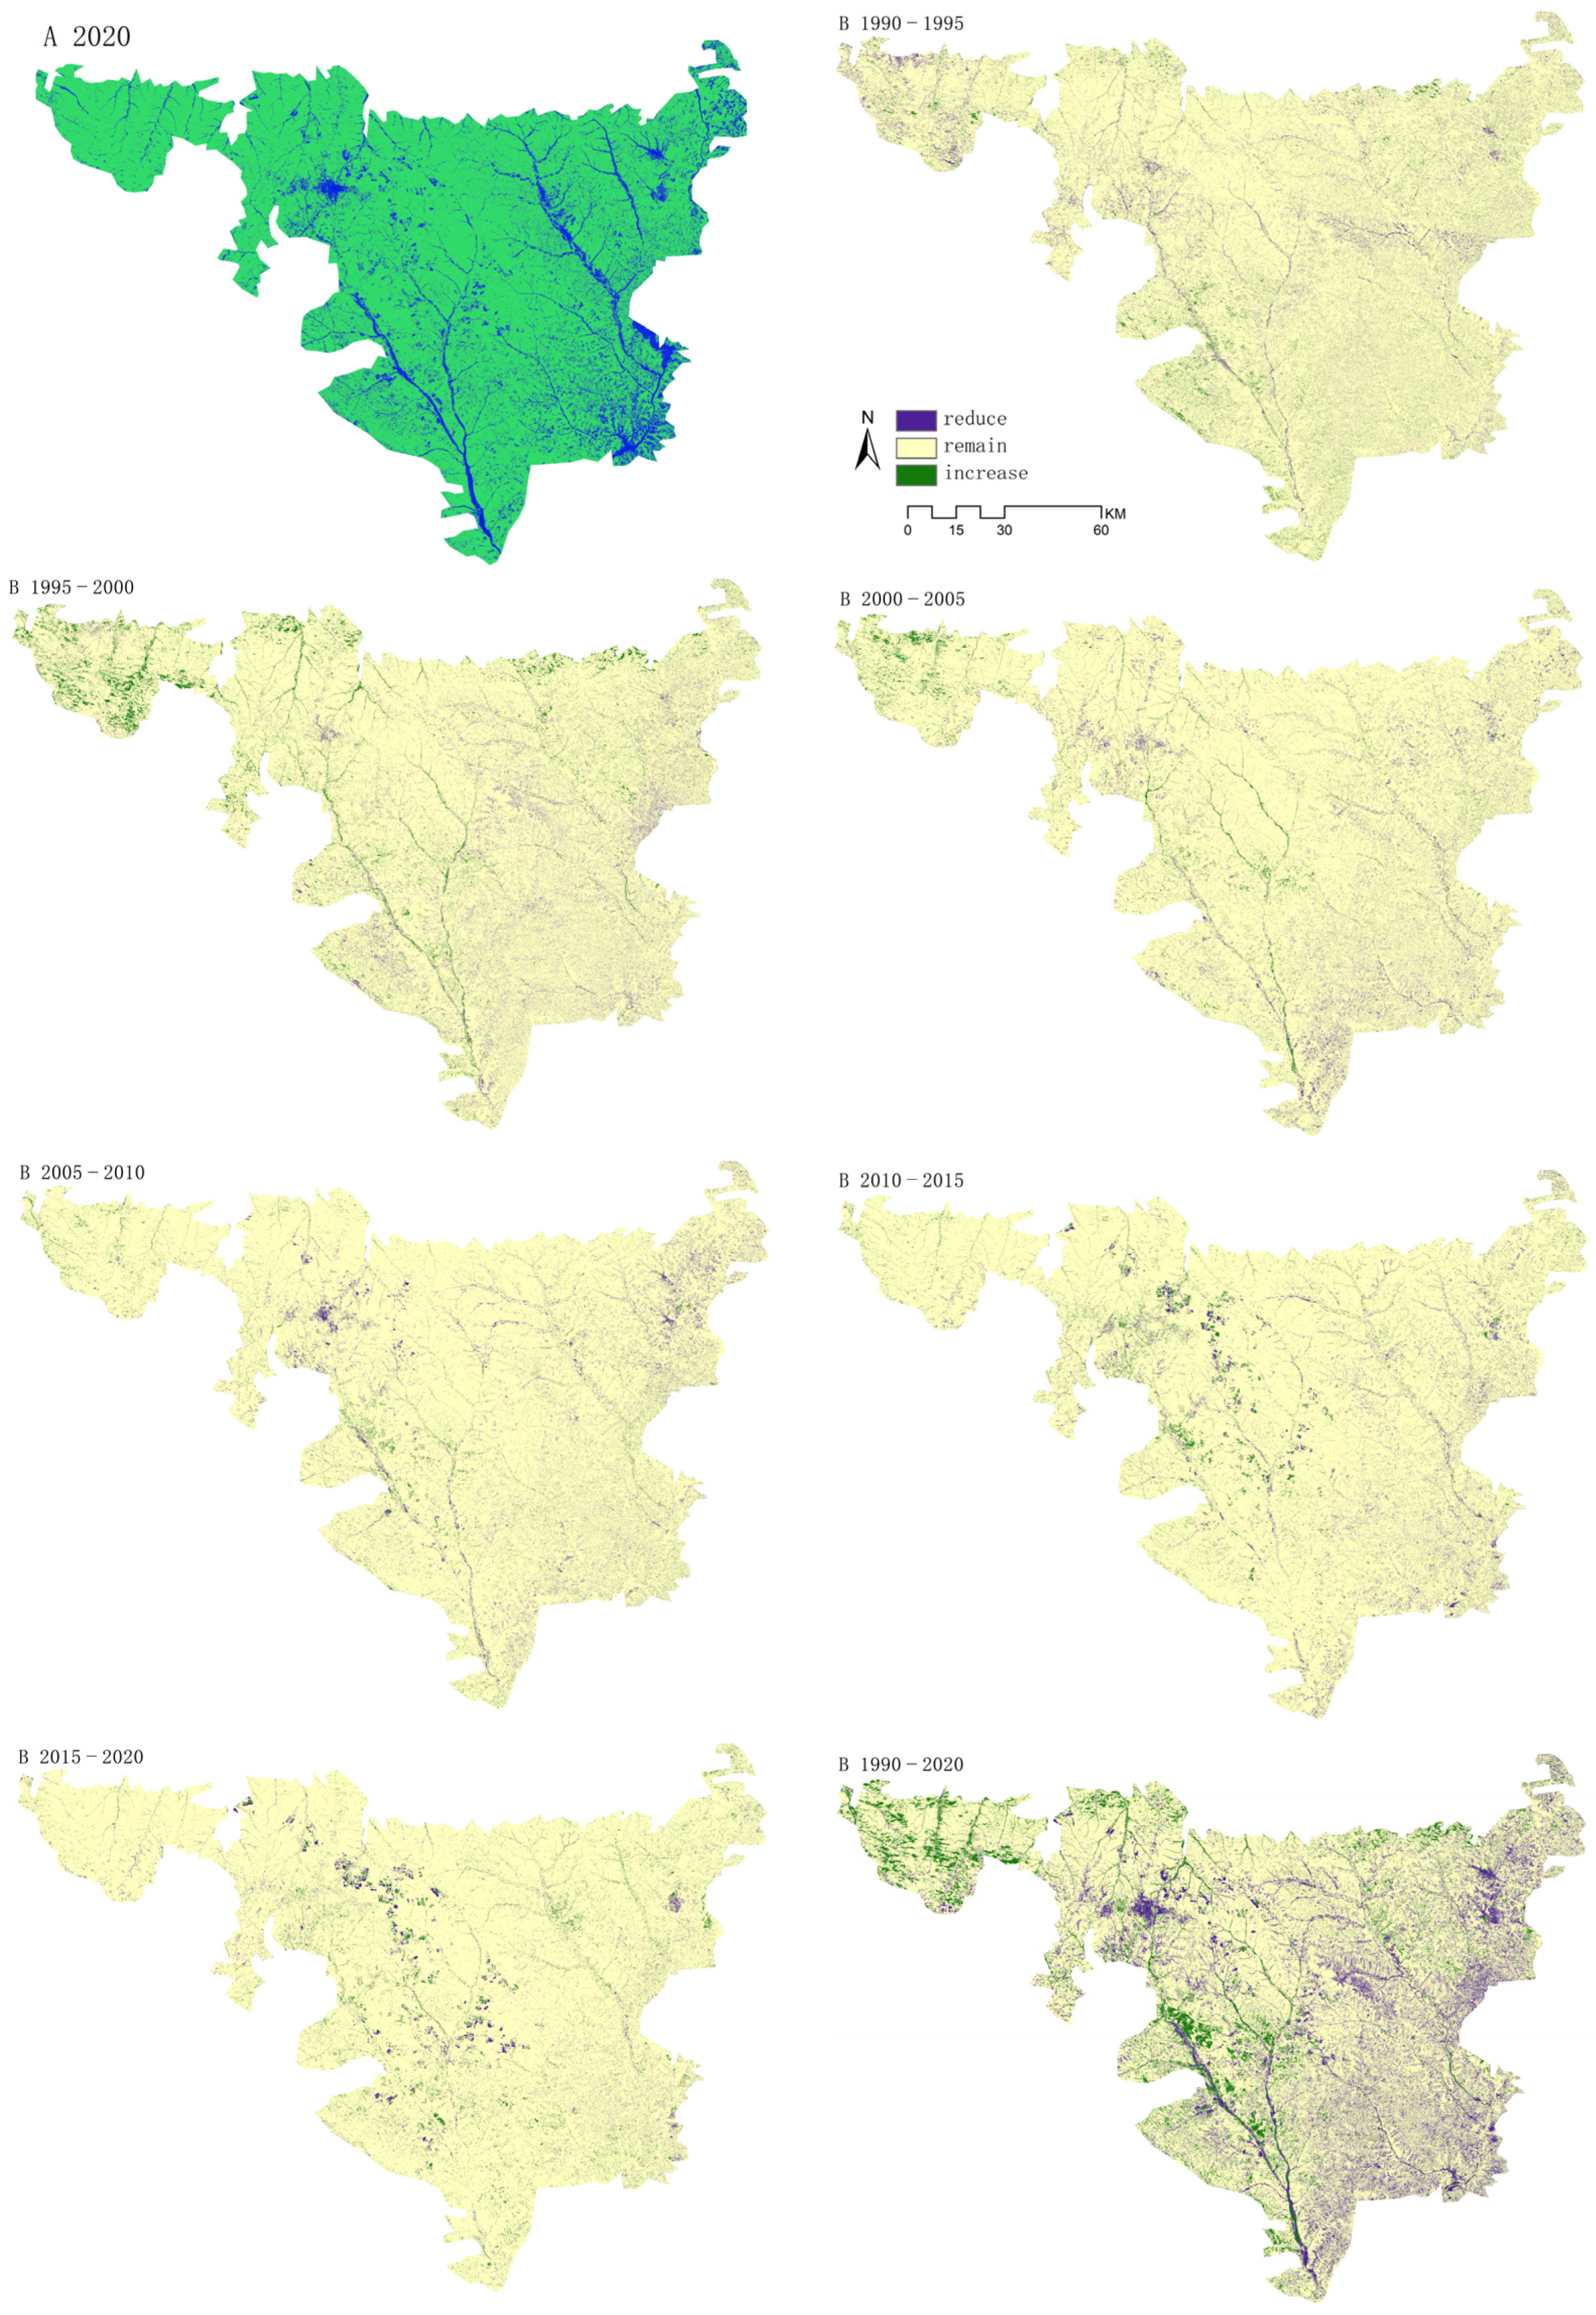
The InVEST-based carbon-storage estimation showed that total carbon storage in the Pisha sandstone area exhibited a fluctuating but overall increasing trend from 1990 to 2020. Total carbon storage increased from 2.658 × 10⁵ tC in 1990 to 2.734 × 10⁵ tC in 2020, with a net increase of 7.591 × 10³ tC. The temporal trajectory was not strictly linear. Carbon storage decreased slightly during 1990–1995, increased markedly during 1995–2000, accumulated more slowly during 2000–2010, and then declined slightly again during 2010–2020. This staged pattern indicates that short-term carbon-storage changes were sensitive to land-use transitions, while the long-term trend was mainly supported by the expansion and stabilization of grassland.
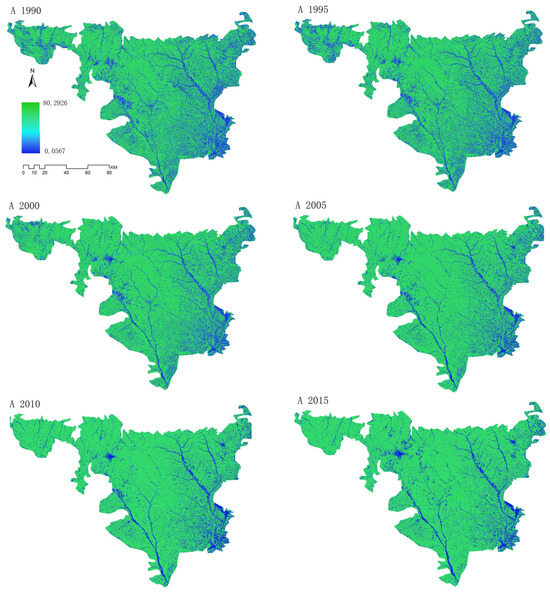
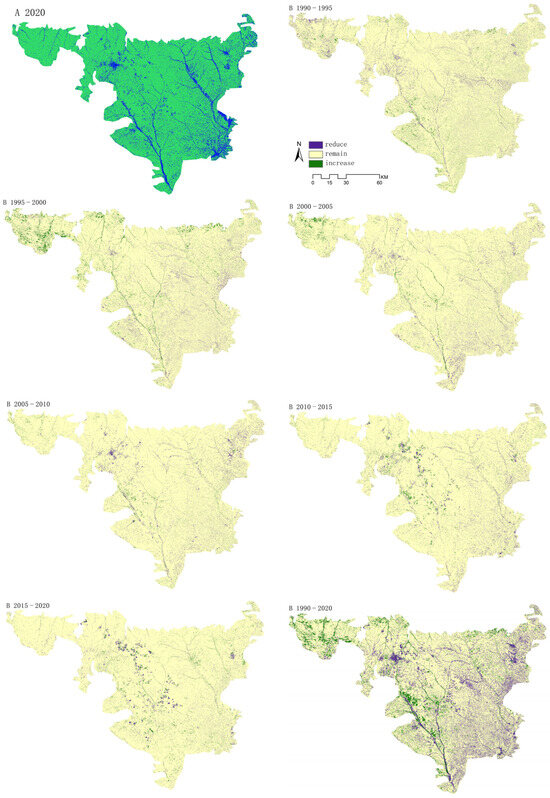
Spatially, carbon-storage change showed clear heterogeneity (Figure 4). Areas of carbon increase and decrease formed a mixed pattern of scattered point-like changes and locally aggregated patches. Over the full period of 1990–2020, carbon increase was mainly associated with areas where barren land or cropland was converted to grassland, especially in gully regions and ecological restoration zones. Carbon decrease was mainly concentrated in areas affected by construction expansion or the degradation of vegetation-covered land. These spatial patterns indicate that the carbon effect of land-use change was not uniform across the region but rather was closely related to the location and type of land conversion.
Figure 4.
(A) Carbon-storage distribution in the Pisha sandstone area; (B) Carbon-storage change in the Pisha sandstone area.
4.4. Multi-Scenario Simulation and Hot Spot Analysis of Carbon Storage in 2040
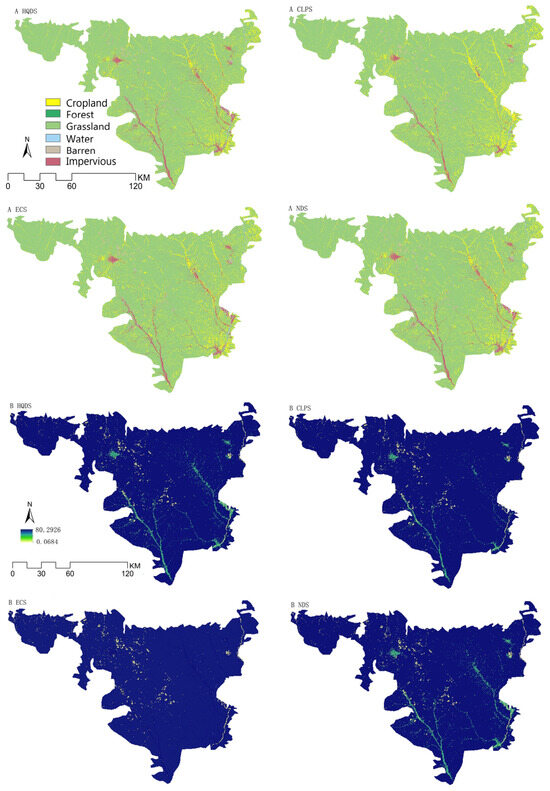
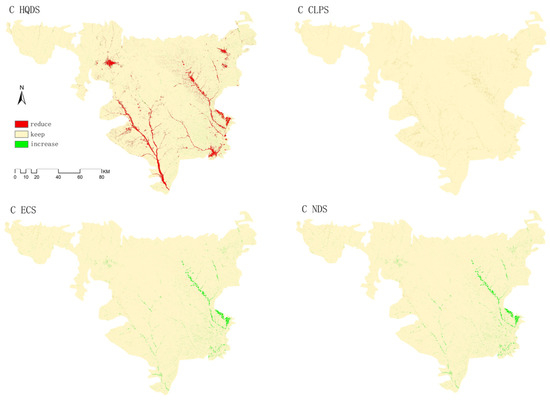
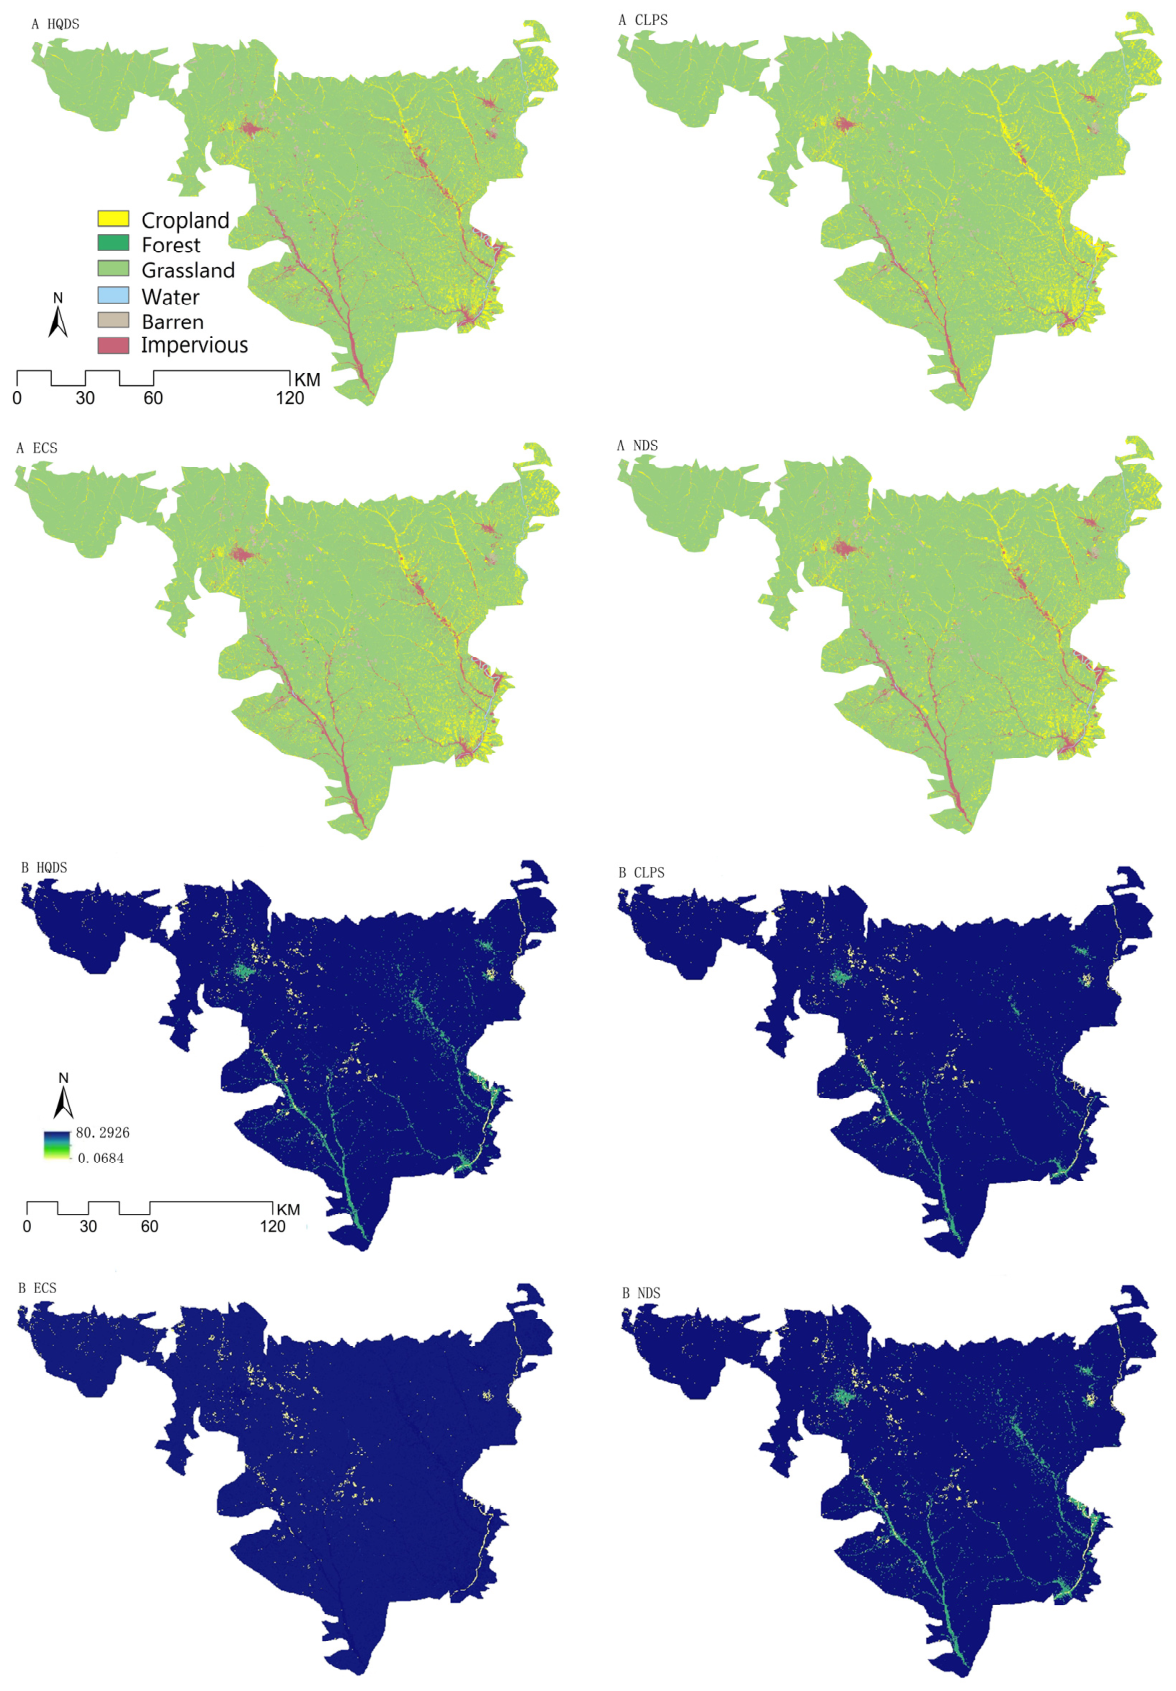
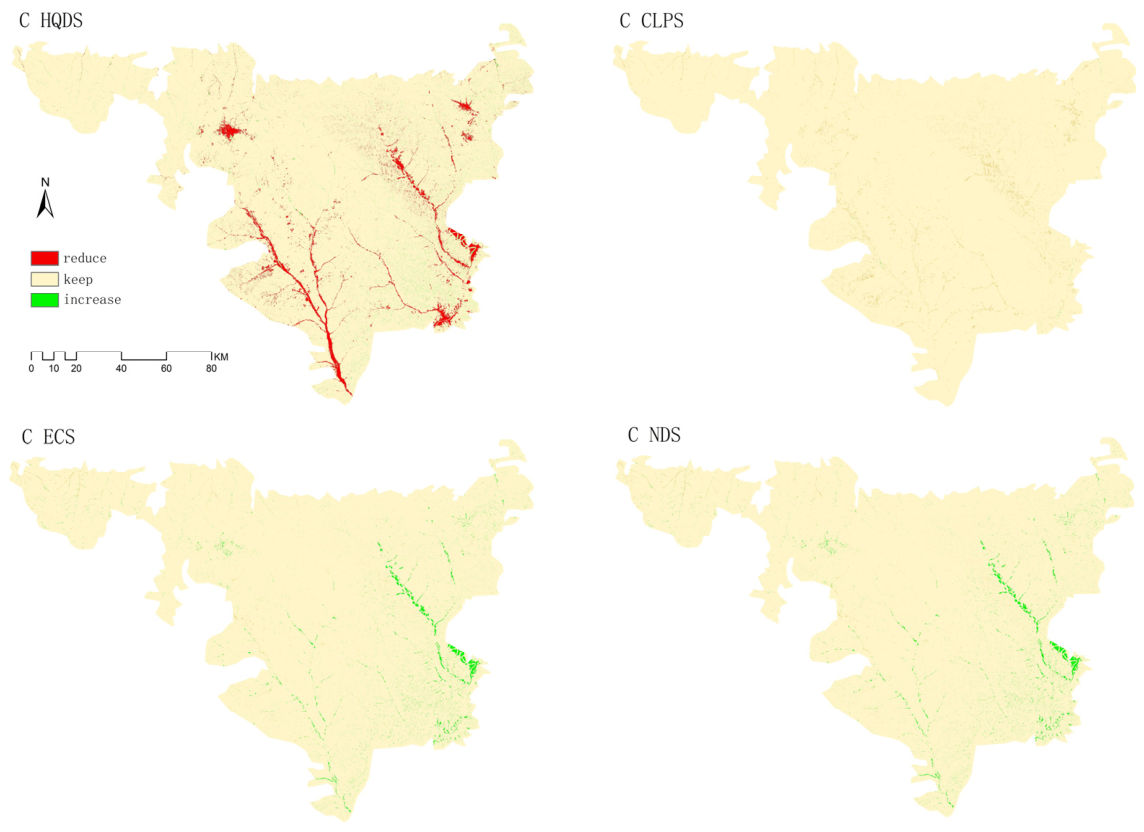
Based on the PLUS model, future land-use patterns in 2040 were simulated under four scenarios: the Natural Development Scenario (NDS), Cultivated Land Protection Scenario (CLPS), Ecological Conservation Scenario (ECS), and High-Quality Development Scenario (HQDS). Across all scenarios, grassland remained the dominant landscape type, exhibiting strong path dependence in the regional land-use structure. However, the proportions and spatial configuration of cropland, barren land, and impervious land varied among scenarios, resulting in different carbon-storage outcomes (Figure 5).
Figure 5.
(A) Multi-scenario land simulation; (B) carbon reserve distribution; (C) carbon reserve change.
After coupling the simulated land-use maps with the InVEST carbon-storage module, the projected carbon-storage values showed clear scenario differences. The ECS produced the highest projected carbon storage, reaching 3.194 × 10⁵ tC in 2040. This result was mainly associated with the expansion and protection of ecological land, especially grassland, and the conversion of barren land into vegetation-covered land. The CLPS showed a moderate carbon-storage level of 2.744 × 10⁵ tC, reflecting the stabilizing effect of cropland protection, although its carbon enhancement potential was limited by strict agricultural land constraints.
In comparison, the HQDS and NDS showed lower projected carbon-storage values, at 2.728 × 10⁵ tC and 2.727 × 10⁵ tC, respectively. Under the HQDS, the relatively low carbon storage was mainly related to the expansion of impervious land and the occupation of ecological or agricultural land in areas with stronger socioeconomic accessibility. Under the NDS, the lower carbon storage reflected the continuation of historical land-use inertia without additional ecological restoration constraints. These results indicate that ecological conservation measures can substantially improve future carbon storage, whereas development-oriented or passive pathways may weaken regional carbon sink potential.
Spatially, high-carbon-value areas remained concentrated in large and continuous grassland patches, while low-carbon-value areas were mainly distributed along valley corridors and the southern agro-urban transition zone and around scattered construction land. This pattern suggests that the key management challenge is not only to increase total carbon storage but also to prevent the fragmentation of high-carbon ecological patches and the further expansion of low-carbon land uses in sensitive transition areas.
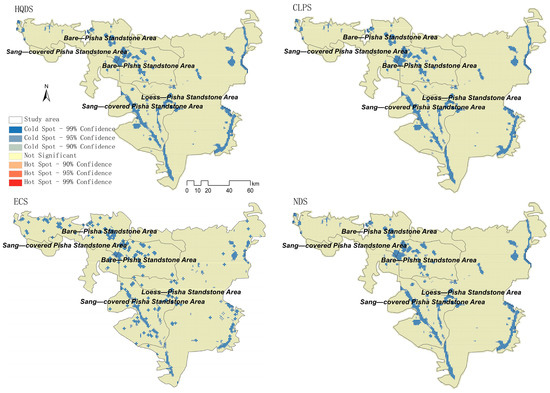
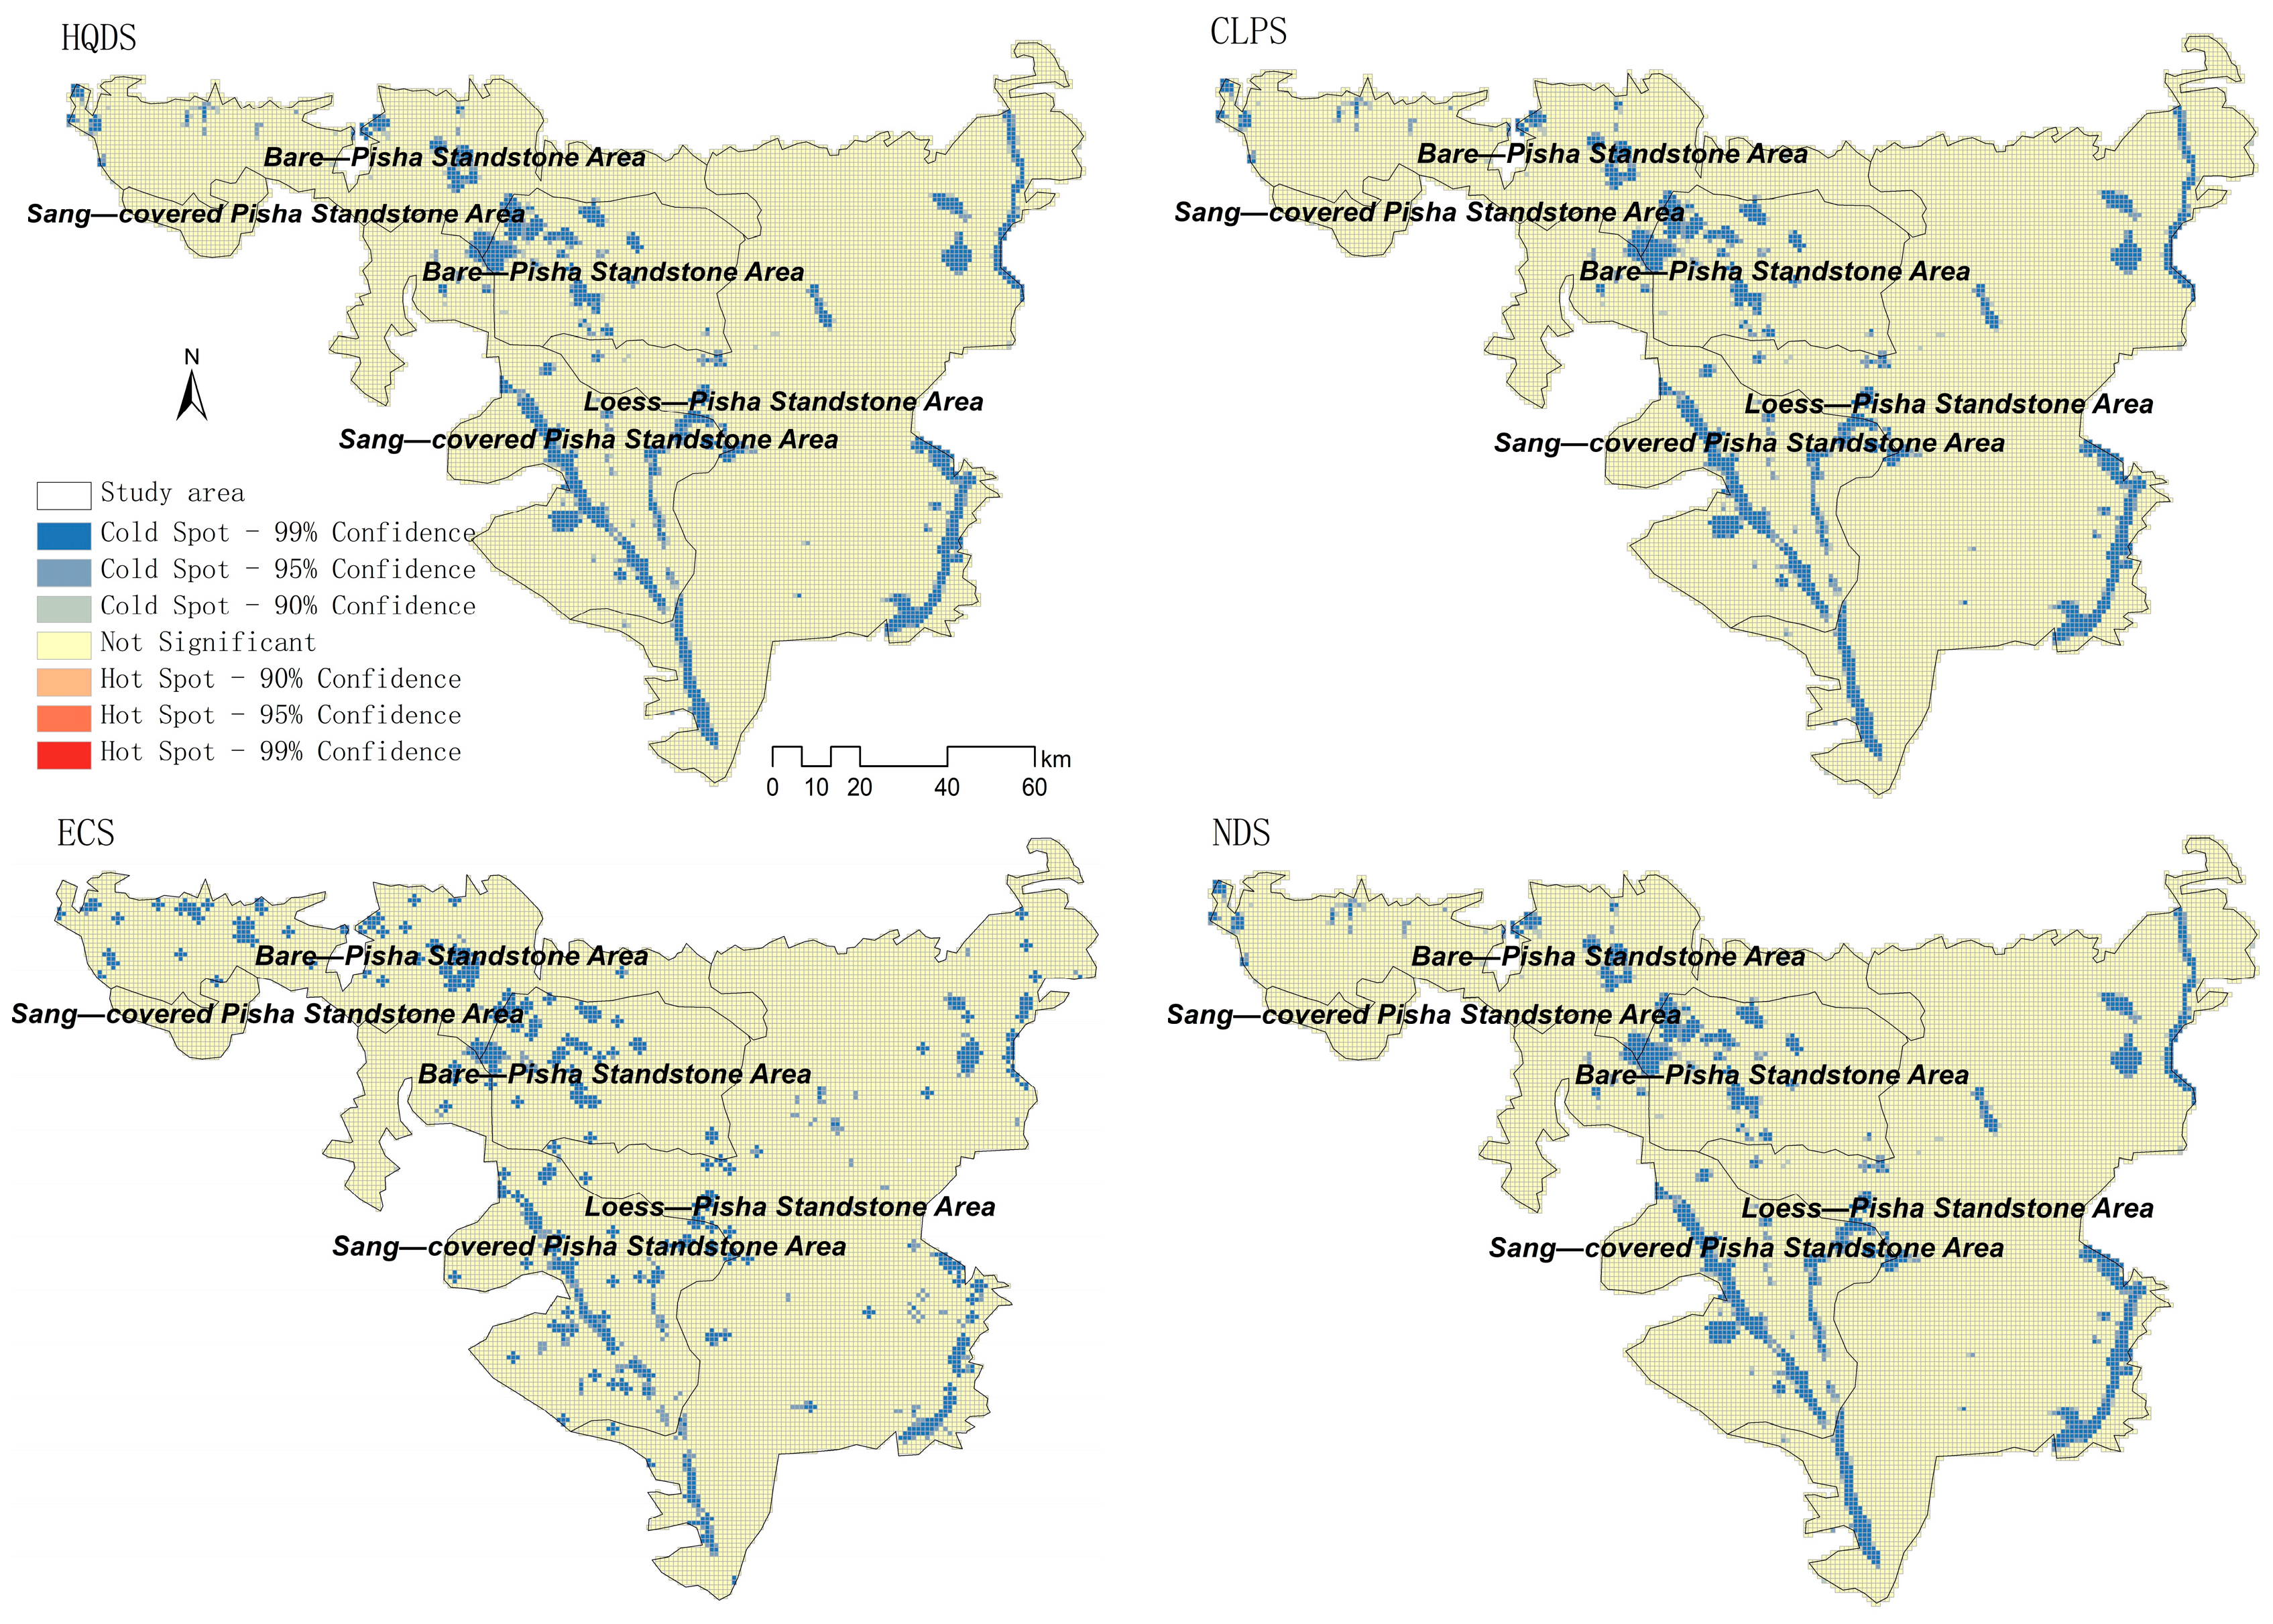
To further identify the spatial clustering characteristics of future carbon storage, hot spot and cold spot analysis was conducted for the four 2040 scenarios (Figure 6). The results showed a clear asymmetry between hot spots and cold spots. Significant cold spots were much more widely expressed than hot spots, while high-carbon hot spots were relatively limited or weakly clustered. This indicates that the main spatial risk of future carbon storage is not the lack of isolated high-carbon patches but rather the persistent clustering of low-carbon areas. Across the four scenarios, cold spots formed a relatively stable spatial skeleton along valley and gully corridors, marginal transition zones, the eastern river corridor, and locally disturbed construction patches. Therefore, the low-carbon areas were not randomly distributed but rather were spatially concentrated in zones where geomorphic constraints, land-use disturbance, and ecological vulnerability overlapped.
Figure 6.
Hot spot and cold spot patterns of projected carbon storage under four 2040 scenarios. Blue clusters indicate statistically significant cold spots; red clusters indicate statistically significant hot spots. Cold spots are mainly concentrated along valley corridors, marginal transition zones, and locally disturbed patches.
More importantly, the cold spot patterns showed evident differences among the three Pisha sandstone subregions shown in Figure 6. In the bare Pisha sandstone areas, cold spots appeared as discontinuous patches and narrow belts in the central and northern parts of the study area, especially near transitional zones. This pattern suggests that low carbon storage in bare Pisha sandstone areas may be closely related to exposed surface conditions, stronger erosion sensitivity, slope fragmentation, and local human disturbance. In the loess-covered Pisha sandstone areas, cold spots were mainly distributed along valley corridors, the eastern boundary belt, and mixed cropland–construction margins, indicating that terrain incision, accessibility, and socioeconomic pressure may jointly shape low-carbon clustering. In the sand-covered Pisha sandstone areas, cold spots were concentrated along the southwestern and southern gully systems and marginal belts, suggesting that water availability, elevation, and vegetation stability may play a more important role in controlling carbon storage.
Scenario comparison further showed that the ECS reduced the continuity of some low-carbon clusters by strengthening ecological land protection and vegetation restoration, although geomorphically constrained cold spots along major valleys and gullies still remained. By contrast, the NDS and HQDS retained more continuous cold spot belts in development-sensitive areas and fragile transition zones, which reflects the persistence of historical land-use inertia and socioeconomic expansion pressure. The CLPS effectively stabilized cropland, but cold spots were still evident where cropland, construction land, and fragile valley environments were spatially interwoven. This indicates that cropland protection alone cannot fully offset carbon loss risk if ecological restoration and land-use regulation are not coordinated across different Pisha sandstone subregions.
These hot spot and cold spot results provide an important spatial basis for the subsequent XGBoost–SHAP attribution analysis. The overlap between cold spots and the bare, loess-covered, and sand-covered Pisha sandstone units suggests that similar low-carbon outcomes may be driven by different mechanisms in different geomorphic subregions. Therefore, a whole-region driver ranking alone may mask important regional heterogeneity. On this basis, the following XGBoost–SHAP analysis further separates the study area into different Pisha sandstone subregions to identify whether topography, water availability, erosion-related factors, accessibility, and socioeconomic pressure contribute differently to carbon-storage prediction. In this way, the hot spot/cold spot analysis serves not only as a spatial diagnostic tool but also as the zoning foundation for differentiated driver attribution and targeted carbon sink management.
4.5. Whole-Region and Subregional XGBoost–SHAP Attribution of Carbon-Storage Drivers
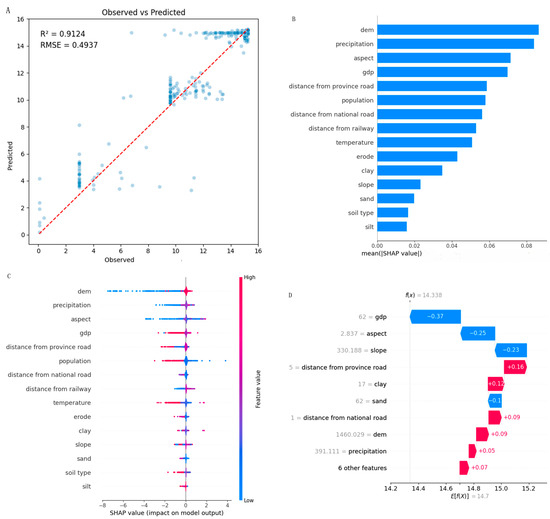
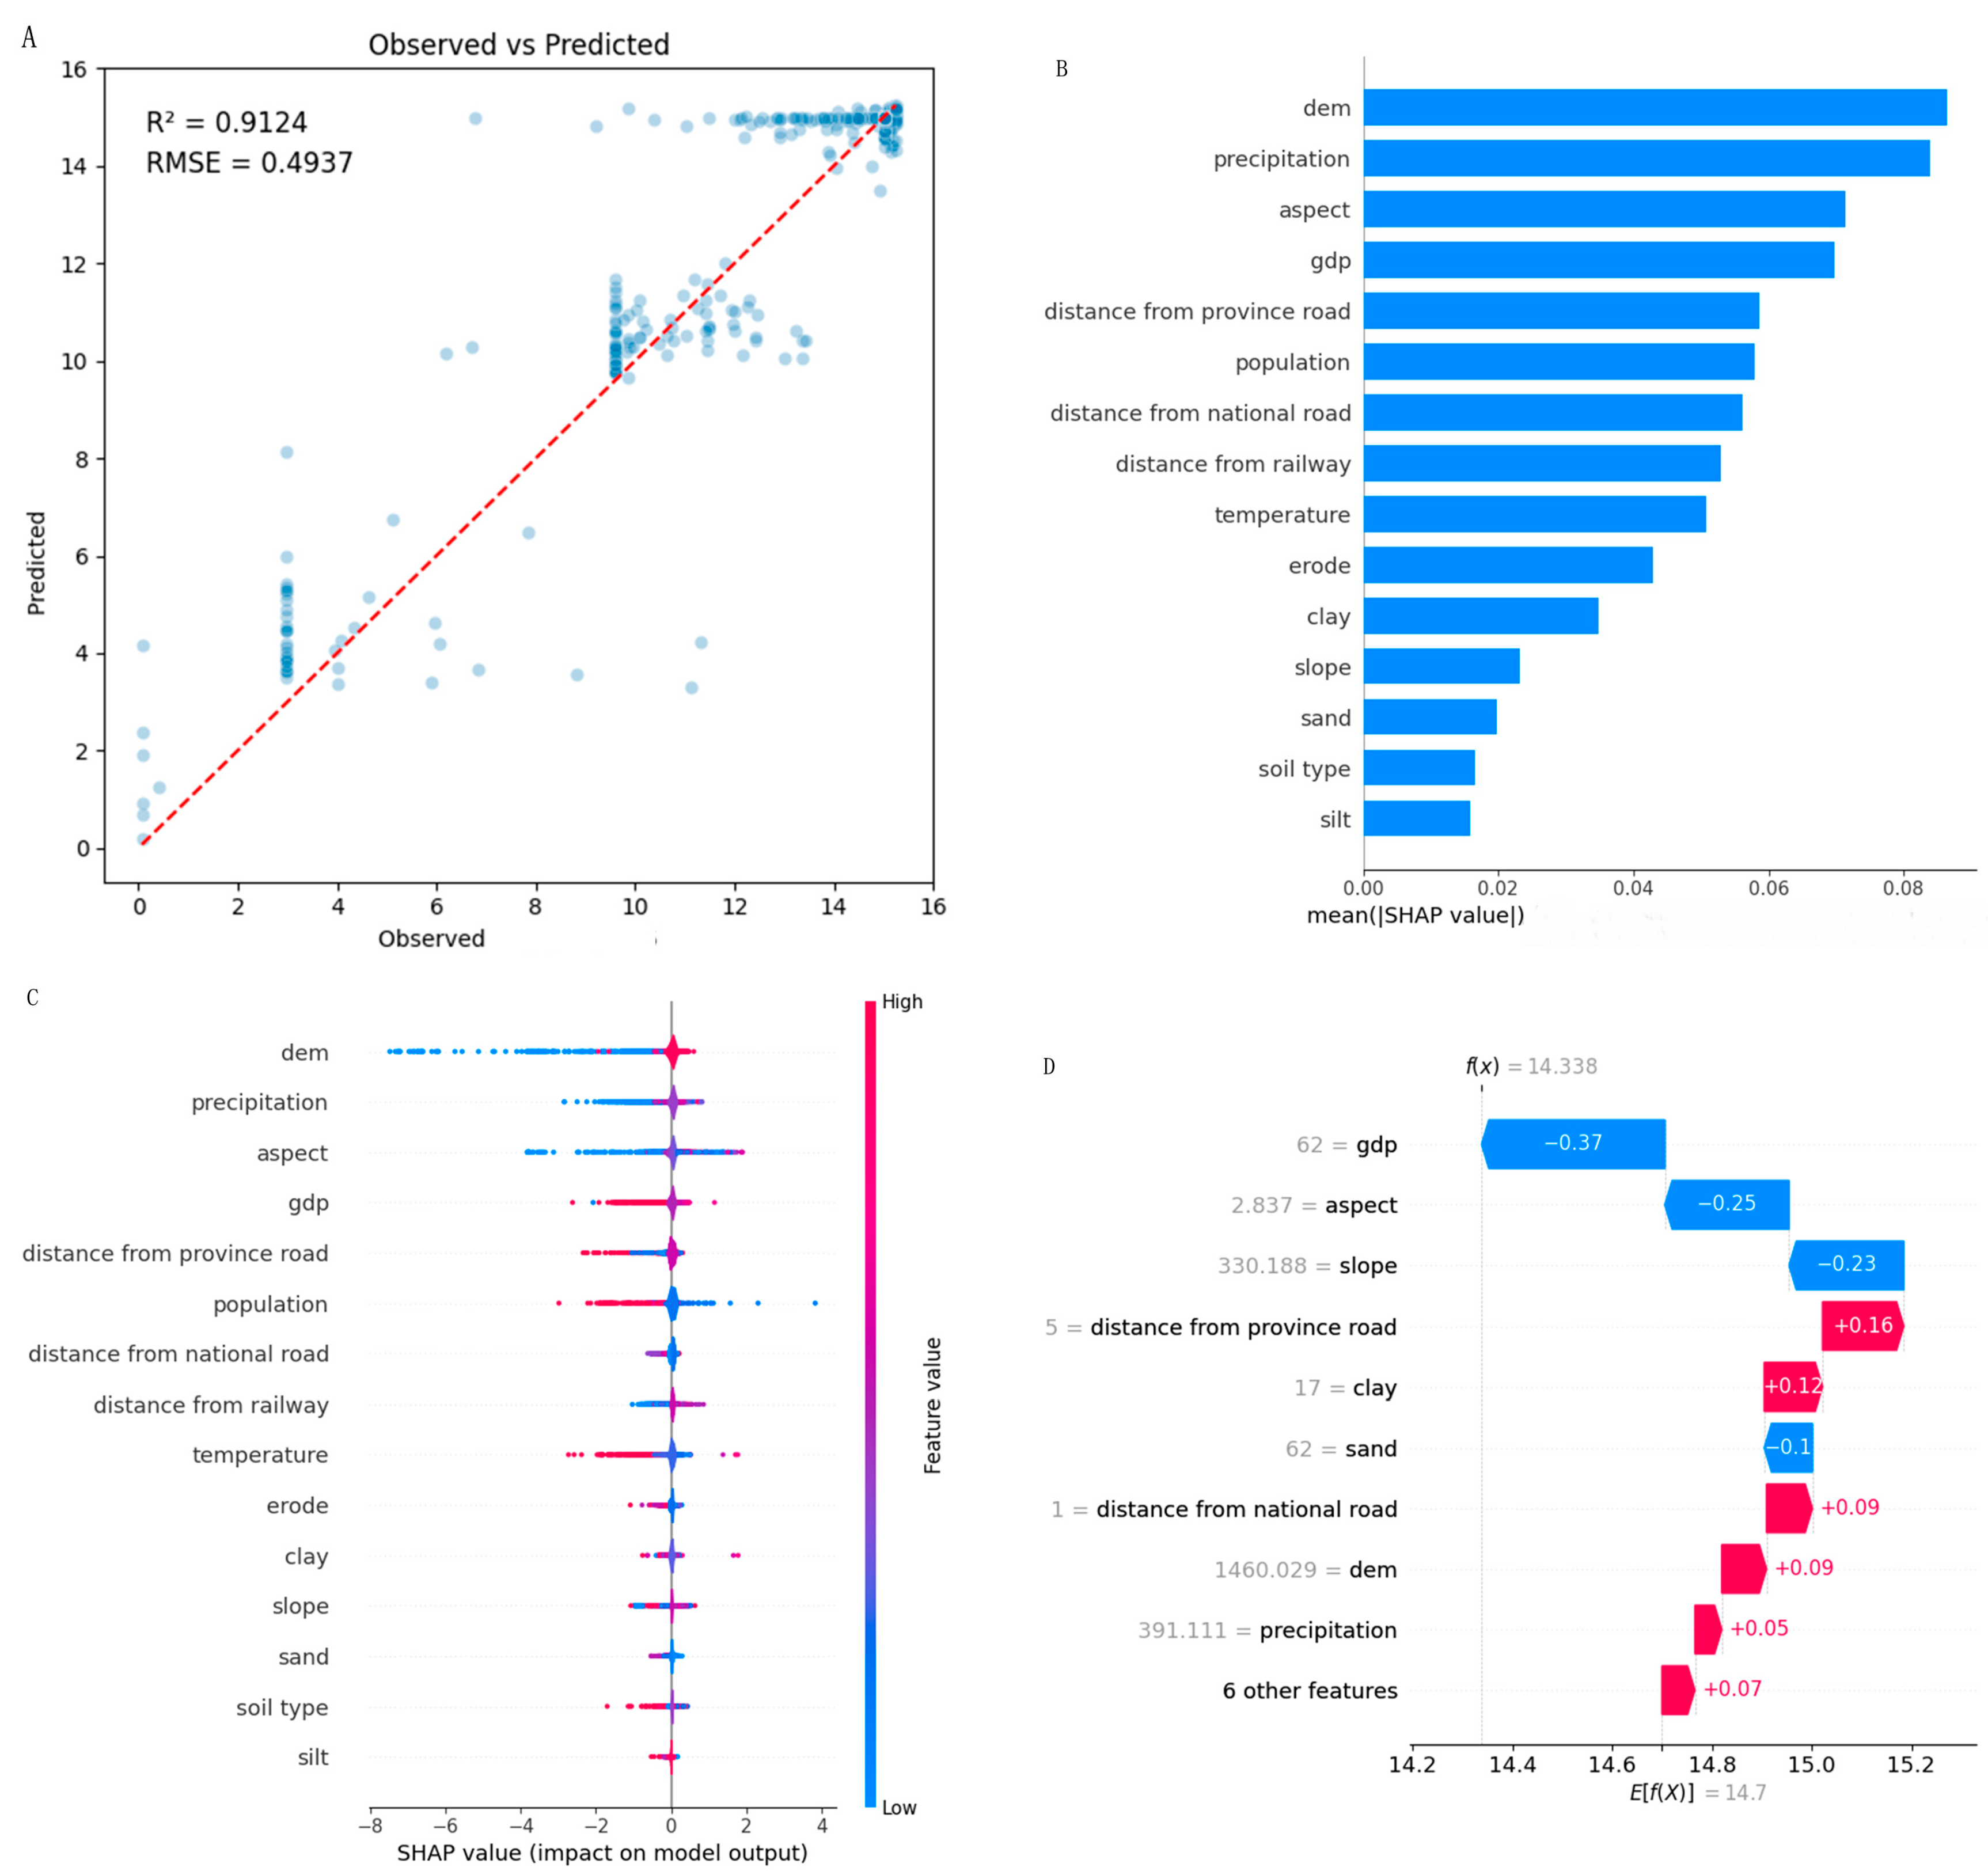
After the PLUS–InVEST simulation and hot spot analysis, the XGBoost–SHAP framework was used to further identify the spatial heterogeneity of carbon-storage drivers at both the whole-region and subregional scales. The whole-region model was first established as a baseline for comparison. A total of 15,905 samples were extracted from the carbon-storage raster and explanatory factor layers, and the model achieved an R2 of 0.9124 and an RMSE of 0.4937 (Figure 7A). This indicates that the selected natural, topographic, soil, accessibility, and socioeconomic variables could effectively characterize the overall spatial variation in modeled carbon storage. However, the whole-region model mainly reflects the average relationship across the entire Pisha sandstone area, and its SHAP results should be interpreted as model-based variable contributions rather than direct causal evidence.
Figure 7.
Whole-region XGBoost model validation and SHAP-based attribution analysis of carbon-storage drivers: (A) observed versus predicted values for the whole-region XGBoost model; (B) global feature importance ranked by mean absolute SHAP values; (C) SHAP summary plot showing the direction and magnitude of feature effects; (D) SHAP waterfall plot illustrating the local contribution of each feature to the prediction for a representative sample.
At the whole-region scale, DEM, precipitation, aspect, GDP, distance from provincial roads, population, distance from national roads, distance from railways, temperature, erosion intensity, clay content, slope, sand content, soil type, and silt content showed different levels of contribution to carbon-storage prediction (Figure 7B). DEM and precipitation ranked as the two most important variables, which suggests that regional carbon storage was strongly constrained by terrain background and water availability. Aspect, slope, and erosion intensity also contributed to the model, which indicates that topographic differentiation may affect carbon storage through radiation exposure, runoff redistribution, soil moisture conditions, and erosion processes. Socioeconomic and accessibility variables, such as GDP, population, and road distance, also played notable roles, which reflects the influence of human disturbance, land development intensity, and transportation accessibility on the spatial distribution of carbon storage.
The SHAP summary plot further revealed the direction and non-linear characteristics of these effects (Figure 7C). Precipitation generally produced positive SHAP contributions, which is consistent with the water-limited ecological background of the Pisha sandstone area. GDP and population showed negative contributions in many samples, which implies that areas with stronger socioeconomic activity tended to correspond to lower modeled carbon storage. The local SHAP explanation (Figure 7D) also shows that the predicted carbon storage of an individual grid cell was determined by the combined positive and negative effects of multiple variables rather than by a single dominant factor. These whole-region results provide an overall understanding of the major drivers, but they may mask the differences among geomorphic and surface-cover units.
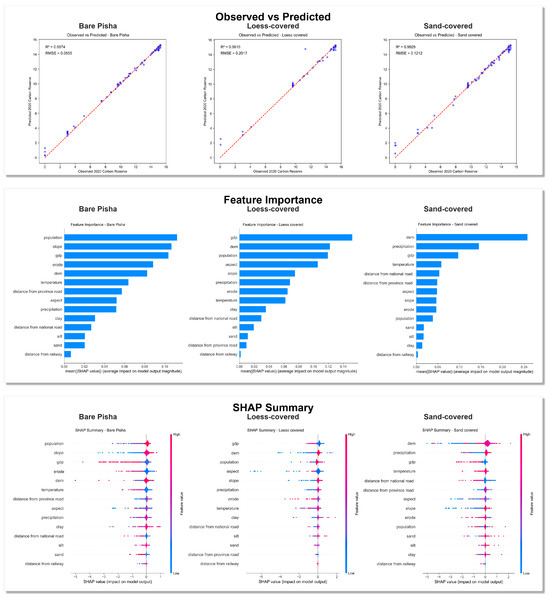
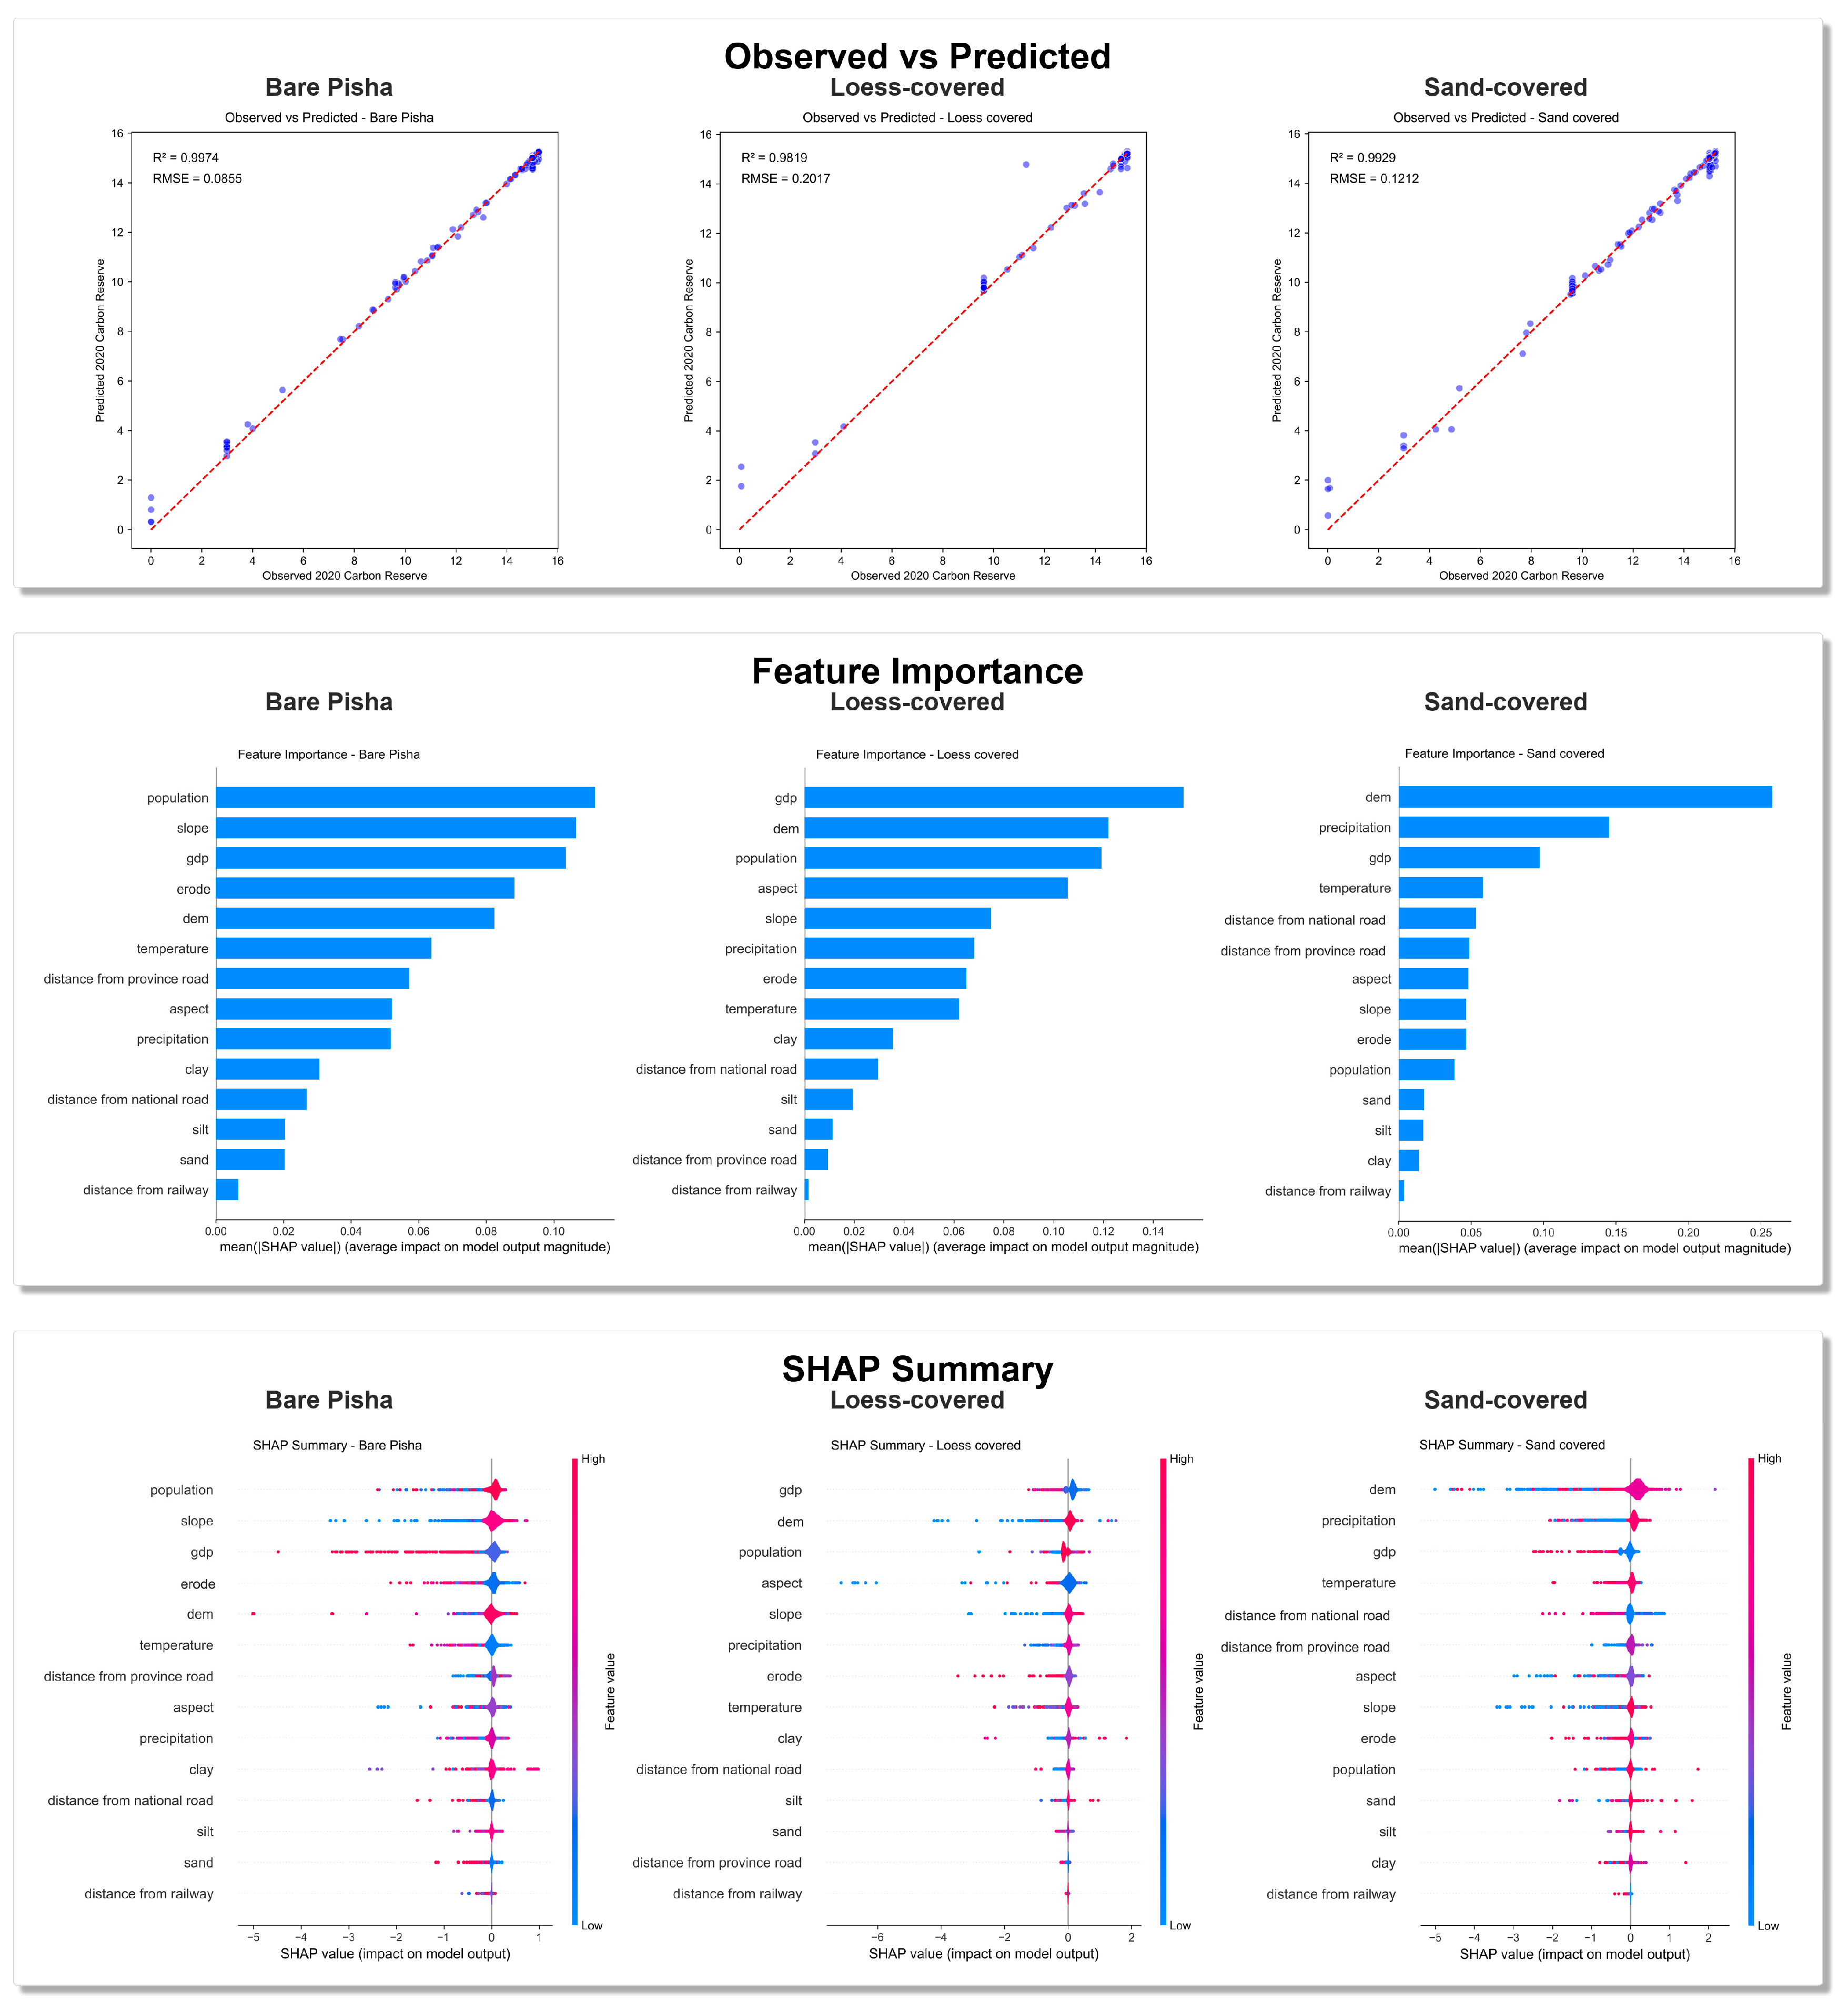
Therefore, to further clarify the spatial differentiation of driving mechanisms, separate XGBoost–SHAP models were constructed for the bare Pisha sandstone area, loess-covered area, and sand-covered area (Figure 8). Compared with the whole-region model, the subregional models showed stronger fitting performance, with R2 values of 0.9974, 0.9819, and 0.9929 and RMSE values of 0.0855, 0.2017, and 0.1212, respectively. This result indicates that the relationship between carbon storage and its explanatory factors became clearer after the region was divided according to geomorphic and surface-cover characteristics. In other words, the Pisha sandstone area is not controlled by a uniform driving mechanism; instead, carbon storage is shaped by different combinations of human disturbance, terrain conditions, erosion intensity, and hydrothermal factors in different subregions.
Figure 8.
Subregional XGBoost model validation and SHAP-based interpretation for bare, loess-covered, and sand-covered Pisha sandstone areas.
In the bare Pisha sandstone area, population, slope, GDP, erosion intensity, and DEM were the leading variables. This subregion is characterized by exposed sandstone, sparse vegetation, strong runoff erosion, and fragile surface stability. Under such conditions, carbon storage is highly sensitive to both anthropogenic disturbance and terrain-erosion processes. The high importance of population and GDP suggests that human activities, land-use intensity, and development pressure may directly affect vegetation restoration and soil carbon accumulation. Meanwhile, slope, erosion intensity, and DEM indicate that terrain-driven runoff and erosion processes are key physical constraints. Steeper slopes and stronger erosion can reduce soil retention capacity, limit vegetation establishment, and weaken the accumulation of ecosystem carbon. Therefore, the bare Pisha sandstone area represents a typical zone where ecological restoration is jointly restricted by human pressure and severe geomorphic erosion.
In the loess-covered area, GDP, DEM, population, aspect, and slope ranked as the most important variables. Compared to the bare Pisha sandstone area, the loess-covered area generally has relatively better soil development and stronger potential for vegetation growth, but it is also more closely associated with agricultural use and human settlement. The dominance of GDP and population indicates that socioeconomic disturbance is a major factor affecting carbon storage in this subregion. Areas with higher development intensity may experience stronger land conversion, cultivation pressure, or infrastructure expansion, which can reduce vegetation carbon and soil carbon accumulation. At the same time, DEM, aspect, and slope remained important, which shows that topographic background still regulates local hydrothermal conditions, soil moisture redistribution, and erosion risk. Thus, carbon storage in the loess-covered area is mainly controlled by the coupling of socioeconomic pressure and topographic differentiation rather than by natural factors alone.
In the sand-covered area, DEM and precipitation were the dominant factors, followed by GDP and temperature. This indicates that carbon storage in this subregion is more strongly regulated by terrain and hydrothermal conditions. The sand-covered area is usually characterized by loose surface materials, relatively poor water-holding capacity, and high sensitivity to precipitation variation. Under these conditions, water availability becomes a key limiting factor for vegetation growth and carbon accumulation. The high contribution of DEM may reflect the influence of elevation-related differences in moisture, temperature, vegetation distribution, and surface stability. Temperature also contributed to the model, which suggests that hydrothermal interactions may affect vegetation productivity and soil carbon processes in sandy environments. Although GDP still had a certain influence, its relative importance was lower than that of DEM and precipitation, which indicates that natural environmental constraints were more prominent in this subregion.
Overall, the subregional SHAP results demonstrate that the dominant drivers of carbon storage differ substantially among the three ecological units. The bare Pisha sandstone area is mainly controlled by the combined effects of human disturbance and terrain-erosion constraints; the loess-covered area is shaped by the interaction between socioeconomic pressure and topographic conditions; and the sand-covered area is more strongly regulated by terrain and hydrothermal factors. These differences indicate that the drivers identified by the whole-region model cannot be directly generalized to all subregions. The subregional analysis, therefore, provides a more targeted basis for carbon sink management. For the bare Pisha sandstone area, priority should be given to erosion control, slope stabilization, and disturbance reduction. For the loess-covered area, land-use regulation and the coordination of agricultural production with ecological restoration are particularly important. For the sand-covered area, vegetation restoration should focus on water-limited conditions, drought-resistant species selection, and measures that improve soil moisture retention. Differentiated management according to geomorphic and surface-cover conditions is, therefore, essential for improving regional carbon storage and enhancing the effectiveness of ecological restoration in the Pisha sandstone area.
5. Discussion and Conclusions
5.1. Discussion
(1) Land-use change and carbon-storage response
Carbon-storage change in the Pisha sandstone area was closely linked to land-use transition. From 1990 to 2020, grassland remained the dominant land-use type, while cropland and barren land declined markedly and impervious land expanded locally. These transitions were accompanied by a fluctuating but overall increasing carbon-storage trend, which indicates that restoration-oriented land conversion outweighed the local carbon losses associated with construction expansion and vegetation degradation [41].
The observed carbon-storage increase appears to be primarily associated with the conversion of barren land and cropland to grassland, which likely reduced surface exposure and improved vegetation-mediated carbon accumulation. This interpretation is broadly consistent with previous scenario-based studies showing that ecological land expansion and vegetation restoration tend to enhance regional carbon storage, whereas construction expansion and intensive development weaken it [42,43].
(2) Scenario simulation and spatial cold spot implications
The 2040 scenario comparison indicates that policy orientation will strongly influence future carbon-storage outcomes in the Pisha sandstone area. Among the four scenarios, the ECS produced the highest projected carbon storage, whereas the NDS and HQDS yielded lower values because they preserved stronger development inertia and allowed greater impervious-land expansion. The superior performance of the ECS suggests that, in erosion-prone dryland landscapes, policies that prioritize ecological land protection and restoration can generate larger carbon gains than passive continuation or development-oriented pathways, because they directly affect the land-cover transitions that control vegetation recovery and landscape fragmentation. This pattern is broadly consistent with previous scenario-based studies showing that ecological-priority pathways are generally more favorable for carbon-storage improvement than development-led scenarios.
Hot spot and cold spot analysis adds an important spatial dimension to this scenario comparison. Significant cold spots were more extensive than hot spots, which indicates that future management should focus not only on preserving existing high-carbon patches but also on interrupting the spatial clustering of low-carbon and high-disturbance areas. The concentration of cold spots along valley corridors, gully systems, marginal transition zones, the eastern river corridor, and disturbed construction patches suggests that these locations are not only low in carbon storage but also more vulnerable to continued fragmentation and ecological degradation.
The overlap between cold spot clusters and the internal divisions of the Pisha sandstone area further indicates that low-carbon risk is jointly shaped by land-use transition and geomorphic context. In bare, loess-covered, and sand-covered Pisha sandstone subregions, the locations and likely causes of cold spots differ, which means that restoration priorities cannot be defined by land-use type alone. Instead, subregional geomorphic vulnerability should be considered together with carbon-storage clustering when identifying priority intervention areas.
(3) Driver mechanisms revealed by XGBoost–SHAP
The XGBoost–SHAP results indicate that carbon storage in the Pisha sandstone area is jointly controlled by natural background conditions and human disturbance. At the whole-region scale, DEM and precipitation emerged as dominant variables, which suggests that terrain and water availability set the basic ecological boundary conditions for vegetation recovery and carbon accumulation in this semi-arid environment. Higher terrain complexity may constrain soil development and vegetation continuity, whereas more favorable moisture conditions support biomass growth and carbon sequestration.
Socioeconomic variables, including GDP, population, and accessibility-related factors, capture another dimension of control. Their generally negative or limiting associations with predicted carbon storage suggest that construction expansion, intensified land use, and disturbance along transport corridors tend to weaken regional carbon sink function. In this sense, the XGBoost–SHAP results do not simply rank variables; they also distinguish between ecological constraints that govern restoration potential and human pressures that erode that potential.
The subregional models further show that these controls are spatially heterogeneous. In bare Pisha sandstone areas, the stronger roles of population, slope, GDP, erosion intensity, and DEM indicate that carbon storage is constrained by the joint effects of disturbance and erosion-sensitive terrain. In loess-covered areas, socioeconomic pressure and topographic heterogeneity remain prominent, whereas in sand-covered areas, hydrothermal conditions become more influential. Similar explainable-ML studies in fragile ecosystems have also reported non-linear and spatially heterogeneous driver effects, but our results show that such heterogeneity is especially important in the geomorphically differentiated Pisha sandstone area. Taken together, these findings explain why a whole-region ranking alone is insufficient for differentiated carbon sink management.
(4) Management implications and limitations
Because the main controls on carbon storage differ across land-transition pathways and geomorphic subregions, the management implications of this study are inherently spatial rather than uniform. First, continuous grassland patches should be protected because grassland serves as the dominant carbon-storage carrier in the region. Second, cold spot clusters along valleys, gullies, transition zones, and disturbed margins should be prioritized for restoration because these areas combine low carbon storage with high ecological vulnerability. Third, impervious-land expansion should be strictly controlled in ecologically sensitive locations to reduce carbon loss and landscape fragmentation. Fourth, restoration and regulation measures should be differentiated among bare, loess-covered, and sand-covered Pisha sandstone subregions according to their contrasting geomorphic and socioeconomic constraints.
This study also has several limitations. First, the InVEST carbon-storage module estimates carbon stocks using fixed carbon density coefficients linked to land-use categories. Although a sensitivity comparison was conducted for the dead organic matter pool, this approach still simplifies within-class variation in vegetation quality, stand age, soil carbon dynamics, degradation status, and management intensity. Second, the 2040 PLUS results are scenario-based projections rather than deterministic forecasts, and uncertainty remains in both transition rules and the spatial allocation of future land-use patches. Third, XGBoost–SHAP reveals non-linear associations and variable contributions, but it does not by itself establish causality, and the results may still be influenced by spatial autocorrelation. Future studies should, therefore, combine field observations, dynamic carbon density data, spatially explicit uncertainty analysis, spatial block validation, and process-based or causal-inference approaches to strengthen both carbon estimation and mechanism interpretation.
5.2. Conclusions
This study integrated a PLUS model, InVEST carbon-storage module, hot spot analysis, and XGBoost–SHAP framework to analyze land-use change, carbon-storage evolution, future scenario differences, spatial clustering patterns, and driving mechanisms in the Pisha sandstone area. The main conclusions are as follows:
(1) From 1990 to 2020, the land-use structure of the Pisha sandstone area remained grassland-dominated, while cropland and barren land declined and impervious land expanded locally. Overall, restoration-oriented land conversion outweighed local development-related losses and became the main land-cover process associated with ecological improvement.
(2) Carbon storage increased from 2.658 × 10⁵ tC in 1990 to 2.734 × 10⁵ tC in 2020, with gains mainly linked to the conversion of barren land and cropland to grassland. Carbon losses were concentrated near construction expansion areas and mixed land-use transition zones, which indicates that the regional carbon trajectory reflects the combined effects of restoration and human disturbance.
(3) The 2040 scenario analysis showed that the ECS yielded the highest projected carbon storage (3.194 × 10⁵ tC), followed by the CLPS, HQDS, and NDS. This indicates that ecological land protection and restoration are more effective for carbon enhancement in the Pisha sandstone area than passive continuation or development-oriented pathways.
(4) Significant cold spots were more widely distributed than hot spots and were concentrated in valley corridors, gully systems, marginal transition zones, and disturbed patches. Their overlap with the bare, loess-covered, and sand-covered Pisha sandstone units shows that low-carbon risk is jointly shaped by land-use transition and geomorphic vulnerability.
(5) XGBoost–SHAP revealed that carbon storage is jointly controlled by natural background conditions and socioeconomic disturbance. Topography and precipitation define the ecological boundary conditions for carbon accumulation, whereas GDP, population, and accessibility-related factors reflect human-pressure effects. The subregional models further confirmed that these controls differ across geomorphic subregions, supporting differentiated carbon sink management.
Overall, the Pisha sandstone area has experienced a restoration-led increase in carbon storage, but future carbon sink stability remains constrained by the spatial clustering of low-carbon areas and by localized development pressure. Effective management should, therefore, combine grassland protection, cold spot restoration, strict control of impervious-land expansion, and subregion-specific interventions.
Author Contributions
Funding acquisition, L.Z.; writing-original draft preparation, J.X.; writing-review and editing, L.Z.; methodology, B.P.; formal analysis, J.H.; investigation, W.Y.; validation, W.Y. All authors have read and agreed to the published version of the manuscript.
Funding
This research was funded by the Science and Technology Research Project of Henan Province (Grant No. 232102321108) and the National Natural Science Foundation of China (Grant No. 32101591).
Institutional Review Board Statement
Not applicable.
Informed Consent Statement
Not applicable.
Data Availability Statement
The original contributions presented in this study are included in the article. Further inquiries can be directed to the corresponding author.
Conflicts of Interest
The authors declare no conflict of interest.
References
- Bardgett, R.D.; Bullock, J.M.; Lavorel, S.; Manning, P.; Schaffner, U.; Ostle, N.; Chomel, M.; Durigan, G.; Fry, E.L.; Johnson, D.; et al. Combatting Global Grassland Degradation. Nat. Rev. Earth Environ. 2021, 2, 720–735. [Google Scholar] [CrossRef] [Scilit]
- Liu, L.; Liang, L.; Gao, P.; Fan, C.; Wang, H.; Wang, H. Coupling Relationship and Interactive Response between Ecological Protection and High-Quality Development in the Yellow River Basin. J. Nat. Resour. 2021, 36, 176. [Google Scholar] [CrossRef] [Scilit]
- Xu, L.; Yu, G.; He, N.; Wang, Q.; Gao, Y.; Wen, D.; Li, S.; Niu, S.; Ge, J. Carbon Storage in China’s Terrestrial Ecosystems: A Synthesis. Sci. Rep. 2018, 8, 2806. [Google Scholar] [CrossRef] [Scilit] [PubMed]
- Intergovernmental Panel on Climate Change (IPCC). Climate Change 2021–The Physical Science Basis: Working Group I Contribution to the Sixth Assessment Report of the Intergovernmental Panel on Climate Change, 1st ed.; Cambridge University Press: Cambridge, UK, 2023; ISBN 978-1-009-15789-6. [Google Scholar]
- Grassini, P.; Eskridge, K.M.; Cassman, K.G. Distinguishing between Yield Advances and Yield Plateaus in Historical Crop Production Trends. Nat. Commun. 2013, 4, 2918. [Google Scholar] [CrossRef] [Scilit] [PubMed]
- Yang, Y.; Shi, Y.; Sun, W.; Chang, J.; Zhu, J.; Chen, L.; Wang, X.; Guo, Y.; Zhang, H.; Yu, L.; et al. Terrestrial Carbon Sinks in China and around the World and Their Contribution to Carbon Neutrality. Sci. China Life Sci. 2022, 65, 861–895. [Google Scholar] [CrossRef] [Scilit] [PubMed]
- Ruehr, S.; Keenan, T.F.; Williams, C.; Zhou, Y.; Lu, X.; Bastos, A.; Canadell, J.G.; Prentice, I.C.; Sitch, S.; Terrer, C. Evidence and Attribution of the Enhanced Land Carbon Sink. Nat. Rev. Earth Environ. 2023, 4, 518–534. [Google Scholar] [CrossRef] [Scilit]
- Wang, S.; Fu, B.; Piao, S.; Lü, Y.; Ciais, P.; Feng, X.; Wang, Y. Reduced Sediment Transport in the Yellow River Due to Anthropogenic Changes. Nat. Geosci. 2016, 9, 38–41. [Google Scholar] [CrossRef] [Scilit]
- Wen, X.; Zhen, L. Soil Erosion Control Practices in the Chinese Loess Plateau: A Systematic Review. Environ. Dev. 2020, 34, 100493. [Google Scholar] [CrossRef] [Scilit]
- Shi, C.; Zhou, Y.; Fan, X.; Shao, W. A Study on the Annual Runoff Change and Its Relationship with Water and Soil Conservation Practices and Climate Change in the Middle Yellow River Basin. Catena 2013, 100, 31–41. [Google Scholar] [CrossRef] [Scilit]
- Zuo, D.; Xu, Z.; Yao, W.; Jin, S.; Xiao, P.; Ran, D. Assessing the Effects of Changes in Land Use and Climate on Runoff and Sediment Yields from a Watershed in the Loess Plateau of China. Sci. Total Environ. 2016, 544, 238–250. [Google Scholar] [CrossRef] [Scilit] [PubMed]
- Liu, Z.; Deng, Z.; Davis, S.J.; Giron, C.; Ciais, P. Monitoring Global Carbon Emissions in 2021. Nat. Rev. Earth Environ. 2022, 3, 217–219. [Google Scholar] [CrossRef] [Scilit] [PubMed]
- Zhu, L.; Song, R.; Sun, S.; Li, Y.; Hu, K. Land Use/Land Cover Change and Its Impact on Ecosystem Carbon Storage in Coastal Areas of China from 1980 to 2050. Ecol. Indic. 2022, 142, 109178. [Google Scholar] [CrossRef] [Scilit]
- Li, X.; Liu, Z.; Li, S.; Li, Y. Multi-Scenario Simulation Analysis of Land Use Impacts on Habitat Quality in Tianjin Based on the PLUS Model Coupled with the InVEST Model. Sustainability 2022, 14, 6923. [Google Scholar] [CrossRef] [Scilit]
- Gao, L.; Tao, F.; Liu, R.; Wang, Z.; Leng, H.; Zhou, T. Multi-Scenario Simulation and Ecological Risk Analysis of Land Use Based on the PLUS Model: A Case Study of Nanjing. Sustain. Cities Soc. 2022, 85, 104055. [Google Scholar] [CrossRef] [Scilit]
- Zhang, P.; Yao, W.; Liu, G.; Xiao, P.; Sun, W. Experimental Study of Sediment Transport Processes and Size Selectivity of Eroded Sediment on Steep Pisha Sandstone Slopes. Geomorphology 2020, 363, 107211. [Google Scholar] [CrossRef] [Scilit]
- Liang, Z.; Wu, Z.; Yao, W.; Noori, M.; Yang, C.; Xiao, P.; Leng, Y.; Deng, L. Pisha Sandstone: Causes, Processes and Erosion Options for Its Control and Prospects. Int. Soil Water Conserv. Res. 2019, 7, 1–8. [Google Scholar] [CrossRef] [Scilit]
- Huang, X.; Liu, X.; Wang, Y. Spatio-Temporal Variations and Drivers of Carbon Storage in the Tibetan Plateau under SSP-RCP Scenarios Based on the PLUS-InVEST-GeoDetector Model. Sustainability 2024, 16, 5711. [Google Scholar] [CrossRef] [Scilit]
- Chen, W.; Yang, L.; Wu, J.; Wu, J.; Wang, G.; Bian, J.; Zeng, J.; Liu, Z. Spatio-Temporal Characteristics and Influencing Factors of Traditional Villages in the Yangtze River Basin: A Geodetector Model. Herit. Sci. 2023, 11, 111. [Google Scholar] [CrossRef] [Scilit]
- Su, Y.; Li, T.; Cheng, S.; Wang, X. Spatial Distribution Exploration and Driving Factor Identification for Soil Salinisation Based on Geodetector Models in Coastal Area. Ecol. Eng. 2020, 156, 105961. [Google Scholar] [CrossRef] [Scilit]
- Groffman, P.M.; Baron, J.S.; Blett, T.; Gold, A.J.; Goodman, I.; Gunderson, L.H.; Levinson, B.M.; Palmer, M.A.; Paerl, H.W.; Peterson, G.D.; et al. Ecological Thresholds: The Key to Successful Environmental Management or an Important Concept with No Practical Application? Ecosystems 2006, 9, 1–13. [Google Scholar] [CrossRef] [Scilit]
- Lindenmayer, D.B.; Luck, G. Synthesis: Thresholds in Conservation and Management. Biol. Conserv. 2005, 124, 351–354. [Google Scholar] [CrossRef] [Scilit]
- Zhu, L.; Meng, J.; Zhu, L. Applying Geodetector to Disentangle the Contributions of Natural and Anthropogenic Factors to NDVI Variations in the Middle Reaches of the Heihe River Basin. Ecol. Indic. 2020, 117, 106545. [Google Scholar] [CrossRef] [Scilit]
- Chen, T.; Guestrin, C. XGBoost: A Scalable Tree Boosting System. In Proceedings of the 22nd ACM SIGKDD International Conference on Knowledge Discovery and Data Mining; ACM: San Francisco, CA, USA, 2016; pp. 785–794. [Google Scholar]
- Akono, A.; Druhan, J.L.; Dávila, G.; Tsotsis, T.; Jessen, K.; Fuchs, S.; Crandall, D.; Shi, Z.; Dalton, L.; Tkach, M.K.; et al. A Review of Geochemical–Mechanical Impacts in Geological Carbon Storage Reservoirs. Greenh. Gases Sci. Technol. 2019, 9, 474–504. [Google Scholar] [CrossRef] [Scilit]
- Lundberg, S.M.; Erion, G.; Chen, H.; DeGrave, A.; Prutkin, J.M.; Nair, B.; Katz, R.; Himmelfarb, J.; Bansal, N.; Lee, S.-I. From Local Explanations to Global Understanding with Explainable AI for Trees. Nat. Mach. Intell. 2020, 2, 56–67. [Google Scholar] [CrossRef] [Scilit] [PubMed]
- Xu, L.; He, N.; Yu, G. Dataset of Carbon Density in Terrestrial Ecosystems of China in the 2010s. China Sci. Data 2019, 4, 90–96. [Google Scholar] [CrossRef] [Scilit]
- Li, X.; Fu, J.; Jiang, D.; Lin, G.; Cao, C. Land Use Optimization in Ningbo City with a Coupled GA and PLUS Model. J. Clean. Prod. 2022, 375, 134004. [Google Scholar] [CrossRef] [Scilit]
- Li, Y.; Tang, Y.; Li, L.; Tang, J. Habitat Quality Assessment of the Yangtze River Shoreline in Hunan Based on Land Use Change. Three Gorges Ecol. Environ. Monit. 2024, 9, 57–66. [Google Scholar]
- Yang, X.; Zhang, J.; Li, Q. Study on Dynamic Changes of Ecosystem Services in Xinjizhou National Wetland Park Based on InVEST Model. J. Anhui Agric. Sci. 2024, 52, 75–80. [Google Scholar] [CrossRef]
- Huang, T.; Liu, S. Land Use Change and Carbon Storage Assessment in Fujian Province Based on PLUS-InVEST Model. J. Soil Water Conserv. 2024, 38, 246–257. [Google Scholar]
- Liang, X.; Guan, Q.; Clarke, K.C.; Liu, S.; Wang, B.; Yao, Y. Understanding the Drivers of Sustainable Land Expansion Using a Patch-Generating Land Use Simulation (PLUS) Model: A Case Study in Wuhan, China. Comput. Environ. Urban Syst. 2021, 85, 101569. [Google Scholar] [CrossRef] [Scilit]
- Wan, Q.; Shao, J. Land Use and Carbon Storage Estimation in Chongqing Section of Three Gorges Reservoir Area from 2000 to 2020. J. Chongqing Norm. Univ. Nat. Sci. Ed. 2023, 40, 52–64. [Google Scholar]
- Yu, Z.; Zhao, M.; Gao, Y.; Wang, T.; Zhao, Z.; Wang, S. Spatiotemporal Evolution and Prediction of Carbon Storage in Huaibei City Based on InVEST-PLUS Model. Environ. Sci. 2024, 45, 3270–3283. [Google Scholar]
- Ji, L.; Wang, Q.; Zhu, G. Carbon Storage Assessment and Multi-Scenario Land Use Simulation in Jingzhou City Based on PLUS and InVEST Models. J. Fujian Norm. Univ. Nat. Sci. Ed. 2024, 40, 44–56. [Google Scholar] [CrossRef]
- Jiang, L.; Su, H.; Zhang, Y.; Liu, Q.; Zhang, X.; Li, M. Land Cover Classification and Prediction Based on Multi-Classifier Ensemble. J. Nanjing For. Univ. Nat. Sci. Ed. 2024, 48, 255–266. [Google Scholar] [CrossRef]
- Jiang, L.; Zuo, Q.; Ma, J.; Zhang, Z. Evaluation and Prediction of the Level of High-Quality Development: A Case Study of the Yellow River Basin, China. Ecol. Indic. 2021, 129, 107994. [Google Scholar] [CrossRef] [Scilit]
- Wang, Y.; Yang, N. Differences in High-Quality Development and Its Influencing Factors between Yellow River Basin and Yangtze River Economic Belt. Land 2023, 12, 1461. [Google Scholar] [CrossRef] [Scilit]
- Cao, Y.; Liu, W.; Zhao, S.; Luo, Y.; Zou, K.; Yang, Z. Multi-Scenario Simulation of the Impact of Rainfall and Land Use Change on Water Yield in Fuxian Lake Basin. Hydrology 2025, 45, 77–85. [Google Scholar]
- Dong, G.; Yin, H.; Yao, R.; Yuan, C.; Qu, C.; Tia, Y.; Jia, M. Patiotem-poral Pattern and Multi-Scenario Simulation of Land Use Conflicts: A Case Study of Shandong Section of the Yellow River Basin. Smart Agric. 2025, 7, 183–195. [Google Scholar] [CrossRef]
- Qi, M.; Wang, F.; Hua, Y.; Wang, M. Land Use Change and Carbon Storage Assessment in Inner Mongolia Based on PLUS and InVEST Models. J. Soil Water Conserv. 2023, 37, 194–200. [Google Scholar]
- Zhang, P.; Yao, W.; Wang, J.; Zhang, Y. Research Status, Development Trends, and Prospects of Vegetation Degradation Processes Under Compound Erosion in the Pisha Sandstone Area of the Yellow River. Sci. Soil Water Conserv. Chin. Engl. 2026, 24, 1–12. [Google Scholar] [CrossRef] [Scilit]
- Wang, Z.; Wang, B.; Zhang, Y.; Zhang, Q. Dynamic Simulation of Land Use Change and Carbon Storage Assessment in Hohhot Based on PLUS-InVEST Model. J. Agric. Resour. Environ. 2024, 41, 292–304. [Google Scholar]

Disclaimer/Publisher’s Note: The statements, opinions and data contained in all publications are solely those of the individual author(s) and contributor(s) and not of MDPI and/or the editor(s). MDPI and/or the editor(s) disclaim responsibility for any injury to people or property resulting from any ideas, methods, instructions or products referred to in the content. |
© 2026 by the authors. Licensee MDPI, Basel, Switzerland. This article is an open access article distributed under the terms and conditions of the Creative Commons Attribution (CC BY) license.