


Abstract
Traditional approaches to urban real estate green value assessment rely heavily on single structured data sources. Such methods often provide limited interpretability and fail to capture multidimensional green attributes accurately. To address these limitations, this study constructs a multimodal assessment framework that integrates image, text, and spatial information. A housing price prediction model is developed based on a Multi-Layer Perceptron architecture. Results show that the proposed method is superior to traditional models (such as the Hedonic pricing model, Ridge regression, and eXtreme Gradient Boosting, as well as single-modality control models). The core evaluation metric, mean squared error, reaches 0.0505 ± 0.0021. SHapley Additive exPlanations analysis shows that the text modality provides the largest contribution to model prediction, accounting for 51.45% of the global contribution. However, this dominance reflects the model’s dependence on textual green signals rather than the establishment of causal relationships. The result may also be influenced by marketing language bias and symbolic sustainability signals. The image modality contributes 38.48%, while the spatial modality contributes 10.07%, indicating a complementary relationship among the three modalities. Green premium analysis confirms that the model achieves higher prediction accuracy for high-priced residences and effectively captures differences in green premium across housing price tiers. This study provides a new technical pathway for real estate green value assessment.
1. Introduction
The green value of real estate reflects a comprehensive embodiment of multidimensional advantages (e.g., green buildings, ecological environments, and locational supporting facilities). Accurately accounting for such values can stabilize the running rhythm of real estate markets; it also optimizes urban planning layouts, helps the implementation of environmentally friendly buildings, and improves residential living quality [1]. At present, the urban real estate market presents a diversified development. Homebuyers no longer focus only on residential greening conditions; meanwhile, they also pay attention to the energy-saving performance, ecological amenities, and environmental quality. Under these conditions, traditional valuation methods are no longer sufficient for measuring green value comprehensively [2]. Conventional real estate valuation methods mainly rely on the Hedonic pricing model and linear regression approaches. These methods typically focus on structured indicators such as housing prices and floor area, while overlooking complex environmental and semantic attributes. As a result, their capability to represent green value remains limited [3]. With the fast development of artificial intelligence (AI) technology, data-driven assessment methods provide a new technical path [4]. All kinds of public data are becoming more and more popular, and deep learning-related algorithms are also being continuously optimized. The advancement of multimodal technology lays the foundation for deeply dismantling all kinds of core features of the green value of real estate [5]. However, at present, existing data-driven real estate evaluation studies focus on single-mode data application; in addition, they fail to achieve accurate evaluation and an interpretable decomposition of green value.
To address these limitations, this study develops a data-driven multimodal framework for real estate green value assessment based on the China Multi-Attribute Building (CMAB) dataset. The framework integrates image, text, and spatial data to improve the extraction of multidimensional green features and optimize multimodal fusion performance. Housing price prediction and green premium interpretability analysis are conducted within the unified framework. This study makes several contributions. First, image, text, and spatial multi-source data are integrated into a unified multimodal valuation framework. Second, unified feature mapping, cross-modal attention, and dynamic gating mechanisms are introduced to alleviate modal imbalance and insufficient feature interaction in conventional models. Third, SHapley Additive exPlanations (SHAP) analysis and green premium analysis are incorporated to support quantitative decomposition of green value drivers and economic-level interpretability. These improvements enhance the interpretability and analytical capability of existing data-driven real estate valuation models.
To establish a clearer economic and urban-theoretical foundation for the concept of green value, this study draws upon sustainable urban economics, environmental valuation theory, and the Environmental, Social and Governance (ESG) asset pricing framework to redefine real estate green value. Sustainable urban economics suggests that the spatial distribution of urban green spaces and ecological infrastructure affects land and housing prices through the mechanism of “green locational rent.” Residents generally exhibit a significant willingness to pay for better air quality, richer urban greenery, and lower urban heat island intensity [6]. Environmental valuation theory further argues that environmental attributes, such as greening coverage and thermal comfort, function as non-market goods whose implicit value can be estimated through feature-based pricing methods. However, conventional approaches often struggle to capture nonlinear relationships and visual perception factors [7,8]. The ESG asset pricing framework indicates that real estate assets with higher ESG ratings tend to exhibit lower capitalization rates and higher rental premiums. Green certifications and energy-saving descriptions serve as observable signals that reduce information asymmetry between buyers and sellers, thereby becoming incorporated into capital market pricing mechanisms [9].
Based on these theoretical perspectives, this study conceptualizes real estate green value as a multidimensional sustainability construct formed through the interaction of four dimensions: environmental quality, market premium, signaling effects, and ecological attractiveness. Environmental quality is measured using indicators such as the Green View Index (GVI), Normalized Difference Vegetation Index (NDVI), and Land Surface Temperature (LST). Market premium refers to the value-added component of transaction prices attributable to green attributes. Signaling effects are represented through green certification texts and energy-saving semantic descriptions. Ecological attractiveness includes spatial convenience indicators such as distance to parks, public transportation accessibility, and Point of Interest (POI) density. These four dimensions are not independent. Instead, they are operationalized through three computational channels: visual perception (image modality), semantic expression (text modality), and spatial structure (spatial modality). Accordingly, the “green value” measured in this study represents a comprehensive construct that integrates environmental, market, signaling, and locational dimensions rather than a simple housing price prediction indicator.
The proposed framework operationalizes these theoretical foundations through several technical components. First, the image modality quantifies visually perceivable dimensions of ecosystem services from the perspective of ecological economics. Second, the text modality identifies green certifications and energy-saving signals within the context of ESG-oriented housing research. Third, the spatial modality measures the spatial accessibility and spatial equity of green facilities in relation to sustainable urban development. Fourth, SHAP analysis reveals the pricing mechanisms associated with green attributes from the perspective of sustainable consumption behavior. Through multimodal fusion, the framework integrates fragmented dimensions of green value from different theoretical traditions into a unified assessment system, thereby supporting the transition from theoretical conceptualization to technical implementation.
More specifically, the major contributions of this study are summarized as follows.
- (1)
- Innovation in multimodal fusion architecture: A unified valuation framework integrating image-based Vision Transformer (ViT), text-based Bidirectional Encoder Representations from Transformers (BERT), and spatial Graph Convolutional Network (GCN) is proposed. Cross-modal attention and dynamic gating mechanisms are introduced to achieve adaptive information integration across modalities and alleviate the limitations of insufficient information dimensionality in conventional single-modality models.
- (2)
- Operational definition of green value: Green value is quantified for the first time through three dimensions: visual perception, semantic expression, and spatial structure. A computable and interpretable assessment indicator system for real estate green value is established.
- (3)
- Integration of explainable AI and sustainable real estate valuation: SHAP analysis is incorporated to conduct both global and local interpretation of the multimodal fusion model. The marginal contributions of different modalities to green premium are quantitatively estimated, providing a transparent analytical tool for identifying the driving mechanisms of green value.
- (4)
- Differentiated green premium interpretation framework: A housing price tier-based green premium analysis framework is constructed. The framework reveals the dominant role of green semantic labels in high-priced residences and demonstrates the declining contribution of spatial attributes across higher housing price tiers. These findings provide empirical evidence for differentiated market dynamics.
- (5)
- Extension of multimodal applications based on the CMAB dataset: The CMAB dataset is extended from conventional structured-data applications to multimodal deep learning scenarios. The applicability of the dataset to green value assessment is validated, providing a new data foundation for multimodal real estate valuation research.
2. Literature Review
In recent years, the application of AI technology to real estate valuation has become a research hotspot in both academia and industry, leading to substantial methodological progress [10]. In the context of real estate green premium assessment, Copiello and Coletto [11] combined a spatial autoregressive model with a multi-criteria optimization approach to evaluate green value premiums in real estate markets. An, et al. [12] developed green indices via street view imagery and constructed a regression analysis model integrated with spatial interpolation techniques. Their findings suggested a negative correlation between street greening and housing prices. The study also indicated that different green indicators exhibited complementary characteristics, thereby providing a practical analytical framework for sustainable urban development. Walacik and Chmielewska [13] examined the relationship between real estate prices and environmental sustainability using an AI-driven analytical framework. Their results showed that the Random Forest (RF) method was good at dealing with the non-linear relationship and providing an evaluation of feature importance. The method demonstrated stable performance in sustainable real estate valuation and offered advantages over conventional multiple regression approaches. To investigate the effects of environmental facilities and energy efficiency on real estate prices, Pellizzari, et al. [14] used the Hedonic pricing model. Their study demonstrated how urban green spaces and energy efficiency influenced real estate value under rapid urbanization conditions. Xu, et al. [15] estimated the green value of buildings by integrating land-use data with street view imagery through machine learning algorithms. The results indicated that environmental quality exerted a positive influence on housing prices, highlighting the importance of ecological factors in urban planning. Ledraa and Aldubikhi [16] pointed out that the influence of green spaces on real estate value varied across local communities and environmental contexts. Their findings provided empirical evidence and planning implications for localized data-driven green value assessment. Alfarhood, et al. [17] demonstrated that using satellite data and deep learning technology together could improve how well image recognition performance and expanded the analytical potential of green value assessment in real estate research.
At the same time, multimodal AI approaches for real estate valuation have developed rapidly in recent years. Huang, et al. [18] conducted a comprehensive review of multimodal machine learning applications in real estate valuation and identified three major challenges in current research: difficulties in modality alignment, insufficient cross-modal interaction modeling, and limited interpretability. The present study directly addresses these challenges by introducing a unified mapping space for modality alignment, a cross-modal attention mechanism for interaction modeling, and SHAP analysis for multimodal interpretability. Compared with the existing studies summarized by Huang, Liang, Li and Chen [18], the distinctive contribution of this study lies in the specialization of the multimodal fusion framework for green value assessment and the introduction of a dynamic gating mechanism for sample-adaptive fusion, an area that has received limited attention in previous research. From a theoretical perspective, several research gaps remain. In the field of sustainable urban economics, Wang, et al. [19] reported that green premium exhibited substantial spatial heterogeneity, although their analysis did not integrate multi-source heterogeneous data. Within environmental valuation theory, Aziz, et al. [20] argued that although the Hedonic pricing model could estimate the marginal value of real estate attributes, its reliance on linear assumptions and structured data limited its ability to capture nonlinear interaction effects. In the context of sustainability transition research, Diarra [21] discussed the multi-level perspective proposed by Geels, emphasizing the co-evolution of technology, institutions, and user practices. Green real estate valuation currently represents a critical intersection between technological systems, such as AI algorithms, and institutional systems, including green certification frameworks. Regarding ESG-related asset pricing, Vonlanthen [22] confirmed the positive influence of Leadership in Energy and Environmental Design (LEED) certification on commercial real estate rents and prices. However, his study primarily relied on a single certification variable and lacked a systematic representation of multidimensional green attributes. In addition, existing studies provide limited micro-level evidence regarding the transmission mechanisms between environmental policy and green value formation. Hu, et al. [23] employed a quasi-natural experimental design based on Chinese manufacturing enterprise data from 2012 to 2023. Their findings indicated that environmental tax reform significantly promoted green technological innovation by altering the relative market value of green and non-green technologies, research and development investment intensity, and productivity. The study revealed a micro-level transmission pathway through which environmental policy influenced green value, namely: policy incentives → technological innovation → environmental performance improvement → asset value capitalization. Nevertheless, the analysis focused on manufacturing enterprises and did not extend to real estate assets. The present study incorporates institutional policy signals, represented by green certifications within the text modality, into the multimodal assessment framework. In this way, the framework captures the capitalization effect of environmental policy in the real estate sector and extends the analysis of micro-level transmission mechanisms. Through multimodal fusion, the proposed framework integrates these theoretical perspectives into a unified technical pathway and supports a methodological transition from single-attribute analysis to multidimensional collaborative assessment.
Although previous studies have generated important findings within their respective domains, several limitations remain when examined from the interdisciplinary perspectives of sustainable urban economics, environmental valuation theory, and ESG asset pricing. First, a contradiction exists between the single-dimensional nature of existing data and the multidimensional characteristics of green value. Traditional Hedonic pricing models and machine learning approaches mainly rely on structured attributes such as floor area, building age, and location. Consequently, these methods struggle to capture visually perceived green attributes derived from street view imagery and semantic certification information embedded in textual descriptions. While some studies have introduced street view images, text semantic information has generally not been integrated. As a result, key signals such as green certifications and energy-saving descriptions remain underrepresented. Second, existing studies face a trade-off between model interpretability and prediction accuracy. Previous research improved predictive performance through methods such as RF, yet the black-box nature of these models limits the identification of green value driving mechanisms. Quantitative decomposition of multimodal feature contributions remains insufficient, making it difficult to determine which green attributes exert the strongest influence on housing prices. Third, current studies often assume homogeneous green premium effects despite substantial differences across housing price tiers. Most existing analyses treat green premium as a fixed effect and overlook structural variation in the contribution of green attributes across market segments. The composition of green value in high-priced residences may differ fundamentally from that in low-priced residences, although empirical verification remains limited. Fourth, spatial dependency modeling in existing research remains relatively simplified. Conventional spatial econometric models, including spatial autoregressive models, incorporate geographic neighborhood effects primarily through fixed spatial weight matrices. Such approaches cannot adaptively adjust spatial association strength according to attribute similarity. Graph neural networks provide a more flexible solution for modeling spatial dependency; however, their application in real estate green value assessment has rarely been explored.
3. Research Methodology
3.1. Research Data and Framework
Based on the CMAB dataset [24], this study constructs a multimodal real estate green value assessment framework that integrates image, text, and spatial information. The framework is designed to achieve accurate housing price prediction and interpretable decomposition of green premiums. The proposed model is different from traditional hedonic price models only by relying on structural variables. The green value of real estate is depicted from three dimensions: visual perception, semantic expression, and spatial structure. Street view imagery, textual semantic information, and remote sensing data are incorporated to support multidimensional representation of green attributes.
From a theoretical perspective, real estate prices are generally influenced by general factors, regional factors, individual factors, and green characteristic factors [25]. To facilitate subsequent modeling, these factors are mapped into a unified multimodal feature system, as presented in Table 1.
Table 1.
Mapping relationship between real estate value influencing factors and multimodal data.
Given the -th property sample, its multimodal input and prediction target are calculated as:
and are the image set and text information corresponding to the -th sample, respectively; is the building structural attribute vector; refers to the geographic coordinates of the property; stands for the predicted logarithmic housing unit price; denotes the multimodal valuation model; and represents the model parameters.
3.2. Image Modality Feature Extraction
The image modality reflects the environmental quality dimension of green characteristic factors and covers two levels: street-level visual greenery and the regional ecological environment.
Street view imagery captures residents’ visual perception of greenery from the pedestrian perspective and therefore provides an important representation of environmental quality [26]. In this study, street view images are uniformly collected along the surrounding road network within a predefined radius centered on each property coordinate. Assuming that street view images are collected for the -th sample, the GVI is calculated by Equation (2).
denotes the average street-level greenery ratio for sample , represents the number of street view images corresponding to the sample; is the number of pixels identified as green vegetation in the -th street view image; and stands for the total number of pixels in the corresponding image. A higher GVI value indicates richer surrounding greenery and a stronger perceivable green environment for residents.
However, GVI alone cannot fully represent higher-order visual information embedded in street view imagery, such as environmental quality, spatial openness, and aesthetic characteristics. Therefore, this study employs the ViT to extract deep semantic visual features from street view images [27]. For the -th image , the ViT encoding process is expressed as follows:
refers to the visual feature vector of the -th image, and denotes the dimension of the visual embedding space. These deep visual features characterize complex green-related attributes in street scenes, including vegetation morphology, road openness, and environmental cleanliness.
Remote sensing imagery is further used to extract the NDVI and LST indicators [28,29]; this reflects the regional ecological environment at a broader spatial scale. The corresponding calculations are defined as follows:
and stand for the reflectance values of the near-infrared and red spectral bands, respectively. Higher NDVI values indicate greater vegetation coverage and better ecological conditions. represents the original observed value of the Landsat thermal infrared band; is the atmospheric correction parameter; denotes land surface emissivity; and means the LST inversion function.
The image modality feature consists of both interpretable indicators (, , and ) and deep semantic features ().
3.3. Text Modality Feature Extraction
The text modality represents the energy utilization dimension within green characteristic factors of real estate assets. Most text modality information is derived from publicly available or official green certification documents.
To capture contextual semantic information in textual data, this study employs BERT-base-Chinese for text encoding. Let the text sequence corresponding to sample be , where is the text length. The hidden state matrix is obtained as follows:
represents the contextual text representation, and denotes the hidden layer dimension of BERT.
Since not all words contribute equally to green value assessment, an attention pooling mechanism is introduced to emphasize green-related semantic information and improve feature extraction accuracy. Let denote the hidden representation of the -th word in sample . Its intermediate attention representation is given as follows.
is the attention projection matrix; represents the bias term; and refers to the intermediate hidden vector.
The corresponding attention weight is calculated as Equation (8).
represents the importance weight of the -th word in sample , and denotes the learnable context vector.
Based on the attention weights, the textual semantic feature is aggregated as follows:
denotes the attention-aggregated textual semantic vector. This representation emphasizes semantic information directly related to green value, including terms such as “energy conservation”, “photovoltaic”, “green building materials”, “low carbon”, and “sponge city”.
For green certification information extracted from textual data [30], such as LEED, China Green Label, and corresponding certification levels, categorical embedding is adopted for feature encoding. Let denote the certification category. Its embedding representation is defined as Equation (10).
represents the certification category embedding, and denotes the embedding dimension.
The final text modality feature combines textual semantic features and certification embeddings:
3.4. Spatial Modality Feature Extraction
The spatial modality represents regional and individual factors and serves as the most fundamental and stable source of structured information in real estate valuation [31,32,33].
The basic spatial feature representation is constructed by concatenating regional and individual factors as follows:
and stand for regional and individual factors, respectively; , , and denote the distances to the nearest park, subway station, and high-quality school; represents the density of Points of Interest (POI) within a predefined radius; and is road network density. The variable indicates building age, and refers to floor area. and are one-hot encoded variables corresponding to building structural type and orientation.
To capture neighborhood dependency among properties, a spatial graph is constructed, where and are the sets of property nodes and graph edges, respectively. An edge is established between two properties when the geographic distance between them is smaller than the threshold . The normalized adjacency matrix is defined as follows:
is the raw adjacency matrix (unnormalized); refers to the degree matrix (); indicates whether samples and are adjacent; is the geographic distance between the two properties, and represents the adjacency threshold.
A two-layer GCN is employed to propagate and aggregate spatial dependency information. The propagation process is defined as Equation (14).
is the -th layer’s node feature matrix; denotes the learnable weight matrix; refers to the activation function, which is set to Rectified Linear Unit (ReLU). The input layer is initialized as .
After two layers of graph propagation, the final spatial representation is obtained as follows:
3.5. Real Estate Valuation Under the Multimodal Fusion Mechanism
The image, text, and spatial features in this study originate from different data sources. Direct feature concatenation may lead to unbalanced modal imbalance and insufficient cross-modal interaction. To address this issue, a multimodal fusion mechanism is therefore proposed to achieve adaptive information integration through unified feature mapping, cross-modal attention, and dynamic gating.
First, the three modality features are projected into a unified feature space, allowing heterogeneous modalities to interact within a consistent representation dimension [34,35]. To capture complementary relationships across modalities, a cross-modal attention mechanism is employed; thus, visual, textual, and spatial features can mutually reinforce feature representation. Considering that the composition of green value varies across different property types, a dynamic gating mechanism is introduced to assign adaptive modality weights. The importance of each modality is automatically adjusted through the gating process, and the weighted fusion features are subsequently used for housing price prediction and green premium analysis. The multimodal fusion process is defined as follows:
, , and represent the image, text, and spatial features enhanced through cross-modal attention, respectively. , , and are the dynamic weights assigned to the corresponding modalities.
Based on the multimodal fusion features, a Multi-Layer Perceptron (MLP) is constructed for housing price prediction [36]. The MLP captures complex nonlinear relationships between multimodal features and housing prices. Logarithmic housing price is used as the prediction target, and model training is conducted by minimizing the mean squared error (MSE) between predicted and actual values. An L2 regularization term is incorporated to reduce overfitting risk.
To improve model interpretability, this study introduces SHAP analysis [37] to identify the driving mechanisms of green value. SHAP quantifies the marginal contribution of each feature to individual prediction outcomes and further decomposes these contributions into image, text, and spatial modality components associated with green premium. This decomposition clarifies the main sources of green value and enables comparison of modal effects across different property samples.
The loss function used for model training is defined as Equation (17).
refers to the real logarithmic housing price of sample ; is the model’s predicted value; stands for the number of samples; represents the model parameter; and denotes the regularization coefficient.
The overall framework of this study is displayed in Figure 1.
Figure 1.
Overall framework of the proposed model.
The proposed framework integrates several large-scale deep learning components, including ViT, BERT, and GCN. As a result, the framework involves relatively high computational complexity. Therefore, computational sustainability should also be considered. According to the systematic review conducted by Verdecchia, et al. [38], the core principles of Green AI include model efficiency, data efficiency, and hardware efficiency.
This study follows Green AI principles in several aspects.
- (1)
- Model efficiency: A pretraining-finetuning strategy is adopted. The lower layers of ViT and BERT are frozen, while only the top four layers are finetuned, reducing approximately 60% of trainable parameters. Mixed-precision training (FP16) is further employed to reduce Graphics Processing Unit (GPU) memory usage and computational energy consumption. An early stopping strategy (patience = 20 epochs) is also introduced to avoid unnecessary training iterations.
- (2)
- Data efficiency: The publicly available CMAB dataset is utilized to avoid repeated data collection. Data augmentation techniques, including random flipping and brightness adjustment, are applied to increase the effective sample size and reduce dependence on additional data acquisition.
- (3)
- Hardware efficiency: All experiments are conducted using a single NVIDIA RTX 4090 GPU without relying on distributed computing clusters. Gradient accumulation is adopted to simulate large-batch training while reducing hardware requirements.
4. Experimental Setup and Performance Evaluation
4.1. Experimental Environment and Parameter Settings
Experiments in this study are conducted on a high-performance computing platform equipped with an NVIDIA RTX 4090 GPU for deep neural network training. The Central Processing Unit (CPU) is an Intel Core i9-13900K, and a high-speed Non-Volatile Memory Express Solid State Drive (NVMe SSD) is used for data storage. To optimize GPU memory utilization, mixed-precision training and gradient accumulation strategies are adopted. These configurations support efficient multimodal feature processing and large-scale model training while maintaining computational stability and experimental reproducibility.
The CMAB dataset used in this study was developed by the research team led by Long Ying at Tsinghua University. The dataset represents the first national-scale, high-precision, multi-attribute building dataset covering urban built environments across mainland China. It includes approximately 31 million buildings distributed across 31 provinces, autonomous regions, and municipalities, excluding Hong Kong, Macao, and Taiwan. The dataset covers 3667 urban spatial units, with a total rooftop area of 23.6 billion square meters and a total building volume of 363 billion cubic meters. From this dataset, 8542 real estate samples containing complete multimodal information are selected for analysis. The samples are distributed across 12 major Chinese cities, including first-tier, new first-tier, and second-tier cities, thereby ensuring representativeness and spatial heterogeneity. Specifically, first-tier cities, including Beijing, Shanghai, Guangzhou, and Shenzhen, account for 34.2% of the samples. New first-tier cities, including Hangzhou, Chengdu, Wuhan, and Nanjing, account for 41.5%, while second-tier cities, including Xi’an, Changsha, and Zhengzhou, account for 24.3%. The data collection period spans from 2019 to 2024. The training dataset covers 2019–2022, the validation dataset corresponds to 2023, and the testing dataset corresponds to 2024. Street view imagery is primarily derived from 2022 to 2024 Google Earth imagery with a spatial resolution ranging from 0.3 to 1 m.
The data preprocessing procedure is summarized as follows.
- (1)
- Missing value processing: For structured features such as floor area and building age, K-Nearest Neighbors (KNN) imputation with k = 5 is applied. Samples with missing image data are removed, while missing textual descriptions are replaced with the placeholder “no description.”
- (2)
- Outlier detection: Housing price outliers are identified using the Interquartile Range (IQR) method, and samples exceeding 1.5 times the IQR are removed. For image quality control, samples with image resolutions lower than 224 × 224 or blur indicators exceeding predefined thresholds are excluded.
- (3)
- Data normalization: Continuous variables are standardized using Z-score normalization. Categorical variables, including structural type and orientation, are encoded using one-hot encoding. The housing price target variable is logarithmically transformed to alleviate right-skewed distributions.
- (4)
- Image preprocessing: Street view images are uniformly resized to 224 × 224 pixels. Data augmentation techniques, including random horizontal flipping, brightness adjustment (±15%), and contrast enhancement (±10%), are applied. Remote sensing images are resampled to the same resolution as the street view imagery.
The adjacency threshold used for constructing the spatial association graph is determined through the following procedure. First, statistical characteristics of pairwise geographic distances among all samples, including the mean, median, and standard deviation, are analyzed. Second, candidate thresholds of 300 m, 500 m, 800 m, 1000 m, and 1500 m are selected according to the commonly adopted neighborhood effect ranges in urban planning and real estate studies, which typically vary between 500 and 1000 m. Third, grid-based optimization is conducted using validation-set MSE as the objective function. The optimal spatial adjacency threshold is determined to be 800 m.
Sensitivity analysis further indicates that when the threshold varies between 600 m and 1200 m, fluctuations in overall model performance remain below 8%, suggesting that the selected threshold exhibits satisfactory robustness.
This study divides the dataset into training, validation, and testing subsets according to an 8:1:1 ratio. The partition strategy is designed based on the following considerations. First, allocating 80% of the samples to the training set enables the deep learning framework to sufficiently learn and fit complex multimodal feature representations. Second, assigning 10% of the samples to both the validation and testing sets supports effective hyperparameter optimization and objective evaluation of model generalization ability. To avoid spatial data leakage, a geographic grid-based partitioning strategy is adopted. The entire study area is first divided into standard geographic grids of 1 km × 1 km. Stratified sampling is then performed at the grid level to ensure that all samples within the same grid are assigned exclusively to a single dataset subset. This strategy prevents cross-dataset leakage of spatial neighborhood information.
The hyperparameters of each module in the proposed multimodal housing price assessment framework are determined through a combination of domain knowledge, standard pretrained model configurations, and validation-based optimization results. The visual branch employs the pretrained ViT-Base-Patch16-224 model initialized on the ImageNet dataset and subsequently finetuned for real estate scene analysis. All images are resized to 224 × 224 pixels. A 768-dimensional visual embedding space is adopted to maintain consistency with the text branch. Only the final four layers of the ViT are finetuned, while lower layers remain frozen to preserve general visual representations. The text branch utilizes the pretrained BERT-base-Chinese model adapted to Chinese-language contexts. The maximum text input length is set to 512 tokens to accommodate most real estate description samples. The model retains the standard configuration of 768 hidden dimensions and 12 attention heads. During feature fusion, an attention pooling layer reduces the unified 768-dimensional feature representation to 256 dimensions. A dropout rate of 0.2 is applied to mitigate overfitting. The spatial Graph Convolutional Network (GCN) module adopts a two-layer convolutional architecture to avoid excessive node feature smoothing. The hidden layer dimension is set to 256 to balance representational capacity and computational efficiency. Based on geographic distance grid search, the spatial adjacency threshold is determined to be 800 m. The ReLU activation function is employed for spatial feature modeling. The cross-modal interaction module uses eight attention heads with a 64-dimensional representation for each head to achieve deep alignment among image, text, and spatial features. The dynamic gating network adopts a hierarchical structure of [256, 512] and applies a standard temperature coefficient of 1.0 to regulate modality fusion weights. The final MLP housing price prediction network adopts hidden layer dimensions of [512, 256, 128], together with a dropout rate of 0.3 and ReLU activation, to further reduce overfitting risk. The overall training process employs the Adam optimizer with an initial learning rate of 0.001. A cosine annealing strategy is adopted for smooth learning rate decay. Considering GPU memory limitations, the batch size is set to 64, and the maximum number of training epochs is fixed at 200. An L2 regularization coefficient of 0.0001 is incorporated to constrain parameter complexity. In addition, an early stopping mechanism with a patience value of 20 epochs is applied. Training terminates when the validation-set MSE fails to improve continuously within the specified patience interval. This configuration balances convergence performance, generalization capability, computational efficiency, and hardware adaptability.
Hyperparameter optimization is conducted through a hybrid strategy combining hierarchical grid search and Bayesian optimization. First, coarse-grained grid search is performed for core hyperparameters, including learning rate, batch size, and regularization coefficient. Subsequently, fine-grained parameter optimization is conducted using a Bayesian optimization algorithm based on the Tree-structured Parzen Estimator, guided by validation-set performance. Each parameter configuration is evaluated through three independent repeated experiments, and the average experimental results are used as the final performance criterion. This study adopts MSE, mean absolute error (MAE), and root mean squared error (RMSE) as evaluation metrics for comprehensive model comparison. Baseline models include the traditional Hedonic pricing model, Ridge Regression, RF, and eXtreme Gradient Boosting (XGBoost).
4.2. Performance Evaluation
To improve the stability and reliability of the experimental results, all models are evaluated through five independent repeated experiments. The comparative results of the proposed algorithm and baseline models are demonstrated in Figure 2 and Table 2.
Figure 2.
Comparison results of different algorithms.
Table 2.
Comparative analysis of various algorithms (mean ± standard deviation).
The proposed multimodal fusion method achieves the best overall performance across all three error indicators compared with the four mainstream baseline methods, namely the Hedonic pricing model, Ridge Regression, RF, and XGBoost. The proposed framework achieves an MSE of 0.0505 ± 0.0021, an RMSE of 0.2260 ± 0.0029, and an MAE of 0.1961 ± 0.0038. These results indicate substantially lower prediction error and higher stability than the comparison models. Compared with XGBoost, which achieves an MSE of 0.0718 ± 0.0029 and an RMSE of 0.2688 ± 0.0038, the proposed framework reduces MSE and RMSE by approximately 29.7% and 15.9%, respectively. These findings indicate that the image–text–spatial fusion strategy effectively captures the intrinsic relationships among multidimensional features and integrates complementary information across heterogeneous modalities. The framework therefore improves predictive fitting capability and model stability beyond what can be achieved using conventional single-model approaches. The results of the three single-modality control groups further demonstrate the effectiveness of multimodal fusion. The spatial-only model achieves the strongest performance among the single-modality baselines, with an MSE of 0.0779 ± 0.0032, RMSE of 0.2710 ± 0.0039, and MAE of 0.1953 ± 0.0045. In contrast, the image-only model produces larger prediction errors, with an MSE of 0.0905 ± 0.0046, RMSE of 0.3015 ± 0.0051, and MAE of 0.2132 ± 0.0062. These findings suggest that spatial and locational attributes remain fundamental determinants of housing prices. However, reliance exclusively on visual environmental features or textual semantic information cannot adequately represent the full range of real estate characteristics. Multimodal fusion effectively compensates for the limitations of individual modalities and reduces prediction bias caused by single-dimensional feature representations.
The CNN + MLP and LSTM + MLP frameworks introduce image and text information separately and therefore achieve better performance than the spatial-only baseline. Nevertheless, their performance remains inferior to the proposed framework, indicating that simple feature concatenation is insufficient to capture complex multimodal interaction effects. Although the CNN + LSTM + MLP framework further improves performance through multimodal integration (MSE = 0.0615 ± 0.0025), its error remains approximately 21.8% higher than that of the proposed framework. This result demonstrates the importance of the cross-modal attention mechanism and dynamic gating strategy in optimizing multimodal fusion performance. The performance improvement of the proposed framework also benefits from the superior representation capabilities of ViT for image feature extraction and BERT for semantic text understanding. Overall, the effectiveness of the proposed framework originates from the collaborative interaction among three complementary representation learning pathways. Specifically, the cross-modal attention mechanism enables bidirectional information enhancement. Visual features extracted by ViT provide spatial grounding for textual green semantics, while BERT-encoded textual signals highlight green-related regions within visually complex street scenes and thereby reduce visual ambiguity. In addition, the spatial embeddings generated by the GCN introduce topological constraints into cross-modal interaction, ensuring that attention weights between image–text feature pairs are modulated by geographic proximity. Samples sharing similar locational contexts therefore obtain aligned feature representations. This three-way interaction alleviates the inherent limitations of single-modality models. The image-only model lacks semantic disambiguation capability, the text-only model lacks objective environmental verification, and the spatial-only model cannot capture non-locational green attributes. These comparative results collectively demonstrate the necessity and synergistic value of each component within the proposed framework.
To further verify whether the performance advantages of the proposed framework are statistically significant, paired-sample t-tests and Wilcoxon signed-rank tests are conducted. Using MSE as the evaluation metric, the paired comparison between the proposed framework and XGBoost produces a t-statistic of 8.734 with p < 0.001, while the Wilcoxon test yields a statistic of 0 with p < 0.01. Both statistical tests confirm that the performance difference is highly significant. In addition, 95% Confidence Intervals (CI) are used to evaluate model stability. The proposed framework achieves an MSE 95% CI of [0.0463, 0.0547], whereas the corresponding interval for XGBoost is [0.0661, 0.0775]. Since the two CI do not overlap, the statistical superiority of the proposed framework is further supported.
To verify the rationality of the proposed framework, an ablation study is conducted. The corresponding results are presented in Figure 3 and Table 3.
Figure 3.
Results of the ablation experiment.
Table 3.
Ablation experiments (mean ± standard deviation).
Compared with the proposed model (MSE = 0.0505 ± 0.0021, MAE = 0.1961 ± 0.0038, and RMSE = 0.2260 ± 0.0029), all three error indicators rise noticeably after removing either the attention mechanism or the dynamic gating mechanism. The performance degradation caused by removing the gating mechanism is slightly greater than that caused by removing the attention mechanism. Specifically, the framework without the gating mechanism produces an MSE of 0.0613 ± 0.0027, MAE of 0.2115 ± 0.0048, and RMSE of 0.2476 ± 0.0036, whereas the framework without the attention mechanism achieves an MSE of 0.0589 ± 0.0025, MAE of 0.2068 ± 0.0044, and RMSE of 0.2427 ± 0.0033. These findings indicate that both mechanisms play essential roles in high-precision prediction by improving multimodal feature fusion and enhancing model stability. In addition, removing any modality among the image, text, and spatial branches results in further increases in prediction error, confirming the importance of tri-modal collaborative representation learning. Among these variants, the framework without the spatial modality shows the largest performance decline, with MSE and RMSE increasing to 0.0745 ± 0.0036 and 0.2730 ± 0.0045, respectively. These values are substantially higher than those observed after removing the text modality (MSE = 0.0639 ± 0.0029, RMSE = 0.2528 ± 0.0038) or the image modality (MSE = 0.0668 ± 0.0031, RMSE = 0.2585 ± 0.0040). The results suggest that spatial–locational characteristics and building structural attributes exert the strongest influence on prediction performance, exceeding the contributions of environmental quality information from the image modality and green semantic information from the text modality. The synergistic integration of the three modalities therefore constitutes a key prerequisite for accurate housing price prediction. Performance degradation caused by the removal of any modality further supports the rationality and effectiveness of the proposed multimodal fusion architecture. The interaction between environmental semantics and spatial features in the proposed framework is achieved through two complementary mechanisms. First, positive spatial attributes are often associated with richer green semantic descriptions within the dataset, since high-end properties generally contain more detailed marketing narratives. This produces semantic–spatial covariance, which is exploited by the cross-modal attention mechanism for joint feature refinement. Second, the dynamic gating mechanism mitigates potential conflicts among modalities. When textual descriptions deviate from spatial distance indicators, the gating network reduces the weight assigned to conflicting text branches while increasing the weight of spatial evidence, thereby limiting the influence of exaggerated marketing language on prediction outcomes. This adversarial validation capability is absent in simple feature concatenation approaches and improves robustness against potential “greenwashing” effects.
To further improve economic interpretability, a green premium analysis experiment is conducted. The corresponding results are illustrated in Figure 4.
Figure 4.
Results of green premium analysis.
The proposed model’s prediction accuracy shows a gradient optimization feature as housing prices increase. Prediction error is highest in the low-priced housing group (MSE = 0.0582, RMSE = 0.2412), decreases substantially in the mid-priced housing group; in addition, the high-priced housing group achieves the best prediction effect (MSE = 0.0466, RMSE = 0.2158). This pattern confirms that the core features considered in this study, including green ecological characteristics, semantic certification information, and locational advantages, exert stronger explanatory power within the pricing systems of high-value residential properties. High-end residences demonstrate greater sensitivity to premiums from green building attributes, environmental landscapes, and spatial–location advantages; they have more distinguishable feature signals for accurate model fitting.
The interpretability analysis results of the proposed model are presented in Table 4.
Table 4.
Distribution of SHAP contributions.
From the global contribution of categories, text modality exerts the strongest influence on the model predictions, accounting for 51.45% of the total SHAP contribution; this is the core leading factor. Followed by image modality, the global contribution represents 38.48%, whereas the spatial modality contributes 10.07%, and the supplementary regulation effect is remarkable. The three modalities form a distinct and mutually complementary contribution structure. This finding is consistent with the ablation experiment results, in which the removal of any modality led to substantial declines in predictive performance. At the individual feature level, the highest-contributing variables are concentrated within the core indicators of the three modalities. Specifically, the green certification level in the text modality, the ViT-derived visual features in the image modality, and building area together with POI density in the spatial modality exhibit the highest SHAP contributions. These findings indicate that green semantic labels, deep visual environmental features and locational support scale are key positive determinants of housing value. By contrast, indicators such as LST, distance to parks, distance to subway stations, and building age display negative average SHAP values, suggesting inhibitory effects on prediction outcomes. These patterns are consistent with practical geographical and architectural characteristics. Combined with the positive and negative effects of SHAP, the mechanism of feature action can be clarified. contribution mechanisms. Within the image modality, GVI, NDVI, and ViT visual features mainly exert positive effects, indicating that ecological quality and visual environmental characteristics improve valuation outcomes. All sub-items of text modality contribute positively to SHAP; this proves the value-enhancing effects of green energy-saving semantics, environmentally friendly materials, and high-level green certifications. In the spatial modality, both positive and negative effects coexist. Commuting distance and building age function as restrictive factors, whereas support density and building area contribute positively, objectively reflecting the dual-directional nature of location-dependent residential value formation.
Although the SHAP analysis indicates that the text modality contributes 51.45% of the overall explanatory power, this dominant role should be interpreted from several perspectives.
First, information asymmetry and marketing bias may partially explain the strong contribution of textual features. Real estate textual descriptions, including property listings and developer promotional materials, inherently function as marketing discourse and may contain elements of “greenwashing,” whereby ecological, low-carbon, or energy-saving terminology is overstated to enhance property attractiveness despite limited actual environmental performance. Consequently, the high SHAP contribution of the text modality may partly reflect the premium effects of marketing language rather than purely environmental value. This issue is particularly prominent in real estate markets because buyers often cannot fully verify green claims prior to purchase.
Second, from the perspective of signaling theory, green certifications and energy-efficiency labels function not only as indicators of environmental performance but also as symbolic sustainability signals. Such labels communicate social meanings associated with high quality, modernity, and responsible lifestyles. In high-end housing markets, green certifications may therefore operate partly as status symbols rather than solely as environmental investments. As a result, the measured “green value” captured by the model may combine both environmental value and symbolic value, which should be distinguished carefully during interpretation.
Third, the source of textual data may introduce systematic bias. The textual information used in this study is primarily derived from public property descriptions and official certification documents, both of which are filtered and edited by developers or intermediaries. High-end properties are generally described with greater detail regarding green attributes, whereas ordinary residential properties often contain limited environmental descriptions. This imbalance in data generation mechanisms may contribute to the overestimation of text modality importance.
Fourth, SHAP inherently explain model prediction behavior rather than real-world causal relationships. Under conditions of strong feature collinearity, such as the positive correlation between green certification levels and community greening rates, SHAP may incorrectly attribute explanatory power to a single feature. In addition, SHAP assumes additive feature contributions in its global interpretation framework, whereas nonlinear interactions among multimodal features may produce misleading percentage decompositions. Future studies should therefore incorporate causal inference approaches, such as Difference-in-Differences and instrumental variable methods, together with repeated SHAP stability analyses, to further validate the robustness of the findings.
Fifth, from the perspective of information economics, the high SHAP contribution of the text modality reflects the structural characteristics of signal noise in real estate markets. According to the study by Solodoha [39], standardized signals such as certification levels are often easier for market participants to process and interpret than complex multidimensional information in highly asymmetric information environments. Consequently, these signals may exert disproportionate influence on market outcomes. However, such “signal advantages” are accompanied by systemic risks. When certification systems lack rigorous third-party verification mechanisms, low-quality products may imitate high-quality sustainability signals and obtain unjustified green premiums through greenwashing practices.
Overall, these limitations suggest that, although the text modality dominates the model prediction process, policymakers should avoid excessive reliance on textual green claims alone. Independent environmental audits and standardized disclosure requirements remain essential for ensuring that green value reflects actual environmental performance rather than marketing rhetoric.
To further evaluate the generalization stability and feature adaptation rules under different housing market structures, this study divides all samples into low-, medium-, and high-price groups according to housing price tiers. The average global SHAP contribution ratios of the image, text, and spatial modalities in the three groups, respectively. In addition, it carries out coupling analysis based on the grouped prediction accuracy. Detailed results are depicted in Figure 5 and Table 5.
Figure 5.
SHAP contribution ratios across different housing price tiers.
Table 5.
Average SHAP contribution ratios of each modality under different housing price tiers.
Figure 5 and Table 5 show that the contribution ratios of the three modalities exhibit clear gradient variations across housing price tiers, and these variations are strongly associated with changes in prediction accuracy. As housing prices increase from the low-price to the high-price group, the contribution ratio of the text modality (green semantics) rises from 42.16% to 58.27%. This trend indicates that soft green semantic labels (e.g., green certification levels, energy-saving design descriptions, and environmentally friendly materials) are core dominant factors in the premium pricing mechanisms of high-end residences. The high-end housing market shows much higher sensitivity to such green semantic attributes than middle- and low-end markets. The contribution ratio of the image modality remains relatively stable, fluctuating between 33.18% and 37.95%. The ratio decreases only slightly from 35.73% in the low-price group to 33.18% in the high-price group. This finding suggests that ecological and visual indicators (such as landscape greenery, LST, and ViT-derived visual features) provide important support across all housing price ranges as a basic reference dimension for residential value assessment. However, their influence becomes secondary to the dominant role of textual green semantics in high-end properties. The contribution ratio of the spatial modality (location and supporting facilities) decreases continuously from 22.11% in the low-price group to 8.55% in the high-price group. This pattern reflects differences in the pricing logic across housing market segments. Low-price housing markets are more strongly driven by basic locational attributes, including subway accessibility, POI density, building age, and floor area, which directly influence residential utility and affordability. In contrast, the pricing logic of high-end residences has shifted from basic locational requirements toward higher-level dimensions like green value and ecological quality. Consequently, the relative influence of conventional location-based factors is substantially weakened in premium housing markets. The modal contribution gradient is highly coupled with the model accuracy gradient in Table 3. Stronger dominance of green semantic information and more concentrated high-end feature signals are associated with lower prediction errors and improved prediction stability. These findings further confirm the effectiveness and adaptability of the proposed multimodal fusion model in differentiated real estate valuation scenarios.
To further validate the robustness of the proposed framework, several additional experiments are conducted.
First, a cross-city validation experiment is performed by iteratively selecting data from one city as the test set while using data from the remaining cities for training. The results show that the framework maintains relatively strong generalization performance across most cities, with an average MSE of 0.0556 ± 0.0042. However, performance declines in cities with substantially different real estate market characteristics, particularly lower-tier cities, where the MSE increases to 0.0689. This finding suggests that the applicability of the framework varies across markets with different levels of maturity and structural characteristics.
Second, alternative training–testing partition schemes are examined in addition to the original 8:1:1 split. The 7:2:1 and 6:2:2 partition strategies produce MSE values of 0.0512 ± 0.0023 and 0.0528 ± 0.0028, respectively, compared with 0.0505 ± 0.0021 under the 8:1:1 configuration. Paired sample t-tests indicate that these performance differences are not statistically significant (p > 0.05), confirming the robustness of the data partition strategy.
Third, temporal validation is conducted using a forward validation strategy, in which historical data are used for training and future data are reserved for testing. This setup more closely reflects real-world deployment scenarios. The results indicate that prediction performance on out-of-time samples declines slightly, with MSE increasing by 3.2–10.1%. Nevertheless, the proposed framework still substantially outperforms traditional models, including XGBoost (MSE = 0.0718) during the same period. These findings demonstrate a certain degree of temporal robustness while also indicating that temporal market dynamics, such as policy changes and economic cycles, remain important factors affecting real estate valuation.
Fourth, experiments are conducted under different market conditions. Market cycles are classified according to the annual growth rate of the Chinese urban housing price index, including expansion periods (annual growth rate > 5%), stable periods (within ±5%), and downturn periods (annual growth rate < −5%). The framework achieves the best performance during expansion periods, whereas prediction errors increase by 12.5% during downturn periods. This pattern may be associated with the narrowing of green premiums under declining market conditions. In addition, the contribution ratio of the text modality decreases to 48.2% during downturn periods compared with 53.1% during expansion periods, further confirming the cyclical characteristics of green premiums.
Fifth, SHAP stability analysis is conducted using different random seeds (1–10) while maintaining identical data partitions and hyperparameter settings. The contribution ratios of the three modalities remain highly stable across repeated runs, with coefficients of variation below 1.5%. Specifically, the relative standard deviations are ±2.31% for the text modality, ±1.89% for the image modality, and ±1.15% for the spatial modality, all of which fall within acceptable ranges. These results confirm the reproducibility and stability of the interpretability analysis.
5. Conclusions
This study explores data-driven urban real estate green value assessment; it adopts the CMAB dataset to integrate image, text, and spatial multimodal data, thus building a multimodal fusion green value assessment framework. The proposed framework integrates image, text, and spatial data to address the limitations of traditional valuation approaches and existing single-source data-driven studies. The results demonstrate that multimodal fusion modeling can markedly improve the accuracy of real estate green value assessment. Concurrently, the proposed method is prominently better than benchmark models and single-modality control groups across three evaluation indicators, namely MSE, MAE, and RMSE. Within the model prediction behavior, the text modality exhibits the highest SHAP contribution (51.45%), indicating strong model dependence on textual green signals. Nevertheless, caution is required when interpreting this result as a real-world causal mechanism because SHAP describes model prediction behavior rather than underlying economic causality. The dominant role of the text modality may partly reflect marketing-related effects and symbolic sustainability signaling. Sub-items such as green certification levels and energy-saving semantics exert key positive effects. The image modality accounts for 38.48% of the global contribution; indicators including ViT visual features, GVI, and NDVI effectively characterize the empowering effect of ecological environments on green value formation. The spatial modality contributes 10.07% globally. POI density and building area are positive influencing factors; distance to parks and building age are restraining factors; this pattern objectively reflects the regulatory roles of location and building attributes. This study also finds that, as housing price tiers increase, the contribution of the text modality (green semantics) rises substantially and gradually becomes the dominant factor in premium pricing for high-end residences. By contrast, the contribution of the spatial modality (location matching) continuously declines; this reflects the differences in pricing logic across housing market segments. The image modality (environmental quality) maintains a stable and high contribution and plays a basic supporting dimension across different housing price levels.
The conclusions derived from this study provide practical implications for policymakers, urban planners, investors, and industry practitioners. The empirical results confirm that green building certifications and energy-efficiency labels can significantly increase residential property values, thereby providing empirical support for ecological urban development and green building policy implementation. Regulatory authorities may further improve standardized green building certification systems by enhancing transparency, comparability, and disclosure quality. Ecological residential value may also be incorporated into urban benchmark land price assessment systems to promote the marketization of ecological benefits. In addition, differentiated policy strategies may be implemented across housing price tiers. More stringent green certification standards may be applied to high-end residences, whereas energy-efficiency renovation subsidies may be directed toward middle- and low-income housing sectors. From the perspective of urban spatial planning, the empirical results of the spatial modality confirm the importance of green space accessibility and public facility allocation for residential value formation. These findings provide useful guidance for optimizing urban green space distribution and coordinating public service resources. During new urban district development, ecological green corridors and community-scale public parks may be prioritized to improve visual greenery and ecological environmental quality. Coordinated spatial planning between residential communities and public transportation systems may further reduce commuting-related value loss. At the same time, balanced distribution of urban green resources should be emphasized to prevent green gentrification and ensure equitable access to high-quality ecological residential environments for low-income groups. For investors adopting ESG investment strategies, the proposed multimodal fusion framework provides a practical tool for green real estate screening and asset value assessment. The framework enables identification of undervalued properties with latent green value potential while also supporting ecological risk assessment, including urban thermal environment risks. In addition, the framework may provide quantitative support for ESG reporting and sustainability-oriented asset evaluation. For practitioners engaged in green real estate development and building certification industries, the findings highlight the importance of transparent and verifiable environmental information disclosure. The dominant role of textual features in value formation suggests that credible disclosure of measurable environmental performance indicators, including actual energy-saving outcomes and authoritative certification levels, is essential for improving market value. Industry participants should therefore avoid vague or exaggerated green marketing narratives and instead disclose verifiable ecological performance data and operational indicators. Furthermore, the quantitative framework developed in this study may be integrated into smart city governance platforms for dynamic monitoring and assessment of real estate green value. By continuously incorporating updated street-view imagery, property listing information, and urban spatial activity data, the framework may support long-term tracking of the spatiotemporal evolution of residential green value and provide intelligent decision-making support for refined urban ecological governance.
Despite these contributions, several limitations remain. First, the dataset is constructed based on the Chinese urban real estate market, where land policies and green certification systems differ substantially from those of overseas markets. Consequently, the direct applicability of the framework to international real estate markets remains uncertain and requires further empirical validation. Second, the cyclical nature of real estate markets may influence green premium dynamics over time, thereby affecting prediction stability under different economic conditions. The temporal adaptability of the framework therefore requires additional improvement. Third, the training dataset does not fully cover low-income housing samples, resulting in structural imbalance that may introduce bias in green value assessment across different housing categories and weaken overall fairness in valuation outcomes. In addition, AI-based valuation systems may unintentionally reinforce existing patterns of resource inequality. Uneven spatial distribution of urban green infrastructure may be amplified through algorithmic valuation mechanisms, potentially exacerbating regional residential value disparities and raising concerns regarding environmental justice. Moreover, the proposed framework involves relatively high computational complexity and relies heavily on high-performance GPU hardware. Such computational requirements may limit efficient real-time deployment in resource-constrained practical scenarios and restrict large-scale implementation. Finally, this study does not explicitly incorporate differences in urban scale, including variations in economic development level, real estate market maturity, and green policy orientation. Future research may therefore focus on differentiated urban-scale characteristics by conducting targeted investigations across cities with different development stages and market structures. Such efforts may further refine the impact weights of multimodal features, improve model universality and practical applicability, and provide more targeted theoretical and practical guidance for real estate green value assessment across diverse urban contexts.
Author Contributions
Conceptualization, W.F. and L.Z.; methodology, W.F.; software, W.F.; validation, W.F. and L.Z.; formal analysis, W.F.; investigation, W.F.; resources, L.Z.; data curation, W.F.; writing—original draft preparation, W.F.; writing—review and editing, L.Z.; visualization, W.F.; supervision, L.Z.; project administration, L.Z.; funding acquisition, L.Z. All authors have read and agreed to the published version of the manuscript.
Funding
This research was funded by the National Natural Science Foundation of China, grant number 72474158.
Institutional Review Board Statement
Not applicable.
Informed Consent Statement
Not applicable.
Data Availability Statement
The data presented in this study are available on request from the corresponding author. The data are not publicly available due to privacy and ethical restrictions.
Conflicts of Interest
The authors declare no conflicts of interest.
References
- Popescu, D.; Mladin, E.-C.; Boazu, R.; Bienert, S. Methodology for Real Estate Appraisal of Green Value. Environ. Eng. Manag. J. 2009, 8, 601–606. [Google Scholar] [CrossRef] [Scilit]
- Zhang, Y.; Fu, X.; Lv, C.; Li, S. The Premium of Public Perceived Greenery: A Framework Using Multiscale GWR and Deep Learning. Int. J. Environ. Res. Public Health 2021, 18, 6809. [Google Scholar] [CrossRef] [Scilit]
- Lee, J.-W.; Lee, S.-W.; Kim, H.G.; Jo, H.-K.; Park, S.-R. Green Space and Apartment Prices: Exploring the Effects of the Green Space Ratio and Visual Greenery. Land 2023, 12, 2069. [Google Scholar] [CrossRef] [Scilit]
- Teo, H.C.; Fung, T.K.; Song, X.P.; Belcher, R.; Siman, K.; Chan, I.; Koh, L. Increasing Contribution of Urban Greenery to Residential Real Estate Valuation over Time. Sustain. Cities Soc. 2023, 96, 104689. [Google Scholar] [CrossRef] [Scilit]
- Hu, A.; Yabuki, N.; Fukuda, T.; Kaga, H.; Takeda, S.; Matsuo, K. Harnessing Multiple Data sources and Emerging Technologies for Comprehensive Urban Green Space Evaluation. Cities 2023, 143, 104562. [Google Scholar] [CrossRef] [Scilit]
- Zhang, P.; Ghosh, D.; Park, S. Spatial Measures and Methods in Sustainable Urban Morphology: A Systematic Review. Landsc. Urban Plan. 2023, 237, 104776. [Google Scholar] [CrossRef] [Scilit]
- Zandebasiri, M.; Jahanbazi Goujani, H.; Iranmanesh, Y.; Azadi, H.; Viira, A.-H.; Habibi, M. Ecosystem Services Valuation: A Review of Concepts, Systems, New Issues, And Considerations About Pollution in Ecosystem Services. Environ. Sci. Pollut. Res. 2023, 30, 83051–83070. [Google Scholar] [CrossRef] [Scilit] [PubMed]
- Isacs, L.; Kenter, J.O.; Wetterstrand, H.; Katzeff, C. What Does Value Pluralism Mean in Practice? An Empirical Demonstration from a Deliberative Valuation. People Nat. 2023, 5, 384–402. [Google Scholar] [CrossRef] [Scilit]
- Talan, G.; Sharma, G.D.; Pereira, V.; Muschert, G.W. From ESG to Holistic Value Addition: Rethinking Sustainable Investment from the Lens of Stakeholder Theory. Int. Rev. Econ. Financ. 2024, 96, 103530. [Google Scholar] [CrossRef] [Scilit]
- Liebelt, V.; Bartke, S.; Schwarz, N. Urban Green Spaces and Housing Prices: An Alternative Perspective. Sustainability 2019, 11, 3707. [Google Scholar] [CrossRef] [Scilit]
- Copiello, S.; Coletto, S. The Price Premium in Green Buildings: A Spatial Autoregressive Model and a Multi-Criteria Optimization Approach. Buildings 2023, 13, 276. [Google Scholar] [CrossRef] [Scilit]
- An, S.; Jang, H.; Kim, H.; Song, Y.; Ahn, K. Assessment of Street-Level Greenness and Its Association with Housing Prices in A Metropolitan Area. Sci. Rep. 2023, 13, 22577. [Google Scholar] [CrossRef] [Scilit] [PubMed]
- Walacik, M.; Chmielewska, A. Real Estate Industry Sustainable Solution (Environmental, Social, and Governance) Significance Assessment—AI-Powered Algorithm Implementation. Sustainability 2024, 16, 1079. [Google Scholar] [CrossRef] [Scilit]
- Pellizzari, C.B.; Tempesta, T.; Franceschinis, C.; Thiene, M.; Vecchiato, D. Unleashing the hHdden Green Value: Assessing the Impact of Energy Certification and Environmental Amenities on Real Estate through Hedonic modelling. Aestimum 2025, 87, 71–86. [Google Scholar] [CrossRef] [Scilit]
- Xu, Y.; Chen, R.; Du, H.; Chen, M.; Fu, C.; Li, Y. Evaluation of Green Space Influence on Housing Prices Using Machine Learning and Urban Visual Intelligence. Cities 2024, 158, 105661. [Google Scholar] [CrossRef] [Scilit]
- Ledraa, T.; Aldubikhi, S.A. Unveiling the Value of Green Amenities: A Mixed-Methods Analysis of Urban Greenspace Impact on Residential Property Prices Across Riyadh Neighborhoods. Buildings 2025, 15, 2088. [Google Scholar] [CrossRef] [Scilit]
- Alfarhood, M.; Alahmad, A.; Alalwan, A.; Alkulaib, F. Leveraging Satellite Imagery and Machine Learning for Urban Green Space Assessment: A Case Study from Riyadh City. Sustainability 2025, 17, 6118. [Google Scholar] [CrossRef] [Scilit]
- Huang, C.; Liang, B.; Li, Z.; Chen, F. Multimodal Machine Learning for Real Estate Appraisal: A Comprehensive Survey. In Proceedings of the Advances in Knowledge Discovery and Data Mining; Springer Nature: Singapore, 2025; pp. 345–361. [Google Scholar]
- Wang, J.; Lee, C.L.; Han, H. Green Building Certification And drivers of Green Premiums: A meta-Regression Analysis on Global housing Market. Smart Sustain. Built Environ. 2025. ahead of print. [Google Scholar] [CrossRef] [Scilit]
- Aziz, A.; Anwar, M.M.; Abdo, H.G.; Almohamad, H.; Al Dughairi, A.A.; Al-Mutiry, M. Proximity to Neighborhood Services and Property Values in Urban Area: An Evaluation through the Hedonic Pricing Model. Land 2023, 12, 859. [Google Scholar] [CrossRef] [Scilit]
- Diarra, B.; Geels, F.W. Advanced Introduction to Sustainability Transitions. In Hungarian Geographical Bulletin; Edward Elgar Publishing: Cheltenham, UK, 2026; Volume 75, pp. 131–135. [Google Scholar]
- Vonlanthen, J. ESG Ratings and Real Estate Key Metrics: A Case Study. Real Estate 2024, 1, 267–292. [Google Scholar] [CrossRef] [Scilit]
- Hu, H.; Zhu, Y.; Ye, L.; Wang, Y. How Does Environmental Tax Reform Drive Corporate Innovation to Green Technologies? Quasi-Natural Experimental Evidence from China. J. Bus. Econ. Manag. 2025, 26, 798–824. [Google Scholar] [CrossRef] [Scilit]
- Zhang, Y.; Zhao, H.; Long, Y. CMAB: A Multi-Attribute Building Dataset of China. Sci. Data 2025, 12, 430. [Google Scholar] [CrossRef] [Scilit] [PubMed]
- Gil-Ozoudeh, I.; Iwuanyanwu; Okwandu, A.; Ike, P. The Impact of Green Building Certifications on Market Value and Occupant Satisfaction. Int. J. Manag. Entrep. Res. 2024, 6, 2782–2796. [Google Scholar] [CrossRef] [Scilit]
- Wang, G.-Y. The Effect of Environment on Housing Prices: Evidence from the Google Street View. J. Forecast. 2023, 42, 288–311. [Google Scholar] [CrossRef] [Scilit]
- Chen, C.; Ma, X.; Zhang, X. Empirical Study on Real Estate Mass Appraisal Based on Dynamic Neural Networks. Buildings 2024, 14, 2199. [Google Scholar] [CrossRef] [Scilit]
- Deng, L. Real Estate Valuation with Multi-Source Image Fusion and Enhanced Machine Learning pipeline. PLoS ONE 2025, 20, e0321951. [Google Scholar] [CrossRef] [Scilit] [PubMed]
- Guerri, G.; Crisci, A.; Cresci, I.; Congedo, L.; Munafò, M.; Morabito, M. Residential Buildings’ Real Estate Values Linked to Summer Surface Thermal Anomaly Patterns and Urban Features: A Florence (Italy) Case Study. Sustainability 2022, 14, 8412. [Google Scholar] [CrossRef] [Scilit]
- Holtermans, R.; Kok, N. On the Value of Environmental Certification in the Commercial Real Estate Market. Real Estate Econ. 2017, 47, 685–722. [Google Scholar] [CrossRef] [Scilit]
- Wanga, P.-Y.; Chen, C.-T.; Su, J.-W.; Ting-Yun, W.; Huang, S.-H. Deep Learning Model for House Price Prediction Using Heterogeneous Data Analysis Along with Joint Self-Attention Mechanism. IEEE Access 2021, 9, 55244–55259. [Google Scholar] [CrossRef] [Scilit]
- Das, S.S.S.; Ali, M.E.; Li, Y.-F.; Kang, Y.-B.; Sellis, T. Boosting House Price Redictions Using Geo-Spatial Network Embedding. Data Min. Knowl. Discov. 2021, 35, 2221–2250. [Google Scholar] [CrossRef] [Scilit]
- Yousif, A.; Baraheem, S.; Vaddi, S.S.; Patel, V.S.; Shen, J.; Nguyen, T.V. Real Estate Pricing Prediction Via Textual and Visual Features. Mach. Vis. Appl. 2023, 34, 126. [Google Scholar] [CrossRef] [Scilit]
- Zhao, Y.; Zhao, J.; Lam, E.Y. House Price Prediction: A Multi-Source Data Fusion Perspective. Big Data Min. Anal. 2024, 7, 603–620. [Google Scholar] [CrossRef] [Scilit]
- Chiu, S.-M.; Chen, Y.-C.; Lee, C. Estate Price Prediction System Based on Temporal and Spatial Features and Lightweight Deep Learning Model. Appl. Intell. 2022, 52, 808–834. [Google Scholar] [CrossRef] [Scilit]
- Rosato, P.; Galante, M. Forecasting the Housing Market Sales in Italy: An MLP Neural Network Model. Real Estate 2025, 2, 16. [Google Scholar] [CrossRef] [Scilit]
- Kee, T.; Ho, W.K.O. Explainable Machine Learning for Real Estate: XGBoost and Shapley Values in Price Prediction. Civ. Eng. J. 2025, 11, 2116–2133. [Google Scholar] [CrossRef] [Scilit]
- Verdecchia, R.; Sallou, J.; Cruz, L. A Systematic Review of Green AI. WIREs Data Min. Knowl. Discov. 2023, 13, e1507. [Google Scholar] [CrossRef] [Scilit]
- Solodoha, E. Who Sees the Risk? Innovation, Information Asymmetry, And Investor Origin in Startup Evaluation. J. Bus. Strategy 2026, 47, 321–338. [Google Scholar] [CrossRef] [Scilit]
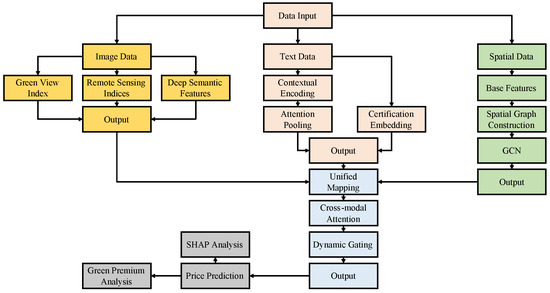
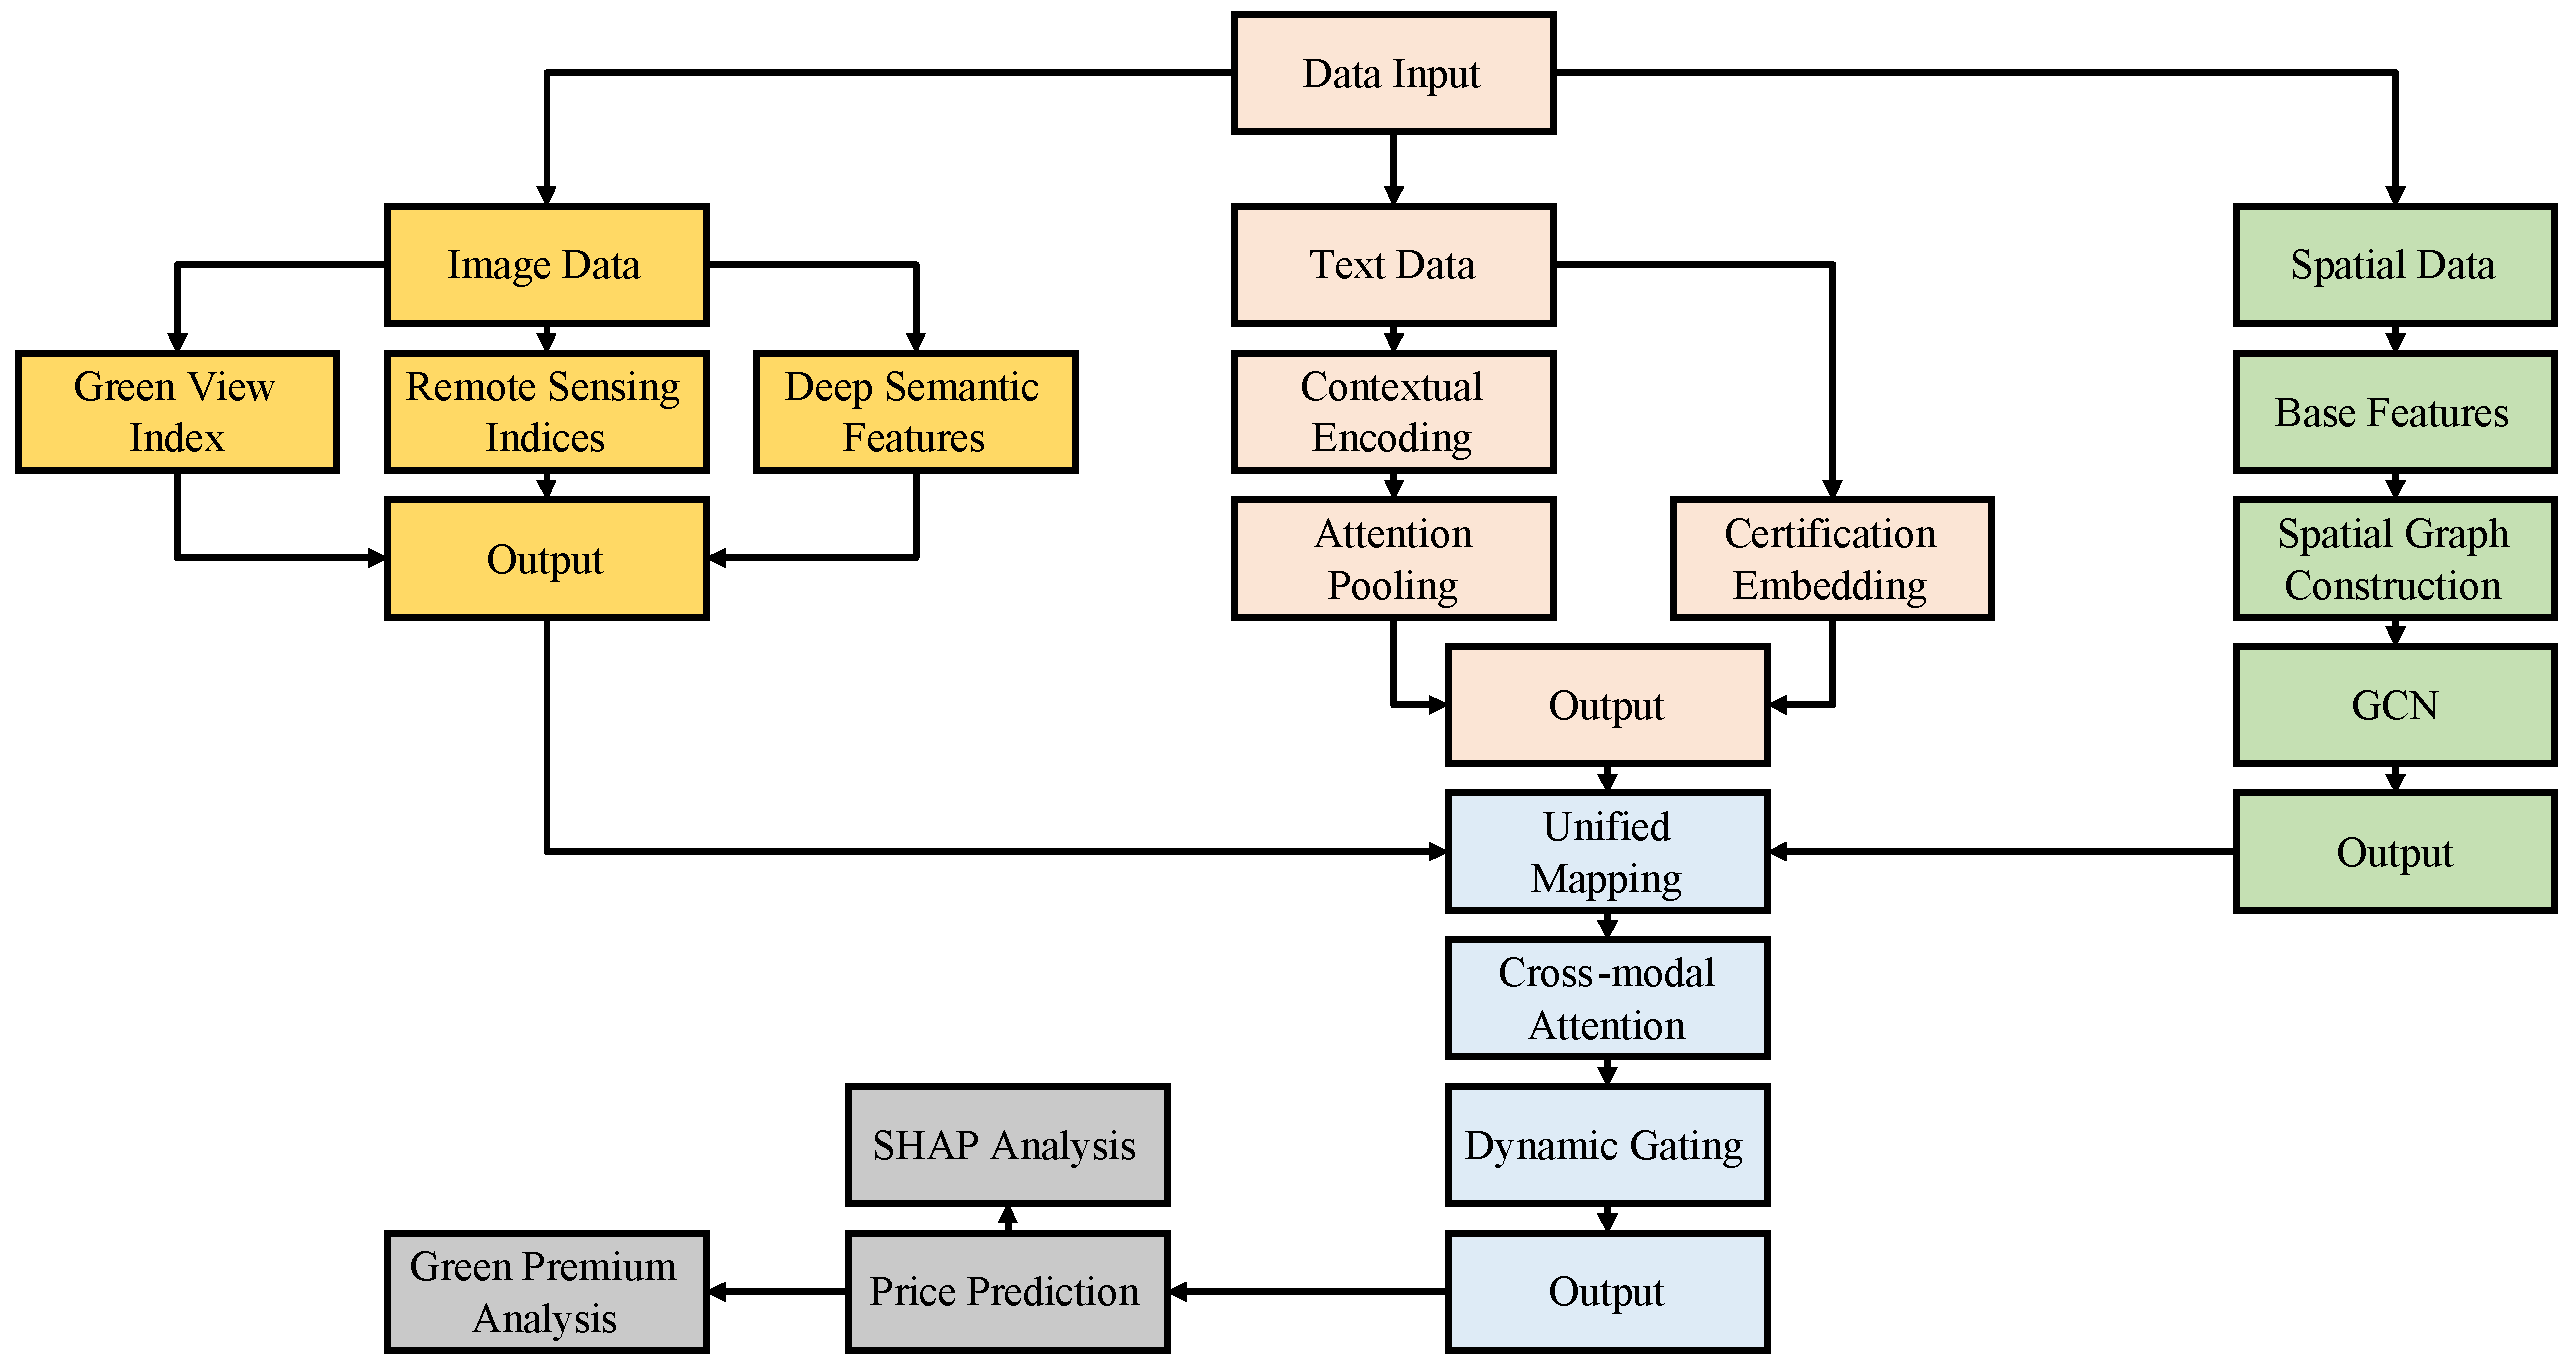
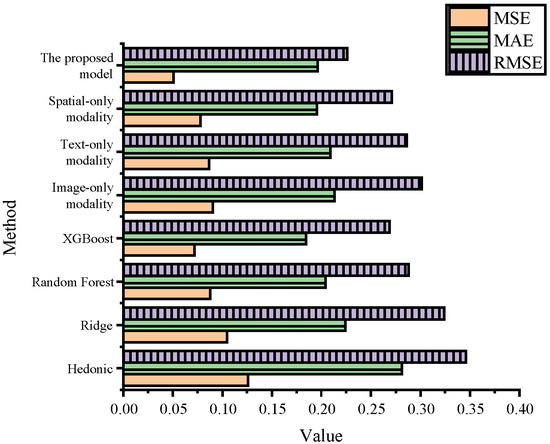
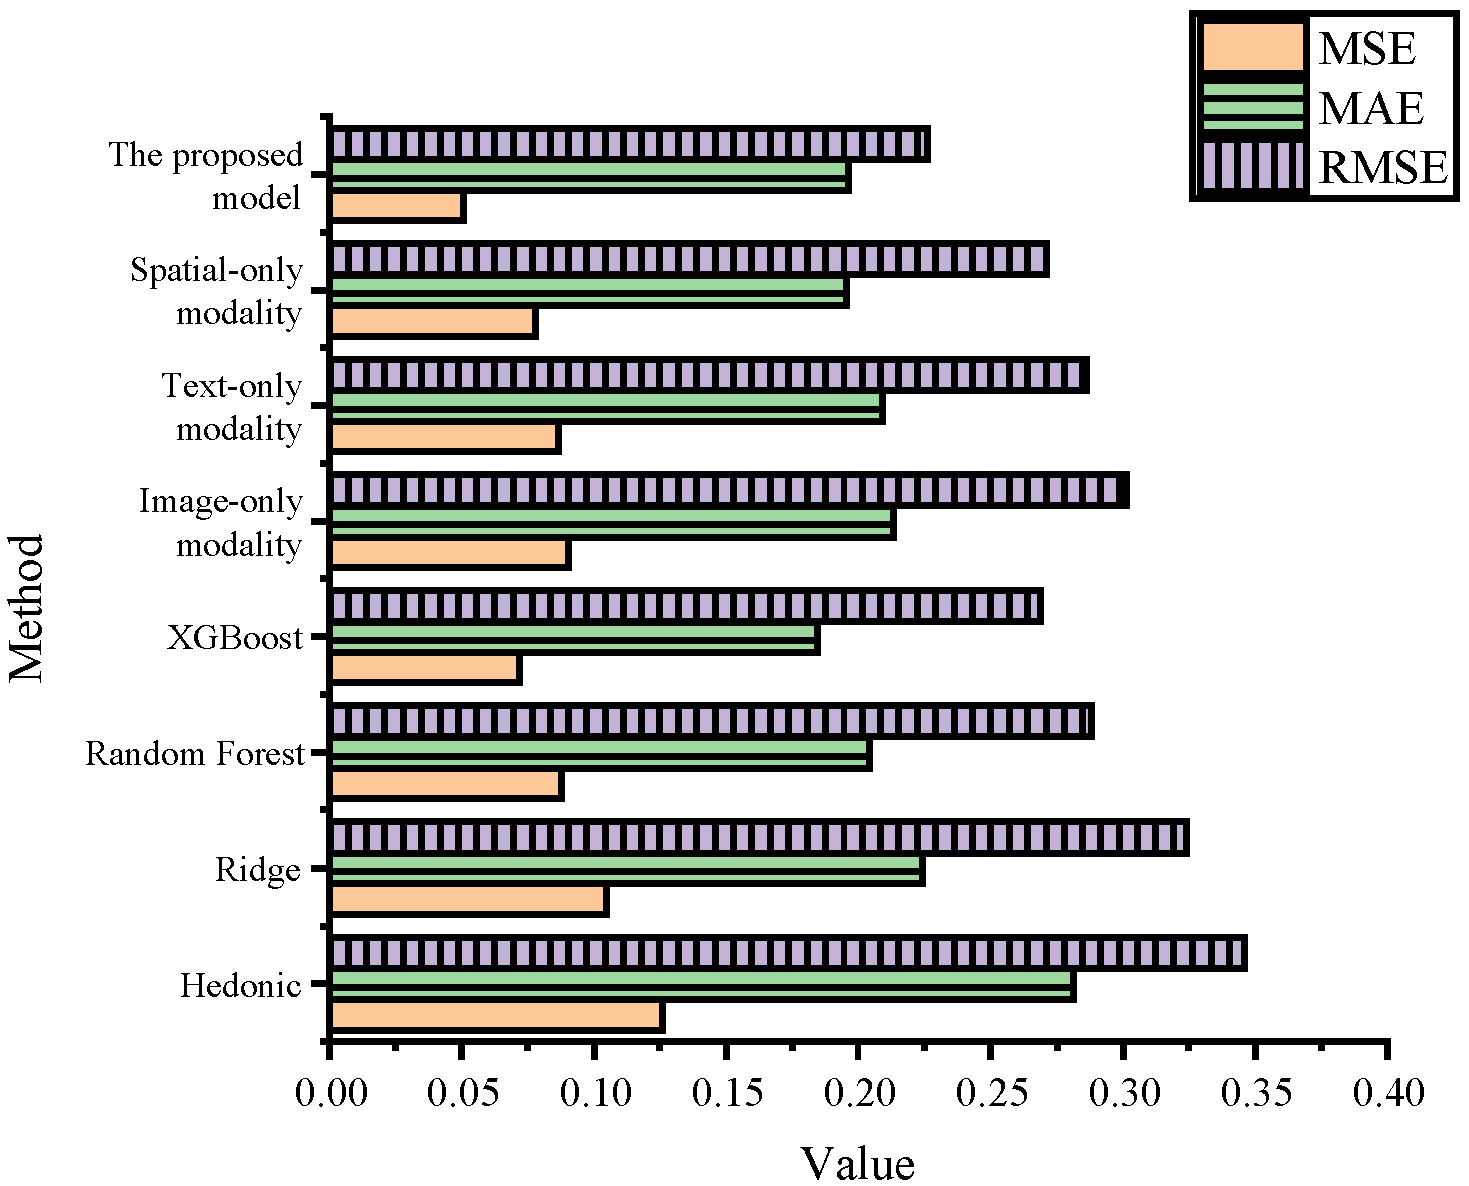
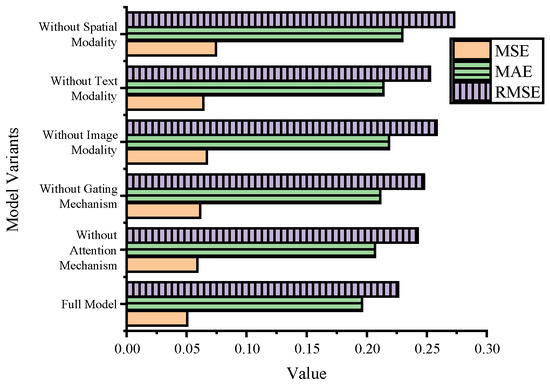
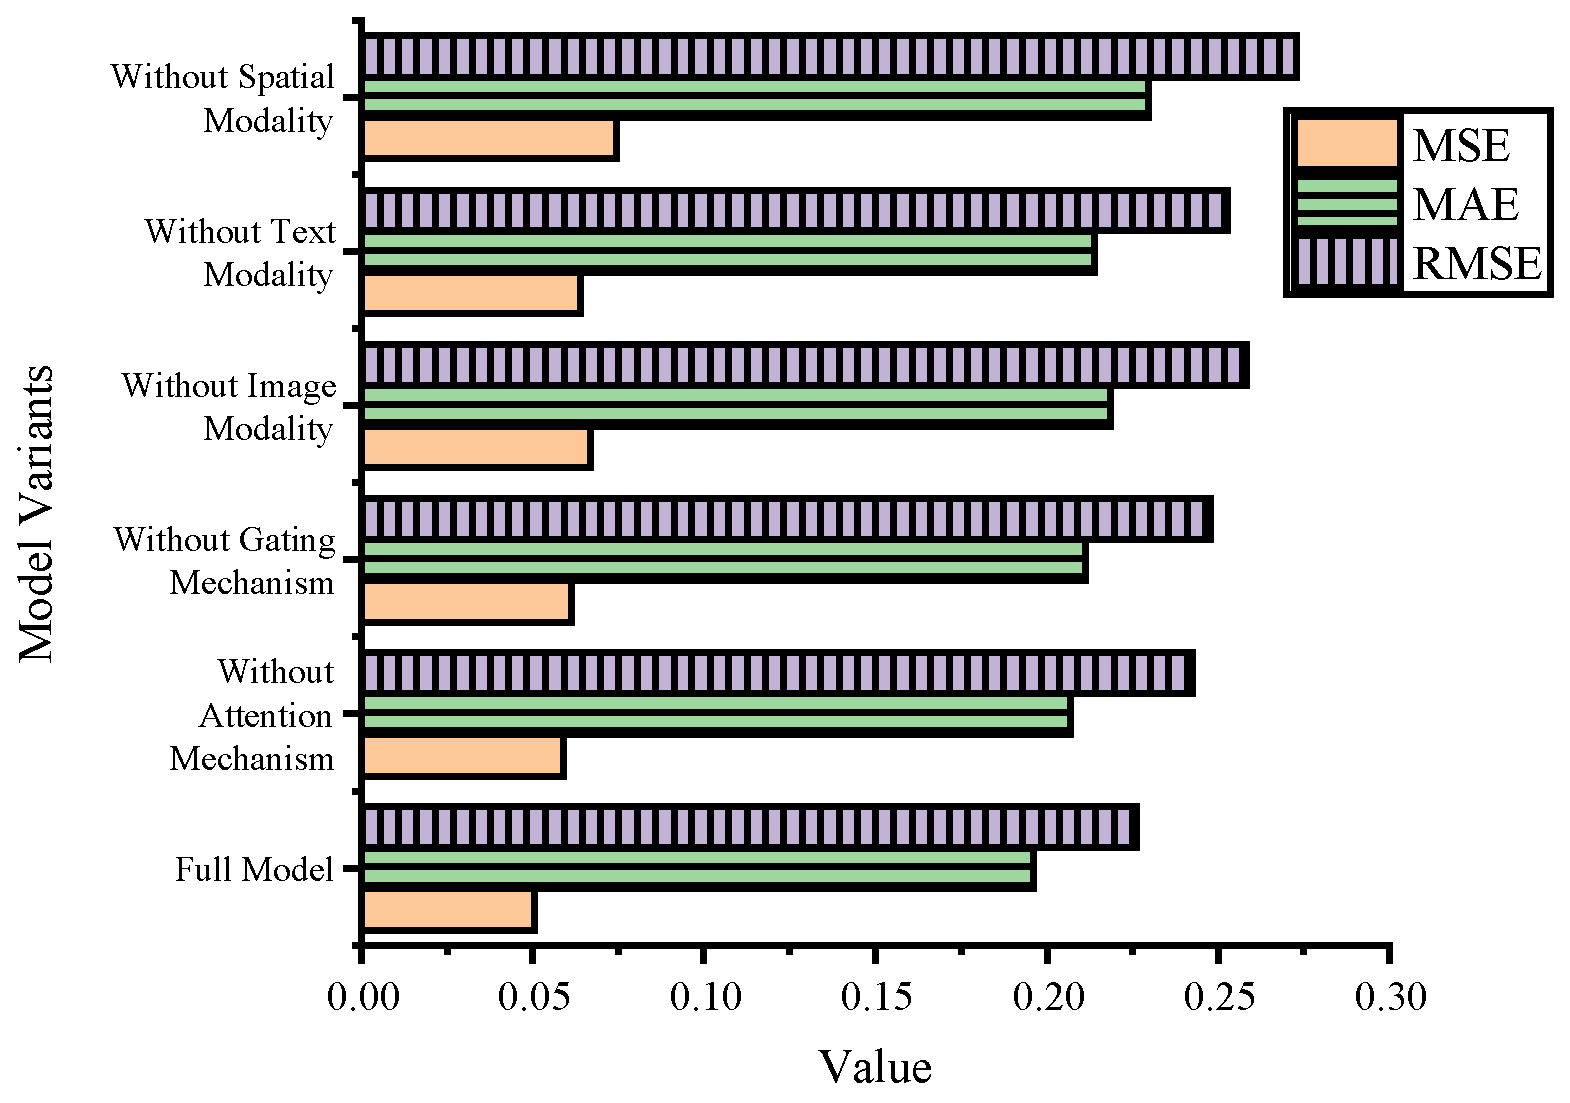
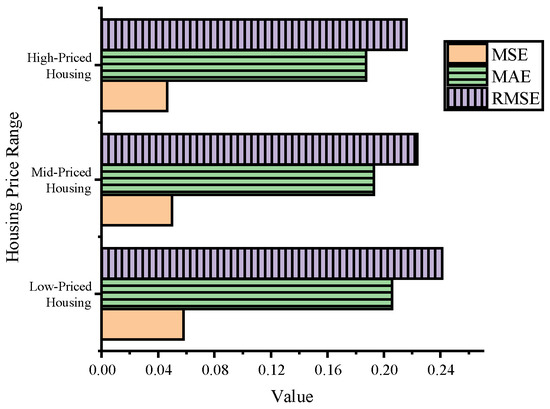
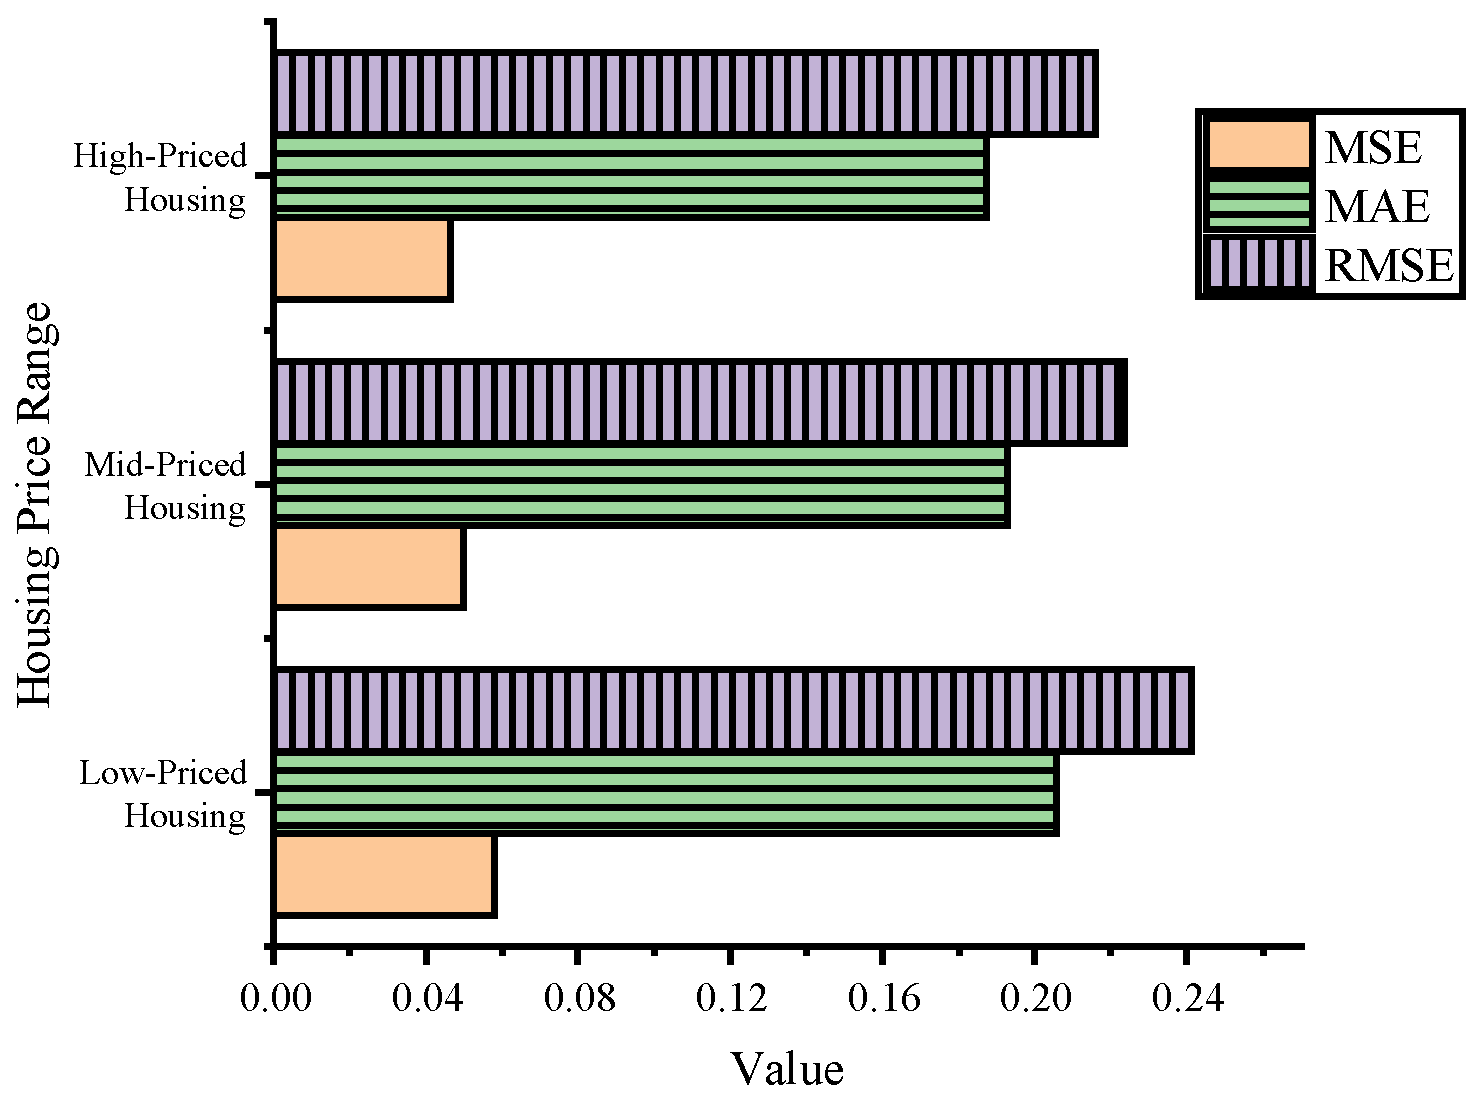
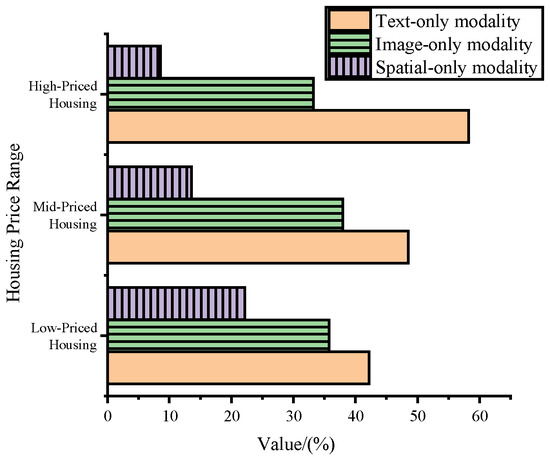
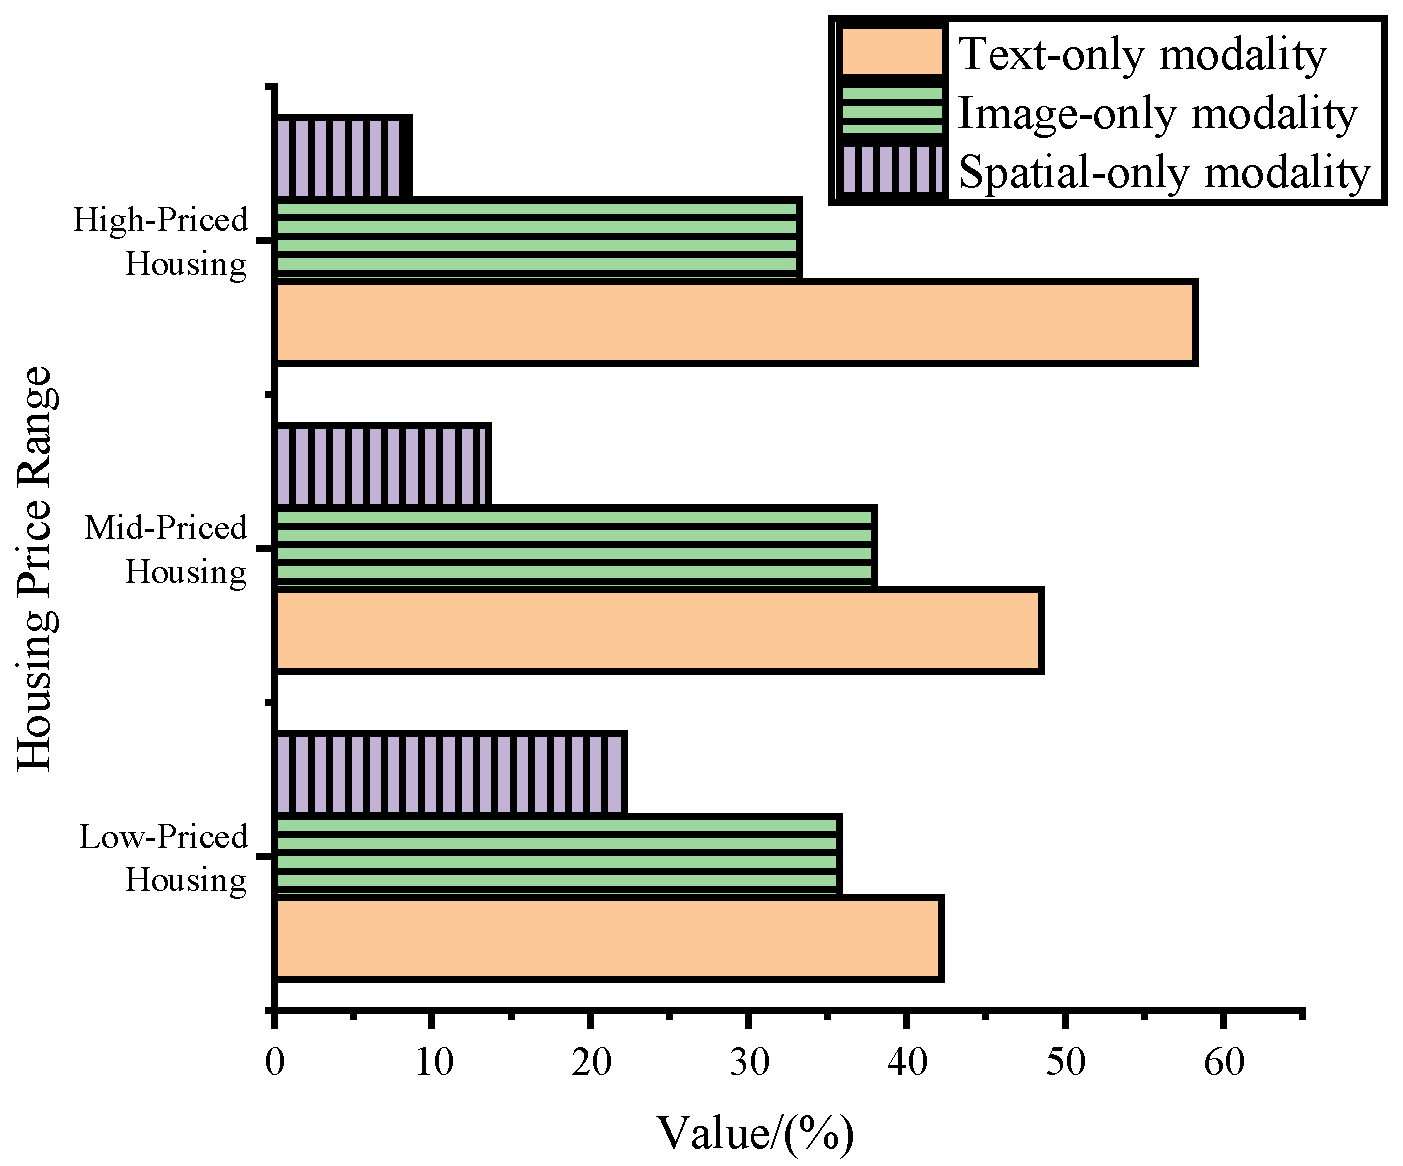

Disclaimer/Publisher’s Note: The statements, opinions and data contained in all publications are solely those of the individual author(s) and contributor(s) and not of MDPI and/or the editor(s). MDPI and/or the editor(s) disclaim responsibility for any injury to people or property resulting from any ideas, methods, instructions or products referred to in the content. |
© 2026 by the authors. Licensee MDPI, Basel, Switzerland. This article is an open access article distributed under the terms and conditions of the Creative Commons Attribution (CC BY) license.