


Abstract
The global water situation is deteriorating not only due to the progressing climate change but also to irrational consumer behaviors, which are driven by attitudes. Given the above, it seemed essential to identify attitudes toward the issue of access to freshwater in households, considering sustainable development guidelines. The aim of this study was, therefore, to develop a research tool for the identification of respondents’ attitudes toward this problem and then to determine its validity and reliability. The object of the study was an original questionnaire serving as a research tool for identifying the specified attitudes. The data required for this study were acquired through a critical review of the literature and a questionnaire survey method. The study was conducted in one of the Polish urban agglomerations using the Paper-and-Pencil Interviewing (PAPI) technique. An in-depth analysis of the validity and reliability of the tool, carried out using a statistical procedure, confirmed it to be a viable means to identify these attitudes in Poland. Therefore, there are reasonable grounds to assume that, following the application of the procedure presented in this manuscript, the developed tool may also be used to identify the specified attitudes when implemented in a different population.
1. Introduction
1.1. Problem of Access to Freshwater
Water plays a critical role in the functioning of ecosystems, human health, and the economy [1,2]. Preventing the growing household water consumption deficit is considered one of the key challenges of the 21st century [3], particularly in Poland, which is among the countries struggling with water stress. The latter indicates pressure on water resources and is defined as the ratio of water consumed to available water resources left. In recent years, Poland has ranked third among the European Union Member States in terms of the lowest freshwater resources per capita [4]. On a global scale, the aggravating water stress is due to climate change, population growth, and progressing urbanization, all of which lead to a growing demand for water [5,6]. In addition, the availability of renewable water resources is limited and depends on the hydrological cycle [7]. The scientific literature emphasizes that the problem of water deficit is not only limited to its physical shortages but also entails its unequal distribution and pollution, as well as inadequate management of water resources at both the systemic level (water policy, infrastructure) and the individual one, reflected in the attitudes and behaviors of end users [8,9].
Water wastage is another big puzzle in the water crisis. It is particularly evident in the public sector and in households [10], which are among the largest consumers of freshwater next to agriculture and industry [4]. Investigations conducted so far have demonstrated that a significant proportion of abstracted water is wasted due to inefficient appliances, faulty installations, and consumption habits, such as prolonged bathing, leaving taps running, and no investments in water-saving technologies [6]. According to authors of international reports, water wastage reduction represents one of the most cost-effective and efficient ways to mitigate the water crisis. It is also a prerequisite for achieving the Sustainable Development Goals, in particular Goal 6 of the 2030 Agenda, the major aim of which is to provide access to water and ensure adequate sanitary conditions for the population [11,12,13].
Water-related issues are complex and encompass both quantitative shortages, deteriorating quality, and social inequalities in access to safe drinking water. Ample studies have confirmed a strong relationship between water management and climate change [14], since extreme weather events, like droughts and floods, have been shown to trigger local water crises and to negatively affect food, health, and energy security [13]. In this context, increasing attention is being paid not only to technical investments (in water retention, infrastructure modernization, and treatment technologies) but also to public education and the development of attitudes that underlie water waste reduction at individual and local levels [15,16]. In view of the above, this article presents the results of a study evaluating the validity and reliability of a tool designed to identify consumer attitudes toward selected aspects of water use in households.
1.2. The Concept of Sustainable Development
Sustainable development is one of the key directions of contemporary socio-economic activities, aimed at balancing economic, social, and environmental needs [17]. Water resources are of particular importance from the perspective of natural environmental protection, as they influence ecosystem functioning, economic development, and human health [18]. The proper water management is an issue of concern to various international organizations, such as the United Nations, which, among its Sustainable Development Goals, emphasizes the need to ensure broad access to clean water [4].
Water resources are critical in maintaining environmental balance. Growing challenges due to climate change, urbanization, industrial development, and intensive agriculture contribute to increased consumption and deteriorated quality of water. Weather anomalies, including hydrological droughts, groundwater depletion, and degradation of aquatic ecosystems, urge the implementation of rational and long-term water management policies [19], whereas a sustainable strategy means not only the protection of these resources but also their efficient use while maintaining the environment’s capacity for regeneration [20].
The issue of water wastage in households raises both ecological and economic concerns. Excessive water use often stems from everyday human behaviors, including prolonged bathing, leaving taps running while brushing teeth, and the use of household appliances that consume large amounts of water [21,22]. Another cause is leakage in water supply systems, which can lead to significant water losses over time. Although such losses may appear negligible from the perspective of a single household, on a global scale, they contribute to increased exploitation of water resources, higher energy demand for water treatment and distribution, and the exacerbation of environmental problems [23].
In the context of sustainable development, water management brings multiple benefits to the environment, the population, and the economy. The rational use of water resources enables reducing pressure on ecosystems, lowering infrastructure-related costs, and enhancing water security for the population [24]. The attitudes of household members, reflected in their daily choices and habits, play a key role in achieving sustainable development goals, since the actual consumption of resources is shaped at the individual level. Therefore, effective water management requires cooperation between public institutions, the private sector, and citizens, as well as continued development of technologies and policies supporting economical water use [22,25].
1.3. Attitudes as an Indicator of Behaviors of Consumers Toward the Water Crisis
An attitude, in a general sense, should be understood as a hypothetical construct that cannot be directly identified through observation [26,27]. It is defined as a tendency to perceive a particular object in a certain specific way, which may be positive, ambivalent, or negative from an individual’s perspective [26,28]. Attitudes are driven by three types of factors: cognitive (resulting from knowledge about a given object), affective (resulting from emotions toward the object), and behavioral (stemming from a tendency to act in a certain way toward this object) [29,30]. The identification of an attitude is particularly important, as it forms grounds for its potential modification and is deemed a significant determinant of behaviors related to the object of the attitude [27].
One of the most widely used models for explaining pro-environmental behavior is the Theory of Planned Behavior (TPB), which is derived from the theory of reasoned action developed by Ajzen [31]. This model assumes that an individual’s behavior is directly determined by behavioral intentions, which in turn result from three basic factors: attitudes towards a given behavior, subjective norms, and perceived behavioral control [32].
In the context of the issue of access to fresh water, this refers to the way in which individuals assess the need to protect water resources, curb excessive water consumption, or support policies relating to its rational use. Subjective norms, on the other hand, relate to social pressure and beliefs regarding others’ expectations of certain behaviors. In the context of water management, these may manifest as a social expectation to conserve water or support for measures to reduce wastage. Behavioral control, in turn, manifests itself in an individual’s belief in their own ability to take specific actions and influence the environmental situation.
According to the TPB framework, the more positive one’s attitude towards environmental protection, the stronger the social norms and the greater the sense of agency, the more likely one is to engage in pro-environmental behavior. This model is widely used in environmental research as it allows for the analysis of the mechanisms shaping intentions and practices related to the responsible use of natural resources [33].
In the context of freshwater access, TPB theory helps to explain how individual attitudes, social influence, and a sense of control affect people’s willingness to take action to protect water resources and curb their overexploitation.
The second key approach used to analyze environmental behavior is the Value–Belief–Norm Theory (VBN), developed by Stern. This model focuses on the role of values, beliefs, and moral norms as key determinants of pro-environmental behavior [32].
VBN posits that individuals’ behavior towards the environment stems from a specific value system, which influences their beliefs regarding environmental threats and their sense of a moral duty to act. The model primarily distinguishes between altruistic, egoistic, and biospheric values. Altruistic values relate to concern for the welfare of others, biospheric values focus on the protection of nature and ecosystems, whilst egoistic values are linked to the protection of one’s own interests and quality of life [34,35].
With regard to the issue of access to fresh water, VBN enables us to analyze how ecological values and awareness of the consequences of the water crisis influence social attitudes towards the conservation of water resources. People guided by strong biospheric and altruistic values are more likely to recognize the need to reduce water consumption, support conservation measures, and make responsible consumption choices.
Combining TPB and VBN provides a more comprehensive explanation of environmental behavior relating to access to fresh water. TPB focuses primarily on the rational determinants of behavior and the influence of social factors and behavioral control, whilst VBN emphasizes the importance of values, moral norms, and environmental awareness. The integration of both approaches enables the analysis of both social and psychological-moral determinants of attitudes towards water resource management.
In research into the issue of access to fresh water, the application of both theories can help to identify the factors influencing the level of acceptance of conservation measures, the reduction in water consumption, and support for policies on the sustainable management of water resources.
A study conducted in Australia in 2025 by Prajapati et al. [36] investigated the relationship between pro-environmental attitudes and actual household water use, with particular emphasis on water wastage. The study involved the synthesis of data acquired from a questionnaire survey of attitudes and behaviors related to water management with real water consumption data. This approach enabled identifying consumption behaviors and analyzing their drivers based on the identification of attitudes. The findings demonstrated that households with stronger pro-environmental attitudes exhibited significantly lower water consumption, especially for garden watering, bathing, and making laundry. Interestingly, the declared environmental awareness did not always translate into actual behavior, whereas the effectiveness of water-saving practices was limited by practical barriers, including no access to water-saving technologies, financial constraints, and demographic factors. Furthermore, the study showed that the patterns of using water were significantly influenced by income, educational level, and place of residence. Despite high environmental awareness, members of higher-income households often consume more water due to larger living spaces and infrastructure that facilitates higher consumption. In contrast, lower-income households tend to save water more frequently, often for economic reasons. The above findings, as well as those reported in other studies [37], enable us to conclude that reducing water wastage in households requires not only fostering positive social attitudes toward the growing problem of water deficit but also increasing knowledge in this area, providing financial incentives, and improving access to water-saving technologies.
In turn, the results of a study conducted in Turkey by Aydin [38] indicate that consumer attitudes toward water deficit play a significant role in reducing water wastage and promoting conservation behaviors. Another study has shown that the way consumers perceive water deficits, particularly in terms of psychological distance, affects their willingness to change water consumption patterns [39]. Greater temporal and social distance from the issue of water shortage leads to underestimation of its severity, which may result in the continuation of behaviors promoting water wastage [9]. Thus, individuals’ attitudes to the problem are of critical importance. A higher proportion of consumers who believe in the effectiveness of their actions declare willingness to reduce water consumption and abandon behaviors that contribute to water wastage. This means that understanding the issue of water scarcity alone is insufficient and that the belief that choices of an individual consumer can have a real impact on mitigating the problem is equally important. Similarly, perceived responsibility has been identified as an important factor affecting consumer attitudes, i.e., the stronger the sense of responsibility for the consequences of excessive water consumption, the greater the eagerness to engage in water-saving behaviors [38].
This article is therefore devoted to the development of an original questionnaire tool designed to identify consumer attitudes towards the issue of domestic water use. This approach distinguishes the developed tool from others in which water is merely one element of the environment. Consequently, this study focuses on the issue of water use and the statistical verification of its suitability.
2. Materials and Methods
2.1. Aim of the Study
The aim of this study was to develop a research tool enabling the identification of respondents’ attitudes toward the issue of access to freshwater in households within the context of sustainable development, and then to determine its validity and reliability. The study assumed that validity determines whether the designed tool measures what it is intended to measure, and that reliability means the accuracy and repeatability of the results, hence indicating whether repeated measurements yield consistent results. The research procedure described in this manuscript enabled the verification of the research hypothesis, assuming the usefulness (i.e., validity and reliability) of the developed tool for assessing respondents’ attitudes toward access to freshwater in households.
2.2. Characteristics of the Research Object—Scale Content and Questionnaire Metrics
The research object was an original questionnaire, which is indeed a research tool for identifying specific attitudes. It consisted of a research construct (also referred to as a scale) and a demographic section (metrics) with nine socio-demographic questions. The main part of the questionnaire comprised a scale developed to identify consumer attitudes toward access to water. The statements forming the scale were developed based on a critical literature review combined with expert consultations and addressed aspects related to water resource management for sustainable development. The scale consisted of 20 statements, half of which were positive and the other half were negative. The statements reflected opinions driven by cognitive, emotional, or behavioral components of attitudes, and were arranged randomly to reduce the risk of response bias.
Respondents expressed their attitudes toward each statement using a five-point Likert scale. The choice of this measurement scale was justified by the limited capacity of the human mind to process multiple pieces of information simultaneously, as confirmed in previous investigations indicating that the optimal number of response categories falls within the range of 7 ± 2, making a five-point scale a more transparent and functional tool compared to three-, seven-, or nine-point scales [40,41].
The Likert scale used in the present study included verbal descriptors of responses to facilitate the precise expression of respondents’ opinions. The verbal replies were supplemented with numerical values, enabling statistical analysis of potential correlations within this set of data. The following response categories were applied in the study: 1—I strongly disagree, 2—I rather disagree, 3—I neither agree nor disagree, 4—I rather agree, and 5—I strongly agree [42].
2.3. Characteristics of the Research Method—Validity (Validation) and Reliability Assessment Procedure
The research object, in the form of an original questionnaire, was subjected to validity (validation) and reliability assessment. The purpose of validity (validation) assessment was to obtain a tool that accurately measures what it was designed for (the intended construct) [43], whereas reliability assessment aimed to determine the consistency of repeated measurements.
The validity assessment (validation) process included three main stages:
- Content validity—this stage involves verifying whether particular elements (statements) of the scale are adequate and whether they appropriately reflect the objective they were designed for [44]. The statements were specified based on a critical literature review and subsequently evaluated based on discussions with three experts who assessed their substantive relevance. This stage was conducted in January 2025.
- Response process validation (face validity)—this stage aims to assess the consistency between the intended theoretical construct and the way respondents interpret the related statements. It is usually conducted on a small group representing the target population [45]. At this stage of the present study, 20 participants were involved, including 10 women (50%). The minimum recommended number of respondents for response validation is 10, although approximately 30 participants is often considered a standard. Hence, the criterion adopted in this study was met at a moderate level [46]. This stage of the study was conducted in February 2025.
Consequently, following the content validation (point 1) and face validity (point 2), it was confirmed that the respondents understood the statements in accordance with the authors’ intentions. In turn, the information load of individual statements, as determined by the authors, was the result of a critical analysis of the literature and consultation with experts. This process was carried out in accordance with the scheme proposed by Klimas [47]. Further testing of the reliability of the statements on the proposed scale was carried out using PCA (point 3).
- 3.
- Statistical validation—this stage was conducted based on data collected from 350 respondents. The sample size was established following guidelines recommending at least five respondents per scale item [48]. After content and face validation, the scale included 20 statements, which implied a minimum required sample of 100 respondents. In practice, however, 350 individuals participated in the study, of whom 59.42% were women. Thus, the sample number criterion exceeded the minimum requirement. The proposed questionnaire was therefore subjected to a preliminary exploratory study.
Participants expressed their attitudes toward each statement using one of the five response options ranging from “I strongly disagree” to “I strongly agree”. Responses were coded with values from 1 to 5, with 3 indicating neutrality. Reverse coding was applied for the negatively worded statements, i.e., “I strongly agree” was assigned 1 point, and “I strongly disagree” was assigned 5 points. This coding approach allows treating the variable as measured on an interval scale, which in turn enables basic statistical analyses, like computation of mean values and standard deviation. However, it should be emphasized that this strategy represents a certain simplification, and the results obtained should be interpreted with caution [49,50]. The study was conducted between March and June 2025.
Statistical analyses were performed using Statistica 13.0 PL software (StatSoft, TIBCO Software, San Ramon, CA, USA), and differences were considered statistically significant at p ≤ 0.05. Calculations were conducted using Principal Component Analysis (PCA) [27,48,51], which included two stages: (A) calculation of descriptive statistics (mean values and standard deviations) for individual statements, and (B) principal component analysis with orthogonal Varimax rotation. Prior to PCA, the Kaiser–Meyer–Olkin (KMO) measure was calculated, and Bartlett’s test of sphericity was performed. A KMO value > 0.60 indicates that the data are suitable for factor analysis, whereas results of Bartlett’s test confirm the adequacy of the sample distribution [52]. As a result of this procedure, factors were obtained that fully describe all aspects of the phenomenon under investigation.
The scale reliability assessment was conducted using Cronbach’s alpha coefficient, and an analysis of the risk of common method bias (CMB) using the Harman rule. Reliability of a tool refers to the extent to which a scale provides consistent and repeatable results from multiple measurements, thereby ensuring the reliability of the obtained findings. The unidimensionality of the construct and its convergent and divergent validity were also examined [43,47]. This stage of reliability evaluation of the analyzed research tool was performed based on the data collected for statistical validation.
Each procedure was accomplished based on the results of surveys conducted in the Pomeranian Voivodeship with the PAPI method. Only the authors of the study were involved in collecting the data, which helped to minimize the limitations of this method, such as the influence of the interviewer.
The main study (statistical validation and reliability assessment) was conducted among respondents aged 18–80 years, who were selected at random using a stratified sampling approach to account for the spatial diversity of the voivodeship (cities of varying sizes as well as central and peripheral locations). It is noteworthy, however, that the resulting sample was not representative of the entire population of Poland. The survey was conducted anonymously, with full respect for ethical principles and respondents’ rights, in accordance with the Declaration of Helsinki [53]. The selection of the study sample, including residents of the Pomeranian Voivodeship aged 18–80, was a deliberate and justified decision in the context of research on consumer attitudes toward water use in households as an important indicator of their behaviors in this respect.
Firstly, the adopted age range enables capturing a bigger picture of attitudes toward water management within the studied population. Individuals aged 18 are legally adults and can independently participate in the study to express their own attitudes in the contexts of their actions (behaviors). This group includes both young adults (often still living with their parents or roommates) and individuals establishing their own households. Their attitudes toward the surveyed problem may reflect emerging social trends, including increasing environmental awareness, the use of modern technologies, or sensitivity to issues related to water and energy conservation.
The middle segment of the sample, encompassing individuals aged 30–60 years, represents the most economically active group of respondents, typically responsible for managing households. These respondents make decisions regarding everyday water use, from the choice of sanitary installations and household appliances to adopting water-saving practices or responding to utility costs. Their responses are particularly valuable as they enable identifying determinants of actual, ongoing water consumption practices.
In turn, the older respondents aged 60–80 years contribute a different perspective to the study. Their attitudes toward water use are often driven by past life experiences, related to, e.g., periods when access to resources was more limited and required more careful and economical management. The attitudes of this group may justify their long-established habits characterized by a conservative and rational perception of water as a valuable resource in everyday life. The inclusion of older respondents in the sample enables the identification of generational differences and their comparison with emerging trends observed among younger generations.
The choice of the research area, i.e., the Pomeranian Voivodeship, was driven by its significant social, economic, and spatial diversity. On the one hand, it encompasses highly urbanized areas, such as the Tricity (Gdańsk, Gdynia, Sopot), characterized by an urban lifestyle, modern water infrastructure, and access to innovative technologies. On the other hand, Pomerania also comprises smaller towns and rural areas, where water use may be influenced by different conditions, e.g., use of private water sources or various approaches to resource management.
Also worthy of attention are the specific water-related characteristics of the Pomeranian Voivodeship. Although this region is relatively rich in water resources due to its access to the Baltic Sea and a well-developed river network, it has recently been struggling with some issues related to local water availability, particularly during the summer season when water consumption increases significantly. These extreme conditions experienced by Pomeranian residents, i.e., water abundance on the one hand and awareness of its potential scarcity on the other, make their attitudes a particularly interesting subject of study. Therefore, the selection of a study sample including individuals aged 18–80 from the Pomeranian Voivodeship enables capturing a multigenerational picture reflecting consumer attitudes toward household water use, an important indicator of their behaviors. Such a broad demographic range allows for the identification of generational differences, shows variations in practices across age groups, and enables the determination of the influence of specific regional conditions on water use. As a result, the collected data may be considered more comprehensive and representative, and reflect the real social attitudes toward this severe challenge of the 21st century in Poland.
3. Results
A relatively high number of statements (20) and possible response variants (5) determined the use of a multivariate analysis, which enables ordering of data by grouping statements of a similar content and nature. The present study employed the principal components analysis (PCA), being one of the methods of factor analysis [54].
However, prior to PCA, it is necessary to verify whether its application is methodologically justified. This assessment can be made based on Bartlett’s test of sphericity and the Kaiser–Meyer–Olkin (KMO) measure.
The null hypothesis advanced in Bartlett’s test assumes that the matrix of a correlation between variables is an identity matrix, whereas the alternative hypothesis assumes that this matrix differs significantly from the identity matrix. Not rejecting the null hypothesis would suggest the lack of significant correlations between variables, which would, in turn, preclude the meaningful application of PCA, as this method is based on the analysis of correlations between variables. This hypothesis can be verified by means of the chi-square statistic [55].
In turn, the KMO measure assumes values from 0 to 1; however, the higher its value is, the more justified is the use of dimensionality reduction via factor analysis. A minimum threshold of 0.5 is typically considered acceptable. Table 1 presents the results of both analyses.
Table 1.
Results of Bartlett’s test of sphericity (test statistics and significance) and KMO criterion analysis.
The results of Bartlett’s test of sphericity and KMO value indicate that the data collected are adequate for conducting principal component analysis (PCA). The use of PCA enables reducing data dimensionality, which consequently allows for simplifying their structure and facilitates the interpretation of correlations between dependent variables in the analyzed dataset. Hence, PCA was conducted at this stage of the study, with the aim of identifying the number of dimensions that would allow for the reliable description of the observed attitudes. Principal component analysis consists of transforming the original set of variables into a new system of coordinates, in which each successive axis (principal component) is orthogonal to the preceding ones and maximizes the percentage of the explained variance.
In turn, dimensionality reduction in PCA consists of eliminating those components that contribute only a small amount of information about the studied population, without substantially compromising the knowledge about the structure of the dataset. From the perspective of quantitative sciences, information is equated with dispersion or variability. Therefore, components with the smallest variance are selected for elimination. The number of dimensions remaining for the analysis may be chosen based on Cattell’s criterion, Kaiser’s criterion, or the cumulative variance criterion, which allows preserving most of the information contained in the data while simplifying the structure of the variables [48,56,57].
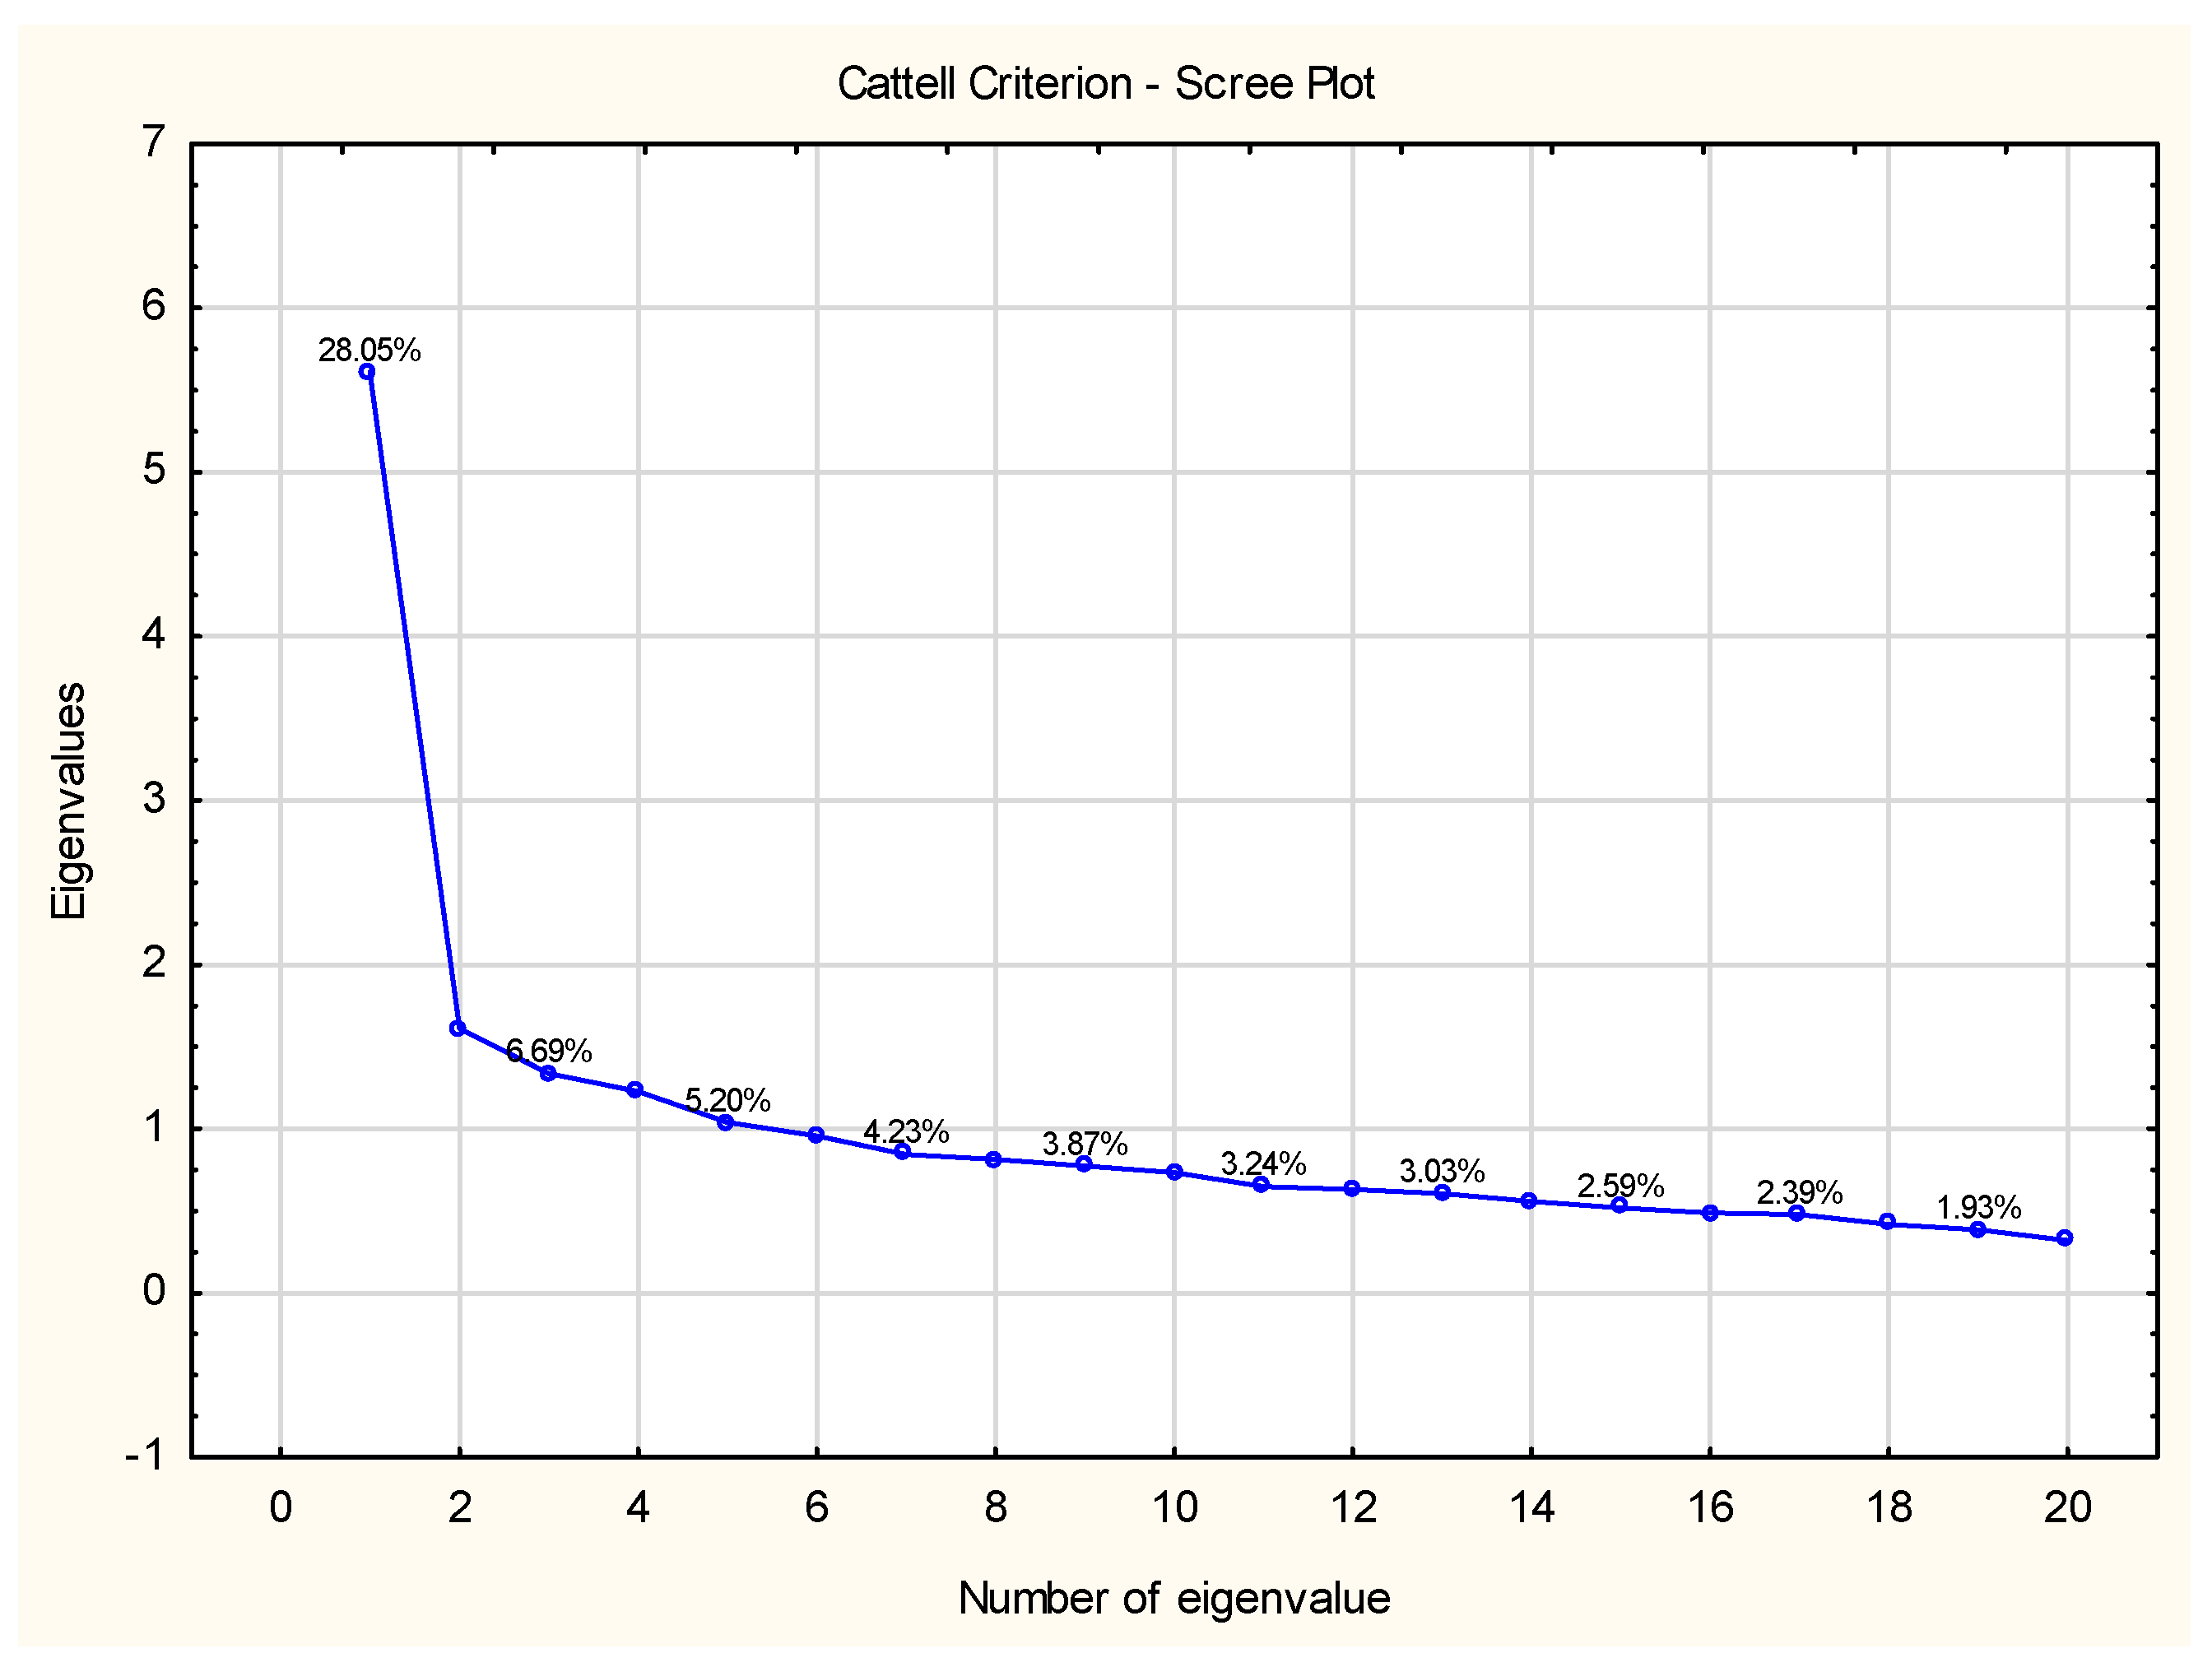
The use of Cattell’s criterion [58] involves preparing the so-called scree plot, which presents the standardized eigenvalues of successive principal components. The number of dimensions retained for further analysis corresponds to the break-point of the curve, beyond which it turns relatively flat, indicating components with low variance [59]. In turn, Kaiser’s criterion is based on the individual eigenvalues of the principal components, where the components with eigenvalues lower than 1, corresponding to a variance smaller than that of a single variable, may be excluded from further analysis [56,60,61]. In the case of the cumulative variance criterion, the number of components is selected so that their total contribution to the explained variance exceeds a specified threshold, usually set at 75–80%, which enables retaining most of the information contained in the data. All these three criteria were applied in the present analysis, and their results were combined to determine the optimal number of dimensions for further interpretation.
An important stage during PCA is the selection and rotation of principal components. The present study harnessed the Varimax rotation, which maximizes the variance of factor loadings for each component while minimizing their values for the remaining components. This approach allows for a clearer distinction of the variables within individual components, thereby facilitating the interpretation of results and the selection of the number of dimensions retained in the analysis [48,57,62].
The analyzed scale included 20 variables representing the examined statements. Prior to the analysis, they were transformed to ensure a consistent direction of their influence on all variables. The application of principal component analysis (PCA) with Varimax rotation enabled the separation of new principal components, forming an alternative system of coordinates to this scale. The eigenvalues of the obtained dimensions, the cumulative percentage of the explained variance, and the scree plot are presented in Table 2.
Table 2.
Eigenvalues and cumulative percentage of explained variance in PCA performed for the investigated scale.
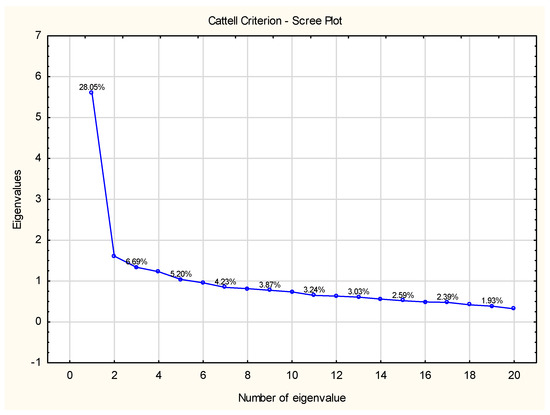
Based on the presented results (Table 2 and Figure 1), the number of retained dimensions could reach: 1 (according to Cattell’s criterion), 5 (according to Kaiser’s criterion), or 11–12 (based on the cumulative variance criterion). In the present analysis, a five-dimensional solution was adopted, explaining merely 55% of the variance of the original variables. It should be noted, however, that the interpretation of an excessive number of dimensions is far more difficult and may not lead to satisfactory results. For this reason, after identifying weak correlations of factors four and five with the variables, the number of dimensions was reduced to three. The factor loadings obtained for these dimensions (after excluding non-significant factors) are presented in Table 3.
Figure 1.
Scree plot in PCA performed for the analyzed scale.
Table 3.
Factor loadings for the selected three factors of the analyzed scale.
Table 3 presents the variables with the highest factor loadings, and those that were most strongly correlated with the respective dimensions are highlighted in red. Factor 1, constituting the key dimension in the analysis, showed the strongest negative correlations with variables 2, 4, 5, 6, and 8, as well as with the group of variables from 11 to 20 (Table 3). The interpretation of this factor allows us to conclude that it was associated with the respondents’ level of knowledge about the consequences of not conserving water and with their awareness of rational water-use practices. The high negative values of correlations may indicate skeptical attitudes or insufficient awareness of issues related to water resource management. This factor can be called knowledge and awareness about saving water.
Factor 2 was most strongly associated with variables 3, 7, and 9. Based on their content, it can be concluded that this dimension reflects the willingness to undertake practical pro-environmental actions, including investing in water-saving technologies or reusing the so-called greywater. This factor may, thus, be interpreted as an expression of a proactive attitude toward environmental problems, manifested in the willingness to implement specific solutions in everyday life. This factor can be defined as pro-ecological attitudes.
Factor 3 showed the strongest positive correlation with variable 1 and a distinctly negative correlation with variable 10. These observations suggest that it is related to practical, “here-and-now” knowledge about realistic water-saving possibilities, like the awareness of differences in water consumption between taking a bath and using a shower. In turn, the negative correlation with the variable related to the belief that water can be supplied to any place on Earth indicates that this factor expresses a more realistic approach to the issue, rather than an overreliance on unlimited technological capabilities. This factor can be called the ability to save water in practice.
One of the key features of construct validation is its unidimensionality, meaning that all statements collectively represent the entire continuum of a given phenomenon. This feature is examined by checking for redundant variables and potentially breaking down the entire construct into subconstructs or factors. This task was accomplished using EFA, and in this case, PCA. The correlation between the factors and their variables is high in all cases and exceeds 0.45 in all cases. This ensures that the condition of unidimensionality for construct validation is met.
To recapitulate, the conducted factor analysis enabled distinguishing three main dimensions describing respondents’ attitudes toward water resource management at the household level. The first dimension refers to the level of knowledge and awareness of the consequences of not conserving water, as well as to the familiarity with rational water-use practices. The second dimension can be interpreted as the readiness to undertake active pro-environmental actions, including both the implementation of novel technical solutions and changes in daily practices that contribute to reducing water consumption. In turn, the third factor is associated with practical awareness of the real and immediate possibilities for reducing water use, taking into account everyday consumption choices and a realistic perception of effective water conservation measures. Such an approach to the analyzed factors enables a multifaceted interpretation of the analyzed attitudes, beginning from theoretical knowledge and general beliefs, through intentions to implement certain actions, to practical choices related to water use in everyday life.
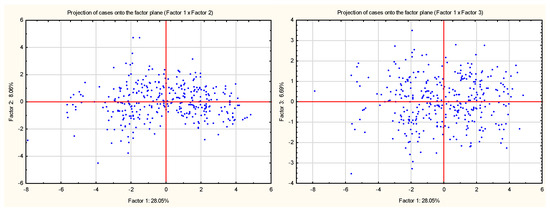
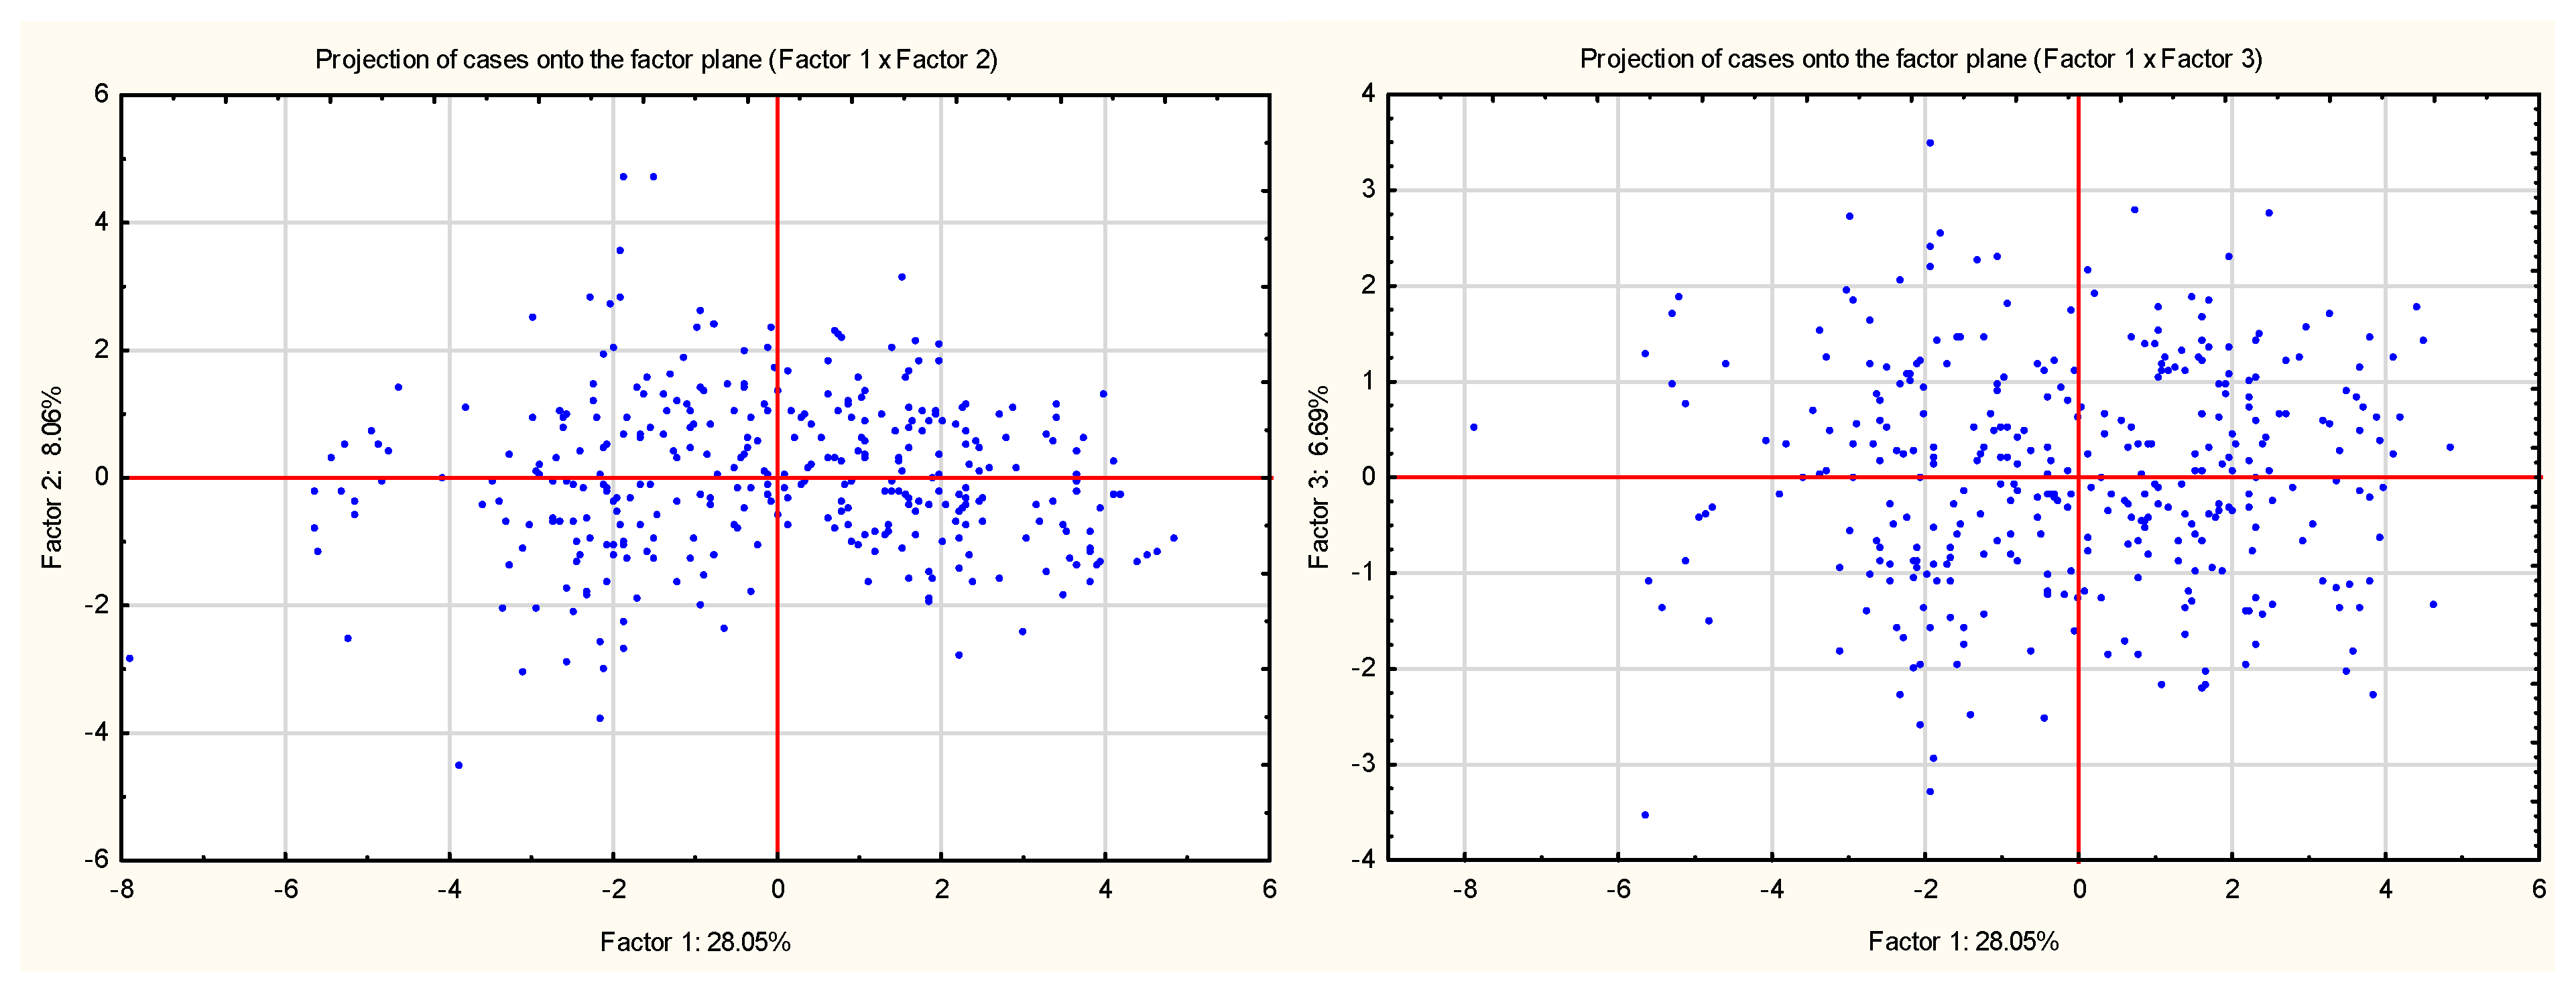
The application of a newly constructed coordinate system, based on the components distinguished in the analysis, enabled assessing respondents’ attitudes toward particular dimensions and aided their segmentation. The projection of the factors onto a two-dimensional space is presented in Figure 2.
Figure 2.
Projection of cases onto the plane—factors 1 and 2, and factors 1 and 3 of the analyzed scale.
The projection of cases onto two-dimensional factor planes (factors 1 and 2, and factors 1 and 3; Figure 2) indicates a relatively high degree of homogeneity within the surveyed group of respondents. It reveals no clear statistical outliers, which suggests a certain consistency in respondents’ attitudes toward the analyzed issues.
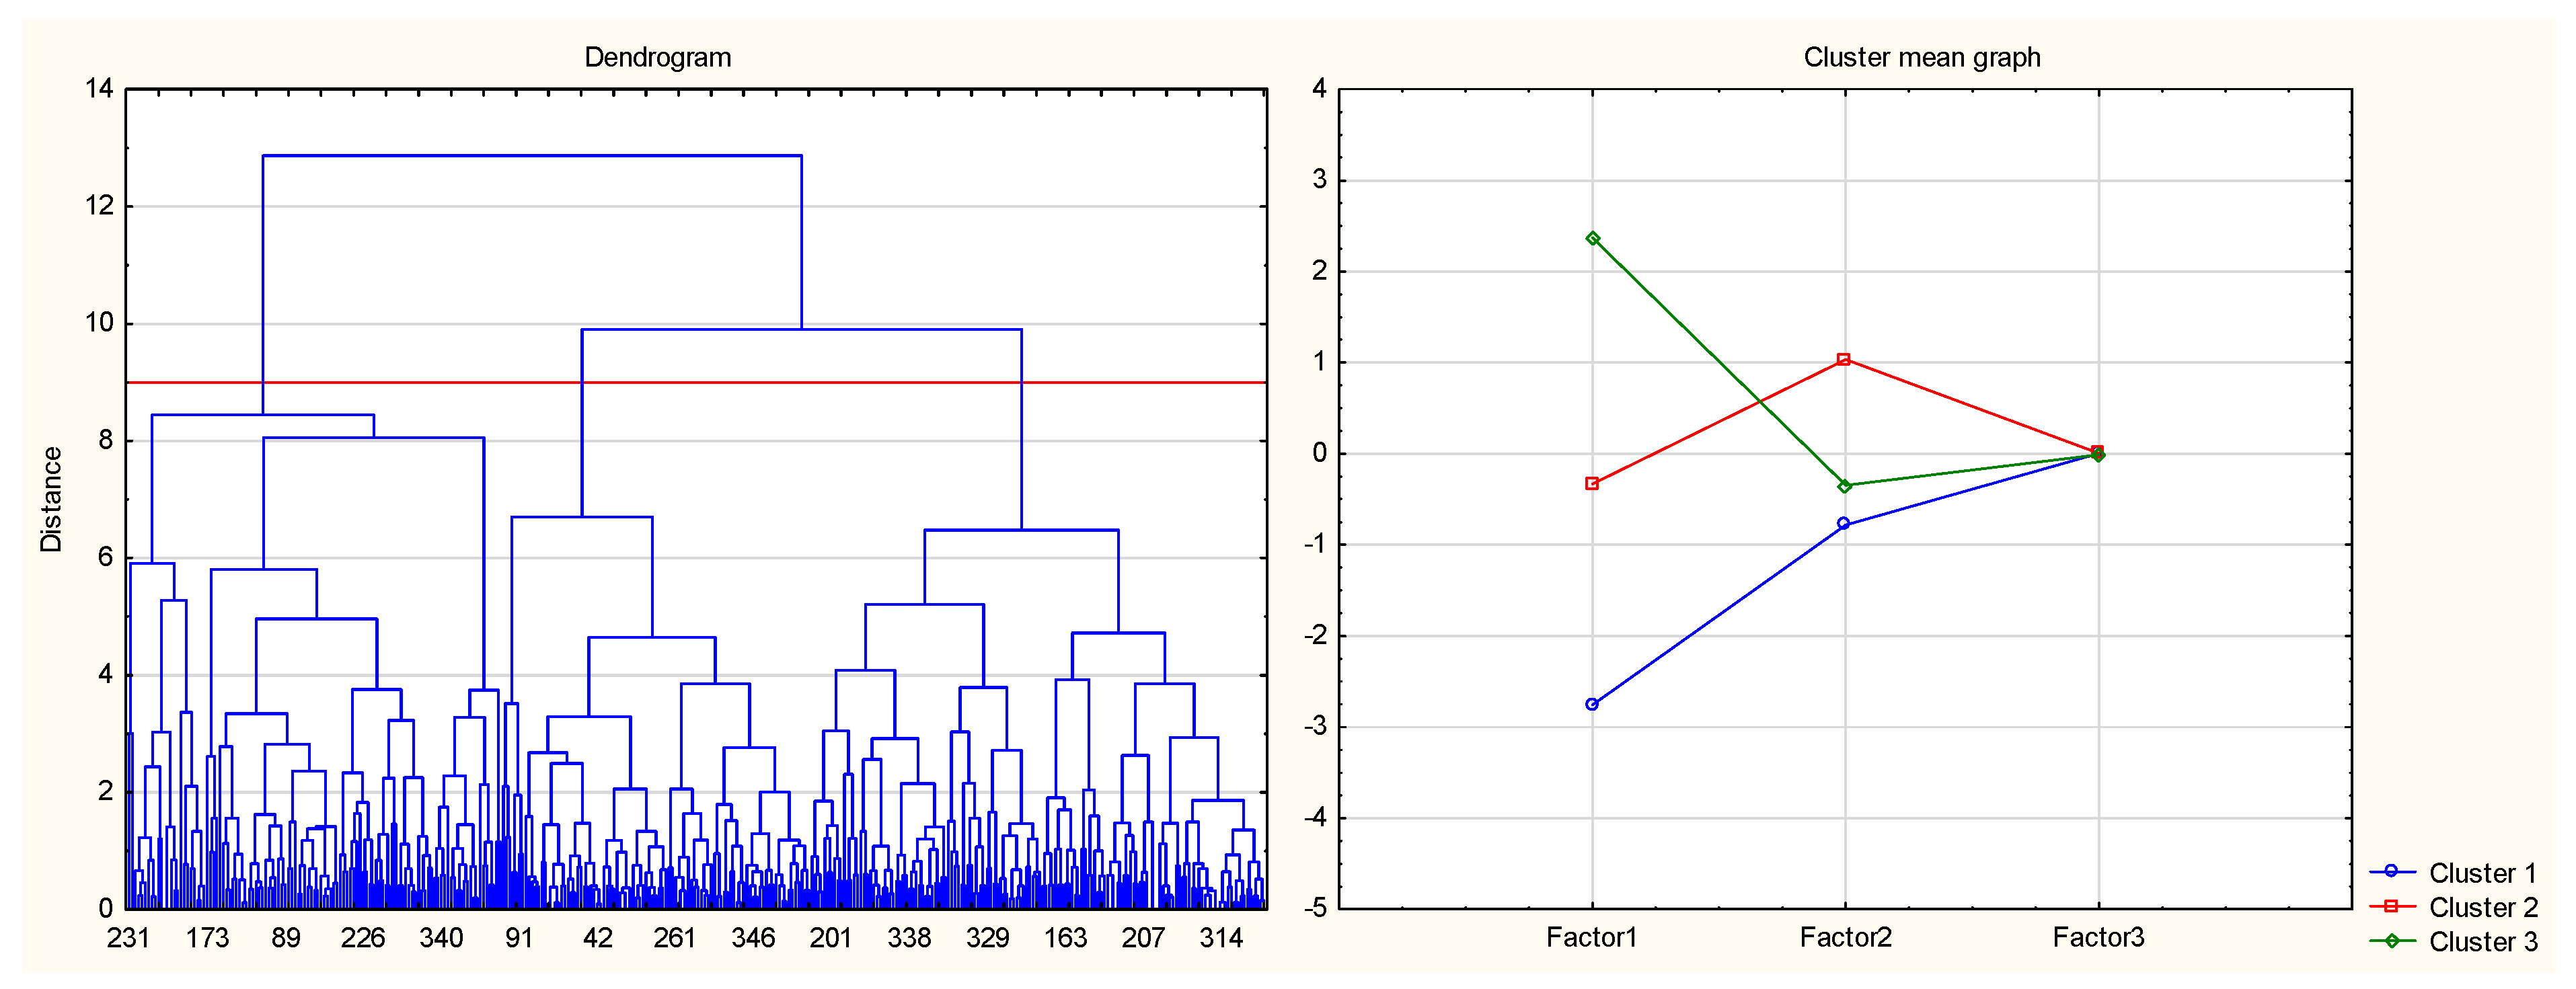
Consequently, a hierarchical agglomerative clustering method based on the complete linkage and Euclidean distance was applied to achieve a more precise classification of the respondents.
A dendrogram depicting the results of the agglomerative clustering (Figure 3) showed a three-cluster division, adopted at a linkage distance threshold of 9, to be the most interpretable solution.
Figure 3.
Dendrogram of the classification of cases (linkage distance threshold of 9) and a graph of means in three clusters of cases.
The resulting classification was subsequently validated using the k-means method, which enabled determining mean factor scores for individual groups. The results of this analysis indicated that the third factor did not play any significant role in differentiating the respondents. Hence, the segmentation was mainly based on the first and second factors, which allowed for the identification of three distinct profiles (clusters) of respondents’ attitudes.
The first cluster encompassed respondents having limited knowledge of the consequences and importance of water conservation, as well as a lower-than-average willingness to engage in pro-environmental actions (average for factor 1 equal to −2.759 and for factor 2: −0.782). They can be described as people uninterested in the issue of saving water.
The second cluster included respondents with a moderate level of knowledge, but distinguished by relatively high motivation and willingness to actively implement water-saving solutions (average for factor 1 equal to −0.333 and for factor 2: 1.036). This group can be called uneducated ecologists or amateur ecologists.
The third cluster included respondents with extensive knowledge of water conservation methods and their impact on the natural environment, but expressing average willingness to translate this knowledge into actions (average for factor 1 equal to 2.370 and for factor 2: 0.347). This group consists of users conscious of the planet’s natural resources.
The achieved segmentation indicates that the differences observed in the studied population’s attitudes toward water resource management are primarily driven by the relationship between knowledge and the willingness to undertake practical actions. These findings emphasize that knowledge alone does not always translate into active engagement and that, in some cases, even a moderate level of awareness can trigger a high motivation to act.
The final stage of the assessment procedure of a tool for the identification of consumer attitudes toward access to freshwater in households, in the context of sustainable development, involved the calculation of Cronbach’s alpha coefficient in order to assess the reliability of the proposed tool. Cronbach’s alpha value obtained showed no need to eliminate any of the statements included in the analyzed scale. Hence, the developed research tool, which was assessed for its validity and reliability, can be considered balanced with respect to both its content and the nature of the statements used. The results of the reliability analysis, conducted using Cronbach’s alpha and its standardized version, after necessary adjustments to the survey data, for the entire construct and the factors obtained in PCA, are presented in Table 4.
Table 4.
Results of the reliability analysis of the proposed questionnaire.
The reliability analysis for all statements demonstrated that the obtained value of Cronbach’s alpha coefficient (0.85) significantly exceeded the level commonly regarded as acceptable (0.70). Hence, it indicated a high level of consistency of the analyzed scale. Reliability analysis was also conducted for the factors obtained from PCA. As a result, an excellent Cronbach’s alpha of 0.859 was obtained for factor 1. The remaining two factors were problematic due to the small number of variables. Factor 2 consists of three statements and has an alpha of 0.570, while factor 3 has an alpha of 0.614. Therefore, the reliability of factors 1, 2, and 3 is satisfactory.
The risk of common method bias (CMB) was also examined, indicating that the variability in the results is a result of the adopted measurement method rather than the outcome of measuring a given construct. According to Harman’s rule, the factor with the highest eigenvalue identified through PCA should explain less than 50% or 40% of the total variance. In our case, this factor explained 28% of the variance. Based on this and the Cronbach’s alpha values, it can be concluded that the proposed construct meets the requirement for measurement scale reliability.
Convergent and divergent validity, as proposed by D.T. Campbell and D.W. Fiske [63], is ensured by examining the correlations of variables within factors and the correlations of variables between factors. In the convergent validity study, significant Spearman correlation coefficients were obtained for all variables within each factor. In the case of divergent validity, correlations between variables outside the factors are low. Therefore, it can be concluded that both forms of validity, convergent and divergent, are ensured.
The study findings confirm that the developed research tool, i.e., the proposed measurement scale, is characterized by appropriate validity and good internal consistency (reliability), which underscores its initial applicability in research. It should also be noted that cross-cultural validation must be carried out each time before the tool is used in a different population.
The tool developed to investigate consumer attitudes towards water use in households may be useful for identifying barriers to the development of the concept of sustainable development. The issue of changing attitudes—and, consequently, behavior—towards water is, after all, a key element of this concept. Identifying these barriers may contribute to improving the quality of political discourse in this area, which could result in practical and welcome changes in both the management of water and the acceptance of new regulations. The tool developed may be useful in assessing the current situation and potential changes related to water management, particularly in areas with visible water shortages.
4. Summary and Conclusions
The findings from this research survey indicate that attitudes are subject to variability. This means that the survey results might differ even if it was conducted in the same group of respondents, in the same locations, and using the same tool, but at a different point in time. Therefore, the quality of the research tool is of critical importance and should be evaluated for both its validity and reliability.
The results obtained enable the conclusion that the measurement scale, developed through a critical review of the literature and subsequently evaluated for validity and reliability, can be applied to correctly identify respondents’ attitudes toward the growing problem of access to freshwater in households within the context of sustainable development. Thus, the advanced research hypothesis has been positively verified, the research objective has been achieved, and a useful research tool has been developed.
The problem of access to freshwater in households, in the context of sustainable development, is pinpointed as particularly significant in certain regions of the world, including Poland. It is noteworthy that the identification of attitudes toward this issue may be of considerable importance for water resource management. Furthermore, when considered from the perspective of Poland’s development, it is inscribed into the stream of global research supporting the concept of sustainable development.
The development of such a research tool and the assessment of its validity and reliability may contribute to advancements not only in the social sciences related to management and quality sciences, but also in the sciences about the Earth and the environment.
5. Study Limitations
The issue of respondents’ attitudes toward access to freshwater in households is not only topical and important but also complex. Hence, the present study, like many others, has its limitations. The major limitation is the relatively small sample size and its geographical restriction. Another limitation is related to age, gender, and other socio-demographic characteristics of the participants. Consequently, the results obtained fail to fully reflect the diversity of the whole study area and should be interpreted with caution, particularly in the context of more in-depth analyses.
Author Contributions
Conceptualization, K.K. and A.O.; methodology, K.K. and A.O.; software, T.O.; validation, K.K., A.O. and T.O.; formal analysis, T.O.; investigation, K.K.; resources, T.O.; data curation, K.K.; writing—original draft preparation, K.K.; writing—review and editing, A.O.; visualization, T.O.; supervision, A.O.; project administration, A.O.; funding acquisition, A.O. All authors have read and agreed to the published version of the manuscript.
Funding
This research was funded by Gdynia Maritime University, grant number WZNJ/2026/PZ/05.
Institutional Review Board Statement
Ethical review and approval were waived for this study because it was designed as a non-interventional study. As part of the study, a tool was developed to identify attitudes toward access to fresh water. This study was conducted using an original questionnaire that contained information relevant to potential participants. The statements included in the questionnaire did not interfere with the respondent’s physical and/or mental sphere. The results obtained in this study, as well as the conclusions drawn from them, did not refer to the respondents (humans). Due to the above, the consent of the Research Ethics Committee of Gdynia Maritime University was not required.
Informed Consent Statement
Informed consent was obtained from all subjects involved in the study. Written informed consent has been obtained from the respondents to publish this paper.
Data Availability Statement
The data were compiled in .xlsx format and are available from the authors of this publication.
Acknowledgments
The authors would like to thank all respondents who voluntarily, free of charge, and using their free time, provided answers to the questions formulated in the questionnaire.
Conflicts of Interest
The authors declare no conflicts of interest.
Abbreviations
The following abbreviations are used in this manuscript:
| PAPI | Paper-and-Pencil Interviewing |
| PCA | Principal Component Analysis |
| KMO | Kaiser–Meyer–Olkin |
References
- Borek, P. Water deficit as a threat of international security. Rozpr. Społeczne 2025, 19, 108–120. [Google Scholar] [CrossRef] [Scilit]
- Kelly, D.A. The European water label: An analysis and review. In Proceedings of the CIB W062 39th International Symposium on Water Supply and Drainage for Buildings, Nagano, Japan, 17–20 September 2013; pp. 17–20. [Google Scholar]
- Thier, A. Analiza sposobów pomiaru oraz skutków deficytu zasobów wodnych na świecie. Śląski Przegląd Stat. 2016, 20, 111–130. [Google Scholar]
- Poland on the Path to Sustainable Development. SDG Report 2025. Available online: https://raportsdg.stat.gov.pl/cel6.html (accessed on 12 February 2026).
- Kłopotek, K.; Ocieczek, A. Public Perception of Innovative Technical Solutions for the Development of the ‘Sponge City’ Concept in Poland: A Case Study of the Tri-City Area. Sustainability 2025, 17, 2380. [Google Scholar] [CrossRef] [Scilit]
- Wolters, E.A. Attitude–behavior consistency in household water consumption. Soc. Sci. J. 2014, 51, 455–463. [Google Scholar] [CrossRef] [Scilit]
- Yang, D.; Yang, Y.; Xia, J. Hydrological cycle and water resources in a changing world: A review. Geogr. Sustain. 2021, 2, 115–122. [Google Scholar] [CrossRef] [Scilit]
- Rahmati, O.; Melesse, A.M.; Naghibi, A. Water scarcity crisis: Overview of challenges and solutions. In Water Scarcity Management; Elsevier: Amsterdam, The Netherlands, 2026; pp. 1–12. [Google Scholar] [CrossRef] [Scilit]
- Loy, L.S.; Spence, A. Reducing, and bridging, the psychological distance of climate change. J. Environ. Psychol. 2020, 67, 101388. [Google Scholar] [CrossRef] [Scilit]
- Jakubczak, A. Water conservation behaviour as a sustainable action of young consumers from selected European countries. Eur. Res. Stud. J. 2020, XXIII, 763–780. [Google Scholar] [CrossRef] [Scilit]
- Shahangian, S.A.; Tabesh, M.; Yazdanpanah, M. How can socio-psychological factors be related to water-efficiency intention and behaviors among Iranian residential water consumers? J. Environ. Manag. 2021, 288, 112466. [Google Scholar] [CrossRef] [Scilit] [PubMed]
- Shahangian, S.A.; Tabesh, M.; Yazdanpanah, M. Psychosocial determinants of household adoption of wa-ter-efficiency behaviors in Tehran capital, Iran: Application of the social cognitive theory. Urban Clim. 2021, 39, 100935. [Google Scholar] [CrossRef] [Scilit]
- Li, Y.; Wang, B.; Cui, M. Environmental concern, environmental knowledge, and residents’ water conservation behavior: Evidence from China. Water 2022, 14, 2087. [Google Scholar] [CrossRef] [Scilit]
- Kang, J.; Grable, K.; Hustvedt, G.; Ahn, M. Sustainable water consumption: The perspective of Hispanic consumers. J. Environ. Psychol. 2017, 50, 94–103. [Google Scholar] [CrossRef] [Scilit]
- Cichocka, I.; Krupa, J.; Mantaj, A. Zachowania proekologiczne mieszkańców Polski w świetle badania sondażowego. Handel. Wewnętrzny 2018, 6, 121–139. [Google Scholar]
- Singha, B.; Eljamal, O.; Karmaker, S.C.; Maamoun, I.; Sugihara, Y. Water conservation behavior: Exploring the role of social, psychological, and behavioral determinants. J. Environ. Manag. 2022, 317, 115484. [Google Scholar] [CrossRef] [Scilit] [PubMed]
- Liu, K.D.; Yang, G.L.; Yang, D.G. Investigating industrial water-use efficiency in mainland China: An improved SBM-DEA model. J. Environ. Manag. 2020, 270, 110859. [Google Scholar] [CrossRef] [Scilit] [PubMed]
- Li, P.; Wu, J. Water resources and sustainable development. Water 2023, 16, 134. [Google Scholar] [CrossRef] [Scilit]
- Wang, D.; Li, P.; He, X.; He, S. Exploring the response of shallow groundwater to precipitation in the northern piedmont of the Qinling Mountains, China. Urban Clim. 2023, 47, 101379. [Google Scholar] [CrossRef] [Scilit]
- Cosgrove, W.J.; Loucks, D.P. Water management: Current and future challenges and research directions. Water Resour. Res. 2015, 51, 4823–4839. [Google Scholar] [CrossRef] [Scilit]
- Granda, L.; Moya-Fernández, P.J.; Soriano-Miras, R.M.; González-Gómez, F. Pro-environmental behaviour in household water use. A gender perspective. Sustain. Water Resour. Manag. 2024, 10, 49. [Google Scholar] [CrossRef] [Scilit]
- Singha, B.; Eljamal, O. A Review on Water Conservation and Consumption Behavior: Leading Issues, Promoting Actions, and Managing the Policies. In Proceedings of the International Exchange and Innovation Conference on Engineering & Sciences (IEICES), Fukuoka, Japan, 22–23 October 2020. [Google Scholar] [CrossRef] [Scilit]
- Xu, Q.; Liu, R.; Chen, Q.; Li, R. Review on water leakage control in distribution networks and the associated environmental benefits. J. Environ. Sci. 2014, 26, 955–961. [Google Scholar] [CrossRef] [Scilit] [PubMed]
- Dean, A.J.; Kneebone, S.; Tull, F.; Lauren, N.; Smith, L.D. Stickiness’ of water-saving behaviours: What factors influence whether behaviours are maintained or given up? Resour. Conserv. Recycl. 2021, 169, 105531. [Google Scholar] [CrossRef] [Scilit]
- Eshun, F.; Bour, K.B.; Kyei-Arthur, F.; Adu, K.; Larbi, L.; Asiedu, E.; Amoah, A. The irony of use-water-wisely: Qualitative research evidence from the proponents of water use behaviour. Water Policy 2025, 27, 596–614. [Google Scholar] [CrossRef] [Scilit]
- Ajzen, I. Attitudes and personality traits. In Attitudes, Personality and Behavior, 2nd ed.; Manstead, T., Ed.; Open University Press: Berkshire, UK, 2005; pp. 1–23. [Google Scholar]
- Żyłka, K.; Ocieczek, A. Attitudes of Polish adolescents towards energy drinks. Part 1. Development, validation and reliability testing of a scale to identify attitudes towards energy drinks. Ann. Agric. Environ. Med. 2022, 29, 407–416. [Google Scholar] [CrossRef] [Scilit]
- Bohner, G.; Dickel, N. Attitudes and Attitude Change. Annu. Rev. Psychol. 2011, 62, 391–417. [Google Scholar] [CrossRef] [Scilit] [PubMed]
- Jain, V. 3D Model of Attitude. Int. J. Adv. Res. Manag. Soc. Sci. 2014, 3, 1–12. [Google Scholar]
- Maio, G.R.; Haddock, G. Attitudes: Content, Structure and Functions. In The Psychology of Attitudes and Attitude Change, 2nd ed.; Sage Publications Ltd.: Thousand Oaks, CA, USA, 2015; pp. 112–133. [Google Scholar]
- Ajzen, I.; Fishbein, M. Understanding Attitudes and Predicting Social Behavior; Prentice-Hall: New York, NY, USA, 1980. [Google Scholar]
- Batool, N.; Wani, M.D.; Shah, S.A.; Dada, Z.A. Theory of planned behavior and value-belief norm theory as antecedents of pro-environmental behaviour: Evidence from the local community. J. Hum. Behav. Soc. Environ. 2024, 34, 693–709. [Google Scholar] [CrossRef] [Scilit]
- Liebe, U.; Preisendörfer, P.; Meyerhoff, J. To pay or not to pay: Competing theories to explain individuals’ willingness to pay for public environmental goods. Environ. Behav. 2011, 43, 106–130. [Google Scholar] [CrossRef] [Scilit]
- Kiatkawsin, K.; Han, H. Young travelers’ intention to behave pro-environmentally: Merging the value-belief-norm theory and the expectancy theory. Tour. Manag. 2017, 59, 76–88. [Google Scholar] [CrossRef] [Scilit]
- Stern, P.C. New environmental theories: Toward a coherent theory of environmentally significant behavior. J. Soc. Issues 2000, 56, 407–424. [Google Scholar] [CrossRef] [Scilit]
- Prajapati, M.B.; Patel, R.B.; Dogra, A.K.; Singh, V.; Kumar, P.; Verma, S. Impact of water conservation on household end-use water consumption. In Advancing Social Equity Through Accessible Green Innovation; IGI Global Scientific Publishing: New York, NY, USA, 2025; pp. 265–282. [Google Scholar]
- Dolnicar, S.; Hurlimann, A. Australians’ water conservation behaviours and attitudes. Australas. J. Water Resour. 2010, 14, 43–53. [Google Scholar] [CrossRef] [Scilit]
- Aydin, A.E. Consumers’ attitudes towards water scarcity and eco-friendly products in Turkey: A psychological distance perspective. Int. J. Bus. Emerg. Mark. 2025, 17, 261–282. [Google Scholar] [CrossRef] [Scilit]
- Maiella, R.; La Malva, P.; Marchetti, D.; Pomarico, E.; Di Crosta, A.; Palumbo, R.; Cetara, L.; Di Domenico, A.; Verrocchio, M.C. The psychological distance and climate change: A systematic review on the mitigation and adaptation behaviors. Front. Psychol. 2020, 11, 568899. [Google Scholar] [CrossRef] [Scilit] [PubMed]
- Miller, G.A. The magical number seven, plus or minus two: Some limits on our capacity for processing information. Psychol. Rev. 1956, 63, 81–97. [Google Scholar] [CrossRef] [Scilit]
- Mesinger, D.; Ocieczek, A.; Owczarek, T. Attitudes of young tri-city residents toward game meat. Development and validation of a scale for identifying attitudes toward wild meat. Int. J. Environ. Res. Public Health 2023, 20, 1247. [Google Scholar] [CrossRef] [Scilit] [PubMed]
- Likert, R. A technique for the measurement of attitudes. Arch. Psychol. 1932, 22, 55. [Google Scholar]
- Haynes, S.N.; Richard, D.; Kubany, E.S. Content validity in psychological assessment: A functional approach to concepts and methods. Psychol. Assess. 1995, 7, 238. [Google Scholar] [CrossRef] [Scilit]
- Cook, D.A.; Beckman, T.J. Current concepts in validity and reliability for psychometric instruments: Theory and application. Am. J. Med. 2006, 119, 166.e7–166.e16. [Google Scholar] [CrossRef] [Scilit] [PubMed]
- Taber, K.S. The use of Cronbach’s alpha when developing and reporting research instruments in science education. Res. Sci. Educ. 2018, 48, 1273–1296. [Google Scholar]
- Yusoff, M.S.B. ABC of response process validation and face validity index calculation. Educ. Med. J. 2019, 11, 55–61. [Google Scholar] [CrossRef] [Scilit]
- Klimas, P. Skale pomiaru: Konstrukcja i walidacja skal nowych versus weryfikacja i adaptacja skal replikowanych. Metod. Badań Ilościowych W Zarządzaniu 2021, 6, 123–160. [Google Scholar]
- Hair, J.F., Jr.; Lds Gabriel, M.; da Silva, D.; Braga Junior, S. Development and validation of attitudes measurement scales: Fundamental and practical aspects. RAUSP Manag. J. 2019, 54, 490–507. [Google Scholar] [CrossRef] [Scilit]
- Wieczorkowska-Wierzbińska, G.; Wierzbiński, J. Statistic. Analysis of Social Research; Wydawnictwo Naukowe Scholar: Warszawa, Poland, 2007. [Google Scholar]
- Wierzbiński, J.; Kuźmińska, A.; Król, G. Consequences of using different types of rating scales. Probl. Zarządzania—Manag. Issues 2014, 12, 113–136. [Google Scholar] [CrossRef] [Scilit]
- De Oliveira Santos, R.; Mendes Gorgulho, B.; de Castro, M.A. Principal Component Analysis and Factor Analysis: Differences and similarities in Nutritional Epidemiology application. Rev. Bras. Epidemiol. 2019, 22, E190041. [Google Scholar] [CrossRef] [Scilit] [PubMed]
- Koparan, T. Development of an attitude scale towards statistics: A study on reliability and validity. Karaelmas J. Educ. Sci. 2015, 3, 76–86. [Google Scholar]
- WMA World Medical Association. Declaration of Helsinki—Ethical Principles for Medical Research Involving Human Subjects; World Medical Association: Fortaleza, Brazil, 2013. [Google Scholar]
- Górniak, J. Analiza czynnikowa i analiza głównych składowych. In My i Nasze Pieniądze. Wyniki Badań Empirycznych Nad Postawami Wobec Pieniądza; Górniak, J., Ed.; Aureus: Kraków, Poland, 2000. [Google Scholar]
- Kidwell, B.; Hardesty, D.M.; Childers, T.L. Consumer emotional intelligence: Conceptualization, measurement, and the prediction of consumer decision making. J. Consum. Res. 2008, 35, 154–166. [Google Scholar] [CrossRef] [Scilit]
- Henson, R.K.; Roberts, J.K. Use of exploratory factor analysis in published research: Common errors and some comment on improved practice. Educ. Psychol. Meas. 2006, 66, 393–416. [Google Scholar] [CrossRef] [Scilit]
- Fabrigar, L.R.; Wegener, D.T.; MacCallum, R.C.; Strahan, E.J. Evaluating the use of exploratory factor analysis in psychological research. Psychol. Methods 1999, 4, 272. [Google Scholar] [CrossRef]
- Cattell, R.B. The scree test for the number of factors. Multivar. Behav. Res. 1966, 1, 245–276. [Google Scholar] [CrossRef] [Scilit] [PubMed]
- D’agostino, R.B., Sr.; Russell, H.K. Scree test. In Encyclopedia of Biostatistics, 2nd ed.; Armitage, P., Colton, T., Eds.; Wiley Online library: New York, NY, USA, 2005; p. 7. [Google Scholar] [CrossRef] [Scilit]
- Sztemberg-Lewandowska, M. Analiza Czynnikowa w Badaniach Marketingowych. Doctoral Thesis, Uniwersytet Ekonomiczny we Wrocławiu, Wrocław, Poland, 2008. [Google Scholar]
- Braeken, J.; Van Assen, M.A. An empirical Kaiser criterion. Psychol. Methods 2017, 22, 450. [Google Scholar] [CrossRef] [Scilit] [PubMed]
- Lastovicka, J.L.; Murry, J.P., Jr.; Joachimsthaler, E.A.; Bhalla, G.; Scheurich, J. A lifestyle typology to model young male drinking and driving. J. Consum. Res. 1987, 14, 257–263. [Google Scholar] [CrossRef] [Scilit] [PubMed]
- Campbell, D.T.; Fiske, D.W. Convergent and Discriminant Validation by the Multitrait-Multimethod Matrix. Psychol. Bull. 1959, 56, 81–105. [Google Scholar] [CrossRef] [Scilit]

Disclaimer/Publisher’s Note: The statements, opinions and data contained in all publications are solely those of the individual author(s) and contributor(s) and not of MDPI and/or the editor(s). MDPI and/or the editor(s) disclaim responsibility for any injury to people or property resulting from any ideas, methods, instructions or products referred to in the content. |
© 2026 by the authors. Licensee MDPI, Basel, Switzerland. This article is an open access article distributed under the terms and conditions of the Creative Commons Attribution (CC BY) license.