


Abstract
Against the backdrop of intensifying global climate change, climate policy uncertainty (CPU) and investor sentiment have become critical factors influencing the stability of financial markets. In this study, a quantitative index of investor sentiment is constructed using stock trading volume, turnover rate, price-to-earnings ratio, circulating market value, and the consumer confidence index. The QVAR-DY model is employed to analyze the risk contagion mechanisms among CPU, investor sentiment, and China’s financial sub-markets across different quantiles. Furthermore, five machine learning models—LSTM, BiLSTM, CNN, XGBoost, and LightGBM—are used to forecast risk spillover indices, and their performance is compared with three benchmark models (ARIMA, Persistence, and HistMean) to systematically evaluate the advantages of machine learning models in capturing tail risk spillover effects. The findings reveal significant cross-market risk contagion in financial markets, characterized by asymmetry. The level of risk spillover under extreme conditions is substantially higher than under normal conditions, indicating high sensitivity to extreme events and major policies. CPU exhibits the most pronounced spillover effect on the money market, while investor sentiment has the greatest impact on the stock market. The stock, real estate, and commodity markets act simultaneously as sources of risk and receivers of shocks. In terms of forecasting performance, LightGBM performs best under normal conditions, whereas LSTM achieves the highest prediction accuracy under extreme conditions.
1. Introduction
Against the backdrop of intensifying global warming, the increasing frequency of extreme climate events poses severe challenges to human society and economic development. Addressing climate change has become an international consensus, and nations have successively incorporated climate governance into the core of their national strategies, promulgating a series of binding and incentive-based policies to mitigate the adverse effects of climate change and propel economic and social systems toward sustainable development. From the perspective of achieving the sustainable development of the Chinese nation and building a community with a shared future for mankind, China has explicitly articulated the strategic objectives of “carbon peaking and carbon neutrality” and has progressively established a “1 + N” policy framework centered on the Action Plan for Carbon Dioxide Peaking Before 2030. It actively employs financial instruments such as green credit and green bonds to comprehensively accelerate the green and low-carbon transition of the economy and society. As the nexus of modern economic operations, the financial market exhibits a deeply intertwined relationship with climate policy adjustments. On the one hand, climate policies directly impact corporate operating costs and revenue structures, influencing market valuations through the channel of earnings expectations. On the other hand, the dynamic adjustment process of climate policies is characterized by iterative target setting, mechanism optimization, and regional heterogeneity, which collectively constitute the core sources of Climate Policy Uncertainty (CPU). This uncertainty exacerbates market information asymmetry, rendering it difficult for investors to accurately assess the differentiated impacts of policies across various industries and firms. Consequently, investment decisions tend toward conservatism or herd behavior, which not only impedes the efficient allocation of capital toward green sectors but also potentially triggers short-term market volatility and erodes the foundation of financial stability.
As a concentrated reflection of the collective psychological tendencies, cognitive biases, and future expectations of market participants, investor sentiment is characterized by its inherent volatility, pronounced contagion effects, and susceptibility to external information shocks. It has emerged as a critical nexus linking CPU and systemic financial risk. As a form of exogenous policy shock, CPU directly influences investors’ risk perception levels and decision-making logic by altering the information environment and the foundational basis for expectation formation. When CPU escalates, the ambiguity and complexity of market information intensify, rendering it difficult for investors to formulate stable and rational market expectations. This, in turn, precipitates irrational and drastic fluctuations in their risk perception capacity and emotional state. Irrational trading behaviors driven by investor sentiment can propagate rapidly throughout the financial system through multiple channels, including the cross-market operations of financial institutions, the interconnectedness and nesting of financial products, and investors’ cross-asset portfolio allocations. These behaviors gradually accumulate and amplify systemic risk vulnerabilities, thereby posing a threat to the stable functioning of the financial system.
Under extreme market conditions, the risk contagion effect becomes particularly pronounced. In the upper quantiles, market optimism exhibits a tendency toward irrational expansion, wherein investor expectations regarding the benefits of climate policies are excessively amplified. This dynamic not only propels green asset prices to surge significantly beyond their fundamental values but also drives a blind flow of capital from traditional high-carbon sectors toward green sectors, thereby engendering cross-industry capital misallocation risks. Such risks spill over into the broader financial system through the core operations of financial institutions—including credit allocation and asset deployment—further exacerbating the formation of asset bubbles and intensifying risk spillover effects. Should the asset bubble burst, it would precipitate a chain reaction of risk responses, imposing severe shocks on financial system stability. Conversely, in the lower quantiles, panic sentiment dominates the market. Investors not only divest from green assets and high-carbon assets that are heavily influenced by climate policies but also, driven by heightened risk aversion, withdraw en masse from various risk asset classes—such as equities and bonds—and shift their capital toward safe-haven assets like cash. Such concentrated and large-scale asset sell-offs lead to simultaneous downturns across multiple markets and a precipitous tightening of liquidity. Risk is thereby rapidly disseminated through the interconnected dynamics of financial markets, triggering cross-market risk resonance and significantly amplifying both the scope and destructive intensity of systemic financial risk. This dynamic further underscores the amplification effect and accelerated transmission velocity of risk spillovers under extreme sentiment conditions. In summary, a thorough investigation into the intrinsic mechanisms and dynamic interrelationships among CPU, investor sentiment, and systemic financial risk—and a clear elucidation of their transmission chains and impact boundaries within the context of the “dual carbon” policy framework—holds substantial theoretical value and practical significance. Such inquiry is essential for refining the financial risk early warning system, enhancing the precision of risk prevention and control measures, and safeguarding the overall stability of financial markets.
2. Literature Review and Theoretical Mechanisms
2.1. Literature Review
Against the backdrop of global low-carbon transition and persistently rising CPU, a growing body of scholarly literature has begun to examine the interconnections among CPU, investor sentiment, and systemic financial risk. The relevant research primarily encompasses the following dimensions.
First, studies investigating the contagion mechanisms of systemic financial risk. This stream of literature focuses predominantly on the nonlinear, asymmetric, and cyclical characteristics of risk spillovers among financial sub-markets [1,2], while concurrently exploring the heterogeneity of inter-industry risk contagion and the impact of extreme events on risk transmission [3]. A subset of studies further examines risk spillovers under extreme conditions, noting that the contagion effect is substantially intensified under tail dependence structures [4,5] and that risk transmission exhibits networked characteristics [6] as well as cross-country heterogeneity [7,8].
Second, research concerning the impact of CPU on systemic financial risk. Extant studies demonstrate the presence of significant risk spillovers between CPU and financial markets, with such shocks being particularly pronounced under extreme market conditions [9], thereby constituting a crucial driver of volatility in energy and stock prices [10]. The impact of policy uncertainty on financial sub-markets exhibits time-varying and heterogeneous properties, which may exacerbate systemic risk [11,12]. Moreover, CPU exerts a notable influence on systemic risk spillovers within global financial markets, and its incorporation into investment portfolios has been shown to enhance risk-adjusted returns [13,14].
Third, studies on the relationship between investor sentiment and systemic risk. As a significant branch of finance, behavioral finance centers on the irrational characteristics and intrinsic mechanisms underlying market participants’ investment decisions, with particular emphasis on delineating the pathways through which psychological and cognitive factors shape decision-making behavior. It provides a more realistic analytical framework for interpreting the operational features of actual financial markets. As a core element, fluctuations in investor sentiment can amplify risk contagion through channels such as risk perception and online public opinion [9,15]. Substantial market volatility triggered by extreme sentiment may surpass the self-regulating capacity of financial markets. In an environment characterized by close interconnections among financial markets, such volatility is readily transmitted and amplified across different markets via financial institutions, financial products, and related conduits, thereby inciting cross-market resonance and posing threats to financial stability [16,17].
Fourth, research on the application of machine learning in financial risk forecasting. Compared with traditional econometric models, machine learning techniques exhibit pronounced advantages in financial risk early warning systems, largely attributable to their superior nonlinear modeling capabilities. Relevant studies have constructed risk indices and employed a diverse array of machine learning models—including SCInet, DBN, XGBoost, and LSTM—for predictive analysis, thereby substantiating their superiority in capturing complex nonlinear relationships and enhancing both the accuracy and timeliness of early warning signals [18,19,20,21]. A portion of the literature further concentrates on the identification of risk transmission channels and the analysis of state-dependent heterogeneity, utilizing methodologies such as XGBoost-SHAP to disentangle critical risk transmission pathways under varying market regimes [22,23]. Additionally, some studies have leveraged ensemble modeling approaches to improve both in-sample and out-of-sample predictive performance [24].
In summary, while extant research has extensively explored the contagion mechanisms of systemic financial risk and the respective associations of CPU and investor sentiment with financial risk, notable research gaps persist. First, CPU and investor sentiment have yet to be integrated into a unified analytical framework, and a systematic examination of the intrinsic mechanisms through which their synergistic interaction influences financial market risk remains lacking. Second, studies on tail risk in financial markets predominantly focus on single-market contexts or normal market regimes, leaving the heterogeneity of spillover effects among CPU, investor sentiment, and financial risk under extreme market conditions insufficiently addressed. Third, scarce research combines a quantile perspective with machine learning methodologies to achieve regime-specific, precise forecasting of financial market risk spillovers.
To address the aforementioned research gaps, this paper adopts a targeted methodological design. First, to overcome the limitations of existing studies in exploring the heterogeneity of risk spillovers under extreme conditions, this paper introduces the quantile vector autoregression (QVAR) model and integrates it with the spillover index method developed by Diebold and Yilmaz [25] to construct time-varying spillover indices under different conditional quantiles. This approach overcomes the limitations of traditional mean regression models, which focus solely on conditional expectations, and flexibly captures the dynamic linkage structures of variables across different quantiles. Three representative quantiles—0.05, 0.50, and 0.95—are selected to precisely characterize the heterogeneous risk spillover effects of CPU and investor sentiment on the financial market system under market downturn, normal, and boom conditions, respectively. Second, in view of the limitations of traditional linear econometric models in capturing the complex nonlinear relationships among financial variables, this paper further introduces five machine learning models—Long Short-Term Memory (LSTM), Bidirectional LSTM (BiLSTM), Convolutional Neural Network (CNN), Extreme Gradient Boosting (XGBoost), and Light Gradient Boosting Machine (LightGBM)—and compares them with three benchmark models (ARIMA, Persistence, and HistMean) to fit and predict the level of risk spillovers under different quantile conditions. This design aims to leverage the nonlinear mapping capabilities of machine learning to improve the accuracy and timeliness of risk spillover predictions under extreme conditions, thereby providing methodological support for the construction of a forward-looking financial risk early warning system.
Adopting a dual perspective encompassing both time and frequency domains, and incorporating risk spillover analysis across distinct quantiles, this paper comprehensively investigates the impact of CPU and investor sentiment on volatility spillovers within financial markets, thereby deepening the understanding of systemic financial risk. The marginal contributions of this paper are primarily manifested in the following aspects. First, by integrating CPU and investor sentiment into a unified analytical framework and constructing a quantitative investor sentiment index, this study systematically elucidates the transmission mechanisms and influence pathways through which their synergistic interaction affects systemic financial risk, thereby addressing the limitation of isolated analysis prevalent in the existing literature. Second, based on an examination of seven financial sub-markets in China—including the money market, stock market, and bond market—this research reveals, at the macro level, the regularities and pathways of cross-market risk contagion within the financial system, and clarifies the role positioning of distinct financial sub-markets in risk transmission. Third, employing the QVAR-DY model from a conditional quantile perspective, this study conducts an in-depth analysis of the heterogeneous characteristics of risk spillover effects among CPU, investor sentiment, and financial markets under both normal and extreme market regimes, thereby delineating the patterns of risk transmission under extreme events and major policy shocks. Fourth, this study innovatively introduces five machine learning models—LSTM, BiLSTM, CNN, XGBoost, and LightGBM—into the prediction of risk spillovers in financial markets. Three benchmark models, namely ARIMA, Persistence, and HistMean, are also included for comparison. This design enables a systematic analysis of the optimal prediction model selection under different market conditions, thereby providing a novel methodological reference for financial risk early warning.
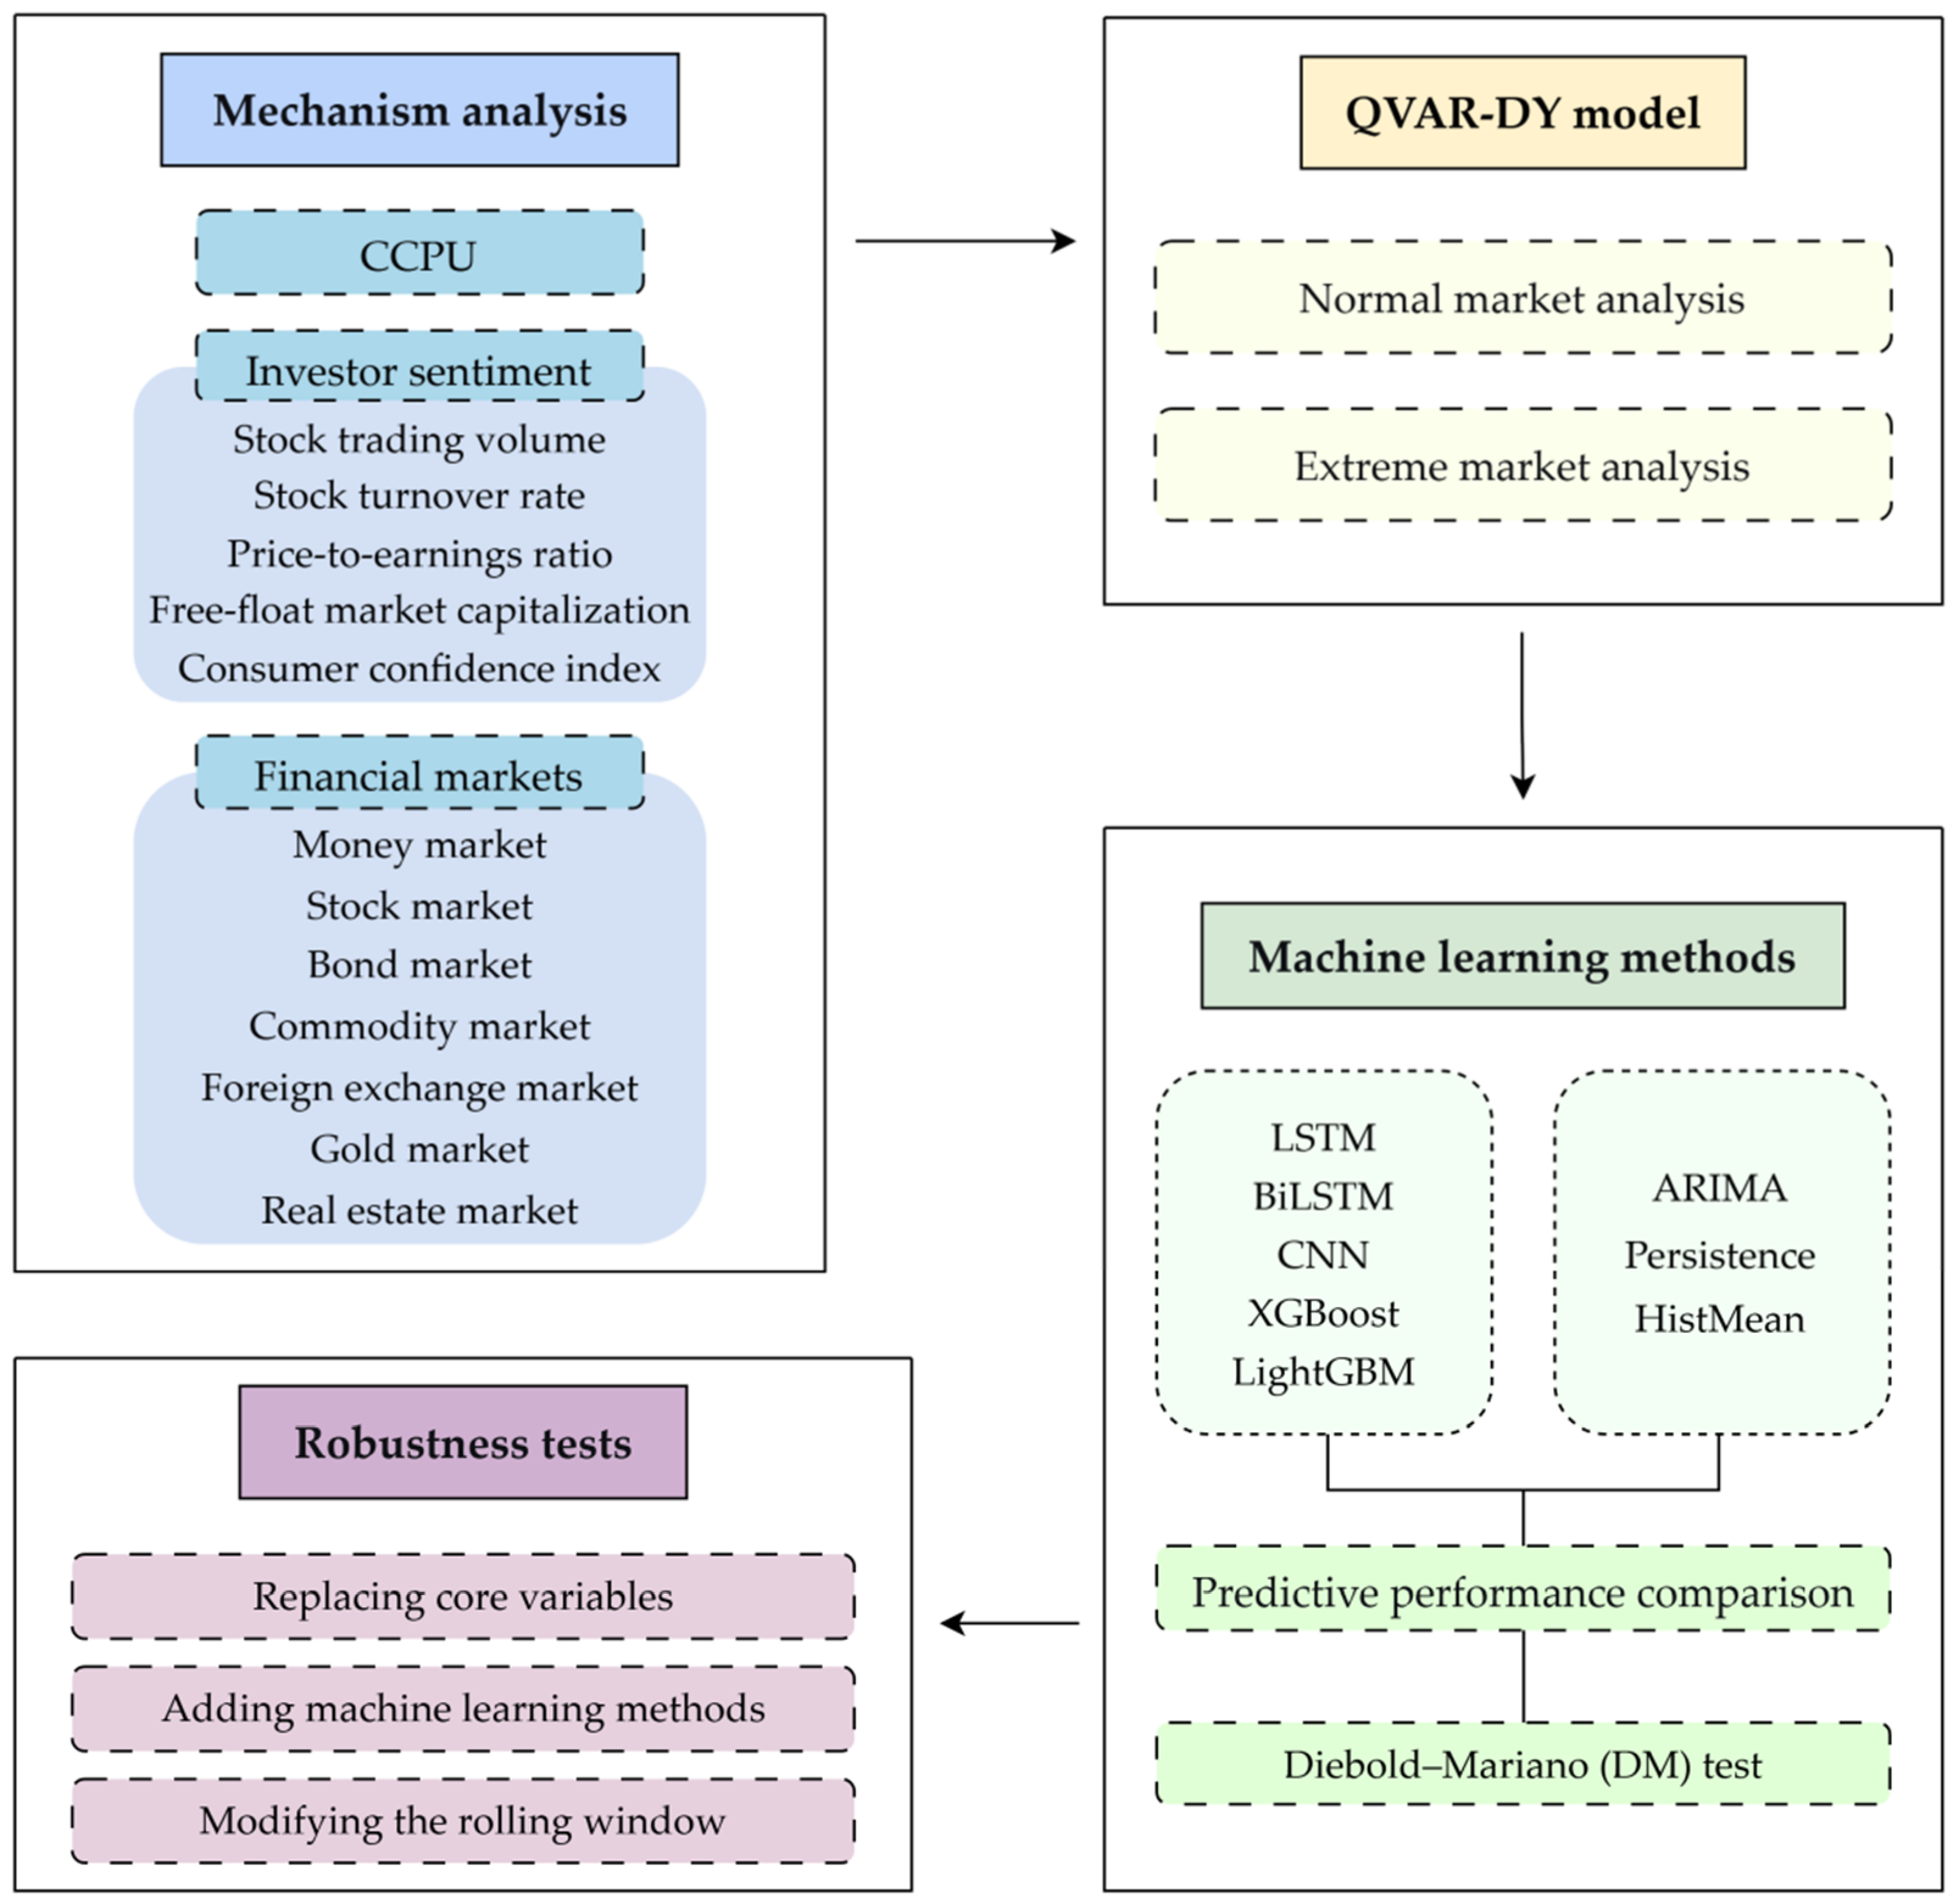
Figure 1 illustrates the methodological scheme of this study.
Figure 1.
Methodological scheme.
2.2. Theoretical Mechanisms
CPU exerts a systemic impact on financial markets through a multi-layered transmission process involving real enterprises, investor behavior, financial institutions, and market linkages, with each layer interacting and amplifying the others. At the real enterprise level, rising CPU makes it difficult to anticipate key parameters such as the stringency of carbon emission constraints, carbon pricing levels, and green technology standards. High-carbon enterprises, by delaying low-carbon technology upgrades, face a passive accumulation of carbon cost exposure, while green enterprises encounter the risk of stalled capacity expansion due to unclear timelines for subsidy phaseouts. Together, these factors increase corporate earnings volatility and credit default risk, forming the micro-level origins of risk spillover [10]. At the investor behavior level, unclear policy pathways exacerbate information asymmetry and divergent expectations in the market. Investors struggle to accurately assess the differential impacts of policies on cash flows across industries, diminishing the effectiveness of fundamental analysis and making trading behavior more susceptible to noise signals. Under optimistic sentiment, green assets form valuation bubbles; under pessimistic sentiment, high-carbon assets suffer irrational discount selling. Both types of mispricing amplify asset price volatility and transmit single-market fluctuations to other submarkets through cross-market asset rebalancing [9].
At the financial institution level, banks tend to raise risk premiums and tighten credit standards during periods of high policy uncertainty, worsening external financing conditions for enterprises and creating a negative feedback loop. Meanwhile, financial institutions holding large amounts of climate-sensitive assets may be forced to initiate programmatic selling during extreme volatility, triggering concentrated sell-offs and accelerating risk accumulation within the financial system. At the market linkage level, risk transmission networks form across submarkets through cross-market capital flows, the interconnectedness and nesting of financial products, and investors’ cross-asset rebalancing. A liquidity shock in one market can rapidly spread to related markets such as money, bond, and foreign exchange markets, ultimately evolving into a systemic risk resonance across markets and assets [1,2]. Notably, the above transmission mechanisms exhibit significant heterogeneity across different market states. During normal periods, risk spillover is primarily driven by fundamental linkages and transmission is relatively moderate. In extreme states, the simultaneous occurrence of concentrated corporate default exposure, sharp divergence in investor expectations, concentrated selling by financial institutions, and liquidity resonance across markets gives rise to pronounced nonlinear amplification effects, with the intensity and speed of risk spillover far exceeding normal levels [4,5]. This heterogeneity provides the theoretical basis for adopting a conditional quantile approach to examine risk spillovers across different states. Based on this, the following hypothesis is proposed:
Hypothesis 1.
Significant mutual risk spillover effects exist among CPU, investor sentiment, and financial submarkets, and the total spillover level under extreme market states is significantly higher than that under normal market states.
Existing literature has confirmed a bidirectional interactive relationship between investor sentiment and risk spillover. On the one hand, investor sentiment positively amplifies risk spillover through irrational trading behavior, cross-market sentiment contagion, and positive feedback mechanisms. Optimistic sentiment drives investors to excessively chase assets favored by policy, inflating valuation bubbles; pessimistic sentiment triggers panic selling and liquidity crises; and positive feedback loops continuously amplify the intensity of risk spillover [15]. On the other hand, risk spillover in turn shapes investor sentiment. Extreme market volatility and asset crashes constitute strong external information shocks, sharply altering investors’ risk perceptions and confidence levels. The spread of cross-market risk intensifies investors’ concerns about systemic crises, leading to heightened panic and subsequent selling, thereby forming a negative feedback spiral [16,17]. Rising volatility itself is also interpreted by investors as a signal of heightened uncertainty, further shrinking risk exposure under the framework of ambiguity-averse decision-making. The two are not independent causal chains but rather an intertwined, mutually reinforcing dynamic spiral. Under normal conditions, the bidirectional interaction is anchored by fundamentals and remains within a moderate and controllable range; under extreme conditions, the bidirectional feedback intensifies significantly, giving rise to a nonlinear escalation process [9]. Based on this, the following hypothesis is proposed:
Hypothesis 2.
A bidirectional spillover relationship exists between investor sentiment and risk spillover, and the intensity of this bidirectional spillover is significantly higher under extreme conditions than under normal conditions.
The climate policy uncertainty index and investor sentiment vary across different market states, leading to significant differences in risk spillover. Under normal market conditions, information transmission is relatively smooth, investor expectations are primarily anchored by fundamentals, financial institutions adhere to conventional risk preferences, the roles of net risk exporters and net recipients remain relatively stable, and cross-market risk transmission is dominated by fundamental spillovers, with intensity remaining in a low range. Under market downturn conditions, negative shocks trigger a sharp rise in risk aversion, panic sentiment dominates trading, liquidity demand replaces value judgment as the primary driving force, corporate credit defaults become concentrated, financial institutions sharply contract credit, and concentrated asset sell-offs occur frequently. The interconnectedness among submarkets is greatly enhanced due to liquidity resonance, and some safe-haven assets may switch to become net risk exporters, leading to a shift in market roles and a significant amplification of risk spillover intensity [11,12]. Under market boom conditions, optimistic sentiment expands irrationally, investors excessively amplify expectations of policy benefits, and large-scale capital inflows drive asset prices to rise rapidly away from fundamental support. Low volatility on the surface may conceal the process of risk accumulation. Once expectations reverse or policy benefits fall short of expectations, the bursting of asset bubbles triggers sharp corrective reversals, and risk spillover effects also intensify significantly. In summary, the impact of CPU and investor sentiment on financial market risk spillover is not a simple linear relationship but exhibits nonlinear and asymmetric characteristics that vary with market states. Only by adopting a conditional quantile approach and examining risk spillovers across different states can a comprehensive characterization of the heterogeneous patterns of risk spillover under different market environments be achieved [3,6]. Based on this, the following hypothesis is proposed:
Hypothesis 3.
The net spillover roles of different financial submarkets in the risk transmission network exhibit heterogeneity, and the roles of some submarkets may undergo directional shifts under extreme market conditions.
3. Research Methodology and Data Description
3.1. Research Methodology
QVAR-DY Model
Following the methodological frameworks established by Diebold and Yilmaz [25] and Li Zheng et al. [26], this study integrates the Quantile Vector Autoregression (QVAR) model with the Diebold-Yilmaz (DY) spillover index approach to construct spillover indices across distinct conditional quantiles. This integrated methodology serves to delineate the heterogeneous impacts of CPU and investor sentiment on financial sub-markets under varying market regimes. Specifically, three representative conditional quantiles are selected for analysis: the 0.05 quantile is employed to characterize market downturns and capture risk transmission dynamics under extreme negative shocks; the 0.50 quantile corresponds to the median condition and represents volatility characteristics under normal market states; and the 0.95 quantile is utilized to depict market upswings and capture risk spillovers under extreme positive shocks.
A p-th order Quantile Vector Autoregression model, denoted as QVAR(P) containing N variables is established:
where is an vector of explained variables, and represent the N vector of constants and the residual vector at quantile , respectively. denotes the coefficient matrix for the lagged dependent variables at quantile , and is the lag order. The parameters and can be estimated by assuming that the residuals satisfy the population quantile restriction, specifically . The conditional response of at the population quantile can be expressed as:.
Transform Equation (1) into its moving average (MA) representation:
where
For a forecast horizon H, the proportion of the H-step-ahead forecast error variance of variable i that is attributable to shocks from variable j can be expressed as:
where is the residual covariance matrix, is the j-th diagonal element of the matrix , and is a selection vector with the i-th element equal to 1 and all other elements equal to 0. Normalize as follows:
From this, the following spillover indices can be derived: the net pairwise directional connectivity index (NPDC), the directional risk spillover index from variable i to all other variables (TO), the directional risk spillover index received by variable i from all other variables (FROM), the net risk spillover index for market i (NET), and the total connectivity index (TCI):
Based on the Generalized Forecast Error Variance Decomposition (GFEVD), the Total Connectedness Index (TCI) at each quantile is calculated to measure the intensity of risk transmission among financial sub-markets:
3.2. Sample Data
CPU encompasses a broad spectrum of factors related to climate governance. This study employs the national-level CPU index constructed by Ma et al. [27] to quantify uncertainty. This index is generated based on the quantification of climate policy-related terminology appearing in six major Chinese newspapers, and the data are sourced from the website http://www.cnefn.com (accessed on 26 March 2026). The measurement of systemic financial risk adheres to the frameworks established by Zhang Zongxin and Jin Jiaqi [1] and Hu Lining [9]. Seven major financial sub-markets are selected for analysis, specifically encompassing the money market, stock market, bond market, commodity market, foreign exchange market, gold market, and real estate market. The data for these markets are sourced from the Wind Database. The sample period for all datasets spans from 1 January 2005 to 28 December 2024, as detailed in Table 1. To mitigate the interference of high-frequency noise inherent in daily data, the sample data are aggregated at a weekly frequency. Financial market data are transformed into return series via logarithmic differencing.
Table 1.
Sample Indicator Selection.
3.3. Construction of the Investor Sentiment Index
This paper employs Principal Component Analysis (PCA) to construct the model. This method transforms multiple groups of correlated observed variables in the original data into several independent composite variables through orthogonal transformation, achieving data dimensionality reduction. Considering the time-lag effect in the transmission of investor sentiment within financial markets [28], this paper further incorporates the impact of the one-period lagged explanatory variables. The construction of the composite investor sentiment index draws upon the methodological approaches of Gao Zhenbin and Liang Xingbi [29], Liu Zhifeng et al. [30], and Xie Shiqing et al. [17]. Taking into account both data availability and indicator representativeness, five dimensions are selected: the scale of securities market transactions, stock turnover efficiency, valuation levels, the scale of margin trading, and the consumer confidence index. The data for these dimensions are obtained from the Wind Database. The sample period for all datasets spans from 1 January 2005 to 28 December 2024, as detailed in Table 1. Specifically, trading volume (VOL) is the monthly market trading volume, reflecting market participation enthusiasm and serving as a classic positive indicator of sentiment. Turnover rate (TR) is defined as monthly trading volume divided by monthly circulating market capitalization, providing a relative measure of market trading activity that avoids distortion by market size. The price-to-earnings ratio (PE) is the average market price-to-earnings ratio, where a high PE is often associated with optimistic sentiment and valuation bubbles. The Consumer Confidence Index (CCI) is a monthly index released by the National Bureau of Statistics, reflecting residents’ general expectations for the economy and capturing sentiment at the macroeconomic level. Circulating market value (CMV) is the monthly circulating market value of the market, where market expansion is positively correlated with optimistic sentiment, serving as a market-wide representation of sentiment. The one-period lagged values of the above five variables are further incorporated, denoted as VOL1, TR1, PE1, CCI1, and CMV1, respectively. To eliminate the influence of dimensionality, all variables are standardized. Based on Principal Component Analysis, the cumulative variance contribution rate of the first three principal components reaches 92%. Accordingly, the initial investor sentiment index CIMS* is constructed, expressed as:
To optimize the construction of the investor sentiment index, this study further analyzes the correlations between CIMS* and ten proxy variables. Among them, five variables with relatively high correlation coefficients between the original proxy variables and their one-period lagged counterparts are selected as the basis for constructing the final investor sentiment index. The results of the correlation analysis are presented in Table 2.
Table 2.
Correlation Analysis Results.
Based on the selected set of variables, the investor sentiment index CIMS is reconstructed and expressed as:
4. Empirical Results
4.1. Tail Risk Static Spillover Effect Analysis
Table 3 and Table 4 present the levels of static spillover effects among CPU, investor sentiment, and various financial sub-markets under normal and extreme market conditions, respectively. In these tables, “FROM” denotes the spill-in index, representing the level of spillover received by a given market from all other markets, whereas “TO” denotes the spill-out index, representing the level of spillover transmitted from a given market to all other markets.
Table 3.
Static Total Spillover Effects of Financial Markets Under Normal Conditions.
Table 4.
Static Total Spillover Effects of Financial Markets Under Extreme Conditions.
4.1.1. Under Normal Market Conditions
As can be observed from Table 3: First, under normal market conditions, the total volatility spillover index for China’s financial market stands at 18.87%. In terms of spillover magnitude, CPU exhibits the largest spillover index toward the gold market, followed by the bond market, while its spillover toward the money market is the smallest. Investor sentiment demonstrates the largest spillover index toward the bond market, followed by the stock market and commodity market, with the smallest spillovers directed toward the money market and foreign exchange market. These findings indicate that distinct financial sub-markets exhibit significant heterogeneity in their sensitivity to external shocks. Second, regarding the mutual transmission mechanisms among financial sub-markets, the bond market receives the highest level of spill-ins from other markets (44.40%) and also transmits the highest level of spillovers to other markets (67.32%), suggesting that the bond market functions as a crucial risk nexus within the financial system. In contrast, the stock market exhibits the weakest levels of both spill-in and spill-out, at 1.94% and 1.37%, respectively. Third, from the perspective of net spillover effects, the commodity market, money market, stock market, and foreign exchange market serve as net recipients of risk, with net spill-in effects of 3.12%, 1.08%, 0.56%, and 0.05%, respectively. Conversely, the bond market, gold market, and real estate market act as net transmitters of risk, with net spillover effects of 22.92%, 14.10%, and 0.25%, respectively.
4.1.2. Under Extreme Market Conditions
Table 4 presents the static spillover levels among CPU, investor sentiment, and various financial sub-markets under extreme upward ( = 0.95) and extreme downward ( = 0.05) market conditions.
Under extreme upward market conditions, the escalation of CPU and investor sentiment exacerbates cross-market risk contagion within the financial system. First, with respect to the overall spillover magnitude, the average volatility spillover index reaches 81.28%, substantially exceeding the 18.87% recorded under normal conditions. The total spillover level of CPU stands at 79.79%, while that of investor sentiment reaches 87.43%, both exhibiting marked increases relative to the normal state. These findings indicate that extreme upward conditions significantly amplify the spillover effects of both CPU and investor sentiment, as well as the volatility transmission across markets. Second, regarding the spillover structure among financial sub-markets, CPU exerts the strongest spillover effect on the money market, followed by the foreign exchange market, while its impact on the gold market is the weakest. Investor sentiment exhibits the most pronounced spillover toward the money market, followed by the commodity market, with the real estate market receiving the weakest spillover. The bond market transmits the highest level of spillovers to other markets, succeeded by the foreign exchange market, whereas the money market exhibits the lowest spillover transmission. Compared with normal market conditions, the spillover level from CPU to the foreign exchange market registers the most substantial increase, while the real estate market experiences the smallest variation. The spillover from investor sentiment to the real estate market shows the greatest surge, whereas the stock market undergoes the least change. Third, in terms of net spillover effects, the stock market, commodity market, and money market function as net recipients of risk, with net spill-in effects of 12.95%, 2.77%, and 14.04%, respectively. Conversely, the bond market, real estate market, foreign exchange market, and gold market serve as net transmitters of risk, with net spillover effects of 11.96%, 1.91%, 0.43%, and 11.07%, respectively.
Under extreme downward market conditions, the escalation of CPU and investor sentiment similarly intensifies cross-market risk contagion within the financial system. First, with respect to the overall spillover magnitude, the average volatility spillover index reaches 80.40%, substantially higher than that observed under normal conditions. The total spillover level of CPU registers at 74.52%, while that of investor sentiment attains 77.53%, both exhibiting pronounced increases relative to the normal state. Second, regarding the spillover structure among financial sub-markets, CPU exerts the strongest spillover effect on the money market, followed by the foreign exchange market, while its impact on the bond market is the weakest. Investor sentiment demonstrates the most pronounced spillover toward the bond market, succeeded by the foreign exchange market, with the commodity market receiving the weakest spillover. The real estate market transmits the highest level of spillovers to other markets, followed by the bond market, whereas the stock market exhibits the lowest spillover transmission. Compared with normal market conditions, the spillover levels from both CPU and investor sentiment to the foreign exchange market register the most substantial increases, while the real estate market and the bond market experience the smallest variations, respectively. Third, in terms of net spillover effects, the stock market, commodity market, and money market function as net recipients of risk, with net spill-in effects of 4.70%, 3.68%, and 3.69%, respectively. Conversely, the bond market, real estate market, foreign exchange market, and gold market serve as net transmitters of risk, with net spillover effects of 8.39%, 4.55%, 0.18%, and 9.30%, respectively.
Collectively, the findings indicate that the total spillover effect within the financial market escalates substantially under extreme market conditions relative to the normal state, with the average volatility spillover index rising to exceed 80%, thereby signifying a marked intensification of cross-market risk contagion. The spillover effects of both CPU and investor sentiment are significantly amplified, and their interconnectedness with financial markets strengthens notably, suggesting that risk transmission in response to external shocks becomes considerably more sensitive under extreme environments. Moreover, distinct financial sub-markets exhibit pronounced heterogeneity within the risk spillover configuration: the bond market, real estate market, and gold market consistently function as net transmitters of risk under extreme conditions, whereas the stock market, commodity market, and money market persistently serve as net recipients of risk. Notably, this structural pattern of risk transmission remains relatively stable across both upward and downward extreme market regimes.
4.1.3. Trends in Total Risk Spillover Across Different Quantiles
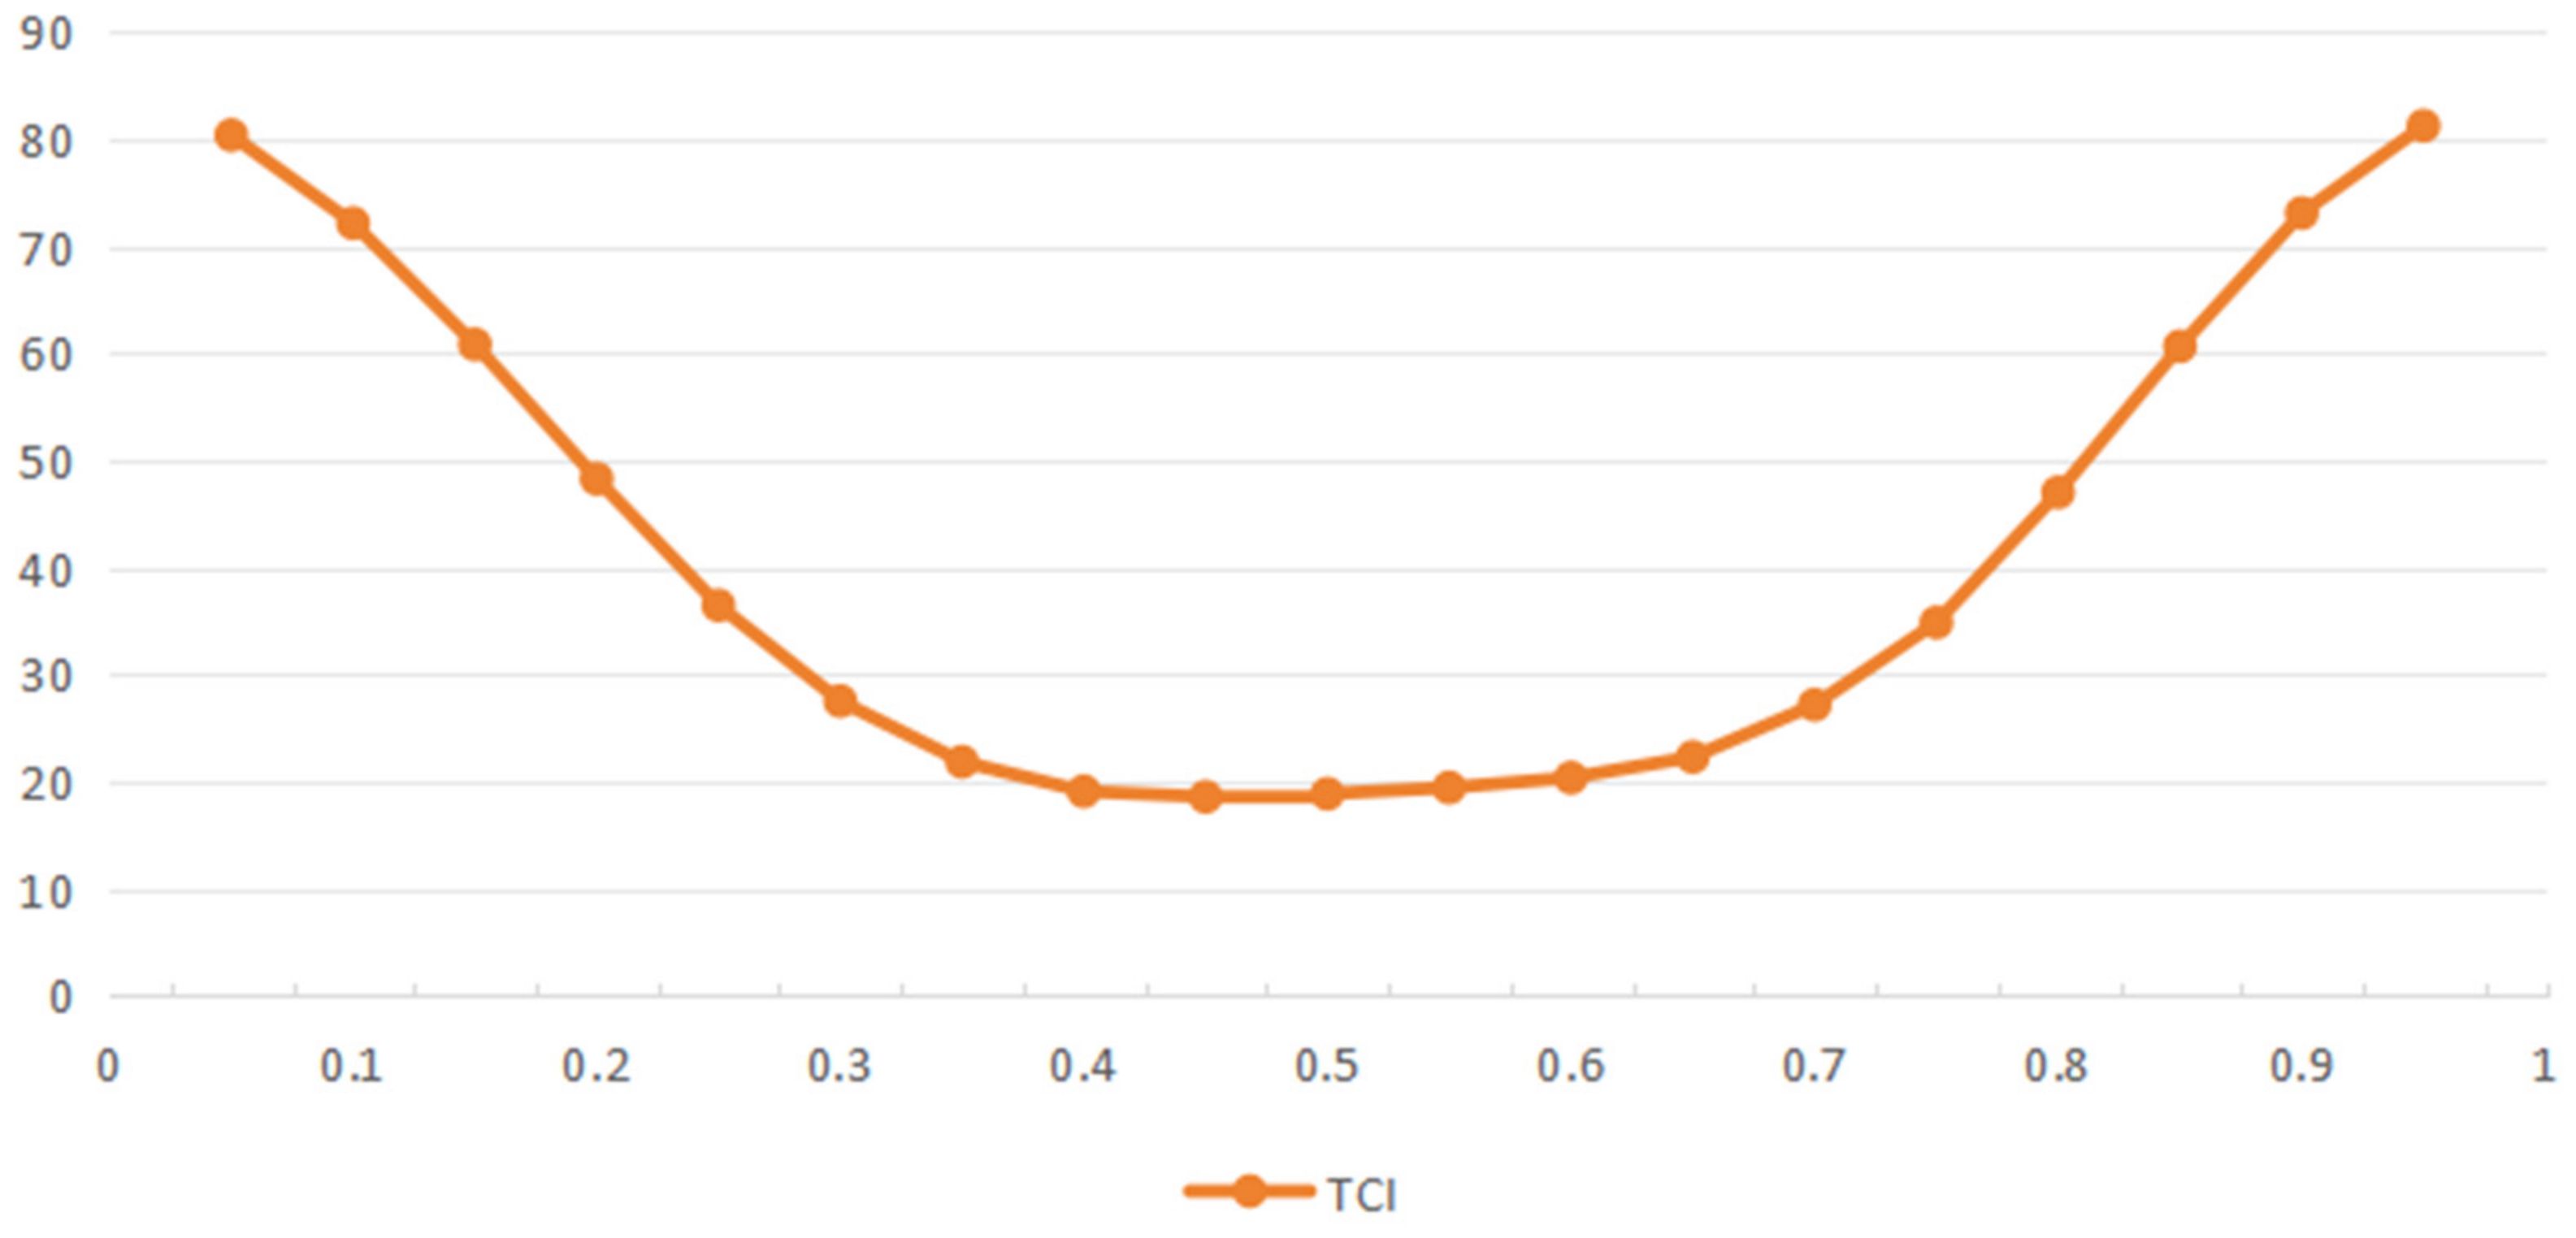
As illustrated in Figure 2, the total spillover effect index of CPU and investor sentiment on China’s financial market exhibits a pronounced U-shaped pattern across different quantiles. Notably, the spillover levels at the right and left tails of the conditional distribution demonstrate a degree of similarity, wherein the spillover magnitude progressively intensifies as the quantile shifts from the median toward either extreme. This phenomenon can be attributed to the fact that under extreme negative shocks, investor panic and irrational sentiment readily exacerbate cross-market risk contagion. Conversely, under extreme positive shocks, investors exhibit heightened sensitivity to even minor perturbations, and both mechanisms—operating through their influence on investor sentiment and behavior—amplify tail volatility spillover effects. Furthermore, based on the estimation of the QVAR-DY model, the residual covariance matrices across different quantiles do not display significant divergence, suggesting that the observed tail similarity may partially stem from the similarity of dynamic parameters at both tails of the model. It is noteworthy, however, that the spillover effect indices at the conditional left and right tails are not entirely symmetric. At the 0.1 quantile, the total spillover level registers at 72.18%, whereas at the 0.9 quantile, it reaches 73.12%, slightly surpassing that of the left tail. Under extreme downward market conditions, investor panic and irrational selling behavior dominate, thereby intensifying risk contagion. Under extreme upward conditions, the synergistic effect of market optimism and leveraged trading activities may similarly amplify cross-market interconnectedness through capital reallocation and risk-seeking behavior. Therefore, irrespective of whether the market is experiencing extreme upward or extreme downward movements, severe financial market volatility reinforces the degree of risk transmission across different markets, albeit with certain divergences in the underlying transmission mechanisms and predominant driving factors.
Figure 2.
Trend of the Total Spillover Effect.
4.2. Dynamic Spillover Effect Analysis of Tail Risk
4.2.1. Dynamic Total Risk Spillover
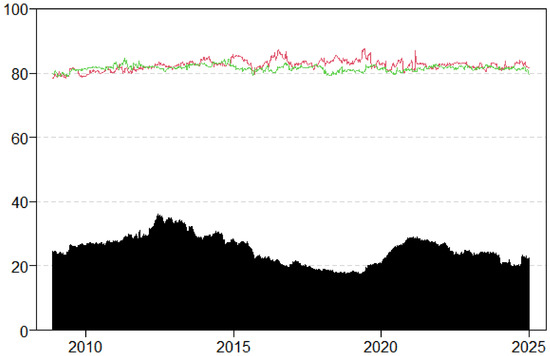
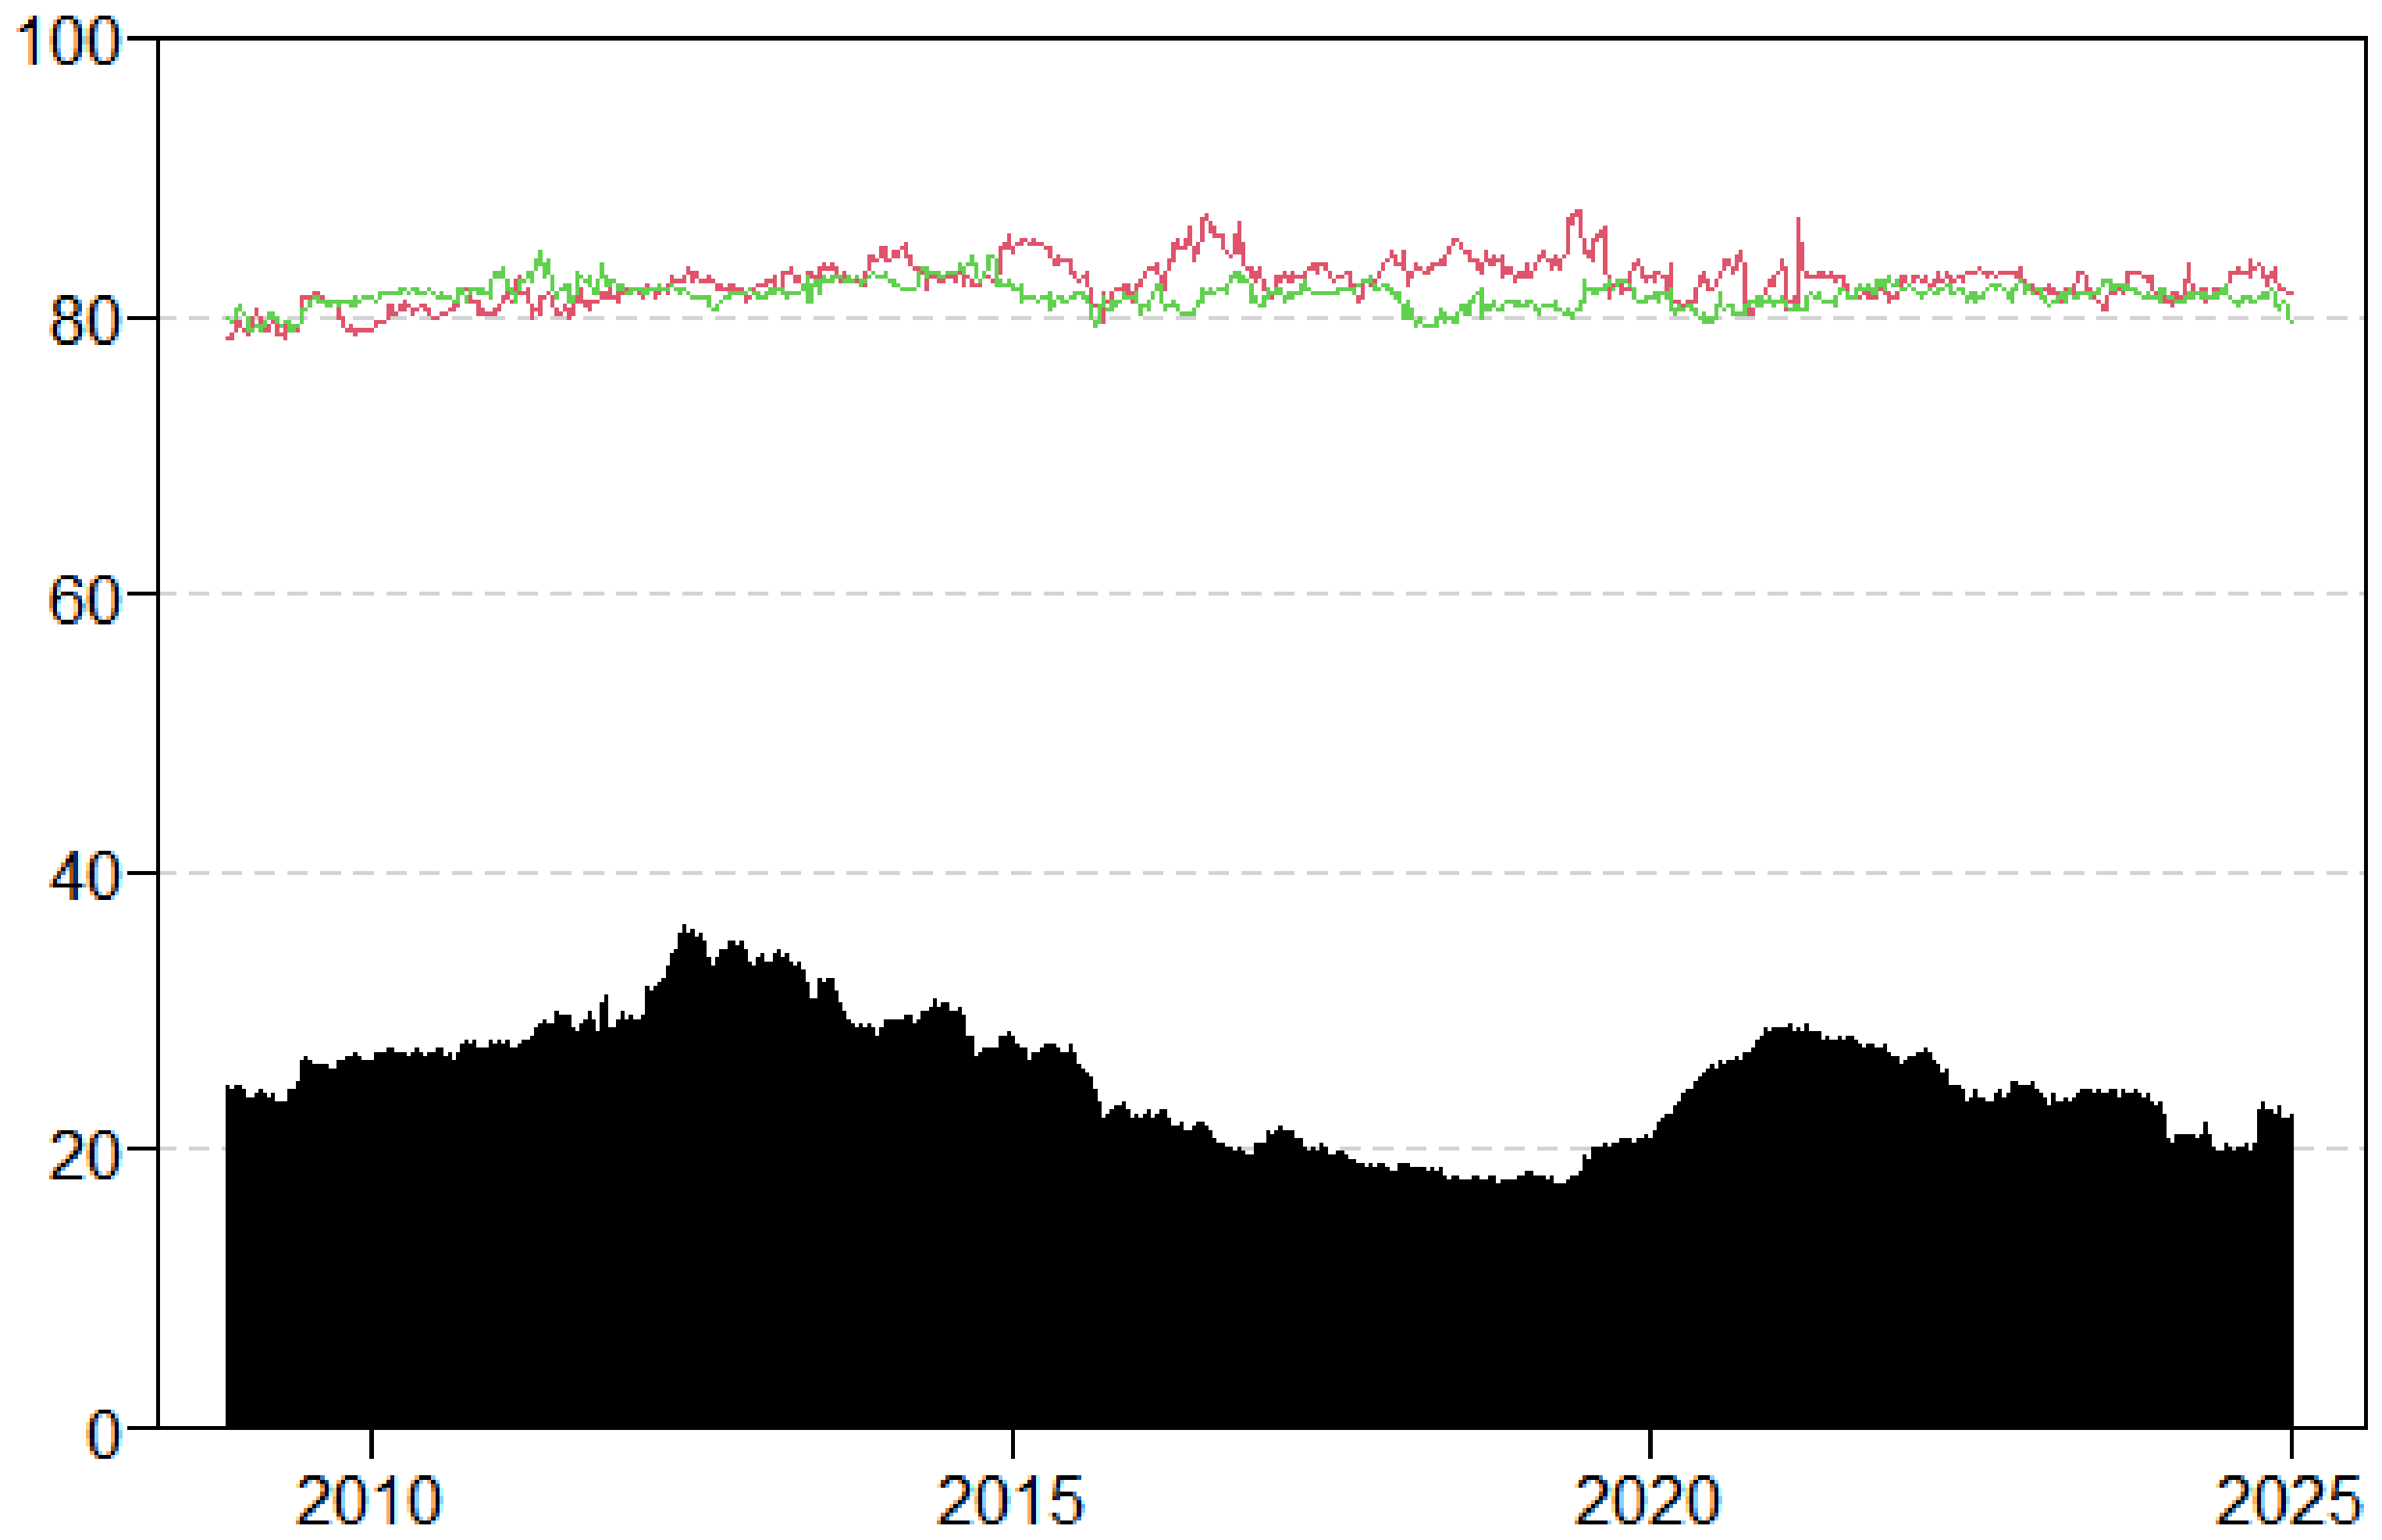
This paper analyzes the dynamic spillover effects among CPU, investor sentiment, and China’s financial market under normal and extreme market conditions, as illustrated in Figure 3. In the figure, the shaded area represents risk spillovers under normal conditions, while the red and green curves denote risk spillovers under extreme upward and extreme downward conditions, respectively. It can be observed that the total spillover effects under all three regimes exhibit pronounced time-varying characteristics, albeit with certain divergences in their fluctuation patterns and magnitudes. Under normal conditions, the spillover level operates at a relatively low range, manifesting periodic fluctuation features. In contrast, under extreme conditions, the spillover level remains elevated at approximately 80%, accompanied by substantial volatility and heightened sensitivity to the impact of extreme events. When the market enters an extreme volatility regime, investors become highly sensitive to even minor perturbations, and panic sentiment coupled with irrational behavior readily exacerbates cross-market risk contagion.
Figure 3.
Dynamic Tail Risk Spillover. Note: Shaded area represents risk spillovers under normal conditions; red and green curves denote risk spillovers under extreme upward and extreme downward market conditions, respectively.
As can be discerned from Figure 3, under normal market conditions, the total spillover level among CPU, investor sentiment, and China’s financial market fluctuates around 20%, and its volatility trajectory can be broadly delineated into three distinct phases. In the first phase (2012–2014), the total risk spillover level escalated rapidly in 2012 and subsequently sustained oscillations at an elevated range. During the second phase (2014–2019), the total risk spillover level exhibited a downward trend, experiencing only a transient resurgence in 2015 before continuing its decline. In the third phase (2019–2024), the total risk spillover level commenced an ascent from 2019 onward, reaching its zenith in 2021, followed by a modest retracement thereafter.
The time-varying trend of the risk spillover level reflects the susceptibility of financial markets to the impact of major events. In the first phase, the eruption of the European debt crisis in 2012 exerted a disruptive influence on financial market risk contagion. In the second phase, the National Plan for Addressing Climate Change (2014–2020), promulgated in 2014, established the strategic framework for climate governance. In 2015, Enhanced Actions on Climate Change: China’s Intended Nationally Determined Contributions set forth quantitative targets for carbon intensity reduction. These policy developments coincided with the 2015 A-share market crash, during which the failure of pledge financing mechanisms and irrational investor behavior further amplified short-term volatility effects. Additionally, the entry into force of the Paris Agreement at the international level also exerted a certain influence on risk fluctuations. From 2016 to 2018, with the preparatory advancement of the national carbon emissions trading market and the deepening of industrial energy conservation and emission reduction policies, the total spillover level gradually receded. In the third phase, the upward trend observed from 2020 to the first half of 2021 was particularly pronounced, primarily driven by the dual forces of the establishment of the “dual carbon” goals and the outbreak of the COVID-19 pandemic. During the post-pandemic period from 2021 to 2022, the normalization of industrial activity and sustained macroeconomic recovery led to a gradual attenuation of long-term risk transmission effects within the financial market. The outbreak of the Russia-Ukraine conflict in 2022 triggered an energy crisis, intensifying the tension between climate policy imperatives and energy security concerns. This resulted in a modest uptick in short-term spillover effects and heightened market apprehension regarding policy uncertainty. By 2023, with China’s economic recovery stabilizing and geopolitical competition becoming normalized, policy uncertainty moderated, market expectations reverted to a more rational state, and the total spillover level maintained a relatively stable trajectory.
The time-varying trend of risk spillovers under extreme conditions exhibits a degree of synchronicity with that observed under normal conditions, with pronounced fluctuations being particularly evident in response to extreme shocks. Under the impact of extreme events, the risk spillover effects among CPU, investor sentiment, and financial markets escalate markedly. Conversely, when the economic environment is favorable, investor sentiment remains stable, and financial markets operate smoothly, the risk spillover level remains comparatively low, thereby serving to buffer the impact of extreme events. In contrast, under tail-state conditions, the intensity of the shock from extreme events is significantly amplified.
4.2.2. Risk Spillover of Variables Under Normal Conditions
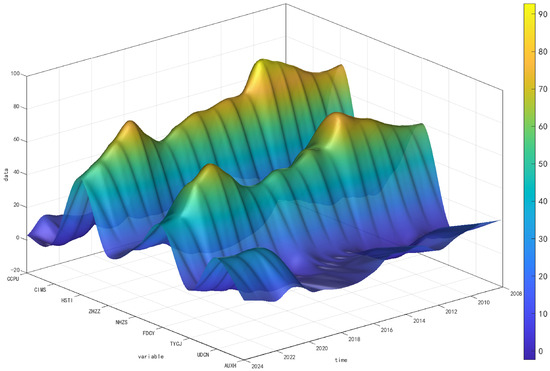
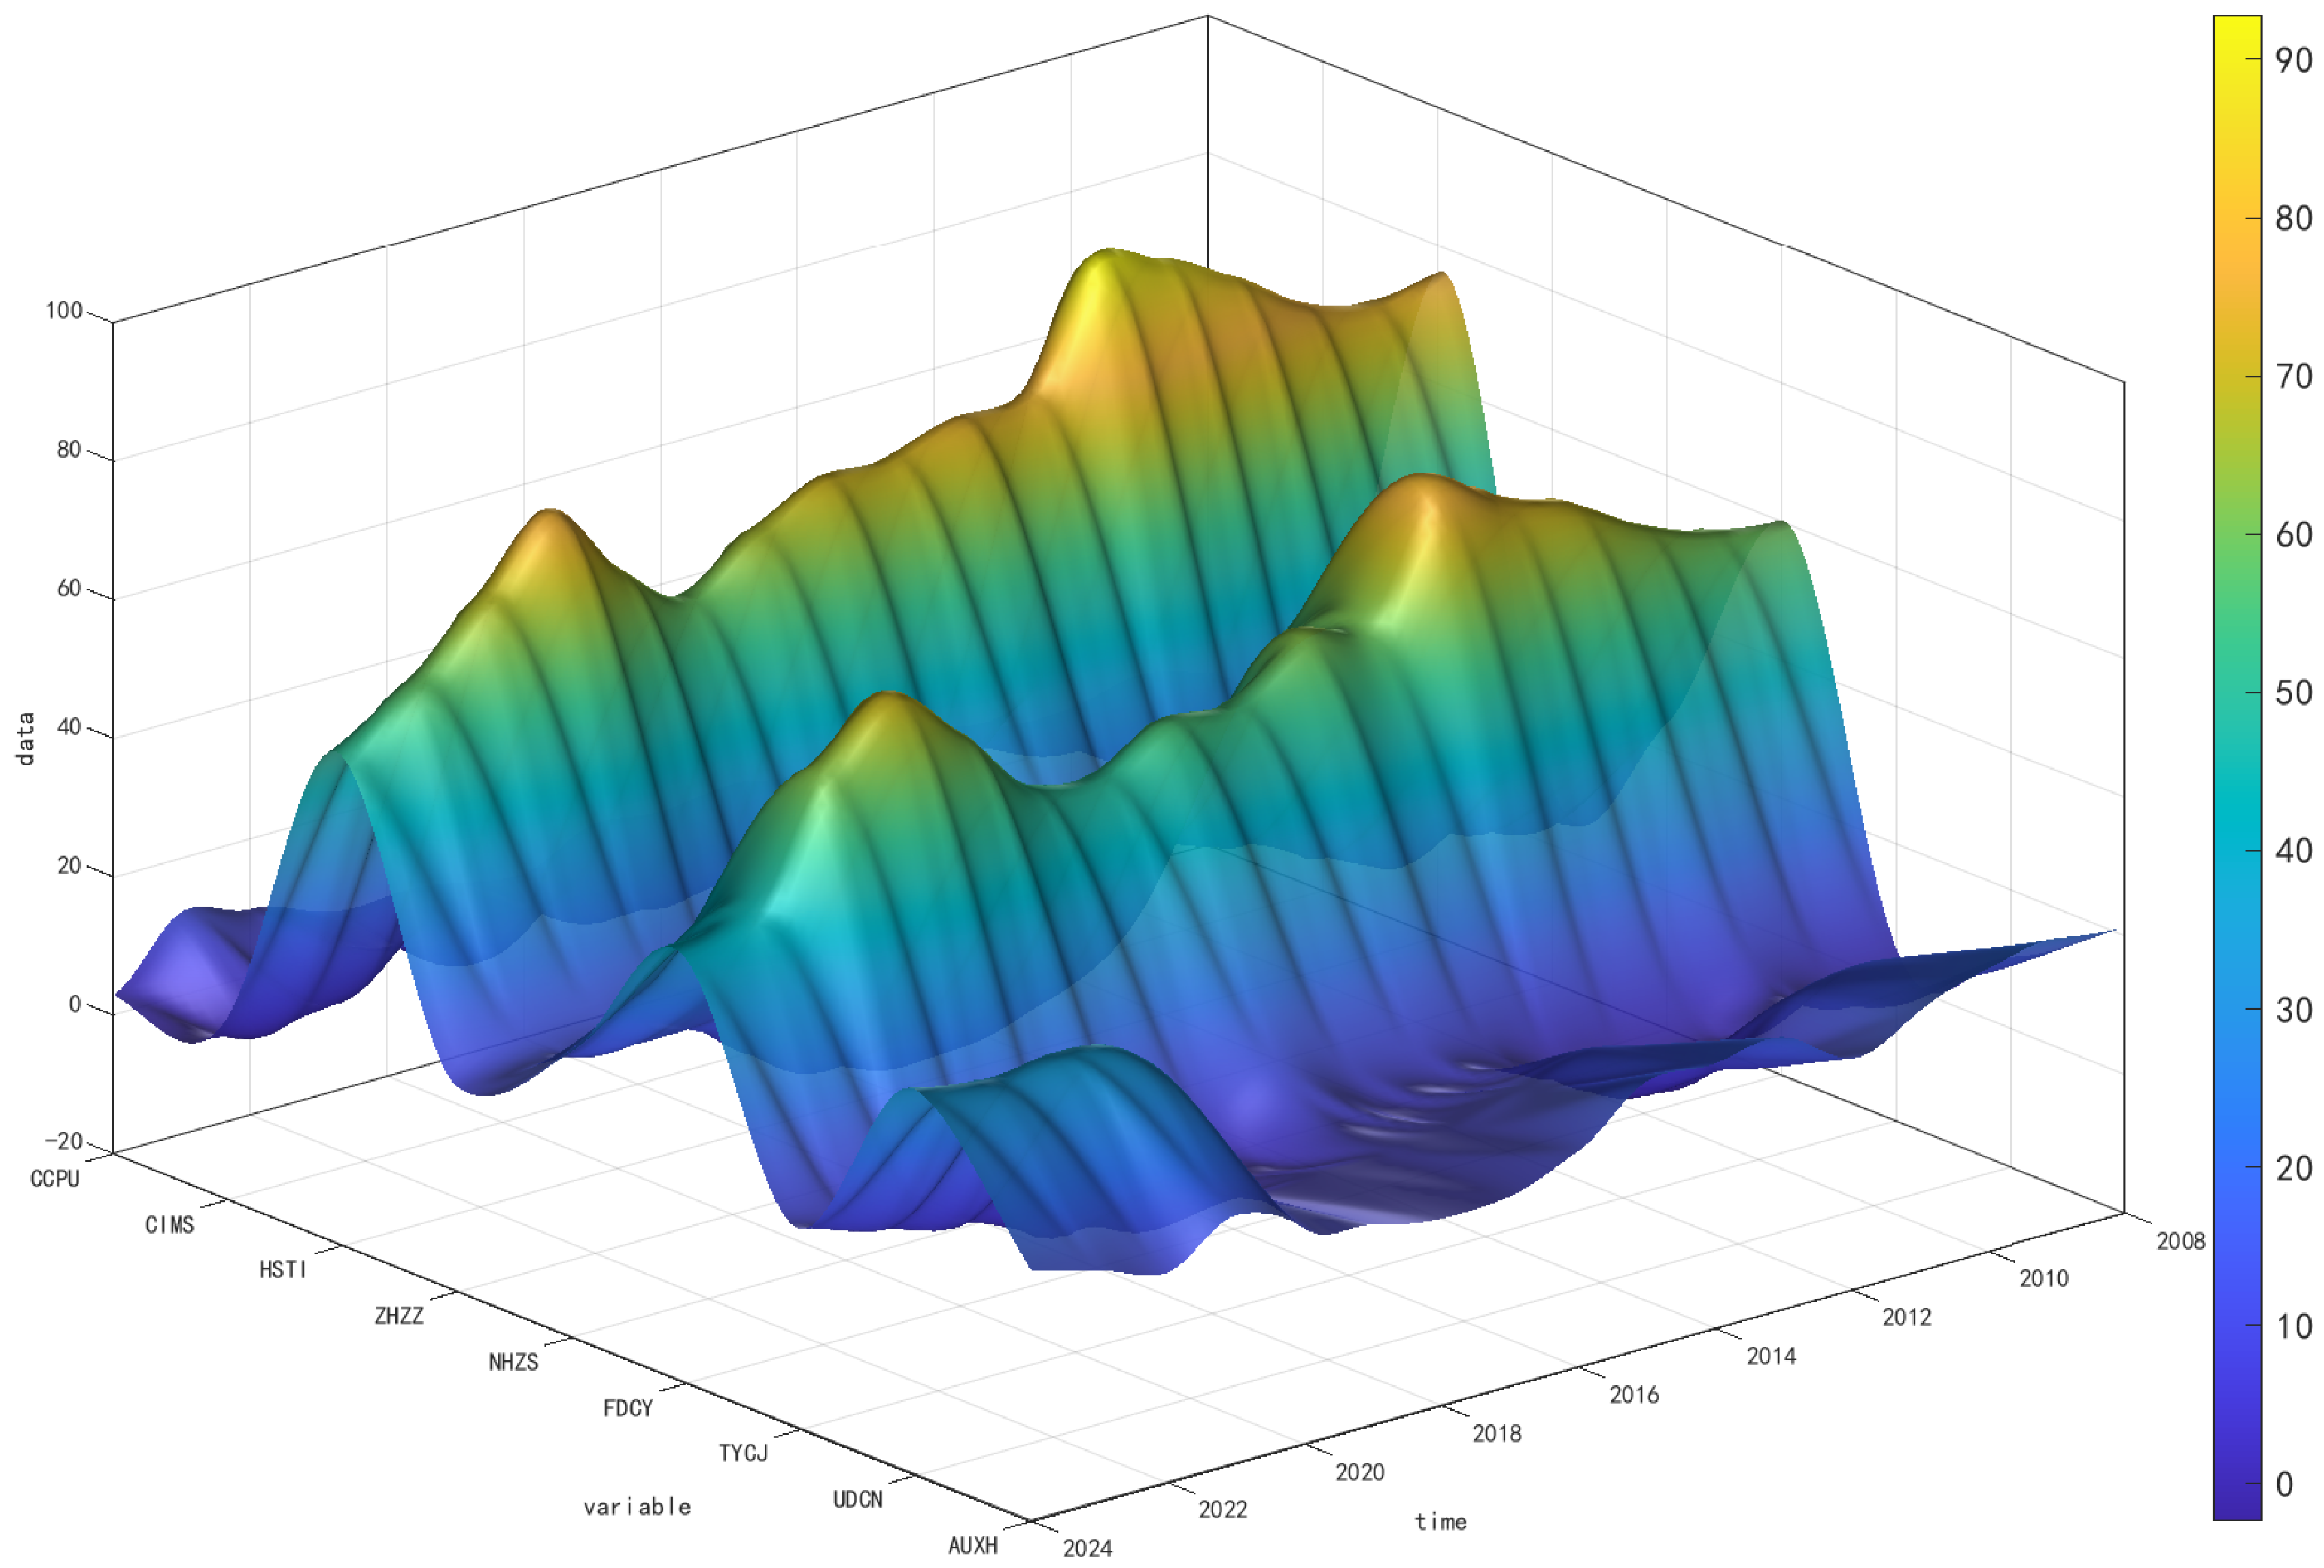
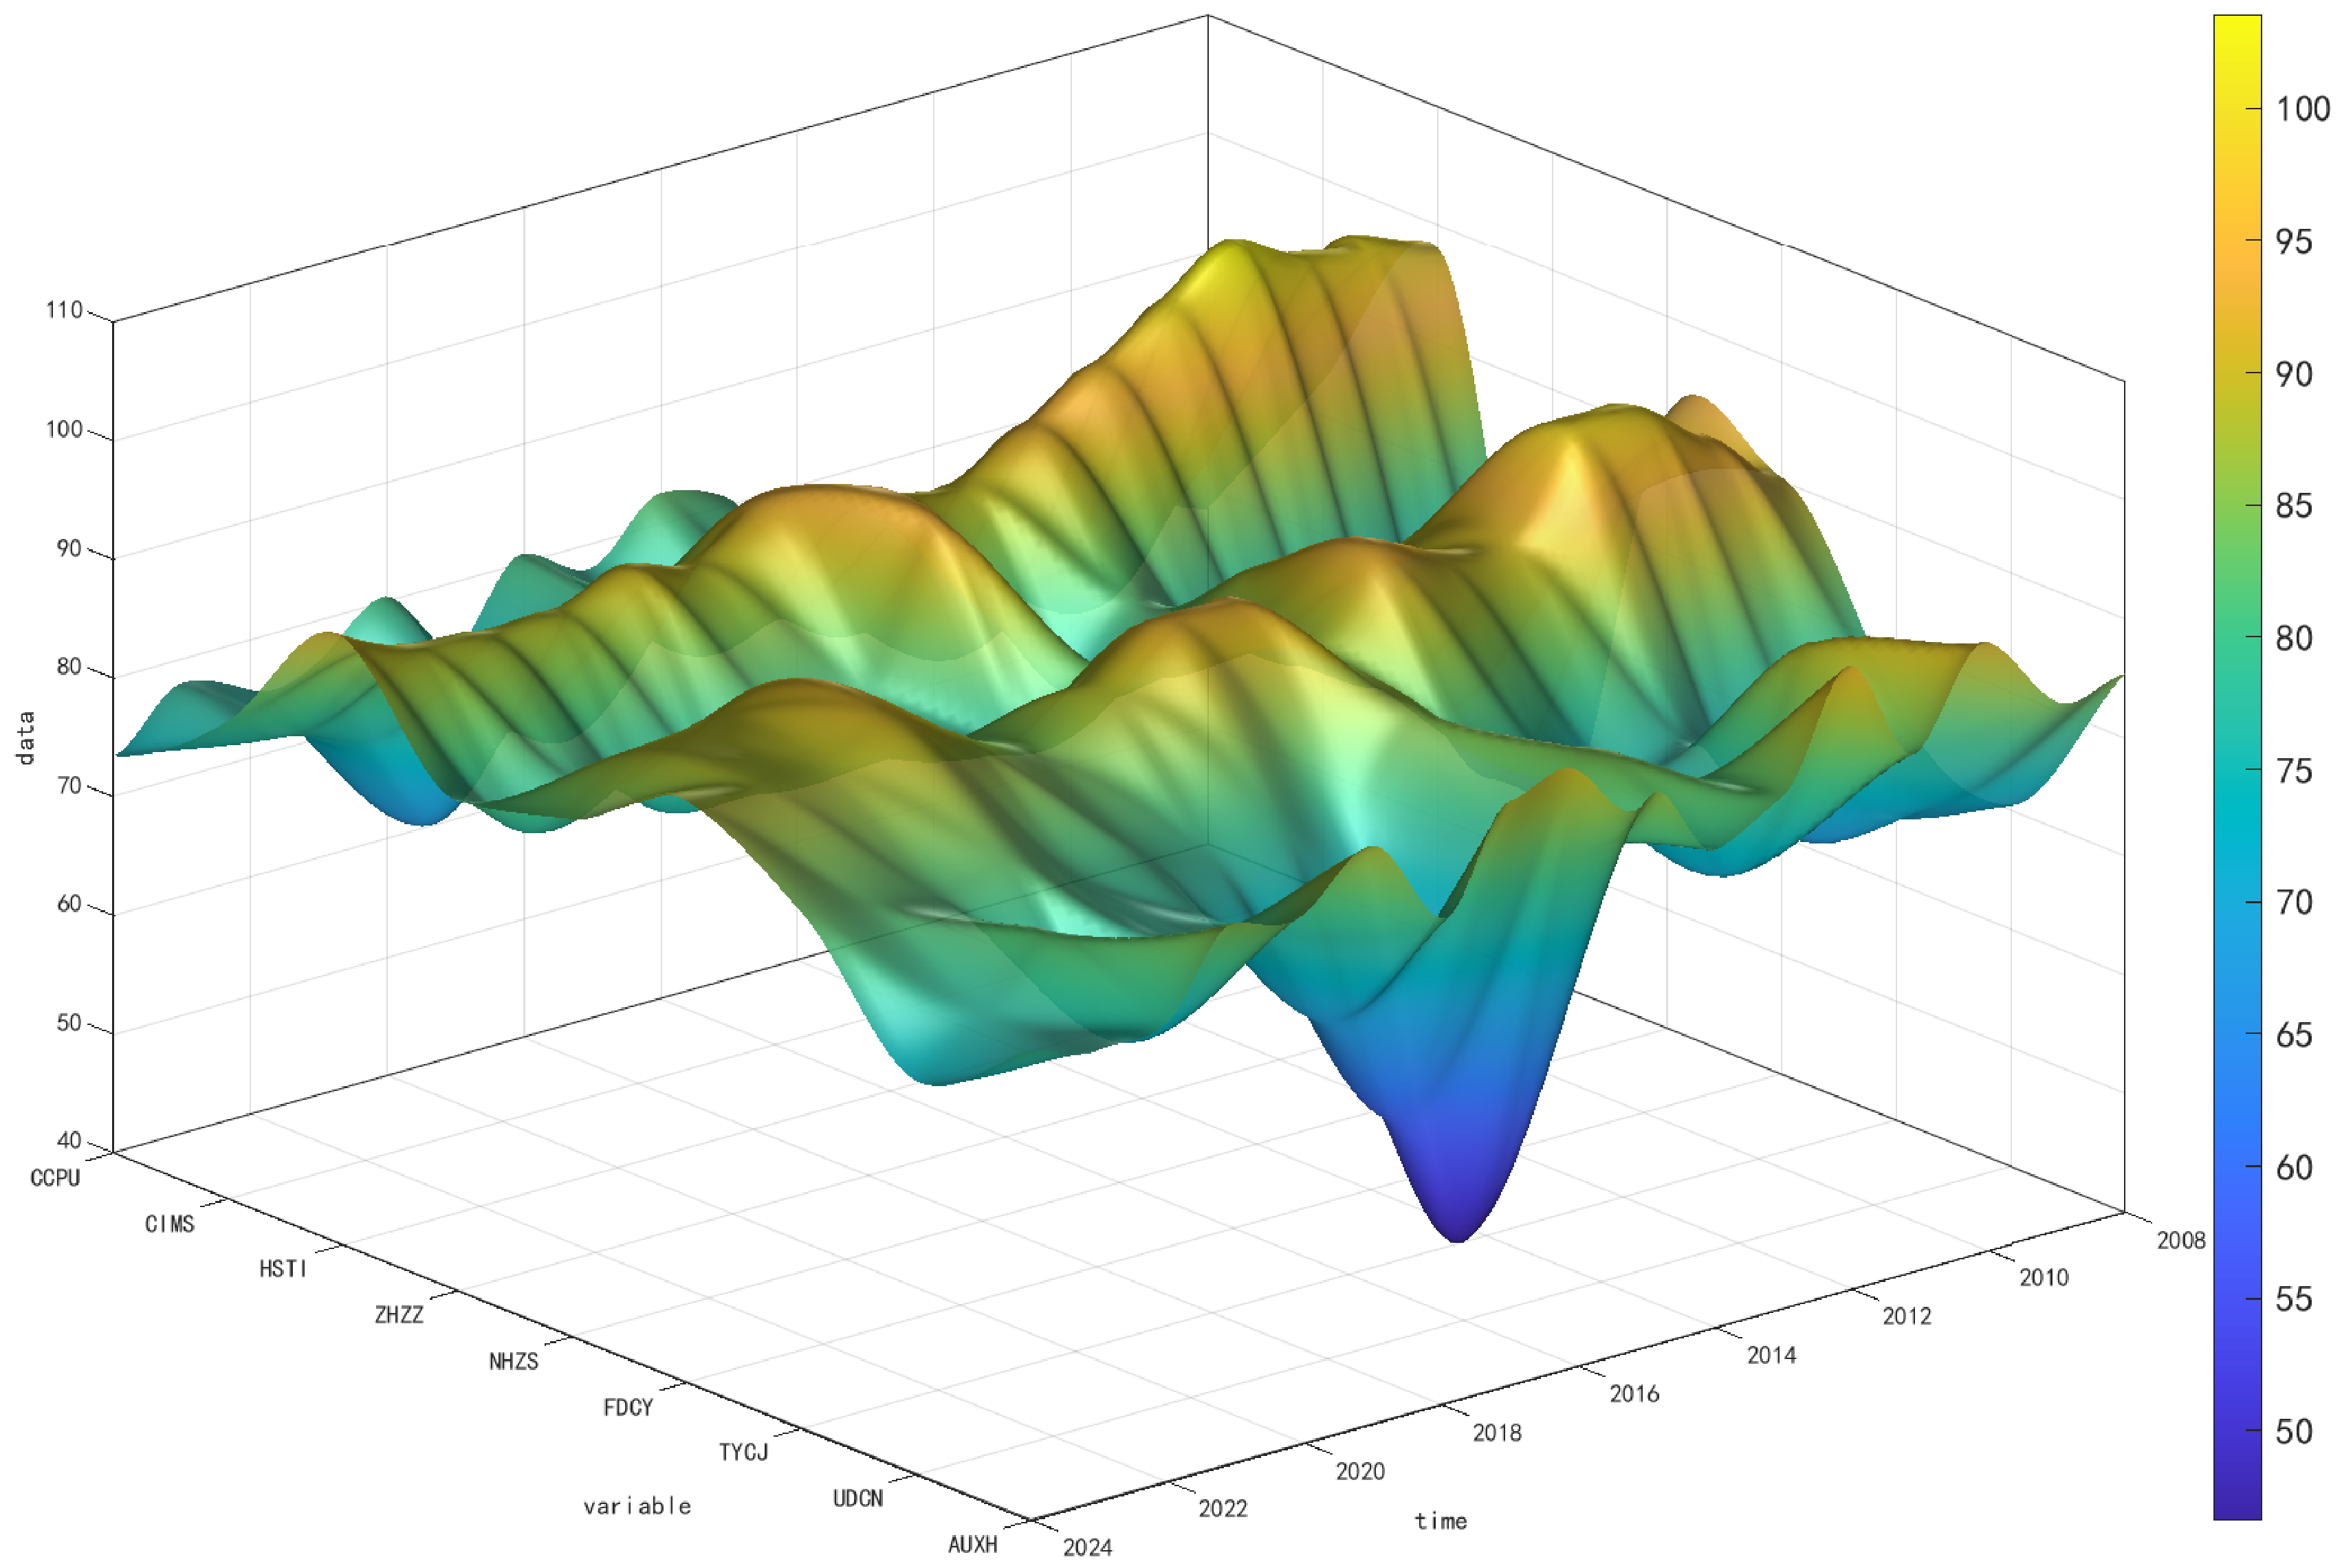
Figure 4 illustrates the distribution of risk spillover levels across various variables under normal market conditions. In this figure, the horizontal axis denotes time, the vertical axis lists the variables, and both the surface height and the color gradient collectively indicate the intensity of risk spillover. Colors tending toward deep purple represent lower risk spillover levels, whereas colors approaching bright yellow signify higher risk spillover levels. From the temporal dimension, the risk spillover level exhibits pronounced periodic fluctuation characteristics throughout the sample period. Specifically, an overall upward trend in risk spillover is observed from 2008 to 2013, followed by a retrenchment during the 2014–2019 period. A renewed escalation commences after 2019, culminating in a peak within the sample interval in 2021, which is demarcated as a yellow high-value region, before gradually receding thereafter. From the variable dimension, although the risk spillover levels of distinct variables display heterogeneity within the same time frame, their overall trajectory remains consistent with the fluctuations observed along the temporal dimension.
Figure 4.
Risk Spillover of Variables Under Normal Conditions.
4.2.3. Risk Spillover of Variables Under Extreme Conditions
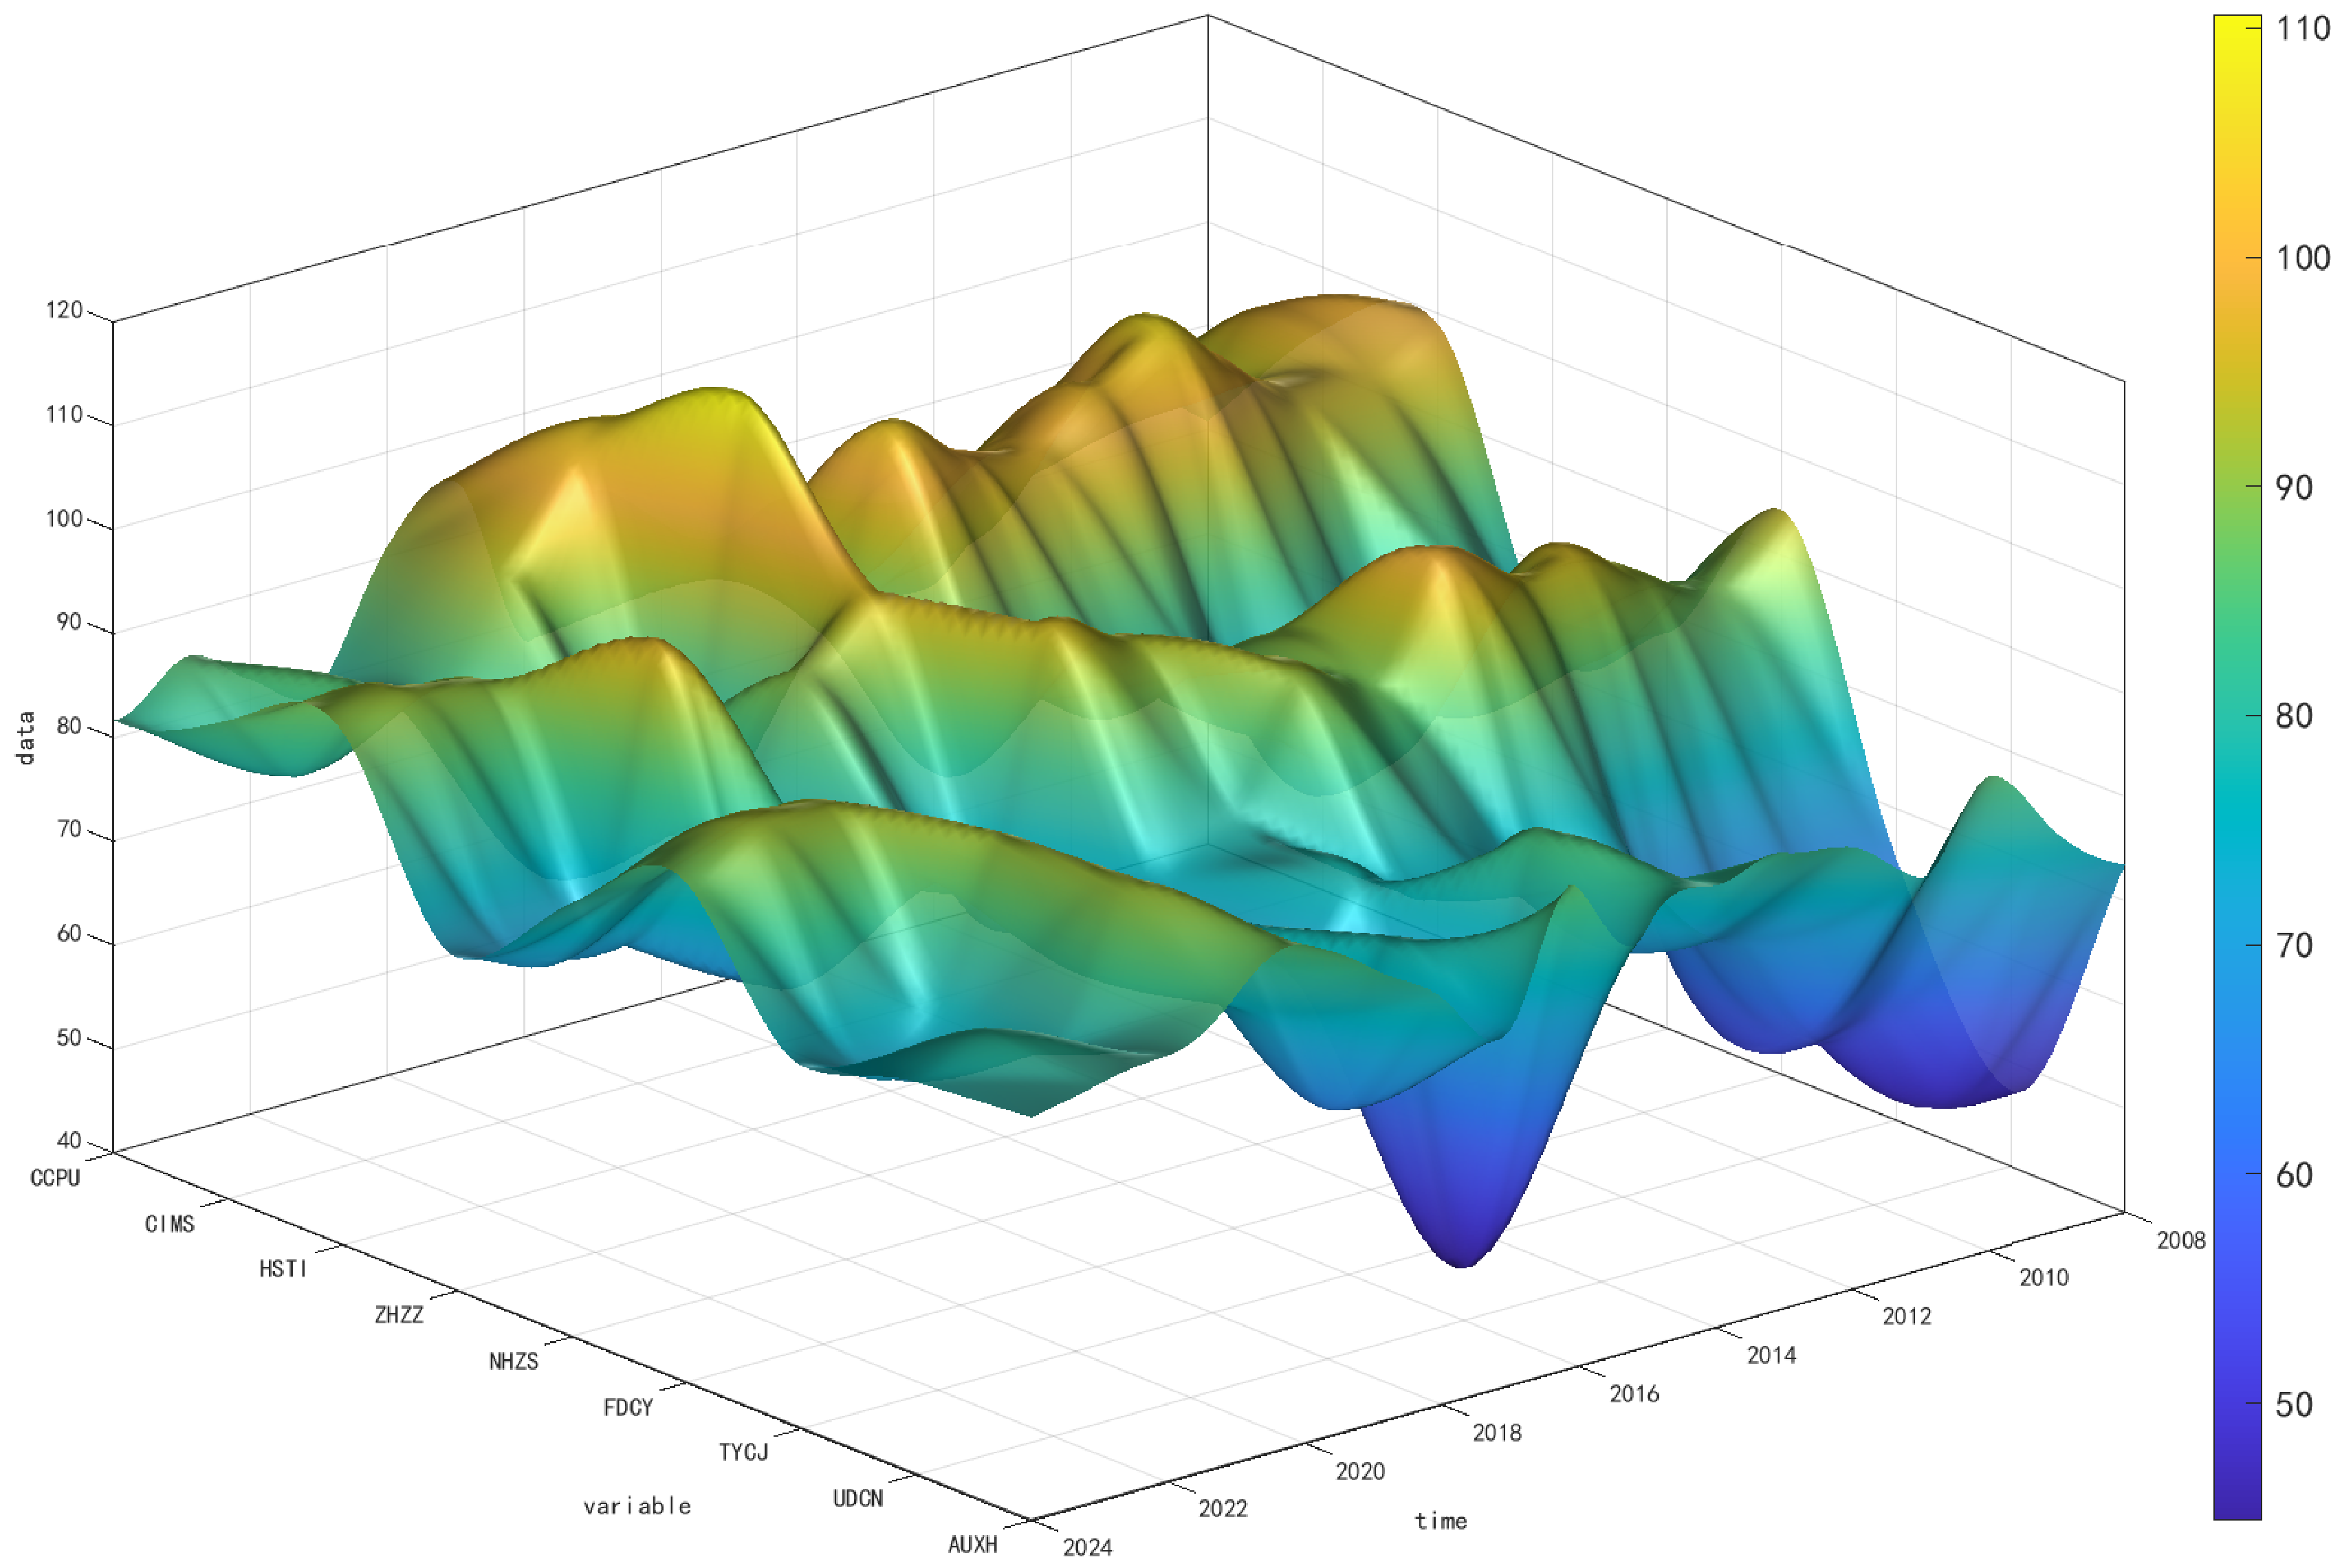
Figure 5 depicts the distribution of risk spillover levels across various variables under extreme upward market conditions. From the temporal dimension, the risk spillover level throughout the sample period predominantly resides within a moderately high to high range of 60% to 100%, exhibiting a gradual upward trajectory. Prior to the signing of the Paris Agreement in 2015, asset price appreciation remained moderate, trading activity was relatively limited, and investor sentiment exhibited subdued volatility, resulting in comparatively weaker intensity of risk transmission among variables. Following 2015, the implementation of climate policies delineated explicit constraints for the transition of high-carbon industries and defined developmental pathways for low-carbon sectors. Under extreme upward conditions, the rapid escalation of asset prices amplified the efficiency of risk transmission, which, compounded by market expectations of climate policy dividends, propelled risk spillovers to recurrently attain elevated ranges. Since 2020, as global climate policy has entered a phase of deepening implementation, risk spillovers have stabilized within a fluctuating band of 80% to 90%. Although the market persists in an extreme upward state during this period, the gradual clarification of detailed implementation rules for climate policies has prevented a further amplification of risk linkages among variables, yet has also precluded a significant retrenchment.
Figure 5.
Risk Spillover of Variables Under Extreme Upward Condition.
From the variable dimension, the heterogeneity of risk spillovers across different variables is significantly influenced by CPU shocks. Under extreme upward market conditions, CPU directly precipitates rapid capital reallocation between high-carbon and low-carbon assets, whereby shifts in trading behavior amplify the efficiency of risk transmission. Furthermore, policy incentives directed toward low-carbon industries propel the valuation expansion of related assets, thereby intensifying spillover effects onto other variables. The transmission of market expectations regarding climate policy dividends, mediated through price and trading indicators, exhibits a certain temporal lag. Conversely, production curtailment and emission reduction policies targeting high-carbon industries directly impinge upon the earnings expectations of relevant enterprises, thereby inducing fluctuations in the risk spillover levels associated with climate policy uncertainty.
Figure 6 presents the distribution of risk spillover levels across various variables under extreme downward market conditions. From the temporal dimension, the risk spillover level predominantly resides within a range of 70% to 100%. Around 2008, risk spillover remained within an elevated range exceeding 90%. During this period, the global climate policy framework had yet to be clearly defined, and the market insufficiently priced in the policy risks associated with high-carbon industries. The extreme downturn triggered by the global financial crisis, compounded by the uncertainty stemming from the ambiguous direction of climate policy, coupled with tightening liquidity that further amplified risk transmission, resulted in a mutual reinforcement of pessimistic investor sentiment and policy uncertainty, collectively driving risk spillovers to heightened levels. Following the signing of the Paris Agreement in 2015, risk spillover receded to a relatively lower level. The core mechanism underlying this decline resides in the substantial reduction in uncertainty engendered by the clarified direction of climate policy. Policy incentives directed toward low-carbon industries partially offset the impact of extreme downward shocks, while policy-driven demand for long-term capital allocation contributed to the convergence of market volatility. Consequently, the intensity of risk transmission among variables diminished in tandem with the decline in policy uncertainty. Since 2020, risk spillover has stabilized within a fluctuating band of 70% to 90%. During this phase, climate policy has engendered new forms of uncertainty: the tightening of emission reduction targets has escalated the transition costs for high-carbon industries, and the tapering of policy subsidies has adversely impacted the earnings expectations of low-carbon assets, leading to recurrent fluctuations in commodity risk spillovers. The safe-haven attributes of the gold market provide only partial buffering against these shocks, thereby sustaining the overall risk spillover within a moderately high to high range.
Figure 6.
Risk Spillover of Variables Under Extreme Downward Conditions.
From the variable dimension, CPU amplifies the heterogeneity of risk spillovers across different variables. Policy uncertainty rapidly escalates risk exposures, thereby constituting a core source of risk transmission under extreme downward market conditions. The earnings expectations of high-carbon enterprises fluctuate in tandem with policy uncertainty, and the associated risks are subsequently transmitted to equity assets. As CPU intensifies, the safe-haven and long-term allocation attributes of the gold market and the bond market become increasingly pronounced, thereby rendering their buffering effect on risk transmission more conspicuous. When the direction of climate policy remains ambiguous, pessimistic investor sentiment exacerbates risk contagion; conversely, policy clarity serves to moderate sentiment and attenuate risk transmission.
4.3. Financial Market Risk Forecasting Analysis
To examine the predictive capabilities of different modeling paradigms for the total TCI derived from the QVAR-DY model, this study selects eight models for systematic comparison. At the level of traditional statistical models, the Persistence model and the HistMean model are introduced as lower-bound benchmarks for prediction evaluation, serving to determine whether complex models offer incremental predictive value beyond simple extrapolation. Additionally, the ARIMA model is included as a representative of the classical time series modeling paradigm to test the ability of linear autoregressive structures to capture the temporal dynamics of the TCI. At the machine learning model level, two gradient boosting ensemble learning models—XGBoost and LightGBM—are selected to leverage their strong nonlinear approximation capabilities, high robustness to noisy data, and superior computational efficiency in capturing the potentially complex nonlinear mapping relationships embedded in the TCI series. At the deep learning model level, LSTM is selected to capture the long-term temporal dependencies of the TCI series; BiLSTM, through its bidirectional recurrent structure, extracts both forward and backward temporal information simultaneously, enhancing the modeling capacity for sequential contextual features; and CNN employs convolutional kernels to extract local morphological features and short-term fluctuation patterns from the series.
4.3.1. Model Parameter Settings
Following the methodological approach of Ouyang Zisheng et al. [20], the total risk spillover values under both normal and extreme market conditions, as estimated by the QVAR-DY model, serve as the input variables. The entire sample is partitioned into training, validation, and test sets according to a ratio of 7:2:1, which are respectively employed for fitting the data sample, tuning model hyperparameters, and evaluating model generalization capability. The partitioning of the training, validation, and test sets remains consistent across all models. The model parameter configurations are presented in Table 5.
Table 5.
Machine Learning Model Parameter Settings.
4.3.2. Predictive Performance of TCI Under Normal Conditions
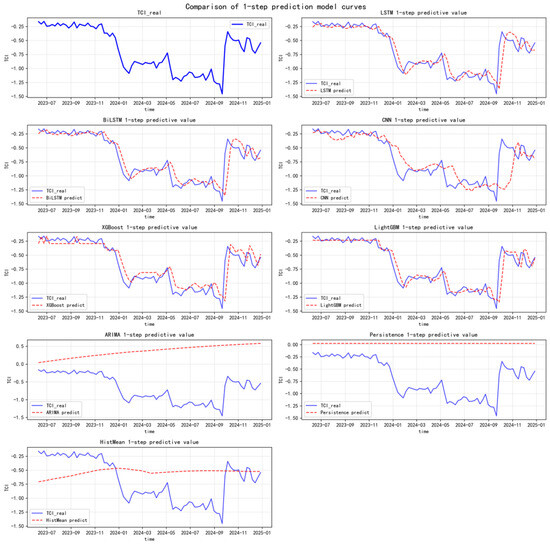
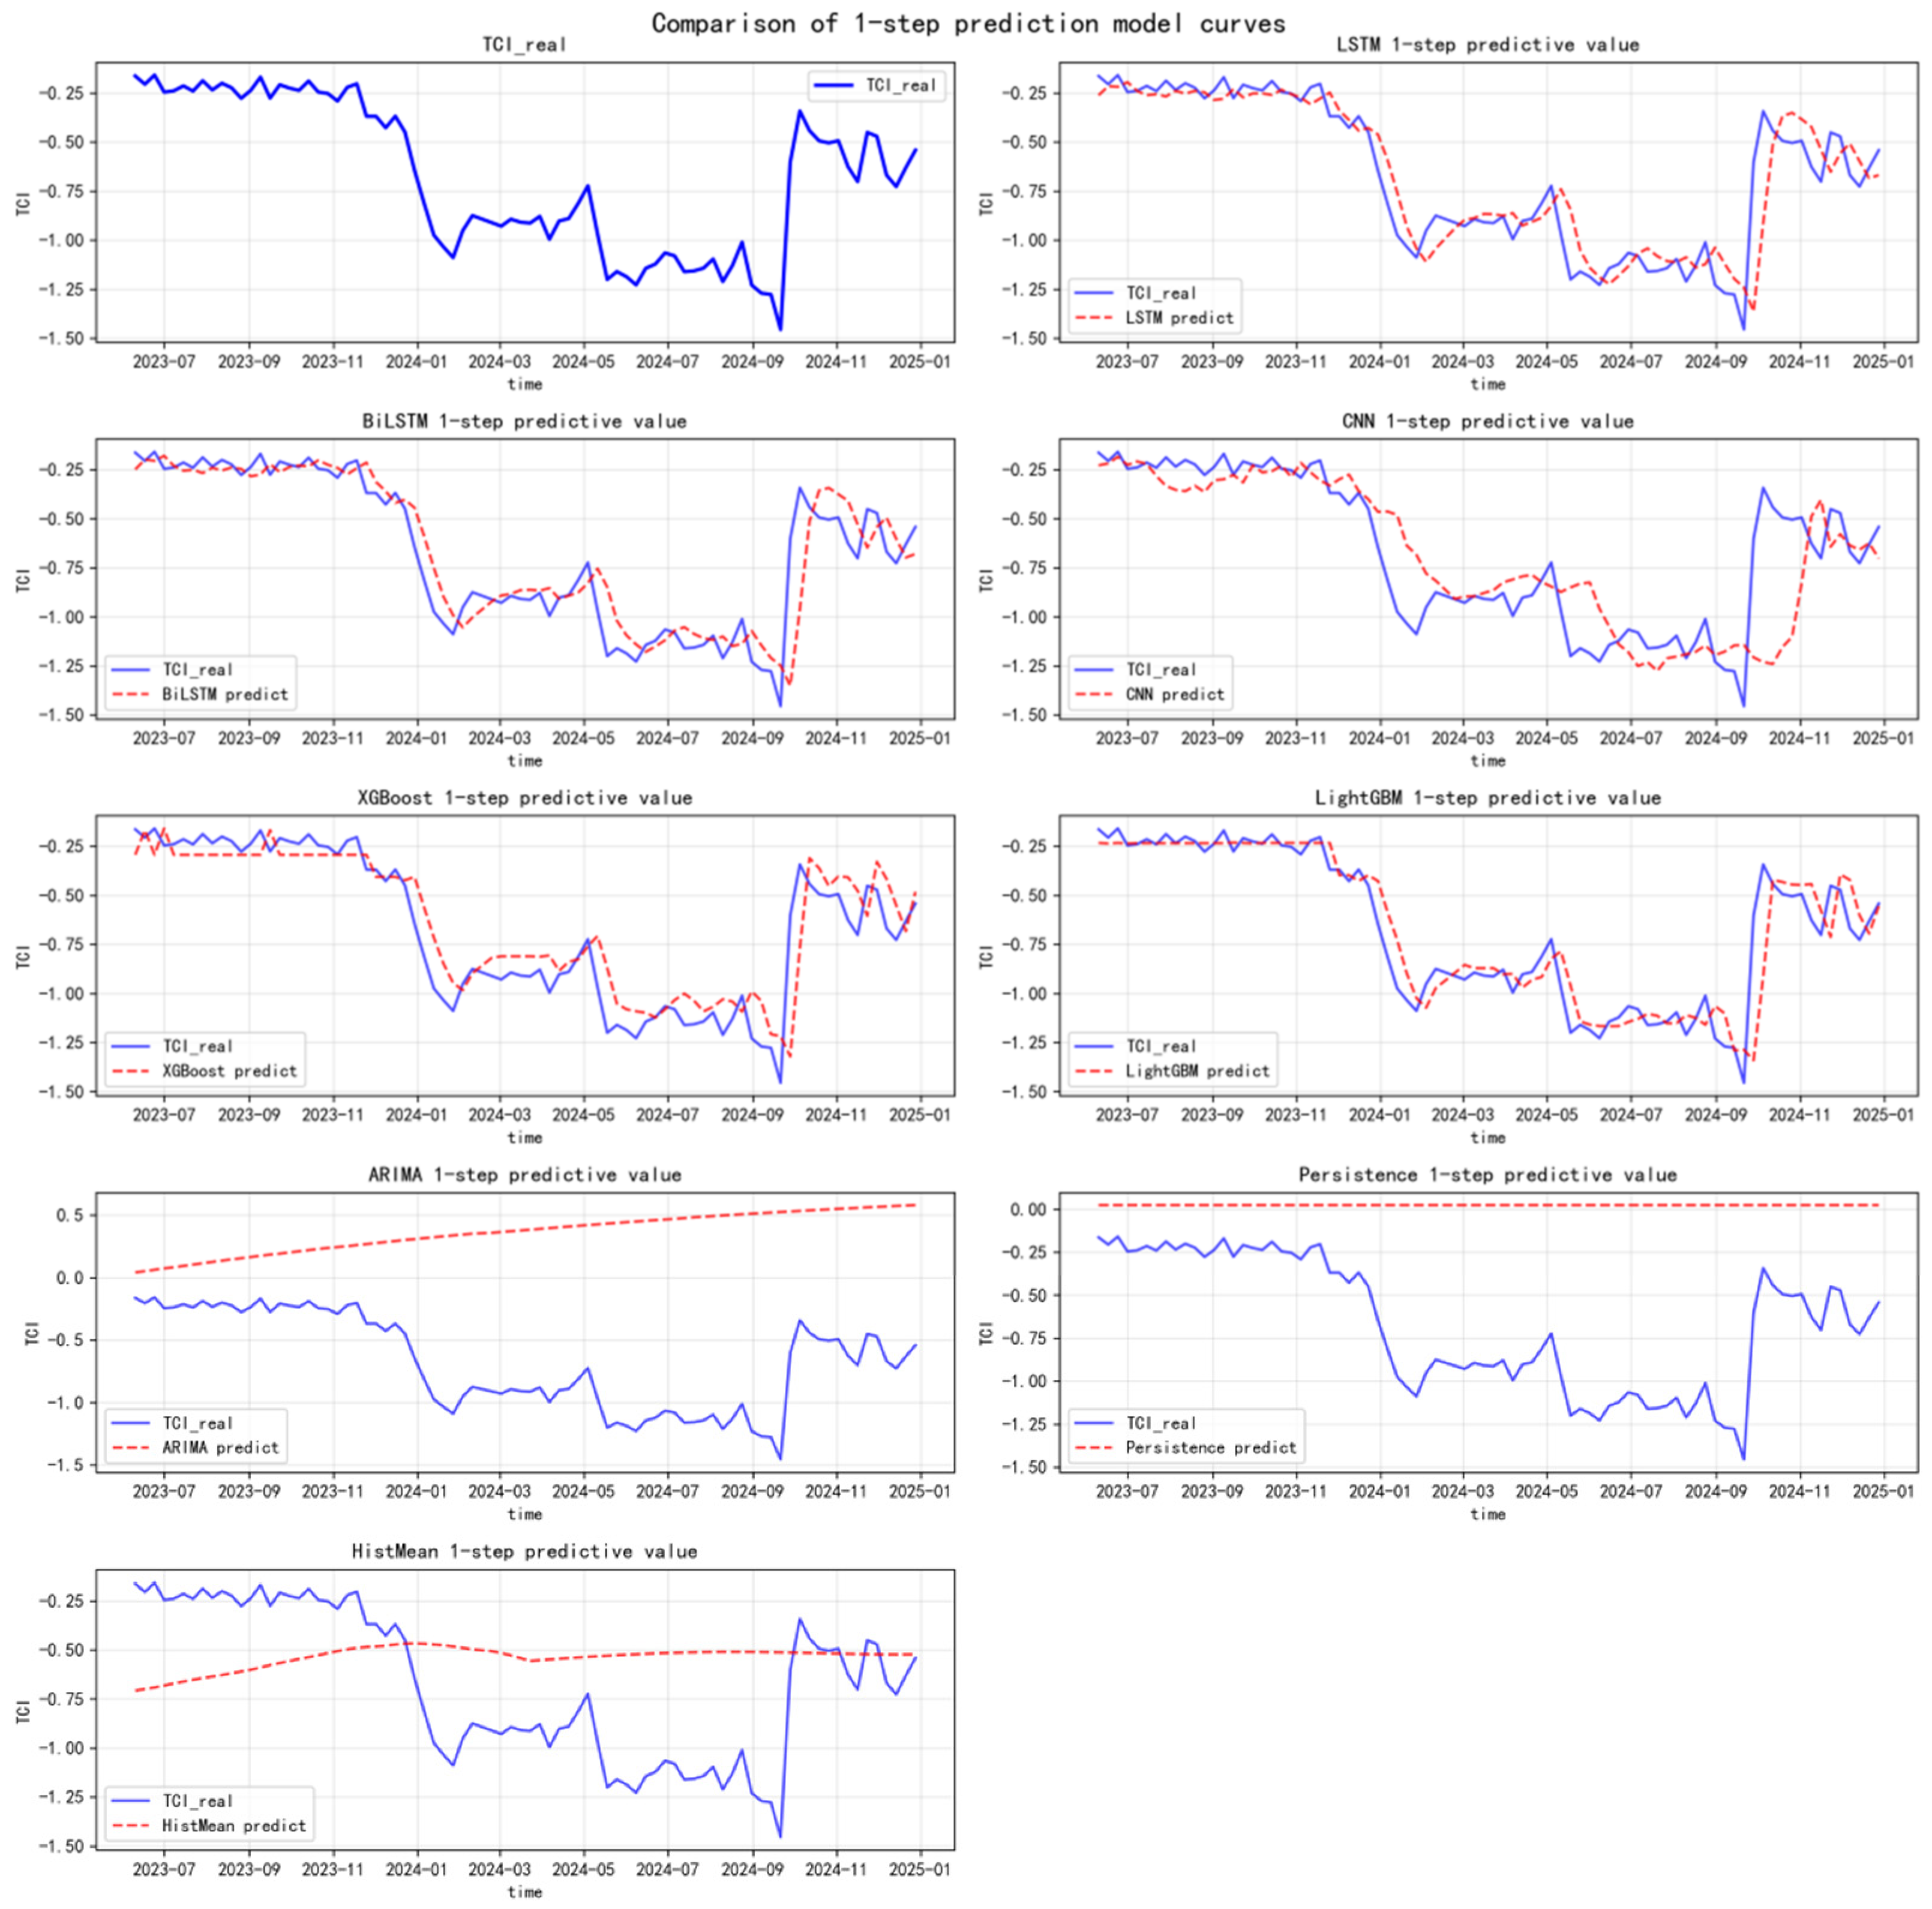
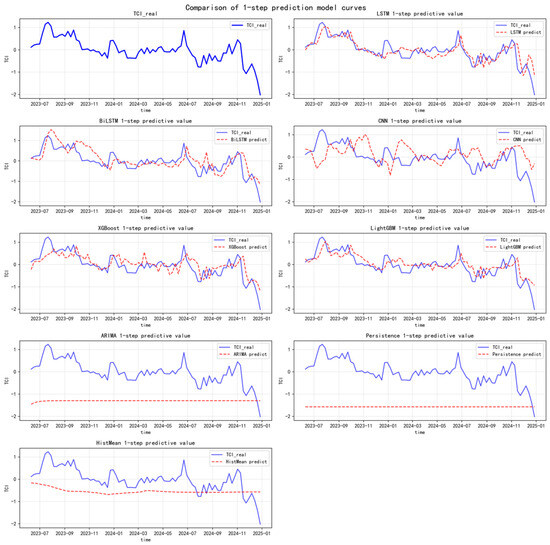
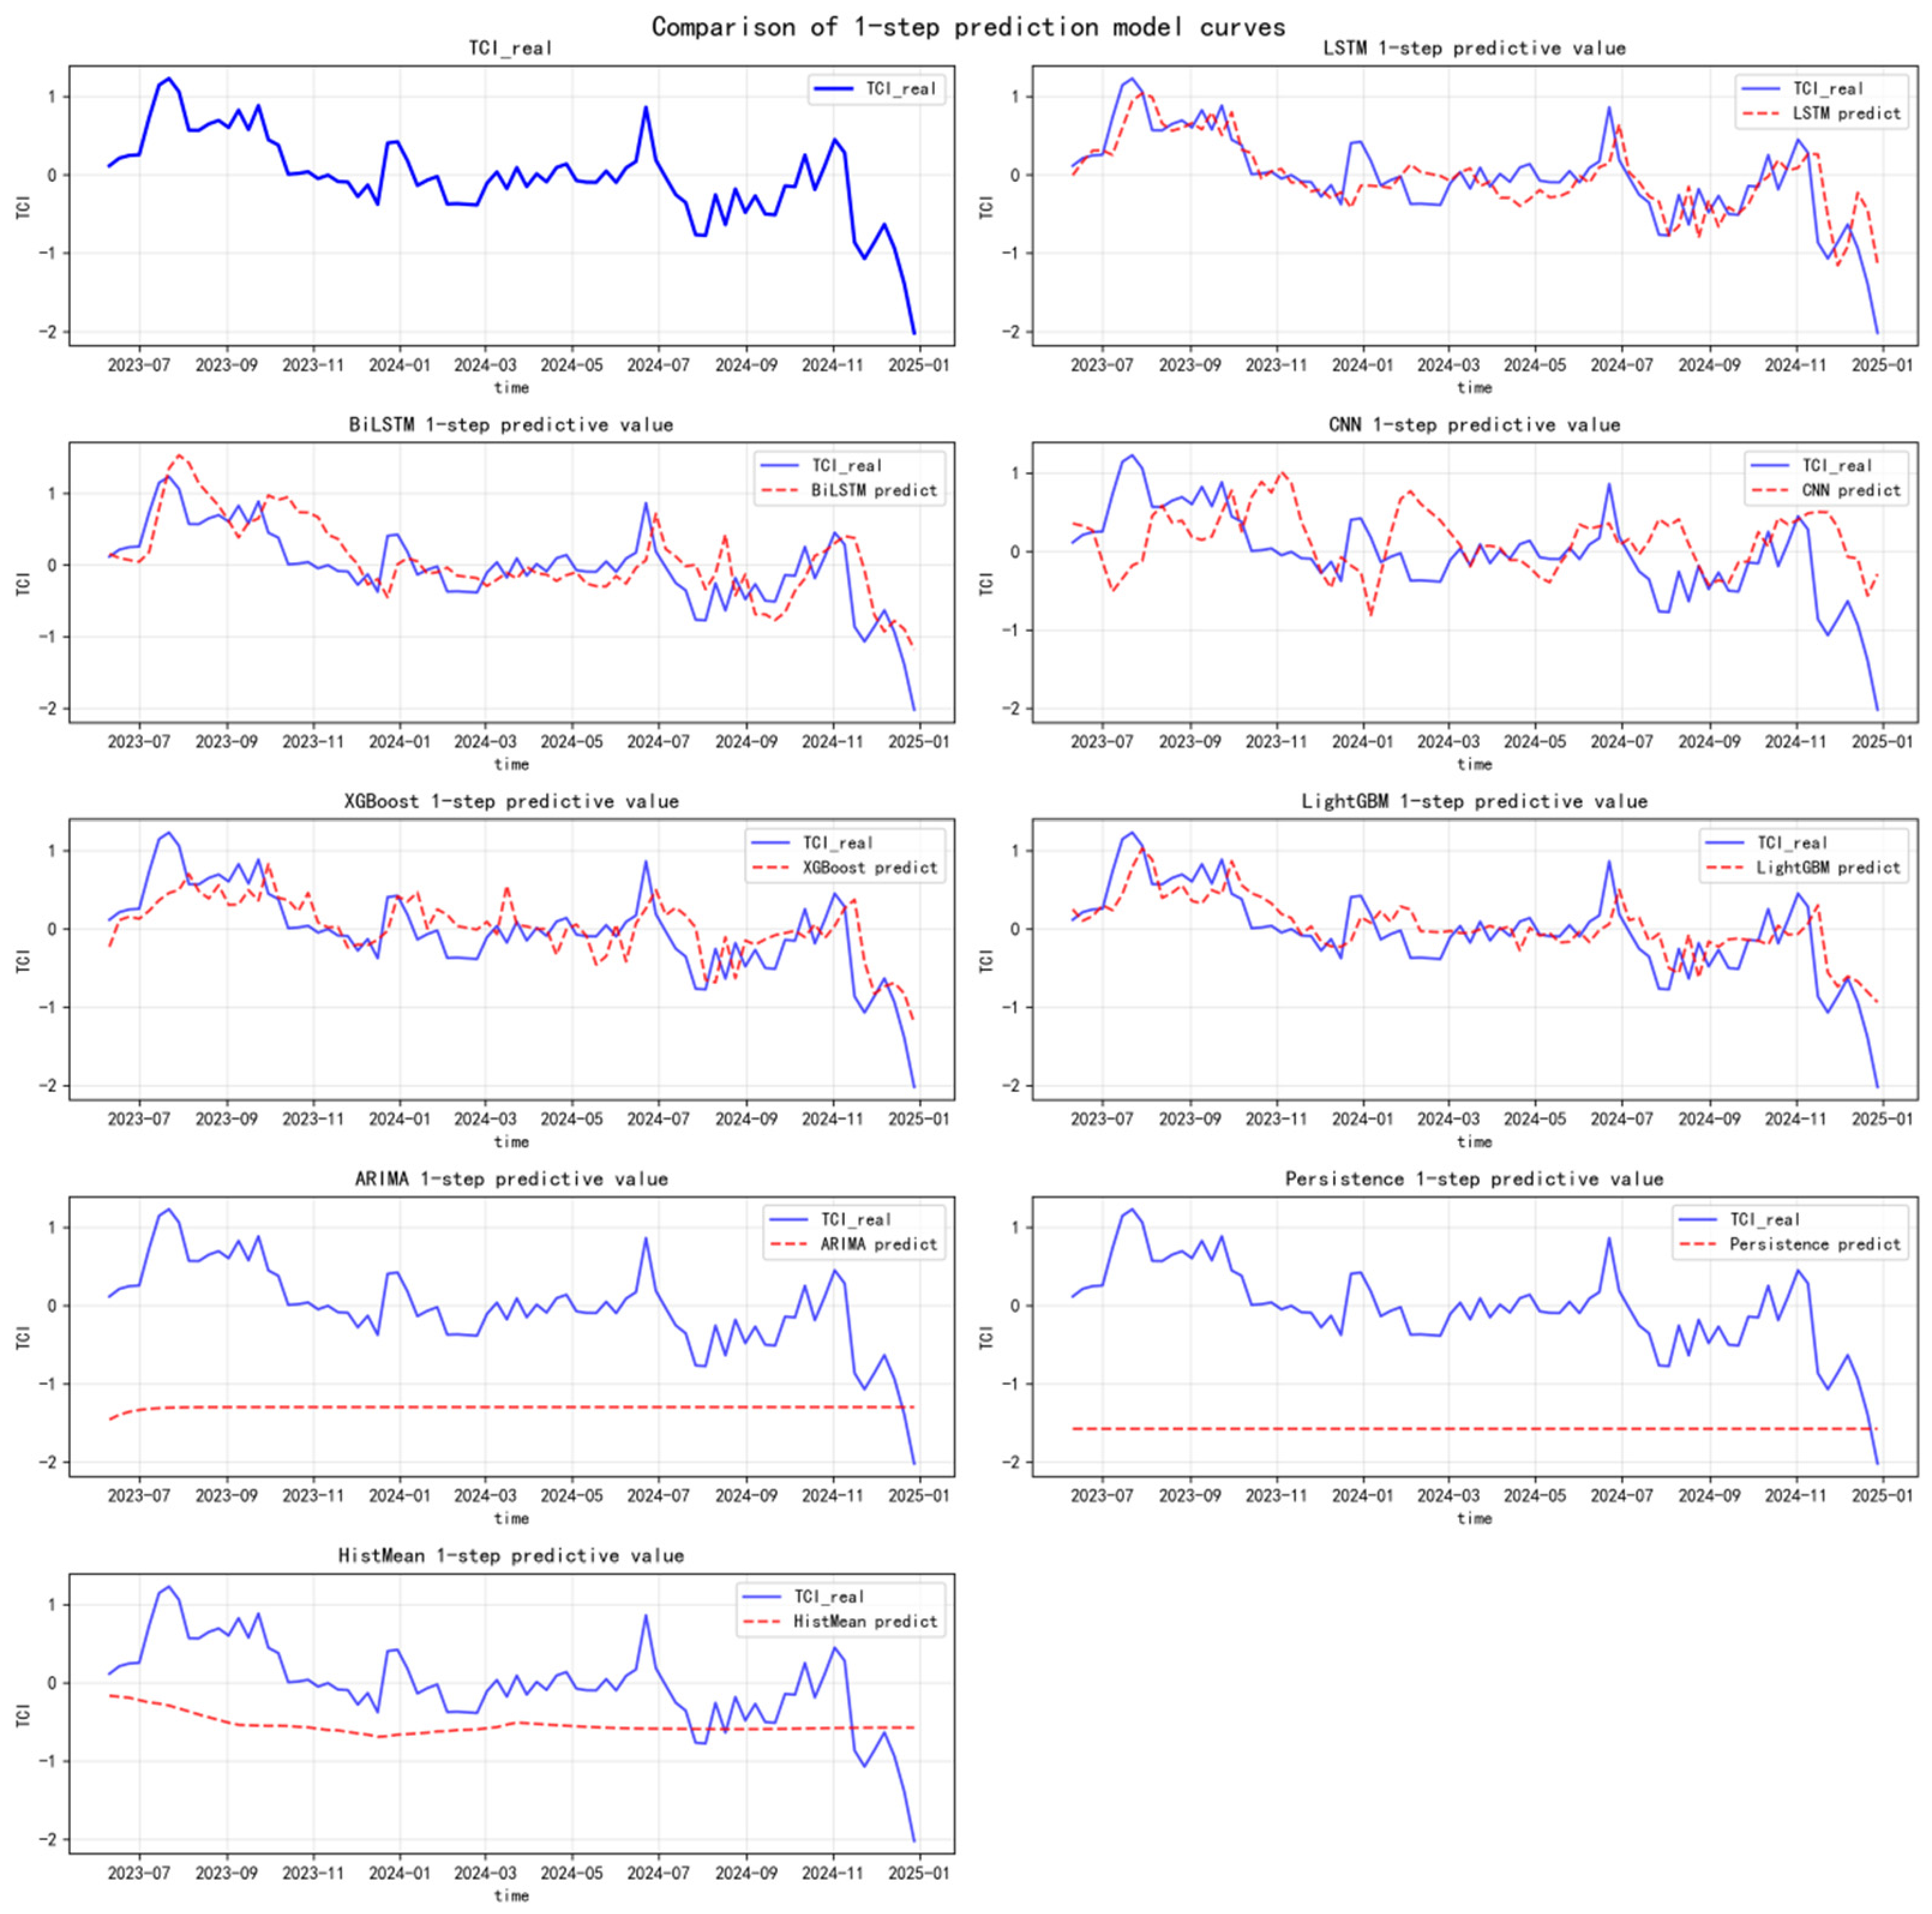
Figure 7 presents the forecast curves of each model under normal market conditions for a forecast horizon of one day. Table 6 compares the predictive performance of the models based on four evaluation metrics: MAE, MSE, RRSE, and CORR. MAE and MSE reflect absolute prediction errors, RRSE provides comparability of accuracy on a relative scale, and CORR measures the consistency between the predicted trend and the actual values. As can be observed from Figure 7, the LightGBM model exhibits superior fitting performance at curve peaks and within regions characterized by dense fluctuations, thereby demonstrating enhanced predictive accuracy.
Figure 7.
1-Step Ahead Prediction Curve of Total Risk Spillover Under Normal Conditions.
Table 6.
Evaluation Results of TCI Prediction Under Normal Conditions.
The one-step-ahead prediction results under normal conditions in Table 6 show that the LightGBM model achieves the best performance, with the lowest MAE (0.086), MSE (0.020), and RRSE (0.372) among all models, and the highest CORR (0.930). BiLSTM and XGBoost also exhibit excellent performance, with CORR values of 0.919 and 0.919, respectively. Among the traditional statistical models, ARIMA yields an MAE of 1.031 and a CORR of −0.662, Persistence yields a CORR of 0.000, and HistMean yields a CORR of −0.506, indicating that none of these three models can effectively predict the dynamic changes in TCI. The five-step-ahead prediction results are also presented in the table for reference.
To further assess the statistical significance of the predictive performance of the LightGBM model, Table 7 presents the results of the Diebold-Mariano (DM) test, employing MAE and MSE as the respective loss functions. All DM statistics are significantly positive at the 10% level or higher, indicating a significant difference in prediction accuracy between LightGBM and the other models. Specifically, when MSE is used as the loss function, LightGBM significantly outperforms CNN at the 1% level, BiLSTM at the 5% level, and XGBoost and LSTM at the 10% level. Additionally, LightGBM significantly outperforms ARIMA, Persistence, and HistMean at the 1% level. When MAE is used as the loss function, the advantage of LightGBM remains significant, with all DM statistics significantly positive at the 1% level. Among these, the DM value for LightGBM compared with BiLSTM is 3.047, and compared with CNN is 3.836, with the advantages over the traditional statistical models being even more pronounced. The above results indicate that the predictive performance of LightGBM under normal conditions is not only numerically superior to that of the other models but also statistically significant.
Table 7.
DM Test Results Under Normal Conditions.
4.3.3. Predictive Performance of TCI Under Extreme Conditions
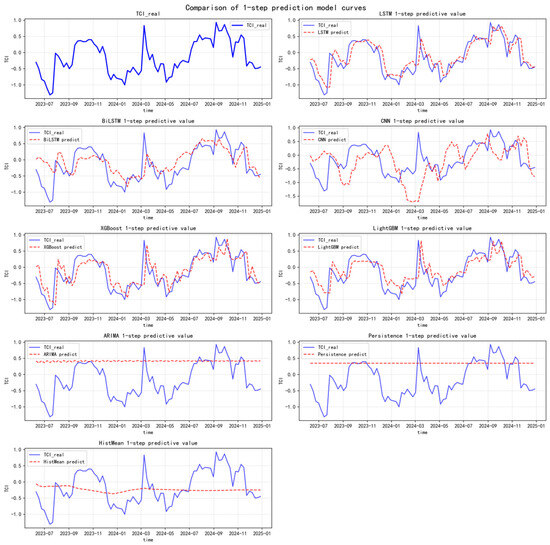
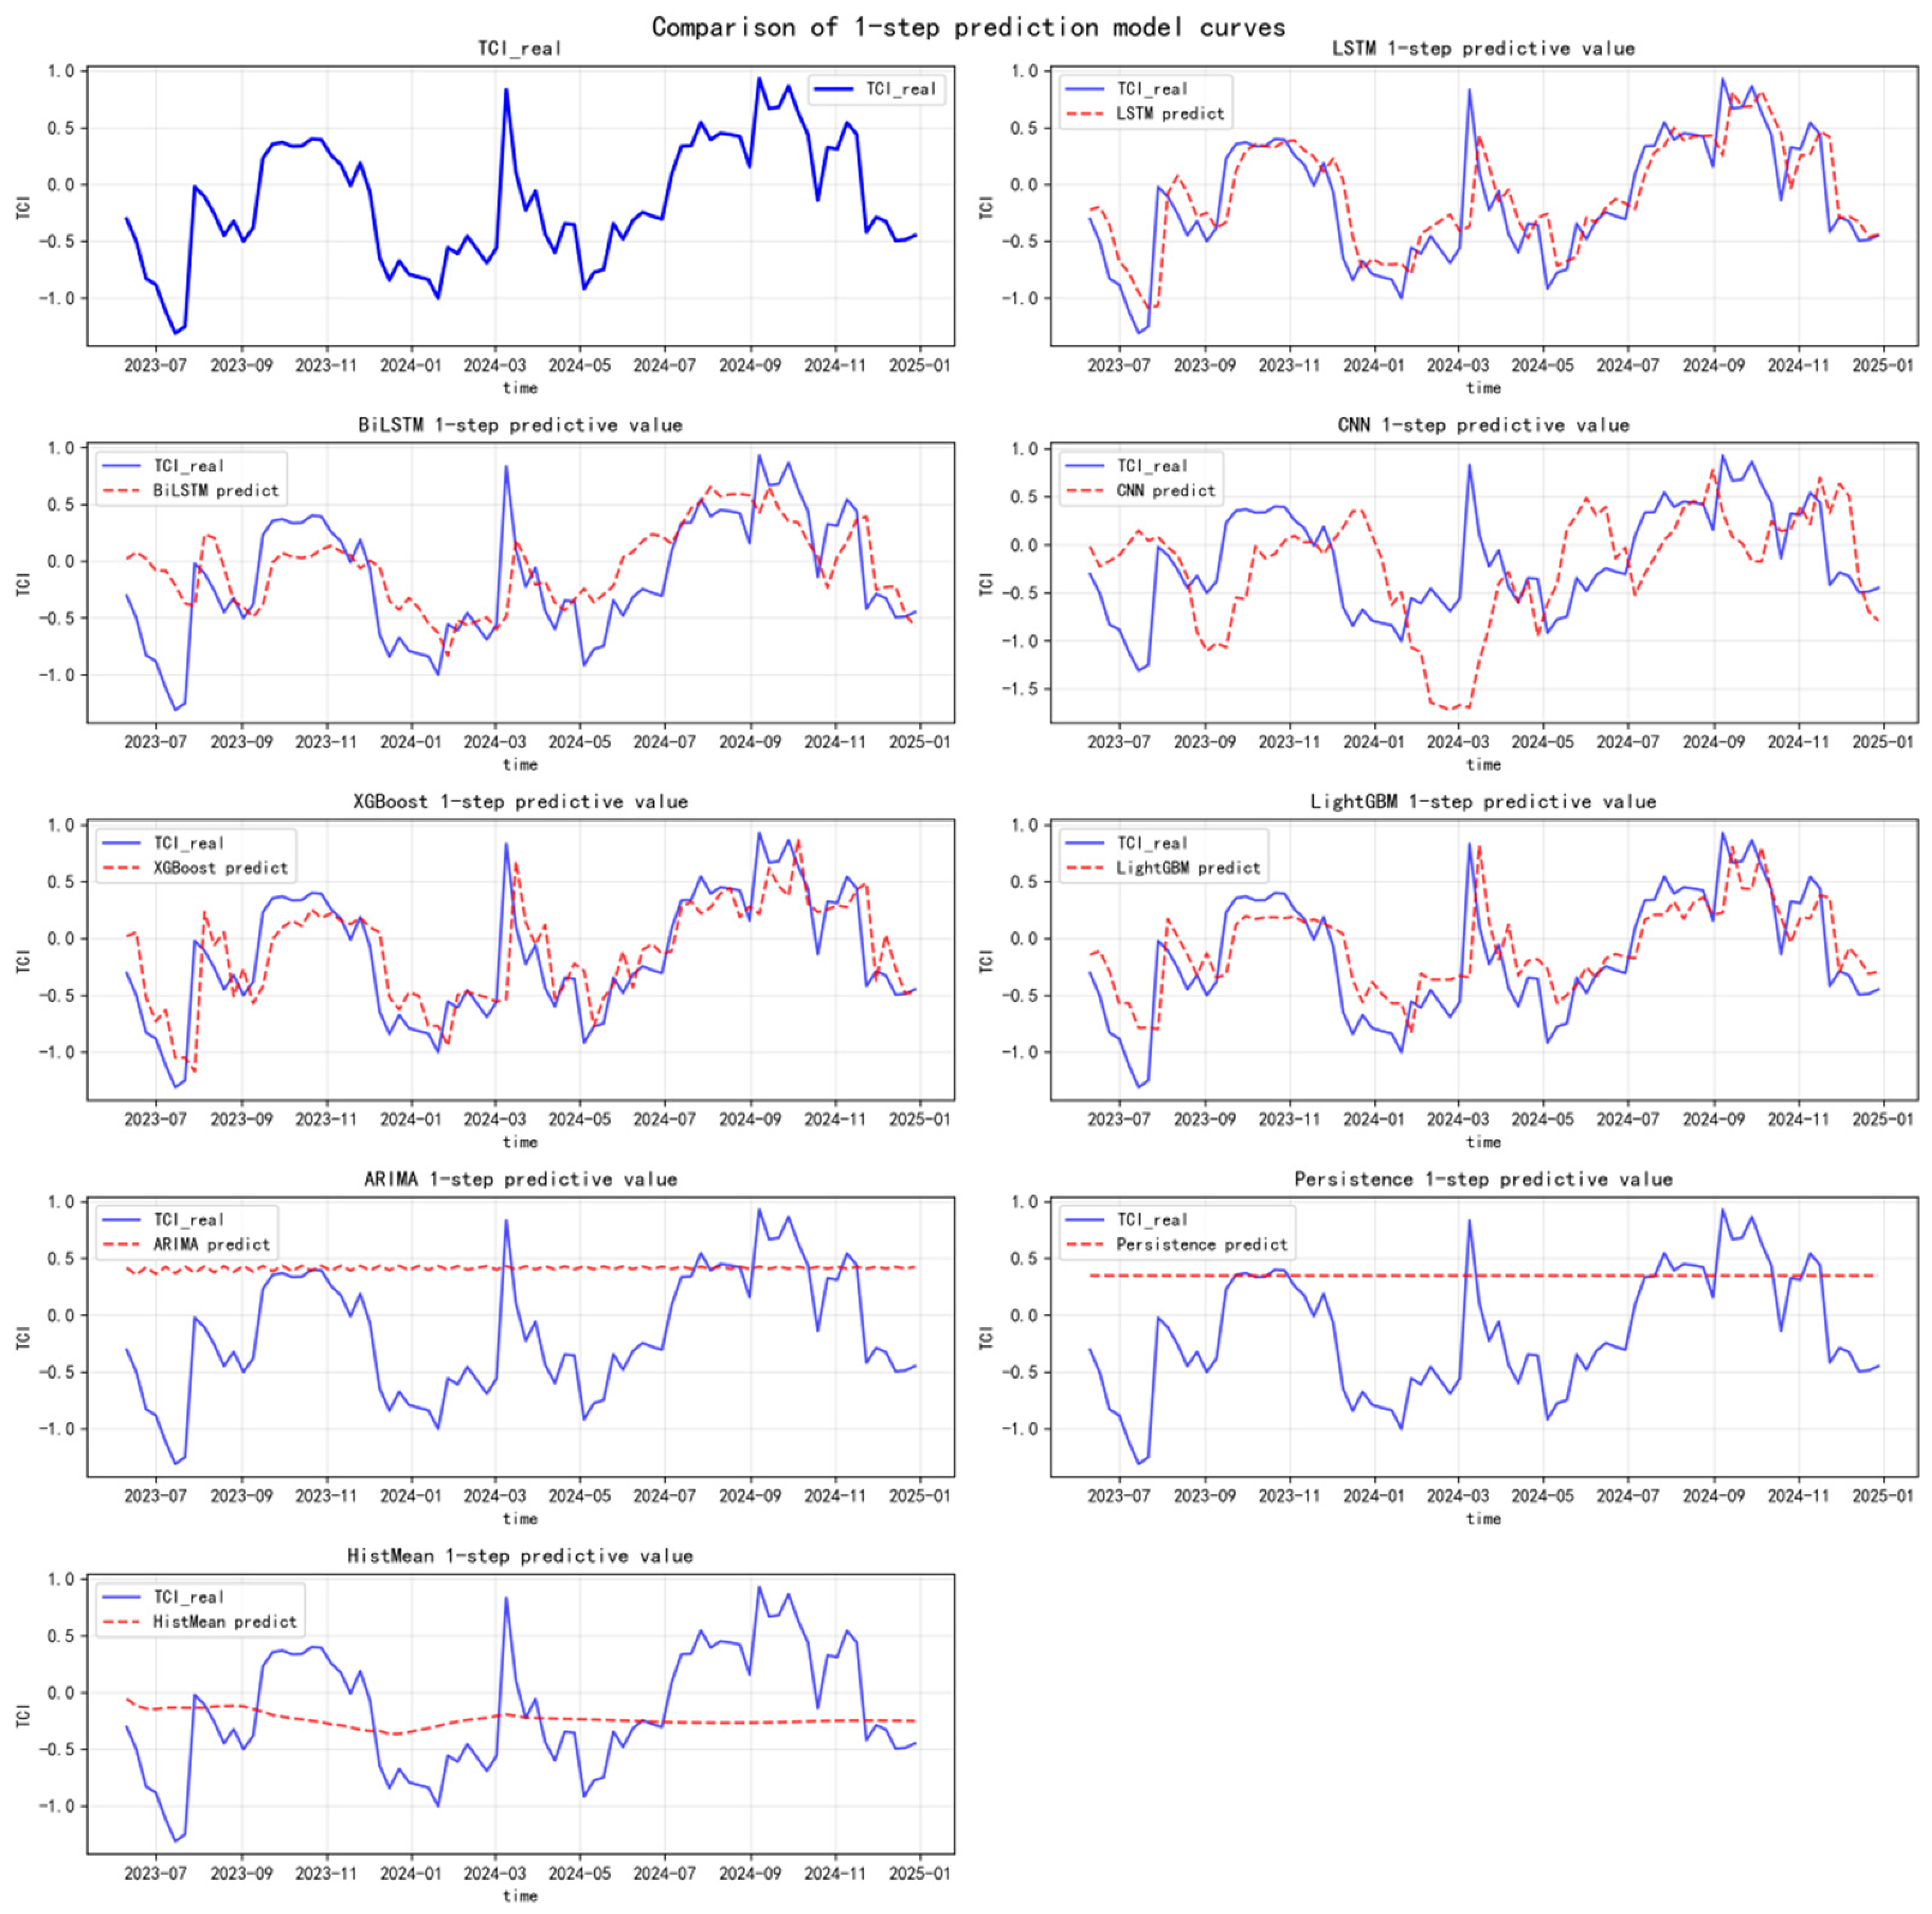
Figure 8 and Figure 9 present the forecast curves of each model under extreme upward and extreme downward market conditions, respectively, for a forecast horizon of one day. Table 8 compares the predictive performance of the models using MAE, MSE, RRSE, and CORR metrics. As can be observed from the figures, the LSTM model exhibits superior fitting performance at curve peaks and within regions characterized by dense fluctuations, thereby demonstrating enhanced predictive accuracy.
Figure 8.
1-Step Ahead Prediction Curve of Total Risk Spillover Under Extreme Upward Conditions.
Figure 9.
1-Step Ahead Prediction Curve of Total Risk Spillover Under Extreme Downward Conditions.
Table 8.
Evaluation Results of TCI Prediction Under Extreme Conditions.
In the one-step-ahead forecasting exercise under extreme upward market conditions, the LSTM achieves the best performance, with the lowest MAE (0.226), MSE (0.104), and RRSE (0.609) among all models, as well as the highest CORR (0.805), indicating superior numerical fitting accuracy and directional alignment. XGBoost and LightGBM significantly outperform CNN in predictive performance. Traditional statistical models perform poorly overall, further validating the failure of linear models and naive benchmarks in extreme market environments. The five-step-ahead prediction results are also presented in the table for reference.
In the one-step-ahead forecasting exercise under extreme downward market conditions, the LSTM again outperforms the other models, achieving the lowest MAE (0.261), MSE (0.125), and RRSE (0.654) among all models, as well as the highest CORR (0.759). Traditional statistical models continue to exhibit poor performance under the extreme downside state. For instance, ARIMA yields an MAE of 1.304 and a CORR of only −0.129, indicating substantially inadequate predictive capability.
Table 9 presents the results of the DM test, which employs MAE and MSE as the respective loss functions to assess the statistical significance of the predictive performance of the LSTM model. Under extreme upward conditions, when MSE is used as the loss function, LSTM significantly outperforms LightGBM at the 10% level, and significantly outperforms BiLSTM, CNN and XGBoost at the 1%, 1%, and 5% levels, respectively. When MAE is used as the loss function, all DM statistics are significantly positive at the 10% level or higher. Under extreme downward conditions, the predictive advantage of LSTM is even more pronounced. Regardless of whether MSE or MAE is used as the loss function, all DM statistics are significantly positive at the 10% level or higher, with the exception of the comparisons with XGBoost and LightGBM under MSE and with LightGBM under MAE, which are not statistically significant. Furthermore, the DM statistics for LSTM compared with the three traditional statistical models—ARIMA, Persistence, and HistMean—are substantially higher than those for other comparison models under both extreme states, providing further evidence of the predictive failure of traditional linear models in extreme market environments.
Table 9.
DM Test Results Under Extreme Conditions.
4.4. Robustness Tests
This paper examines the robustness of the prediction results by replacing the core variable, adding additional machine learning methods, and altering the rolling window size. First, the China Climate Policy Uncertainty Index (CCPU) is replaced with the Global Climate Policy Uncertainty Index (GCPU), and the Transformer model is additionally included for prediction. The results are presented in Table 10. It can be observed that the predictive performance of the machine learning models is largely consistent with the results reported in Table 6 and Table 8, indicating that the findings are robust to the inclusion of additional machine learning methods and the replacement of the core variable.
Table 10.
Prediction Evaluation Results for TCI After Adding Machine Learning Methods and Replacing the Core Variable.
Second, by altering the rolling window size, this paper evaluates the predictive performance of the machine learning models using a short window of 30 days and a long window of 50 days, with the Transformer model also included. The results are presented in Table 11. A comparison reveals that, under normal conditions, LightGBM consistently achieves the best predictive performance across all forecasting tasks. Under extreme conditions, LSTM continues to maintain the best performance. The ranking of model performance remains consistent across the three window configurations, indicating that the results remain robust after adding additional machine learning methods and altering the rolling window size.
Table 11.
TCI Prediction Evaluation Results After Adding Machine Learning Methods and Changing the Rolling Window.
5. Conclusions and Policy Recommendations
5.1. Main Research Conclusions
This study employs the quantile-based spillover index methodology (QVAR-DY) to investigate the static and dynamic risk spillover effects among Climate Policy Uncertainty (CPU), investor sentiment, and seven major financial sub-markets in China under both normal and extreme market conditions. Furthermore, five machine learning models—LSTM, BiLSTM, CNN, XGBoost, and LightGBM—are applied to forecast and evaluate the total risk spillover index. The principal findings are summarized as follows.
First, with respect to static spillover effects, significant risk spillover effects exist among CPU, investor sentiment, and financial markets, with the total spillover level under extreme conditions substantially exceeding that observed under normal conditions. Under normal market conditions, the bond market and gold market function as the primary net transmitters of risk, whereas the stock market and commodity market serve as net recipients of risk. Under extreme market conditions, the bond market, real estate market, foreign exchange market, and gold market consistently act as net risk transmitters, while the stock market, commodity market, and money market persistently function as net risk recipients. The above findings confirm the assessment of asymmetry in risk spillovers. Furthermore, the quantitative evidence that the total spillover level under extreme conditions far exceeds that under normal conditions provides direct empirical support for the theoretical expectation in the existing literature that risk contagion effects are stronger under tail dependence structures. The role reversal and dual attributes exhibited by the bond market and the real estate market under extreme conditions complement the existing literature on the dynamic evolution of risk transmission networks and industry heterogeneity.
Second, regarding dynamic spillover effects, the risk spillover effect exhibits pronounced time-varying characteristics and phase-specific divergences. The periods 2012–2014 and 2019–2024 are identified as high-spillover phases, whereas the 2014–2019 period constitutes a low-spillover phase. Risk spillovers demonstrate heightened sensitivity to extreme events and the implementation of major policies. Under extreme market conditions, fluctuations in risk spillovers are considerably more intense. A higher level of CPU is associated with stronger intensity of cross-market risk transmission, whereas a clearly defined policy direction can effectively mitigate risk contagion. This conclusion corroborates the existing literature’s assessment of the cyclicality of risk spillovers, while the finding that CPU risk spillover effects intensify significantly under extreme conditions aligns closely with the conclusions of prior studies.
Third, concerning market heterogeneity, CPU exerts the most prominent spillover effect on the money market, whereas investor sentiment wields the greatest influence on the stock market. Volatility spillover effects within financial markets exhibit asymmetry, and the stock market, real estate market, and commodity market possess the dual attributes of serving as both risk sources and risk recipients. Prior to and following the implementation of the “dual carbon” policy, investor sentiment consistently exhibits a net spillover effect, whereas CPU transitions from a net spill-in to a net spill-out effect. The above findings further reveal the ordering structure of CPU spillover effects across different sub-markets, thereby refining the general assessment in the existing literature regarding the heterogeneity of policy uncertainty shocks. The result that investor sentiment exerts the strongest influence on the stock market and consistently exhibits net spillover effects across all market regimes aligns with the conclusions of prior studies. Moreover, the finding that investor sentiment demonstrates greater inertia and more persistent influence compared to CPU provides new evidence from the climate policy domain for behavioral finance theory.
Fourth, in terms of predictive performance, the forecasting efficacy of machine learning models for the TCI varies across market regimes. Under normal market conditions, the LightGBM model demonstrates optimal performance, with the DM test corroborating its significant superiority. Under extreme market conditions, the LSTM model achieves the highest predictive accuracy, attributable to its enhanced capacity to capture temporal dependency characteristics inherent in sequential data. While corroborating the general consensus in the existing literature regarding the predictive advantages of machine learning, this finding further advances the research from a “state-dependent” perspective and resonates with explorations in the literature on identifying risk transmission channels across different market regimes.
5.2. Policy Implications
Based on the aforementioned conclusions, this paper proposes the following policy recommendations. First, a regime-specific risk monitoring mechanism should be established. Regulatory authorities ought to prioritize the surveillance of risk contagion under extreme market environments, implement dynamic supervision targeting primary risk transmitters such as the bond market and gold market, and establish risk early warning thresholds for risk-sensitive markets, including the stock market and commodity market, so as to forestall the diffusion of cross-market risk.
Second, the formulation and dissemination mechanisms of climate policies should be optimized. Enhancing policy transparency and stability is essential to mitigate market volatility induced by policy uncertainty. During the deepening phase of the “dual carbon” policy implementation, it is imperative to balance emission reduction targets with market stability. A graduated policy guidance framework for the transition of high-carbon industries should be adopted to alleviate the risk spillovers triggered by transitional shocks.
Third, the guidance of investor sentiment and the management of market expectations should be strengthened. Irrational trading behavior can be curtailed through measures such as refining information disclosure regimes and promoting the dissemination of green finance literacy. An investor sentiment monitoring index should be constructed, enabling the timely deployment of stabilization measures in response to extreme sentiment fluctuations, thereby buffering sentiment-driven risk transmission.
Fourth, the predictive advantages of machine learning models should be fully leveraged. The LightGBM and LSTM models should be integrated into the risk early warning framework, designated respectively for forecasting risk spillovers under normal and extreme market conditions, thereby enhancing both the precision and forward-looking capability of financial risk prevention and control. Concurrently, differentiated risk prevention and control strategies should be formulated, tailored to the distinct risk characteristics of various financial sub-markets.
5.3. Research Outlook
This paper constructs a unified analytical framework encompassing CPU, investor sentiment, and systemic financial risk, and comprehensively employs the QVAR model and machine learning methods to investigate the risk contagion mechanisms and transmission pathways among the three. The methodology and market structure of this study are generalizable: the QVAR-DY approach does not presuppose any specific market structure; the machine learning prediction framework is transferable across markets; CPU and investor sentiment, as systemic risk drivers commonly faced by various economies, have broad applicability; the sample covers multiple economic cycles and policy phases; and the linkage mechanisms among financial submarkets are also typical and representative.
Future research directions can be pursued along the following dimensions. First, additional heterogeneous submarkets and cross-border markets can be introduced. Subsequent research could be extended to different industry sectors such as energy and technology, or to major international financial markets, to examine cross-market and cross-country transmission pathways of risk contagion. Second, more unstructured data can be incorporated. Incorporating news text, social sentiment, and other forms of unstructured data into investor sentiment measurement could enhance the ability to capture and provide early warning of extreme risk events. Third, a macroprudential early warning framework can be constructed. Leveraging the predictive advantages of the models, combining QVAR with optimal machine learning models could enable the construction of a dynamically updatable real-time monitoring and early warning system for financial market risk.
Author Contributions
Conceptualization, X.Z. and H.P.; methodology, H.P.; software, H.P.; validation, X.Z. and H.P.; resources, H.P.; data curation, H.P.; writing—original draft preparation, X.Z. and H.P.; writing—review and editing, X.Z. and H.P.; visualization, X.Z.; supervision, H.P.; project administration, H.P.; funding acquisition, H.P. All authors have read and agreed to the published version of the manuscript.
Funding
This research was funded by the National Social Science Fund of China (No. 24BJY097).
Institutional Review Board Statement
Not applicable.
Informed Consent Statement
Not applicable.
Data Availability Statement
The raw data supporting the conclusions of this article will be made available by the authors on request.
Conflicts of Interest
The authors declare no conflicts of interest.
References
- Zhang, Z.X.; Jin, J.Q. Economic Policy Uncertainty, Market Expectations and Volatility Spillover in Financial Market. Shanghai Financ. 2024, 3–18. [Google Scholar] [CrossRef]
- Yang, Z.H.; Chen, L.X.; Chen, Y.T. Cross-market Contagion of Economic Policy Uncertainty and Systemic Financial Risk: A Nonlinear Network Connectedness Analysis. Econ. Res. J. 2020, 55, 65–81. [Google Scholar]
- Wang, Z.R.; Niu, Y.X.; Ren, X.H. How Climate Change Affects Systemic Financial Risk: Evidence from Extreme Climate Events and Green (Brown) Assets. China J. Econom. 2024, 4, 1009–1030. [Google Scholar] [CrossRef]
- Huang, B.T.; Hu, H.W. Energy Market Uncertainty and the Tail Dependency Structure and Spillover Effects of Financial Market Risk in China—An Empirical Study Based on QVAR-DY Modeling. Rev. Invest. Stud. 2024, 43, 139–159. [Google Scholar]
- Wang, J.Y.; Wang, A.J.; Liu, Y.M. The Impact of Geopolitical Risk Shocks and the Risk Spillover Effects on the Financial Marke-t: An Analysis Based on the QVAR-DY Spillover Index. Mod. Financ. Econ. J. Tianjin Univ. Financ. Econ. 2024, 44, 76–93. [Google Scholar] [CrossRef]
- Xu, Q.F.; Jiang, C.X.; Tang, B.B. Characteristics of Tail Correlation Network and Systemic Risk of Chinese Financial Institutions: Based on the LASSO-QVAR Model. J. Stat. Inf. 2025, 40, 56–72. [Google Scholar] [CrossRef]
- Yang, Z.H.; Chen, Y.T.; Huang, Z. Research on Influencing Factors and Transmission Channels of Systemic Risks under International Shocks. Econ. Res. J. 2023, 58, 90–106. [Google Scholar]
- Deng, C.; Wu, J.; Wu, C. The External Economic and Financial Uncertainties and the Macroeconomic Downside Risk in China. Stat. Res. 2022, 39, 36–51. [Google Scholar] [CrossRef]
- Hu, L.N. Climate Policy Uncertainty, Investors’ Climate Risk Perception and Systematic Financial Risk. World Econ. Stud. 2024, 29–43+135–136. Available online: http://kdd.epsnet.com.cn/documentDetail?aId=1518664 (accessed on 26 March 2026).
- He, Z.F.; Zhong, M.Q. Research on the Dynamic Impact of Climate Policy Uncertainty on Global Energy Prices and Stock Prices. J. Syst. Sci. Math. Sci. 2025, 45, 3135–3156. [Google Scholar] [CrossRef]
- Yang, K.; Guo, Y.F.; Tian, F.P. Cross-market Contagion of Global Systemic Financial Risk under the Impact of Economic Policy Uncertainty: An Analysis Based on TVP-FAVAR and TVP-VAR Model. Stat. Res. 2023, 40, 70–84. [Google Scholar] [CrossRef]
- Yang, M.; Wang, L.R. Financial Uncertainty and Risk Contagion in Financial Markets. Financ. Regul. Res. 2023, 61–79. [Google Scholar] [CrossRef]
- Ding, S.J.; Liang, Z.P.; Chen, J.Y. Research on the spillover effects among climate policy uncertainty, energy, and metal markets from the time-frequency perspective. Syst. Eng. Theory Pract. 2023, 43, 2222–2235. [Google Scholar] [CrossRef]
- Pan, H.F.; Li, C.C.; Chen, J.H.; Fei, W.Y. Research on the Systemic Spillover of the Global Financial Market and Portfolio Opti-mization Under Climate Policy Uncertainty. J. Syst. Sci. Math. Sci. 2025, 45, 3955–3971. [Google Scholar]
- Ouyang, Z.S.; Chen, S.L.; Yang, X.T.; Liu, F.G.; Zhou, X.W. Economic policy uncertainty, network public opinion and systemic risk of financial institutions. J. Manag. Sci. China 2023, 26, 62–86. [Google Scholar] [CrossRef]
- Lu, M.X. A Study on the Measurement of Investor Sentiment and Its Effect on Stock Market Volatility. Macroeconomics 2022, 106–119. [Google Scholar] [CrossRef]
- Xie, S.Q.; Tang, S.X. The Impact of Investor Sentiment and Macro Economy Fluctuations on Stock Market Returns. Macroeconomics 2021, 99–107. [Google Scholar] [CrossRef]
- Liu, C.; Gao, F.F.; Zhang, M.W.; Xie, Q.W. Research on Risk Spillover Effect, Impact Effect and Risk Early Warning in China’s Financial Market. Chin. J. Manag. Sci. 2025, 33, 1–12. [Google Scholar] [CrossRef]
- Ouyang, Z.S.; Lu, M.; Zhou, X.W. A Study of Financial Risk Spillover and Early Warning in China Based on TVP-VAR-LSTM Model. J. Stat. Inf. 2022, 37, 53–64. [Google Scholar] [CrossRef]
- Ouyang, Z.S.; Peng, B.; Lu, M. The Time-Varying Analysis and Early Warning Study of the Importation Risk in China’s Finan-cial Market. J. Xi’an Univ. Financ. Econ. 2024, 37, 23–37. [Google Scholar] [CrossRef]
- Xiao, Y.L.; Xiang, Y.T. Prediction Model of Extreme Risk State in Chinese Financial Market and its Application. J. Financ. Dev. Res. 2022, 8–17. [Google Scholar] [CrossRef]
- Shi, G.; Chen, Z.; Luo, W.; Wei, Z.J. Cross-Border spillover of imported sovereign risk to China: Key factors identification base-d on XGBoost-SHAP explainable machine learning algorithm. Financ. Res. Lett. 2024, 70, 106307. [Google Scholar] [CrossRef] [Scilit]
- Wang, Q.Y.; Na, A.; Zhu, A.F. Constructing an Early Warning Indicator System for Financial Market Anomalies and Systemi-c Risk: A Perspective of Information Spillovers. Financ. Regul. Res. 2024, 44–62. [Google Scholar] [CrossRef]
- Li, H.Q.; Zhou, L. Systemic Financial Risk Monitoring and Early Warning Based on Machine Learning Model. Oper. Res. Manag. Sci. 2023, 32, 212–219. [Google Scholar]
- Diebold, F.X.; Yilmaz, K. Better to Give than to Receive: Predictive Directional Measurement of Volatility Spillovers. Int. J. Forecast. 2012, 28, 57–66. [Google Scholar] [CrossRef] [Scilit]
- Li, Z.; Shi, Q.; Bu, L. Quantile Connectedness of Policy Continuity across the Globe. J. Financ. Res. 2022, 506, 94–112. [Google Scholar]
- Ma, Y.R.; Liu, Z.; Ma, D.; Zhai, P.; Guo, K.; Zhang, D.; Ji, Q. A News-based Climate Policy Uncertainty Index for China. Sci. Data 2023, 10, 881. [Google Scholar] [CrossRef] [Scilit]
- Baker, M.; Wurgler, J. Investor Sentiment and the Cross-Section of Stock Returns. J. Financ. 2006, 61, 1645–1680. [Google Scholar] [CrossRef] [Scilit]
- Gao, Z.B.; Liang, X.B. Research on the impact of investor sentiment on stock market returns based on VAR and EGARCH. J. Zhejiang Univ. Sci. Ed. 2023, 50, 434–441+454. [Google Scholar] [CrossRef]
- Liu, Z.F.; Zhang, Z.P.; Dai, P.F.; Liu, W.H. A study on the spillover effect of crash risk between carbon and stock markets: CO-VID-19, investor sentiment and economic policy uncertainty. Syst. Eng. Theory Pract. 2023, 43, 740–754. [Google Scholar] [CrossRef]

Disclaimer/Publisher’s Note: The statements, opinions and data contained in all publications are solely those of the individual author(s) and contributor(s) and not of MDPI and/or the editor(s). MDPI and/or the editor(s) disclaim responsibility for any injury to people or property resulting from any ideas, methods, instructions or products referred to in the content. |
© 2026 by the authors. Licensee MDPI, Basel, Switzerland. This article is an open access article distributed under the terms and conditions of the Creative Commons Attribution (CC BY) license.