Article

GIS-Based Suitability Evaluation and Layout Optimization of Temporary Disaster Waste Storage Sites During Rainstorm Disasters: A Case Study of Mentougou District, Beijing

1
School of Environment and Energy Engineering, Beijing University of Civil Engineering and Architecture, Beijing 102616, China
2
Beijing Energy Conservation & Sustainable Urban and Rural Development Provincial and Ministry Co-Construction Collaboration Innovation Center, Beijing University of Civil Engineering and Architecture, Beijing 102616, China
3
Climate Change Research and Talent Training Base in Beijing, Beijing University of Civil Engineering and Architecture, Beijing 100044, China
4
CUCDE Environmental Technology Co., Ltd., Beijing 100032, China
5
School of Civil and Transportation Engineering, Beijing University of Civil Engineering and Architecture, Beijing 102616, China
6
Beijing Jin Yu Hongshulin Environmental Technology Co., Ltd., Beijing 102299, China
*
Author to whom correspondence should be addressed.
Sustainability 2026, 18(12), 6154; https://doi.org/10.3390/su18126154
Submission received: 27 April 2026 / Revised: 9 June 2026 / Accepted: 11 June 2026 / Published: 15 June 2026

Abstract

Frequent heavy rainstorm disasters have led to the need for temporary storage of large quantities of heterogeneous disaster-related solid waste within a short period, making temporary storage an important issue in the construction and optimization of the urban comprehensive urban emergency management systems. This study takes the “23·7” catastrophic rainstorm event in Mentougou District, an area prone to rainstorm disasters in Beijing, as a case study and develops an auxiliary decision-making model for site selection that integrates estimates of construction waste and household goods waste, an “initial selection—screening—optimization” suitability evaluation, and the optimization of spatial layout optimization. By combining the spatial analysis method of the Geographic Information System (GIS), an evaluation index system covering natural geography, ecological environment, and socio-economic factors was constructed. An integrated AHP–EWM model was constructed, merging the expert-driven, subjective weighting of the Analytic Hierarchy Process with the objective, data-derived weighting of the Entropy Weight Method to determine indicator weights. The suitability distribution for site selection was studied by combining the multi-factor weighted overlay model, and the area most suitable for construction of Temporary Disaster Waste Storage Sites (TDWSSs), accounting for 4.51% of the total area, was identified. Subsequently, multiple constraints—including ecological protection redlines and minimum area requirements—were superimposed to exclude non-compliant areas. Ultimately, a combined optimization model integrating the minimum facility location model, maximum coverage model, and minimum impedance model was constructed, and the optimal site selection scheme was determined via ArcGIS. The results show that, when seven TDWSSs are considered, the coverage rate of administrative villages within the 20 km transportation service range reaches 97.38%. The results also indicate that, when the number of TDWSSs exceeds eight, the increase in the coverage rate tends to be moderate and the optimization space is limited, indicating that the layout scheme with seven TDWSSs is close to the regional optimal solution. This framework provides crucial guidance for post-rainstorm TDWSS planning and layout optimization.

1. Introduction

Driven by global climate warming and rapid urbanization, extreme hydro-meteorological disasters have grown increasingly frequent, with rainstorm-triggered floods being especially prominent. Such hazards not only pose substantial threats to human habitats but also sustainable societal development [1]. Spanning from the 1976 Thompson Great Flood in the United States, to the 2004 torrential rains in Niigata and Fukui Prefectures of Japan, the extreme rainstorms in North China in 2012 and 2023, and the catastrophic floods and debris flows triggered by persistent heavy rainfall in Sumatra, Indonesia, in 2025, the devastating impacts of rainstorm disasters have continued to intensify. Rainstorm-related disasters result in human casualties and public health emergencies, alongside environmental contamination, property damage, and substantial economic losses [2,3]. Rainstorm-induced disasters produce massive volumes of solid waste in affected areas, significantly raising waste quantities and complicating post-disaster remediation efforts. Existing studies have demonstrated that waste generated in disaster-affected communities can be 5–15 times the quantity produced under normal annual conditions [4]. For instance, the October 2011 floods in Thailand generated 100,000 tons of solid waste; the September 2019 rainstorm event in Joso, Japan, produced 52,000 tons of solids—an amount equivalent to three years of local household waste output; the July 2021 extreme rainstorm in Zhengzhou, China resulted in a daily solid waste output of approximately 8000 tons. Disaster waste is characterized by high compositional complexity, typically comprising household waste, construction waste, food waste, hazardous materials, and e-waste, which renders its management extremely challenging [5]. In addition, routine municipal waste collection, transportation, and treatment operations can be severely disrupted by rainstorm-induced hazards, leading to service suspensions and operational failures. Such adverse effects can propagate beyond disaster-affected zones to adjacent areas [6]. The timely removal and standardized management of waste from large-scale natural disasters are critical for the post-disaster recovery and reconstruction of affected regions [7]. However, limited by inadequate emergency response capabilities, post-disaster solid waste and debris removal often fails to proceed as scheduled, thereby hindering community-level emergency responses and post-disaster reconstruction progress [8].
Environmental protection authorities, including the Environmental Protection Agency, have highlighted the necessity of temporary disaster waste storage sites (TDWSSs), which facilitates the timely transportation and disposal of post-disaster debris [9]. In many countries, TDWSSs serve as temporary storage for waste prior to final treatment, with on-site classification and intermediate processing [9,10]. Optimizing the siting and layout of TDWSSs under rainstorm conditions is essential to meet solid waste transport demands. Assessing the suitability of potential TDWSS locations is a systematic endeavor that requires multi-dimensional evaluation, including environmental, sociocultural, logistical, and land ownership criteria [11].
The value of geographic information systems (GISs) in addressing environmental spatial issues has been widely demonstrated in previous studies. In early studies, Grzeda proposed a pre-selection method for TDWSSs based on binomial clustering analysis and GIS. By conducting pre-disaster spatial constraint modeling, this work provided a solid foundation for dynamic site selection after disasters occur [12]. As the methodological systems have matured, multi-criteria decision-making and model integration have become important research directions for disaster waste facility planning. Habib constructed a two-stage decision-making framework that integrates the ANP–fuzzy multi-criteria analysis with a dynamic allocation model, thereby supporting TDWSS site selection and waste diversion optimization under hurricane disaster conditions, providing a reference paradigm for the resource utilization of disaster waste in developing countries [13]. Taking Cavite Province in the Philippines as a case study, Lontoc established a site selection criteria system that includes indicators such as land use and distance from water bodies. With the aid of GIS layer overlay analysis, 18 potential TDWSSs were determined, which effectively improved the scientific basis of the regional emergency disaster waste management [14]. Therefore, GIS provides a powerful tool for addressing geospatial issues in waste management.
Another critical component of site suitability analysis is location-allocation models, whose core objective is optimization of the matching relationship between supply and demand. Through analysis of the spatial correlation between the distribution of potential site locations (supply side) and that of the demand side, this model determines the optimal set of N site locations [15]. As a pivotal research direction within the domains of spatial optimization and geographic information science, diverse location-allocation models have been developed into diverse forms over the past 50 years, accommodating varied planning and spatial analysis requirements [16].
This study proposes a framework for TDWSS site selection following rainstorm disasters. The framework integrates information on disaster-related solid waste generation. Using GIS technology (Arc Map 10.2), quantitative analysis and visualization are carried out for each influencing factor, which are used to evaluate the optimal site selection for TDWSS. Mentougou District in Beijing, China, is selected as the case study area, because it is prone to rainstorm disasters and its existing disposal facilities are unable to meet the treatment demand generated by large volumes of disaster-related solid waste. Influencing factors for TDWSS site selection under rainstorm disaster conditions are analyzed in three dimensions: natural geography, ecological environment, and social economy. Then, based on constraints such as suitability scores and minimum area requirements, potential site selection areas are preliminarily screened. Finally, the optimal TDWSS site selection scheme is determined and analyzed by applying the minimum facility point model, maximum coverage model, and minimum impedance model, while integrating road network data. The research results are intended to provide a more comprehensive and accurate scientific basis for TDWSS site-selection decisions under rainstorm disaster conditions, thus contributing to contribute to improved emergency management efficiency.

2. Materials and Methods

2.1. Study Area

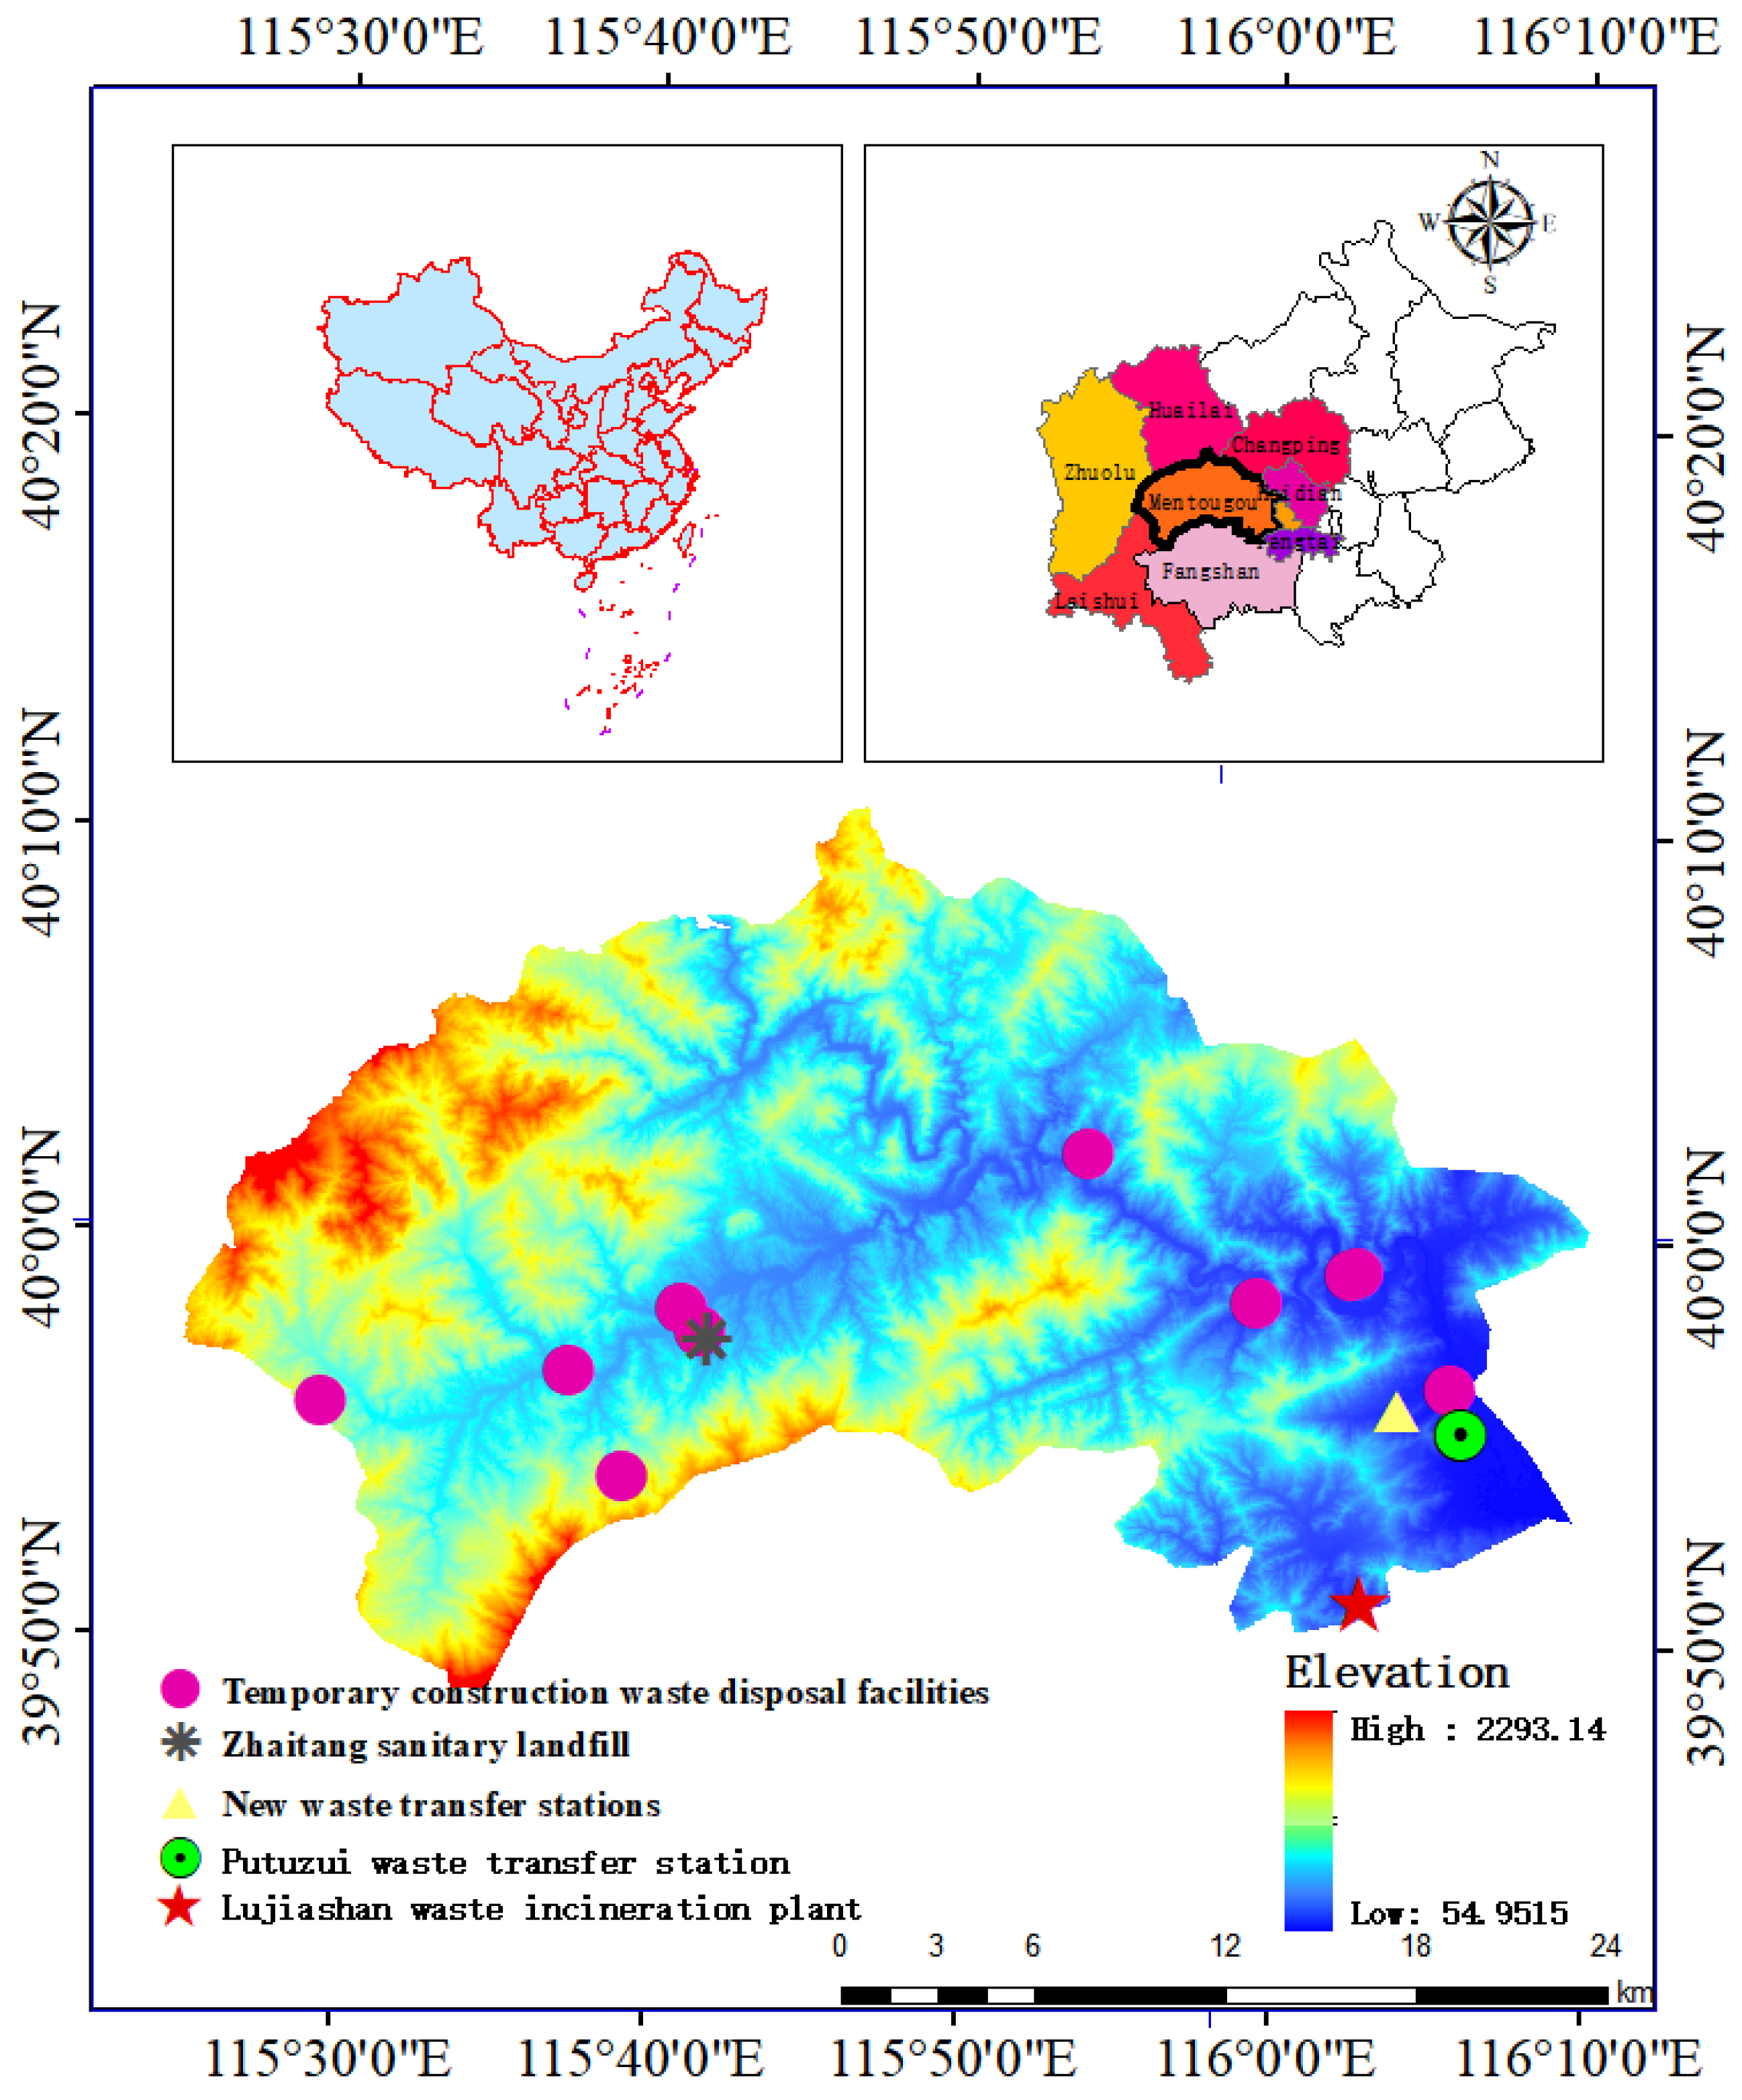
Mentougou District is located in the western mountainous part of Beijing, China, forms part of the Taihang Mountains and features complex, rugged terrain. The district spans 1447.85 km2 (Figure 1), with mountainous areas accounting for 98.5% of its land cover. Elevation ranges from 73 m to 2303 m, generally decreasing from northwest to southeast. The terrain is generally higher in the northwest and lower in the southeast, and the Yongding River, the largest river in the district, flows through the area.
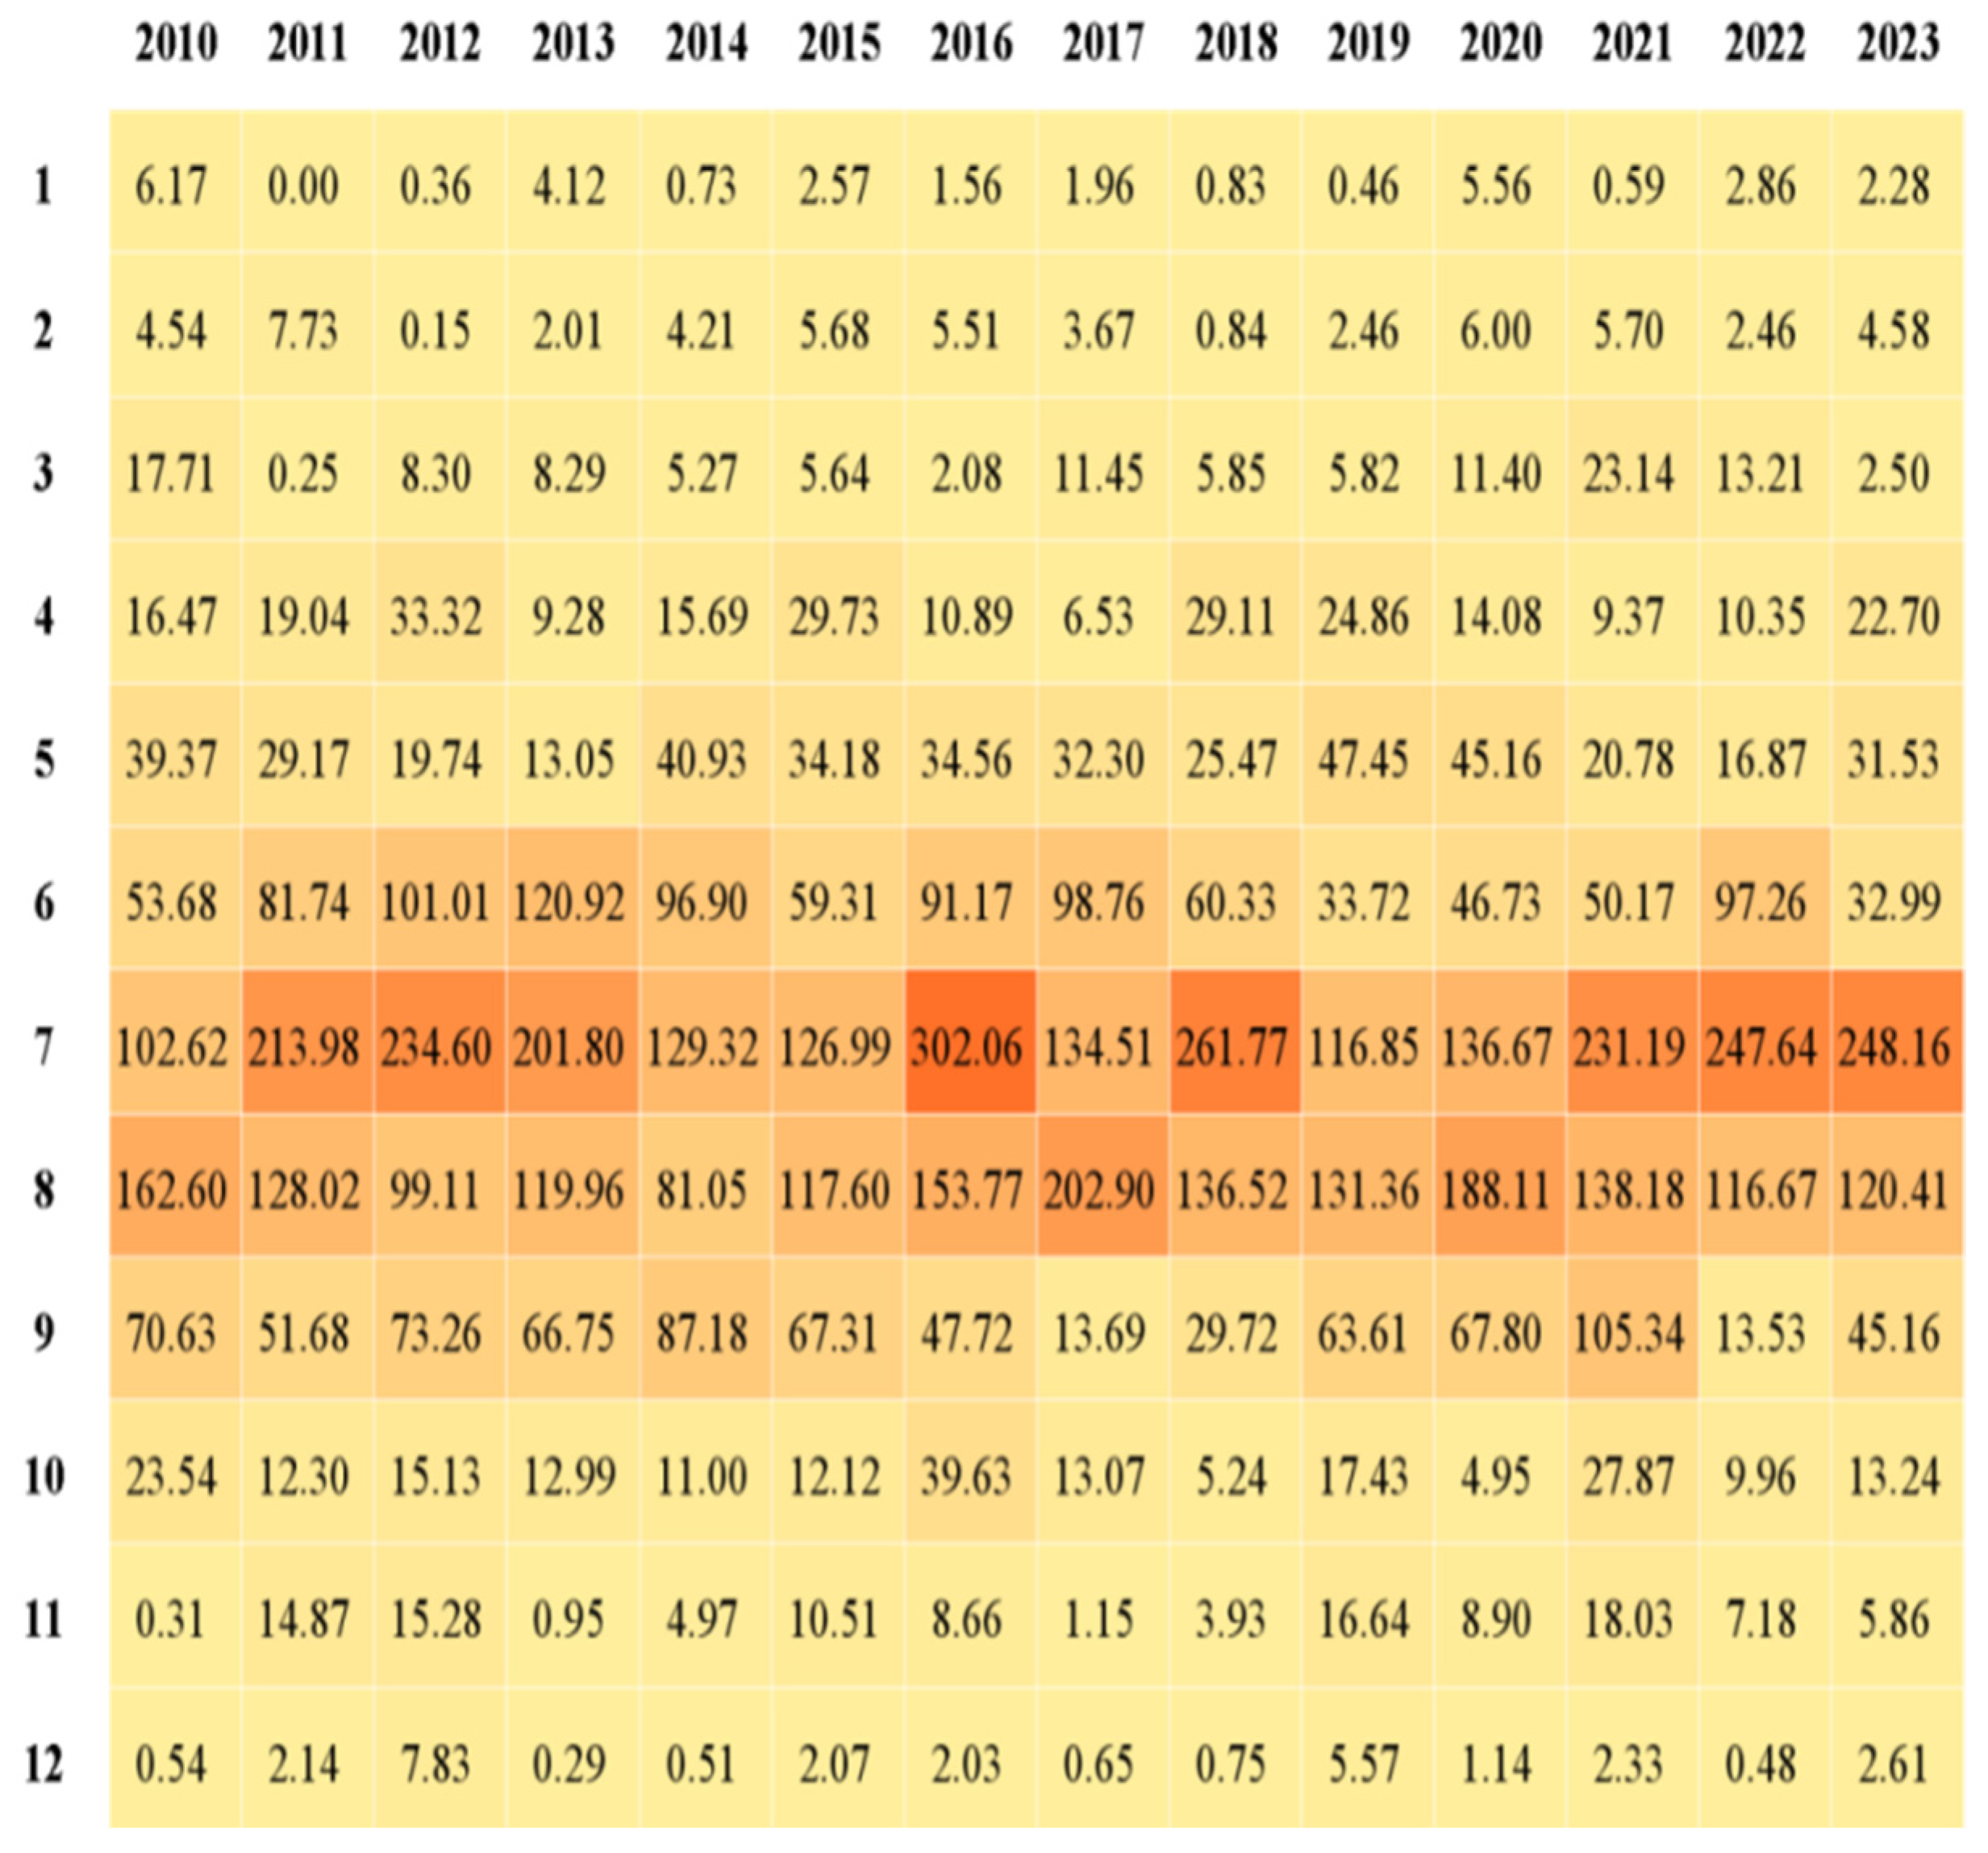
Mentougou District has a continental monsoon climate with significant annual precipitation fluctuations. The average annual precipitation from 2010 to 2023 was 547.54 mm. Concentrated precipitation from July to August accounts for 59.45% of the annual total (with a long-term average of 327.46 mm) and can easily trigger secondary disasters such as mountain torrents and mudslides. Monthly precipitation data for Mentougou District from 2010 to 2023 are shown in Figure 2. From 29 July to 2 August 2023, under the influence of Typhoon “Doksuri,” the average precipitation in Mentougou District reached 538 mm, the highest historical precipitation recorded in this area. This event caused large-scale damage to houses and infrastructure and generated a substantial amount of disaster-related solid waste.
The pre-disaster solid waste treatment system in Mentougou District was relatively weak. Core facilities included the Lujiashan waste incineration plant, with a daily processing capacity of 3000 tons, and service coverage across multiple urban areas; the Zhaitang sanitary landfill, with a daily processing capacity of 41 tons, functioning as the core treatment facility in deep mountainous areas; and the Putuzui waste transfer station (with a daily processing capacity of 400 tons).
During the “23·7” extreme rainfall event, the Zhaitang landfill ceased operation because of geological subsidence. Consequently, domestic waste from areas such as Qingshui Town had to be transported more than 50 km to the Mencheng area, raising both disposal costs and pollution risks. The remaining waste facilities also suffer from aging infrastructure and insufficient capacity. During the disaster, these facilities were required to handle a large influx of solid waste from building collapse and inundation—estimated at 3.2 times their normal treatment capacity—underscoring a critical mismatch between emergency response capacity and the scale of disaster waste generation.

2.2. Data Collection and Processing

In this study, 12 impact indicators were selected based on the local characteristics of Mentougou District to support the site selection analysis of TDWSS. Detailed information on data sources and relevant specifications is presented in Table 1. These datasets were integrated and clipped using the ArcMap 10.2 platform, with a uniform raster cell resolution of 30 m × 30 m and a unified projection of Beijing_1954 3 Degree_GK CM 117E. In addition, a dataset on housing collapse and structural damage induced by the “23·7” rainstorm disaster in Mentougou District was compiled.
Several authoritative normative documents and statistical materials were used to support this research, including the Mentougou District Statistical Yearbook 2023, and the Mentougou District Territorial Spatial Partition Plan (2017–2035). Relevant technical codes and standards are cited in Refs. [17,18].

3. Model Design for TDWSS Site Selection

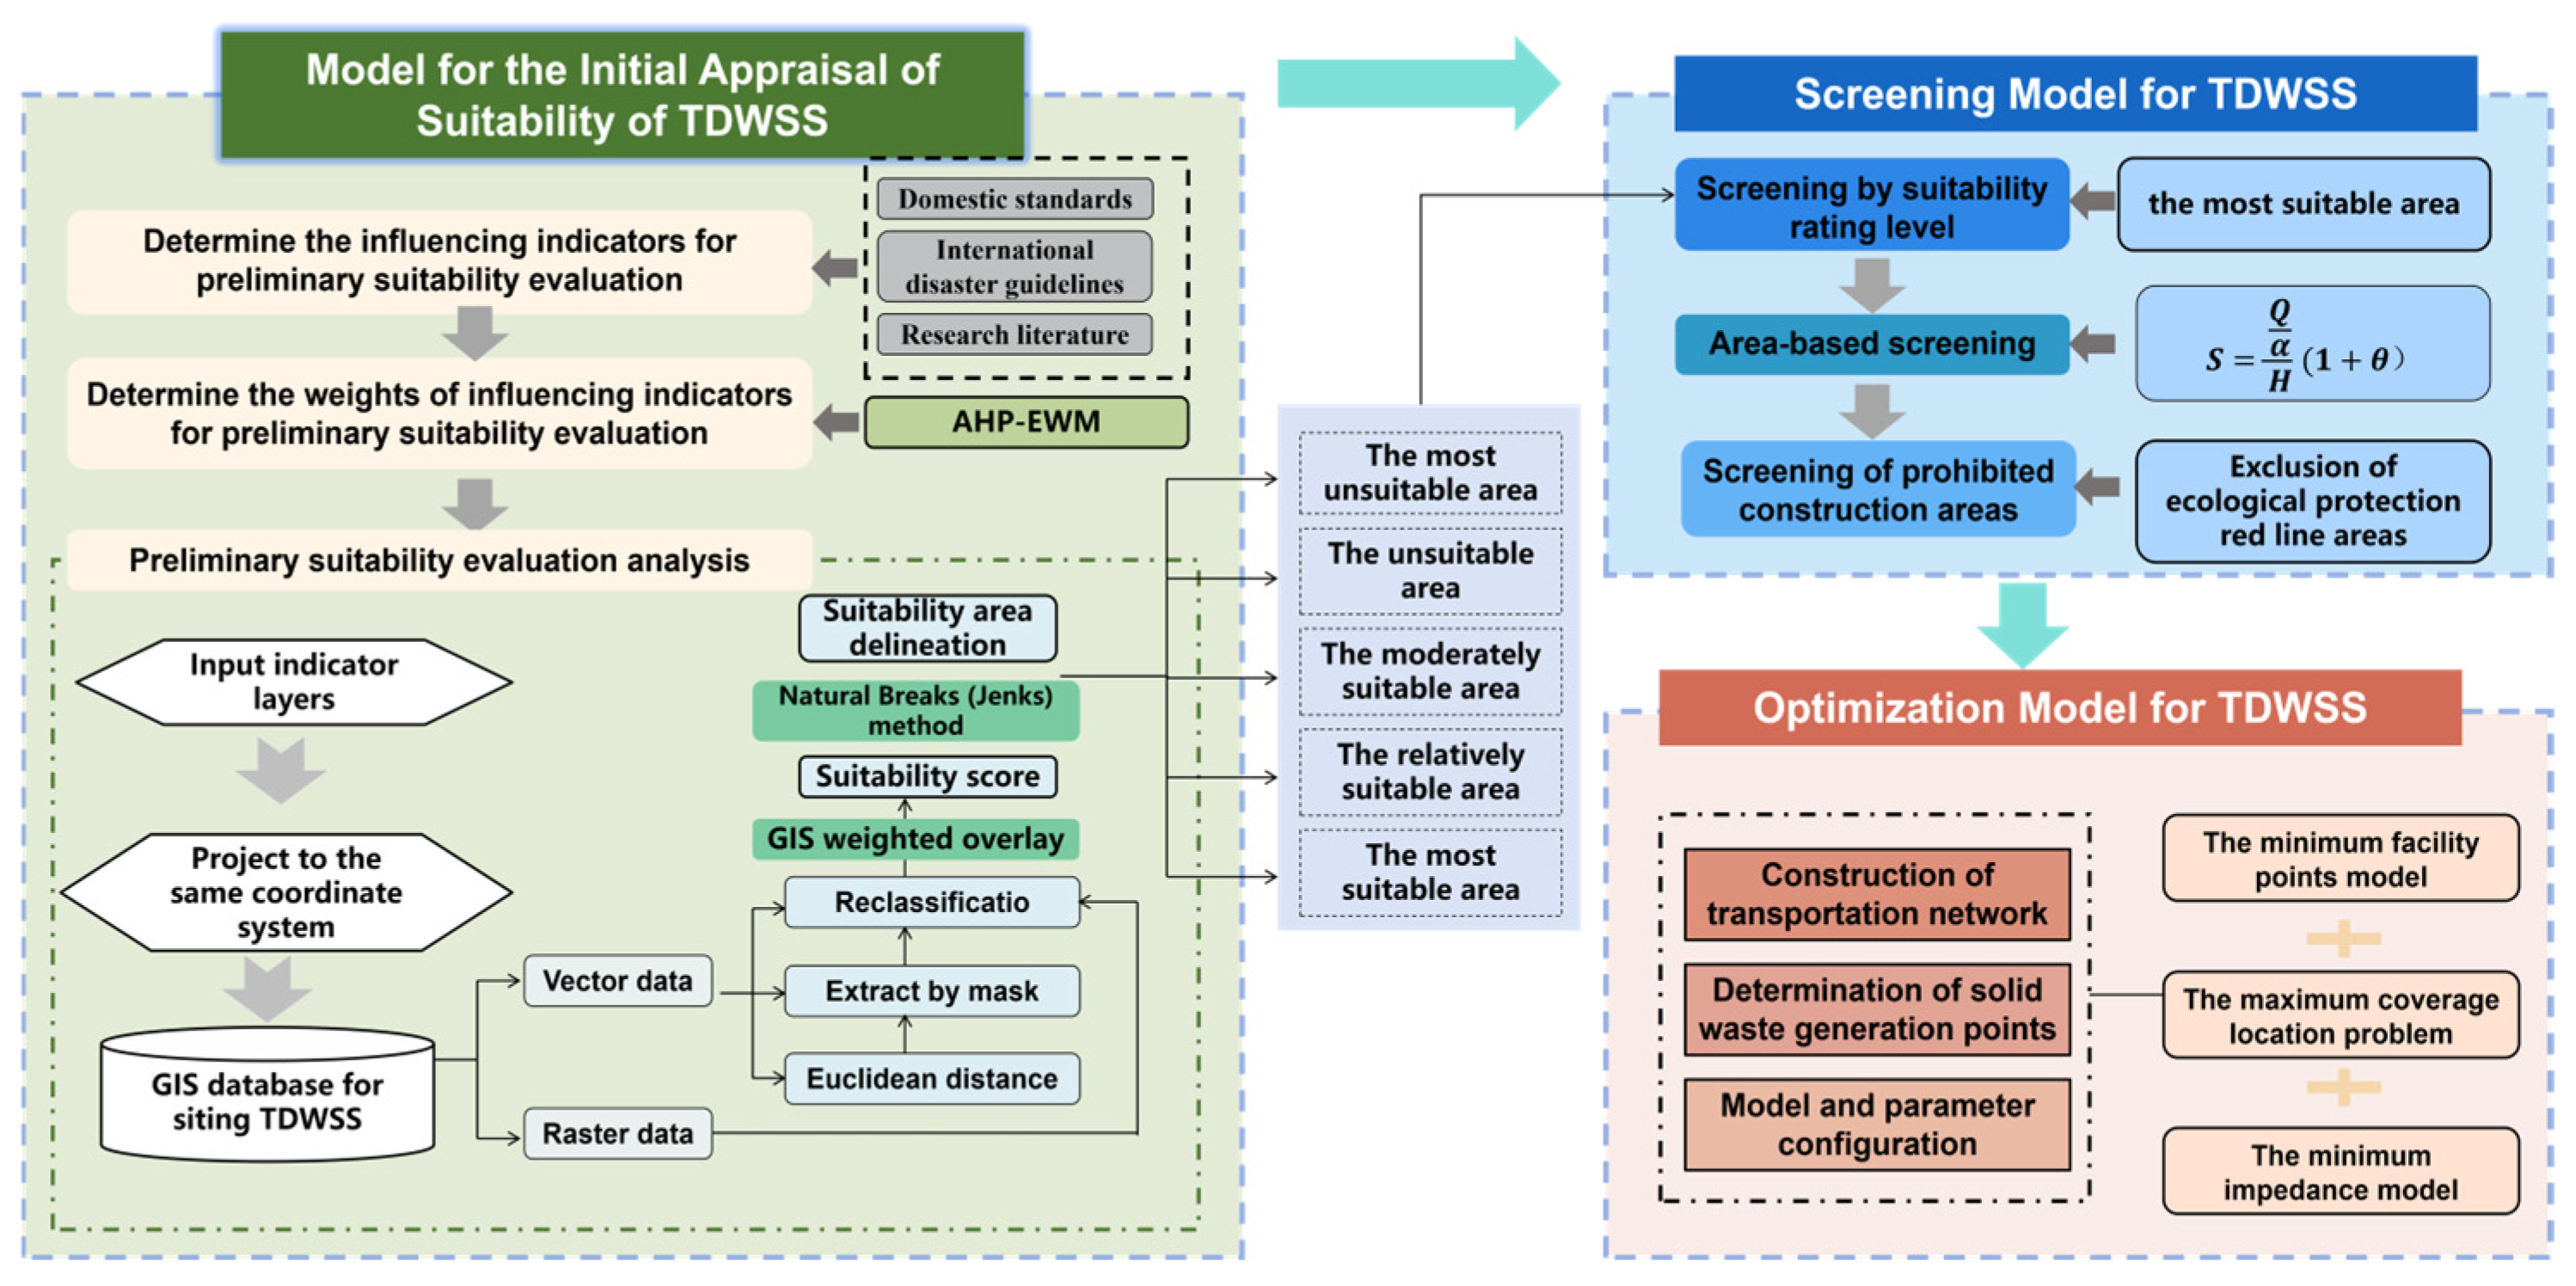
The conceptual framework of the research model is illustrated in Figure 3. The conceptual framework of the research model is illustrated in Figure 3. A three-stage TDWSS framework consisting of preliminary selection, screening, and spatial optimization is proposed in this study, which is primarily grounded in the spatial and network analysis functions of GIS. First, the volumes of construction waste and household goods waste generated from housing collapse or severe structural damage caused by rainstorm disasters are estimated, which provides a quantitative basis for determining the required land area of subsequent TDWSS. In this study, a GIS-based Multi-Criteria Decision Analysis (MCDA) method was selected as the research framework. In addition, a location-allocation model was incorporated to optimize facility layout, thereby balancing spatial decision accuracy with collection and transportation efficiency. During model construction, AHP-EWM was employed to determine indicator weights. Simultaneously, the range method was applied to standardize indicators with different dimensions, thereby improving comparability among them. Leveraging GIS spatial analysis tools, including Euclidean distance analysis, reclassification, and weighted overlay, the preliminary site suitability for TDWSS was assessed. Accordingly, the study area was classified into five grades: most suitable, relatively suitable, moderately suitable, unsuitable, and least suitable. On this basis, prohibited construction zones, such as ecological protection redlines, and area constraints were superimposed. Plots that did not meet the construction requirements were then eliminated, resulting in the screening of candidate site areas. This study integrated three core models within the GIS location-allocation framework, namely, minimum facility location, maximum coverage, and minimum impedance models. Coupled with road network spatial analysis, the optimal selection of TDWSS was ultimately achieved.

3.1. Estimation of Solid Waste Generation Volume Under Heavy Rainfall Disasters

Estimating the quantity of flood waste is a fundamental step in promoting sustainable disaster waste management. Such quantitative assessment provides critical technical support for the planning and deployment of full-cycle waste recycling and disposal processes. Furthermore, it facilitates pre-disaster preparedness planning, particularly for TDWSS site allocation [9,19]. Existing studies mainly employ three methods for estimating disaster waste: the “historical data” method, which is based on data from past disasters; the “database” method, which relies on relevant national, regional, or local databases, such as information on household items and building types; and the “imaging” method, which utilizes aerial, satellite, or radar imagery to quantify solid waste [20]. The sources of solid waste generated by rainstorm disasters are complex and diverse. However, the waste generated by house collapse often plays an important role in terms of both quantity and impact. In this study, the database-based estimation approach developed by Marchesini was employed to quantify the amount of construction waste and household goods waste generated by collapsed or damaged houses during rainstorm disasters.

3.1.1. Estimation Method for Construction Waste

In this study, the construction waste estimation method specified in SJG21-2011 was adopted to estimate the amount of construction waste generated by collapsed and damaged houses under rainstorm disasters, as expressed in the following equation [17]:
Q c s = S × R × q
where Q c s is the amount of construction waste generated by the collapse and damage of houses, kg; S is the floor area of each household, in square meters; R is the total number of houses damaged in the rainstorm disaster; and q is an indicator of the generated volume of construction waste, in kg/m2, as shown in Table 2 [21].

3.1.2. Estimation Method for Household Goods Waste

A large amount of household goods waste is generated when houses collapse or are severely damaged by sudden natural disasters. Household goods waste mainly consists of Durable Consumer Goods (DCGs) such as furniture, clothing, electrical and electronic products, and scrapped vehicles [20]. China’s Statistical Survey System for Natural Disasters categorizes building damage into four grades: total collapse, severe damage, moderate damage, and slight damage. Among these, severely damaged buildings are defined as structures where the primary load-bearing components are partially intact yet critically impaired or partially collapsed, thereby undermining overall structural integrity. Although repairs are technically possible, the building is deemed not worth repairing after weighing the costs against safety considerations. There is significant uncertainty regarding the scrapping of durable consumer goods in flood-submerged homes, as this is influenced by multiple factors such as the duration of submersion and material composition. At the same time, constrained by limited post-disaster field survey datasets and insufficient historical statistics on household waste generation from prior flood disasters across China, rapid household-scale quantification of discarded domestic items remains challenging. Therefore, this study selected quantifiable solid waste for the accounting analysis, incorporating collapsed and severely damaged houses into the accounting of household waste.
In accordance with the Technical Requirements for Collection and Recycling of Bulky Waste (GB/T 25175-2010) [18], disaster-affected DCGs are classified into four groups: furniture, household appliances, electronic products, and other bulky waste. A baseline database was established using publicly accessible DCG ownership data for urban and rural residents, sourced from the District Statistical Yearbook 2023 of various provinces and municipalities across China. On this basis, a unit mass parameter system for major DCGs was constructed through web-based statistical analysis of sample weights from multi-source product datasets, in order to quantify disaster-driven household waste generation. Specifically, the total household waste volume generated by residential building collapse and severe damage can be formulated as follows:
Q h w s = R × i = 1 n q i × m i
where Q h w s is the amount of household goods wastes generated by collapsed houses (kg); R is the number of houses that collapsed due to the rainstorm disaster; i indexes the type of durable consumer goods; q i is the weight of the i -th durable consumer product (kg); and m i is the quantity of the i -th durable consumer goods.

3.2. Initial Selection of TDWSS Based on GIS Spatial Analysis

3.2.1. Establishment of the Initial Suitability Evaluation System

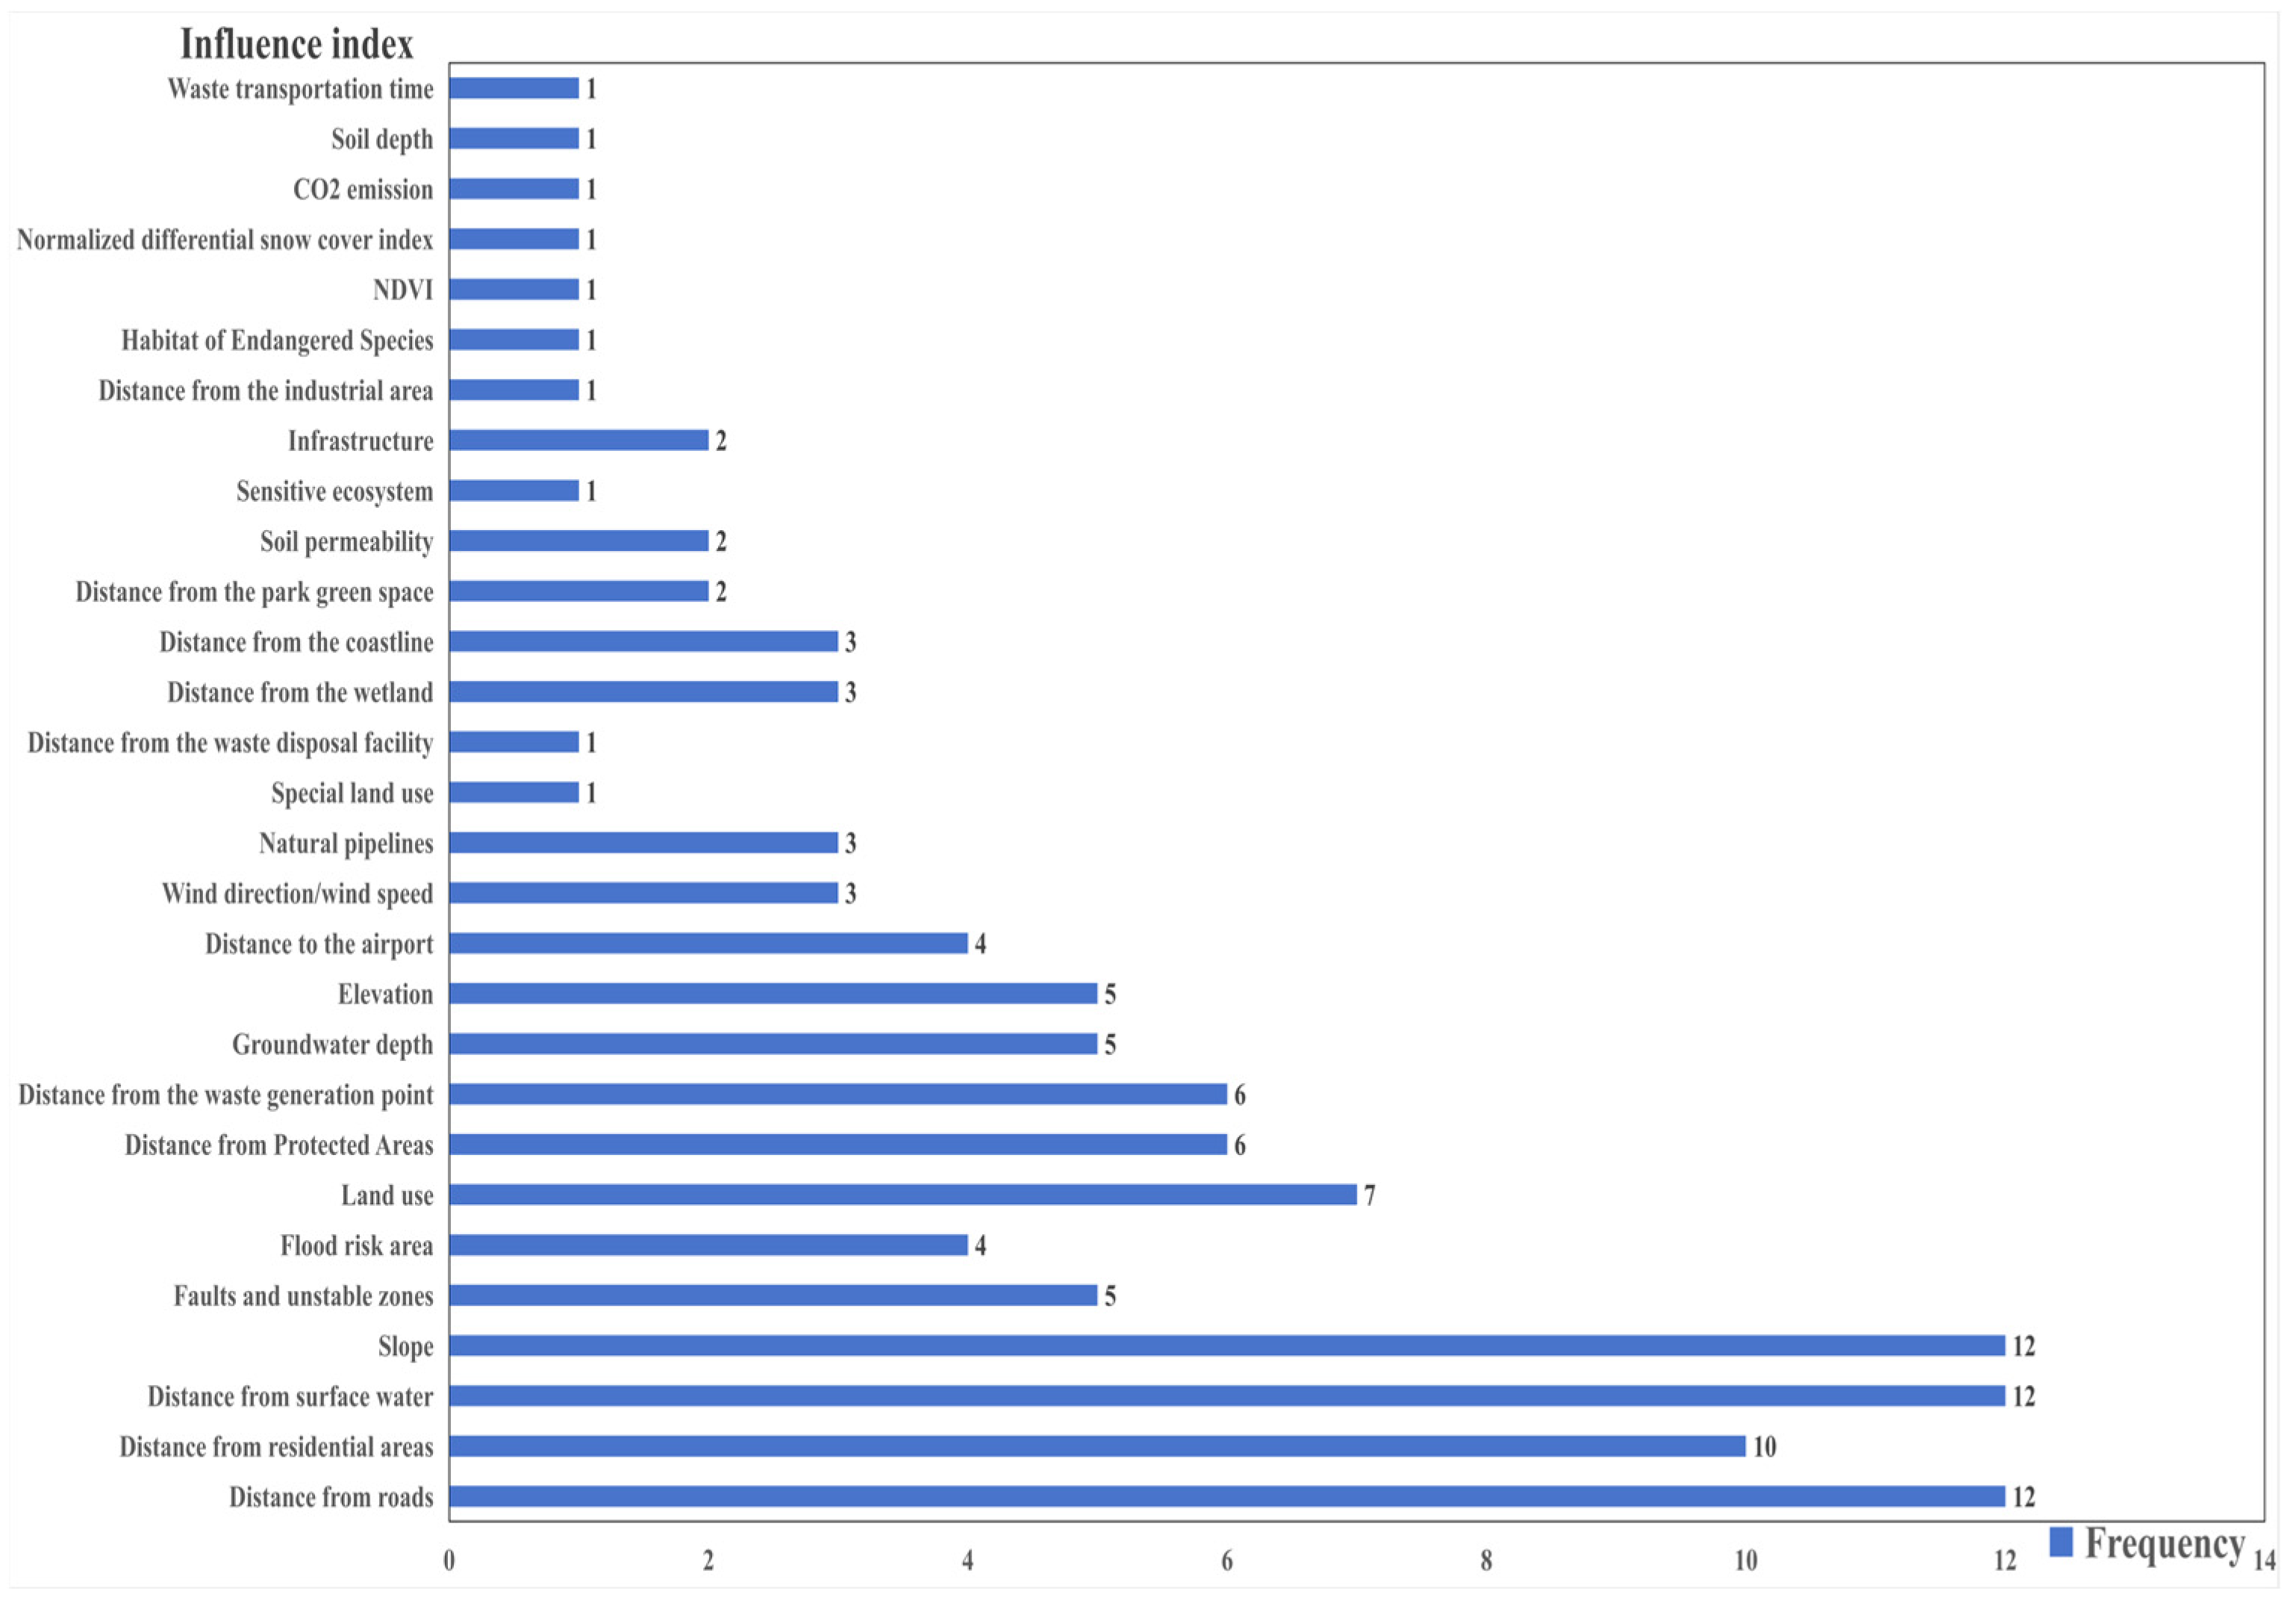
Facility site selection must consider multiple environmental–economic constraints, to optimize cost-effectiveness while minimizing ecological disturbance and resource consumption [22,23]. A systematic review was conducted of the SCI-indexed peer-reviewed literature related to solid waste disposal facility siting (see Table S1). The key points of the relevant national policies were summarized (see Table S2), together with an assessment of leading international guidelines for disaster waste management (see Table S3) [13,14,24,25,26,27,28,29,30,31,32,33,34]. The review showed (Figure 4) that certain criteria were repeatedly adopted, including distance to roads, slope, distance to surface water, distance to residential areas, and land-use type.
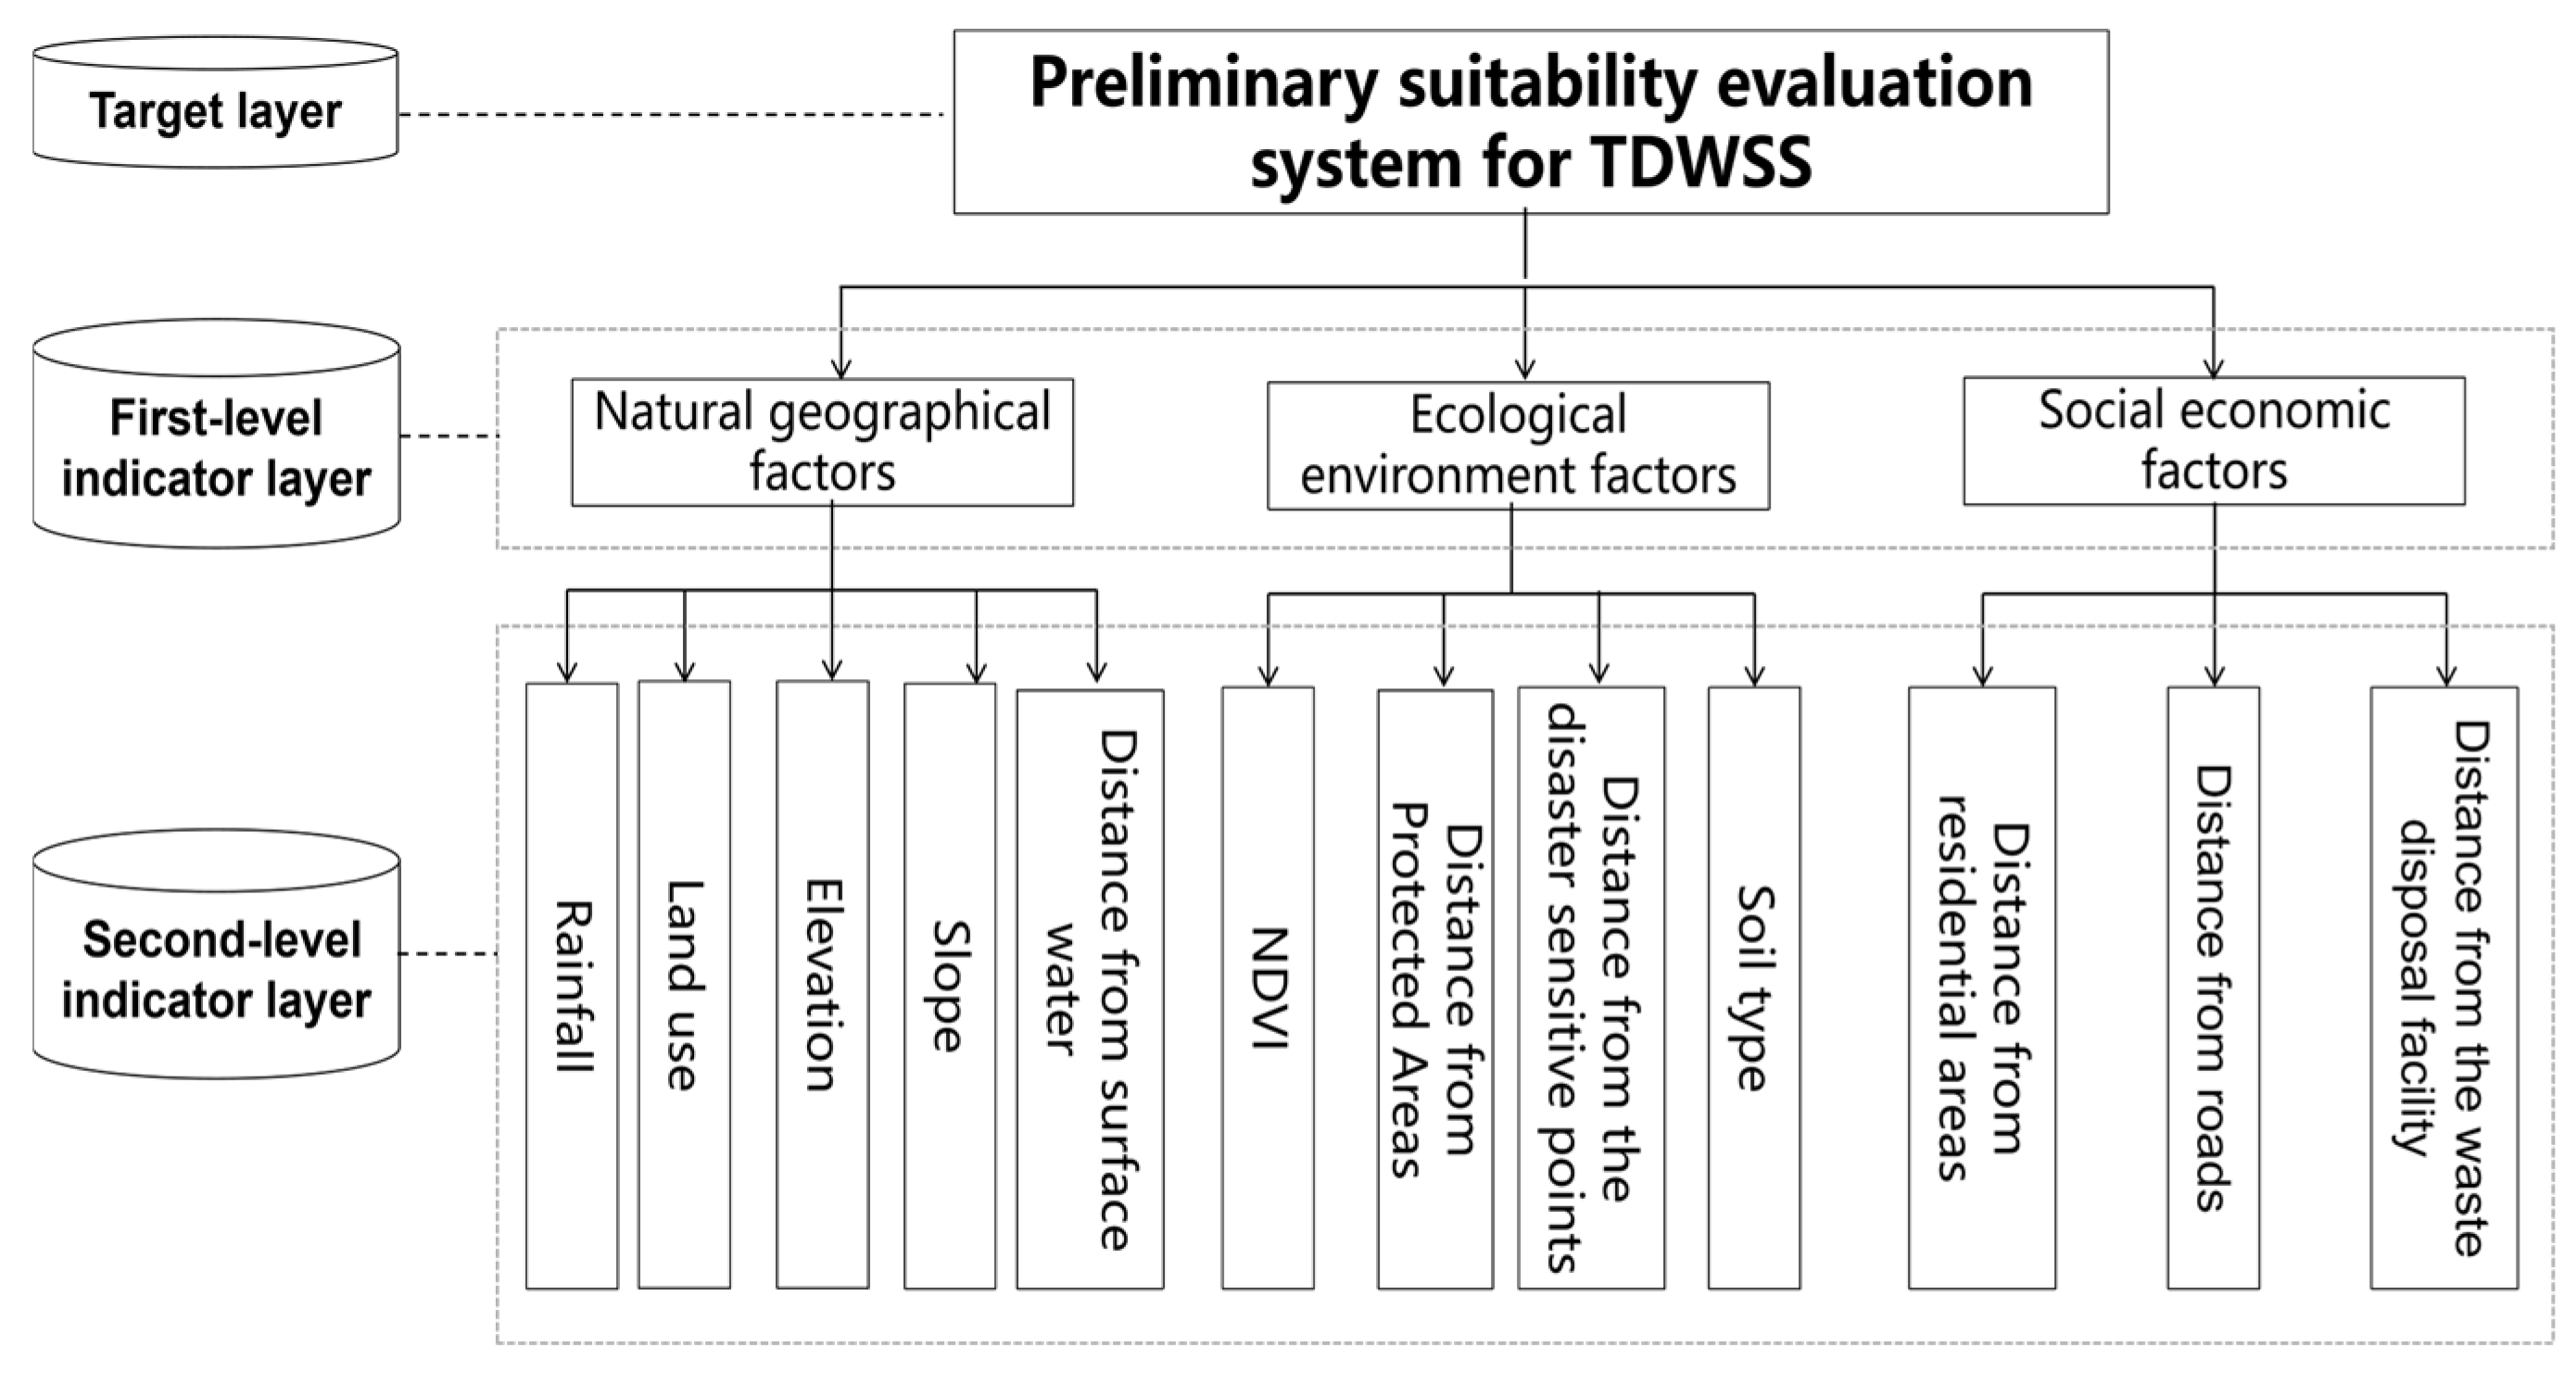
Based on the above analysis results and comprehensive considerations, indicator selection prioritizing quantifiability and systematic completeness was conducted. Three primary indicators and 12 secondary indicators were established as the suitability evaluation system for the preliminary siting of TDWSSs, as shown in Figure 5.
(1)
Natural geographical factors
Rainfall affects the functionality of solid waste disposal systems across collection, sorting, and transport operations [35]. Excessive rainfall increases the likelihood of flooding and can contaminate groundwater. Therefore, temporary solid waste storage sites should be located in areas with low rainfall; this study takes into account the average annual rainfall in the region over the past 20 years.
Elevation determines the likelihood of a site being affected by flash floods and runoff. Elevation affects the drainage systems, accessibility, and construction costs of waste disposal facilities; lower-elevation areas are considered more suitable for site selection due to their better accessibility and lower construction costs [32].
Slope serves as a critical governing factor for the structural stability, construct ability, and long-term operational safety of waste disposal sites. Steep terrain significantly elevates the susceptibility of sites to geological hazards, including landslides and surface erosion. Furthermore, the absence of auxiliary temporary construction facilities hinders on-site waste transportation, thereby restricting site accessibility for engineering and operational activities [31,36].
Solid waste disposal facilities should be sited away from sensitive areas such as forests, farmland, archeological sites, coastlines, and water bodies. Converting these areas into industrial land can lead to environmental issues and increase project costs due to changes in land use; therefore, it is recommended to select remote, undeveloped areas to reduce costs [35]. Barelands and pastures are considered suitable for site selection, while water bodies, forested areas, submerged vegetation, agricultural lands, and built-up zones are regarded as unsuitable [31].
Distance from geological hazard zones quantitatively characterizes the potential risks that landslides, debris flows, and other geohazards impose on disposal sites. In accordance with the “Pollution Control Standard for Hazardous Waste Storage (GB 18597-2023) ”, hazardous waste storage facilities must be situated away from karst landforms and regions exposed to severe natural disasters, including floods, landslides, debris flows, and tidal inundation [37]. Accordingly, this study focuses on evaluating potential sudden geological hazard sites in Mentougou District, encompassing ground collapses, landslides, debris flows, and land subsidence, to support siting analysis.
(2)
Ecological environment factors
NDVI facilitates the qualitative and quantitative evaluation of vegetation cover and physiological vigor. Areas with lower NDVI values are preferable for siting solid waste disposal facilities [38].
Nature reserves constitute core zones for maintaining ecosystem integrity and conserving endangered species, which should be prioritized as a primary constraint in the siting of TDWSSs [32]. According to Uyan’s research, the distance between the TDWSS and the protected area should be at least 1000 m [39].
Proximity to surface water bodies increases the risk of flooding, particularly stormwater-induced inundation. Distance from surface water bodies is a direct proxy for the severity of this threat. Moreover, heavy rainfall mobilizes solid waste, which can contaminate adjacent rivers and other surface water bodies [31]. Consequently, temporary solid waste storage sites must be situated at an adequate setback distance from all surface water bodies.
Soil type is a critical determinant in siting TDWSSs, primarily through influence on impermeability and pollutant retardation, which together govern the risk of leachate migration into surrounding soil and water systems. The soils of Mentougou District encompass loose lithomorphic soil, high-activity luvisol soil, dystric cambisol soil, calcareous soil, and eutric cambisol soil. Eutric cambisol soils, characterized by their perennial saturation and exceptionally low permeability, are deemed the most suitable substrate. Calcareous soils, with their strong adsorption capacity and comparatively dense structure, are classified as generally suitable. Dystric cambisol soils are considered less suitable owing to their an inherent leaching risk. High-activity luvisol soils, despite exhibiting some adsorptive capacity, are classified as unsuitable because of their high permeability. Loose lithomorphic soil, marked by an extremely friable structure and negligible impermeability, are rated as the least suitable and should be avoided.
(3)
Social economic factors
The proximity between a TDWSS and residential zones must be taken into consideration, as TDWSSs frequently generate offensive odors. Such emissions degrade residential living conditions and pose potential hazards to public health and safety hazards [31,39]. Therefore, the TDWSS should be positioned far away from residential areas.
The proximity of TDWSS to road networks directly governs site accessibility and material transport efficiency [14]. Sites located far from major road corridors—including national, provincial, and county highways—are prone to emergency response delays and elevated transportation costs [31].
Solid waste accumulated at TDWSS must ultimately be transported to terminal disposal facilities—such as landfills, incineration plants, or composting facilities—for treatment. Excessive distance between TDWSS and disposal sites inflates transportation costs and prolongs transit times, thereby reducing overall logistics efficiency [32].

3.2.2. Calculation of Weights for Initial Suitability Evaluation Indicators

To derive indicator weights that are both mathematically rigorous and informed by expert knowledge, this study employs a combined weighting approach that integrates the Analytic Hierarchy Process (AHP) with the Entropy Weight Method (EWM).
(1)
AHP
TheAHP is a subjective weighting method that relies on structured expert judgment. Its core procedure comprises four stages: (i) constructing a hierarchical model that decomposes the decision problem into an objective layer, a first-level indicator layer, and a second-level indicator layer (Figure 5); (ii) constructing a pairwise comparison matrix based on expert judgments (Equation (3)), where a 1–9 scale quantifies the relative importance between indicator pairs; (iii) deriving weight vectors via the eigenvector method and performing a consistency check (Equations (4) and (5)) to ensure the random consistency ratio remains below 0.1; and (iv) completing the weight derivation with the eigenvector method [40]. AHP is valued for its conceptual simplicity and flexibility, and it is a widely adopted tool for multi-criteria evaluation. Nonetheless, its reliance on subjective judgment represents an inherent limitation. The principal computational formulas are presented below:
A = a 11 a 12 a 1 n a 21 a 22 a 2 n a n 1 a n 2 a n 3
λ m a x = 1 n i = 1 n a i j × w A j w A i
C I = λ m a x n n 1
where A is the judgment matrix; a i j is the importance of criterion i relative to criterion j, i = 1, 2, …, n, j = 1, 2, …, n; λ m a x is the largest eigenvalue; w A i is the consistency index; and CI is the consistency index. When the average randomness index (RI) ratio is less than 0.1, the consistency of judgment matrix A is considered reasonable; if CR ≥ 0.1, the judgment matrix A is deemed unreasonable and requires re-examination. q is the order of the judgment matrix.
(2)
Shannon Entropy Weight Method (EWM)
The EWM is an objective weighting method grounded in the principle of information entropy. In EWM, the entropy value captures the dispersion degree of an indicator across observations: higher dispersion corresponds to lower entropy, and consequently, a greater weight in the comprehensive evaluation. The core computational workflow involves constructing a judgment matrix, normalizing the data, calculating entropy values, computing normalized entropy, and determining the final weights. In this study, the m indicators are discretized across n spatial units (30 m × 30 m pixels) to form an indicator matrix, from which the information entropy and weight of each indicator are derived. The detailed computational formulas are provided below:
P a i = Y a i a = 1 n Y a i
e i = a = 1 m P a i ln P a i ln m
w E i = 1 e i i = 1 m 1 e i
where Y a i is the standardized value of the i-th indicator in category a; e i is the information entropy of the i-th indicator; P a i is the eigenvalue of the indicator, with a = 1, 2, …, m and i = 1, 2, …, n; and w E i is the weight of the i-th indicator derived via the EWM.
(3)
Integrated AHP-Entropy
After deriving the subjective weights via AHP and the objective weights via EWM, a distance function is introduced to integrate both sets of weights. A linear combination method is then employed to calculate the composite weights for the preliminary suitability assessment of TDWSS.
The distance function is defined as follows:
d w A i ,   w E i = 1 2 i = 1 w A i w E i 2 1 2
Next, the weighting coefficients α and β are calculated as follows:
d w A i ,   w E i = 1 2 i = 1 w A i w E i 2 1 2
Finally, the composite weights for each indicator are calculated, as shown in the following formula:
W A H P E W M = α w A i + β w E i

3.2.3. Preliminary Selection of a Weighted Suitability Evaluation Model

Weighted overlay in ArcGIS is a spatial analysis method that superimposes multiple layers and assigns weights to each layer for comprehensive evaluation. Based on the suitability characteristics of each evaluation indicator, a grading system was established to quantify the influence of each factor on site suitability [41]. For point, line, and polygon features at various levels within each evaluation indicator, a five-point scoring scale was applied to score site selection suitability according to relevant regulations and the literature. Each evaluation indicator was classified into different suitability levels. Values {5, 4, 3, 2, 1} were assigned accordingly, with higher values indicating greater suitability, as shown in Table 3.
Based on the weight coefficients determined using SPCA, a multi-factor weighted evaluation model was applied to perform a weighted summation of the indicators. Consequently, the preliminary suitability score for TDWSS siting in Mentougou District was calculated. The calculation equation is as follows:
E = i = 1 n a i × W i
where E is defined as the preliminary suitability evaluation score for the siting of TDWSS; a i is the weight value of the i-th evaluation indicator (i = 1, 2, …, n); W i is the suitability level score of the i-th evaluation indicator; and n is the total number of evaluation indicators.

3.3. Selection of TDWSS Based on Constraint Conditions

The preliminary suitability map for TDWSS was refined by excluding candidate sites with low composite suitability scores, in accordance with defined siting constraints and the urban land-use master plan. Areas located within ecological protection redlines were further eliminated. Finally, plots with excessively small areas were excluded.

3.3.1. Analysis of Suitability Score for the Initial Selection

Rating-based screening was performed forthe suitability zones. Site suitability was assessed using a grading approach, with zones receiving higher scores identified as more suitable for TDWSS construction. In practice, the study area was classified using the natural breaks method into five categories: least suitable, unsuitable, moderately suitable, relatively suitable, and most suitable. To identify the most appropriate areas for TDWSS construction, only the most suitable and relatively suitable zones were retained, while the other suitability classes were discarded.

3.3.2. Removal of Ecological Protection Redline Areas

According to the Guidelines for Delineating Ecological Protection Redlines jointly issued by the National Development and Reform Commission and the Ministry of Environmental Protection of China in 2017, ecological protection redlines should generally be managed with reference to standards applied to areas where development is prohibited. Therefore, ecological protection redline areas within Mentougou District were screened out and removed.

3.3.3. Area Selection

Based on the estimated amount of disaster-related solid waste, the effective area of each TDWSS was determined to ensure that candidate sites had sufficient capacity to accommodate the disaster waste. In this study, estimation was conducted with reference to the following area estimation model proposed by Tajima et al. (Equation (8)) [42].
S = Q / α / H × ( 1 + θ )
where S is the footprint of the TDWSS [m2]; Q is the maximum amount of disaster waste at the TDWSS (t); α is the apparent specific gravity of waste (t/m3) (in this study, the apparent specific gravity of construction waste is shown in Table 2, and the apparent specific gravity of household goods wastes is taken as 0.1 t/m3); H is the stacking height of solid waste within the TDWSS, with a maximum value of 5 m; and θ is the ratio of the workspace area, which is taken as 0.8.

3.4. Optimal Selection of TDWSS Based on the Location-Allocation Model

Location-allocation analysis is a core method in regional service planning, as it supports the achievement of planning objectives through the precise determination of facility locations [43]. As a spatial analysis tool, location-allocation analysis can identifythe optimal layout of service facilities for demand points while comprehensively considering factors such as the shortest distance, transportation cost, facility capacity, and service carrying capacity, thereby achieving a reasonable match between demands and facilities [16]. Depending on specific siting objectives, six main location-allocation optimization models have been proposed, including the minimum facility location model, maximum coverage model, and minimum impedance model, maximum market share problem, target market share problem, and maximum capture problem [44].
The minimum facility location model, maximum coverage model and minimum impedance model were adopted in this study. The minimum facility location model determines the minimum number of candidate facility points required to cover all demand points. Under government financial constraints, it quantifies the optimal solution for achieving full coverage of solid waste collection and transportation services across the region. The maximum coverage model is applied through quantitative analysis and optimization of the service coverage of candidate facility sites. Using a specified service radius or time threshold as constraints, the model maximizes the spatial coverage efficiency of candidate facility sites over solid waste generation points. Its mathematical expression is provided in Equation (9) [45]. The minimum impedance model is employed for route optimization, with the objective of minimizing the transportation distance from each demand point to the nearest TDWSS. While ensuring service integrity, it helps to establish an efficient transportation network and substantially improves the responsiveness of the emergency collection system [46]. It can be expressed as Equation (10):
m i n   z 1 = j M c j
m a x   z 2 = i N j M h i j · y i j
m i n   z 3 = i N j M d i j · y i j
Constraint condition:
j M y i j = 1 , i N
y i j 0 , 1 , i N , j M
where the objective functions, z 1 , z 2 and z 3 , aim to minimize the number of facilities, maximize the coverage of solid waste generation points, and minimize the shortest transportation distance from solid waste generation points to TDWSS, respectively; i indexes the solid waste generation points; N is the set of solid waste generation points, N = (1, 2, …, n); j represents a TDWSS; j is the set of TDWSSs, M = (1, 2, …, n); c j indicates whether TDWSS j is selected; h i j indicates the number of solid waste generation points i covered by TDWSS j; d i j indicates the transportation distance from solid waste generation point i to TDWSS j; and y i j indicates whether storage point j is responsible for the waste transportation work of solid waste generation point i. If solid waste generation point i is in N and transportation is carried out by storage point j in M, then it is 1; otherwise, it is 0.

4. Results

4.1. Calculation Results of Solid Waste Generation During the Heavy Rain Disaster

The study used the “23·7” once-in-a-century heavy rainfall disaster in Mentougou District as an extreme scenario. Based on disaster statistics, including 178 affected administrative villages and 126 affected residential communities; approximately 310,000 affected people, accounting for 77% of the district population; and 34,918 collapsed or severely damaged houses, the quantities of construction waste and household goods waste were estimated.

4.1.1. Calculation Results of Construction Waste Generation

According to the 2020 Seventh National Population Census Data of Beijing, the residential building floor area in Mentougou District was 74.15 m2 per household, with 2.27 rooms per household. Thus, the number of households experiencing house collapse or severe damage during the “23·7” event was calculated as R = 34,918 ÷ 2.27 = 15,379. By substituting the building area of houses (S), the number of households with collapsed and damaged houses (R), and the construction waste generation index (q) into Equation (1), the amount of construction waste generated from the collapsed houses during the “23·7” rainstorm disaster was estimated to be approximately 1.6535 million tons.
Given the absence of publicly released official records on post-disaster construction waste removal, transport logs, or recovery reports in Mentougou District, direct validation of our estimates against ground-truth data was not feasible. As an alternative, we benchmarked our estimates against the empirical coefficients for construction waste generation and loss specified in the Technical Guidelines for Construction Waste Management in Earthquake-Affected Areas (Trial) (Ministry of Housing and Urban-Rural Development). This comparison offers a pragmatic test of reliability in the absence of authoritative operational data.
The guidelines specify construction waste generation rates for urban China: 1.0–1.5 t/m2 for reinforced concrete and mixed-structure buildings and 0.5–1.0 t/m2 for brick, wood, and steel-structure buildings. Rural areas adopt the lower limit of the corresponding range. According to Beijing’s Seventh National Population Census, reinforced concrete, mixed-structure and timber-frame buildings together account for 99.89% of the total building stock in Mentougou District. Using the lower limit of 1.0 t/m2 from the guidelines and multiplying by the total floor area of collapsed and severely damaged buildings, we obtain an estimated construction waste volume of approximately 1.14 × 10⁶ t. This indicates that the estimated construction waste generation results obtained in this study are scientifically sound and reliable and can serve as foundational data for subsequent estimates of TDWSS areas and spatial layout analyses.

4.1.2. Calculation Results of Household Goods Waste Generation

As shown in Table 4, the types, quantities, and weights of durable consumer goods per household in Mentougou District, Beijing, were determined [47]. The total weight per household was approximately 1948.13 kg. When these data were entered into Equation (2), the household goods waste ( Q h w s ) was estimated to be Q h w s = 15379 × 1948.13 = 3.00 × 10 4   t .
The total amount of disaster waste generated by the “23·7” rainstorm disaster in Mentougou is Q = Q c s + Q h w s = 1.6535 × 10 6   t + 3.04 × 10 4   t = 1.6839 × 10 6   t , which is approximately 1.6839 million tons. Based on the apparent densities of various types of construction waste and household goods waste, it is calculated that approximately 1,221,060 m3 of solid disaster waste was generated in Mentougou District during this rainstorm disaster, which is approximately 1.22 million m3.

4.2. Analysis of the Initial Suitability Evaluation Results of TDWSS

4.2.1. Analysis and Quantitative Classification of Initial Suitability Evaluation Indicators

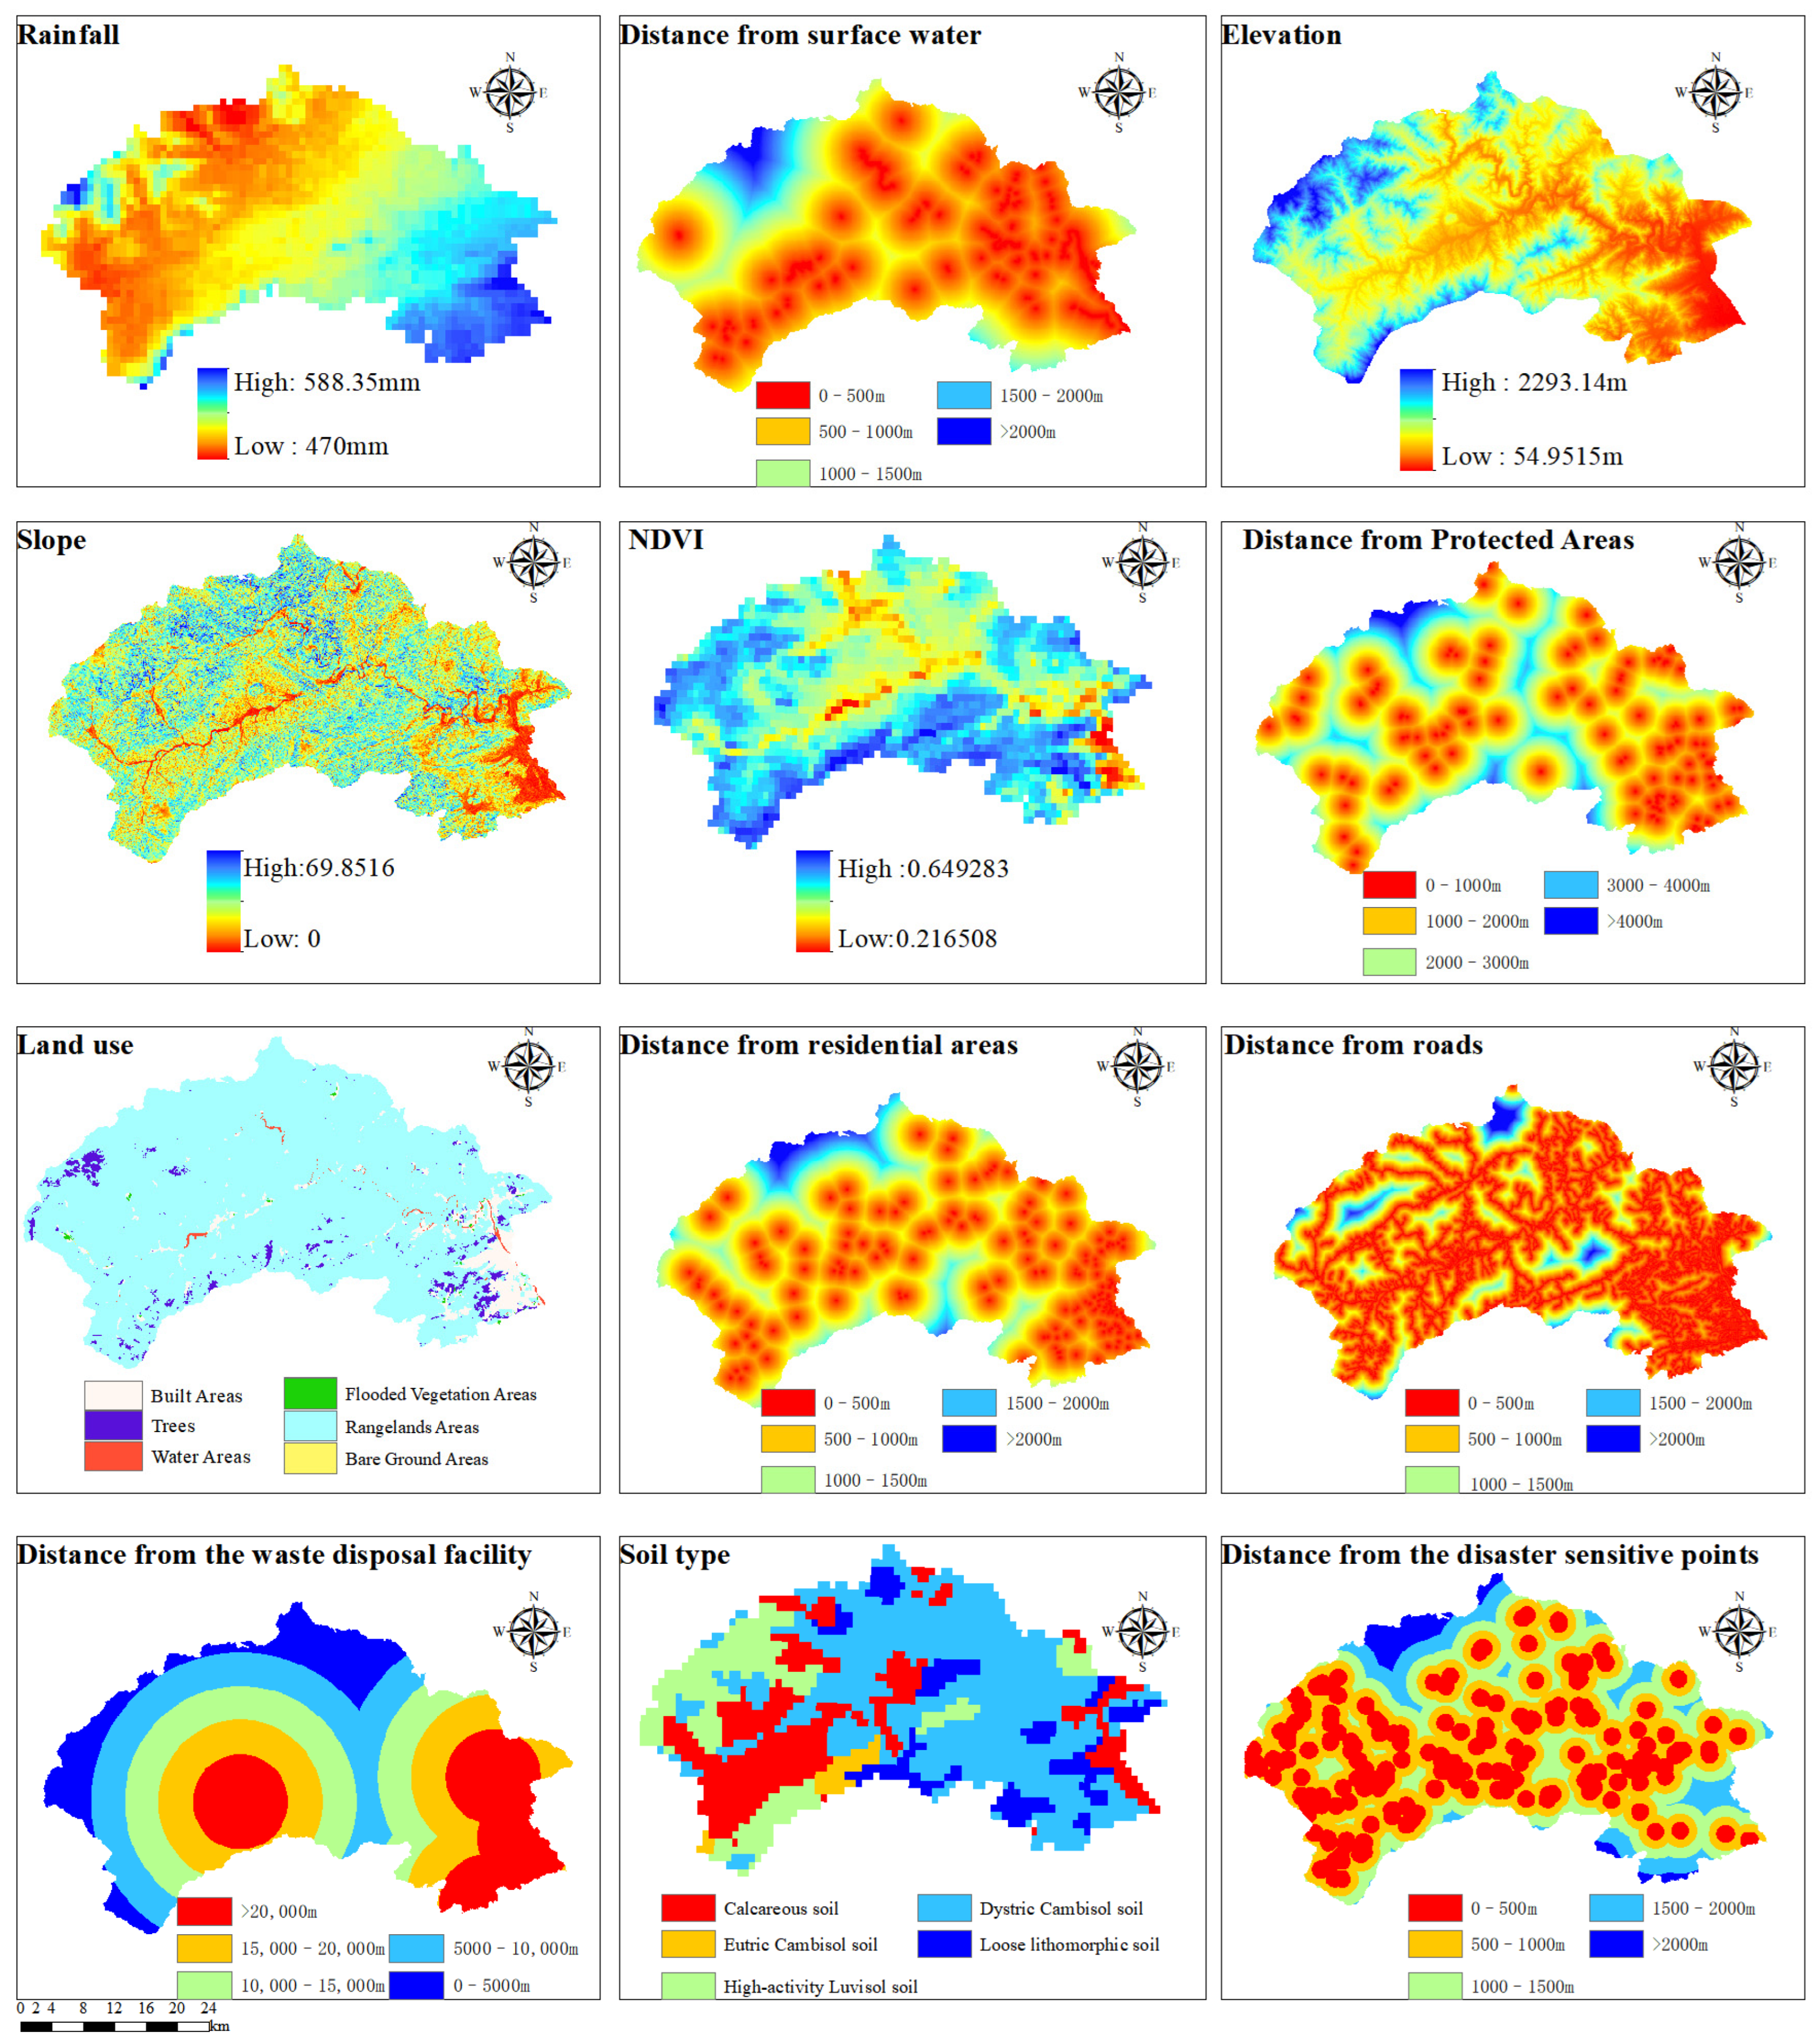
By systematically collecting the basic data required for the study, a spatial database corresponding to each influencing indicator was constructed. The 12 indicator layers were classified into two categories according to data structure: vector data including point, line, and polygon data, and raster data. The vector data included distance to surface water, distance to nature reserves, distance to residential areas, distance to major roads, distance to waste disposal facilities, and distance to geological hazard points. Using the analysis tools in the GIS toolbox, Euclidean distance calculation and multi-level buffer generation were performed for the vector data based on the mask, so that distance-based constraints could be converted into analyzable raster layers. The raster data factors included rainfall, elevation, slope, NDVI, land-use type, and soil type, and their original raster format was retained. Finally, the multi-source spatial impact indicator dataset was constructed, providing a unified spatial data basis for subsequent suitability evaluation, as shown in Figure 6.
To quantify the suitability of each influencing indicator for regional site selection, a reclassification analysis method was adopted. The influencing indicator layers were graded and assigned numerical values. Specifically, elements within each layer were divided into five levels and assigned values of 5, 4, 3, 2, or 1, respectively. Through this quantification, a systematic assessment of site suitability across different regions was achieved. The reclassification results are presented in Figure S1.

4.2.2. Calculation Results of Indicator Weights

This study adopts the AHP-EWM combined weighting framework to integrate expert-derived subjective judgment with data-driven objective information in deriving indicator weights.
(1)
Analytic Hierarchy Process (AHP) and Consistency Verification
We structured the evaluation of the TDWSS suitability into a three-tier hierarchy, with the site suitability assessment at the objective level, three criteria at the intermediate level (natural geographic, ecological environmental, and socioeconomic factors), and corresponding secondary indicators under each criterion. Pairwise comparison matrices were formulated based on expert judgment, and the consistency ratio (CR) was computed for each matrix (Table 5). The CR values for the criteria level and all indicator-level matrices were well below the 0.1 threshold, confirming acceptable consistency. This validates the internal coherence of the judgment matrices and the reliability of the resulting subjective weights.
As listed in Table 5, the consistency ratio (CR) for all hierarchical judgment matrices falls substantially below the critical limit of 0.1. The matrices demonstrate rigorous logical construction, and the expert evaluations contain no notable inconsistencies, lending strong internal coherence and credibility to the derived subjective weights. At the criterion level, natural geographic factors register the highest weight of 0.5396, followed by ecological and environmental factors at 0.2970, whereas socioeconomic factors score the lowest at 0.1634. These outcomes reveal that natural geographic conditions act as the primary subjective constraint when selecting locations for temporary solid waste storage facilities.
(2)
Entropy Weight Calculation
The entropy weight method (EWM) was applied to quantify objective weights for all secondary indicators. Calculations were performed using the dispersion features and information entropy of original spatial datasets across all evaluation items. Table 6 presents the entropy values, diversity coefficients and objective weights for the suitability assessment of TDWSSs, alongside corresponding weight rankings.
(3)
Combined Subjective and Objective Weights
The AHP-EWM hybrid weighting approach was employed to combine the rationality of AHP-derived subjective weights and the data objectivity of EWM-derived weights. Subjective weights from AHP, objective weights from EWM, and the final integrated weights were calculated for all evaluation indicators, with the results summarized in Table 7. A linear combination formula was used to compute the combined weights, where both weighting coefficients α and β were set to 0.5, equivalent to taking the arithmetic average of the two sets of weights.
The integrated AHP-EWM weighting framework merges the rationality of subjective expert judgments and the data-driven objectivity of entropy-based calculations. The resultant combined weights revealed that distance to surface water (0.1748), distance to major roads (0.1304) and distance to geological hazards (0.1215) ranked highest among all indicators. This confirms that water source protection, transport accessibility, and geological stability constitute the primary criteria for siting temporary solid waste storage facilities amid heavy rainfall.
By contrast, the Normalized Difference Vegetation Index (0.0172) and land-use type (0.0209) yielded low weights, implying limited influence on overall site suitability. The indicator for road proximity showed the largest divergence between subjective and objective results, with AHP yielding 2.7% and EWM 23.4%. The integrated weight reached 13%, which mitigates the inherent bias present when either method is used alone. The low objective weights for land use, soil type and vegetation index can be attributed to narrow data dispersion and uniform value distribution, a typical outcome for such parameters.
Collectively, the combined weights reconcile disparities between subjective evaluation and objective data analysis. They preserve the priority placed by AHP on fundamental constraints including natural geography and geological conditions, while incorporating the distinct data characteristics captured by EWM for variables such as transport accessibility. The final weight distribution therefore closely reflects the practical conditions across the study area.

4.2.3. Initial Suitability Evaluation Results and Analysis

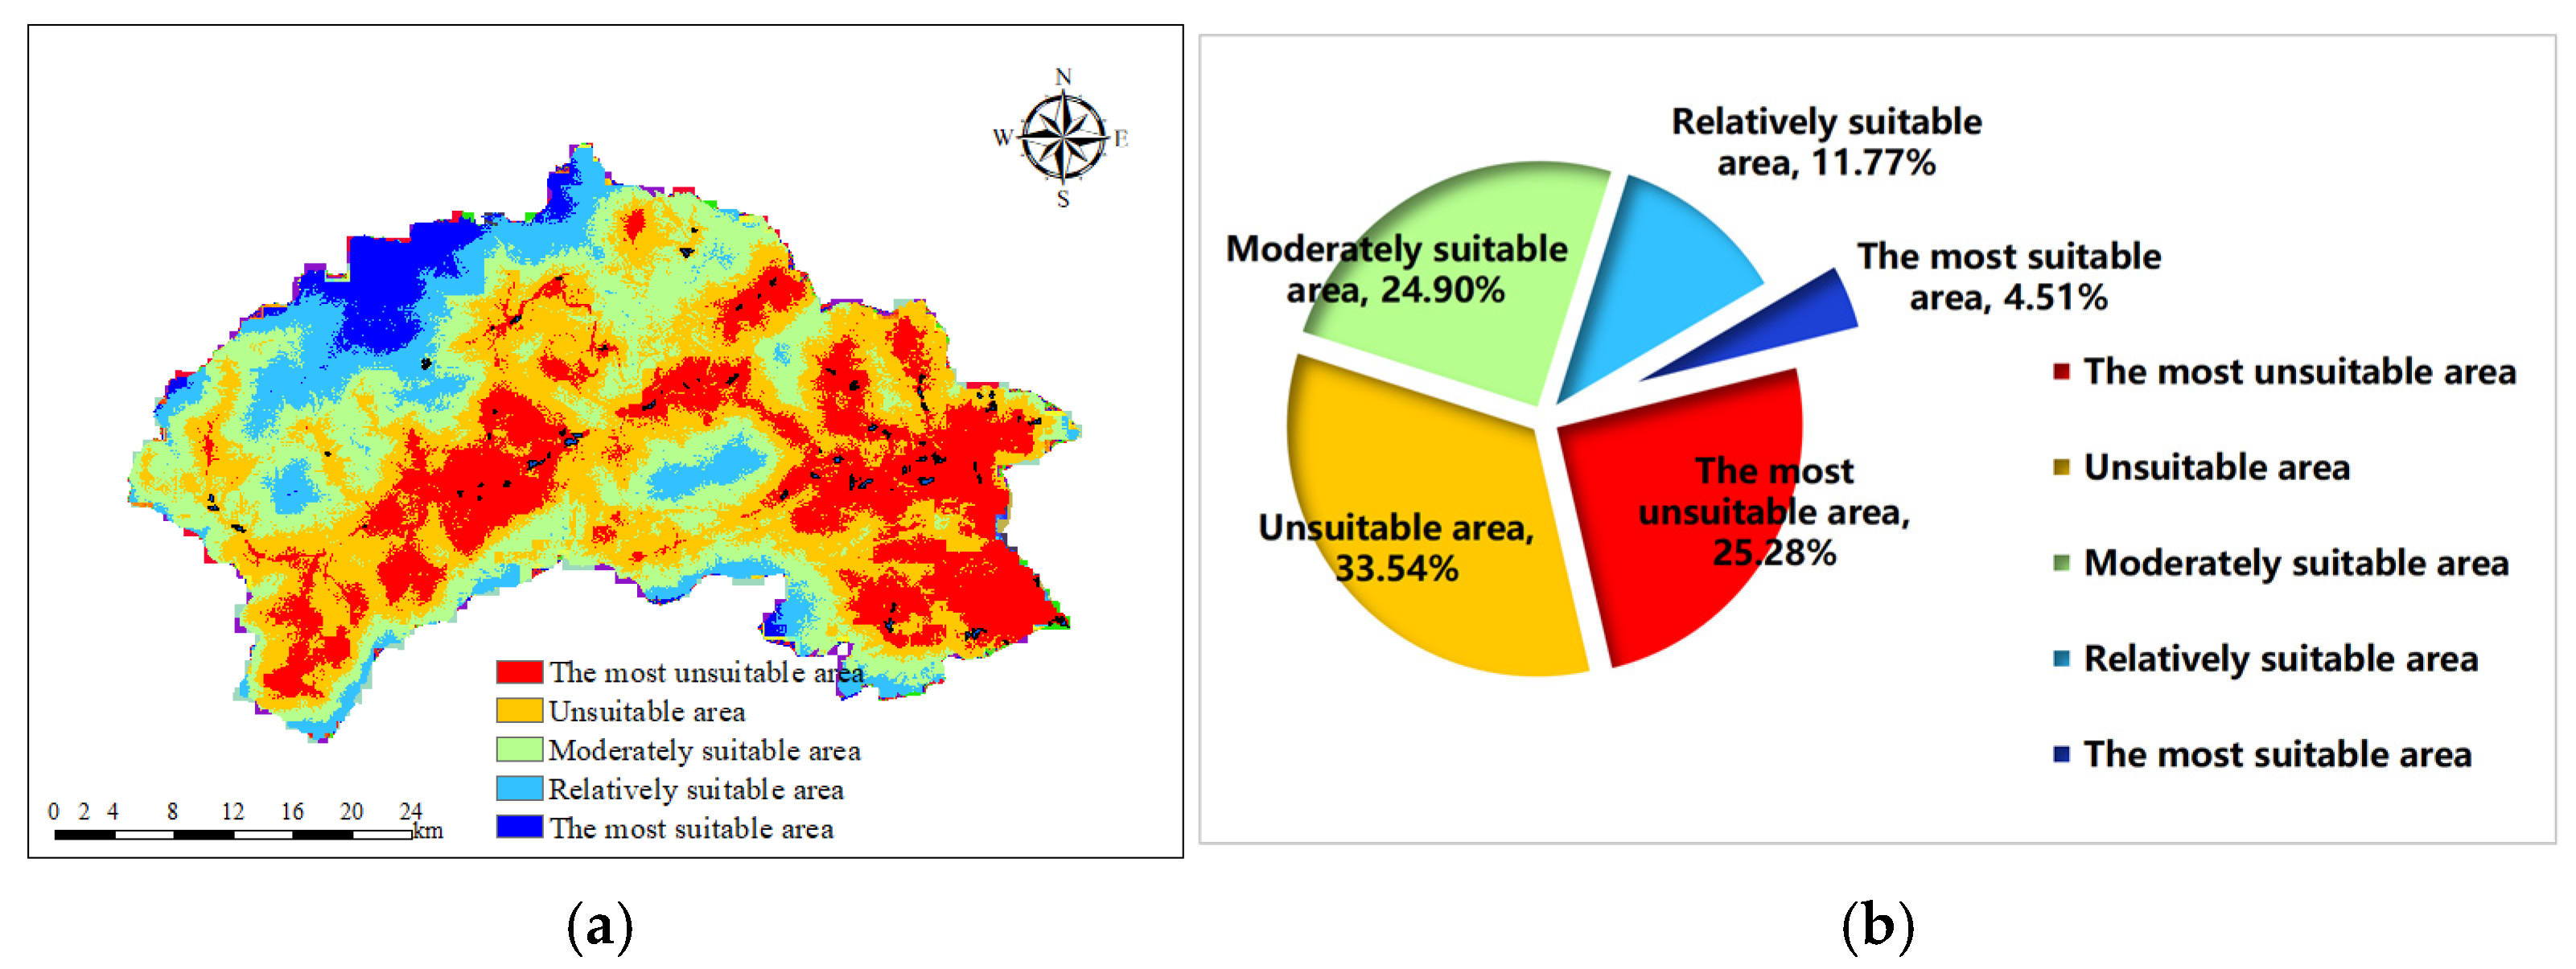
Based on the multi-factor weighted evaluation model and the weight of each evaluation indicator, the indicator raster layers were overlaid using the map algebra raster calculator in GIS. The TDWSS suitability evaluation for Mentougou District was then obtained. The suitability scores ranged from 1.7480 to 4.3042, indicating clear spatial heterogeneity in the suitability of different areas for temporary disaster waste storage. Using the natural breaks classification method, the scores were divided into five ranges: 1.7480–2.3995, 2.3995–2.7003, 2.7003–2.9910, 2.9910–3.4421 and 3.4421–4.3042. These range represent the most unsuitable, unsuitable, moderately suitable, relatively suitable, and the most suitable areas for TDWSS siting in Mentougou District, respectively. The resulting suitability pattern reflects the combined effects of topography, ecological constraints, and accessibility, The initial suitability zoning results for TDWSS in Mentougou District are shown in Figure 7a.
The statistical analysis results for the preliminary suitability evaluation areas are presented in Figure 7b. Clear differences can be observed in the area proportions of each suitability class. Specifically, 64.01 km2 was identified as the most suitable zone, accounting for 4.51% of the total study area. The relatively suitable zone covered 166.98 km2, accounting for 11.77% of the total area. The moderately suitable zone was measured at 353.20 km2, representing 24.90% of the total area. The unsuitable zone covered 475.96 km2, accounting for 33.54% of the total area. Finally, the least suitable zone covered 358.76 km2, accounting for 25.28% of the total area. These results indicate that the combined proportion of high-suitability areas, namely—the most suitable and relatively suitable zones—was relatively low. This low proportion of high-suitability land is mainly attributable to the complex topographical conditions and the stringent ecological protection requirements in Mentougou District, which limit the spatial resources available for the construction of TDWSS.

4.2.4. Weight Sensitivity Analysis and Spatial Simulation

Sensitivity analysis was performed to validate the stability of the AHP-EWM weighting model and the credibility of evaluation outputs. Two sets of tests were carried out: adjustment of the combination coefficient α and single-factor weight perturbation.
First, we adopted five scenarios for the weighting coefficient α: pure entropy weight method (α = 0), α = 0.25, α = 0.5, α = 0.75, and pure analytic hierarchy process (α = 1). We then compared the area of suitability zones across different scenarios and calculated their intersection over union (IoU) relative to the baseline case at α = 0.5. Detailed results are presented in Table 8.
The scenario results indicate that the area of highly suitable zones remained steadily between 4.4% and 5.0% within the reasonable coefficient range of α = 0.25–0.75, accompanied by only minor numerical fluctuations. The spatial overlap ratio with the baseline scenario (α = 0.5) ranged from 79% to 90%, demonstrating the robust stability of the site selection outputs across mainstream weighting configurations. In contrast, the purely objective weighting scenario (α = 0) substantially overestimated the highly suitable area at 8.09%, with a spatial consistency of merely 54.8% relative to the baseline, which confirms the necessity of incorporating AHP subjective constraints to correct pure data-driven bias. Accordingly, the weighting configuration of α = 0.5 adopted in this study is scientifically reliable.
Furthermore, a single-factor perturbation test of ±20% was implemented on the top five indicators with the highest combined weights, while the remaining indicator weights were proportionally adjusted to preserve overall normalization. Variations in the area of optimal suitable zones and their spatial consistency relative to the baseline scenario were statistically analyzed, with detailed outcomes presented in Table 9.
A quantitative analysis was conducted to assess the impact of fluctuations in the weighting of individual indicators on the overall evaluation results. The results of the perturbation test showed that, under a ±20% weighting perturbation for all indicators, the area of the optimal zone fluctuated only within a narrow range of 4.2% to 5.3%. The spatial overlap with the baseline scenario remained between 84.8% and 97.2%, with no significant spatial distribution shifts or abrupt changes in classification levels observed. Among these, the “distance from major roads” indicator exhibited relatively high sensitivity, while the “slope” indicator showed the lowest sensitivity, consistent with the characteristic of significant differences between subjective and objective weightings for this factor. Overall, no single factor was capable of overturning the evaluation results, and the model demonstrated low sensitivity to weight perturbations. This indicates that the model possesses strong resistance to interference from weight fluctuations, and the combined weighting results exhibit good stability and reliability.

4.3. Analysis of TDWSS Screening Results Based on Constraints

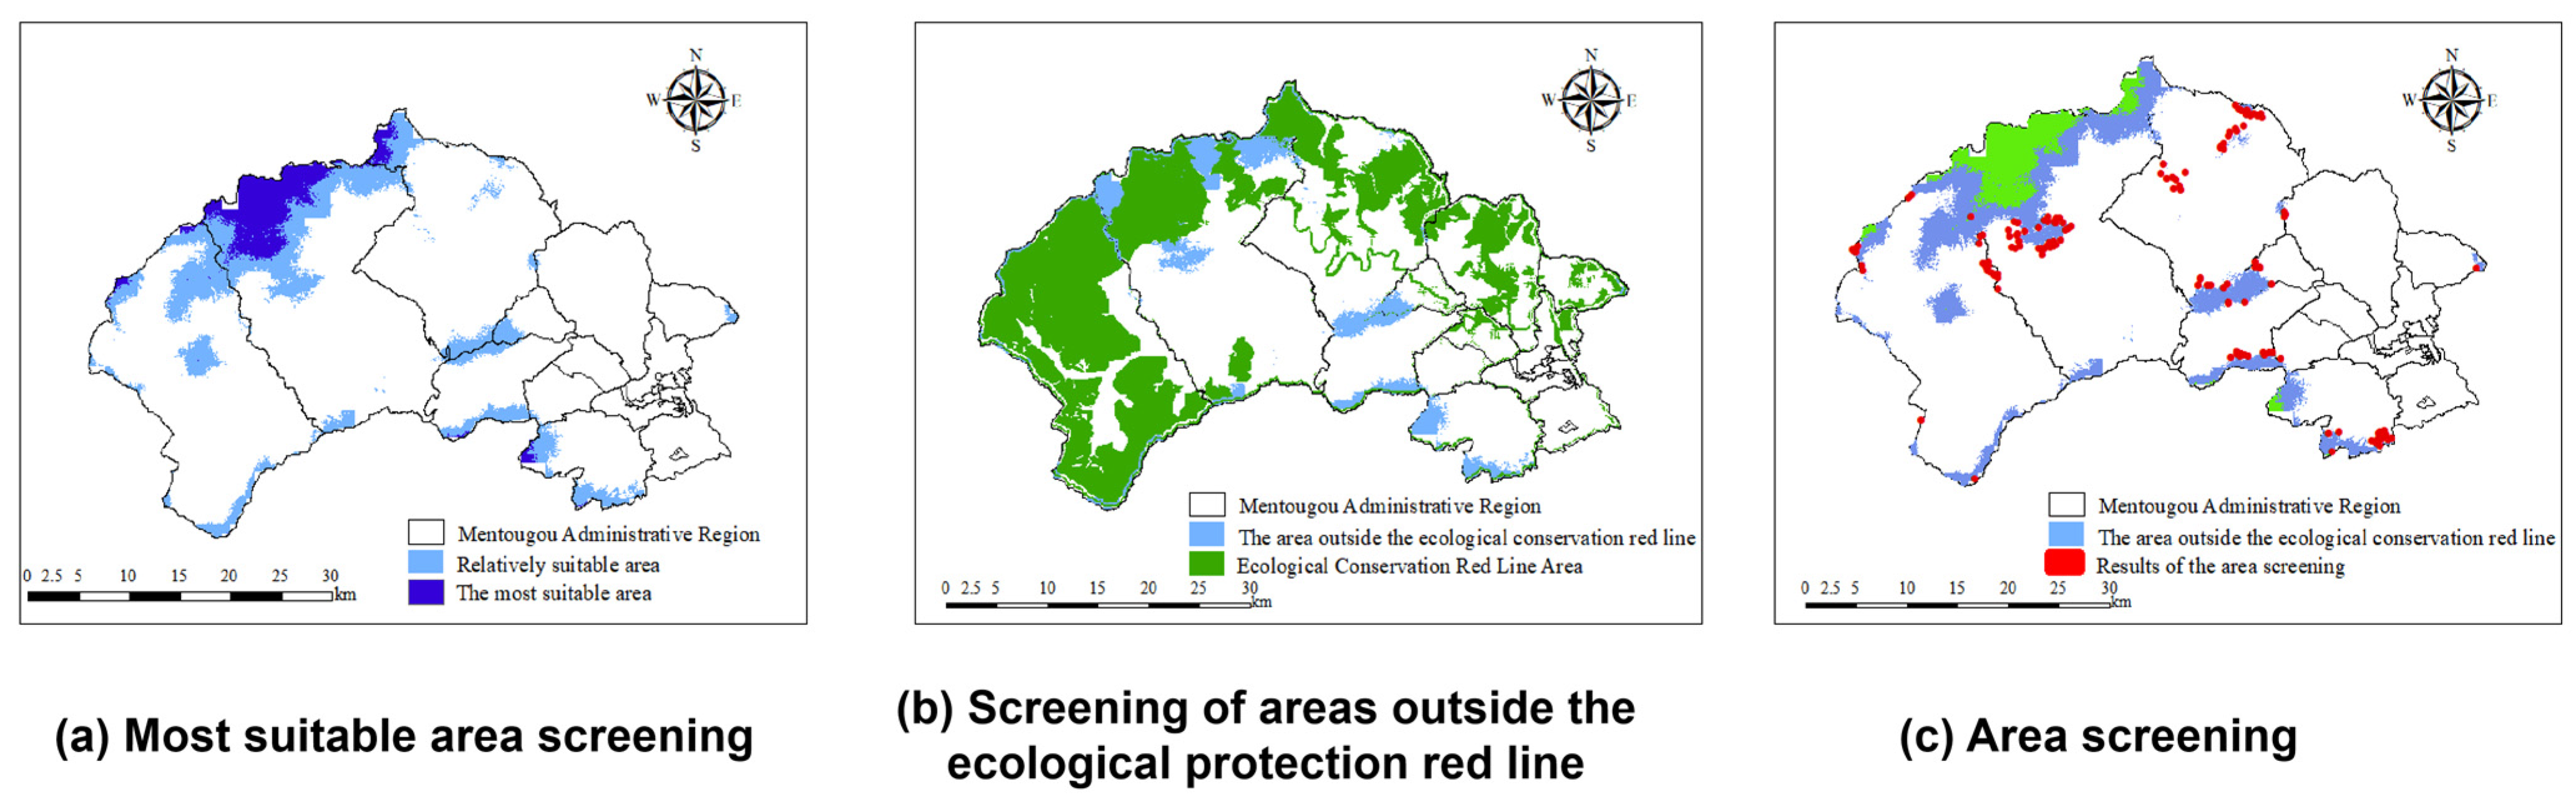
The preliminary suitability assessment yielded an extensive spatial extent of areas deemed suitable for TDWSS, thereby limiting its practical utility in guiding decision-makers toward specific candidate locations. To narrow the selection, areas classified as “moderately suitable,” “unsuitable,” and “most unsuitable” were excluded, retaining only the “most suitable” and “relatively suitable” categories as candidate sites (Figure 8a).
Based on the preliminary suitability classification, the most suitable and relatively suitable areas were pre-selected. GIS-based raster-to-polygon conversion and erasure operations were then applied to eliminate parcels within candidate zones where construction is prohibited. In this study, the ecological protection redline was designated as a no-construction zone, as defined in the Mentougou District Zoning Plan (Territorial Spatial Plan, 2017–2035) and illustrated by the green area in Figure 8b. After removing the most suitable areas and relatively suitable areas that intersect this redline, the retained candidate plots are depicted as the blue area in Figure 8b.
Finally, candidate sites were filtered by area to retain only those meeting the prescribed size criteria. To establish the area thresholds for candidate site selection, the total required storage area was first derived from the waste volume generated by the July 2023 “23·7” rainstorm disaster in Mentougou. Using Equation (3), the total waste volume of 1.68 million tons yielded a required area of 0.44 km2. According to the “Beijing municipal standard DB11/T 2078-2023 for construction waste disposal sites”, facilities are classified as large-, medium-, and small-scale based on their total storage and daily processing capacities, and the land area must be commensurate with the designated scale [48] (Table 10). Given the exceptional waste generated by this disaster, a large-scale facility was adopted. The standard further stipulates that large- and medium-scale sites incorporate an emergency storage zone with a capacity equivalent to at least three days of processing throughput. Accordingly, the minimum area of this emergency zone was determined to be S = 18,000 + 2000 1.45 × 3 0.5 = 44,275 m2 = 0.044 km2. Consequently, candidate sites were screened to an area range of 0.044–0.44 km2, as shown in Figure 8c.

4.4. Analysis of Optimal Selection Results of TDWSS Based on the Location-Allocation Model

A road network dataset for Mentougou District was built from OpenStreetMap data, with road length (meters) set as the cost attribute and “endpoint” connectivity enforced; disconnected segments were repaired to ensure topological integrity. A network dataset was then created in ArcGIS 10.2 to formalize the topological relationships among road elements. Candidate facility sites were defined as the geometric centroids of plots retained after the preliminary suitability screening and subsequent filtering. Demand points were placed at the administrative village committee locations, geocoded via the Baidu Maps API. The impedance for network analysis was the shortest-path distance (meters) along the road network. Three location-allocation models (the minimum facility location model, the maximum coverage, and the minimum impedance model) were solved within the ArcGIS Network Analyst framework to optimize the spatial configuration of temporary solid waste storage sites. Distance metrics were differentiated by analysis stage: in the suitability assessment, Euclidean distances were used to derive proximity indicators (e.g., distance to residential areas); in the location-allocation phase, network distances (shortest paths) between facilities and demand points were adopted, calculated using the OD cost matrix tool.

4.4.1. Construction of the Minimum Facility Location Model Based on the Road Network

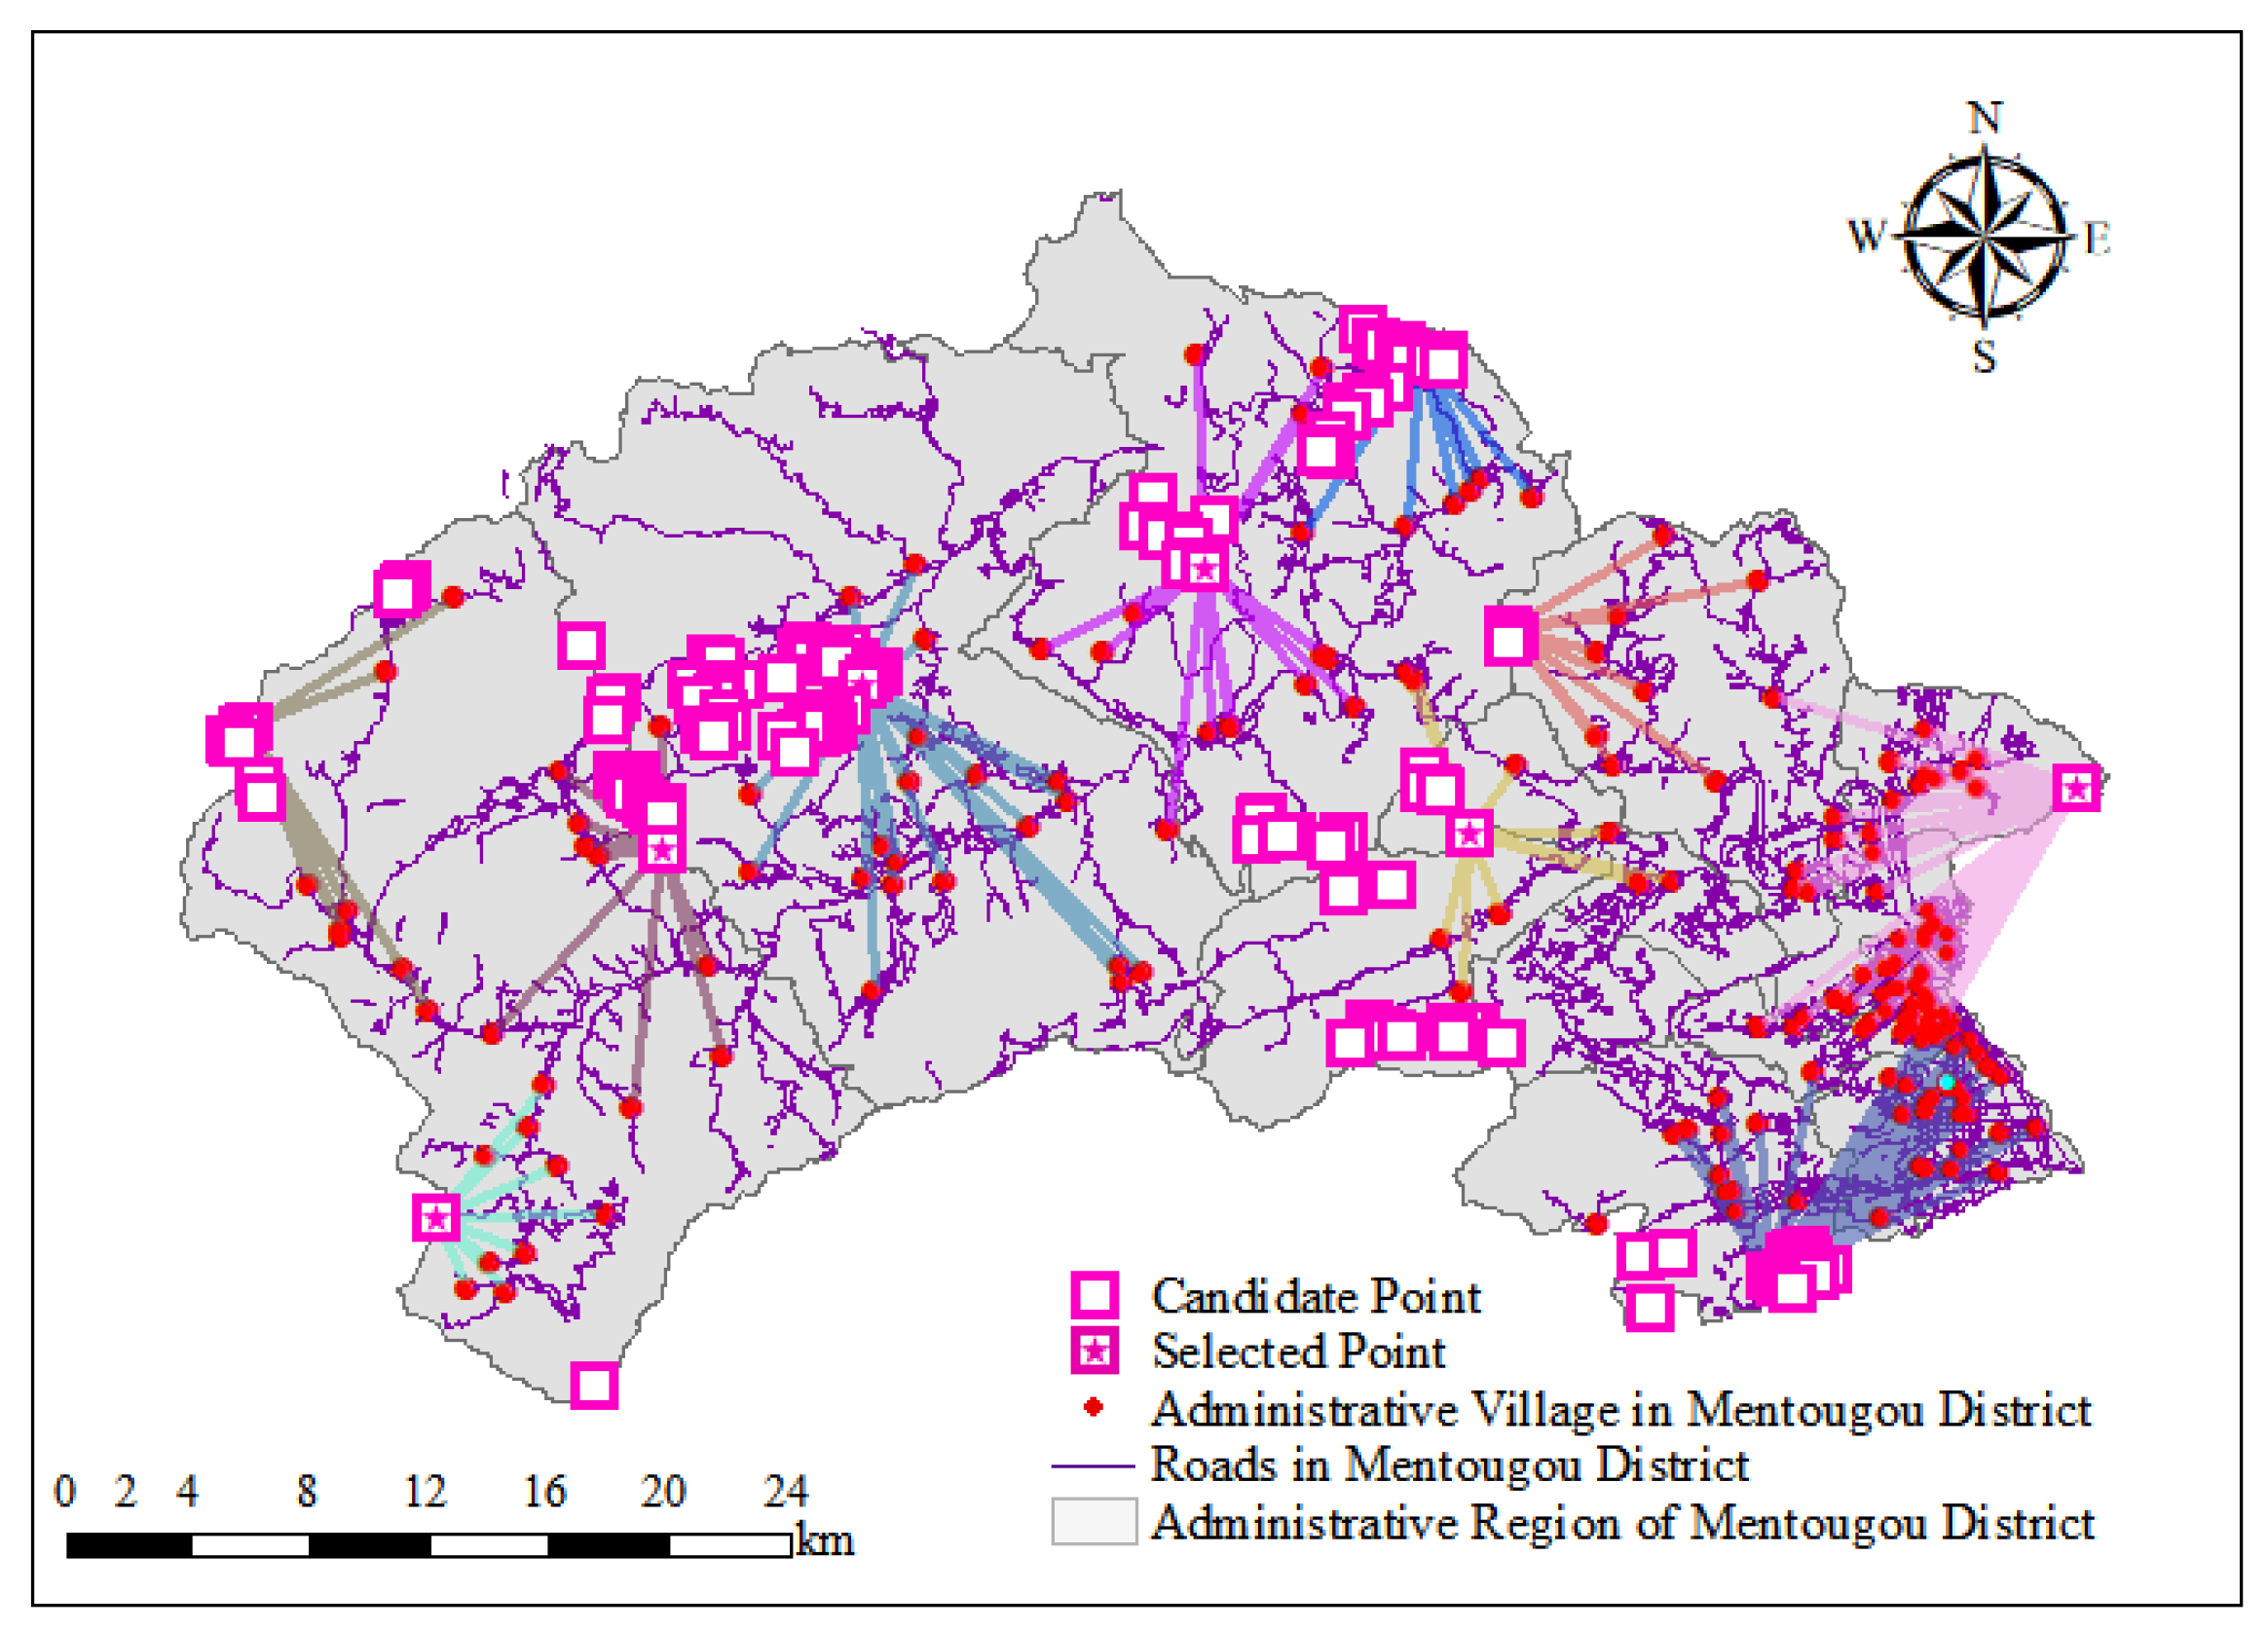
The minimum facility point model was adopted to allocate the demand points of the TDWSS, enabling the system to automatically calculate the minimum number of TDWSS required to fully meet the waste collection and transportation needs of each administrative village in Mentougou District. Based on the road network dataset of Mentougou District, the problem of minimizing facilities was addressed using the location-allocation model in ArcMap. According to the Urban Environmental Sanitation Facilities Planning Standard (GB/T 50337-2018, [49]), large-and medium-sized waste transfer stations should preferably be established when the average waste transportation distance exceeds 20 km. Accordingly, the impedance threshold was set to 20 km, and the minimum facility point model was selected for network analysis and solution until the selected facility points covered all demand points in the study area, as shown in Figure 9. The calculation results show that, under the minimum facility point model, at least ten TDWSSs are required to cover all administrative villages within a 20 km service radius.

4.4.2. Construction of the Maximum Coverage Based on the Road Network

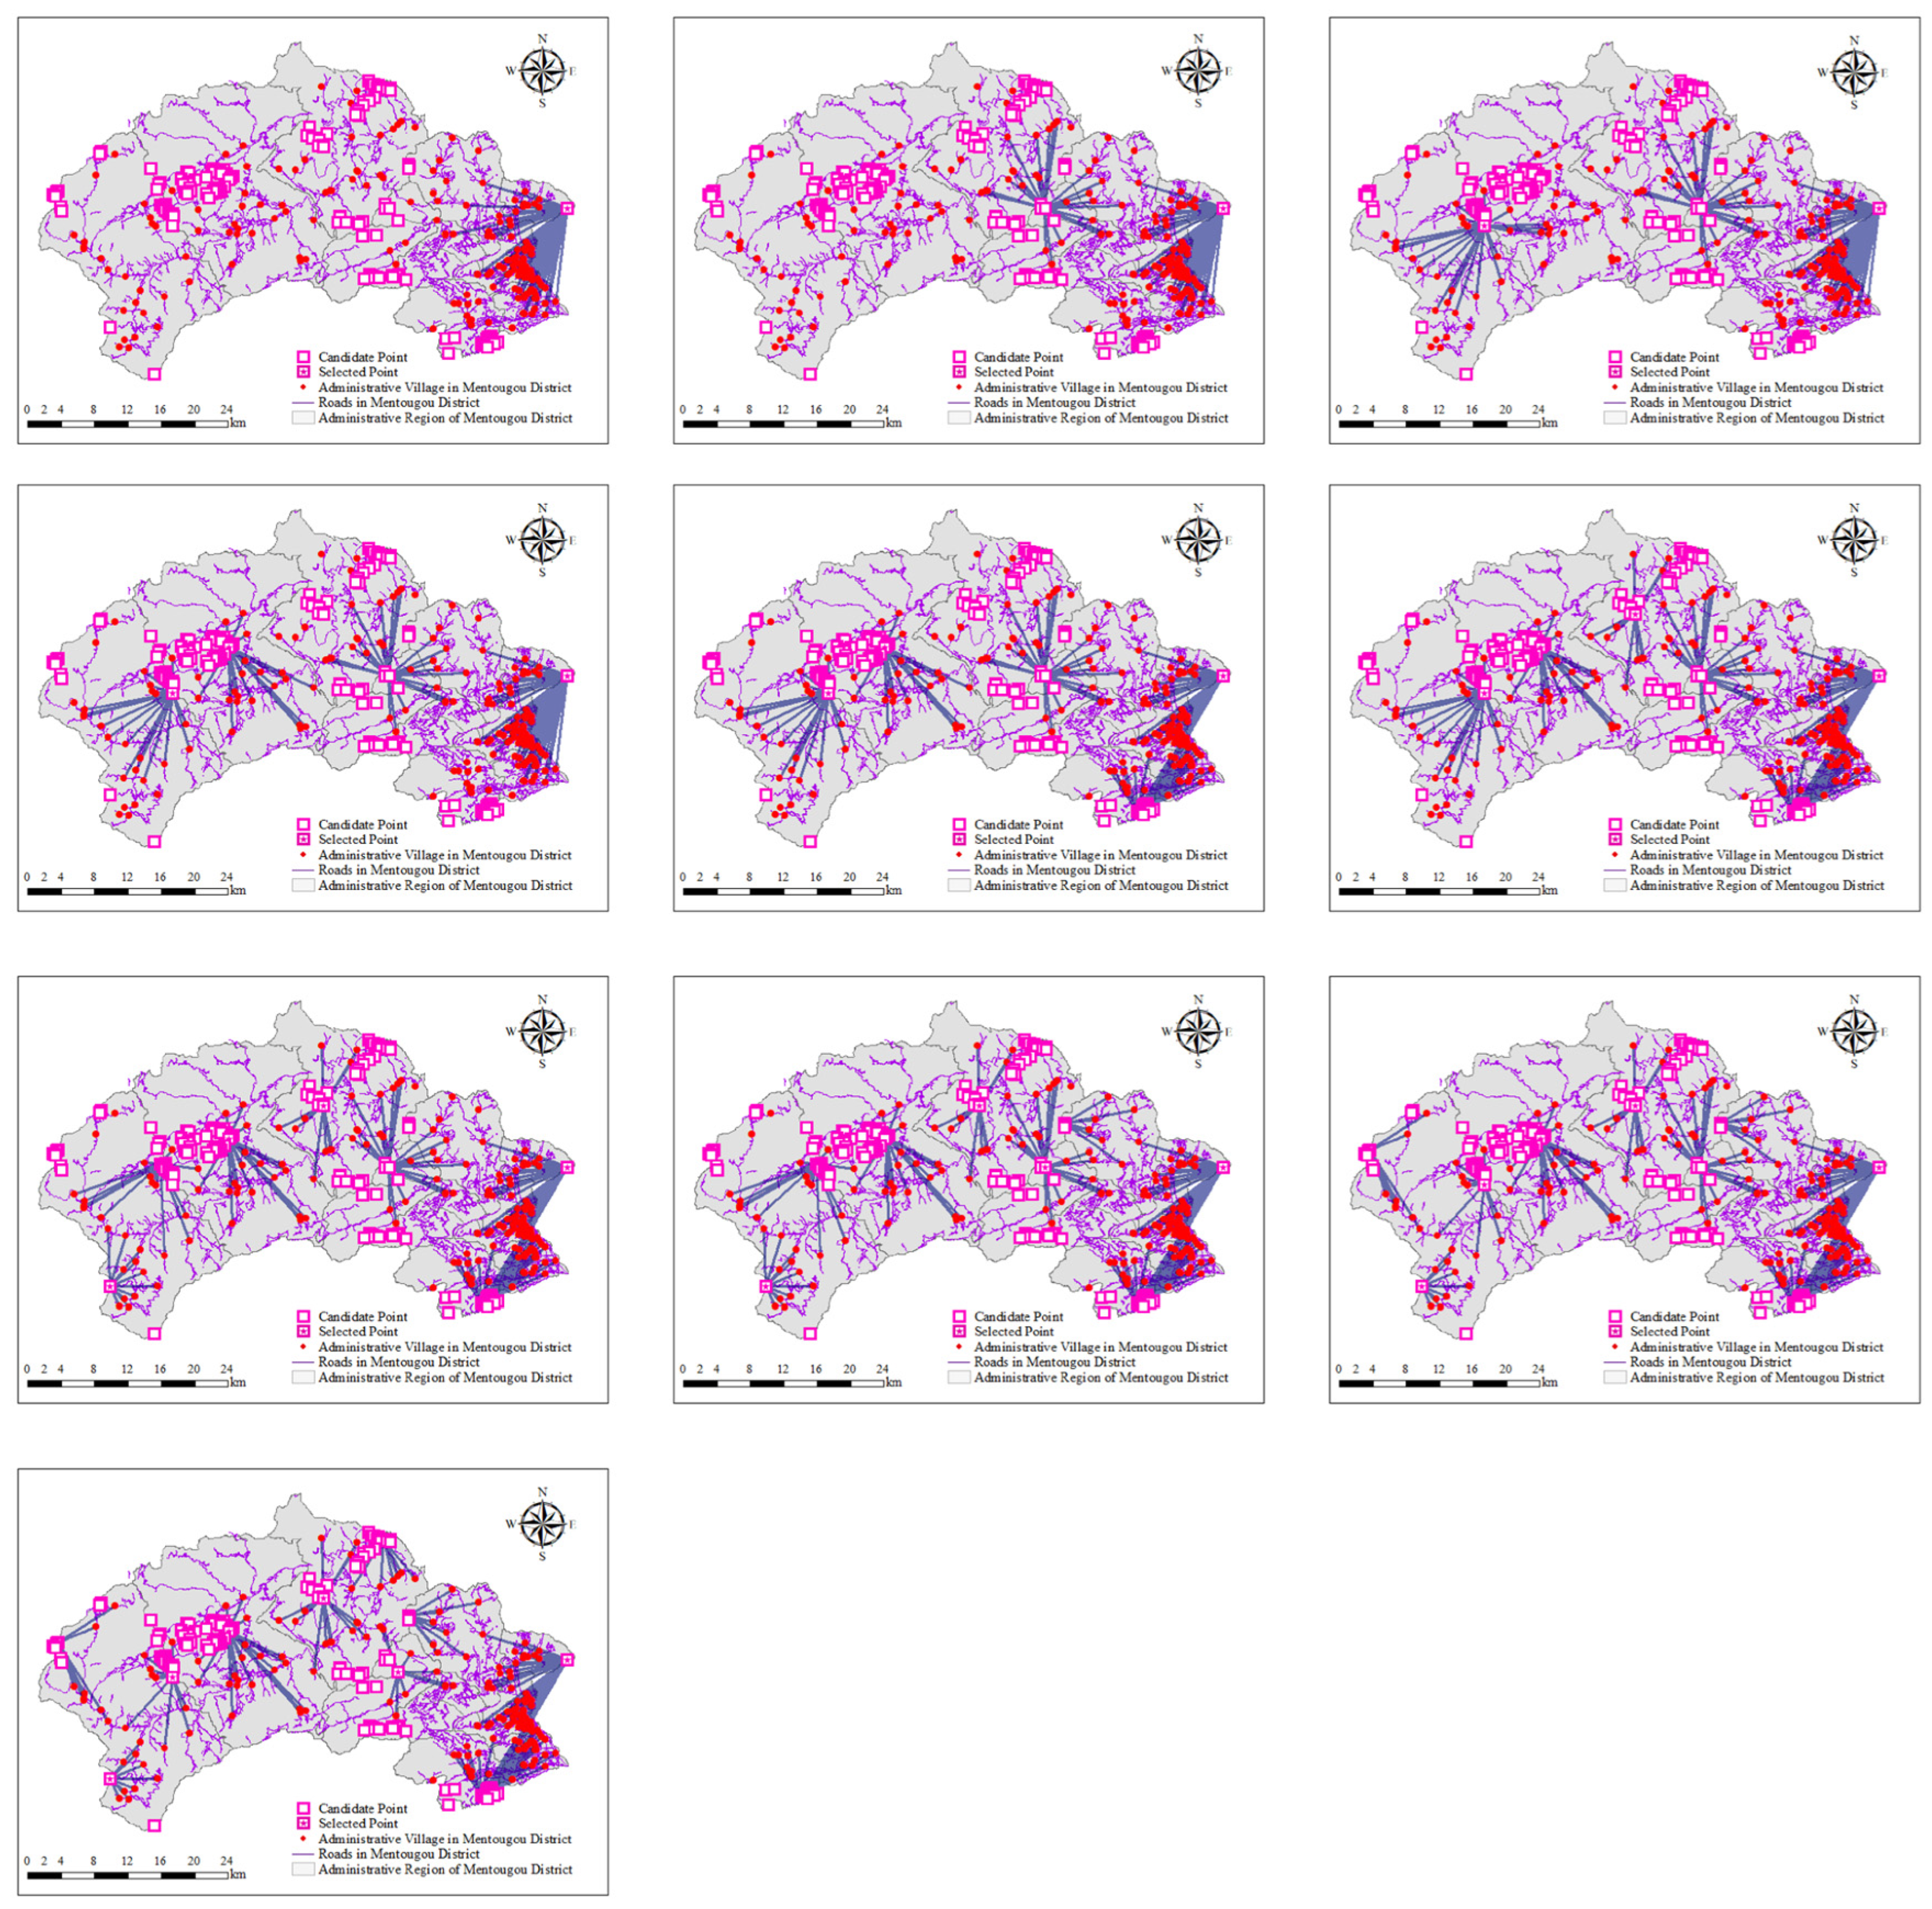
The maximum coverage model refers to a solution that selects a fixed number of candidate sites to serve the maximum number of demand points across the widest possible area. This study used 147 candidate sites as the basis for site selection optimization. By applying the maximum coverage model using GIS network analysis tools and setting a fixed emergency service radius of 20 km, layout schemes for 1 to 10 temporary solid waste storage sites were derived. The results are shown in Figure 10. The total transportation distance (km) within a 20 km radius, the number of administrative villages covered, the coverage rate, and the improvement in coverage rate were calculated for each deployment scale, with the results shown in Table 11.
In terms of the marginal effect of coverage rate, the number of covered administrative villages and the overall coverage rate keep rising with the increase in TDWSSs, while the growth rate gradually slows down. When the number of TDWSS increases from 1 to 2, the coverage rate rises by 23.93%, representing the largest growth throughout the whole process and a remarkable expansion of service scope. When the total number reaches 7, the coverage rate hits 97.38%, with just 2.62% of administrative villages lying beyond the 20 km service radius. As the number of TDWSSs increases from 7 to 10, each additional site raises the coverage rate by only 0.98%, 0.66% and 0.33% respectively. The final coverage rate with 10 sites is 99.34%, an increase of just 1.96% compared with the scheme of 7 sites. Although six more administrative villages are covered, three extra TDWSSs need to be constructed. It is evident that seven sites mark the critical turning point where marginal benefits shift from rapid growth to near stagnation, and further expansion of facilities yields negligible improvement in coverage. Therefore, seven TDWSSs are determined as the optimal solution under the maximum coverage model.
In terms of collection and transportation efficiency, as the number of TDWSSs increases from 1 to 10, the average transportation distance decreases from 13.98 km to 10.41 km, a total reduction of 25.5%. This indicates that additional TDWSSs can effectively shorten the haulage distance from each administrative village to the nearest facility, thereby cutting fuel consumption and time costs per vehicle trip. The total transportation distance presents a trend of rising first and then falling with the growing number of sites. When the number increases from 1 to 4, the total transportation workload rises sharply as the number of covered administrative villages expands rapidly from 161 to 273. Starting from the fifth site, the distance reduction effect brought by layout optimization gradually outweighs the impact of increased transportation tasks. Despite the continuous growth in the number of covered villages, the total transportation distance declines steadily. Meanwhile, the average transportation distance drops sharply from 13.09 km at four sites to 11.59 km at five sites, representing the most prominent improvement in operational efficiency. When six sites are deployed, the coverage rate reaches 95.41%, which can meet routine emergency demands. Nevertheless, the average transportation distance remains between 11.55 km and 13.98 km, and long-distance haulage for some villages is not fully resolved. With seven sites in place, the coverage rate climbs to 97.38%, leaving only 2.62% of administrative villages outside the 20 km service radius. The average transportation distance further decreases to 11.46 km, with the total transportation distance standing at 3402.40 km. A further increase to 10 sites brings the total transportation distance down to 3153.27 km, a reduction of merely around 249 km, and the average transportation distance slightly falls to 10.41 km from 11.46 km. To achieve a coverage increase of less than 2%, three more TDWSSs need to be constructed. The savings in transportation costs are far from offsetting the extra expenses incurred by land occupation, infrastructure construction and subsequent operation and maintenance.
From the perspective of emergency management, a high coverage rate improves emergency response resilience, while excessive facilities may lead to resource dispersion. A higher coverage rate allows more administrative villages to access TDWSSs within a 20 km radius during sudden environmental incidents, shortening the emergency transportation time and enabling timely pollution control. A coverage rate above 95%, achieved with 6 to 7 sites, covers the vast majority of the study area with nearly no emergency blind spots. In addition, a multi-site layout creates operational redundancy. If one TDWSS becomes inaccessible due to damaged roads, adjacent facilities can serve as an effective alternative. For instance, a network of 10 sites limits the impact of single-site failures compared with a 5-site setup, delivering greater system robustness. However, a larger number of sites also increases the complexity of routine inspection, maintenance, staff training and emergency coordination. In practical emergency management, once the coverage rate exceeds 97%, adding more facilities yields only marginal improvements to emergency response capacity. Meanwhile, dispersed resources may weaken the material reserve and waste disposal capacity of individual sites.
In summary, compared with the full-coverage scheme of 10 TDWSSs, the 7-site layout eliminates the construction of 3 additional facilities, substantially reducing land occupation, infrastructure investment, and long-term operation and maintenance costs. This scheme better adapts to local fiscal constraints for emergency facility construction and presents higher practical feasibility. By contrast, schemes with one to six sites yield a maximum coverage rate of only 95.41%, leaving substantial service gaps. During severe rainstorm disasters, such insufficient coverage requires long-distance cross-regional waste transportation, which prolongs the disposal cycle and increases leakage risks, failing to meet mandatory emergency management requirements. Notably, the seven-site configuration does not represent an upper limit for regional capacity. If future environmental risks intensify due to expanded chemical production or sharply increased solid waste output, two to three additional sites can be incorporated into the existing layout to achieve full spatial coverage. This flexible upgrade avoids overhauling the current spatial arrangement and ensures strong long-term planning adaptability.

4.4.3. Construction of the Minimum Impedance Model Based on the Road Network

With the optimal number of TDWSSs is established (i.e., 7), which can essentially cover all administrative villages in Mentougou District, the focus should shift to improving collection and transportation efficiency and shortening vehicle travel distance. In other words, the problem is transformed into a minimum impedance problem with fewer constraints imposed by the maximum transportation distance. Therefore, the best solution is to combine the two types of models. First, the suitable number of facilities is determined using the maximum coverage model, and then the minimum impedance model is used to identify facility locations that minimize the total vehicle transportation distance. The resulting seven-TDWSS layout obtained using the minimum impedance model is shown in Figure 11.

5. Conclusions

This study developed and tested a siting framework that translates post-disaster waste volumes into an actionable network of TDWSSs. Using the “23·7” rainstorm in Mentougou District as a case study, we estimated that approximately 1.68 million tons, equivalent to 1.22 million cubic meters, of construction waste and household goods waste was generated. Based on this estimate, a total of 0.44 square kilometers of land is required for the TDWSSs. To this end, this study proposed an “initial selection—screening—optimization” framework for TDWSSs, based on the spatial analysis and network analysis functions of GIS. Twelve indicators spanning physical geography, ecological constraints, and socio-economic factors were weighted through an AHP-EWM scheme that blends expert judgment with data-driven entropy weighting. Weighted overlay analysis yielded an initial suitability map. Ecological redline boundaries and the Beijing construction-waste site standard (DB11/T 2078-2023) were then applied to screen candidate plots within the 0.044–0.44 km2 range. Finally, three location–allocation models—facility minimization, coverage maximization, and impedance minimization—were solved against the village-level demand pattern. The combined solution provided locations for seven TDWSSs, covering 97.38% of the administrative villages.
This study developed a three-stage site selection framework—namely, preliminary screening, secondary screening, and final optimization—for emergency TDWSSs amid rainstorm disasters by adopting GIS spatial analysis. This framework can rapidly determine the number and spatial layout of post-disaster emergency storage sites and meets the practical requirement of deploying temporary storage facilities shortly after disasters and supports decision-making by emergency managers throughout all disaster relief phases.
Restricted by the lack of refined data on solid waste generation in the early post-disaster emergency period, this study treats all administrative villages as demand units with identical weights, without assigning differentiated weights according to the actual solid waste output of each village. Therefore, further research at refined spatial scales is needed to improve the estimation of generated solid waste and weight setting for demand points. Optimizing the differentiated weighting system based on field survey data is critical to enhance the accuracy of site selection and the rationality of decision-making. Furthermore, the model was established on the basis of an intact road network and fails to account for real-world disruptions such as road collapse and traffic congestion caused by disasters. Similar existing studies generally suffer from overly coarse division of demand units and inadequate simulation of dynamic road damage induced by disasters [14]. In follow-up research, field investigations will be conducted to obtain high-precision data on solid waste generation during post-disaster emergency response, in order to improve the weighting system for collection and transportation demand at each waste generation point. Multi-scenario simulation will also be applied to reconstruct road network conditions under different disaster magnitudes, thereby improving the adaptability and precision of the site selection model.
Overall, the selection of sites for emergency TDWSSs is a sophisticated systematic project. In addition to the suitability of candidate sites, limited available emergency resources and evacuation demand, it also requires the consideration of dynamic variations in post-disaster road connectivity, spatiotemporal uncertainty of solid waste output, and compound disaster scenarios. In order to address the uncertain model parameters, balance multiple objective functions, and various constraints, advanced modelling platforms, specialized computing software, and intelligent solution algorithms are necessary. These will be the core research priorities for optimal post-disaster emergency facility site selection in the future.

Supplementary Materials

The following supporting information can be downloaded at https://www.mdpi.com/article/10.3390/su18126154/s1: Table S1: Summary of influencing factors of site selection in the literature research; Table S2: Requirements for TDWSS; Table S3: Site selection standards for TDWSS. Figure S1. Reclassified Result Layers of Factors Affecting TDWSS Site Selection. References [13,14,24,25,26,27,28,29,30,31,32,33,34] are cited in the Supplementary Materials.

Author Contributions

Conceptualization, Y.L. and W.F.; methodology, W.F.; software, Y.L. and Y.Q.; validation, Y.L. and W.F.; formal analysis, A.Y.; investigation, H.C.; resources, A.Y.; data curation, W.F. and Y.Q.; writing—original draft preparation, Y.L.; writing—review and editing, Y.L., Y.Q. and W.F.; visualization, Y.L.; supervision, H.C. and A.Y.; project administration, Y.L.; funding acquisition, Y.L. All authors have read and agreed to the published version of the manuscript.

Funding

This research was funded by “The Cultivation project Funds for Beijing University of Civil Engineering and Architecture (X24025)”. This research was funded by “R&D Program of Beijing Municipal Education Commission”, grant number SZ202110016008.

Institutional Review Board Statement

Not applicable.

Informed Consent Statement

Not applicable.

Data Availability Statement

The original contributions presented in this study are included in the article/Supplementary Material. Further inquiries can be directed to the corresponding authors.

Conflicts of Interest

Author Yao Qu was employed by the CUCDE Environmental Technology Co., Ltd., Beijing. Author Ajuan Yuan was employed by Beijing Jin Yu Hongshulin Environmental Technology Co., Ltd. The remaining authors declare that the research was conducted in the absence of any commercial or financial relationships that could be construed as a potential conflict of interest.

References

  1. Hasanzadeh Nafari, R.; Ngo, T.; Mendis, P. An Assessment of the Effectiveness of Tree-Based Models for Multi-Variate Flood Damage Assessment in Australia. Water 2016, 8, 282. [Google Scholar] [CrossRef] [Scilit]
  2. Keith, S. Environmental Hazards: Assessing Risk and Reducing Disaster; Routledge: Abingdon, UK, 2013. [Google Scholar]
  3. García-Torres, S. Methodology to Characterize and Quantify Debris Generation in Residential Buildings after Seismic Events. Resour. Conserv. Recycl. 2017, 117, 151–159. [Google Scholar] [CrossRef] [Scilit]
  4. Brown, C.; Milke, M.; Seville, E. Disaster Waste Management: A Review Article. Waste Manag. 2011, 31, 1085–1098. [Google Scholar] [CrossRef] [Scilit]
  5. Fetter, G.; Rakes, T. Incorporating Recycling into Post-Disaster Debris Disposal. Socio-Econ. Plan. Sci. 2012, 46, 14–22. [Google Scholar] [CrossRef] [Scilit]
  6. Denot, A. Prevention and Management of Waste Resulting from Natural Disasters. Waste Manag. 2016, 58, 1–2. [Google Scholar] [CrossRef] [Scilit] [PubMed]
  7. Wakabayashi, Y. Life Cycle Assessment and Life Cycle Costs for Pre-Disaster Waste Management Systems. Waste Manag. 2017, 68, 688–700. [Google Scholar] [CrossRef] [Scilit]
  8. Kim, J.; Deshmukh, A.; Hastak, M. Selecting a Temporary Debris Management Site for Effective Debris Removal. In Proceedings of the 10th International Conference of the International Institute for Infrastructure Resilience and Reconstruction (I3R2), Lafayette, IN, USA, 20–22 May 2014; pp. 214–218. [Google Scholar] [CrossRef] [Scilit]
  9. US Environmental Protection Agency. Planning for Natural Disaster Debris; US Environmental Protection Agency: Washington, DC, USA, 2019.
  10. Crowley, J. A Measurement of the Effectiveness and Efficiency of Pre-Disaster Debris Management Plans. Waste Manag. 2017, 62, 262–273. [Google Scholar] [CrossRef] [Scilit]
  11. Jalloul, H.; Choi, J.; Yesiller, N.; Manheim, D.; Derrible, S. A Systematic Approach to Identify, Characterize, and Prioritize the Data Needs for Quantitative Sustainable Disaster Debris Management. Resour. Conserv. Recycl. 2022, 180, 106174. [Google Scholar] [CrossRef] [Scilit]
  12. Grzeda, S.; Mazzuchi, T.A.; Sarkani, S. Temporary Disaster Debris Management Site Identification Using Binomial Cluster Analysis and GIS. Disasters 2014, 38, 398–419. [Google Scholar] [CrossRef] [Scilit]
  13. Habib, M.S.; Sarkar, B. An Integrated Location-Allocation Model for Temporary Disaster Debris Management under an Uncertain Environment. Sustainability 2017, 9, 716. [Google Scholar] [CrossRef] [Scilit]
  14. Lontoc, G.D.; Diola, M.B.L.D.; Peralta, M.H.T. Multi-Criteria Evaluation of Suitable Locations for Temporary Disaster Waste Storage Sites: The Case of Cavite, Philippines. J. Mater. Cycles Waste Manag. 2023, 25, 2794–2808. [Google Scholar] [CrossRef] [Scilit]
  15. Chukwuma, E.C. Facility Location Allocation Modelling for Bio-Energy System in Anambra State of Nigeria: Integration of GIS and Location Model. Renew. Energy 2019, 141, 460–467. [Google Scholar] [CrossRef] [Scilit]
  16. Lei, T.L.; Church, R.L.; Lei, Z. A Unified Approach for Location-Allocation Analysis: Integrating GIS, Distributed Computing and Spatial Optimization. Int. J. Geogr. Inf. Sci. 2016, 30, 515–534. [Google Scholar] [CrossRef] [Scilit]
  17. SJG21-2011; Technical Code for Reduction of Construction Waste. Shenzhen Municipal Bureau of Housing and Urban-Rural Development: Shenzhen, China, 2011.
  18. GB/T 25175-2010; Technical Requirements for Collection and Recycling of Bulky Waste. China Standards Press: Beijing, China, 2010.
  19. Ho Park, M.; Ju, M.; Jeong, S.; Young Kim, J. Incorporating Interaction Terms in Multivariate Linear Regression for Post-Event Flood Waste Estimation. Waste Manag. 2021, 124, 377–384. [Google Scholar] [CrossRef] [Scilit] [PubMed]
  20. Marchesini, G.; Beraud, H.; Barroca, B. Quantification of Disaster Waste: Review of the Available Methods. Int. J. Disaster Risk Reduct. 2021, 53, 101996. [Google Scholar] [CrossRef] [Scilit]
  21. Xiao, J.; Xie, H.; Zhang, C. Investigation on Building Waste and Reclaim in Wenchuan Earthquake Disaster Area. Resour. Conserv. Recycl. 2012, 61, 109–117. [Google Scholar] [CrossRef] [Scilit]
  22. Feyzi, S.; Khanmohammadi, M.; Abedinzadeh, N.; Aalipour, M. Multi- Criteria Decision Analysis FANP Based on GIS for Siting Municipal Solid Waste Incineration Power Plant in the North of Iran. Sustain. Cities Soc. 2019, 47, 101513. [Google Scholar] [CrossRef] [Scilit]
  23. Abushammala, M.F.M.; Qazi, W.A.; Frrag, S.; Alazaiza, M.Y.D.; Younes, M.K. Site Selection of Municipal Solid Waste Incineration Plant Using GIS and Multicriteria Decision Analysis. J. Air Waste Manag. Assoc. 2022, 72, 1027–1039. [Google Scholar] [CrossRef] [Scilit]
  24. Gbanie, S.P.; Tengbe, P.B.; Momoh, J.S.; Medo, J.; Kabba, V.T.S. Modelling Landfill Location Using Geographic Information Systems (GIS) and Multi-Criteria Decision Analysis (MCDA): Case Study Bo, Southern Sierra Leone. Appl. Geogr. 2013, 36, 3–12. [Google Scholar] [CrossRef] [Scilit]
  25. Eskandari, M.; Homaee, M.; Mahmodi, S. An Integrated Multi Criteria Approach for Landfill Siting in a Conflicting Environmental, Economical and Socio-Cultural Area. Waste Manag. 2012, 32, 1528–1538. [Google Scholar] [CrossRef] [Scilit] [PubMed]
  26. Rahmat, Z.G.; Niri, M.V.; Alavi, N.; Goudarzi, G.; Babaei, A.A.; Baboli, Z.; Hosseinzadeh, M. Landfill Site Selection Using GIS and AHP: A Case Study: Behbahan, Iran. KSCE J. Civ. Eng. 2017, 21, 111–118. [Google Scholar] [CrossRef] [Scilit]
  27. Khan, M.M.-U.-H.; Vaezi, M.; Kumar, A. Optimal Siting of Solid Waste-to-Value-Added Facilities through a GIS-Based Assessment. Sci. Total Environ. 2018, 610–611, 1065–1075. [Google Scholar] [CrossRef] [Scilit]
  28. Cheng, C.; Thompson, R.G. Application of Boolean Logic and GIS for Determining Suitable Locations for Temporary Disaster Waste Management Sites. Int. J. Disaster Risk Reduct. 2016, 20, 78–92. [Google Scholar] [CrossRef] [Scilit]
  29. Madi, N.; Srour, I. Managing Emergency Construction and Demolition Waste in Syria Using GIS. Resour. Conserv. Recycl. 2019, 141, 163–175. [Google Scholar] [CrossRef] [Scilit]
  30. Lee, Y.-H. Framework for Selection of Temporary Disaster Waste Management Sites for Post-Flood Recovery in Seoul, South Korea. Int. J. Disaster Risk Reduct. 2022, 71, 102832. [Google Scholar] [CrossRef] [Scilit]
  31. Demir, A.; Dinçer, A.E. Efficient Disaster Waste Management: Identifying Suitable Temporary Sites Using an Emission-Aware Approach after the Kahramanmaraş Earthquakes. Int. J. Environ. Sci. Technol. 2023, 20, 13143–13158. [Google Scholar] [CrossRef] [Scilit]
  32. Genç, M.S.; Azgin, S.T.; İpekli, Z. Assessing Waste-to-Energy Potential and Landfill Site Suitability via a Holistic Approach. Process Saf. Environ. Prot. 2024, 189, 343–355. [Google Scholar] [CrossRef] [Scilit]
  33. Uyan, M. MSW Landfill Site Selection by Combining AHP with GIS for Konya, Turkey. Environ. Earth Sci. 2014, 71, 1629–1639. [Google Scholar] [CrossRef] [Scilit]
  34. Abd-El Monsef, H. Optimization of Municipal Landfill Siting in the Red Sea Coastal Desert Using Geographic Information System, Remote Sensing and an Analytical Hierarchy Process. Environ. Earth Sci. 2015, 74, 2283–2296. [Google Scholar] [CrossRef] [Scilit]
  35. Fard, M.B. Sustainable Waste-to-Energy Plant Site Selection by a Hybrid Method of Geographic Information System and Evidential Reasoning: A Case Study Guilan Province. Process Saf. Environ. Prot. 2023, 176, 316–331. [Google Scholar] [CrossRef] [Scilit]
  36. Sabzevari, S.A.H.; Mottaki, Z.; Hassani, A.; Zandiyeh, S.; Aslani, F. Temporary Housing Site Selection in Soffeh Mountain, District 5 of Isfahan, Iran. Int. J. Disaster Resil. Built Environ. 2022, 14, 611–627. [Google Scholar] [CrossRef] [Scilit]
  37. GB 18597-2023; Standard for Pollution Control on Hazardous Waste Storage. China Standards Press: Beijing, China, 2023.
  38. Esmaeilpour, M. Site Selection for Construction and Demolition Waste Landfill Using Catastrophe Theory: The Case of Bonab City, Iran. Environ. Monit. Assess. 2023, 195, 1409. [Google Scholar] [CrossRef] [Scilit] [PubMed]
  39. Uyan, M.; Ertunç, E. GIS-Based Optimal Site Selection of the Biogas Facility Installation Using the Best-Worst Method. Process Saf. Environ. Prot. 2023, 180, 1003–1011. [Google Scholar] [CrossRef] [Scilit]
  40. Nyimbili, P.H.; Erden, T. A Hybrid Approach Integrating Entropy-AHP and GIS for Suitability Assessment of Urban Emergency Facilities. ISPRS Int. J. Geo-Inf. 2020, 9, 419. [Google Scholar] [CrossRef] [Scilit]
  41. Tavares, G.; Zsigraiová, Z.; Semiao, V. Multi-Criteria GIS-Based Siting of an Incineration Plant for Municipal Solid Waste. Waste Manag. 2011, 31, 1960–1972. [Google Scholar] [CrossRef] [Scilit]
  42. Tajima, R.; Tsukiji, M. Preparing Temporary Storage Site (TSS) Before a Disaster. 2021. Available online: https://jsmcwm.or.jp/international/files/2021/03/DWM_Lecture_TSS_before_disaster.pdf (accessed on 1 November 2024).
  43. Rizeei, H.M.; Pradhan, B.; Saharkhiz, M.A. Allocation of Emergency Response Centres in Response to Pluvial Flooding-Prone Demand Points Using Integrated Multiple Layer Perceptron and Maximum Coverage Location Problem Models. Int. J. Disaster Risk Reduct. 2019, 38, 101205. [Google Scholar] [CrossRef] [Scilit]
  44. Toregas, C.; Revelle, C. Optimal Location under Time or Distance Constraints. Pap. Reg. Sci. 1972, 28, 133–143. [Google Scholar] [CrossRef] [Scilit]
  45. Jiang, Y.; Lv, A.; Yan, Z.; Yang, Z. A GIS-Based Multi-Criterion Decision-Making Method to Select City Fire Brigade: A Case Study of Wuhan, China. ISPRS Int. J. Geo-Inf. 2021, 10, 777. [Google Scholar] [CrossRef] [Scilit]
  46. Bandyopadhyay, M.; Pratap, M. Spatial Pattern Analysis for Finding Weighted Candidate Set for P-Median Problem in Locating Emergency Facilities. Int. J. 2012, 2, 69–74. [Google Scholar]
  47. Mentougou District People’s Govemment of Beijing Municipality. Beijing Mentougou Statistical Yearbook 2024; Beijing Mentougou District Bureau of Statistics: Beijing, China, 2024.
  48. DB11/T 2078-2023; Specification for Setting and Operation of Construction waste Disposal Sites. China Standards Press: Beijing, China, 2023.
  49. GB/T 50337-2018; Standard for Planning of Urban Environment Sanitation Facilities. China Standards Press: Beijing, China, 2018.
Figure 1. Distribution of Waste Disposal Facilities in Mentougou District.
Sustainability 18 06154 g001
Figure 2. Annual Cumulative Rainfall and Flood-season Rainfall in Mentougou District from 2010 to 2023.
Sustainability 18 06154 g002
Figure 3. Process for Selecting Locations for TDWSS.
Sustainability 18 06154 g003
Figure 4. Frequency Chart of Impact Factors.
Sustainability 18 06154 g004
Figure 5. Hierarchical structure of the initial evaluation indicators for TDWSSs.
Sustainability 18 06154 g005
Figure 6. Layers of Influencing Factors for TDWSS Site Selection.
Sustainability 18 06154 g006
Figure 7. Statistical analysis of suitability for location selection. (a) Distribution map of suitability for TDWSS; (b) proportion of area in suitable location zones.
Sustainability 18 06154 g007
Figure 8. Selection of Location Area Screening.
Sustainability 18 06154 g008
Figure 9. Solution Results of the Minimized Facility Point Model.
Sustainability 18 06154 g009
Figure 10. Solution Results of the Maximum Coverage Model.
Sustainability 18 06154 g010
Figure 11. TDWSS layout optimization results of the minimum impedance model.
Sustainability 18 06154 g011
Table 1. Data Sources and Types.
Data NameData SourcesData Types
Types and Quantity of Consumer DurablesMentougou District Statistical YearbookText information
Rainfall dataNational Tibetan Plateau Science Data CenterRaster data
The administrative division data of Mentougou Districthttps://www.tianditu.gov.cn/ (accessed on 1 October 2024) Vector data
Elevation and slopehttp://srtm.csi.cgiar.org/srtmdata/ (accessed on 22 October 2024)Raster data
Water systems and roadshttps://openstreetmap.net.cn/download (accessed on 8 October 2024)Raster data
Various protected areasBeijing Municipal Commission of Urban Management; https://whlyj.beijing.gov.cn/ (accessed on 1 October 2024)Raster data
Geological disaster sites and potential disaster hazard sitesBeijing Municipal Commission of Planning and Natural Resources (accessed on 1 October 2024)Vector data
Soil typehttps://www.x-mol.com/groups/li_xuecao/dongtaizhitu (accessed on 3 October 2024)Raster data
Normalized Difference Vegetation Index (NDVI)https://www.earthdata.nasa.gov/ (accessed on 1 October 2024)Raster data
Land coverhttps://github.com/thestarlab/ChinaGDP (accessed on 1 October 2024)Raster data
Waste disposal facilitiesBeijing Municipal Commission of Urban ManagementText information
Table 2. Indicators of Construction Waste Generation.
Type of Construction WasteMetalWoodOthersInorganic NonmetallicTotal q (kg/m2)
ConcreteBrickMortarGlass
Material intensity (kg/m2)65358788018020031450
Apparent density (t/m3)7.80.5412.21.71.52.7-
Table 3. Grading of impact indicators for GIS spatial analysis.
First-Level IndicatorsSecond-Level
Indicators
Grading ValueCorresponding Rating Value
12345
Natural geographical factorsRainfall (mm)545.19–588.35527.09–545.19510.84–527.09494.60–510.84470.00–494.60[35]
Land-useWater Areas/Trees/Flooded Vegetation Areas/Built AreasBare Ground Areas/Rangelands Areas[31]
Slope (%)50–69.8535–5020–355–200–5[32]
Elevation (m)2000–22931500–20001000–1500500–100054–500[29]
Distance from surface water (m)0–500500–10001000–15001500–2000>2000[28]
Ecological environment factorsNDVI0.54–0.630.49–0.540.44–0.490.38–0.440.22–0.38[38]
Distance from Protected Areas (m)0–10001000–20002000–30003000–4000>4000[39]
Distance from the disaster sensitive points (m)0–10001000–15001500–20002000–2500>2500
Soil typeLoose lithomorphic soilHigh–activity luvisol soilDystric cambisol soilCalcareous soilEutric cambisol soil
Social economic factorsDistance from residential areas (m)0–500500–10001000–15001500–2000>2000[31,39]
Distance from roads (m)>20001500–20001000–1500500–10000–500[28]
Distance from the waste disposal facility (m)>2015–2010–155–100–5[31]
Table 4. Database of durables’ consumption quantity and weight in Mentougou District.
TypeCategoryQuantityWeight (kg)TypeCategoryQuantityWeight (kg)
FurnitureBed frame2.66100.00Household AppliancesTV1.1225.00
Mattress2.6645.00Refrigerator1.0370.00
Sofa1.0060.00Air conditioner1.5155.00
Table2.0035.00Washing machine0.9763.00
Chair2.0015.00Vacuum cleaner0.508.00
Wardrobe1.0070.00Rice cooker0.7425.00
Bookcase1.0060.00Microwave oven1.0025.00
Cabinet1.0060.00Oven1.006.00
Coffee table1.0035.00Water heater0.98185.00
TV cabinet1.2935.00Range hood0.9022.00
Shoe cabinet1.0030.00Other bulky wasteHousehold car0.411000.00
Dining table and chairs2.0050.00Motorcycle0.0713.00
Electronic productsCamera0.091.50Electric scooter0.5522.00
Computer0.564.00Clothing-70.00
Telephone2.850.75Food5.905.90
Table 5. Results of the consistency check for the AHP judgment matrix.
Determining Matrix Hierarchy λ m a x CICRTest Results
Criteria Layer3.00920.00460.0079Passed
Natural geographical factors5.13940.03490.0311Passed
Ecological environment factors4.05110.01700.0189Passed
Social economic factors3.00920.00460.0079Passed
Table 6. Entropy values, diversity coefficients, objective weights and ranking of evaluation indicators.
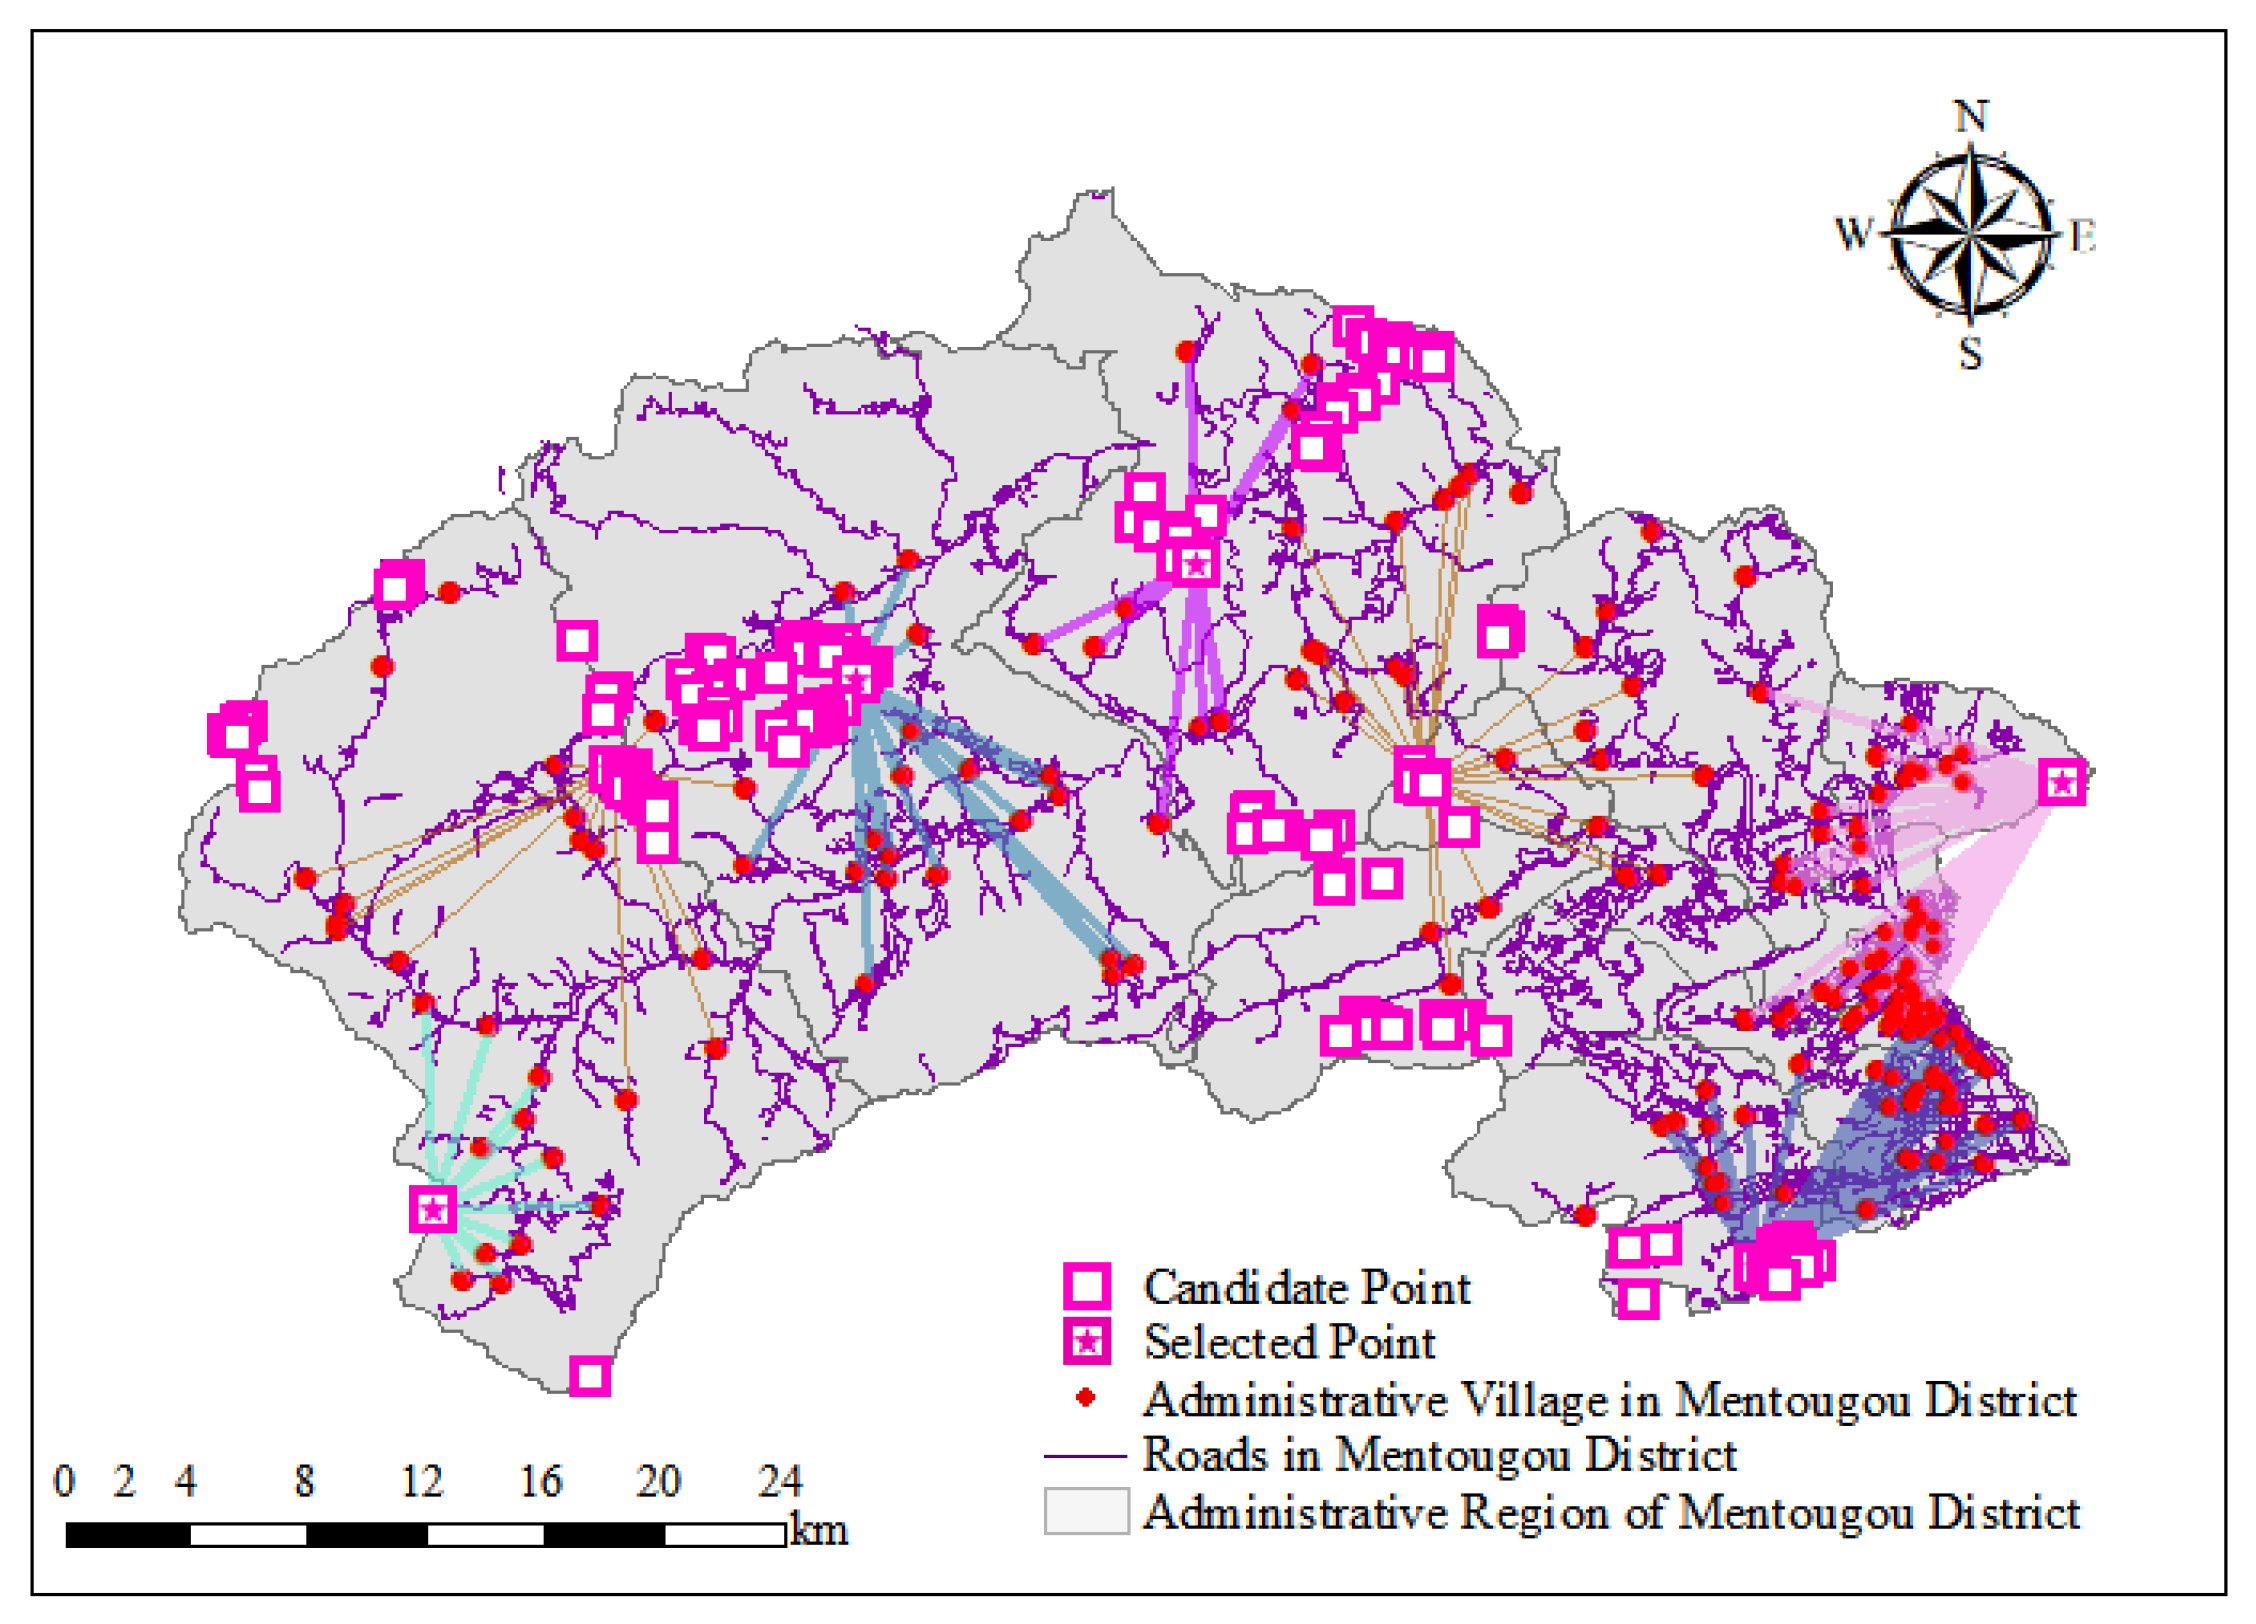
Factor e i d i Weight
Rainfall (mm)0.98940.01060.0683
Land use0.99780.00220.0140
Slope (%)0.99180.00820.0528
Elevation (m)0.98960.01040.0669
Distance from surface water (m)0.97890.02110.1357
NDVI0.99800.00200.0129
Distance from Protected Areas (m)0.98760.01240.0797
Distance from the disaster sensitive points (m)0.98400.01600.1027
Soil type0.98860.01140.0731
Distance from residential areas (m)0.98470.01530.0988
Distance from roads (m)0.96360.03640.2342
Distance from the waste disposal facility (m)0.99050.00950.0609
Table 7. Weights of various indicators for TDWSS suitability assessment based on different methods.
Target LevelFirst-Level IndicatorsSecond-Level IndicatorsWeight
AHPEWMAHP-EWM
Preliminary Suitability Assessment of TDWSSNatural geographical factorsRainfall (mm)0.06020.06830.0642
Land use0.02780.01400.0209
Slope (%)0.14690.05280.0998
Elevation (m)0.09090.06690.0789
Distance from surface water (m)0.21400.13570.1748
Ecological environment factorsNDVI0.02160.01290.0172
Distance from Protected Areas (m)0.08440.07970.0820
Distance from the disaster sensitive points (m)0.14040.10270.1215
Soil type0.05050.07310.0618
Social economic factorsDistance from residential areas (m)0.08820.09880.0935
Distance from roads (m)0.02670.23420.1304
Distance from the waste disposal facility (m)0.04850.06090.0547
Table 8. Area of suitability zones and spatial overlap with the baseline under different α values.
αThe Most Unsuitable Area (%)Unsuitable Area (%)Moderately Suitable Area (%)Relatively Suitable Area (%)The Most Suitable Area (%)IoU
0.00 (only EWM)22.7229.7125.3414.148.0954.8%
0.2527.8733.7922.9710.954.4282.9%
0.50 (Benchmark)24.0232.0025.9713.015.00
0.7522.7732.7326.8213.164.5387.1%
1.00 (only AHP)20.3032.7728.4513.964.5279.4%
Table 9. Sensitivity Analysis Under Single-Factor Weight Shifts (±20%).
FactorDisturbanceArea of the Most Suitable Zones (%)Overlaps with the Baseline
Distance from surface water (m)−20%/+20%4.19/4.7388.7%/91.2%
Distance from roads (m)−20%/+20%4.67/5.3292.3%/84.8%
Distance from the disaster sensitive points (m)−20%/+20%5.24/4.8186.2%/93.5%
Slope (%)−20%/+20%4.61/4.5996.8%/96.8%
Distance from residential areas (m)−20%/+20%4.90/4.6092.1%/97.2%
Table 10. Land area for TDWSSs.
Facility ScaleLargeMediumSmall
Total storage capacity≥20,000 m3≥5000 m3, ≤20,000 m3≥2000 m3, ≤5000 m3
Daily processing capacity≥2000 t/d≥500 t/d, ≤2000 t/d<500 t/d
Land area≥18,000 m3≥6000 m3≥3000 m3
Table 11. Results of site selection and layout for TDWSSs.
The Number of TDWSSThe Total Transportation Distance Within a 20 km Radius (km)The Average Transportation Distance Within a 20 km Radius (km)The Number of Administrative Villages CoveredCoverage RateCoverage Rate Increased
12250.1613.9816152.79%-
23109.8113.2923476.72%23.93%
33451.1113.3825884.59%7.87%
43573.2813.0927389.51%4.92%
53303.64 11.5928593.44%3.93%
63360.83 11.5529195.41%1.97%
73402.40 11.4629797.38%1.97%
83405.48 11.3530098.36%0.98%
93383.50 11.2030299.02%0.66%
103153.27 10.4130399.34%0.33%
Disclaimer/Publisher’s Note: The statements, opinions and data contained in all publications are solely those of the individual author(s) and contributor(s) and not of MDPI and/or the editor(s). MDPI and/or the editor(s) disclaim responsibility for any injury to people or property resulting from any ideas, methods, instructions or products referred to in the content.