


Abstract
The valorisation of household and commercial bio-waste into soil improvers helps to reduce disposable waste, mitigate climate change, and improve soil resilience. While the separate collection of bio-waste is mandatory in the European Union, this remains a challenging task, particularly for large cities, due to quality problems in densely populated areas. In addition to various informational and motivational tools for households, financial incentives are becoming increasingly important. However, there is a lack of robust evidence regarding the optimal use of these incentives and their impact on the quantity and quality of collected bio-waste. We investigated the impact of different charging systems on the quantity and quality of bio-waste, basing our research on the experiences of more than twenty European cities and using a detailed questionnaire completed by the relevant administrators. The results confirm that cities, which provide financial incentives for waste sorting, yield a higher quantity of separated bio-waste. As introducing tiered fees can lead to quality issues, monitoring bio-waste and taking action against polluters seems to be unavoidable. Since the identification of polluters is very difficult in the case of multi-family homes, the results are discussed with a special focus on densely populated cities. Pilot projects for alternative options for the valorisation of organic waste, particularly in districts with high-rise buildings, should be evaluated.
1. Introduction
Bio-waste from households and restaurants, as well as other commercial sources, and green waste (e.g., organic material from gardens and public parks) can be processed aerobically to produce compost. Anaerobic treatment focuses on producing methane, resulting in two residues: a liquid fraction high in nutrients and a solid fraction that is further processed to yield compost. Due to its high organic carbon content, especially humus substances, compost serves as a soil improver or as a basic material for many related products like potting soil (e.g., refs. [1,2]). An increasing number of cities, e.g., Hamburg (Germany) [3], Shanghai (China) [4], Milano (Italy) [5], San Diego (CA, USA) [6], around the world are separating organic waste at source. There are many more reasons for the separate collection of organic waste, besides the production of soil improvers:
- The absence of biodegradable material drastically reduces methane emissions from landfills.
- The use of compost in soils leads to sequestration of CO2.
- The reduction in organic waste in residual waste enhances its heating value for more efficient incineration with energy recovery.
The EU is focusing on all of these targets. According to the Waste Landfill Directive (WLD) [7], the amount of municipal waste going to landfill should be minimised to 10% by 2035. The Waste Framework Directive (WFD) [8] requires organic waste to be collected separately. Since 2024, Member States are expected to introduce suitable collection systems. The European Circular Economy (CE) strategy includes the (intermediate) target of recycling 55% of municipal waste by 2025 and finally 65% by 2035. As organic waste makes up 34% of the total household waste [9], the recycling target can only be achieved if a significant proportion of organic waste is recycled. Since 46% of European land is classified as “marginal” [10], soil improvers from bio-waste can address the lack of carbon in soils and the growing issue of soil degradation through the provision of essential nutrients and improved water, nutrient, and carbon retention, thereby improving soil’s fertility and health while reducing environmental impact by replacing mineral fertilisers. Moreover, methane produced from anaerobic digestion is classified as a “RED III product” according to the amended Renewable Energy Directive [11], meaning it meets all the criteria for climate protection.
However, despite ambitious recycling targets, 18 Member States are not on track to meet their municipal waste recycling goals, while only nine are performing relatively well [12]. This disparity is partly due to the small proportion of organic waste that is collected separately. Therefore, it is necessary to increase the collection and processing of bio-waste.
1.1. Quality of Separately Collected Bio-Waste and Impacts on Compost
Once a system for collecting bio-waste has been introduced, citizens must be encouraged to separate organic waste from other materials in their homes. Food packaging materials and plastic bags used for transporting kitchen waste to the bin, as well as small plastic items from residual waste, are commonly found in separately collected bio-waste (see ref. [13] and literature cited therein), leading to far higher costs for the production of compost [14]. Impurities in bio-waste bins are considerably higher in densely populated areas compared to suburbs with detached houses [15]. Contaminants such as glass, dust, diapers, and plastic materials remain unchanged by the anaerobic or aerobic process. Plastic materials in compost are a subject of growing concern [16,17,18]. While large items can be removed by hand sorting or special sieving systems, milling and grinding the input material increases the number of smaller plastic pieces and cullets. Despite advanced and costly pre- and post-sorting processes, this problem remains partially unsolved. Since soil contamination by plastics should be minimised, compost must not act as a transfer medium. According to EU regulation [19] (valid from 16 July 2026), the amount of plastic particles (>2 mm) in compost is limited to 2.5 g/kg (% dry matter). Therefore, citizens must ensure that organic waste is carefully separated from other materials, particularly plastics, glass, and residual waste. Quality assurance and control during collection and processing are essential for marketing compost derived from bio-waste. Recently, Germany introduced a contamination limit of 3% for bio-waste (see a press release by the City of Jena [20]), which must be met in the organic waste before entering the biological process.
The motivation of citizens to separate waste fractions efficiently can be enhanced by providing suitable information, implementing convenient collection systems, educating special groups such as schoolchildren, and offering financial incentives [21,22,23]; mostly, several instruments are combined [24,25,26]. There is a substantial body of scientific literature that provides evidence for the multifactorial behaviour of waste producers (see refs. [27,28,29,30,31]). The relationship between the different factors and the instruments that lead to the desired behaviour is difficult to assess. Moreover, waste separation behaviour is influenced by local conditions such as dwelling forms, cultural attitudes towards waste, the social composition of housing areas, and other factors. In particular, the relationship between waste charges and the quantity and, especially, the quality of separately collected bio-waste is only partially understood because of the following:
- The influence of other factors on quantity and quality is difficult to distinguish from the impact of the fees to be paid,
- Municipalities rarely analyse the quality of waste,
- Anaerobic and aerobic treatment facilities reject highly contaminated waste, but do not disseminate these findings to the public,
- Scientific publications are dealing with a quality focus on compost rather than the input material.
1.2. Economic Incentives for Pre-Sorting of Waste
Economic tools like pay-as-you-throw (PAYT) tariffs and more differentiated waste charges are becoming more and more used [32] as it is generally assumed that financial incentives will lead to the desired behaviour of companies or individuals, i.e., choosing the environmentally friendly option [33]. Financial incentives aim to reduce waste and environmental damage [32,34]. Such incentives come in different forms, negative incentives such as penalties, and positive incentives such as refunds or discounts. Incentives can also be used to address social issues [35].
Waste separation at source can be incentivised by higher prices for residual waste compared to recyclable fractions. In line with the Polluter-Pays Principle (PPP), fees based on the mass or volume of waste encourage citizens to reduce the amount of waste. According to a review by Alzamora and Barros [36], PAYT charging systems are widely used in industrialised countries, whereas developing countries often rely on flat rates for waste management or finance this service from general revenues. PAYT incentive schemes [37,38] increase the amount of pre-sorted waste, reflecting a change in the behaviour of households [39,40], leading to lower overall costs for waste management [41,42]. Comparisons between municipalities that introduced PAYT systems and those with traditional systems show an increase in the rate of separately collected recyclables [43]; this also applies to bio-waste [44,45]. Other studies observed that the specific amount of mixed waste and organic waste, or only organic waste per household, decreased thanks to PAYT systems [46]. An explanation for this effect could be that “the tariff may lead households to plan their food consumption better, resulting in less food being discarded.” [46]. Deviating from the majority of publications, a comparative study of Swedish municipalities revealed a decline in residual waste, but no substantial rise in recyclables [47]. Gautier and Salem [48] focused on the price elasticity for residual and organic waste by evaluating statistical data from all Wallonian municipalities (Belgium) between 2009 and 2018. They found significant own-price elasticity and a cross-price elasticity for residual waste, but a limited own-price elasticity for organic waste.
As outlined above, there is a bundle of different influences that lead to the multiple and combined approaches mentioned above. Besides the importance of intrinsic motivation [49], convenience issues [50] must be taken into account in the case of the introduction of new waste collection schemes. Citizens not only recognise cost savings with respect to waste charges, but also the additional time and inconvenience involved in sorting. Financial incentives can also have negative effects. For example, free-of-charge bins intended for packaging waste are widely misused, i.e., filled with residual waste [51]. Illegal dumping could be another unintended consequence, as it helps to minimise tax burdens [30,52]. Van Beukering et al. [24] concluded that differential and variable rates are a cost-effective instrument for reducing waste and increasing recycling. However, they also advocated conducting pilot experiments in highly urbanised areas to assess behavioural responses.
Though the quality of separated material is key for a good compost, reasons for contamination of bio-waste are rarely in the focus of researchers. According to Alvarez et al. [15], separately collected bio-waste in about 200 Spanish municipalities contained between 10% and 20% of “undesirable material” in the mean, with maximum levels up to 40%. The amount of undesirable waste in the bio-waste fraction increased linearly in relation to the population density. Moreover, correlations of contamination with gross disposable household income (negative), unemployment, and illiteracy (positive) were found. Kranert et al. [53] reported a range from 0.9% to 12% misplaced materials in bio-waste from numerous German cities, partially depending on the population density. Only in very few publications is the quality of the collected organic waste in relation to waste charges mentioned. Hadzi-Nikolowa et al. [54] reported on a pilot project in the Republic of North Macedonia, yielding high-quality compost from two decentralised composting units located in the urban area. In this case, a PAYT system was introduced whereby the disposal of waste could be assigned to the respective users. An evaluation of numerous Italian cities with and without PAYT systems showed a reduction in residual waste of 10% or more, as well as an increase in separately collected paper, cardboard, and organic waste. The authors of this study found an indication for better quality of recyclable fractions but did not find data for the quality of organic waste [55]. Interviews with experts from municipalities with very low contaminated bio-waste (0.5–3.7%) revealed “Too high differences in the fees between organic and residual waste” as a reason among other factors, which lead to incorrect sorting [13].
1.3. Scope of This Study
These partially contradictory research findings and the scarcity of studies to date on the effect of financial instruments on the quantity and, above all, the quality of bio-waste, are the motivation for this paper. With this paper, we aim to answer the following questions:
- What is the current status of organic waste collection in European cities?
- How does the charging system affect the amount of organic waste collected?
- What impact does the charging system have on the quality of the collected material?
Clearly, an experimental approach in pilot areas would encounter political concerns, a lack of standardised waste producers, and the need for follow-up over a period of one year or more. Therefore, we have evaluated the experiences of a number of cities with different charging systems for collecting bio-waste separately in order to learn more about the relationship between financial incentives and organic waste delivered to processing facilities in terms of quantity and quality. We took the following steps:
- Presented a questionnaire for cities,
- Explained the methodology for the evaluation,
- Presented and discussed the results with respect to local conditions (e.g., population density, waste fee system, quality monitoring, regulatory framework), and drew conclusions for the European framework, the introduction of differentiated waste charges, and the need for further research in this field.
2. Methods
2.1. Data Sources
The approach of data collection involved a structured questionnaire (see Table S1), which served as the primary data source, asking cities for a detailed description of their bio-waste collection system, including figures on quantities collected and quality indicators, the financing and fee structure of their system, and an outline of their legal frameworks and responsibilities for waste administration, collection and treatment. In the case of implausible or missing data, details were clarified by a review of publicly available documents, such as financial reports or official websites from the waste management authority, or by consulting the respondents who submitted the questionnaires.
2.2. Participant Selection
In terms of participants, an even distribution across Europe was aimed for, focusing mostly on European capitals or larger urban areas, as these were more likely to pose greater operational challenges arising from waste charging systems due to higher population density. The research was conducted in collaboration with the EU-funded Bin2Bean project [56], whose network of European cities supported outreach. Active project partners and members from the stakeholder forum participated in the study. In total, 76 cities were contacted, resulting in 27 responses with a response rate of 35.5 percent. While an even geographical distribution was sought, responses from Northern and Middle Europe were comparatively higher than those from Eastern and Southern Europe. The non-randomised, network-based sampling approach was considered appropriate, as it led to the representation of a variety of waste charging systems and population densities. Regions were included in case of a supervising authority, which provides complete data for all cities. To simplify further descriptions, all entities are referred to as “cities” and only in applicable cases as the more fitting description of municipality, county, or state.
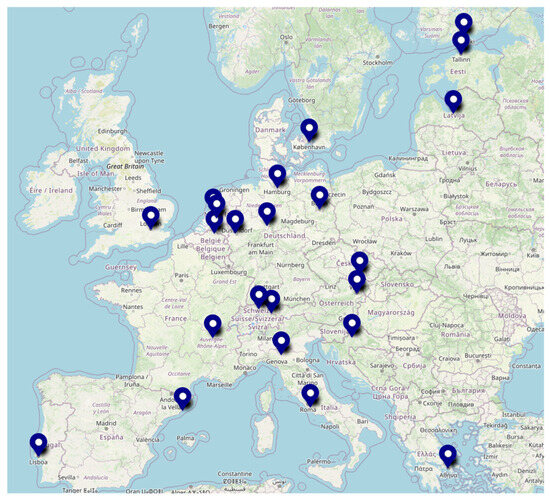
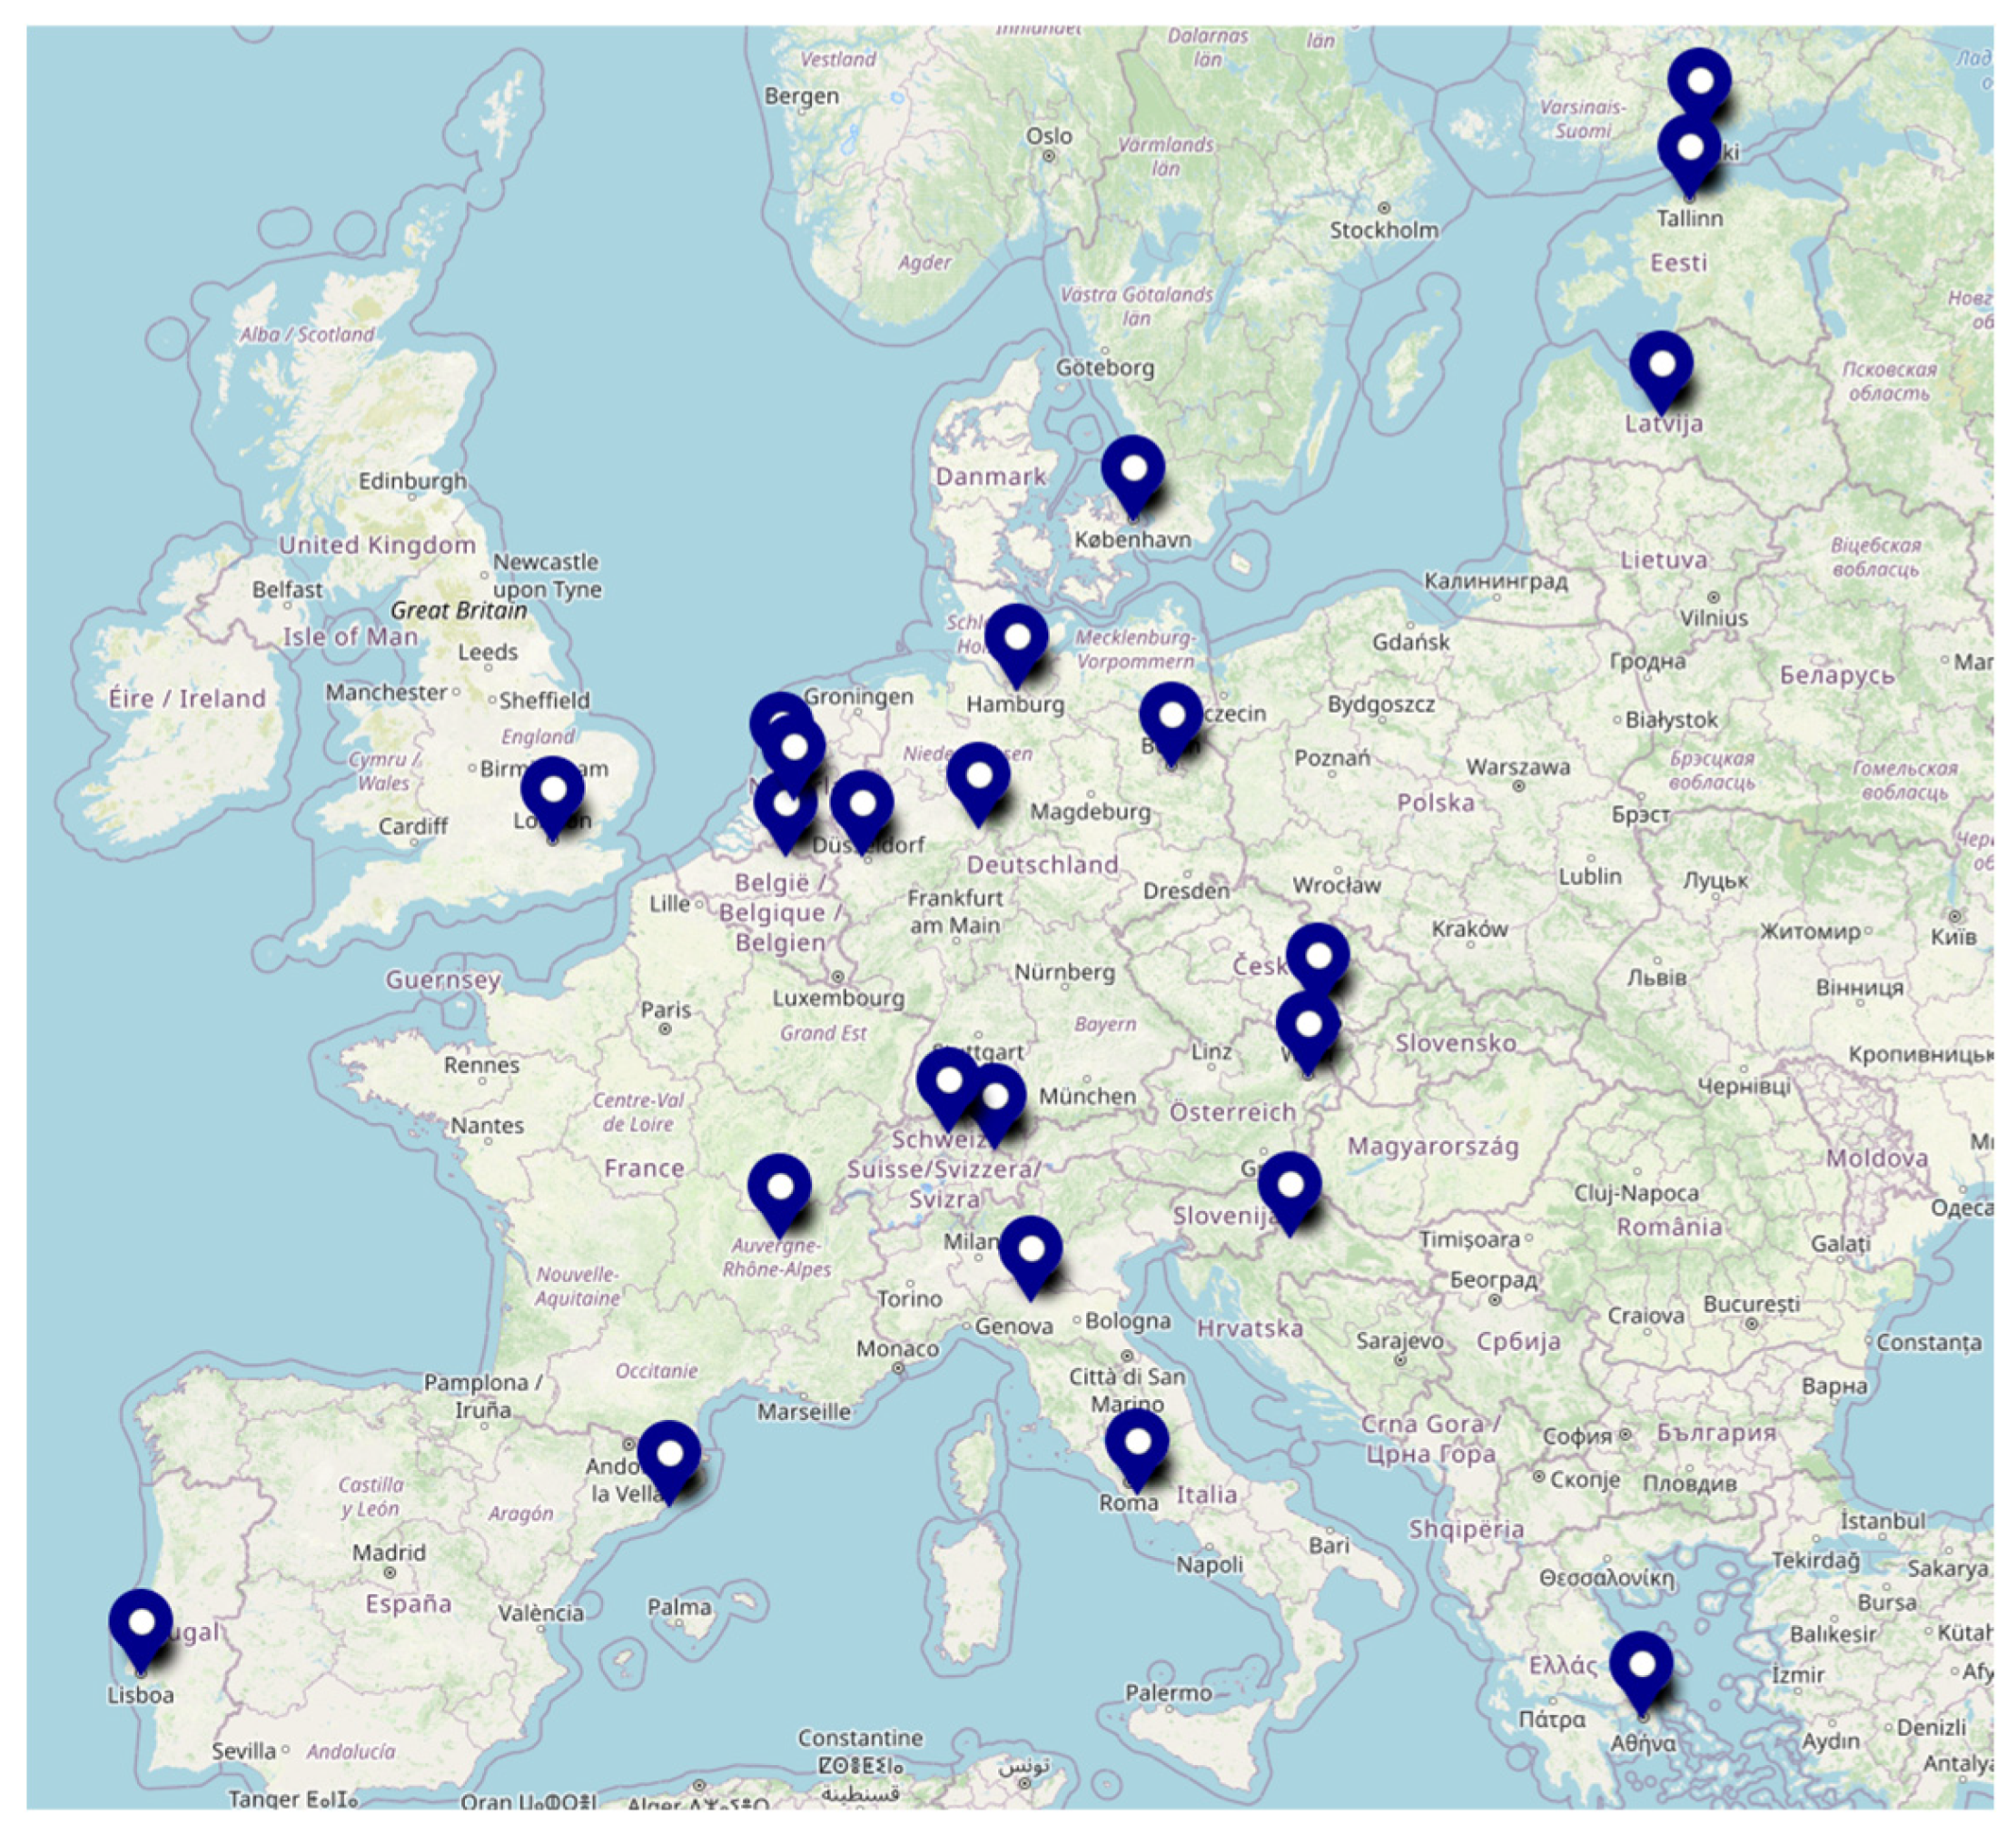
Data collection was conducted from June to September 2025. Requests were sent to either waste departments or waste management companies, and questionnaires were provided in English, German, and French to maximise participation. Most respondents represented municipal waste management authorities; however, their specific position could not be recorded for data protection reasons. Data for Amsterdam, Hamburg, and Egaleo were provided by representatives of the three Bin2Bean project partners. For data evaluation, three cities that responded to our request were excluded from further analysis since no separate bio-waste collection system was implemented. One city wished to be excluded from publication, since it originally participated in preceding non-published research. This resulted in 23 cities being considered in the analysis, from which two participants requested that their names be anonymised. The location of the participating cities is shown on a map, with the exception of the two districts in Germany that remain anonymous (see Figure 1, created with https://umap.openstreetmap.fr, accessed on 17 November 2025).
Figure 1.
Municipalities included in the survey (names given in the respective national language).
2.3. Data Evaluation
The resulting dataset combined both quantitative and qualitative elements. Data analysis was performed combining inductive and deductive category development with descriptive quantitative analysis. All results were compiled into a matrix, creating a clear overview of how each case was classified across topics such as collection systems, fee models, and reported impacts (e.g., kilograms of bio-waste collected per capita). This structure enabled descriptive comparison, combining qualitative assessments alongside quantitative indicators, and resulted in the identification of common patterns.
Given the small number of cases and the limited availability of comparable quantitative indicators, the statistical analysis was carried out in an exploratory manner. Two preliminary analyses, based on Pearson’s correlation coefficient, were conducted to check whether basic relationships existed between population characteristics (total number of inhabitants and population density) and waste generation (total bio-waste collected and bio-waste collected per capita). Such analysis provides an appropriate and robust exploratory measure for detecting linear associations between two continuous variables in small, heterogeneous samples.
To assess whether different charging systems are associated with different amounts of collected bio-waste and residual waste, additional comparative analyses (Kruskal–Wallis test with post hoc comparisons) were conducted. Because the distributions of waste quantities varied considerably between cities, methods appropriate for small and unevenly structured datasets were used. These analyses compared the four charging-system groups (see below) and, where meaningful differences appeared, follow-up checks were carried out to identify which systems differed most clearly from one another. All technical details and full statistical output are provided in Tables S2–S5.
The indicators above were selected because they were the most comparably reported across cities and allowed for the construction of a consistent numerical dataset. Information on quality was provided by 12 cities, allowing only an indicative evaluation.
2.4. Classification of Waste Charging Systems
The classification of the numerous systems for financing waste management, which vary from city to city, followed a system published by Lüssenhoop et al. [57], which distinguishes between four categories:
“Flat”: A flat fee is based on the characteristics of a dwelling (e.g., per household, according to the number of residents, the property’s size, or its value). All citizens pay the same relative amount of fees or taxes, regardless of the actual amount of waste generated.
“Flexible” (in the following “Flex”): Users have one choice regarding the waste charge they pay, usually by selecting a container size, which is charged at a different rate (larger containers cost more than smaller ones). A minimum container size relative to household size may be stipulated.
“Flexible+” (in the following “Flex+”): Users have more than one option for paying the waste charge, usually by selecting a container size and collection frequency. A minimum container size or collection frequency relative to household size may be stipulated.
“PAYT”: Users are charged for each kilogram of waste collected, or for each waste bin collection. Collections are counted via sensors in the bins, or via stickers or bags, which households must purchase in advance. A minimum number of collections may be stipulated.
3. Results
Twenty-six out of the seventy-six selected regions, cities, and counties completed the survey fully or partially. Six cities and counties are situated in Germany. Two cities can be found in each of the following countries: The Netherlands, Italy, France, Switzerland, and the UK. One city or region is located in each of the following countries: Austria, Finland, Spain, Latvia, Croatia, Denmark, Portugal, Belgium, Estonia, Greece, and the Czech Republic. Key information, such as the number of inhabitants, population density, and the amount of waste and bio-waste collected, is summarised in Table 1 in descending order with regard to the number of inhabitants. Data on inhabitant numbers and population density were taken from official statistics on the internet. About 17 million inhabitants were involved in this survey, i.e., about 3.5% of the population in the EU, UK, and Switzerland.
Table 1.
Amount of residual waste, organic waste, and green waste (mostly included in the sixth column) collected.
Three municipalities were excluded from the further presentation of results: Wandsworth (No. 16) and Richmond (No. 21) because both cities collect mostly green waste and do not have their own charging systems, and Egaleo (No. 23) was excluded because the collection of organic waste started at the end of 2024 as a pilot project.
Cities cannot control whether green waste is mixed with kitchen waste. Therefore, even if they offer additional drop-off points for garden waste, most cities collect green waste together with kitchen waste. Ultimately, depending on the ratio of kitchen and garden waste, all this material can be composted or fermented. In what follows, the terms ‘green waste’ and ‘garden waste’ are used interchangeably, whereas ‘bio-waste’ or ‘organic waste’ includes green waste.
3.1. Collection Systems
In a first attempt to understand how the cities organise their waste management infrastructure, a simplified overview of the responsible institutions for each stage of waste management (waste administration, (bio-)waste collection, and bio-waste treatment) is set up. Since some cities indicated multiple institutions for each stage, the number of times a certain institution is mentioned was considered. In terms of waste administration, most cities are directly responsible for administrative tasks, such as planning and organisation, data management, or budgeting. Usually, waste administration is a task performed by a department of the city, i.e., the waste department. In larger cities, such as Amsterdam, each city district sometimes has its own waste department. In the case of Helsinki and Lyon, a metropolitan authority is responsible for all administrative tasks. It is less common for the administration part to be executed by municipally owned or private enterprises. The responsibility starts to shift when it comes to waste collection tasks. More local governments are dealing with waste collection, but are shifting this responsibility towards municipal and sometimes private enterprises. An even greater shift then sets in for bio-waste treatment responsibility where a wider variety of institutions is visible. Mostly companies, municipally or privately owned, will deal with bio-waste treatment and processing.
Table 2 provides an overview of the collection systems in the cities under evaluation. 18 cities mainly provide a door-to-door collection Via bio-waste bins to households, collecting mostly food waste and fine garden waste. An exception is the City of Copenhagen, which explicitly collects food waste and garden waste separately. One of the anonymous municipalities in Germany offers door-to-door collection not for bins but for special bio-waste bags. A voucher for 60 15 L waste bags is offered to each household, which is considered to cover annual bio-waste generation. Additional bio-waste bags must be bought and paid for by citizens. Utrecht and Amsterdam offer door-to-door collection Via bio-waste bins only in some districts, while other districts, such as the historic city centres or large apartment buildings, have no option for bio-waste disposal. In Utrecht, plans are developed to introduce centralised collection systems Via above-ground containers for areas with large apartment buildings. In Amsterdam, some large apartment buildings have small enclosures ‘cocons’, which store common household-sized bins and can only be accessed Via an access card.
Table 2.
Collection systems in the cities (sorted according to the type of collection scheme).
Zagreb and Lisbon provide additional possibilities for door-to-door collection, which do not cover all households, such as recycling centres or some drop-off points, either underground or above-ground containers, distributed throughout the city. In the case of Hamburg, underground containers are only available to residents from high-rise buildings who have no option for small bio-waste bins for each household.
The City of Vienna offers a similar type of door-to-door collection, which involves a full-service backyard collection, meaning that households do not need to bring their bins to the curb. Since most of Vienna’s housing structures are larger apartment buildings, these bins are often shared collectively. There is also a small number of openly accessible containers to which residents may bring their organic waste, which is less frequent and mainly used for garden waste.
Only two cities do not offer door-to-door collection as their main collection method. In Lyon, households can take their bio-waste to one of 2700 collection points located throughout the city. Meanwhile, in Brno, public street containers and bins are used for collection, with the exception of one district with door-to-door collection.
In terms of green waste, different approaches are also used. Specifically, Zagreb and Riga collect green waste from households and other locations Via door-to-door collection. Lisbon and Copenhagen also offer recycling centres as drop-off points for households, in addition to door-to-door collection. Ten cities have drop-off points for green waste distributed throughout the city, which are also partially used for other waste fractions (recycling yards). There are also other options available to citizens, for example, additional mobile containers or optional green waste collection bags, depending on the season. Ten cities did not provide any information regarding separate green waste collection.
3.2. Regulatory Frame
Almost three-quarters (74%) of the cities indicated that they have mandatory bio-waste collection in place. However, exceptions are often made for specific cases. For example, in Riga, separate bio-waste collection is mandatory for apartment buildings with more than ten apartments, whereas in Vienna, it is only mandatory if an apartment complex has a garden. Otherwise, the use of a bio-waste bin is optional. In Helsinki, separate bio-waste collection is mandatory if more than 10 kg is produced per week. Höxter, Zürich, Helsinki, and Hamburg have explicitly stated that exceptions are made if households can verify that they are performing home composting. Exceptions are also made if properties evidently have insufficient space for a bio-waste bin, as explicitly mentioned in the Dutch waste management law: “when separate collection is technically not possible or excessively expensive” (LAP3, B.3.3.2.1 in ref. [58]).
Bio-waste collection is voluntary in only six other cities. Due to many exceptions to compulsory participation in collection, the distinction between mandatory and voluntary is fluid.
The collection system for organic waste from commercial sources (e.g., hotels and restaurants) and the food industry depends on national or local regulations. Five cities claimed that they are not responsible for collecting commercial bio-waste. In these cases, it is the responsibility of the companies to find contractors to recycle their waste. The majority (11 cities) did not provide any information on commercial waste collection. Conversely, six cities stated that they offer businesses a door-to-door collection service. In a few cases, commercial waste producers can choose between a contract with the city or with private waste companies.
3.3. Amount of Separately Collected Bio-Waste
The amount of separately collected organic waste (i.e., bio-waste, including green waste and, in some cases, green waste besides bio-waste) can be found in Table 1. For the following evaluations, the two figures were added together. This is meaningful because cities cannot exclude green waste mixed with kitchen waste, except for very small bags or bins.
In only a few cases does the amount of separately collected organic waste approach the average amount of organic waste contained in household waste (i.e., ~34% [9]). This is particularly evident in the Belgian arrondissement of Turnhout, the German county of Höxter, Argentona in Spain, and two Italian cities: Parma with a rate of over 35%, and Albano Laziale with around 50%. All of these municipalities have a low population density and are characterised by large estates with gardens.
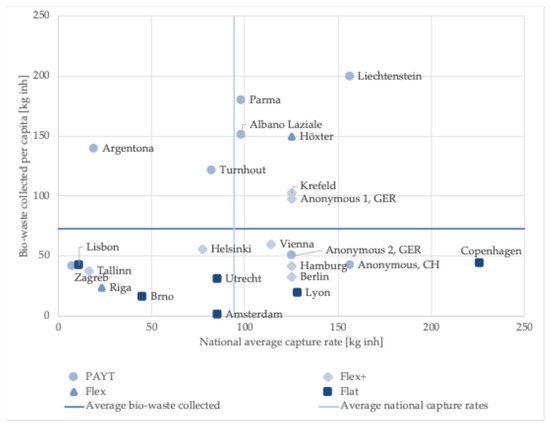
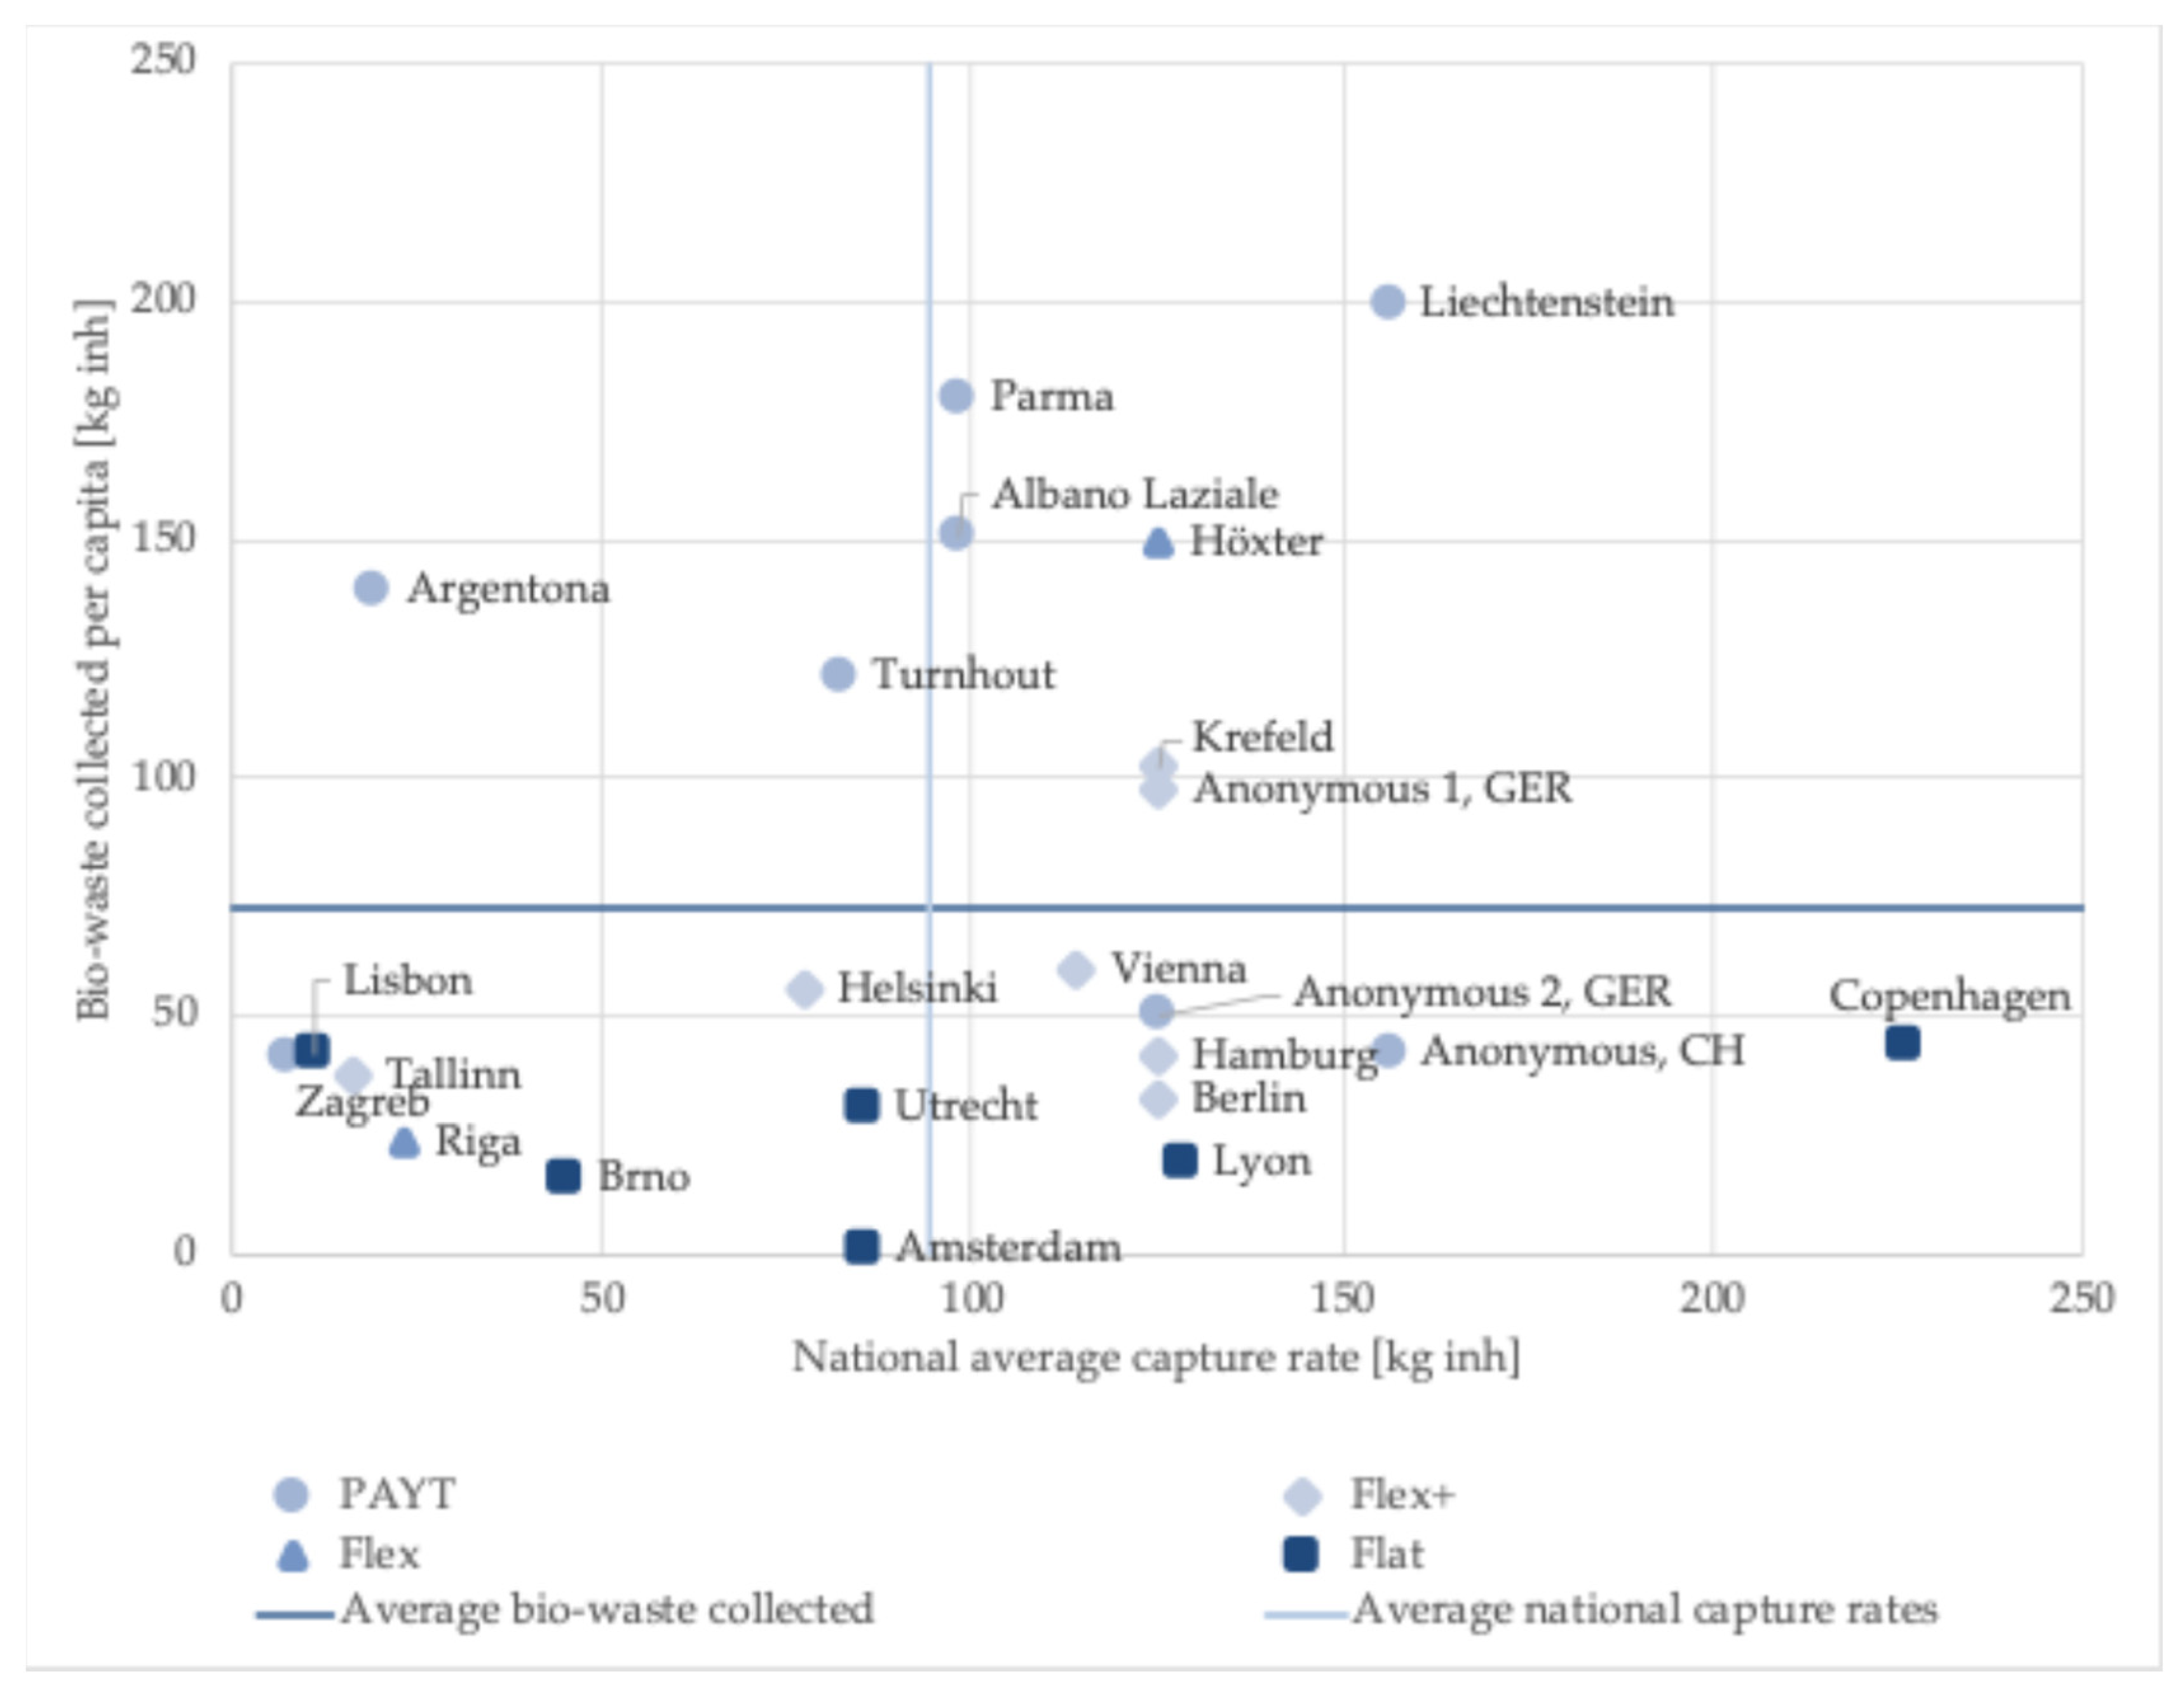
However, due to the fact that many cities only collect bio-waste in certain districts or grant many exemptions from the obligation to collect bio-waste separately (see Section 3.2), there is no linear correlation between the amount of bio-waste and the total number of inhabitants. This is depicted in Figure 2. In the first quadrant are small and medium-sized cities from Germany and Italy, both of which have been active in bio-waste valorisation for many years. The second quadrant contains two municipalities from Spain and Belgium with far higher specific collection rates than their respective country averages. The third and fourth quadrants contain cities with more than 300,000 inhabitants, where the rate of separately collected organic waste is mostly below the national average.
Figure 2.
Relationship between the specific amount of separately collected organic waste and the national average.
Even though a linear correlation does not exist, it has to be noted that there is a strong positive correlation between the total number of inhabitants and the total amount of bio-waste collected (r = 0.859, p < 0.001), indicating that larger populations are associated with greater overall bio-waste collection.
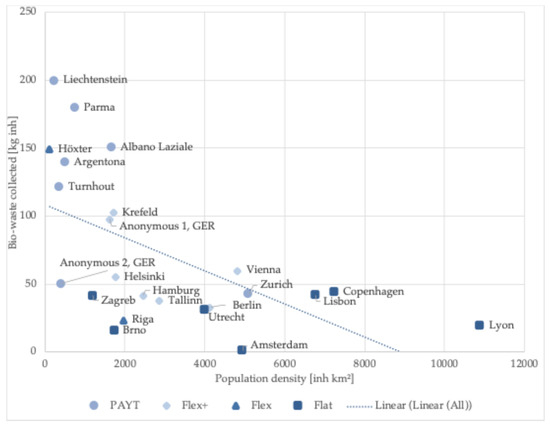
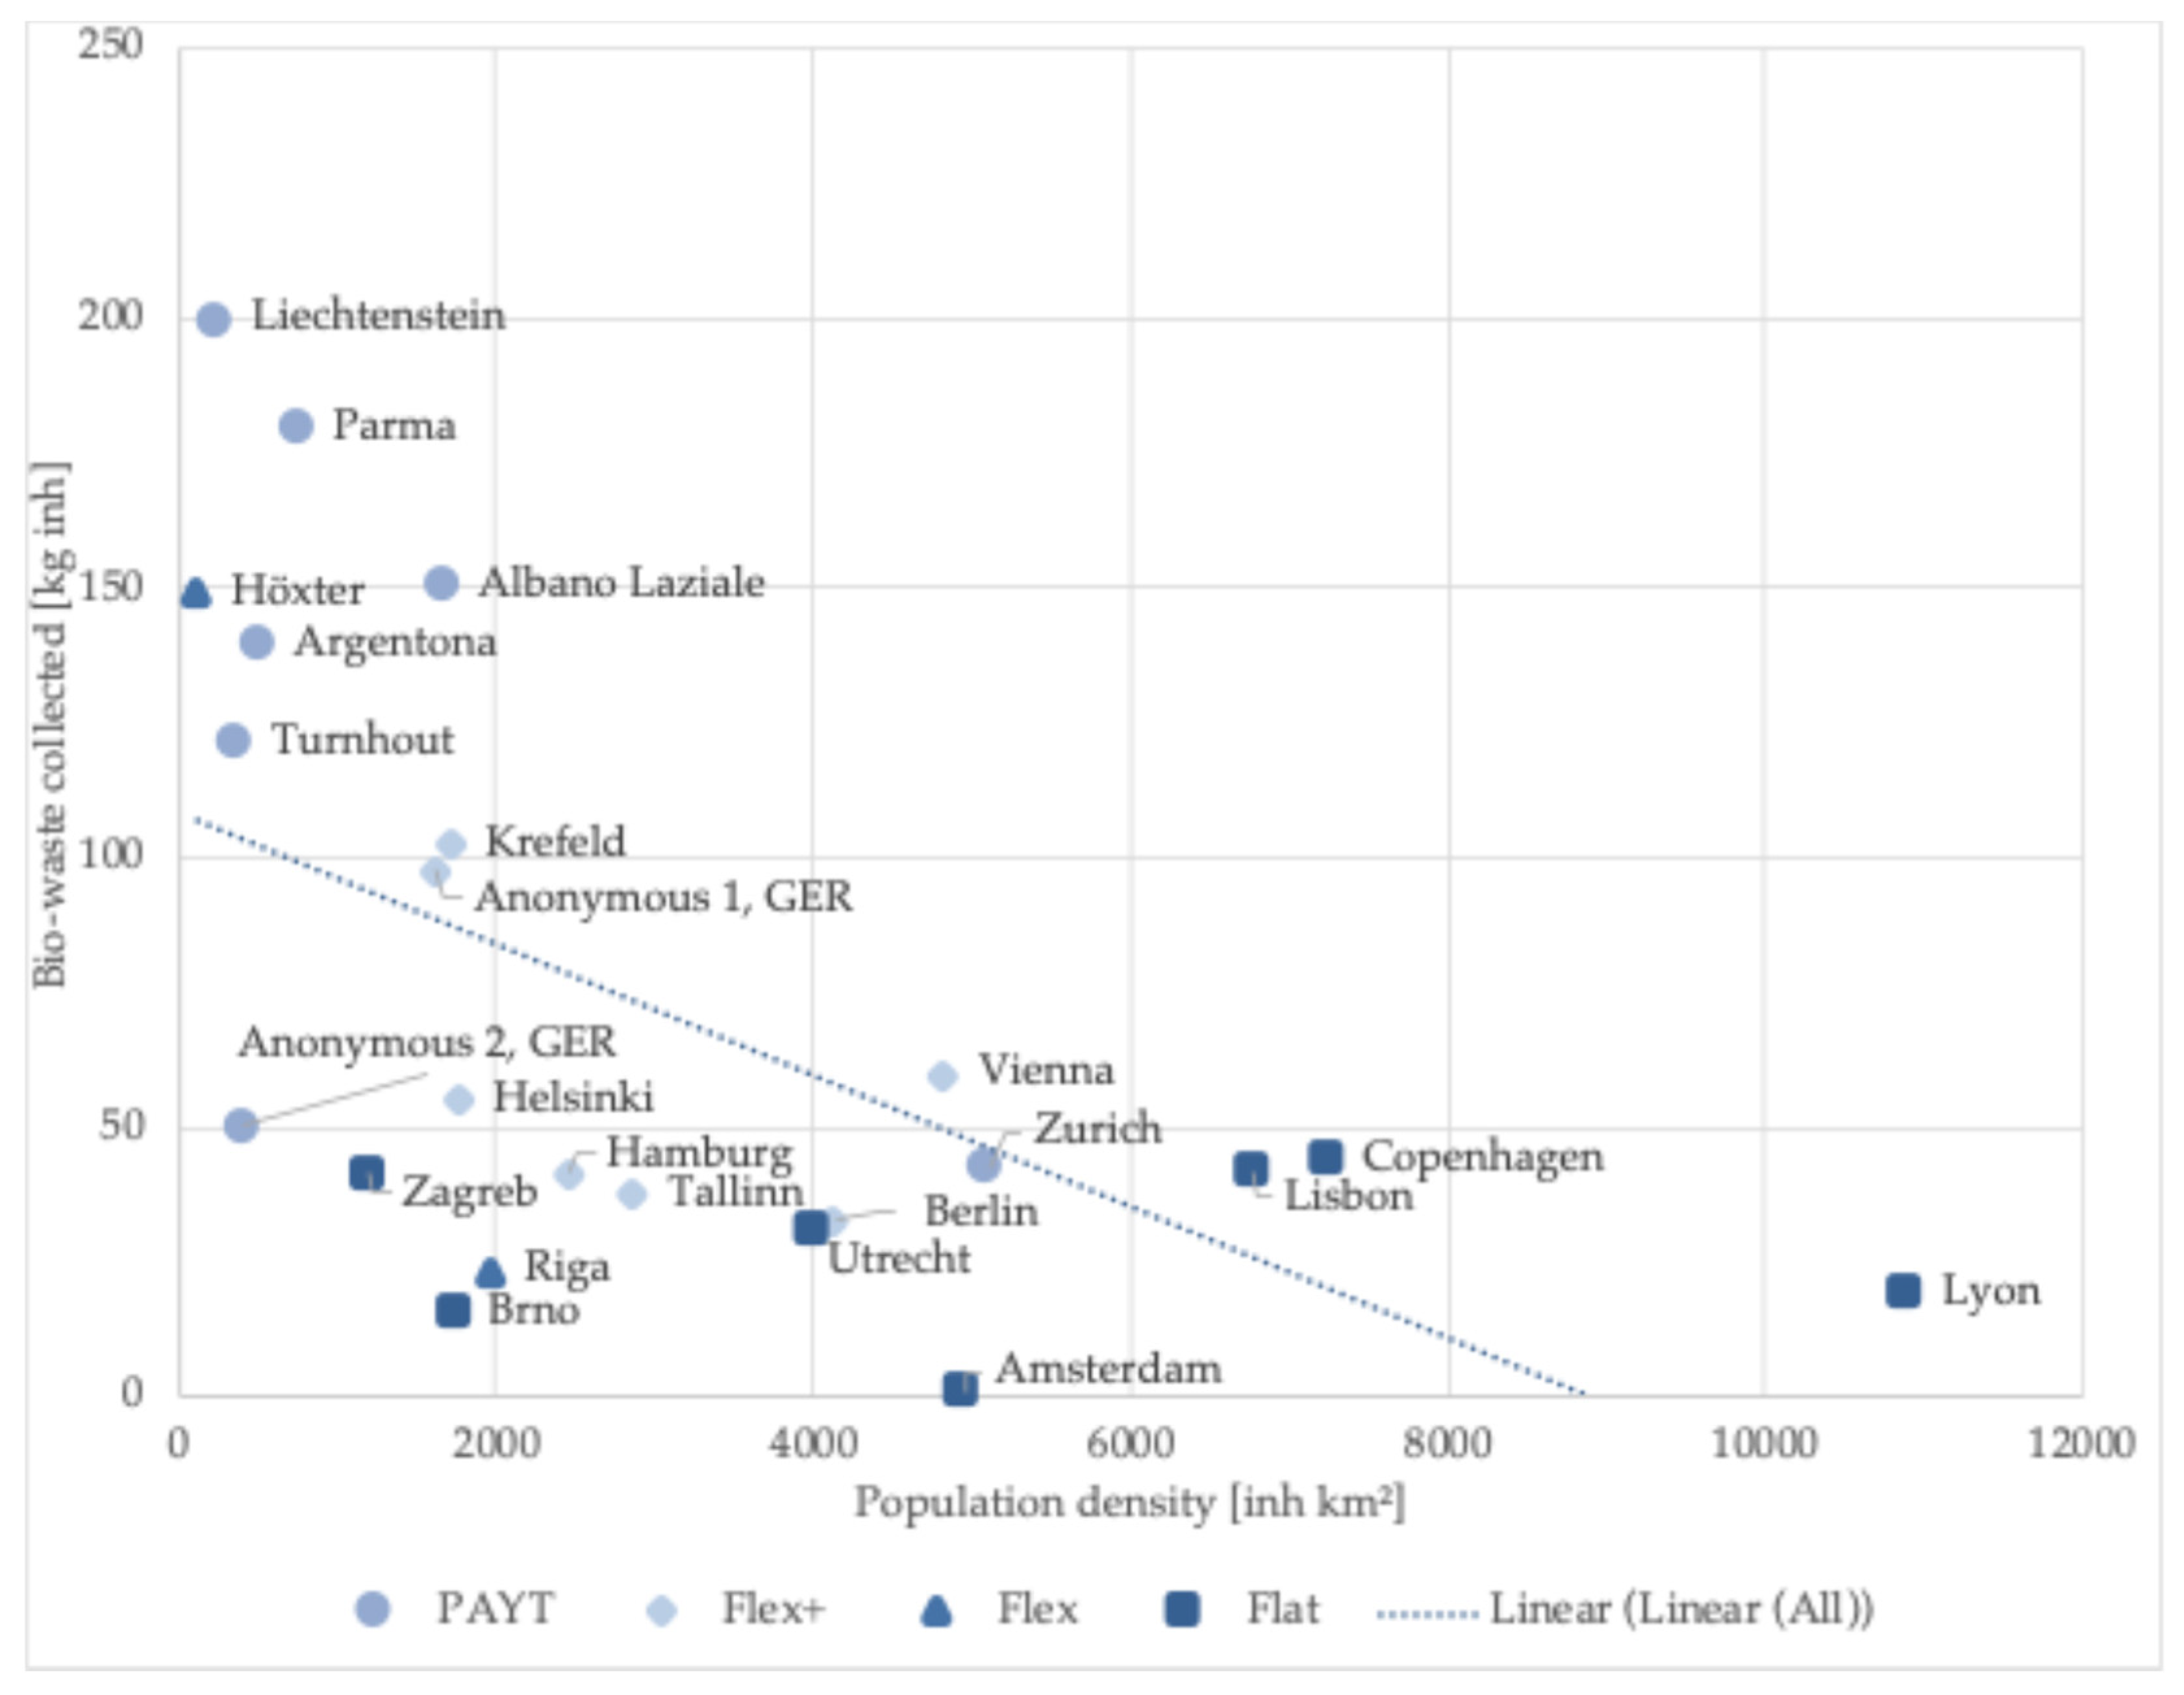
An analysis of the relationship of the specific amount of separately collected organic waste with population density is provided in Figure 3. A significant negative correlation was found (r = −0.579, p = 0.004), indicating that municipalities with higher population density tended to collect less bio-waste per person. All municipalities with an exceptionally high bio-waste sorting rate (Albano Laziale, Argentona, Höxter, Parma, Liechtenstein, and Turnhout) are located in rural areas with comparatively low population density. It can be assumed that there is a high proportion of green waste in the bio bin. Furthermore, Parma and the arrondissement of Turnhout reported a considerable amount of green waste (see Table 1), whereas the others did not report the amount of green waste separately.
Figure 3.
The relation between the specific amount of separated organic waste and the population density.
Home composting plays a role in many cities and is also supported by financial incentives in some cases (see below). However, because the quantities of at-home generated composting are very small in relation to the total amount of municipal bio-waste, these activities do not materially affect the comparative results and are therefore not analysed further.
3.4. Taxes, Fees, and Charges
The basic structure of the waste management financing system is included in Table 1 (last column). PAYT systems dominate in smaller municipalities with low population density. Apart from this observation, there are no obvious correlations between the size of the cities and their respective fee systems. In case of municipalities with a PAYT, Flex+, or Flex system, the collection of bio-waste is either cheaper compared to residual waste (e.g., in case of Hamburg: 1/5, in Berlin 1/3 of the charge for residual waste) or even free of charge (Albano Laziale, Parma, Vienna, Krefeld and city No. 17) to incentivise waste sorting at source. Possibilities for steering sorting behaviour also depend on the allocation of fees to be paid, usually either to the property owner or directly to individual households. This usually depends on the historical development of property taxes and municipal service fees in the Member States.
Some municipalities support home composting with different measures to allow citizens to save money:
- Free construction kits for composters.
- Waiving the obligatory bio-waste bin and therefore also the fee for this bin.
- Reduction in the collection frequency or the obligatory volume for residual waste.
A total of nine cities declared that there are no financial incentives for home composting. As on-site inspections (in County Höxter and the City of Hamburg) have shown, most households dispose of their kitchen waste in residual waste bins rather than in compost bins due to the fear of vermin. Therefore, there is a tendency either to reduce financial incentives or to install obligatory bio bins, provided that residents use the composters exclusively for garden waste.
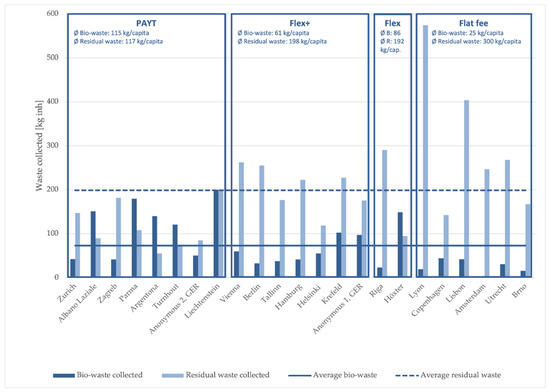
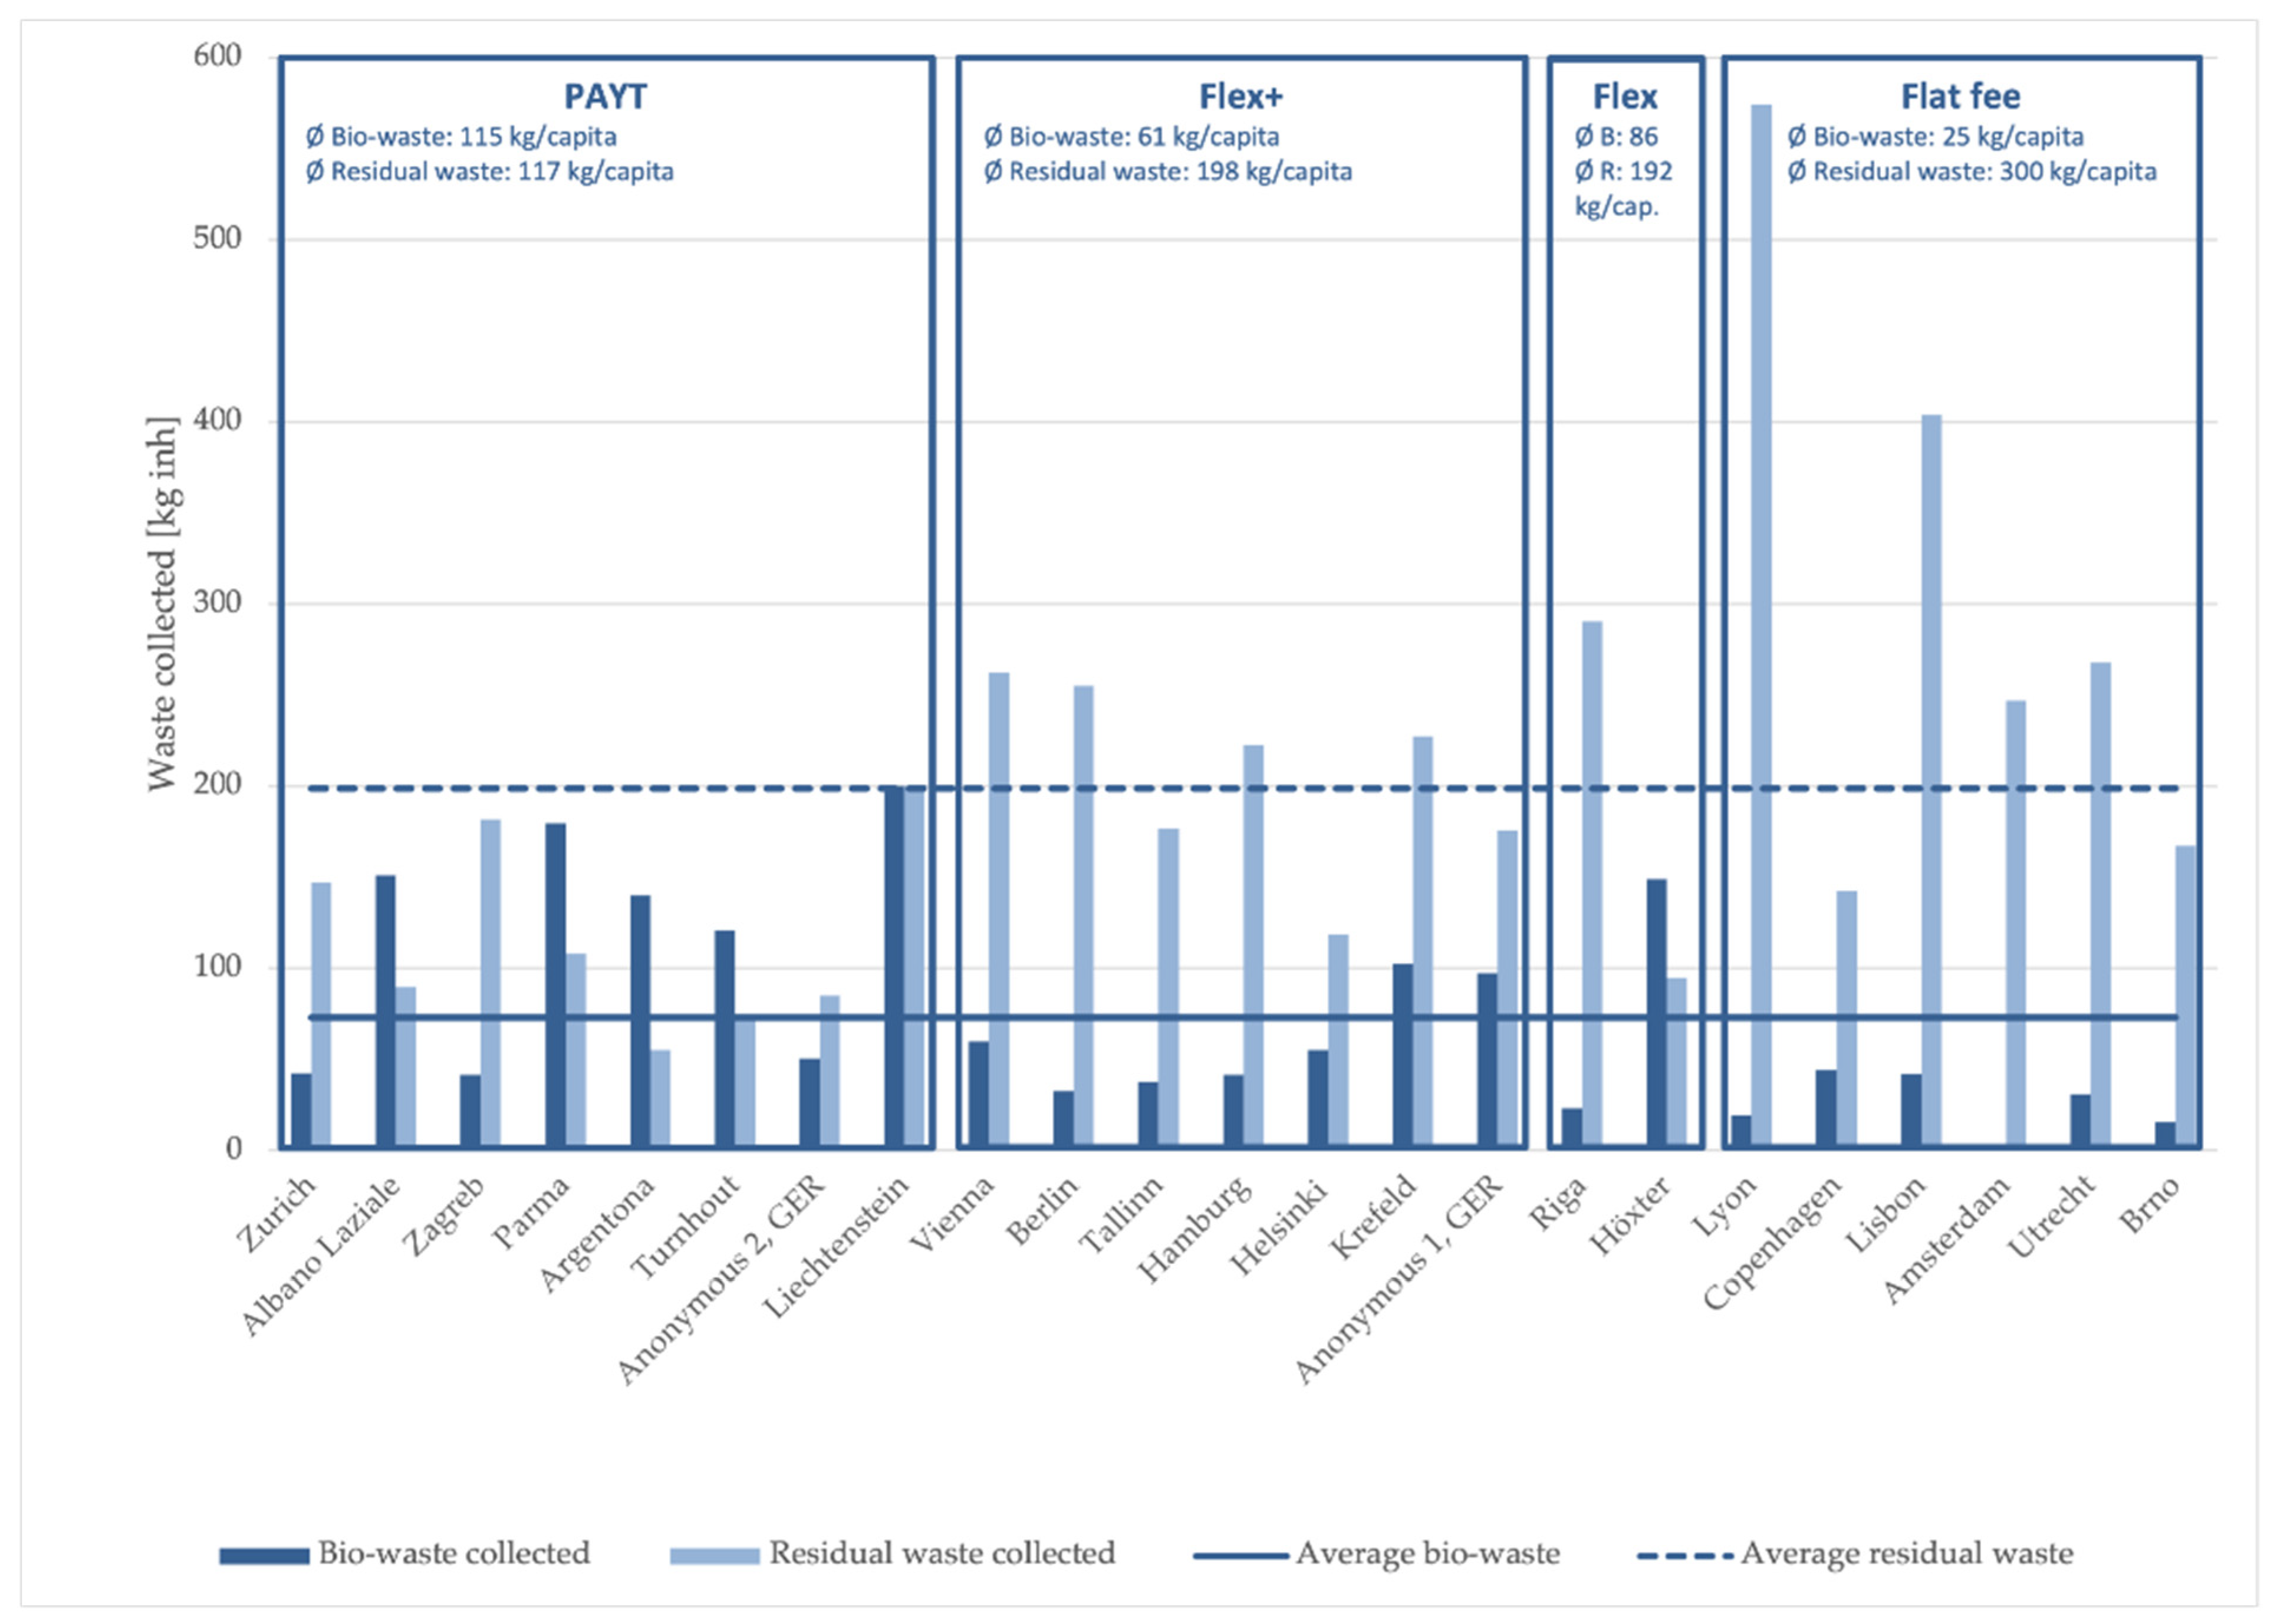
As fee systems influence the amount of both bio-waste and residual waste collected, the difference between the two waste fractions should relate to the charging system in place. The outcome of this comparison can be seen in Figure 4. Clearly, cities that use a PAYT system to provide financial incentives collect more organic waste and less residual waste than those that use taxes or flat fees. The differences between simple Flex and Flex+ systems are less obvious because there are only two examples of the Flex case. As shown in Figure 4, these effects tend to be more pronounced in smaller rural cities than in densely populated urban areas. This will be discussed in more detail in the next section.
Figure 4.
A specific amount of organic waste and residual waste is allocated to different waste fee systems.
The pattern described above is also supported by statistical analysis (Kruskal–Wallis tests with post hoc comparisons), which showed that PAYT systems collect significantly more bio-waste than flat fee systems and exhibit a similar, though non-significant, tendency toward lower residual waste; full test results are provided in Tables S2–S5. The primary limitation of the analysis is the small sample size (N = 23), combined with unequal group sizes and substantial variance, which considerably reduces statistical power.
3.5. Monitoring the Quality of Organic Waste
Monitoring the entire process is necessary to ensure the final product is of high quality and meets legal requirements. Moreover, in a value chain, the requirements of the consumer (in this case, farmers or industry) are the most important factor in successfully marketing the product, i.e., soil improvers or fertilisers made from municipal organic waste.
Most of the bio-waste collected separately is processed into compost (21 cities) and biogas (17 cities). The type of treatment facilities varies. There are six cities that combine anaerobic and aerobic treatment on the same site, with three of these plants also producing fertiliser as a side product or CO2 (for industrial use or greenhouses) in one case. In another eight cities, it is more common to send bio-waste to compost and biogas plants separately. In three cases, bio-waste is sent exclusively to biogas plants, and in six cases, bio-waste is sent exclusively to composting plants.
Table 3 summarises the practices for measuring the quality (measured as percentage of impurities by weight or volume) of bio-waste collection in cities. A total of 18 out of 26 cities responded to this question, while only 12 were able to state numbers regarding impurities measured. Typically, quality control of organic waste is carried out at the first intervention point, i.e., before or during collection, when there are quality issues. This helps to identify the most critical areas or sources of pollution. A second intervention point is needed to prevent contaminated material from entering the process (indicated as “re-sorting upon arrival” in Table 3), as this may lead to unmarketable compost. The final intervention point serves as a quality assurance measure for the finished product. It is also noted whether cities penalise contamination of bio bins to encourage compliance. Several cities mentioned that they also remove bio bins in cases of continuous contamination. This mostly results in higher fees for the respective residents due to the installation of a larger residual waste container and the price difference between residual and organic waste. In large housing complexes, this measure may not be as effective as in areas with small houses because it is difficult to identify the person who committed the offence, as was emphasised by Vienna.
Table 3.
Monitoring of the quality along the value chain and quality assessments.
Amsterdam was excluded from the further evaluation of quality issues because the strategy for the separate collection of organic waste is still under discussion, so monitoring refers to pilot areas.
4. Discussion
Due to the difficulty of distinguishing between the impact of economic incentives and that of many other factors on sorting behaviour, few attempts have been made to assess the influence of charging systems on the quantity and quality of organic waste. In this publication, we bring both issues together and try to evaluate some important frame conditions.
4.1. Relations Between the Amount of Organic Waste and the Type of Urban Settlement
The valorisation of municipal organic waste in Europe is an ongoing process, with some Member States leading the way and others lagging behind, according to the EEA’s early warning reports [12]. It is therefore assumed that the amount of organic waste collected separately per inhabitant varies considerably between cities in different Member States. However, the amount of separately collected organic waste in cities that participated in the survey is only partially related to their respective countries’ average specific collection rates (see Figure 2).
As can be seen from Figure 3, cities with higher population density tend to collect less bio-waste per person. This is in line with recent findings by Walk [45], who evaluated statistical figures from nearly all German municipalities. In the case of cities with more than 1500 inh. km−2, the sorting rate decreased by nearly by 50% compared to areas with less than 300 inh. km−2. Municipalities tend to prefer DtD collection with normal bins instead of large containers because contamination levels are usually lower in smaller bins than in large receptacles. However, this results in lower collection rates in densely populated areas because containers must be used due to a lack of space. A higher level of impurity is often associated with greater anonymity [59], particularly when many people use the same container [60], and is also correlated with lower-income areas, as these households often share containers among a larger population [61].
4.2. Specific Amount of Bio-Waste in Relation to the Local System of Waste Fees
Comparing the fee systems used by municipalities with the specific amounts of bio-waste and residual waste collected (see Figure 4) demonstrates the importance of financial incentives. In cities with a flat fee, the amount of bio-waste collected separately is far below the amount of residual waste. In contrast, cities with PAYT systems and some with Flex+ systems exhibit considerably lower figures for residual waste and higher numbers for bio-waste. This result supports the outcomes of former publications [41,42,43,44,45,48], which highlight the effectiveness of systems that offer financial incentives for decreasing the amount of residual waste and leading to a higher amount of separately collected organic waste.
4.3. Quality of Separately Collected Bio-Waste
The results presented in Table 3 shed light on the impact of quality control and enforcement. Bio bin control is an activity that takes place after the detection of unexpected impurities at the point of delivery, i.e., at the processing facility. Contamination sources can only be identified by opening and checking the bins for impurities, or by technical means [62], such as the recently introduced AI-supported sensor system (see e.g., ref. [63]) for use in the tipping area of waste collection trucks. To eliminate critical bins from the collection, there are two options (see ref. [64] for details):
- Education of certain identifiable users or households, with the aim of improving sorting at source. This feedback is often combined with a fine for emptying the bin into a residual waste truck in the event of repeated violations of the local statute.
- Exclusion of identified polluters, or even complete areas, if the amount of impurities cannot be significantly reduced.
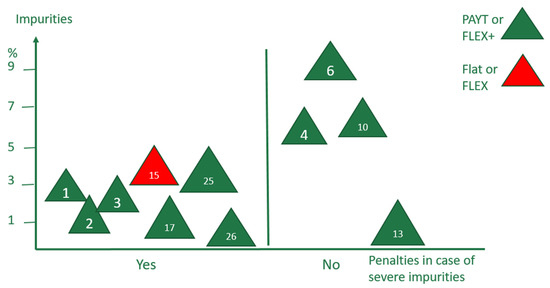
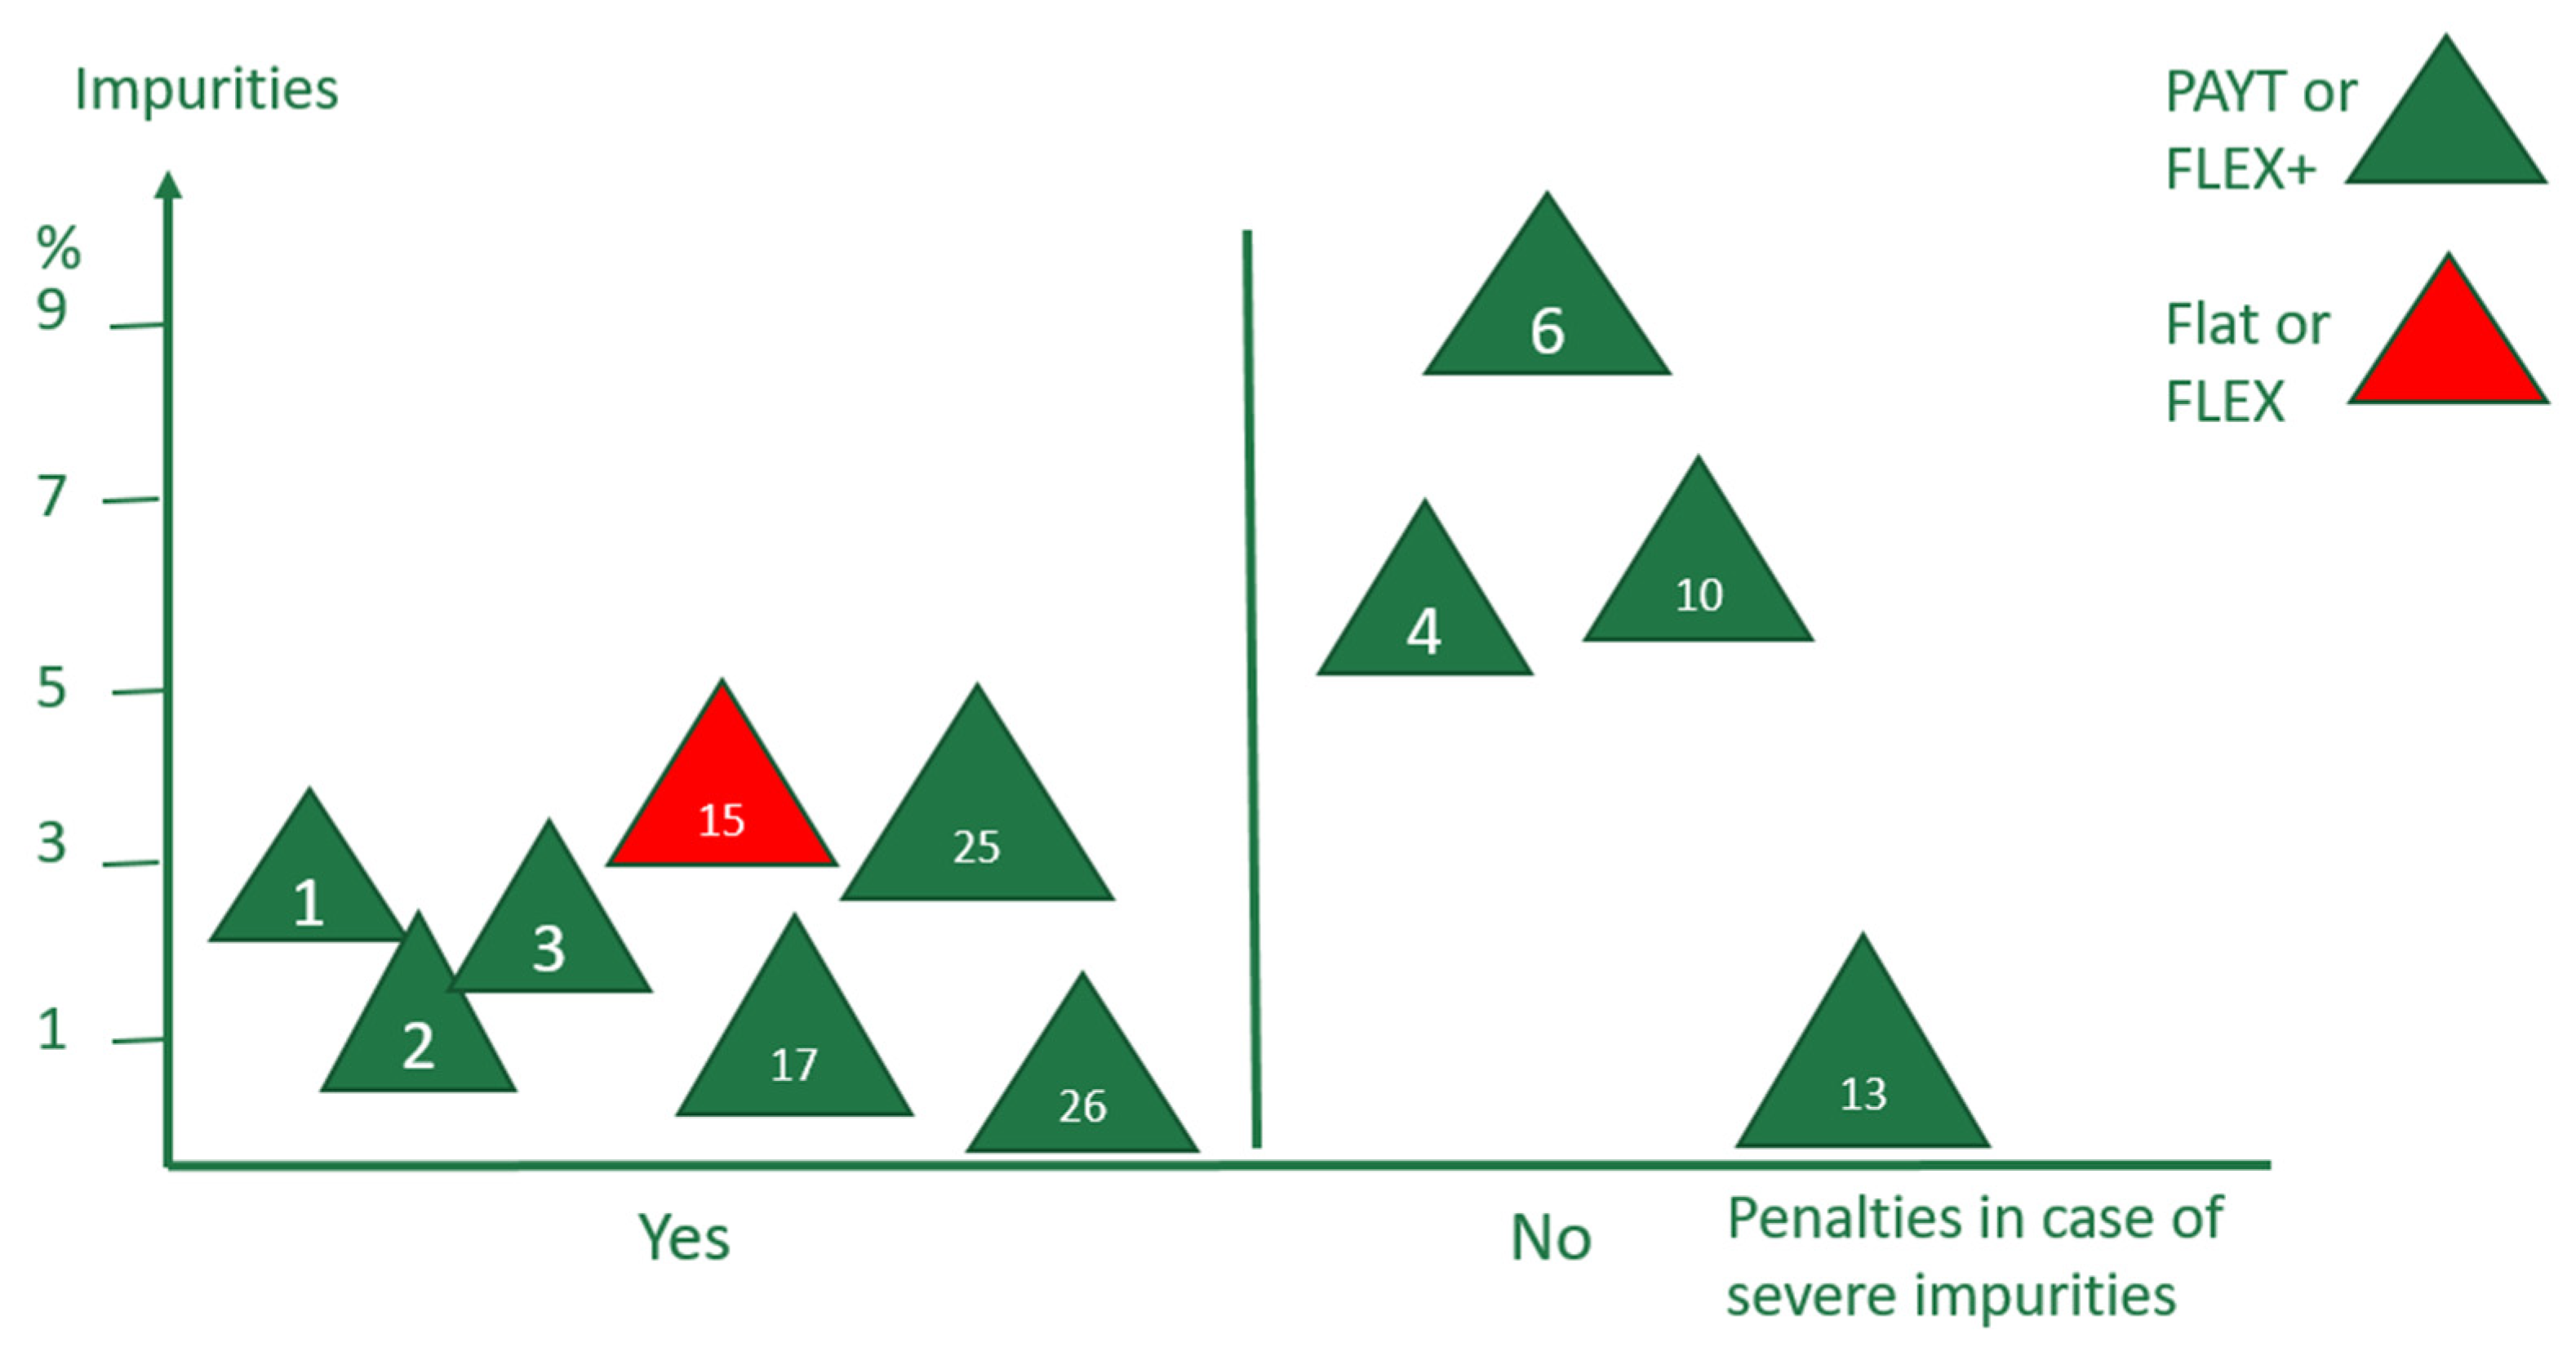
The ‘polluter pays’ principle can be used for enforcement when a PAYT or Flex+ system is in place, but hardly with taxes or flat fees. If certain waste producers are not permitted to order a bio bin, which is cheaper than a residual waste bin, because they have violated local statutes, their charges will increase considerably. Therefore, monitoring the quality of bio-waste before emptying the bin is only worthwhile if there are differentiated charges for residual and organic waste. This argument sheds light on the results depicted in Figure 5, which shows the relationship between the amount of impurities and the tools used to enforce the PPP. With one exception (No. 13, Zürich), the results suggest that achieving a level of impurities below 5% is difficult without differentiated charges and fines for violations. The deviating findings for Zürich could be related to the fact that the city will not connect its large residential complexes to the organic waste collection system until the end of 2026. Thus, the results for 2024 are mainly based on the collection of organic waste in bins and not in large containers, which leads to a relatively lower level of impurities, as discussed in Section 4.1. The importance of control and financial sanctions in preventing bio-waste contamination is consistent with the recent evaluation of German municipalities [65]. According to this elaborate study, control plus feedback and/or sanctions are the most effective tools for improving the quality of bio-waste, but they are also costly for cities. It is also interesting to compare these insights with the experiences collected in Milan (contamination~5%), where compliance with the local waste statutes is continuously monitored by a group of employees and violations of separation requirements are subject to fines [66]. It should be remarked that Milan is planning to apply a PAYT charge on residual waste in the near future to improve recycling results [67].
Figure 5.
Level of impurities in the bio bin in relation to charging systems and penalties for violation.
4.4. Combination of the Foregoing Perceptions
As stated in Section 4.1, the amount of organic waste collected separately is negatively correlated with population density. According to the discussion in Section 4.2, municipalities that offer financial incentives for separating bio-waste (PAYT or Flex+) have higher collection rates than those with flat fees or waste services financed by local taxes. The results presented in Section 4.3 suggest that achieving further improvements in quality depends on the implementation of appropriate enforcement measures.
However, PAYT and Flex+ systems tend to be most effective in areas with detached and semi-detached houses, but not so effective in large apartment houses. This is because it is difficult to identify and charge specific users of large containers for their individual share of waste disposal. User identification is crucial for a successful PAYT scheme, as outlined by Elia et al. [35], and is also recommended as a result of the evaluation of the collection system in Catalan cities [26]. The identification of certain users is mostly based on a code card provided to individual households, which is used to unlock waste containers. The city can therefore refer to a list of users who dropped waste into the container within a certain timeframe. According to additional information gathered in the Bin2Bean project, the City of Amsterdam withdrew an installed system of this type due to personal data security concerns. The City of Hamburg abstains from technical tools of this type due to the high installation and maintenance costs, besides concerns about data security. In the latter case, cooperation with homeowners (mostly large companies partially owned by the city) and providing residents with more convenient sorting and transport of kitchen waste is preferred [64]. Therefore, practitioners need guidelines on how to identify residents who dispose of waste in containers provided at their homes, in line with the European General Data Protection Regulation [68].
This makes it clear that the separate collection of organic waste will not necessarily be successful if PAYT systems are introduced. Further activities are necessary to prevent impurities in the organic waste bin, as the quality of compost and related products depends on the quality of the input material.
4.5. Sustainability
Though the collection of organic waste is a challenging task and requires a great deal of effort with respect to communication with citizens and monitoring, the importance of the valorisation of organic waste for sustainable development should not be underestimated. Soil improvers based on organic waste with good quality contribute to many of the Sustainable Development Goals (SDGs) [69]. They combat soil degradation (target 15.3) and mitigate climate change (target 13.2) by sequestration of carbon. The separate collection of bio-waste reduces the amount of waste that needs to be disposed of (target 12.5), also avoiding methane emissions (target 13.2). The valorisation also helps to reduce damage to the urban environment (target 11.6).
4.6. Limitations
This study is subject to several limitations that should be taken into account when interpreting the results. The network-based sampling approach and the reliance on voluntary participation introduced selection bias. The sample is geographically imbalanced, with a strong concentration of cities from Northern and Middle Europe due to a higher willingness to participate (see Figure 1). Lower participation from Southeastern and Eastern Europe is probably also due to the delayed introduction of the separate collection of organic waste (see also ref. [12]).
The completeness and level of detail in the responses to the questionnaire varied considerably. Missing data were particularly common for contamination indicators, participation rates, and percentages of green waste. The comparison of contamination levels gives only a first impression, as monitoring methods differed across cities, affecting both comparability and interpretability. Information on waste management costs was also frequently omitted and, due to differing financial reporting practices, was not considered in this paper; it had been included in the questionnaire mainly to provide contextual background. Similarly, the concluding question addressing the relevance of mechanisms beyond charging systems was excluded from the analysis, because we received uniformly affirmative responses with limited explanatory value.
As already mentioned in the introduction, there are many factors that influence the waste separation behaviour of citizens. The effectiveness of an elaborated charging system, including monitoring and enforcement, also depends on other measures like awareness raising, convenience, and infrastructure.
5. Conclusions
This contribution highlights the increasing importance of maximising the value of organic waste in Europe as an important activity to promote the CE and the production of soil improvers. It focuses on the relationship between the quantity and quality of separately collected bio-waste, and the relevant conditions that influence its management in European cities. Although regions in Northern and Central Europe are overrepresented in the study, the survey results generally reflect the current situation in Europe because many Member States in Southern and Southeastern Europe are not yet meeting targets for separating recyclable waste fractions [12], i.e., 55% recycling or preparation for re-use in 2025 according to the WFD. Our results suggest that the process of turning organic waste into soil improvers is in the early stages of development and poses a significant challenge, particularly for urban areas with high population density. In many municipalities, separate collection is still in its infancy. This is reflected not only in the relatively low amounts of organic waste, but also in the fact that 50% of the cities participating in the survey do not yet monitor the quality of bio-waste. The use of standard procedures and further technical improvements for the inspection of bio bins for impurities would be helpful.
We found an inverse relationship between the amount of bio-waste collected separately and population density. Large cities tend to introduce the collection of organic waste in areas with detached and semi-detached houses first. This strategy focuses on ‘low-hanging fruit’ because quality problems usually increase with higher population density. This is one reason, among others, for the low percentage of impurities found in several large cities (see Table 3), i.e., <5% or even <3%. These cities face a real challenge of increasing the amount of compost without compromising on quality.
Furthermore, cities with differentiated charging systems show a higher specific amount of organic waste than those that do not financially motivate households to separate their waste (see Figure 4). However, it cannot be concluded that the introduction of PAYT or Flex+ systems is key to a high amount of usable compost. There is a risk of decreasing quality if financial motivation leads to misuse of the brown bin, i.e., dropping residual waste into the organic waste to save money (see e.g., refs. [51,60,65]). According to the results presented here, control mechanisms should be in place to ensure good quality bio-waste in any case (see Figure 5). This makes it clear that the valorisation of organic waste into soil improvers requires significant political support, particularly in large cities. Efforts to avoid contamination in the final product, such as monitoring bio-waste and installing pre- and post-sorting devices in composting facilities, increase the cost of the process, whereas revenues for compost or fertilisers are often low despite their undisputed value for healthy soils. Municipalities should use the findings from this study and the literature cited therein to coordinate and optimise their instruments for high-quality bio-waste collection. The local situation, including the cultural background of the relevant citizens, must be carefully considered [24,31].
Nevertheless, future targets for the recovery of municipal waste (i.e., 60% by 2030 and 65% by 2035) can only be achieved by collecting a significant proportion of organic waste. Although landfilling biodegradable waste is still common in some Member States, it will only be permissible to a certain extent until 2035. This regulatory framework is in line with sustainability principles and will encourage the separate collection of bio-waste. However, obtaining high-quality input material in high-rise buildings and other multi-family homes requires enormous effort. Therefore, it is useful to consider alternative technical methods. In the Bin2Bean project, a ‘Kitchen Sink Grinder’ (KSG) is being developed [70], which could be installed in newly constructed high-rise buildings. The KSG will collect food waste at the household level, separating it into liquid and solid streams. The liquid stream is intended for discharge into the sewage system, while the solid stream will be collected and sent to a central anaerobic digestion plant. This method would largely prevent contamination. However, the loss of carbon compared to the collection of solid organic waste should be investigated. Furthermore, a separate pipe system is needed. Experience from a pilot installation in Seoul based on a similar system could provide valuable insights for discussions in Europe [71]. Comparative life cycle assessments, including energy and mass balances for carbon, nitrogen, phosphorus, etc., and economic considerations along the entire process chain, from households to products, are necessary in order to select the most sustainable option depending on population density.
Summing up, there is no silver bullet for the collection of clean bio-waste from densely populated areas. More research and practical experience on-site are necessary to find suitable solutions.
Supplementary Materials
The following supporting information can be downloaded at: https://www.mdpi.com/article/10.3390/su18010052/s1, Table S1: Questionnaire; Table S2: Pearson’s Correlations; Table S3: Descriptive Statistics; Table S4: Group comparison of charging systems for bio-waste; Table S5: Group comparisons of charging systems for residual waste.
Author Contributions
Conceptualization: H.F.; methodology: M.H.; investigation: M.H.; data curation: M.H.; writing—original draft preparation: H.F.; writing—review and editing: H.F.; visualisation: M.H.; project administration: H.F.; funding acquisition: H.F. All authors have read and agreed to the published version of the manuscript.
Funding
Part of this research was co-funded by the European Union (project “Bin2Bean”, grant number 101113011). Views and opinions expressed are, however, those of the authors only and do not necessarily reflect those of the European Union or REA. Neither the European Union nor the granting authority can be held responsible for them.
Institutional Review Board Statement
No personal or sensitive data were used in this study. Therefore, ethical review and approval were waived by the Institutional Committee, as the study did not involve the processing of personal data within the meaning of § 1 of the German Federal Data Protection Act (BDSG) and Article 4 and Recital 26 of the European General Data Protection Regulation (GDPR).
Informed Consent Statement
Informed consent was obtained from all subjects involved in the study.
Data Availability Statement
More data and results can be found in the publications from the Bin2Bean project (www.bin2bean.eu, accessed on 15 November 2025) and in Maike Hentschel’s Master’s Thesis (will be made available at PubData after examination).
Acknowledgments
This is a part of Maike Hentschel’s Master’s Thesis. The authors are indebted to Yannick Schrik (University of Wageningen) for valuable ideas and discussions and to Steffen Walk, Technical University of Hamburg, and the European Compost Network, for generous information. We would like to thank the employees of the cities surveyed in this study for completing the extensive questionnaire.
Conflicts of Interest
Henning Friege is a partner of N3 Thinking Ahead Dr. Friege & Partners. The authors declare no conflicts of interest. The funding body had no role in the design of the study; in the collection, analyses, or interpretation of data; in the writing of the manuscript; or in the decision to publish the results.
Abbreviations
The following abbreviations are used in this manuscript:
| CE | Circular economy |
| EEA | European Environment Agency |
| EU | European Union |
| inh. | Inhabitant |
| KSG | Kitchen sink grinder |
| PAYT | Pay as you throw |
| PPP | Polluter-Pays Principle |
| WFD | Waste Framework Directive |
| WLD | Waste Landfill Directive |
References
- Adugna, G. A review on impact of compost on soil properties, water use and crop productivity. Acad. Res. J. Agri. Sci. Res. 2016, 4, 93–104. [Google Scholar] [CrossRef]
- Shiralipour, A.; McConnell, D.B.; Smith, W.H. Uses and benefits of MSW compost: A review and an assessment. Biomass Bioenergy 1992, 3, 267–279. [Google Scholar] [CrossRef] [Scilit]
- Available online: https://www.hamburg.com/publicservice/info/111100425/ (accessed on 28 August 2025).
- Available online: https://english.shanghai.gov.cn/en-Latest-WhatsNew/20240826/6936861e41cc4dedb30a6146bbe99017.html (accessed on 23 October 2025).
- Available online: https://www.c40.org/case-studies/cities100-milan-collecting-food-waste-city-wide/ (accessed on 17 November 2025).
- Available online: https://www.sandiego.gov/environmental-services/recycling/sb1383 (accessed on 17 November 2025).
- Directive (EU) 2018/850 on the Landfill of Waste. Available online: https://eur-lex.europa.eu/legal-content/EN/TXT/?uri=celex%3A32018L0850 (accessed on 17 November 2025).
- Directive (EU) 2018/851 Amending Directive 2008/98/EC on Waste. Available online: https://eur-lex.europa.eu/eli/dir/2018/851/oj/eng (accessed on 17 November 2025).
- European Environment Agency. Bio-Waste in Europe—Turning Challenges into Opportunities, EEA Report 04/2020; European Environment Agency: Copenhagen, Denmark, 2020; ISBN 978-92-9480-223-1. [Google Scholar]
- Gerwin, W.; Repmann, F.; Galatsidas, S.; Vlachaki, D.; Gounaris, N.; Baumgarten, W.; Volkmann, C.; Keramitzis, D.; Kiourtsis, F.; Freese, D. Assessment and quantification of marginal lands for biomass production in Europe using soil-quality indicators. SOIL 2018, 4, 267–290. [Google Scholar] [CrossRef] [Scilit]
- Directive (EU) 2023/2413 Amending Directive (EU) 2018/2001, Regulation (EU) 2018/1999 and Directive 98/70/EC as Regards the Promotion of Energy from Renewable Sources, and Repealing Council Directive (EU) 2015/652. Available online: https://eur-lex.europa.eu/legal-content/EN/TXT/PDF/?uri=OJ:L_202302413 (accessed on 17 November 2025).
- European Environment Agency. Early Warning Assessments Related to the 2025 Targets for Municipal Waste and Packaging Waste, 27 Country Profiles; European Environment Agency: Copenhagen, Denmark, 2022. [Google Scholar]
- Friege, H.; Eger, Y. Best practice of bio-waste collection as a prerequisite for high-quality compost. Waste Manag. Res. 2022, 40, 104–110. [Google Scholar] [CrossRef] [Scilit] [PubMed]
- Le Pera, A.; Sellaro, M.; Sicilia, F.; Ciccoli, R.; Sceberras, B.; Freda, C.; Fanelli, E.; Cornacchia, G. Environmental and economic impacts of improper materials in the recycling of separated collected food waste through anaerobic digestion and composting. Sci. Total Environ. 2023, 880, 163240. [Google Scholar] [CrossRef] [Scilit]
- Alvarez, M.D.; Sans, R.; Garrido, N.; Torres, A. Factors that affect the quality of the bio-waste fraction of selectively collected solid waste in Catalonia. Waste Manag. 2008, 28, 359–366. [Google Scholar] [CrossRef] [Scilit]
- Nizzetto, L.; Futter, M.; Langaas, S. Are agricultural soils dumps for microplastics of urban origin? Environ. Sci. Technol. 2016, 50, 10777–10779. [Google Scholar] [CrossRef] [Scilit]
- Bläsing, M.; Amelung, W. Plastics in Soil: Analytical methods and potential sources. Sci. Total Environ. 2018, 612, 422–435. [Google Scholar] [CrossRef] [Scilit]
- Braun, M.; Mail, M.; Heye, R.; Amelung, W. Plastic in compost: Prevalence and potential input into agricultural and horticultural soils. Sci. Total Environ. 2021, 760, 143335. [Google Scholar] [CrossRef] [Scilit]
- Regulation (EU) 2019/1009 Laying Down Rules on the Making Available on the Market of EU Fertilising Products and Amending Regulations (EC) No 1069/2009 and (EC) No 1107/2009 and Repealing Regulation (EC) No 2003/2003. Available online: https://eur-lex.europa.eu/eli/reg/2019/1009/oj/eng (accessed on 17 November 2025).
- Available online: https://rathaus.jena.de/en/new-rules-organic-waste-garbage-can-less-plastic-more-quality (accessed on 17 November 2025).
- Dunne, L.; Convery, F.J.; Gallagher, L. An investigation into waste charges in Ireland, with emphasis on public acceptability. Waste Manag. 2008, 28, 2826–2834. [Google Scholar] [CrossRef] [Scilit]
- Ukkonen, A.; Sahimaa, O. Weight-based pay-as-you-throw pricing model: Encouraging sorting in households through waste fees. Waste Manag. 2021, 135, 372–380. [Google Scholar] [CrossRef] [Scilit]
- Messina, G.; Tomasi, A.; Ivaldi, G.; Vidoli, F. ‘Pay as you own’ or ‘pay as you throw’? A counterfactual evaluation of alternative financing schemes for waste services. J. Clean. Prod. 2023, 412, 137363. [Google Scholar] [CrossRef] [Scilit]
- Van Beukering, P.J.H.; Bartelings, H.; Linderhof, V.G.M.; Oosterhuis, F.H. Effectiveness of unit-based pricing of waste in The Netherlands: Applying a general equilibrium model. Waste Manag. 2009, 29, 2892–2901. [Google Scholar] [CrossRef] [Scilit]
- Jourdan, M.; Favoino, E. LIFE BIOBEST D3.4—Factsheets on the Analysis of Best Practices in Communications and Engagement. Available online: https://zerowasteeurope.eu/wp-content/uploads/2024/06/Jun24_240620_LIFEBIOBEST_WP3_D3.4_Factsheets-communication-engagement_publication.pdf (accessed on 14 August 2025).
- Meisterl, K.; Sastre, S.; Puig-Ventosa, I.; Chifari, R.; Sánchez, L.M.; Chochois, L.; Fiorentino, G.; Zucaro, A. Circular Bioeconomy in the Metropolitan Area of Barcelona: Policy Recommendations to Optimize Biowaste Management. Sustainability 2024, 16, 1208. [Google Scholar] [CrossRef] [Scilit]
- Botetzagias, I.; Dima, A.F.; Malesios, C. Extending the Theory of Planned Behaviour in the context of recycling: The role of moral norms and of demographic predictors. Resour. Conserv. Recycl. 2015, 95, 58–67. [Google Scholar] [CrossRef] [Scilit]
- Bernad-Beltrán, D.; Simó, A.; Bovea, M.D. Attitude towards the incorporation of the selective collection of biowaste in a municipal solid waste management system. A case study. Waste Manag. 2014, 34, 2434–2444. [Google Scholar] [CrossRef] [Scilit] [PubMed]
- Ek, C.; Söderberg, M. Norm-based feedback on household waste: Large-scale field experiments in two Swedish municipalities. J. Public Econ. 2024, 238, 105191. [Google Scholar] [CrossRef] [Scilit]
- Kirakozian, A. One Without the Other? Behavioural and Incentive Policies for Household Waste Management. J. Econ. Surv. 2016, 30, 526–551. [Google Scholar] [CrossRef] [Scilit]
- Stoeva, K.; Alriksson, S. Influence of recycling programmes on waste separation behaviour. Waste Manag. 2017, 68, 732–741. [Google Scholar] [CrossRef] [Scilit] [PubMed]
- Svatikova, K.; Brown, A.; Börkey, P. Economic Instruments for a Resource-Efficient Circular Economy; OECD Environment Working Papers, No. 257; OECD: Paris, France, 2025. [Google Scholar] [CrossRef] [Scilit]
- Hong, S. The effects of unit pricing system upon household solid waste management: The Korean experience. J. Environ. Manag. 1999, 57, 1–10. [Google Scholar] [CrossRef] [Scilit]
- Reingewertz, Y.; Ayalon, O. The effect of the intensive margin on waste separation behavior: A discrete choice experiment. Environ. Dev. Sustain. 2025. [Google Scholar] [CrossRef] [Scilit]
- Elia, V.; Gnoni, M.G.; Tornese, F. Designing Pay-As-You-Throw schemes in municipal waste management services: A holistic approach. Waste Manag. 2015, 44, 188–195. [Google Scholar] [CrossRef] [Scilit]
- Alzamora, B.R.; Barros, R.T.V. Review of municipal waste management charging methods in different countries. Waste Manag. 2020, 115, 47–55. [Google Scholar] [CrossRef] [Scilit]
- Bilitewski, B. From traditional to modern waste fee systems. Waste Manag. 2008, 28, 2760–2766. [Google Scholar] [CrossRef] [Scilit]
- Reichenbach, J. Status and prospects of pay-as-you-throw in Europe—A review of pilot research and implementation studies. Waste Manag. 2008, 28, 2809–2814. [Google Scholar] [CrossRef] [Scilit] [PubMed]
- Bucciol, A.; Montinari, N.; Piovesan, M. Do Not Trash the Incentive! Monetary Incentives and Waste Sorting; Jena Economic Research Papers No. 2011-058; Friedrich-Schiller-University: Jena, Germany, 2011. [Google Scholar]
- Šauer, P.; Pařízková, L.; Hadrabová, A. Charging systems for municipal solid waste: Experience from the Czech Republic. Waste Manag. 2008, 28, 2772–2777. [Google Scholar] [CrossRef] [Scilit] [PubMed]
- Messina, G.; Tomasi, A. Wasted in Waste? The Benefits of Switching from Taxes to Pay-As-You-Throw Fees: The Italian Case; Bank of Italy Occasional Paper No. 584; Elsevier: Amsterdam, The Netherlands, 2020. [Google Scholar] [CrossRef] [Scilit]
- Bonelli, M.; Bosio, L.; Cavallo, R.; Gianolio, U.; Marengo, P. Waste prevention impacts on small municipalities: Three experiences from northern Italy. Waste Manag. Res. 2016, 34, 1014–1025. [Google Scholar] [CrossRef] [Scilit]
- Starr, J.; Nicolson, C. Patterns in trash: Factors driving municipal recycling in Massachusetts. Resour. Conserv. Recycl. 2015, 99, 7–18. [Google Scholar] [CrossRef] [Scilit]
- Morlok, J.; Schoenberger, H.; Styles, D.; Galvez-Martos, J.L.; Zeschmar-Lahl, B. The Impact of Pay-As-You-Throw Schemes on Municipal Solid Waste Management: The Exemplar Case of the County of Aschaffenburg, Germany. Resources 2017, 6, 8. [Google Scholar] [CrossRef] [Scilit]
- Walk, S. Einflussfaktoren auf Die Sammlung von Biogut und Restmüll, Presentation; Hamburg University of Technology: Hamburg, Germany, 2025. [Google Scholar] [CrossRef]
- Andersson, C.; Stage, J. Direct and Indirect Effects of Waste Management Policies on Household Waste Behaviour: The Case of Sweden; Working Paper 148; National Institute of Economic Research: Stockholm, Sweden, 2017. [Google Scholar]
- Dahlén, L.; Lagerkvist, A. Pay as you throw—Strengths and weaknesses of weight-based billing in household waste collection systems in Sweden. Waste Manag. 2010, 30, 23–31. [Google Scholar] [CrossRef] [Scilit]
- Gautier, A.; Salem, I. The impact of prices and pricing units on residual and organic waste: Evidence from Wallonia, Belgium. Waste Manag. 2023, 155, 99–106. [Google Scholar] [CrossRef] [Scilit]
- Miliute-Plepiene, J.; Plepys, A. Does food sorting prevents and improves sorting of household waste? A case in Sweden. J. Clean. Prod. 2015, 101, 182–192. [Google Scholar] [CrossRef] [Scilit]
- Vassanadumrongdee, S.; Kittipongvises, S. Factors influencing source separation intention and willingness to pay for improving waste management in Bangkok, Thailand. Sustain. Environ. Res. 2018, 28, 90–99. [Google Scholar] [CrossRef] [Scilit]
- Friege, H. Separate Collection of Waste Fractions—Economic Opportunities and Problems. In Source Separation and Recycling—Implementation and Benefits for a Circular Economy; Dornack, C., Maletz, R., Lou, Z., Eds.; Springer: Cham, Switzerland, 2018; pp. 11–30. ISBN 978-3-319-69071-1. Available online: https://link.springer.com/chapter/10.1007/698_2017_24 (accessed on 17 November 2025).
- Briguglio, M. Taxing household waste: Intended and unintended consequences. J. Clean. Prod. 2021, 304, 127034. [Google Scholar] [CrossRef] [Scilit]
- Kranert, M.; Böhme, L.; Fritzsche, A.; Gottschall, R. Einflussgrößen auf Die Separate Bioguterfassung Unter Besonderer Berücksichtigung der Qualität; Entsorgergemeinschaft der Deutschen Entsorgungswirtschaft (EdDE e.V.): Köln, Germany, 2016. [Google Scholar]
- Hadzi-Nikolova, M.; Dimov, G.; Mirakovski, D.; Zendelska, A.; Doneva, N.; Zlatkovski, V.; Maragkaki, A.; Papadaki, A.; Sabathianakis, G.; Thrassyvoulos, M.; et al. Biowaste Management and Circular Economy: Usage of Pay as you Throw System and Autonomous Composting Units in Municipality of Probishtip. Circ. Econ. Sustain. 2022, 2, 1283–1300. [Google Scholar] [CrossRef] [Scilit]
- Romano, G.; Masserini, L. Pay-as-you-throw tariff and sustainable urban waste management: An empirical analysis of relevant effects. J. Environ. Manag. 2023, 347, 119211. [Google Scholar] [CrossRef] [Scilit]
- European Commission. Boosting the Market Deployment of Safe, Effective and Sustainable Innovations for Soil Improvement from Bio-Waste, Towards Regenerative Soil Systems. 2023. Available online: https://cordis.europa.eu/project/id/101113011 (accessed on 17 November 2025).
- Lüssenhop, P.; Walk, S.; Körner, I. Abfall-Atlas: Bioabfall und Restmüll Deutschland 2022; Technische Universität Hamburg: Hamburg, Germany, 2024. [Google Scholar] [CrossRef]
- Rijkswaterstaat: Landelijk Afvalbeheerplan 3 (LAP3). Deel B: Afvalbeheer en Overbrenging, Versie Tweede Wijziging, Geldig Vanaf 1 Januari 2024. Available online: https://lap3.nl/beleidskader/deel-b-afvalbeheer/ (accessed on 14 January 2024).
- Kamoen, C.; Karahanoglu, A. Citizen Profiles of Residual Waste Separation Behaviour. Proc. Des. Soc. 2021, 1, 631–640. [Google Scholar] [CrossRef] [Scilit]
- Bucciol, A.; Montinari, N.; Piovesan, M. It Wasn’t Me! Visibility and Free Riding in Waste Sorting; Working Paper No. 2014:17; Lund University: Lund, Sweden, 2014; Available online: http://hdl.handle.net/10419/260114 (accessed on 17 March 2024).
- Injodikaran, J. Detection of Contamination in Biowaste. Master’s Thesis, ETH Zurich, Zurich, Switzerland, 2024. [Google Scholar] [CrossRef]
- Landesanstalt für Umwelt Baden-Württemberg (LUBW) (Ed.) Untersuchung der Eignung und Effizienz Technischer Systeme zur Fremdstofferkennung bei der Sammlung von Bioabfällen; Landesanstalt für Umwelt Baden-Württemberg: Karlsruhe, Germany, 2023; Available online: https://pudi.lubw.de/detailseite/-/publication/10540 (accessed on 12 December 2024).
- SCANTEC System. Available online: https://ecotec-scantec.com/en/products/smartscan/ (accessed on 13 October 2025).
- Friege, H. Collection of Organic Waste—Guidelines for Communication and Awareness Raising. 2025. Available online: https://www.bin2bean.eu/wp-content/uploads/2025/05/SPG22-Guidelines-Communication-Awareness_final-3.pdf (accessed on 27 July 2025).
- Becker, G.; Santjer, M.; Hannes, L.; Bauer, S.K.; Fried, L. Untersuchung der Wirksamkeit von Abfallberatung, Kontroll- und Sanktionsmechanismen und Anderen Maßnahmen zur Erhöhung von Menge, Anteil und Sortenreinheit Getrennt Gesammelter Bioabfälle in Verschiedenen Siedlungsstrukturen; UBA Texte 109/2025; Umweltbundesamt: Dessau, Germany, 2025. [Google Scholar] [CrossRef]
- Dickinson, K. Setting the Trend: Milan’s Recycling Success. Resource 93. 2018. Available online: https://resource.co/magazine/93 (accessed on 24 November 2025).
- Brambilla, V.; Confalonieri, A.; Krutova, I.; Lopez, E.; Giavini, M.; Ricci, M. LIFE BIOBEST D3.1—Guidelines on the Separate Collection of Bio-Waste. 2024. Available online: https://zerowasteeurope.eu/wp-content/uploads/2024/06/Jun24_240618_LIFE-BIOBEST_WP3_D3.1_Guideline_Bio-waste_SeparateCollection_Submitted.pdf (accessed on 17 August 2024).
- Regulation (EU) 2016/679 on the Protection of Natural Persons with Regard to the Processing of Personal Data and on the Free Movement of Such Data, and Repealing Directive 95/46/EC (General Data Protection Regulation). Available online: https://eur-lex.europa.eu/eli/reg/2016/679/oj/eng (accessed on 11 November 2025).
- United Nations: The 17 Goals. Available online: https://sdgs.un.org/goals (accessed on 17 November 2025).
- Van den Broeck, W.; Schrik, Y. Advanced Food Waste Collection for High-Rise Buildings. 2024. Available online: https://www.ams-institute.org/urban-challenges/metropolitan-food-systems/advanced-food-waste-collection-system-for-high-rise-buildings/ (accessed on 23 October 2025).
- Kim, K.-S.; Lee, D.-H.; Jeon, Y.-W.; Han, S.; Seo, D.-C. Developing a Centralized Automatic Biomass Recovery System for Zero-Food Waste in High-Rise Apartment. In Waste Management for a Sustainable Future—Technologies, Strategies and Global Perspectives; Saleh, H.M., Hassan, A.I., Eds.; IntechOpen: London, UK, 2025. [Google Scholar] [CrossRef] [Scilit]

Disclaimer/Publisher’s Note: The statements, opinions and data contained in all publications are solely those of the individual author(s) and contributor(s) and not of MDPI and/or the editor(s). MDPI and/or the editor(s) disclaim responsibility for any injury to people or property resulting from any ideas, methods, instructions or products referred to in the content. |
© 2025 by the authors. Licensee MDPI, Basel, Switzerland. This article is an open access article distributed under the terms and conditions of the Creative Commons Attribution (CC BY) license.