


Abstract
The increasing global production of plastic (P) waste presents a critical environmental challenge, while the construction industry’s demand for sustainable materials continues to grow. The building industry’s reliance on natural aggregates, a contributor to environmental degradation, requires sustainable alternatives. Utilizing plastic waste as a partial aggregate substitute in concrete offers dual advantages: preserving limited resources and redirecting waste from landfills. This research uses advanced machine learning (ML) to forecast the mechanical properties of P waste concrete. Random Forest (RF) and eXtreme Gradient Boosting (XGBoost) models with particle swarm optimization (PSO) were developed to predict compressive and tensile strengths of P waste concrete. A comprehensive dataset comprising 196 datapoints for compressive strength (CS) and 100 datapoints for tensile strength (TS) of P waste concrete was collected from the literature. The input parameters encompassed the plastic (P), cement (C), water-to-cement ratio (W/C), coarse aggregate (CA), fine aggregate (FA), and curing age (Age), while the outputs were CS and TS of P waste concrete. The constructed models were assessed utilizing various statistical metrics. The findings indicate that coefficient of determination of both XGBoost (CS, R2 = 0.9911, and TS, R2 = 0.9947) and RF (CS, R2 = 0.9757, and TS, R2 = 0.9737) models performed well, with XGBoost indicating better performance with fewer prediction errors. SHAP analysis emphasizes the substantial effect of P waste on concrete strength properties followed by C and Age. Furthermore, GUIs for predicting TS and CS of concrete containing P waste utilizing both RF and XGBoost models were developed. Overall, this study not only achieves superior accuracy through hybrid PSO-ML models but also contributes to sustainable construction materials and computational material science, offering a data-driven framework for optimizing mix designs that incorporate plastic waste, which can accelerate its adoption in eco-friendly engineering applications.
1. Introduction
The widespread utilization of plastics has intensified into a significant environmental issue, propelled by a considerable global rise in plastic use and a concomitant increase in plastic trash formation. The enduring presence of plastics, exacerbated by their toxic composition, results in the contamination of terrestrial, marine, and atmospheric environments. This non-biodegradable garbage can impede municipal drainage, fostering environments for infectious diseases and heightening flood hazards, while its integration into soil reduces water infiltration and undermines fertility [1,2]. Moreover, aquatic pollution from plastic waste significantly affects marine ecosystems, since the ingestion of plastic debris and the ensuing bioaccumulation of plastic pieces and chemicals in the digestive tracts and tissues of species have been recorded [3].
Confronting the widespread problem of plastic waste needs new recycling strategies that might convert this environmental burden into a lucrative asset, especially in sectors with significant material usage. Simultaneously, the construction industry confronts its own sustainability challenges. Cement manufacturing is a primary contributor to world carbon dioxide (CO2) emissions, representing roughly 5% of global anthropogenic CO2 emissions [4], and playing a substantial role in climate change. The extraction of natural aggregates for concrete incurs substantial environmental costs, including groundwater depletion and considerable land degradation, with land loss due to extraction of natural aggregates reportedly rising from 47.14% to 112.9% between 2013 and 2017 [5]. Decreasing the demand for natural aggregates in concrete applications is warranted by both economic and environmental advantages, including the alleviation of aggregate quarry overexploitation, subsequent energy consumption, and associated greenhouse gas emissions [6]. The concurrent difficulties highlight the pressing necessity for sustainable recycling of P waste and the exploration of alternative materials for concrete production [7,8]. Recent research has investigated the use of P waste as a replacement for aggregates. The replacement of sand with irradiated plastic waste or PET bottles can either enhance strength or sustain performance at specific replacement ratios [9,10]. Life cycle assessments confirm the environmental advantages of incorporating recycled P waste into concrete, demonstrating reductions in global warming potential, human toxicity, and overall carbon emissions compared to conventional mixtures [11]. This method fosters a circular economy by enhancing waste value, decreasing transportation expenses for raw materials, and minimizing energy usage in cement manufacturing [12]. Since P waste is a relatively new concrete component, establishing appropriate designs and attributes typically necessitates lengthy and expensive experimentation. Thus, machine learning (ML) has become an effective tool for predicting material characteristics and optimizing formulations for mechanical performance. Methods including artificial neural networks (ANN), K-nearest neighbor (KNN), extreme gradient boosting (XGB), support vector machines (SVM), random forest (RF), adaptive neuro-fuzzy inference systems (ANFIS), multilayer perceptron neuron networks (MLPNNs), and gene expression programming (GEP) have been effectively utilized to forecast diverse concrete properties [13,14,15,16,17]. Alyousef et al. [13] used GEP, ANFIS, and ANN to predict the CS of steel-fiber-reinforced concrete at elevated temperatures using a dataset of 307 data points. Sun et al. [14] used KNN and ANN to predict the CS of concrete incorporating carbon nanotubes. Huang et al. [18] modeled the bond strength based on 166 data points utilizing SVM, RF, and XGB. Karim et al. [19] used ANN and XGB based on 138 data points to develop prediction models for the compressive strength of mixtures incorporating supplementary materials like rice husk ash and fly ash.
Several studies have initiated the utilization of machine learning to P waste in concrete, predicting the mechanical properties of concrete using models such as MLPNN, SVM, MLPNN, SVM, RF, Fuzzy Logic (FL), and decision tree (DT). Asif et al. [20] used MLPNN, SVM, RF, and DT to predict the CS and flexural strength (FS) of plastic concrete based on 357 and 125 data points and included eight input variables: C, CA, FA, P, silica fume, water, superplasticizer, and age. Shiuly et al. [5] used GA, ANFIS, ANN, and FL for predicting the density, workability, and CS of plastic aggregate-based concrete. They concluded that ANFIS model yields the highest R2 of 0.98 for predicting the concrete properties. A prevalent drawback of these traditional machine learning techniques is their “black-box” characteristic, which frequently does not yield transparent predictive equations. They may also be susceptible to overfitting and require significant computational resources. On the other hand, evolutionary algorithms like Genetic Programming (GP) and its more advanced versions, such as MEP, offer a strong alternative. These techniques produce clear, streamlined prediction equations, increase interpretability, mitigate overfitting hazards, and exhibit enhanced memory efficiency [21,22].
This study utilized hybrid PSO-ML Framework (RF and XGBoost models with PSO algorithm) to assess and predict the tensile strength and compressive strength of concrete comprising plastic waste, aiming to overcome the constraints of traditional machine learning and harness the advantages of evolutionary computation. A detailed dataset comprising 196 data points for CS and 100 data points for TS of concrete produced using plastic waste was collected from the literature for model building and successfully optimized using meticulous hyperparameter optimization utilizing PSO. The used features were plastic content, cement content, w/c, coarse aggregate content, fine aggregate content, and curing age. The evaluation of model performance was conducted using various statistical metrics. A 5-fold cross-validation was used to assess the generalizability of the developed ML models. A comprehensive SHAP analysis for both compressive and tensile strength predictions from both the PSO-XGBoost and PSO-RF models was performed to determine significant input factors. This dual-target, dual-model explainability methodology provides profound and resilient insights into the governing factors, indicating whether identical parameters regulate both mechanical properties and how these relationships are consistently represented by various, finely calibrated model designs. A comparison between the performance of the proposed models and previous models was made. A user-friendly graphical user interface (GUI) was ultimately created in Python to offer an efficient alternative to conventional experimental approaches. This research substantially enhances the sustainable and cost-effective application of plastic waste in construction materials.
2. Materials and Methods
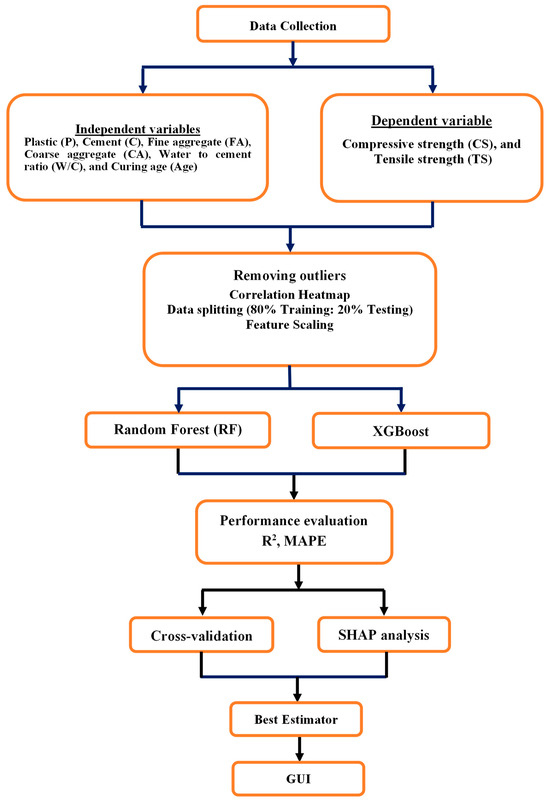
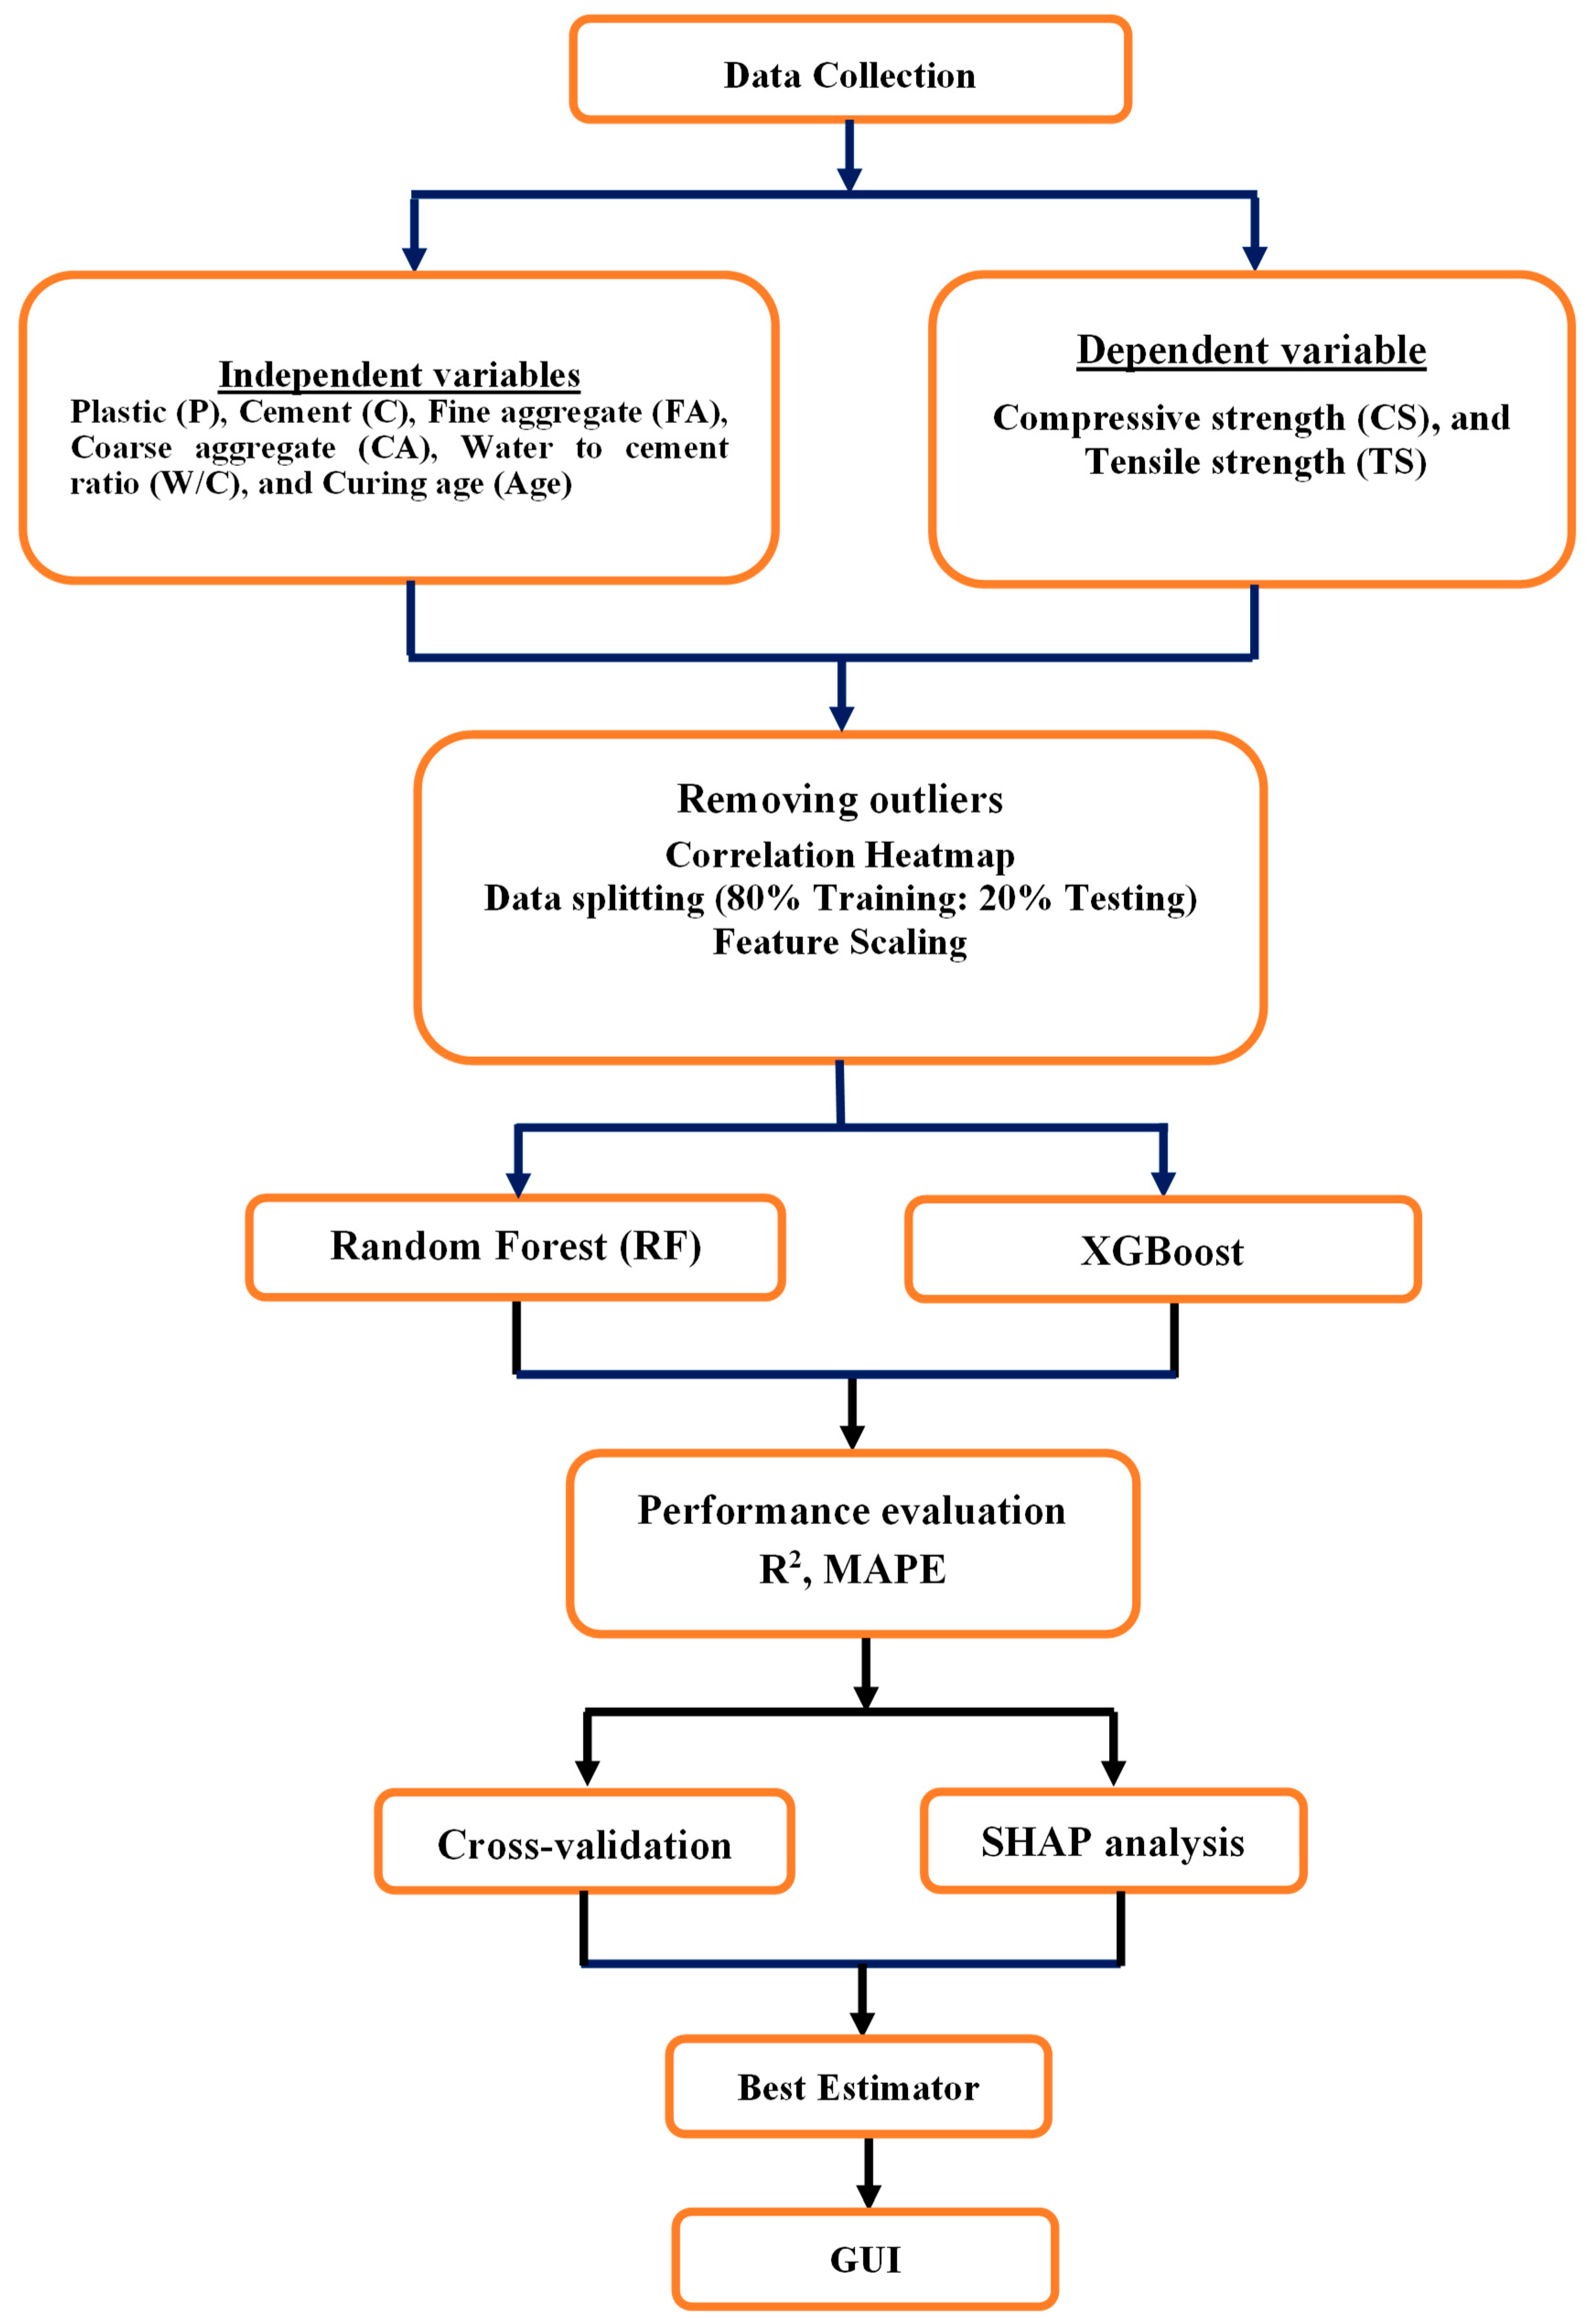
The study process, as depicted in Figure 1, is organized as an extensive machine learning pipeline aimed at predicting the mechanical properties of a composite material, presumably concrete. The procedure commences with Data Collection, wherein the independent variables—Plastic (P), Cement (C), Water-to-Cement Ratio (W/C), Coarse Aggregate (CA), Fine Aggregate (FA), and Curing Age (Age)—are recognized as input features, while Compressive Strength (CS) and Tensile Strength (TS) are classified as dependent variables or target outputs. Subsequent to data collection, data processing is performed, encompassing an investigation of the correlation between independent and dependent variables to elucidate initial feature associations and guide model selection. The dataset is subsequently divided using data splitting into 80%:20% for training/testing sets. Two unique machine learning algorithms are utilized for model training: the Random Forest (RF), an ensemble algorithm that enhances predictive accuracy through many decision trees, and extreme gradient boosting (XGBoost), a sophisticated and effective application of the gradient boosting framework, noted for its outstanding predictive performance and computing speed. The two proposed model hyperparameters were optimized utilizing particle swarm optimization (PSO). Python (version 3.12) [23], which is based on Anaconda, was utilized for developing the proposed prediction models.
Figure 1.
Research methodology flowchart.
The efficacy of these models is meticulously evaluated during Performance Evaluation utilizing essential statistical metrics, specifically the determination coefficient (R2) to examine the proportion of variance elucidated. A SHAP (SHapley Additive exPlanations) analysis is performed to elucidate the model outputs, assess the importance of each input characteristic to the predictions, and offer insights into the fundamental physical principles. The Best Estimator is chosen due to its exceptional performance across evaluation metrics, resulting in a validated, interpretable, and high-performing predictive model for the material’s strength attributes.
2.1. Collection of Data
This work systematically compiled a database of 196 data points for compressive strength (CS) and 100 data points for tensile strength (TS) of concrete produced using plastic waste from literature [24,25,26,27,28,29,30,31,32,33,34,35,36]. Only data records containing comprehensive information crucial for analyzing compressive strength (CS) and tensile strength (TS) were included. In the established database, standard-sized cylindrical samples (150 mm × 300 mm) were uniformly employed for both compressive strength and tensile strength tests to guarantee consistency of results. The chosen input variables comprise plastic (P), cement (C), water-to-cement ratio (W/C), coarse aggregate (CA), fine aggregate (FA), and age (Age).
The statistical summary of the compressive strength dataset, as presented in Table 1, indicates a heterogeneous and broadly distributed array of concrete combinations. The compressive strength (CS), the primary output variable, ranges from a minimum of 1.77 MPa to a maximum of 58.14 MPa, with a mean of 27.01 MPa and a standard deviation of 11.66 MPa, reflecting considerable heterogeneity in the performance of the tested materials. The near-zero skewness and kurtosis values for CS indicate a distribution that is largely symmetric and mesokurtic, closely resembling a normal distribution. The input variables exhibit significant variability in their compositions: The plastic (P) content varies from 0 to a maximum of 609 kg/m3, with a positive skew that suggests a predominance of combinations with lower plastic concentrations. The cement (C) content exhibits little variability, with a mean of 404.82 kg/m3. The aggregates, fine aggregate (FA) and coarse aggregate (CA), exhibit negative skewness, with CA demonstrating a particularly pronounced degree, indicating that numerous combinations contained aggregate quantities close to the upper limits of their respective ranges. The Water–Cement ratio (W/C) is strictly regulated with a minimal standard deviation, whereas curing age (Age) exhibits positive skewness, indicating that most samples were evaluated at younger ages, accompanied by a prolonged tail of samples cured for extended durations. Kurtosis and skewness levels within the ranges of ±3 and ±10 are typically deemed acceptable [13]. This summary verifies that the dataset includes a wide experimental range, appropriate for simulating the intricate impacts of these components on compressive strength.
Table 1.
Summary of statistics for the CS dataset.
Table 2 illustrates an overview of the tensile strength (TS) dataset, detailing the characteristics of a meticulously structured experimental program. The target variable, Tensile Strength (TS), spans from a minimum of 0.44 MPa to a maximum of 4.63 MPa, with a mean of 2.41 MPa and a standard deviation of 0.79, signifying considerable variability around the mean. The near-zero skewness (0.167) and slightly negative kurtosis (−0.495) for TS indicate a relatively symmetric and platykurtic distribution, closely resembling a normal distribution. The constituent materials exhibit considerable variability: The plastic (P) content varies from 0 to 436.2 kg/m3, with a positive skew that suggests a predominance of combinations with lower plastic content. Both Fine Aggregate (FA) and Coarse Aggregate (CA) demonstrate pronounced negative skewness (−1.330 and −1.600, respectively) and elevated positive kurtosis, indicating that the majority of combinations are concentrated toward the maximum observed values for these components, leading to leptokurtic distributions. The Water–Cement ratio (W/C) exhibits moderate variability; however, the Curing Age (Age) is negatively skewed, indicating that most samples were evaluated at durations nearer to the 28-day maximum. This overview verifies the dataset’s appropriateness for examining the intricate, multifaceted factors affecting the tensile strength of concrete.
Table 2.
Summary statistics of the TS dataset.
2.2. Processing of Data
2.2.1. Outlier Removal
Outliers in CS and TS datasets can be detected using a statistical analysis by calculating the Interquartile Range (IQR) as indicated in Equation (1) and determining data points that are above (Q3 + 1.5IQR) or below (Q1 − 1.5IQR).
The outliers in the dataset are the CS values that are either below the lower bound or over the upper bound. The research identifies nine high-value outliers, all pertaining to 28-day compressive strength data. The outliers in the dataset are the TS values that are either below the lower bound or over the upper bound. Given that tensile strength cannot be negative, we need only to evaluate the upper limit. The research identifies two statistical anomalies: one high-value outlier and one low-value outlier. These two points denote the maximum and minimum performance thresholds for tensile strength under the evaluated conditions.
2.2.2. Correlation Coefficients
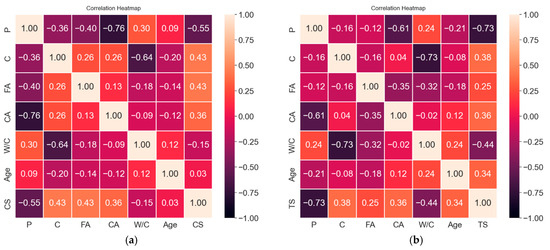
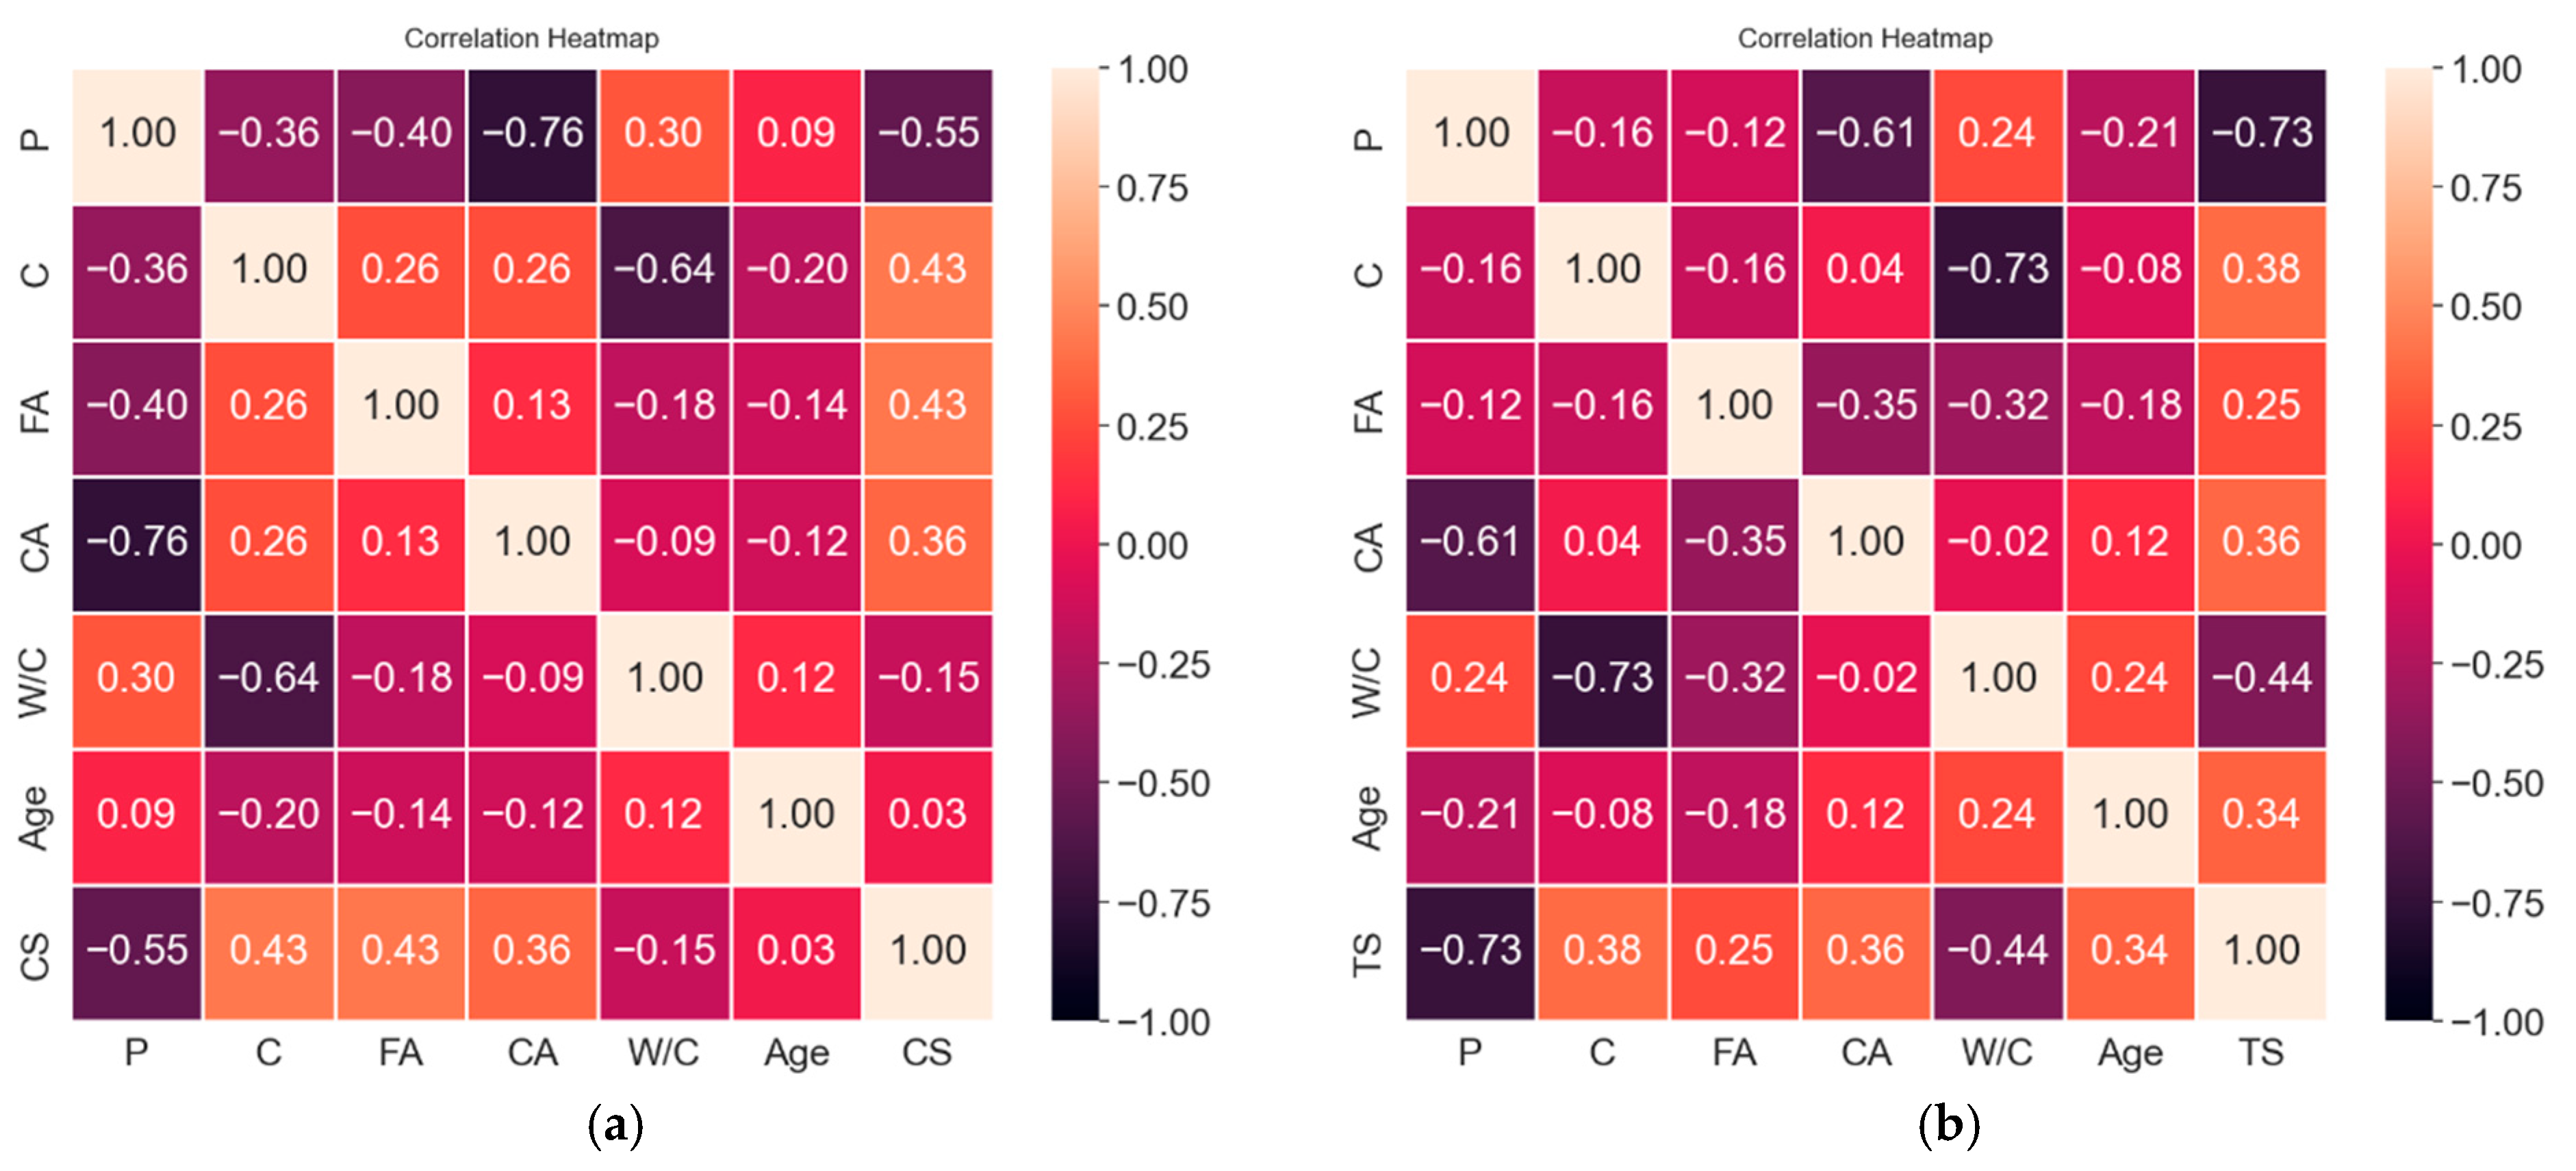
The correlation heatmap presented in Figure 2a reveals numerous significant correlations between the material attributes and the resultant CS of the concrete. Compressive strength exhibits a moderate negative association with the Water/Cement ratio (W/C) of −0.15, signifying that an increased water content relative to cement substantially diminishes strength. In contrast, CS exhibits a moderate positive connection with Cement (C) at 0.43 and a positive correlation with fine aggregate (FA) at 0.43. The Curing Age (Age) exhibits a minor positive connection with CS (0.03), whereas Plastic (P) demonstrates a substantial negative correlation (−0.55). Cement exhibits a moderate positive connection with Compressive Strength (0.43). The heatmap indicates that plastic content is the primary factor adversely affecting compressive strength, whereas cement content, together with fine aggregate and curing age to a lesser degree, positively influences it.
Figure 2.
Pearson correlation coefficient (R) heatmap. (a) Compressive strength (CS); (b) Tensile strength (TS).
The correlation heatmap in Figure 2b indicates that the tensile strength (TS) of the material is significantly affected by several parameters, with Plastic (P) content exhibiting the most substantial negative correlation (−0.73). This signifies that increased plastic content markedly diminishes tensile strength. The Water/Cement ratio (W/C) exhibits a modest negative connection with TS (−0.44), indicating that increased water content diminishes the material’s strength. Conversely, Coarse Aggregate (CA) exhibits a moderate positive correlation (0.36) with tensile strength (TS), indicating its beneficial impact on tensile strength. The curing age exhibits a weak positive correlation (0.34), suggesting that extended curing durations somewhat enhance strength. Within the constituent materials, there exists a moderate positive connection between fine aggregate (FA) and TS, quantified at 0.25. The results indicate that plastic content is the primary factor adversely affecting tensile strength, whereas coarse aggregate and curing age yield advantageous, but less significant, benefits.
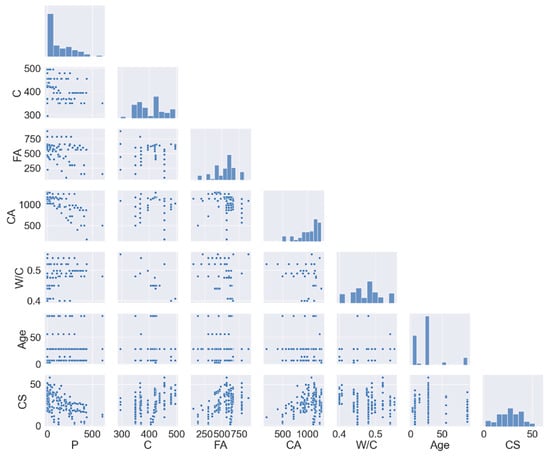
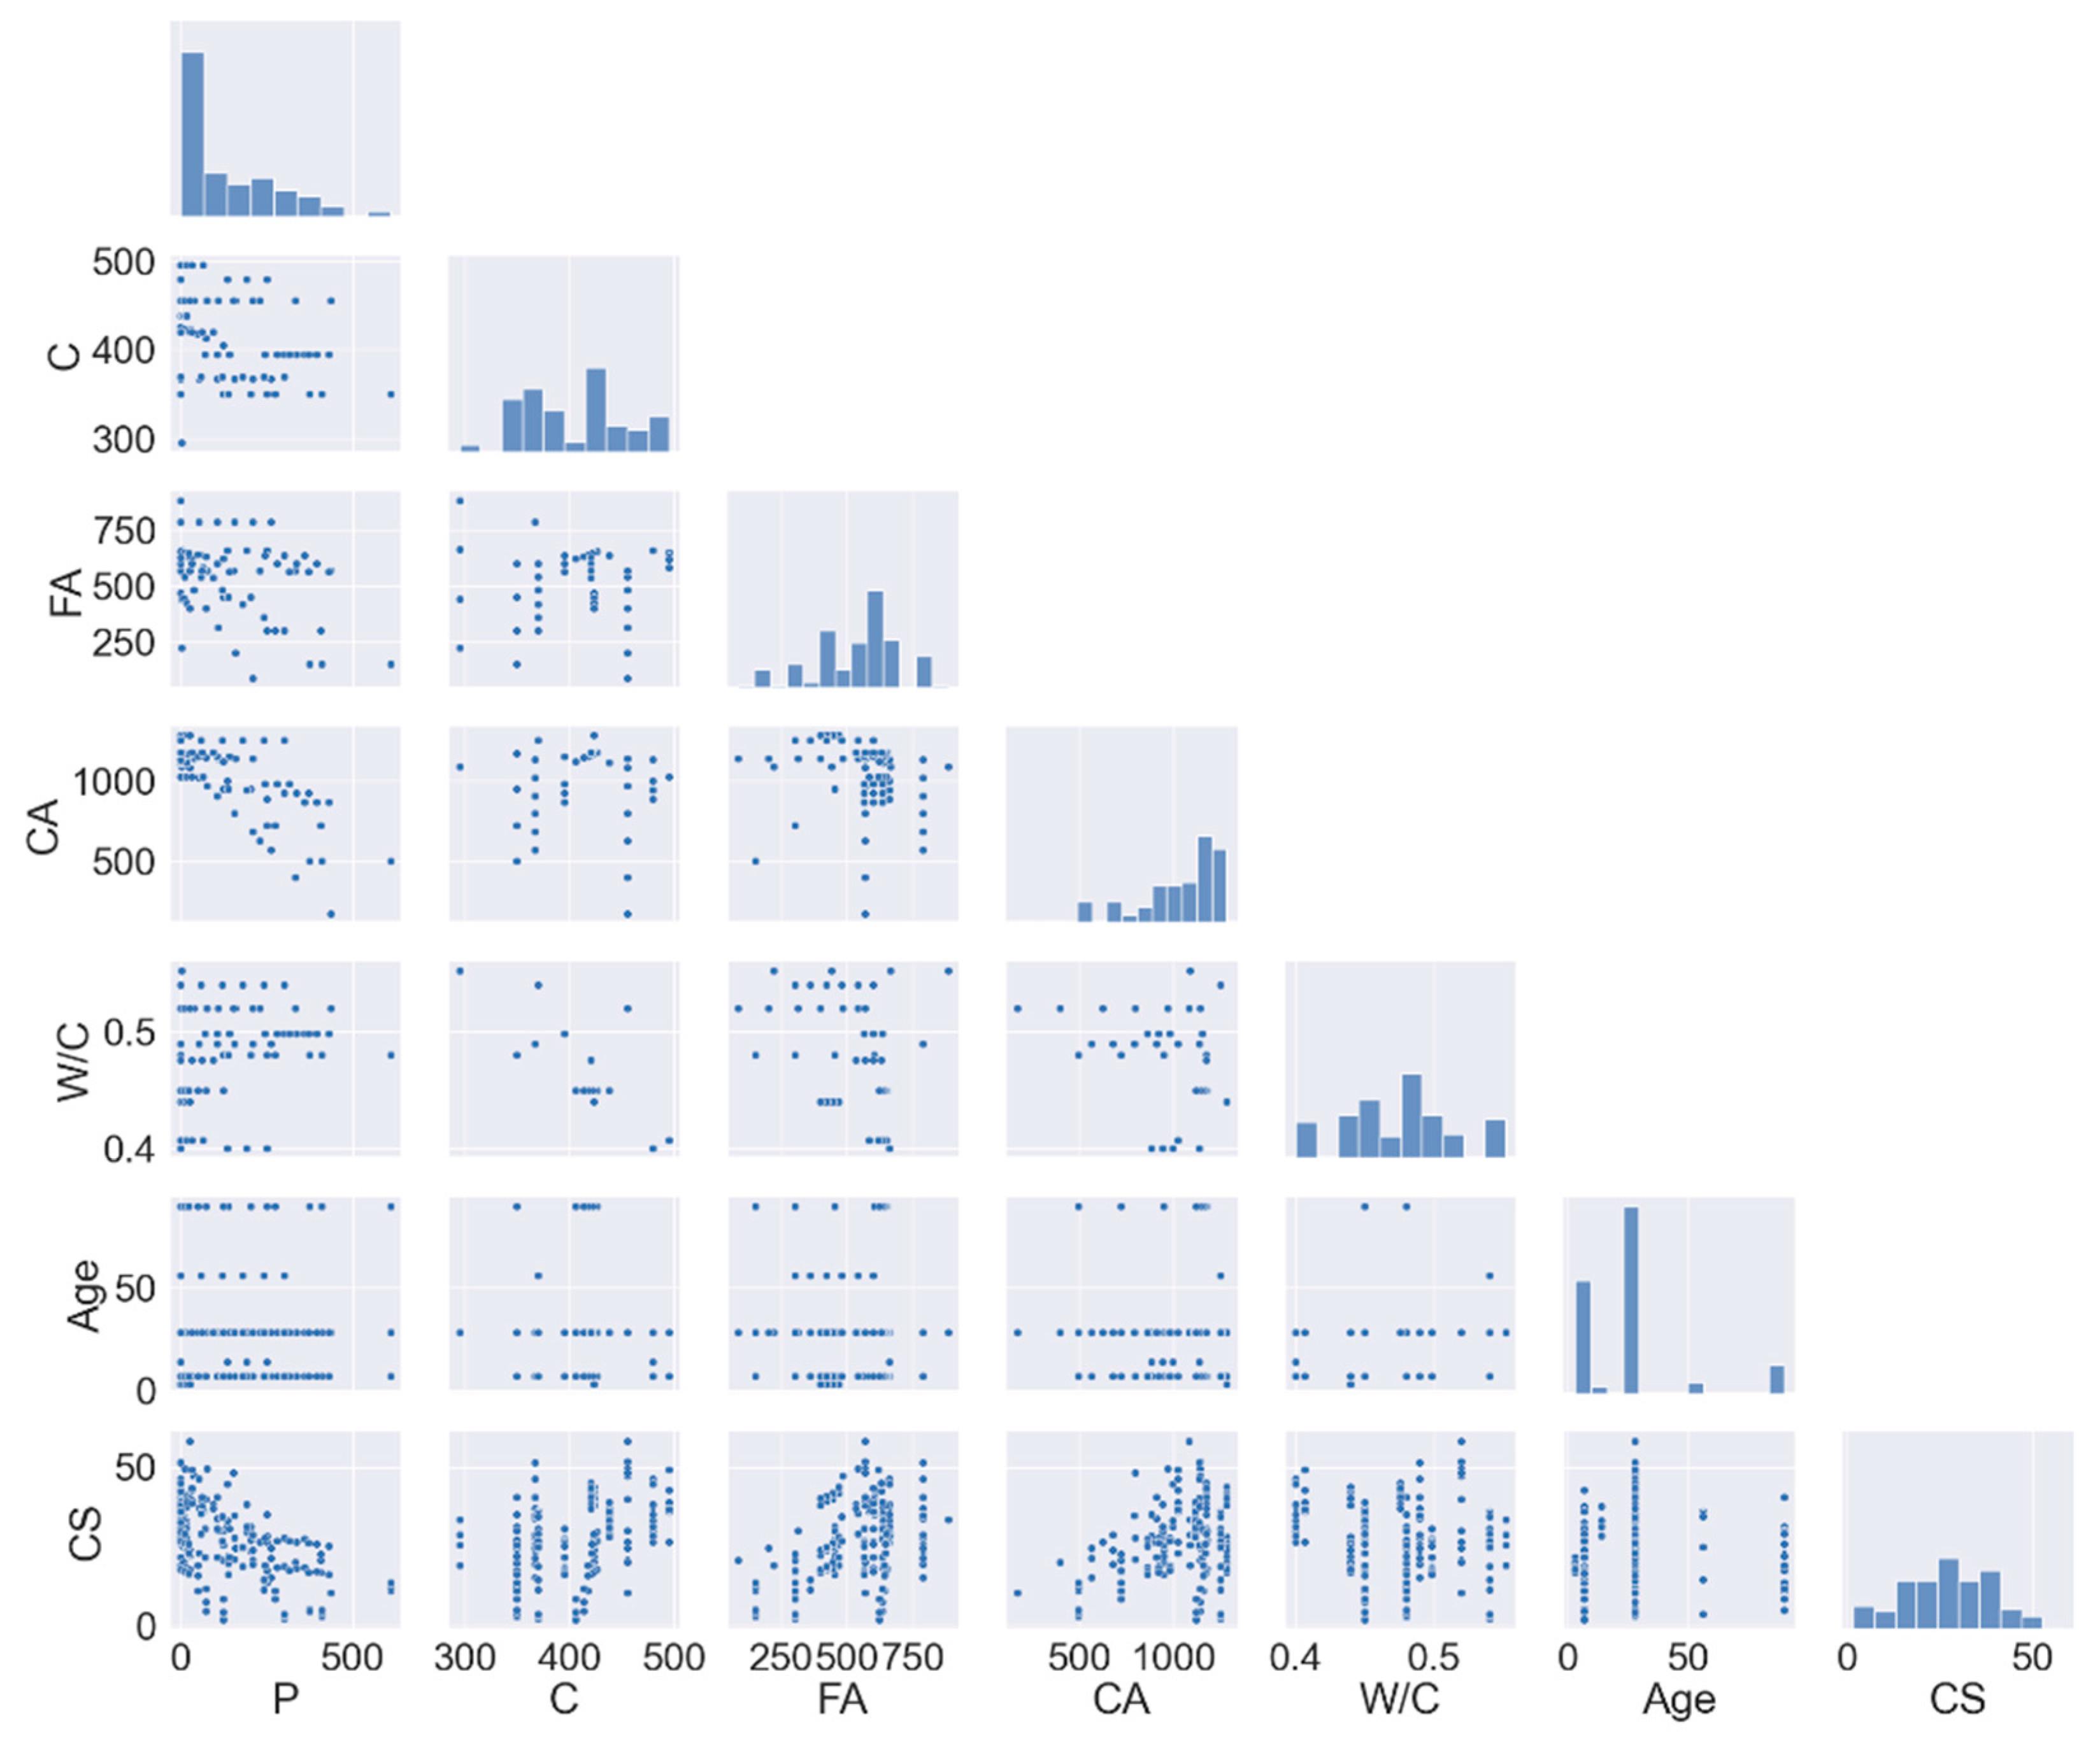
Comprehensive pairwise plots in Figure 3 illustrating the relationships among the constituents of the concrete mixture—Plastic (P), Cement (C), Water–Cement Ratio (W/C), Coarse Aggregate (CA), Fine Aggregate (FA), Curing Age (Age), and Compressive Strength (CS)—reveal several significant and interrelated trends that characterize the material’s mechanical performance. The predominant visual pattern reveals a robust inverse correlation between the W/C and CS; as the W/C value escalates, there is a distinct and consistent reduction in compressive strength, underscoring that an excess of water results in a more porous and diminished microstructure, a fundamental principle in concrete technology. Simultaneously, Curing Age (Age) exhibits a strong positive association with CS, as seen by data trends indicating that strength values consistently rise with extended curing periods, highlighting the enduring advantages of hydration over time for the formation of a dense and resilient cementitious matrix. The inclusion of plastic (P) significantly undermines compressive strength, as scatter plots indicate a consistent inverse relationship between plastic content and compressive strength values. This phenomenon is likely attributed to plastic particles disrupting the uniformity of the cement paste and forming weaker interfacial zones that serve as failure points under stress.
Figure 3.
Pairwise plots for CS.
The influence of Cement (C) content is intricate; although a general positive correlation with compressive strength (CS) is implied, the relationship may not be strictly linear, suggesting an optimal dosage beyond which advantages may level off or decline, potentially due to workability issues or heat of hydration in the specific mix designs analyzed. The relationships among the aggregates (FA and CA) and other components are intricate. Their individual plots versus CS may not exhibit exceptionally significant direct correlations in isolation; rather, their essential role in establishing a robust skeletal framework is suggested. The overall strength seems to be significantly reliant on the proportional equilibrium among these aggregates, the cement paste, and the water content. An optimum, well-graded aggregate matrix minimizes voids and improves packing density, which synergistically interacts with a low W/C ratio and adequate cement to maximize strength. Moreover, the pairwise plots probably indicate substantial interaction effects; for example, the detrimental influence of a high water-to-cement ratio or elevated plastic content may be partly mitigated in mixtures with extended curing duration or an appropriate cement-to-aggregate ratio. The scatter plots collectively demonstrate that optimizing compressive strength is a complex challenge. An emphasis on reducing the water–cement ratio and restricting plastic content is essential, along with the judicious application of adequate cement, a well-balanced aggregate mixture, and prolonged curing to produce a dense, cohesive, and high-strength composite material.
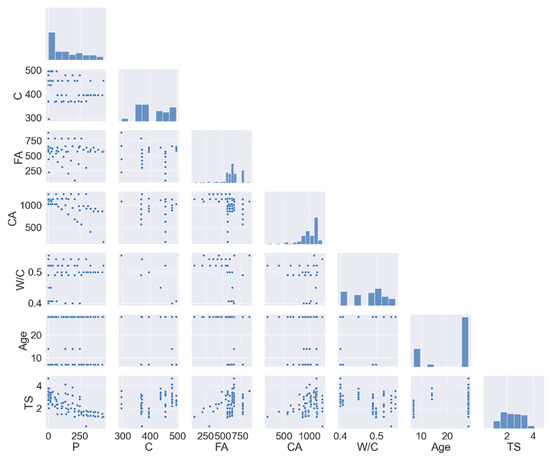
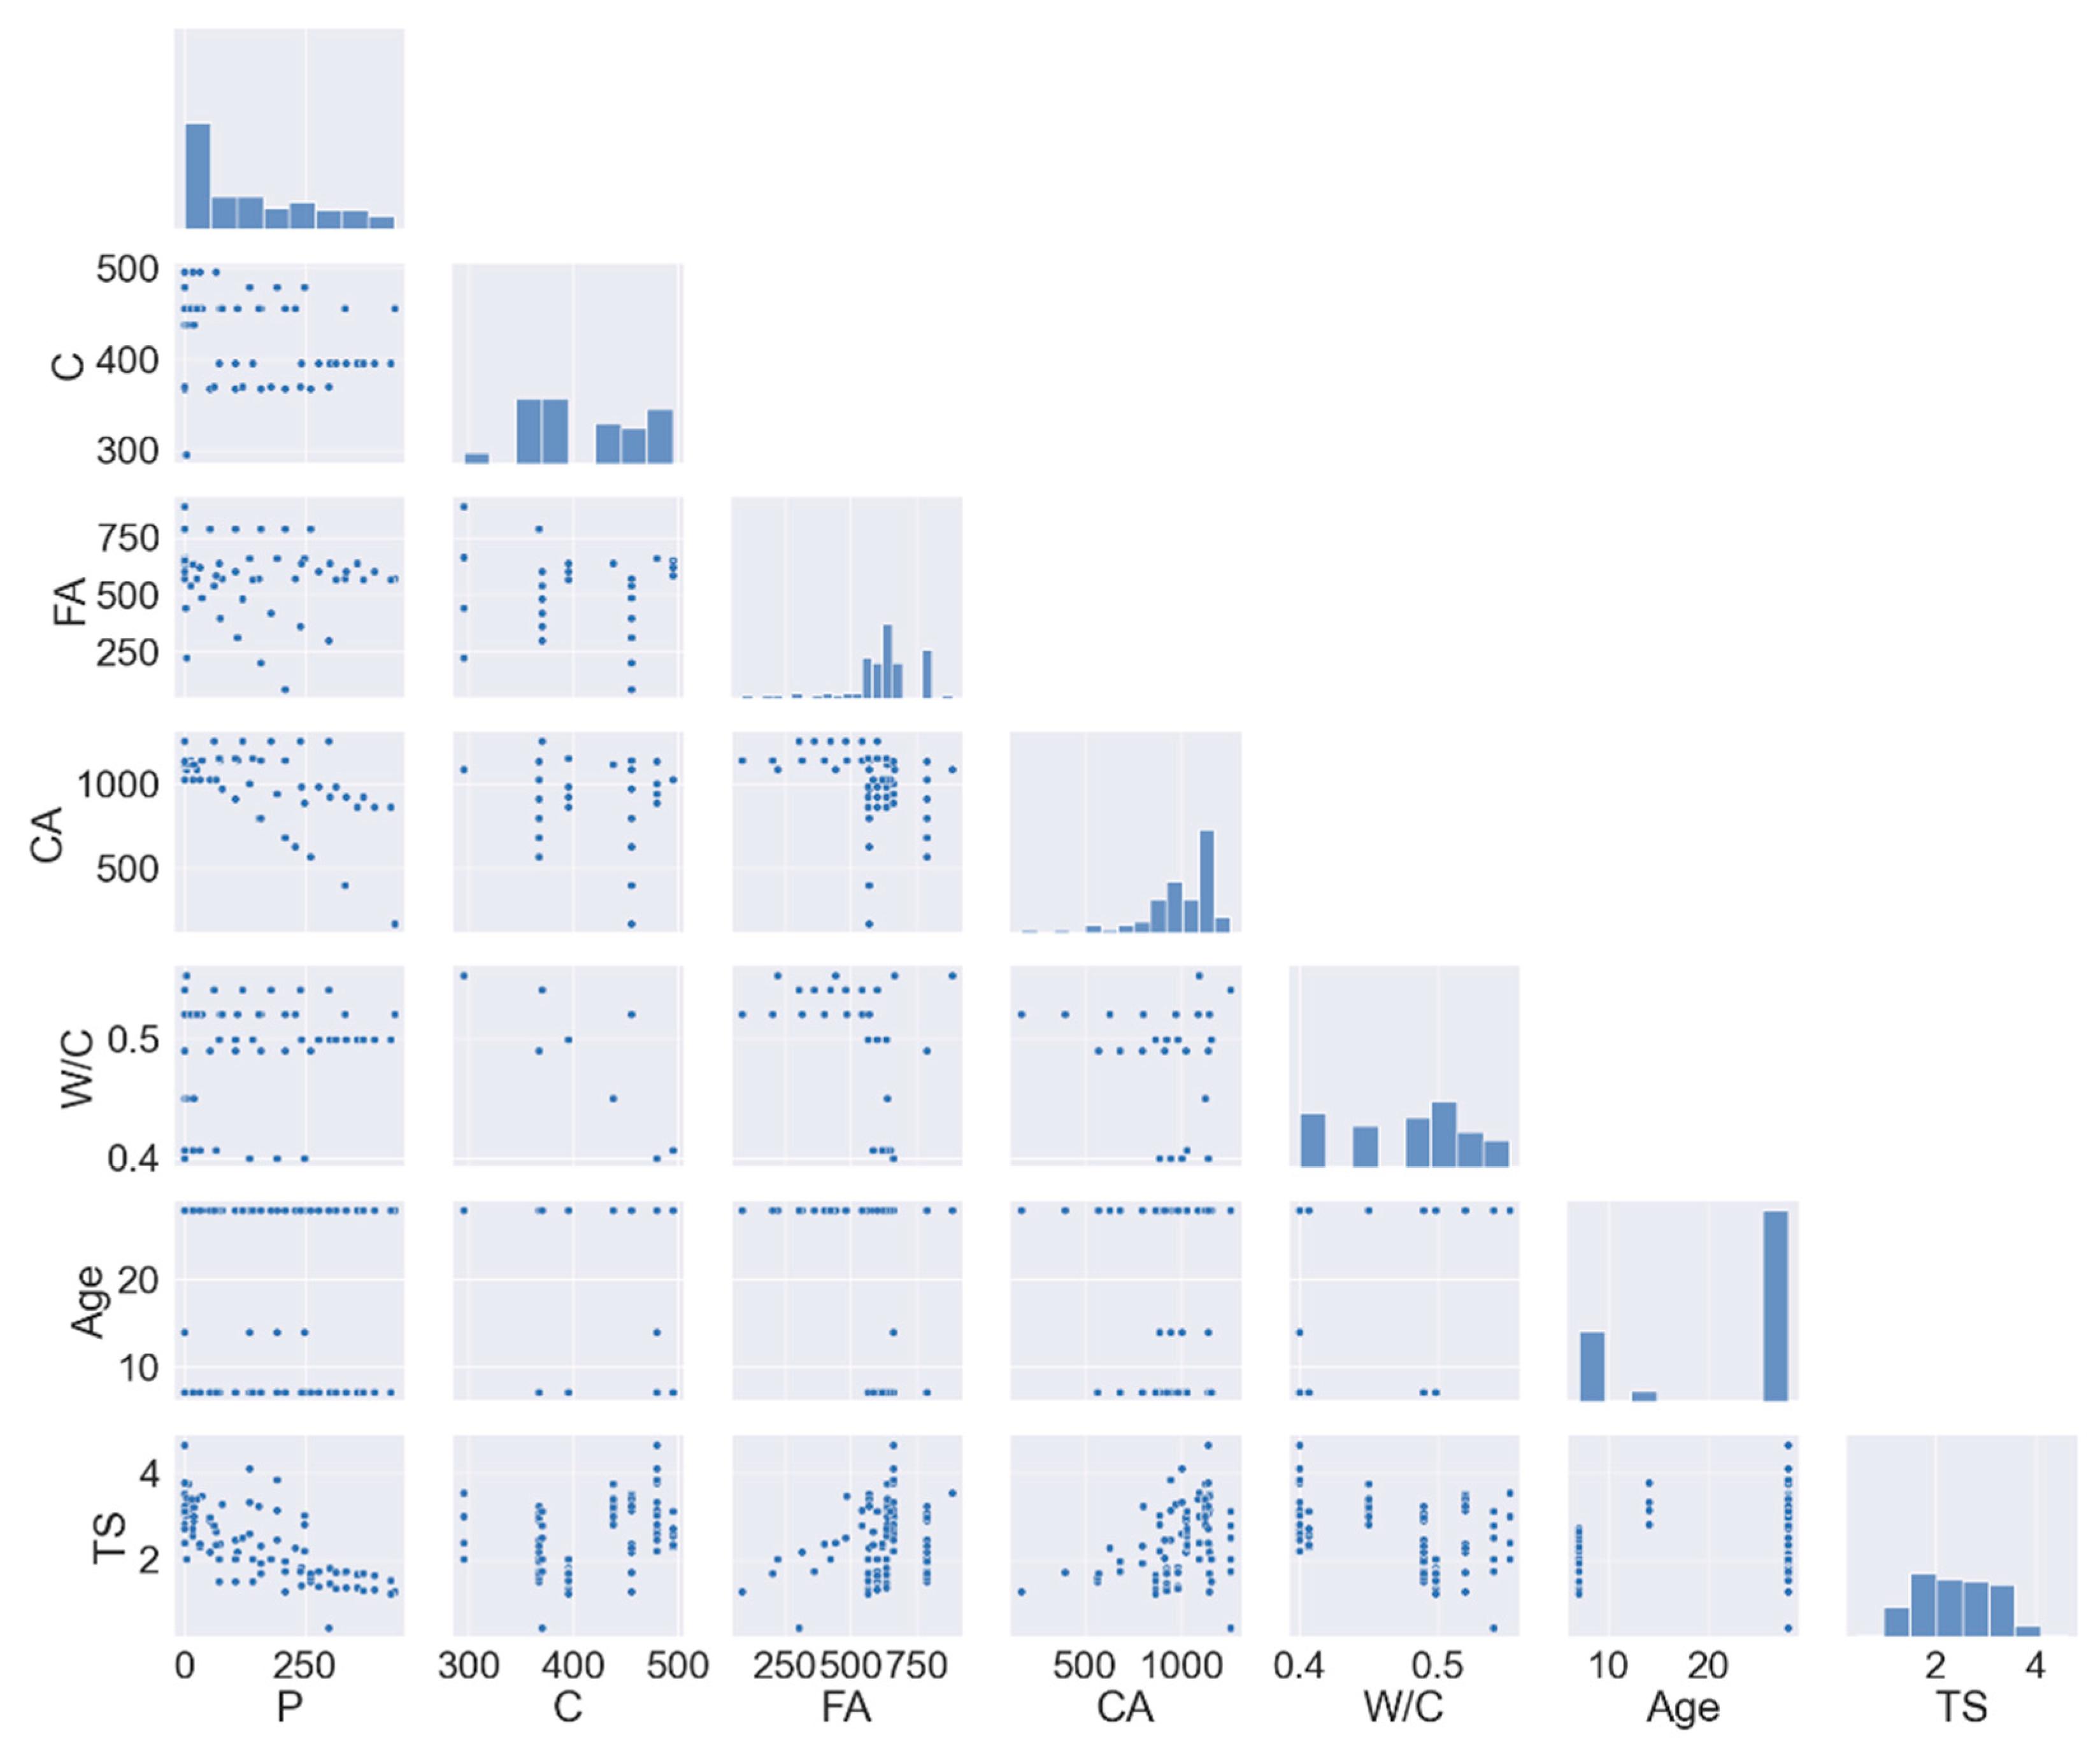
The pairwise graphs in Figure 4 for the concrete mixture containing plastic illustrate a complicated interplay of parameters between the constituent materials and the resultant tensile strength (TS). A significant negative correlation exists between plastic (P) content and tensile strength (TS), with data points exhibiting higher plastic content consistently located in areas of reduced tensile strength, indicating that the presence of plastic typically undermines the material’s tensile integrity. The adverse effect is likely intensified by interactions with the water–cement ratio (W/C), which exhibits a clear inverse correlation with tensile strength (TS); mixtures with a higher W/C ratio exhibit markedly diminished tensile strength, highlighting the essential significance of low water content for a resilient matrix. Conversely, Curing Age (Age) demonstrates a positive, albeit potentially non-linear, connection with TS, suggesting that the material continues to accrue tensile strength over time as the hydration process advances. The impact of Cement (C) is crucial, although it seems to have an appropriate range; beyond this range, its beneficial effect on strength may reduce or even lead to adverse outcomes, potentially due to factors such as excessive heat generation or shrinkage. The aggregates, both FA and CA, exhibit more intricate interactions. Their influence on TS is interconnected and significantly reliant on their proportional relationship with the cement paste and the overall gradation; an inadequate balance is likely to result in vulnerabilities within the interfacial transition zone. The plots indicate substantial interaction effects, wherein the detrimental influence of a high water-to-cement ratio or elevated plastic content may be substantially alleviated by an extended curing duration or an appropriate cement-to-aggregate ratio. In summary, attaining elevated tensile strength in this plastic-modified concrete necessitates a careful equilibrium, chiefly reliant on reducing plastic content and water–cement ratio, while guaranteeing adequate curing duration and an optimized ratio of cement and aggregates to form a cohesive and resilient composite structure.
Figure 4.
Pairwise plots for TS.
Furthermore, the existence of multicollinearity might negatively affect model performance [37,38]. Correlation matrices were established to measure the extent of correlation among input variables, hence improving the reliability and accuracy of the prediction models. Table 3 shows the variance inflation factor (VIF) for the input variables and outputs employed in this study. The VIF results in Table 3 demonstrate a lack of significant multicollinearity across the predictor variables for both CS and TS models. In the CS data, all VIF values are far below the conventional criterion of 5, with Plastic (P) exhibiting the highest value of 3.349, indicating a moderate yet acceptable degree of correlation with other features. In the TS data, the W/C has the greatest VIF of 4.181, although it is below the crucial threshold, suggesting that multicollinearity does not pose a serious risk to the stability of the regression model’s coefficient estimations. Consequently, all characteristics can be dependably preserved for subsequent examination in forecasting both compressive and tensile strength.
Table 3.
Variance inflation factor.
2.2.3. Data Splitting
After removing outliers, the dataset is subsequently randomly divided into 80% for training the models and 20% for testing the models.
2.2.4. Feature Scaling
Feature scaling via the minimum–maximum approach, sometimes referred to as Min–Max normalizing, is a method that rescales numerical data to a predetermined range, normally between 0 and 1. Equation (2) is used for the normalization process.
2.3. Machine Learning Techniques
2.3.1. Random Forest (RF) Algorithm
The RF approach is an ensemble learning technique recognized for its predictive reliability. The core idea entails the simultaneous development of several decision trees during the training phase. In regression tasks, like the one in this study, the final model output is acquired by averaging all the individual trees’ predictions, as indicated by Equation (3):
A fundamental method supporting RF is bagging, or bootstrap aggregating, which trains each tree on a distinct random subset of the data. This strategy is essential for improving the model’s generalization capacity and reducing overfitting. This study utilized RF to predict CS and TS of concrete, including P waste as a partial aggregate replacement. The method was chosen for its ability to identify non-linear patterns and its intrinsic capability for feature importance analysis, essential for understanding the intricate relationships between concrete mix design variables and their resultant mechanical properties. To enhance prediction accuracy, hyperparameter tuning was performed, concentrating on essential factors such as the maximum depth of each tree and the number of trees in the forest.
2.3.2. XGBoost Algorithm
Extreme Gradient Boosting, generally referred to as XGBoost, is a sophisticated and effective application of the gradient boosting framework, noted for its outstanding predictive performance and computing speed. The fundamental principle that differentiates XGBoost from ensemble methods such as Random Forest is its sequential model-building process; it iteratively constructs decision trees, with each subsequent tree specifically aimed at rectifying the residual errors of the prior ensemble. Error correction is accomplished by optimizing a designated loss function by gradient descent, therefore systematically reducing prediction errors. An essential innovation enhancing its robustness is the direct integration of regularization terms into the model’s objective function, which penalizes complexity and significantly reduces the danger of overfitting, a frequent drawback in intricate machine learning models. Moreover, although XGBoost is inherently sequential, it is designed for computational efficiency via optimized data structures and facilitates parallel processing at the node level during tree formation. This research utilized XGBoost to create accurate predictive models for CS and TS of concrete. The selection was primarily driven by its proven capacity to manage small datasets with high accuracy, effectively capturing the intricate, non-linear interactions between the mix design variables and the resulting mechanical properties of the material.
2.3.3. Particle Swarm Optimization (PSO)
The Particle Swarm Optimization (PSO) algorithm, originally introduced by Eberhart and Kennedy [39], is a computational evolutionary method inspired by the collective behavior of birds foraging for food, simulating their migratory and clustering behaviors to address optimization concerns. PSO, as a manifestation of swarm intelligence, functions through a population of particles, each symbolizing a potential solution that traverses randomly across the N-dimensional search space. Each particle has a position vector and a velocity vector, which are updated iteratively. The motion of a particle is determined by its individual optimal position and the optimal position identified by the entire swarm, indicating that its search path is directed by personal experience and the collective intelligence of its peers. The iterative process of updating velocities and locations continues throughout generations, resulting in the swarm settling on an optimal solution, hence establishing PSO as an effective and widely utilized method for optimization problems across various fields.
2.4. Hyperparameter Optimization
To mitigate the issues of underfitting and overfitting, hyperparameters of both proposed models were optimized using PSO based on the training set. This method evaluated a specified search domain of critical parameters. The optimal hyperparameter configuration for each approach was identified based on the lowest RMSE, ensuring that the chosen models could generalize effectively to new data while balancing complexity and predictive accuracy (Table 4).
Table 4.
Hyperparameter optimization values.
2.5. Efficiency of the Model
The efficacy of the constructed prediction models was evaluated utilizing the statistical metrics R-squared (R2), Mean Absolute Percentage Error (MAPE), Mean Absolute Error (MAE), and Root Mean Square Error (RMSE), as illustrated in Equations (4)–(7). The coefficient of determination, R2, measures the proportion of variance in the observed data explained by the model, with values approaching 1.0 signifying a better fit. MAPE quantifies the average prediction error as a percentage, facilitating a relative and scale-independent assessment of the model’s performance, hence enhancing its intuitiveness for practical implementation. MAE quantifies the average magnitude of prediction errors in their original units, providing a clear and interpretable assessment of average accuracy. RMSE, which conveys errors in the original units, assigns greater significance to larger errors because of the squaring of the residuals. Collectively, these metrics offer a widespread evaluation of model performance, integrating measures of fit (R2) with absolute (MAE, RMSE) and relative (MAPE) indicators of predictive inaccuracy.
3. Results and Discussion
3.1. CS Models
3.1.1. Regression Analysis of RF and XGBoost Models for CS
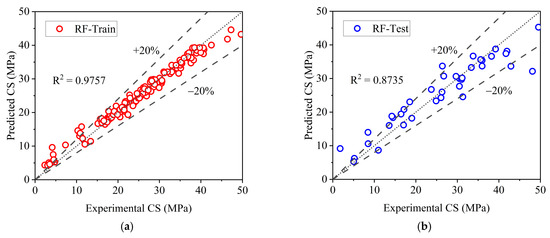
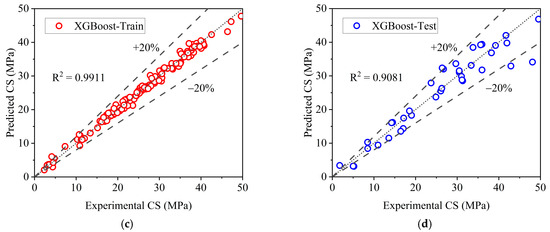
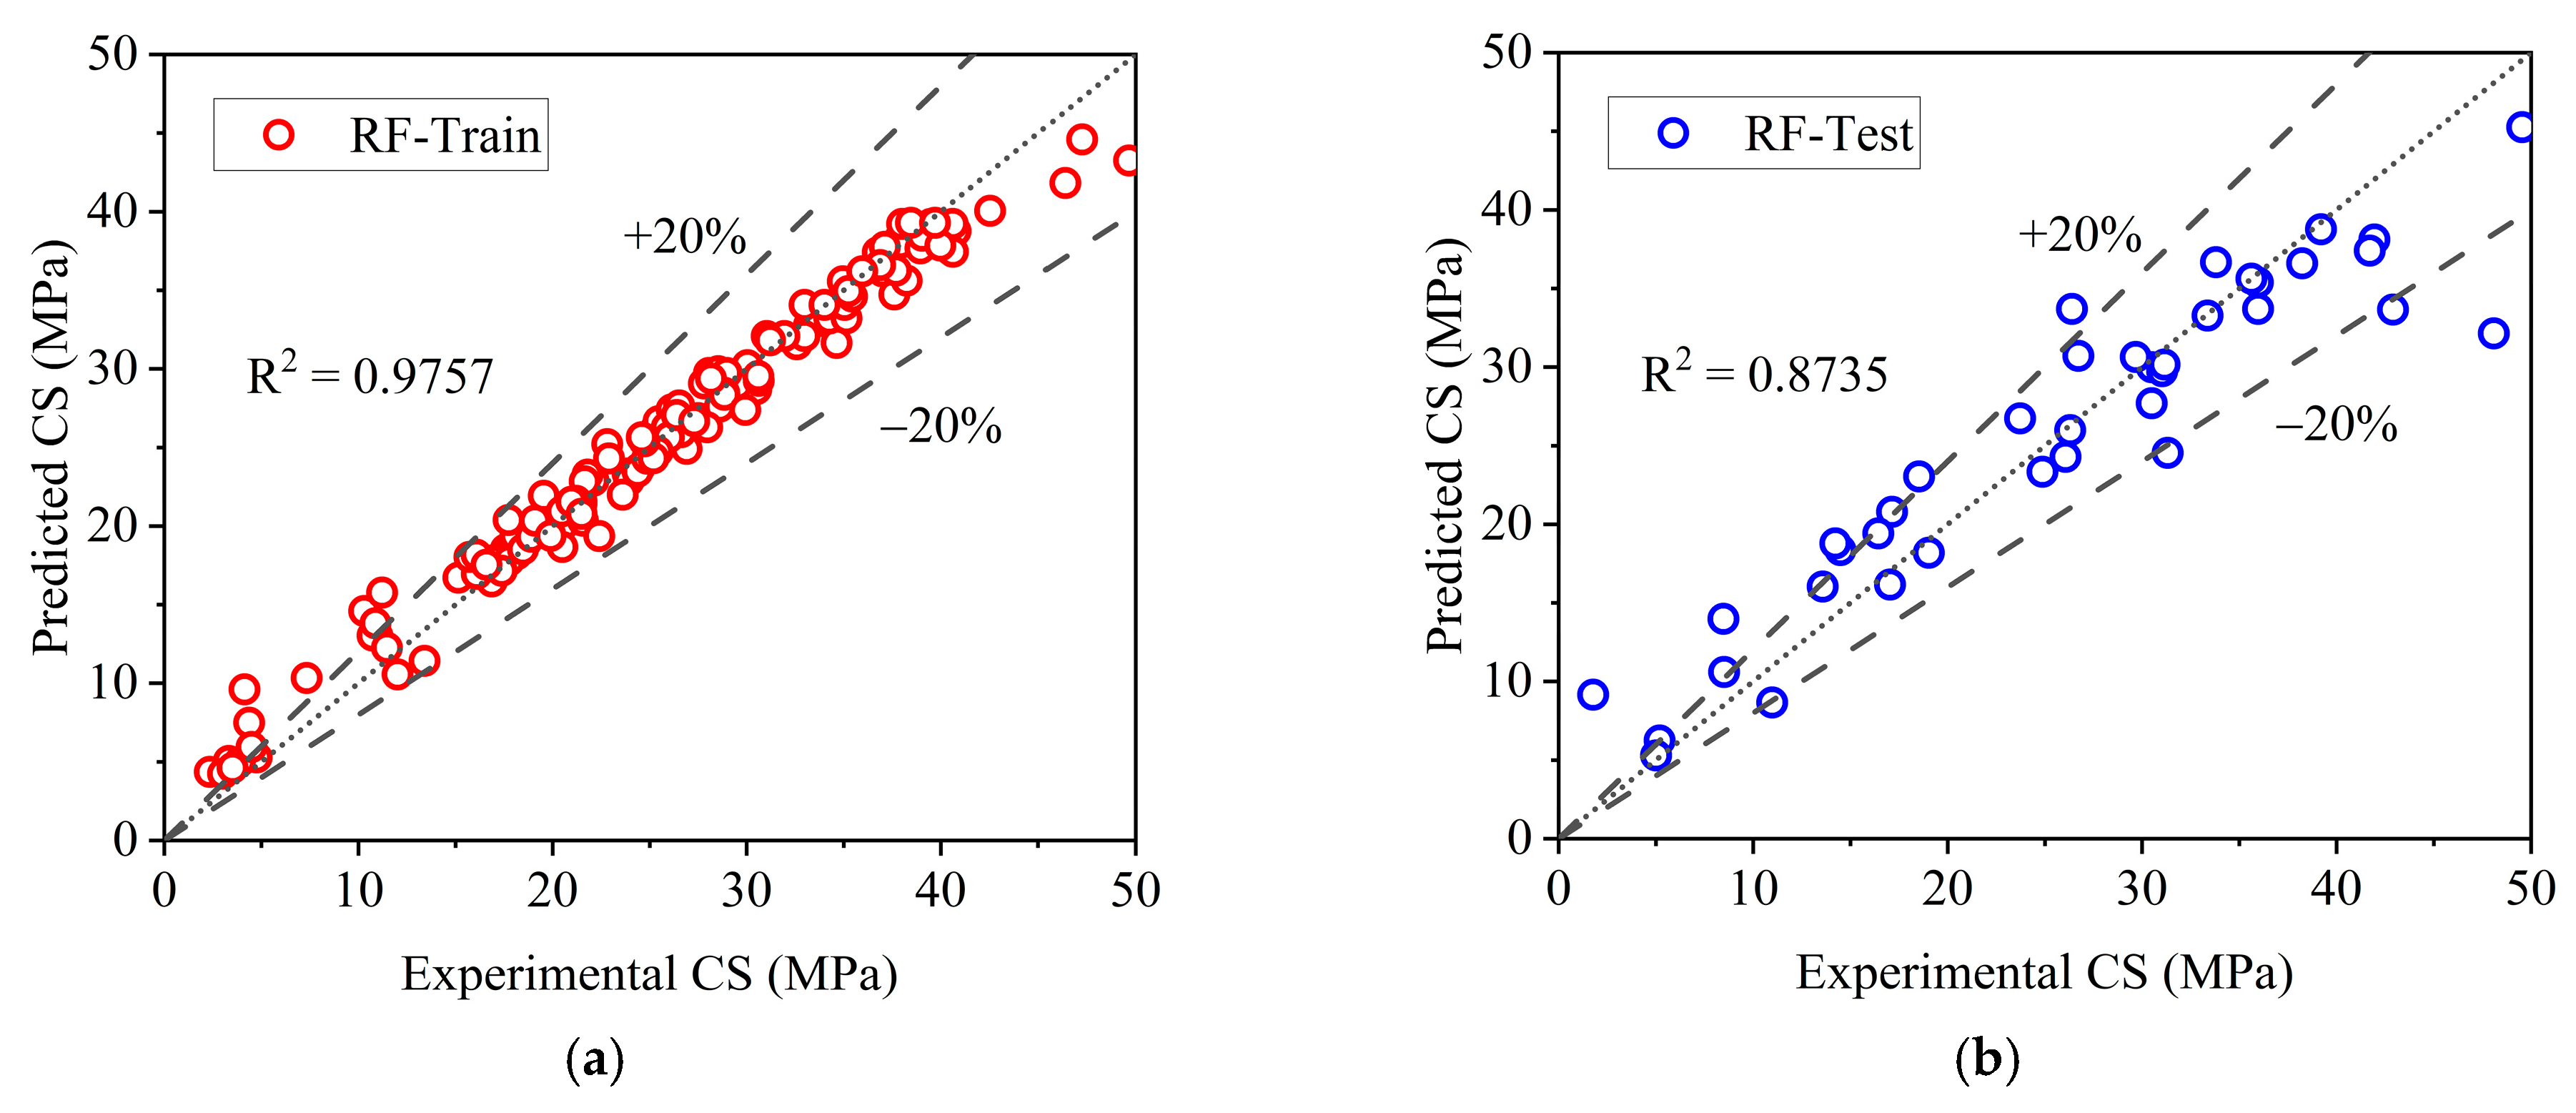
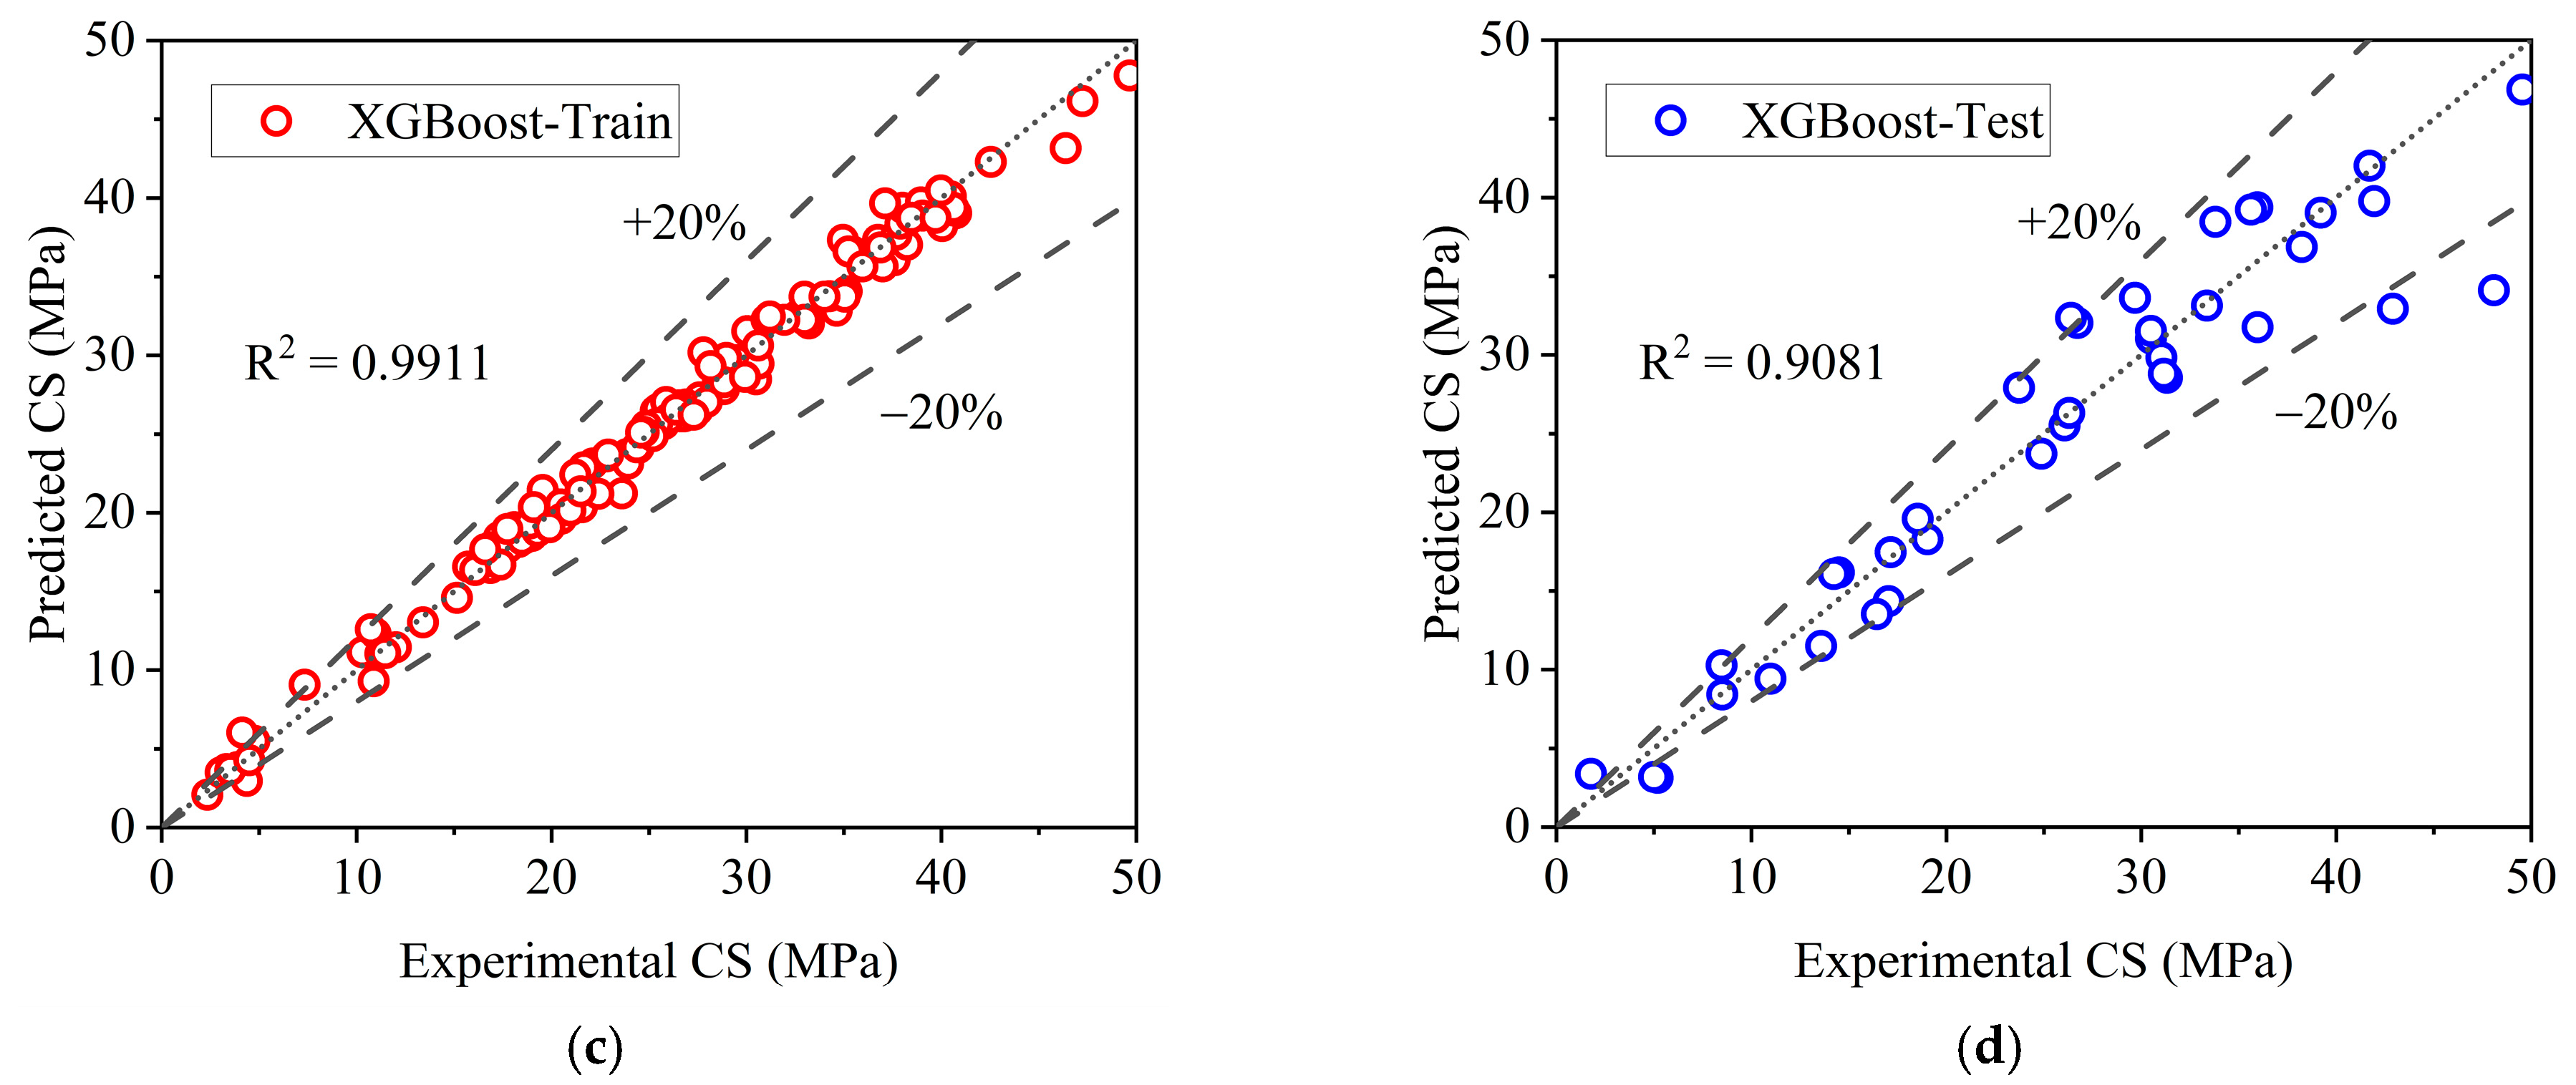
The regression plots illustrated in Figure 5 clearly demonstrate the predictive performance and generalization capability of RF and XGBoost models for CS of P waste concrete. In the RF model, Figure 5a,b demonstrates a robust correlation between predicted and experimental values for both the train and test datasets, with data points densely congregating along the line of complete concordance (Y = X). A little rise in scatter is seen in the testing dataset (Figure 5b), signifying a slight decline in predicting accuracy when applied to novel data. The XGBoost model, illustrated in Figure 5c,d, demonstrates outstanding performance. The training data (Figure 5c) exhibits a remarkably compact cluster of points along the perfect line, indicating a superior model fit. This great accuracy is almost perfectly preserved in the testing dataset (Figure 5d), where the data points consistently coincide with the ideal trend. The slight discrepancy between training and testing performance for XGBoost highlights its exceptional capacity to discern intricate, non-linear relationships in the data without overfitting, yielding a model that is both highly accurate and remarkably resilient for predicting CS of P waste concrete.
Figure 5.
Regression models for CS of P waste concrete: (a) RF-Training; (b) RF-Testing; (c) XGBoost-Training; (d) XGBoost-Testing.
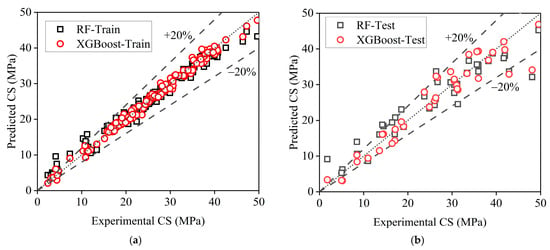
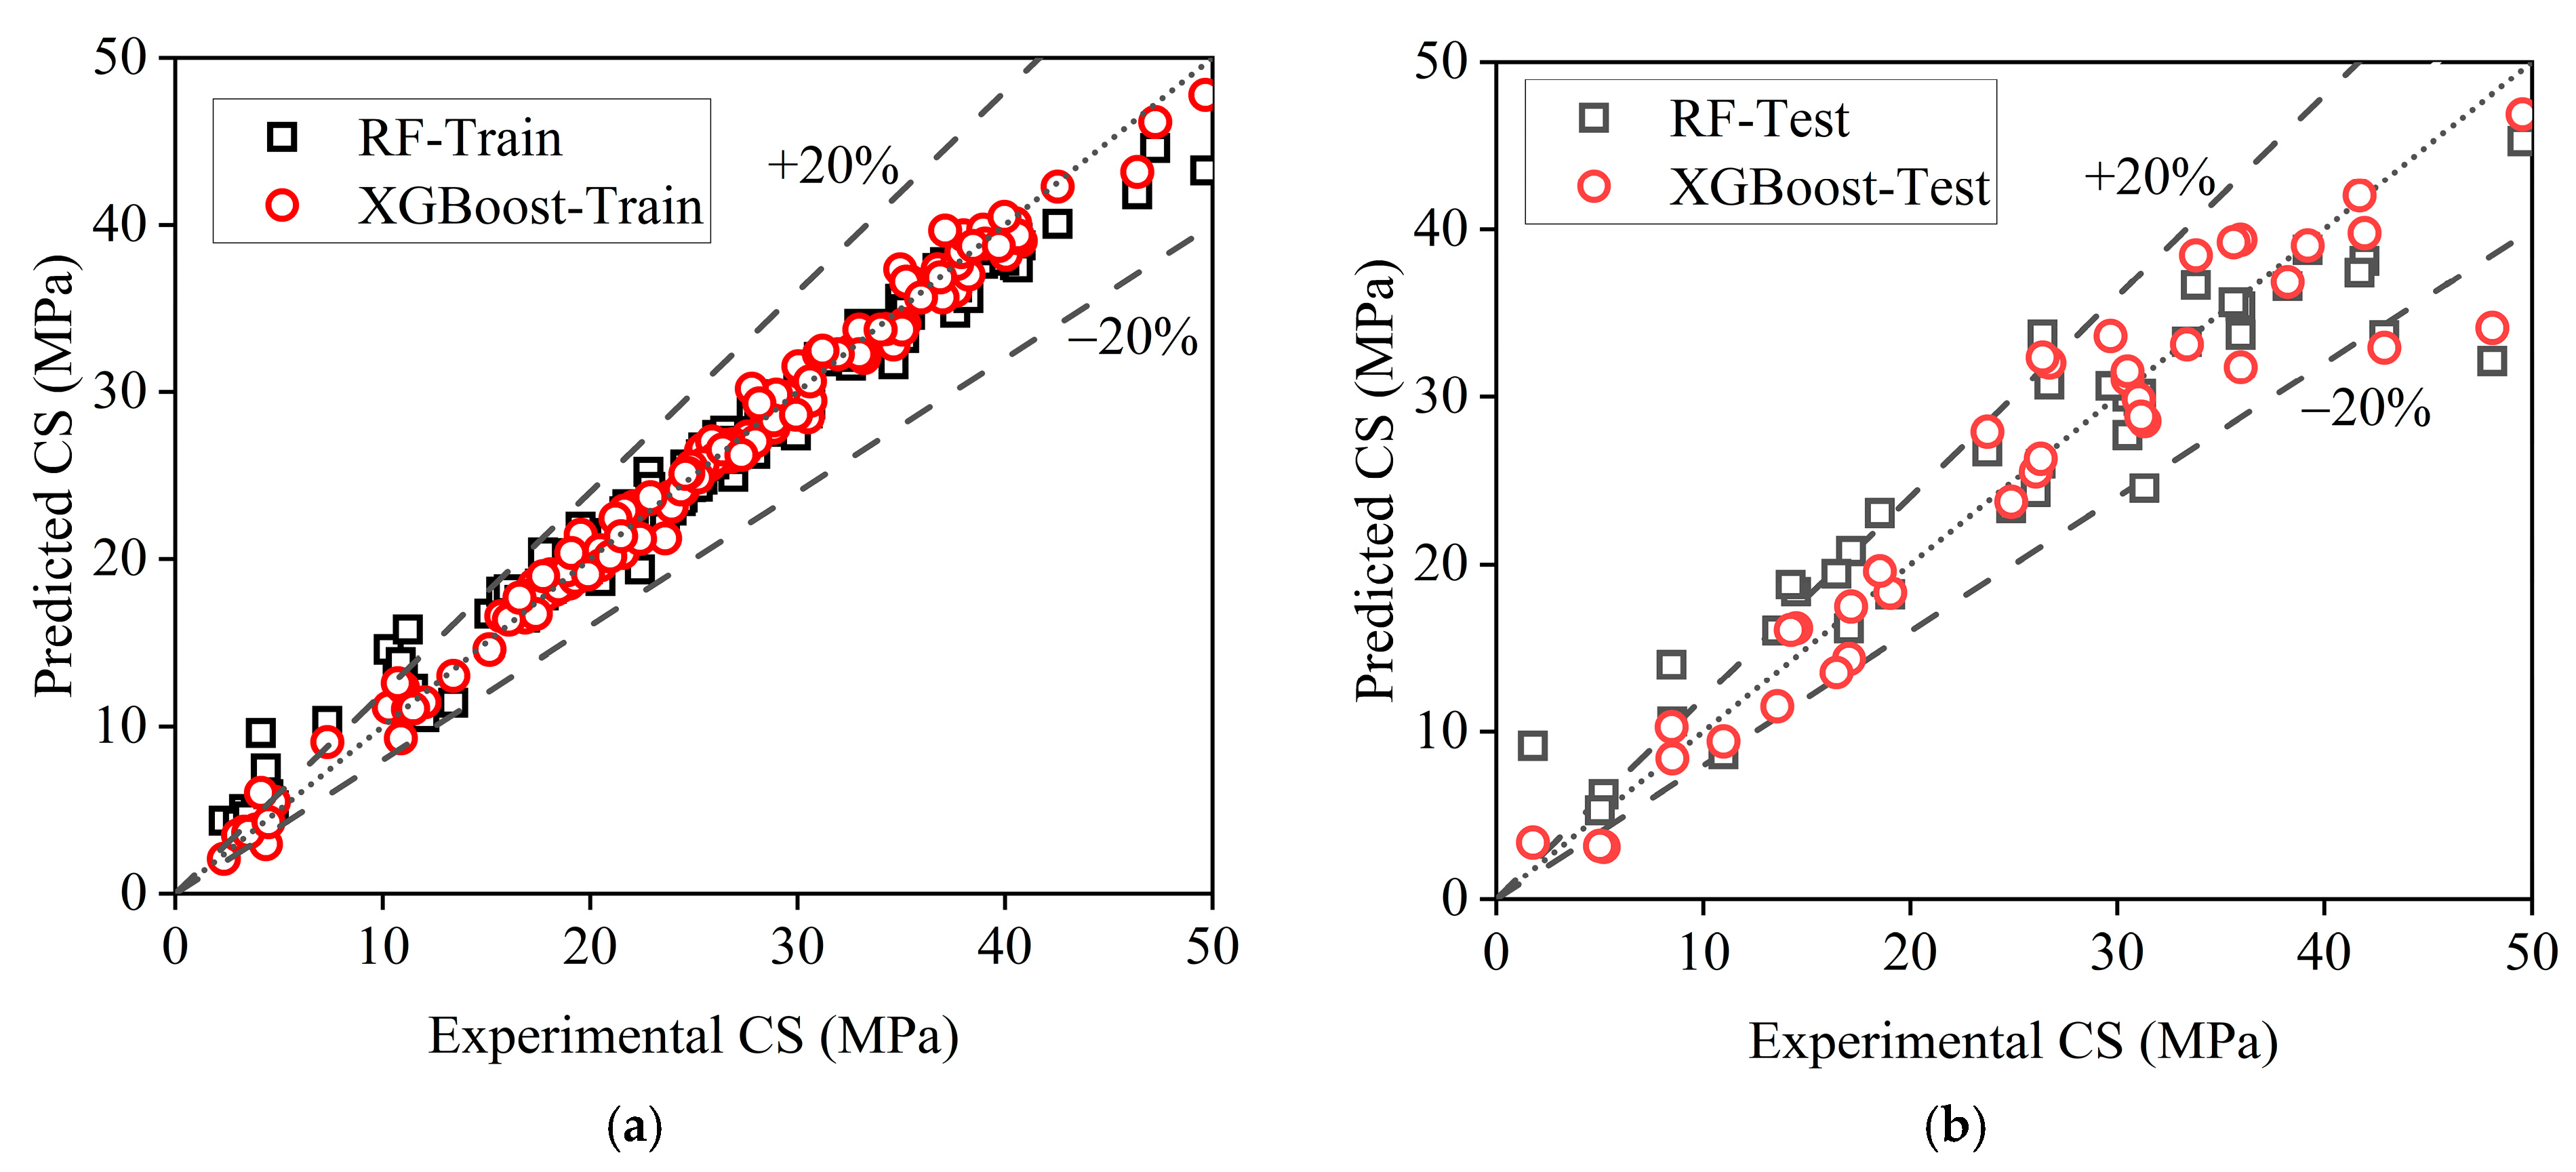
The comparative scatter plots in Figure 6 clearly demonstrate the higher predictive ability of the XGBoost model compared to RF model for CS of P waste concrete. In both the training (a) and testing (b) datasets, the data points for the XGBoost algorithm exhibit a significantly tighter and more linear clustering along the line of perfect concordance (Y = X) compared to those of the RF model. The RF model has a strong overall correlation but displays a broader scatter around the ideal line, signifying increased prediction variation and error. The visual data from these scatter plots substantially supports the quantitative measurements, confirming XGBoost as the more robust and reliable forecasting method for this application.
Figure 6.
Scatter plots for CS predictions: (a) Training; (b) Testing.
3.1.2. Performance of Developed Models for CS
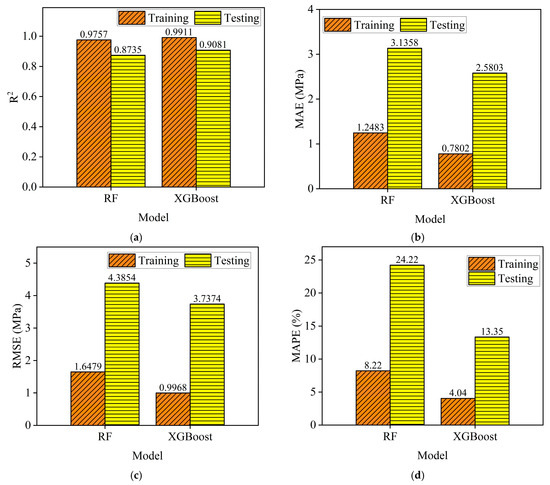
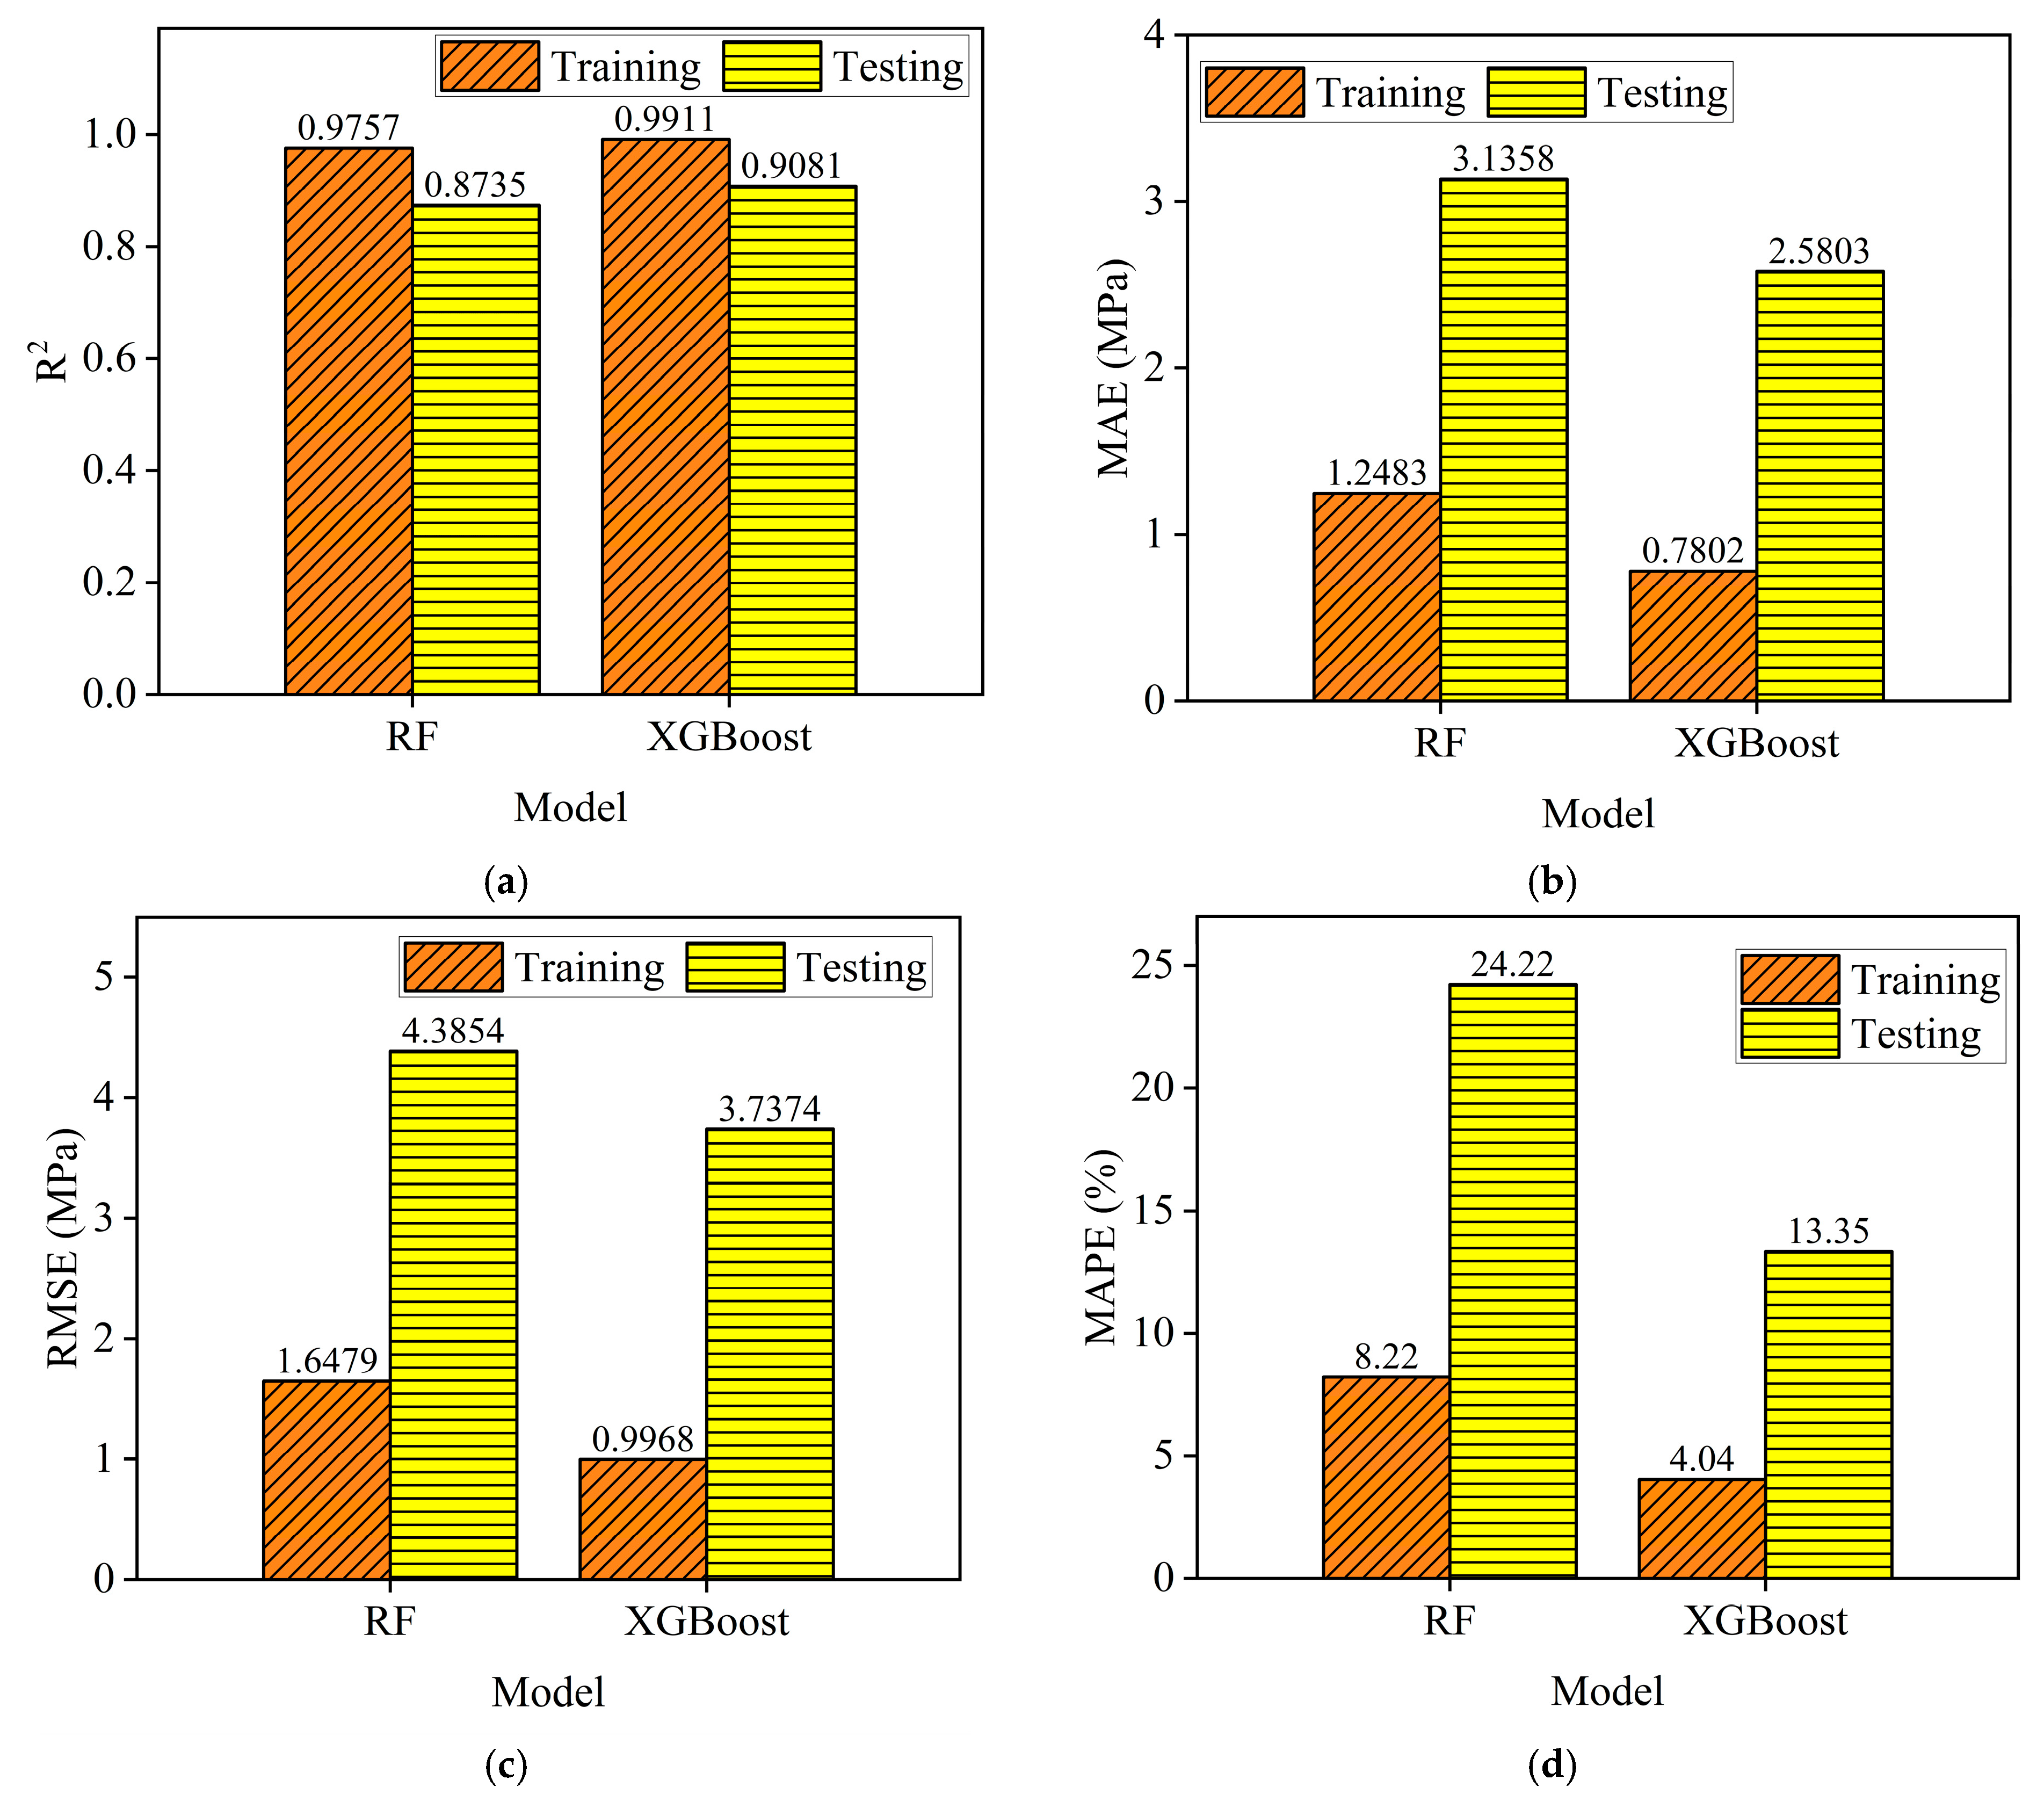
The comparative efficacy of RF and XGBoost models in predicting CS of P waste concrete was assessed utilizing essential statistical measures across both training and testing datasets, as shown in Figure 7 and Table 5. For compressive strength, both models exhibited outstanding performance on the training data, with XGBoost displaying an almost perfect match (R2 = 0.9911) in contrast to RF (R2 = 0.9757). XGBoost demonstrated improved performance, proven by significantly lower error metrics: MAE of 0.7802 MPa compared to 1.2483 MPa for RF, RMSE of 0.9968 MPa versus 1.6479 MPa, and MAPE of 4.04% compared to 8.22% for RF. The models’ generalization capacity was evaluated on the testing set. XGBoost exhibited a distinct superiority, attaining a better R2 (0.9081 compared to 0.8735) and lower MAE (2.5803 MPa versus 3.1358 MPa), RMSE (3.7374 MPa versus 4.3854 MPa), and MAPE (13.35% versus 24.22%).
Figure 7.
Statistical measures for CS models: (a) R2; (b) MAE; (c) RMSE; (d) MAPE.
Table 5.
Summary of statistical metrics for the CS model.
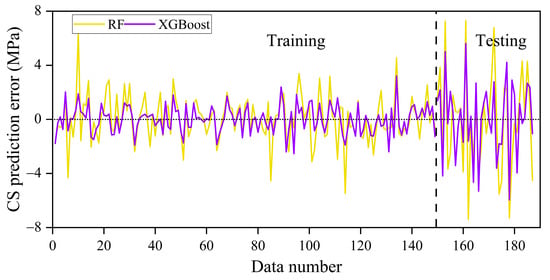
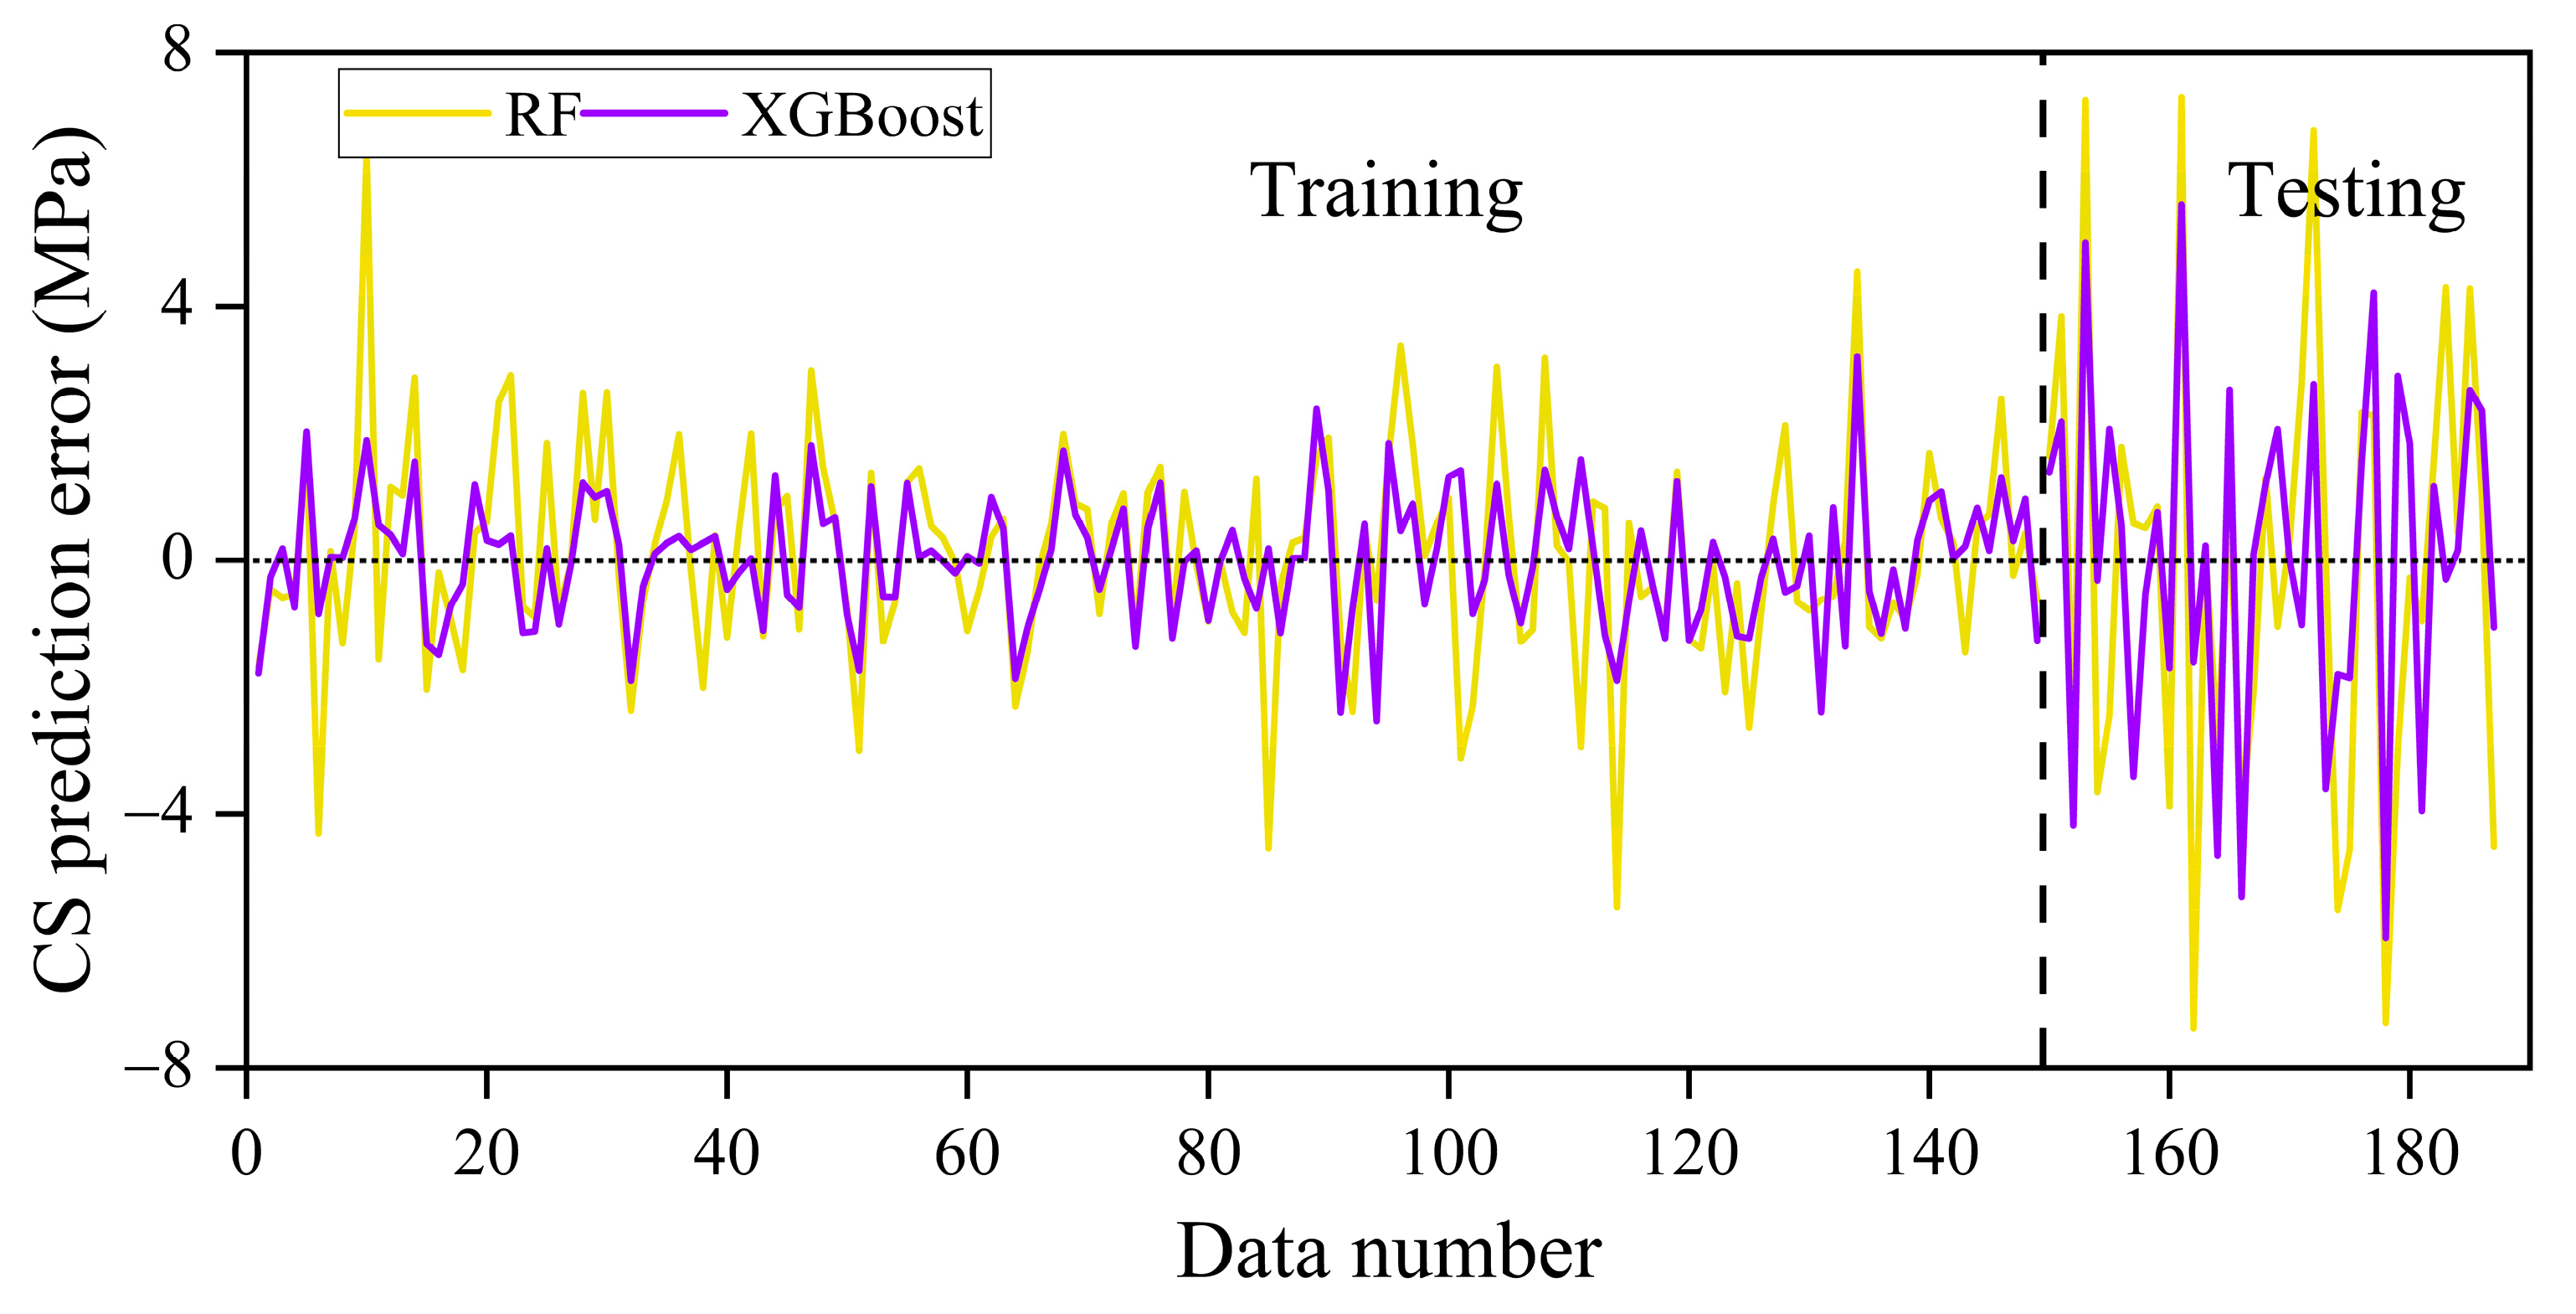
Figure 8 shows residual plots for the Compressive Strength (CS) of plastic waste concrete, which effectively demonstrate the predictive performance and error distribution of the RF and XGBoost models across both datasets. The figures, which show the variance between predicted and actual values (prediction error in MPa) versus data point number, indicate that for both models, the residuals for the training and testing sets are tightly clustered around the zero-error line. This suggests low bias and good accuracy. Notably, the XGBoost model has an even tighter residual distribution with a lower amount of error than the RF model, as indicated by a shorter vertical dispersion of data points on the plot. This verifies XGBoost’s greater precision, as evidenced by lower RMSE and higher R2 values. The fact that the testing dataset residuals for both models have a similar, random distribution about zero to the training data indicates that XGBoost has the highest level of predictive fidelity.
Figure 8.
Residual plots for CS models.
All mean errors are close to zero, ranging from −0.14 to −0.04 MPa as shown in Table 6. The standard deviation of the training residuals indicates a distinct variation in model performance. XGBoost (1.06 MPa) exhibits a significantly closer alignment with the training data than Random Forest (1.83 MPa). The standard deviation of errors significantly increases for both models in the testing set, as expected. XGBoost exhibits a reduced error variance (3.65 MPa) relative to Random Forest (4.33 MPa), indicating enhanced generalization ability and resilience with unseen data. This signifies a 16% decrease in the variability of prediction errors. Conclusion: The XGBoost model offers enhanced accuracy and reliability in predicting the compressive strength of plastic-containing concrete, distinguished by an optimal equilibrium of low bias and high precision in both training and testing datasets.
Table 6.
Quantitative summary of residual distributions for CS models.
3.1.3. Cross-Validation for CS Models
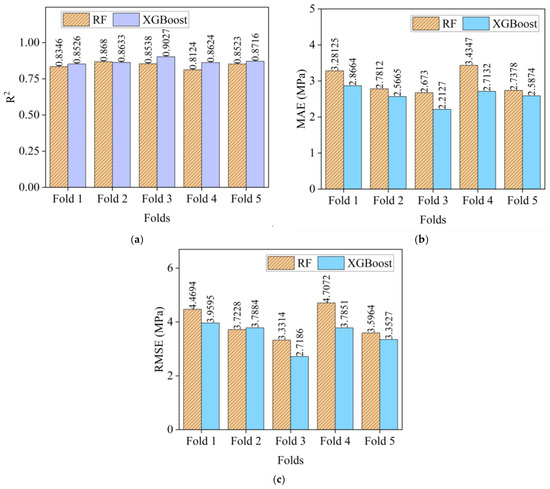
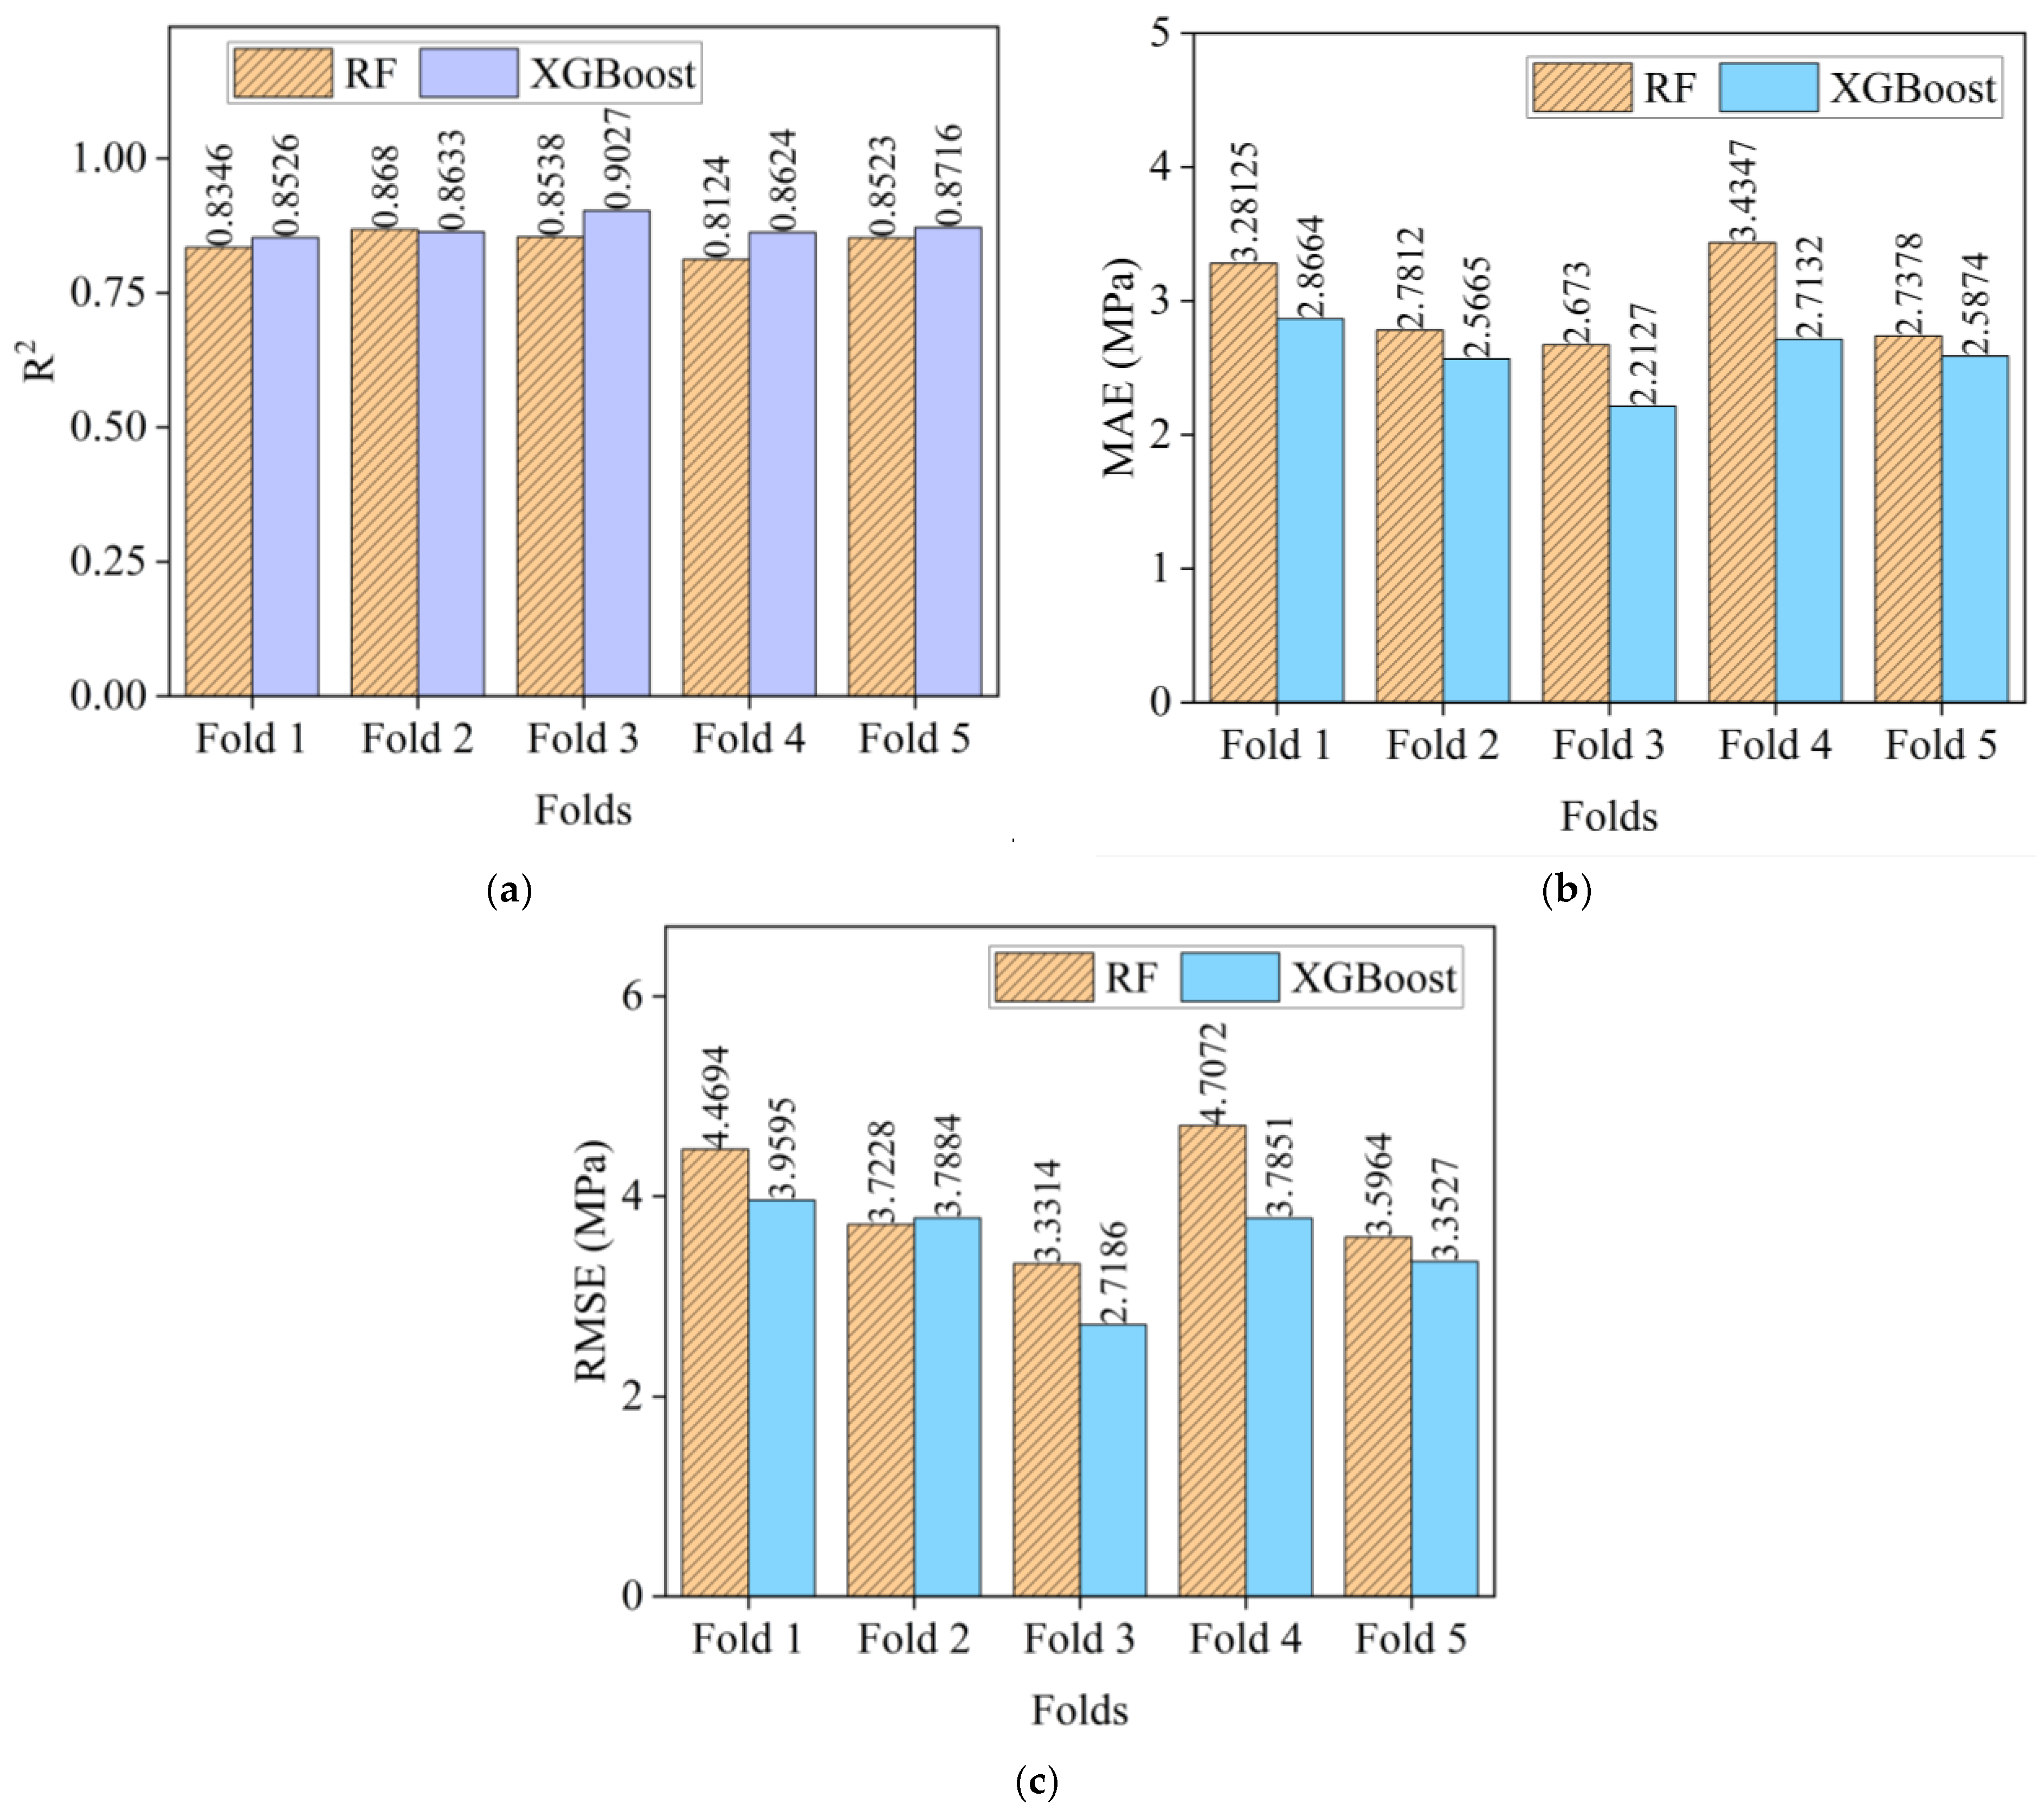
The cross-validation results for CS prediction models are shown in Figure 9. The predictive efficacy of RF and XGBoost models for predicting the compressive strength of concrete containing waste plastic was assessed by 5-fold cross-validation. The findings reveal that both ensemble algorithms are highly effective, with XGBoost exhibiting a marginal overall advantage. The average R2 for the RF model was 0.8442 ± 0.0197, but XGBoost exhibited a superior and more stable value of 0.8705 ± 0.0167. The superior performance of XGBoost was confirmed by the error metrics, demonstrating a lower mean absolute error (MAE: 2.5892 ± 0.2336 compared to 2.9816 ± 0.3142) and a diminished root mean squared error (RMSE: 3.5209 ± 0.4416 vs. 3.9654 ± 0.4963) relative to its random forest counterpart. The reduced standard deviations across all metrics for XGBoost indicate a steadier and dependable performance across various data subsets, rendering it the marginally more robust and precise model for this application.
Figure 9.
Cross-validation for CS models: (a) R2; (b) MAE; (c) RMSE.
3.1.4. Feature Importance for CS Models
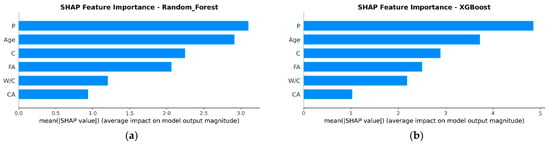
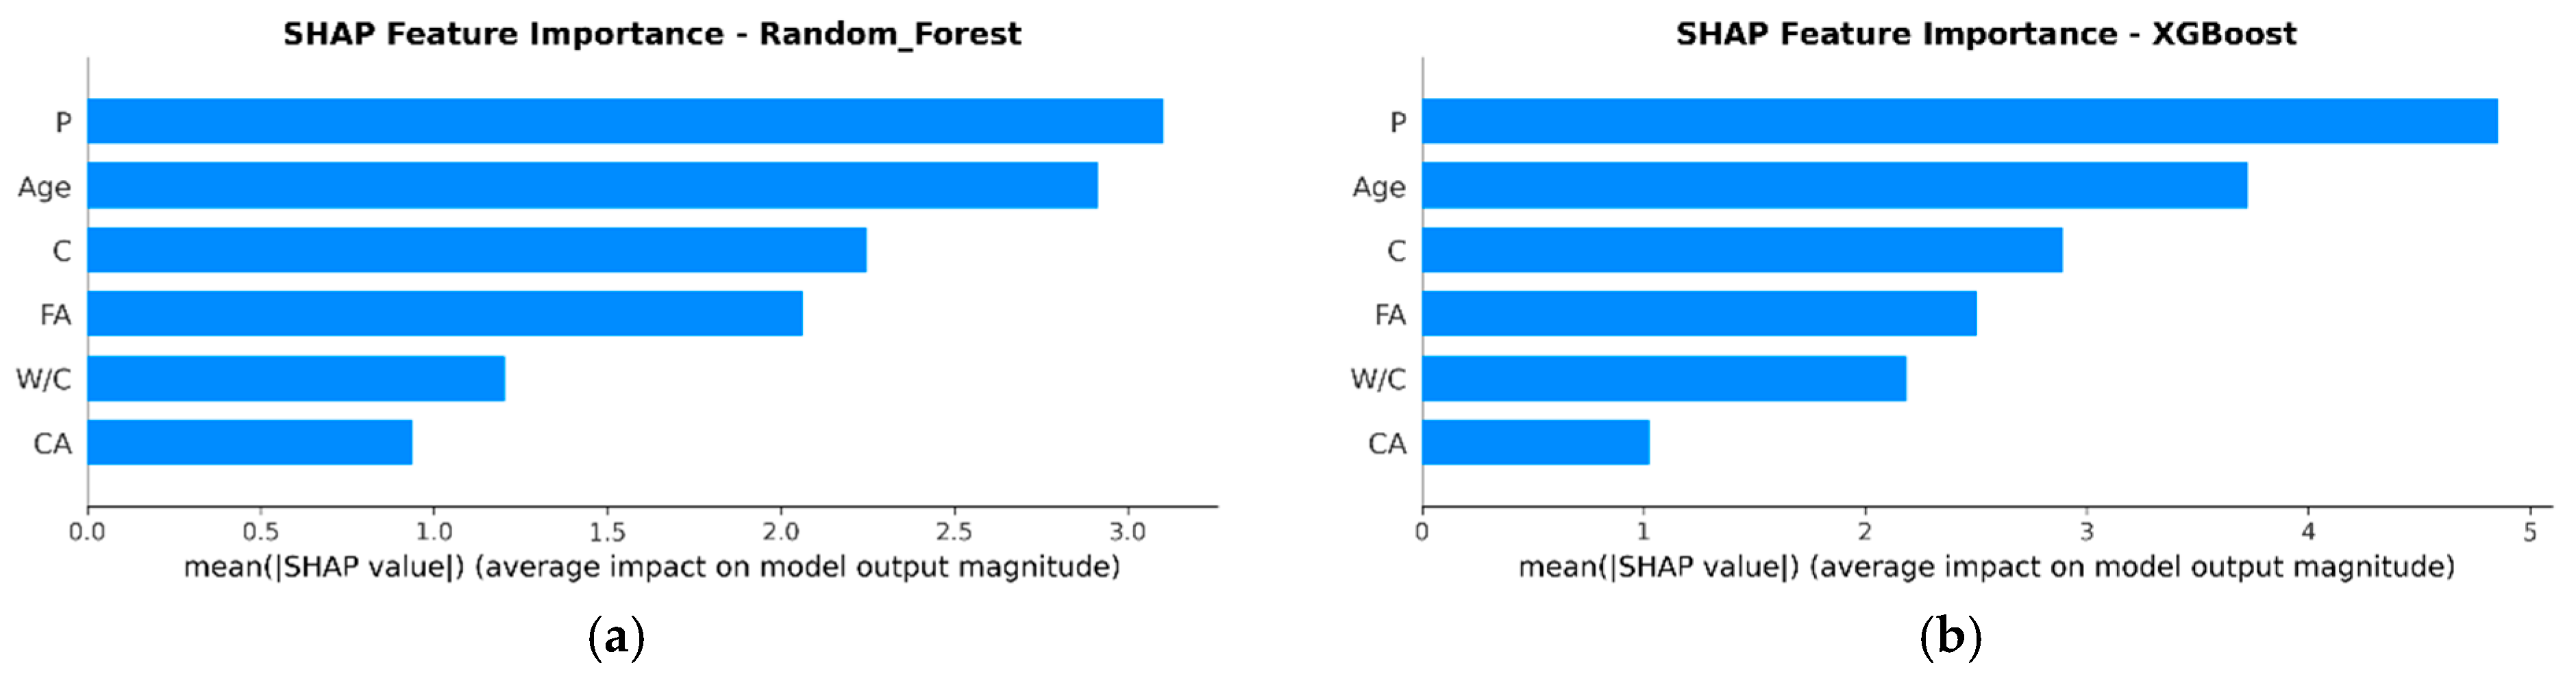
The SHAP feature importance analysis for compressive strength (CS) models in Figure 10 establishes a coherent and interpretable hierarchy of significant factors for P waste concrete. In both models, plastic content (P) is unequivocally the most significant parameter, demonstrating the greatest mean absolute SHAP value and affirming its influence on strength reduction. The age of concrete is the second most critical factor, emphasizing the substantial role of curing duration in strength enhancement, while cement content (C) is ranked third. The models demonstrate complete concordance about the hierarchy of significance for the remaining variables: FA, W/C, and CA.
Figure 10.
Feature importance for CS models: (a) RF; (b) XGBoost.
3.1.5. Enhanced Explainability of the Developed CS Models
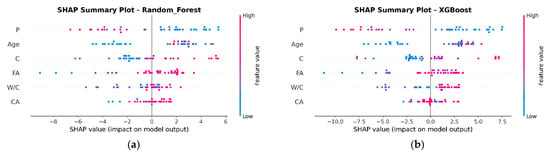
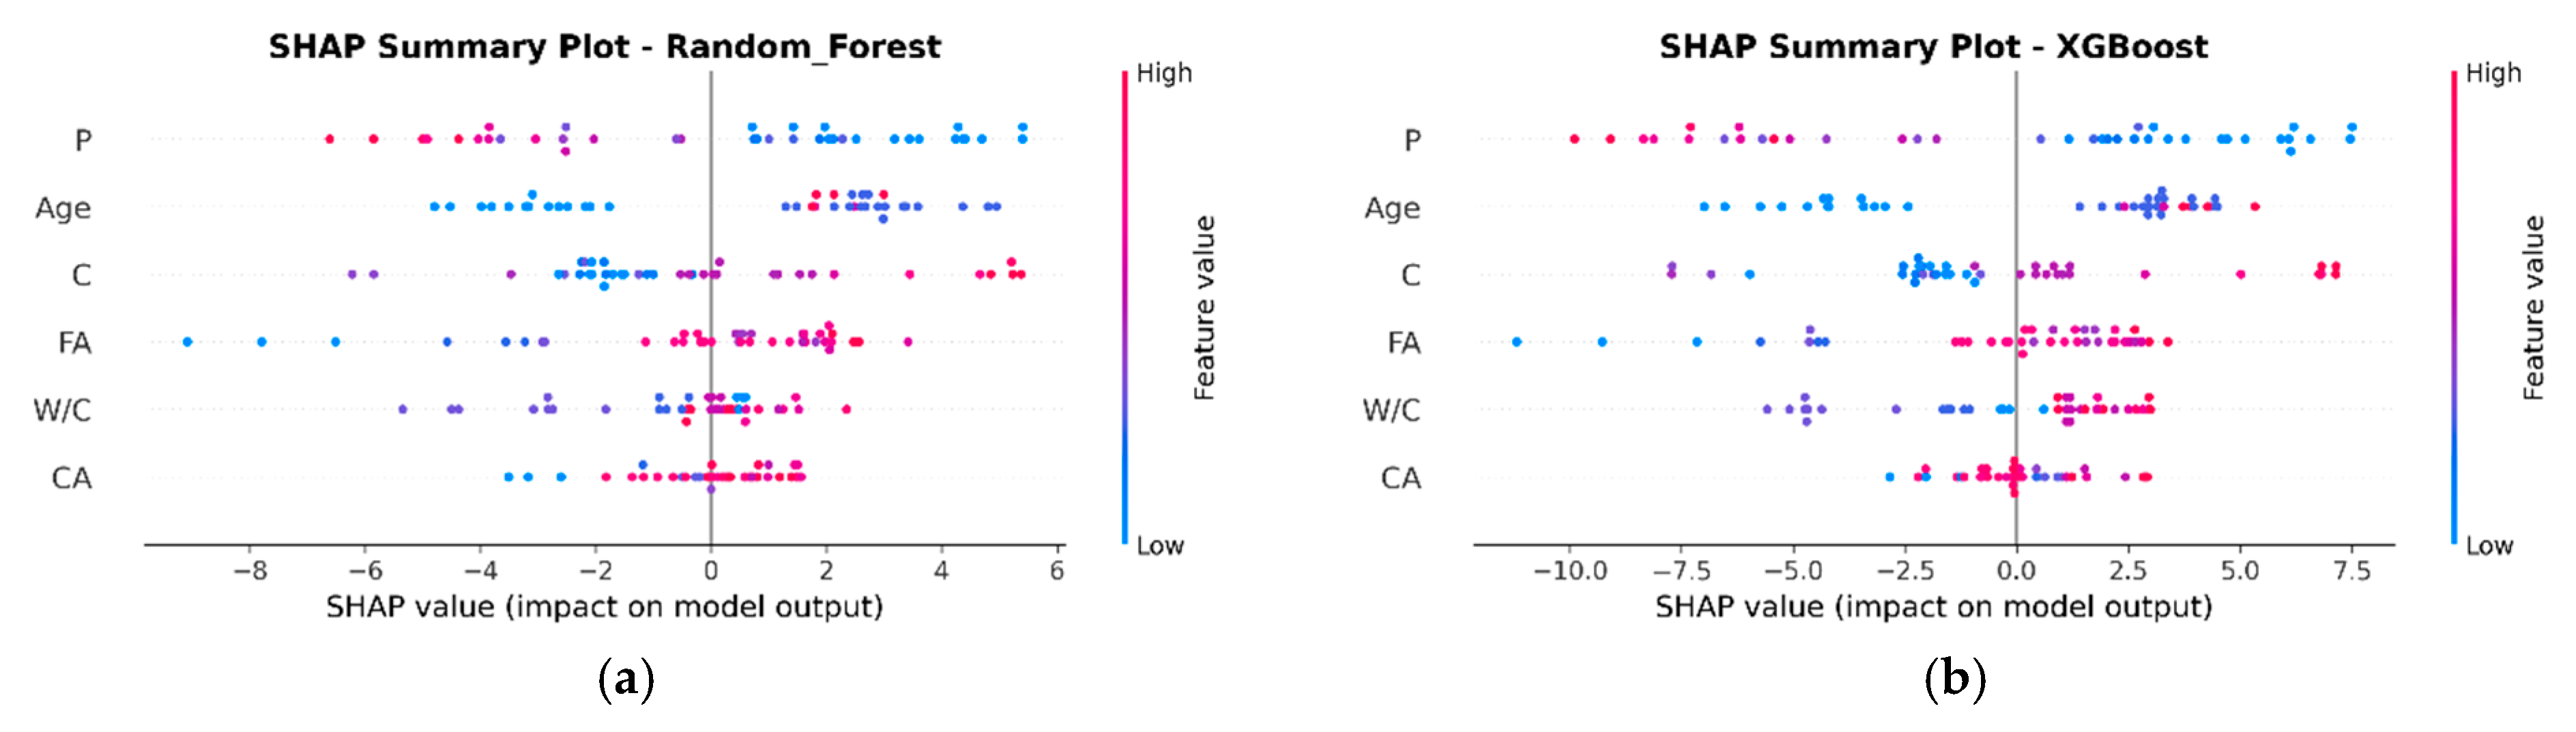
The SHAP summary plots in Figure 11 illustrate the relative relevance and directional impact of the input variables on CS of P waste concrete for both RF and XGBoost models. In both models, the plastic content (P) is the predominant factor, demonstrating a significant negative influence on the predicted compressive strength, as evidenced by its placement at the top and the aggregation of its SHAP values on the negative axis; this substantiates that increased plastic content consistently diminishes strength. In both models, age and cement content (C) are the next most significant elements, typically having a positive effect. A larger W/C consistently demonstrates a detrimental effect in both models. The notable agreement between the two independent models in recognizing plastic content as the principal adverse factor and age/cement as the primary advantageous factors considerably enhances the credibility of these findings for enhancing P waste concrete mix designs.
Figure 11.
SHAP plot for CS: (a) RF; (b) XGBoost.
3.1.6. Comparison Between Developed CS Models with Previous Models
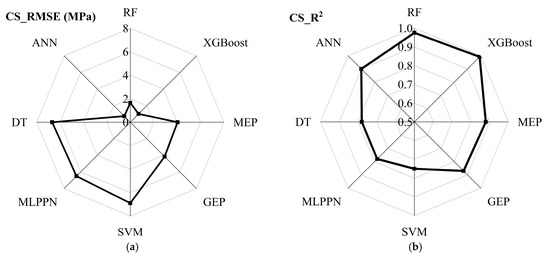
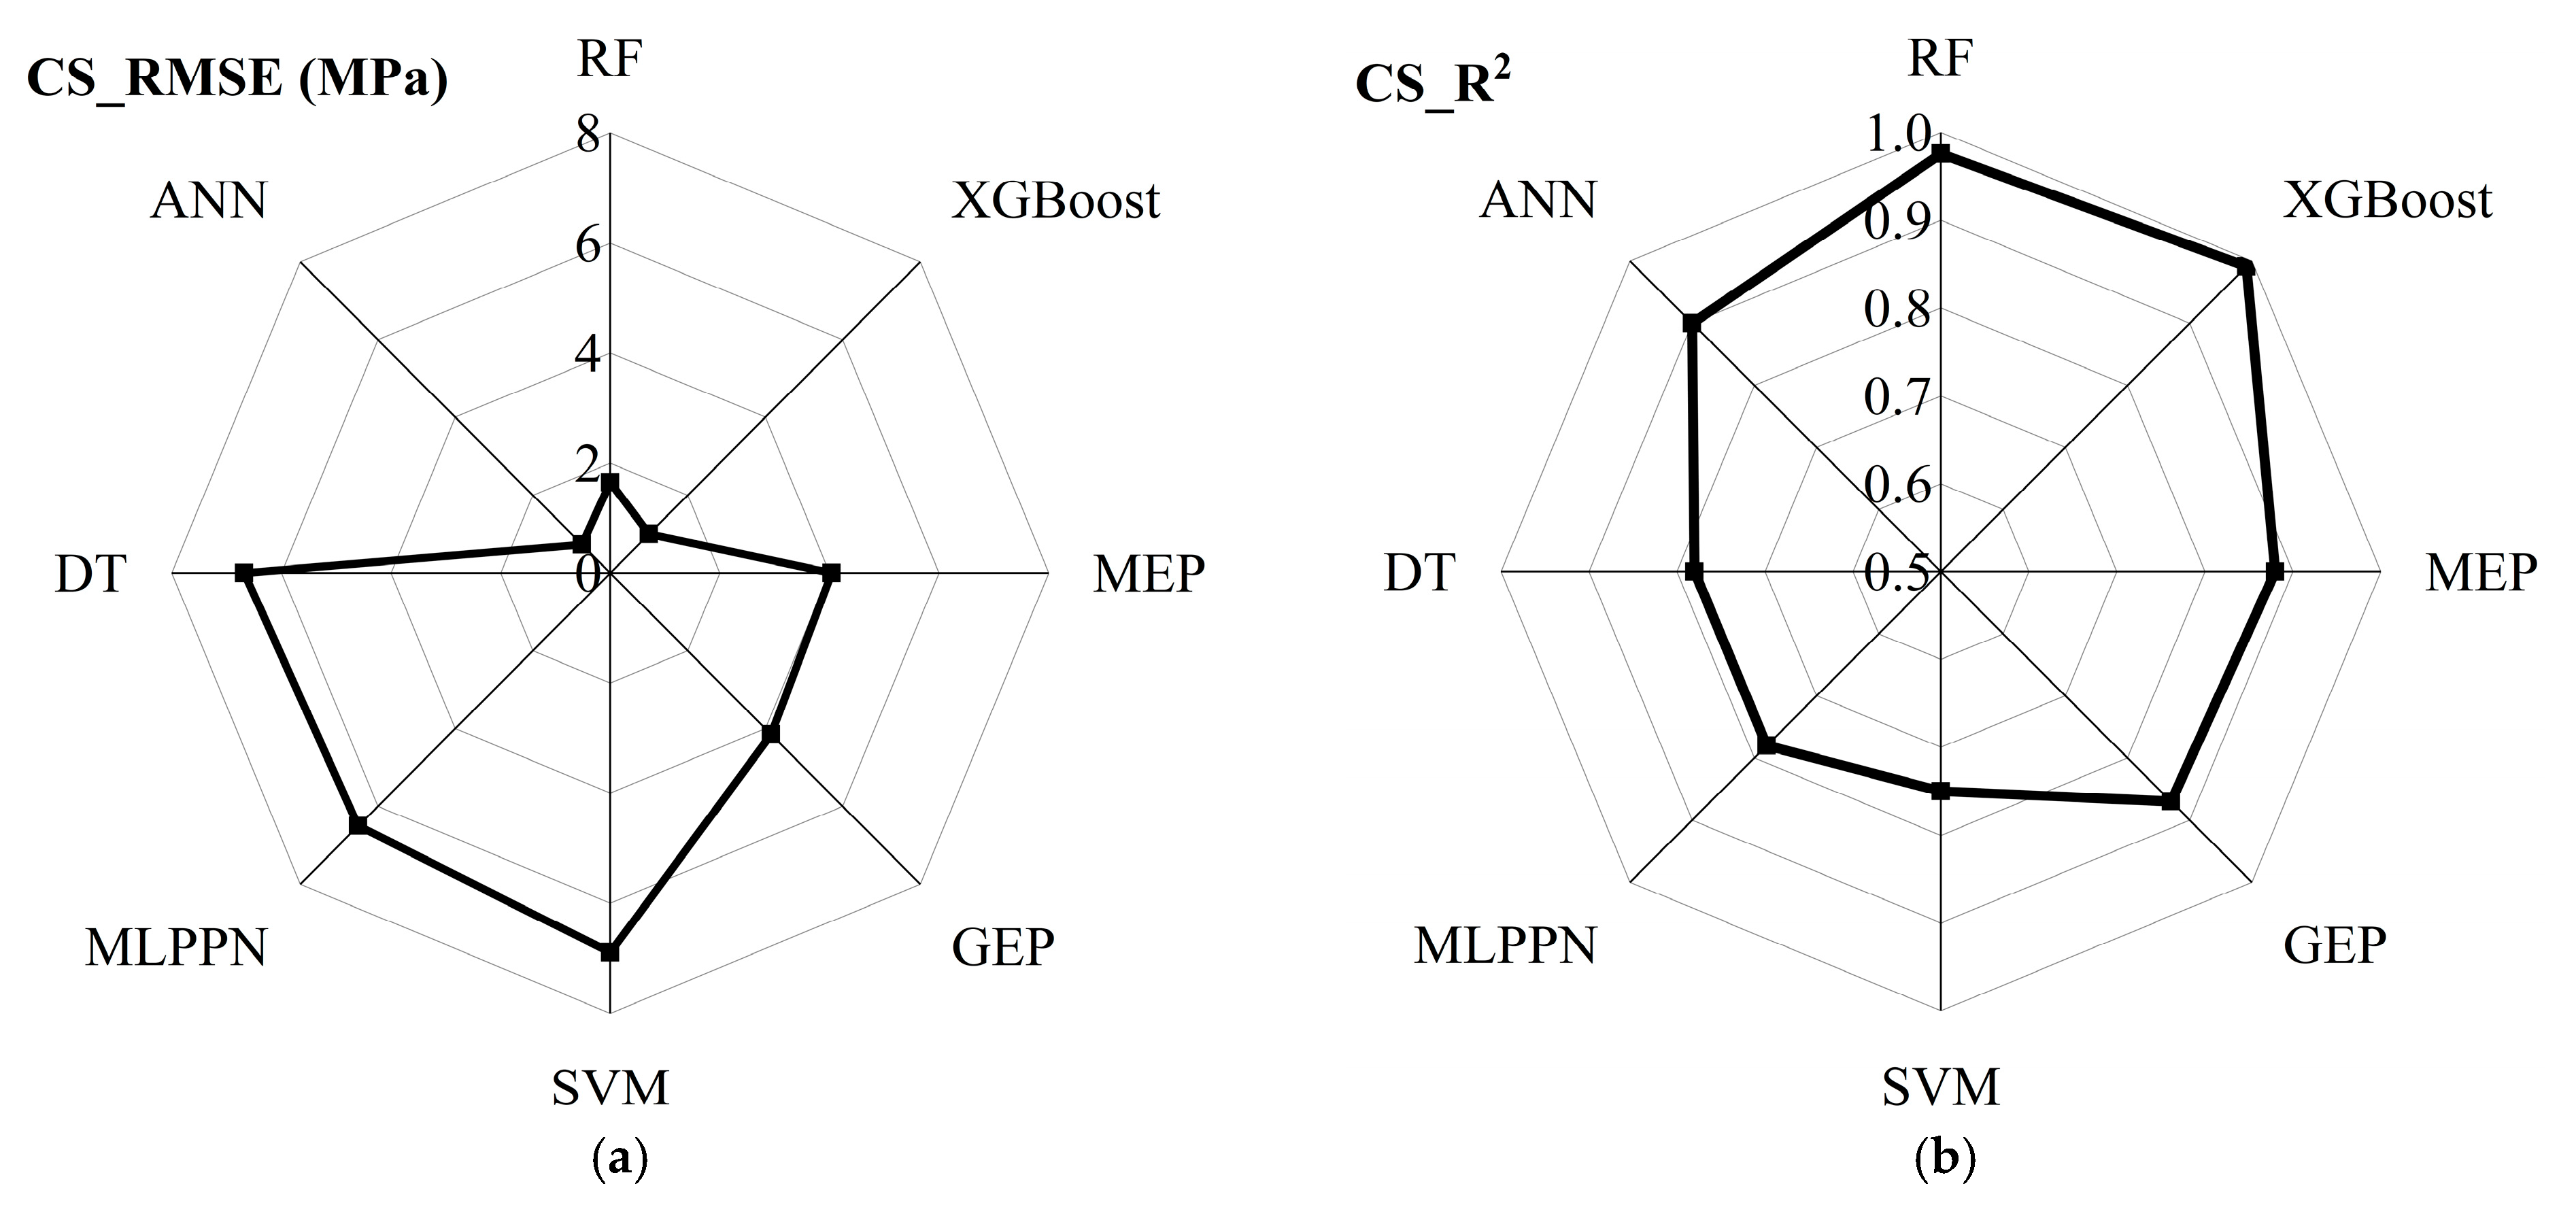
Figure 12 shows the comparison between developed models for compressive strength of P waste concrete with existing models: Gene Expression Programming (GEP) [40], Multi-Expression Programming (MEP) [40], Decision Tree (DT) [41], Multilayer Perceptron Neural Network (MLPNN) [41], Support Vector Machine (SVM) [41], and artificial neural network (ANN) [42]. The developed RF and XGBoost models exhibit a significant improvement in predicting CS of plastic waste concrete relative to previous computational methods. The XGBoost model establishes a high standard with an R2 of 0.9911 and an RMSE of 0.9968; however, it is much outperformed by the RF model, which attains an almost perfect R2 of 0.9757 and lowers the RMSE to an outstanding 1.6479. The significant difference in error reduction and explanatory power highlights the XGBoost algorithm’s superior ability to model the intricate relationships influencing CS of P waste concrete, positioning it as a markedly more robust and dependable predictive tool.
Figure 12.
Comparison between developed CS models and previous models: (a) RMSE; (b) R2.
3.2. Tensile Strength Models
3.2.1. Regression of RF and XGBoost Models for TS
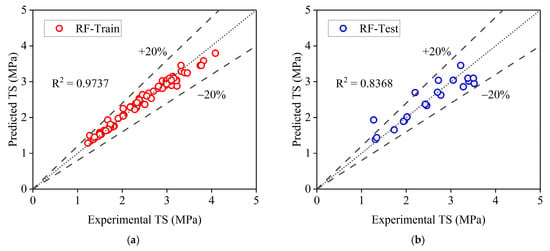
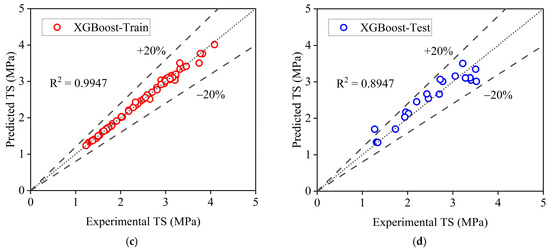
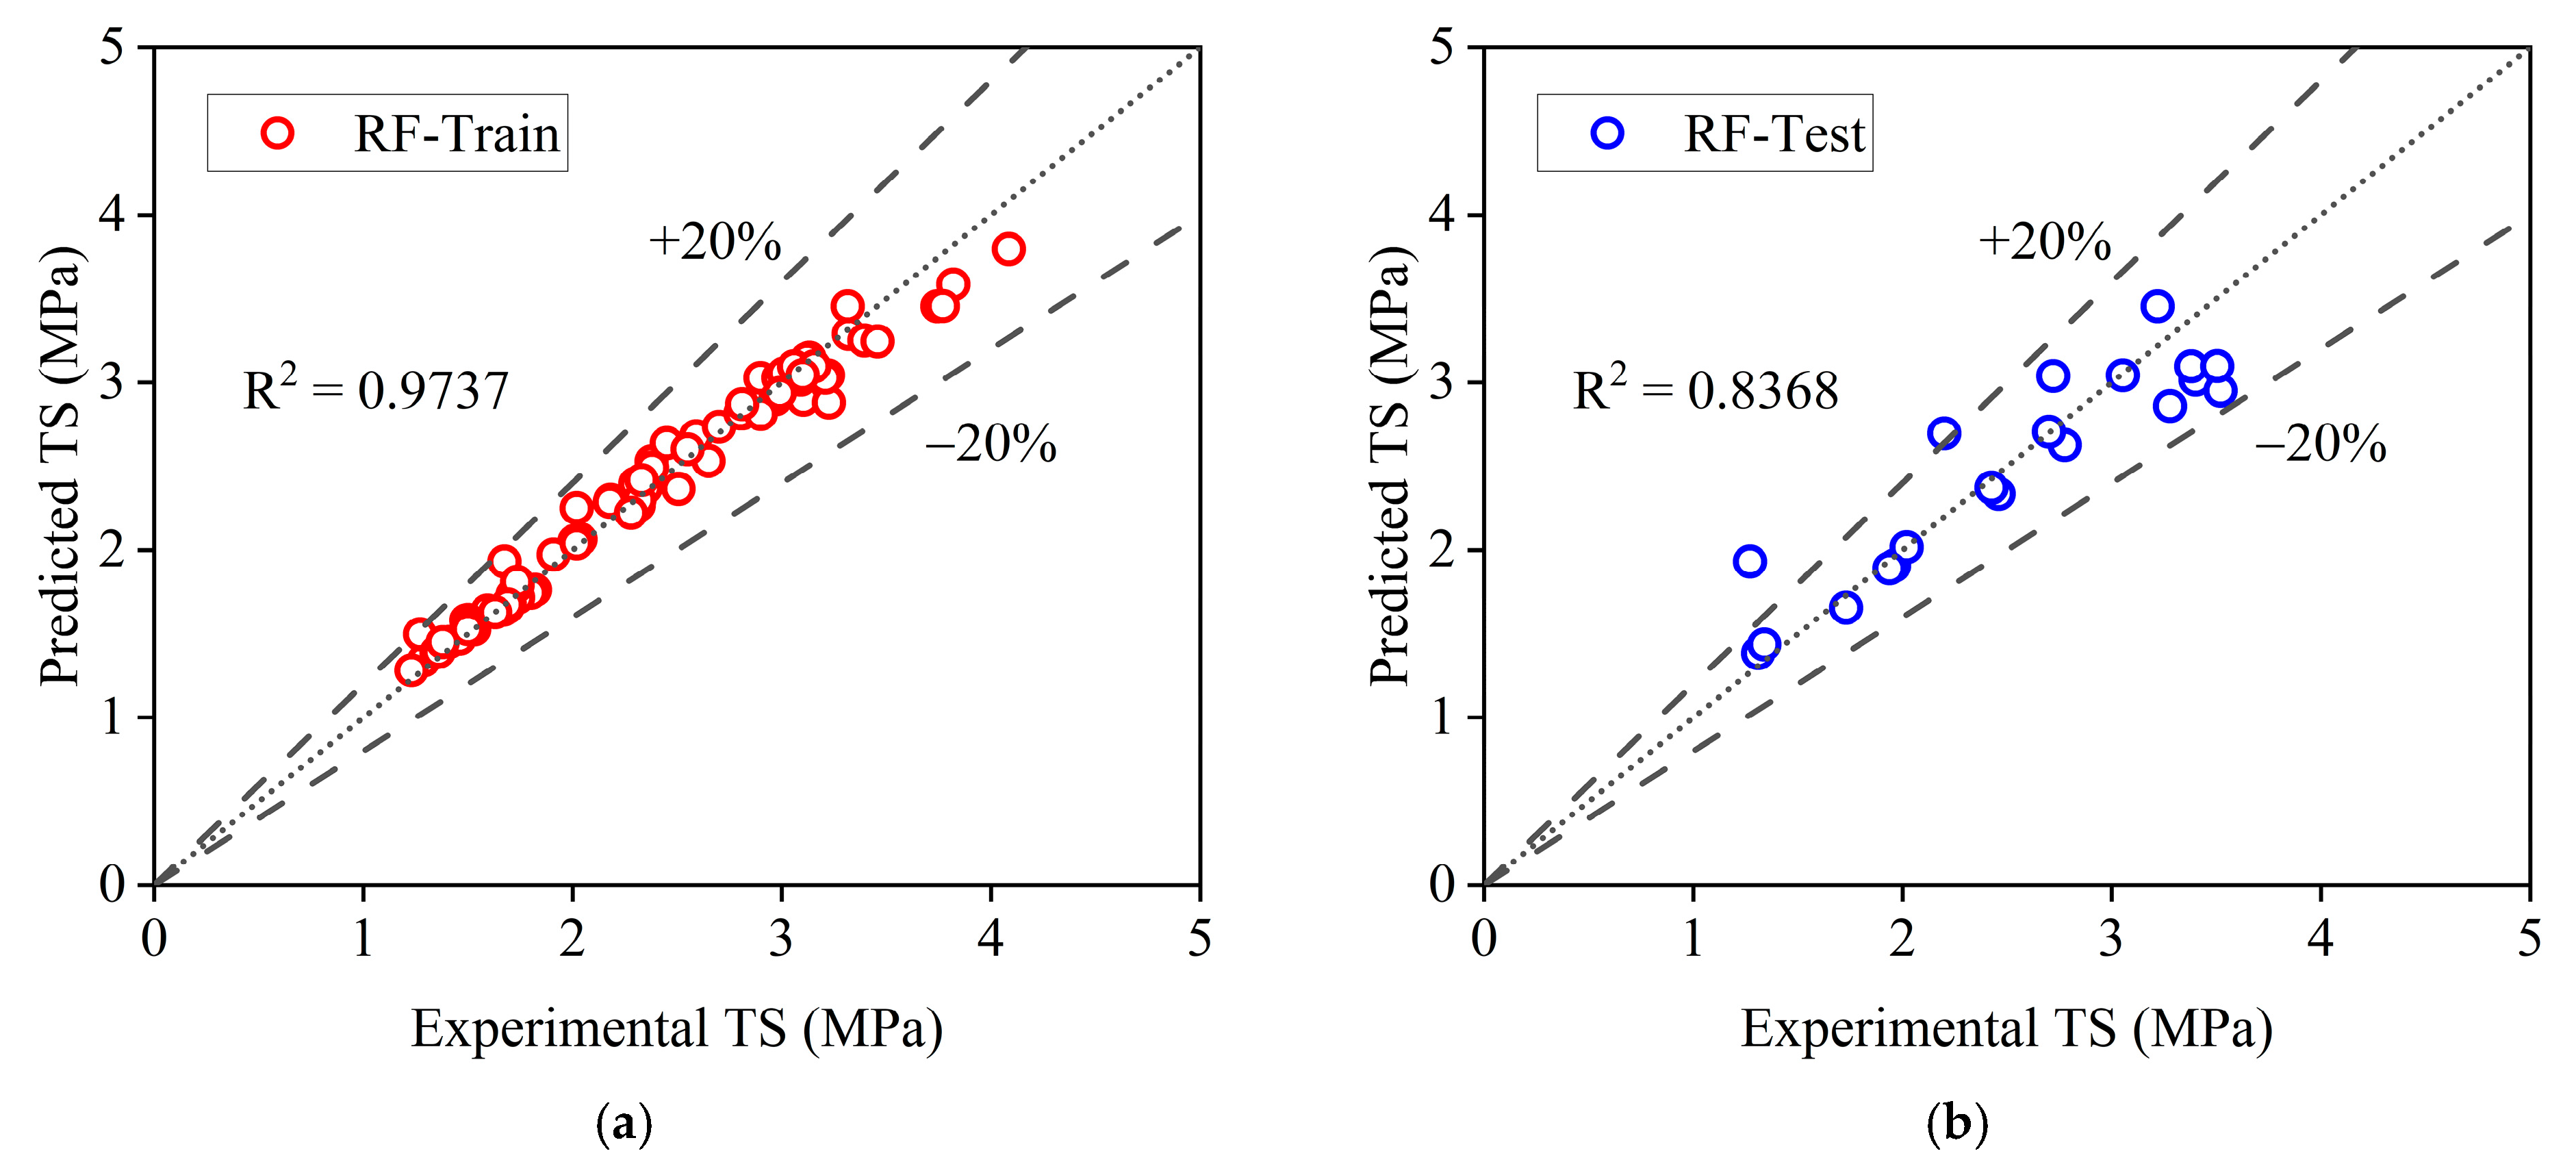
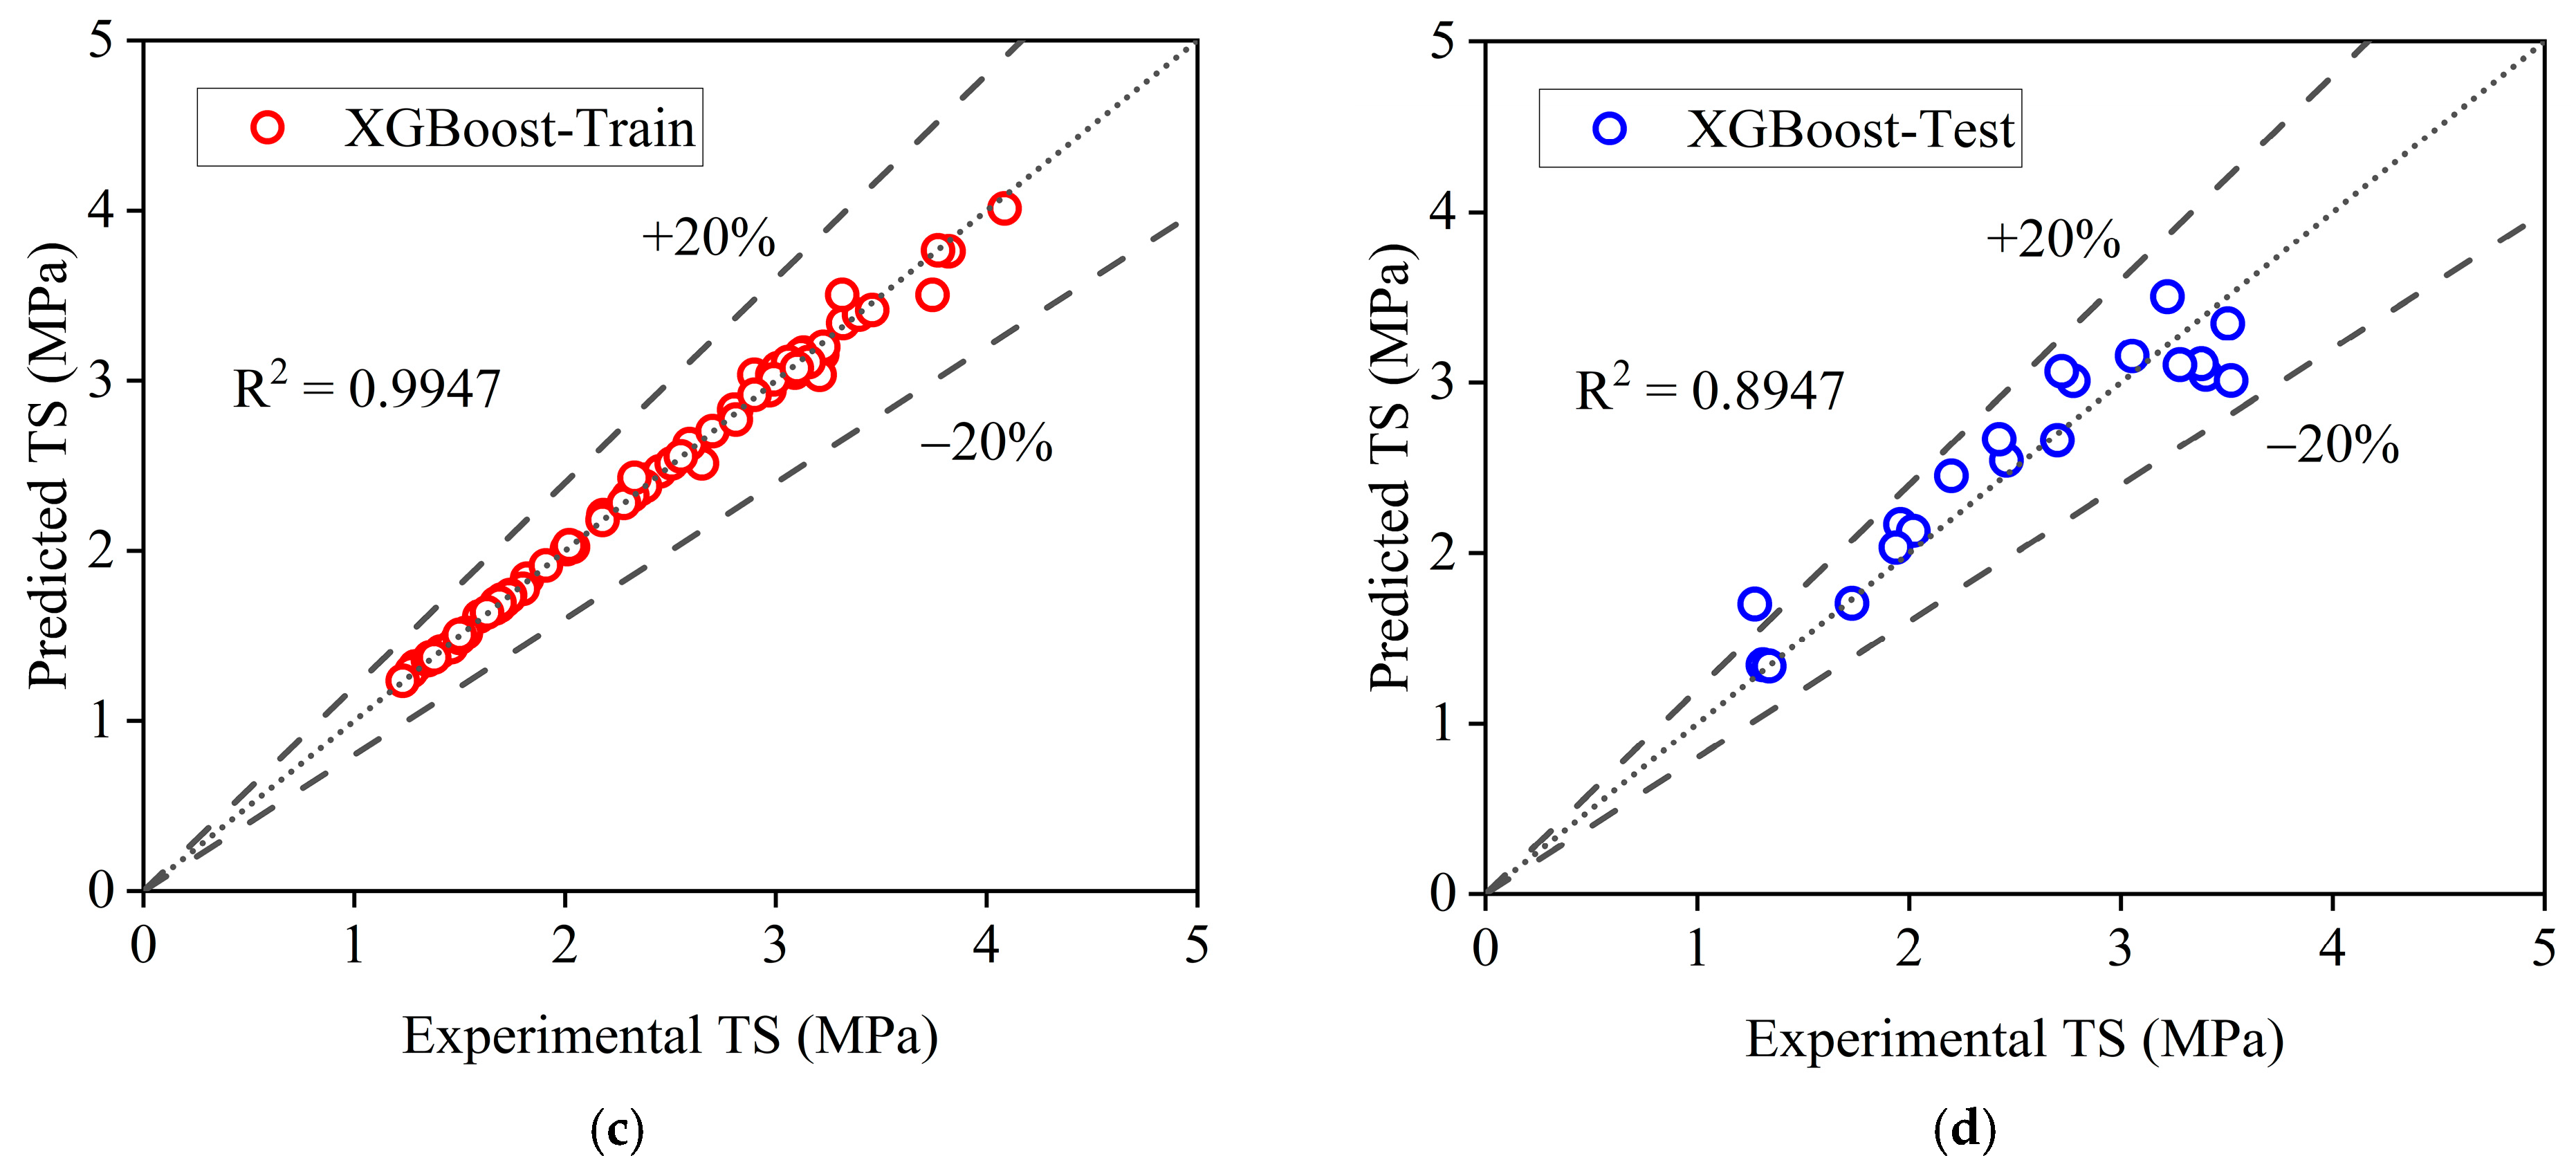
The regression plots for tensile strength (TS) in Figure 13 clearly indicate the predictive efficacy of both RF and XGBoost models. The RF model in Figure 13a,b demonstrates a robust connection between predicted and experimental TS values for both training and testing datasets, as indicated by the tight clustering of data points at the line of perfect concordance (Y = X). A little rise in scatter is found in the testing dataset (Figure 13b), indicating a slight decline in predicted accuracy when generalizing unknown data. The XGBoost model, depicted in Figure 13c,d, attains remarkable predictive accuracy. The training data (Figure 13c) exhibits a highly concentrated and linear aggregation of points along the Y = X line, indicating a nearly flawless model fit. Crucially, this elevated accuracy is constantly upheld in the testing dataset (Figure 13d), where the data points align closely with the intended trend, exhibiting low variance. The minimal disparity between training and testing performance for XGBoost underscores its superior capacity to simulate the intricate interactions influencing the tensile strength of P waste concrete, yielding a highly dependable and generalizable model that surpasses the RF method.
Figure 13.
Regression models for TS of P waste concrete: (a) RF-Training; (b) RF-Testing; (c) XGBoost-Training; (d) XGBoost-Testing.
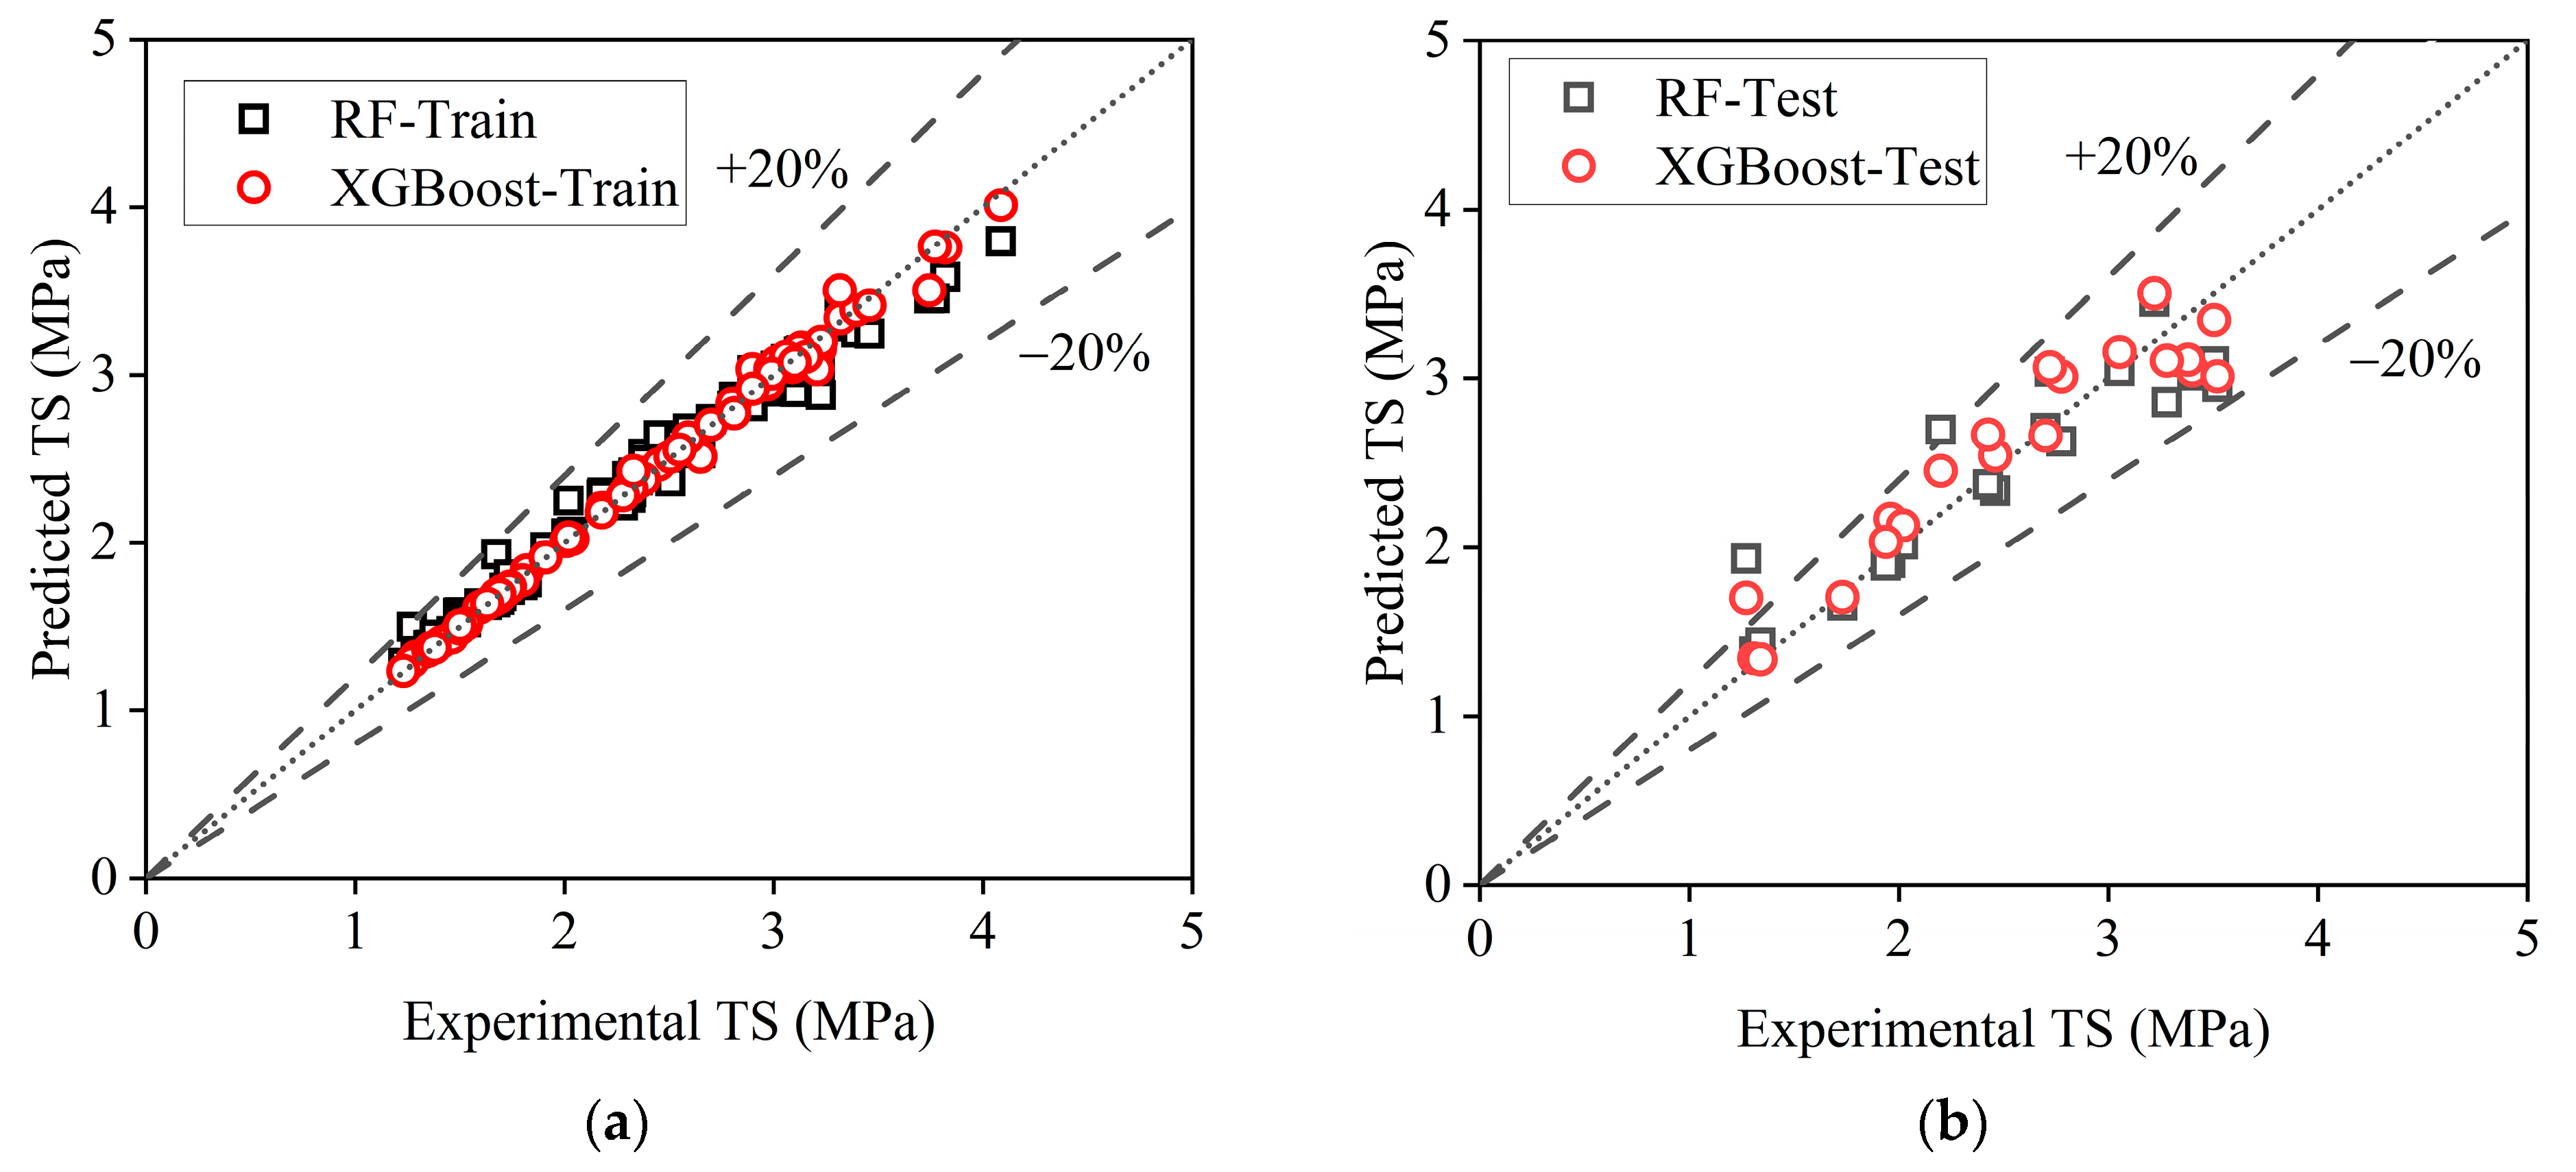
The comparison scatter plots for tensile strength (TS) in Figure 14 clearly demonstrate the superior predictive capability of the XGBoost model compared to RF model. In both the training (Figure 14a) and testing (Figure 14b) datasets, the data points for the XGBoost model exhibit much tighter and more linear clustering along the optimal Y = X line in contrast to the RF model. The RF predictions demonstrate a reasonable correlation; nevertheless, they display a wider, more dispersed dispersion band around the line of perfect agreement, signifying increased prediction variation and error. The XGBoost model exhibits exceptional accuracy and reliability, with its performance on the testing dataset displaying no decline compared to its training performance. The XGBoost model generalizes more proficiently with unseen data.
Figure 14.
Scatter plots for TS predictions: (a) Training; (b) Testing.
3.2.2. Performance of Developed Models for TS
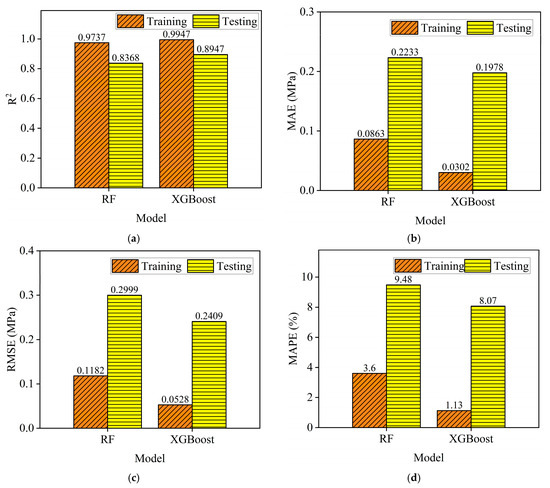
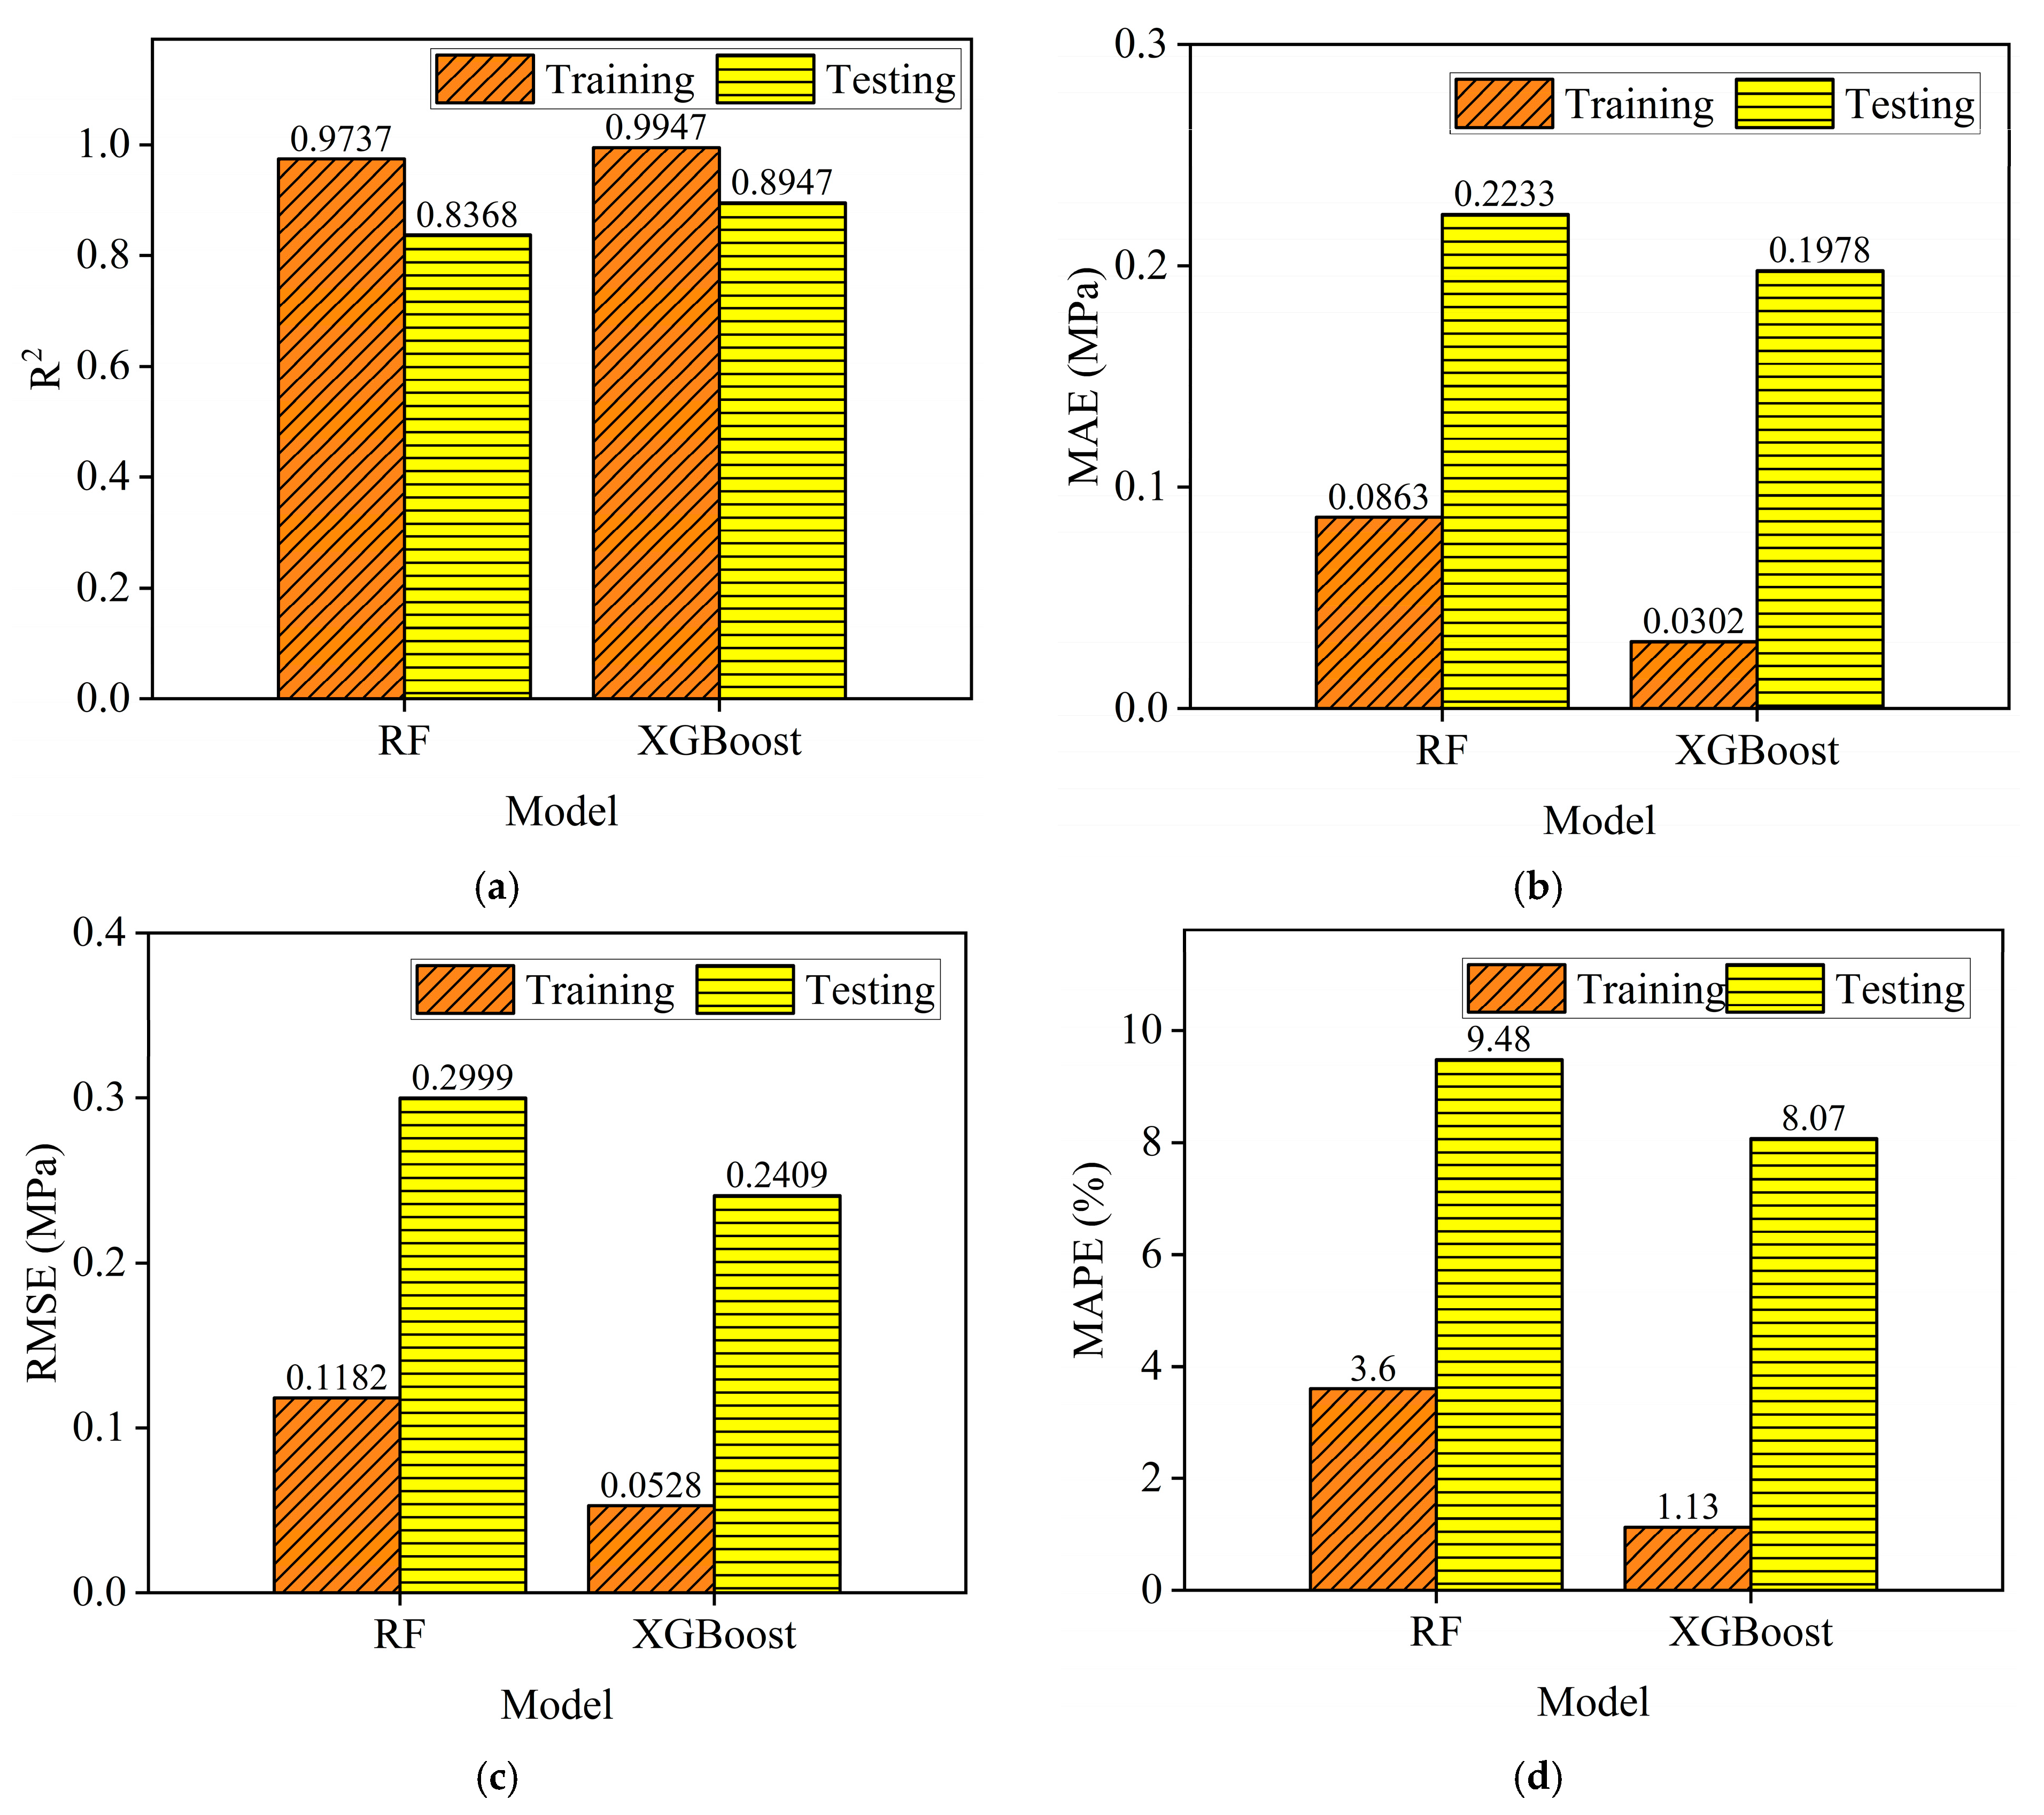
A consistent pattern of performance was noted for the tensile strength predictions, as shown in Figure 15 and Table 7. XGBoost demonstrated an exceptional fit on the training data (R2 = 0.9947) with lower errors (MAE = 0.0302 MPa, RMSE = 0.0528 MPa, MAPE = 1.13%), substantially surpassing the RF model (R2 = 0.9737, MAE = 0.0863 MPa, RMSE = 0.1182 MPa, MAPE = 3.60%). XGBoost exhibited enhanced generalization during testing, achieving a higher R2 (0.8947 versus 0.8368) and reduced error rates (MAE = 0.1978 MPa, RMSE = 0.2409 MPa, MAPE = 8.07%) in comparison to RF (MAE = 0.2233 MPa, RMSE = 0.2999 MPa, MAPE = 9.48%). In summary, the XGBoost model consistently surpassed the Random Forest model in both CS and TS of P waste concrete and all assessed metrics, excelling in identifying underlying trends within the training data and, crucially, in delivering more accurate and dependable predictions for unseen data.
Figure 15.
Statistical measures for TS models: (a) R2; (b) MAE; (c) RMSE; (d) MAPE.
Table 7.
Summary of statistical metrics for the TS model.
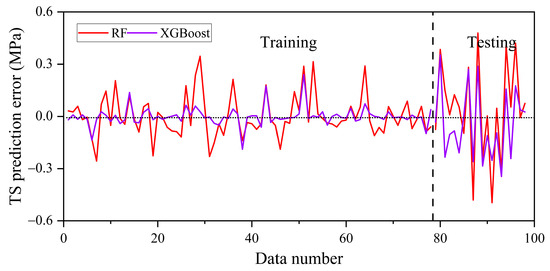
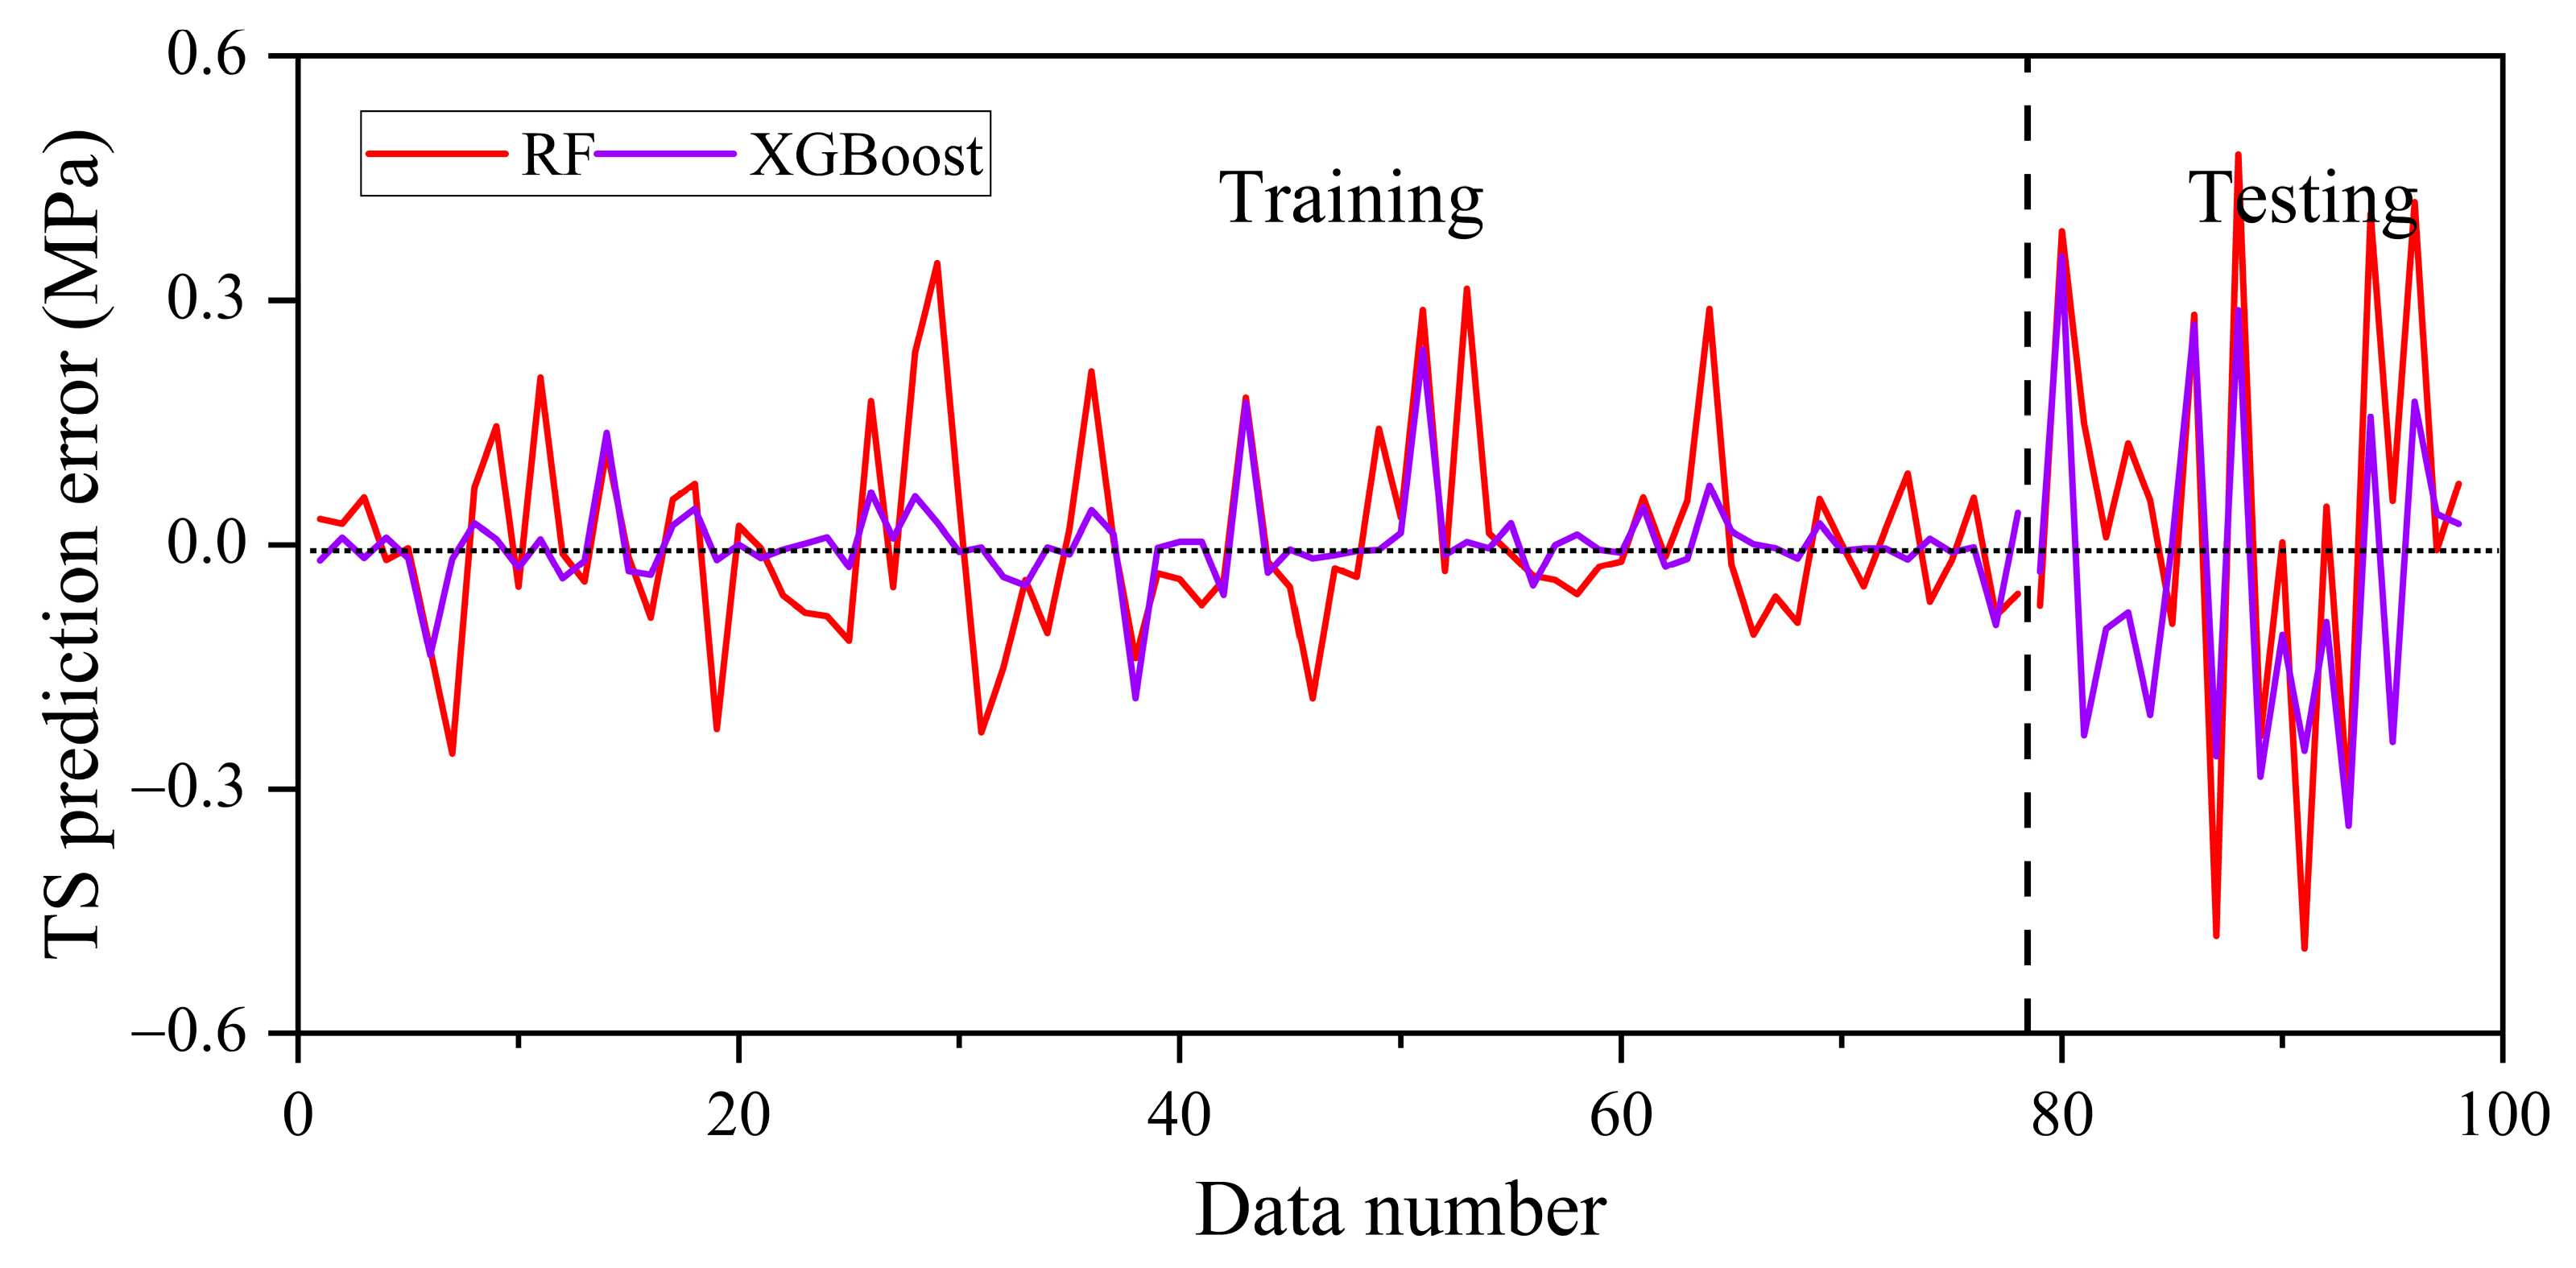
The residual plot for the tensile strength (TS) of plastic waste concrete depicted in Figure 16 allows for the assessment of the prediction efficacy of both RF and XGBoost models. The graph depicts the prediction error (in MPa) relative to the data point number for both datasets. A visual study exhibits that the XGBoost model consistently surpasses the RF model, as seen by its markedly tighter cluster of residuals around the zero-error line for both datasets. The RF model exhibits a broader vertical dispersion of errors, notably with multiple testing locations surpassing ±0.3 MPa, but the XGBoost residuals are tightly clustered around zero, displaying a significantly narrow range. The limited and random dispersion for XGBoost, lacking any identifiable systematic structure, validates its exceptional accuracy and strong generalization capacity for forecasting TS. The RF model’s performance is satisfactory, although it demonstrates a random error distribution that is less exact compared to the highly refined XGBoost algorithm, which displays near-optimal residual characteristics for a dependable predictive model.
Figure 16.
Residual plots for TS models.
Both models exhibit minimal systematic bias, with mean errors nearing zero (±0.023 MPa) across all datasets, as shown in Table 8. XGBoost demonstrates significantly superior precision, exhibiting training and testing standard deviations of 0.052 MPa and 0.251 MPa, respectively, in contrast to 0.118 MPa and 0.301 MPa for RF. This indicates a 56% decrease in training error variability and a 17% decrease in testing error variability for XGBoost. Although both models exhibit heightened error dispersion on the testing set, XGBoost demonstrates superior generalization with a lesser absolute rise in standard deviation (0.199 MPa) in contrast to RF (0.183 MPa relative to its elevated baseline). XGBoost outperforms Random Forest in predicting the tensile strength of plastic-containing concrete, exhibiting comparable bias but markedly enhanced precision, thus establishing it as the preferable modeling technique for this application.
Table 8.
Quantitative summary of residual distributions for TS models.
3.2.3. Cross-Validation for TS Models
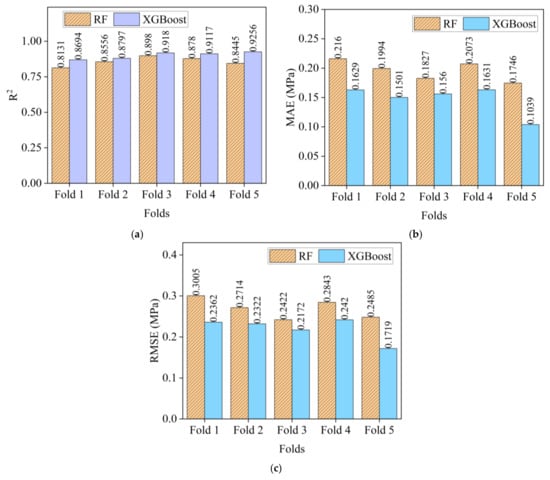
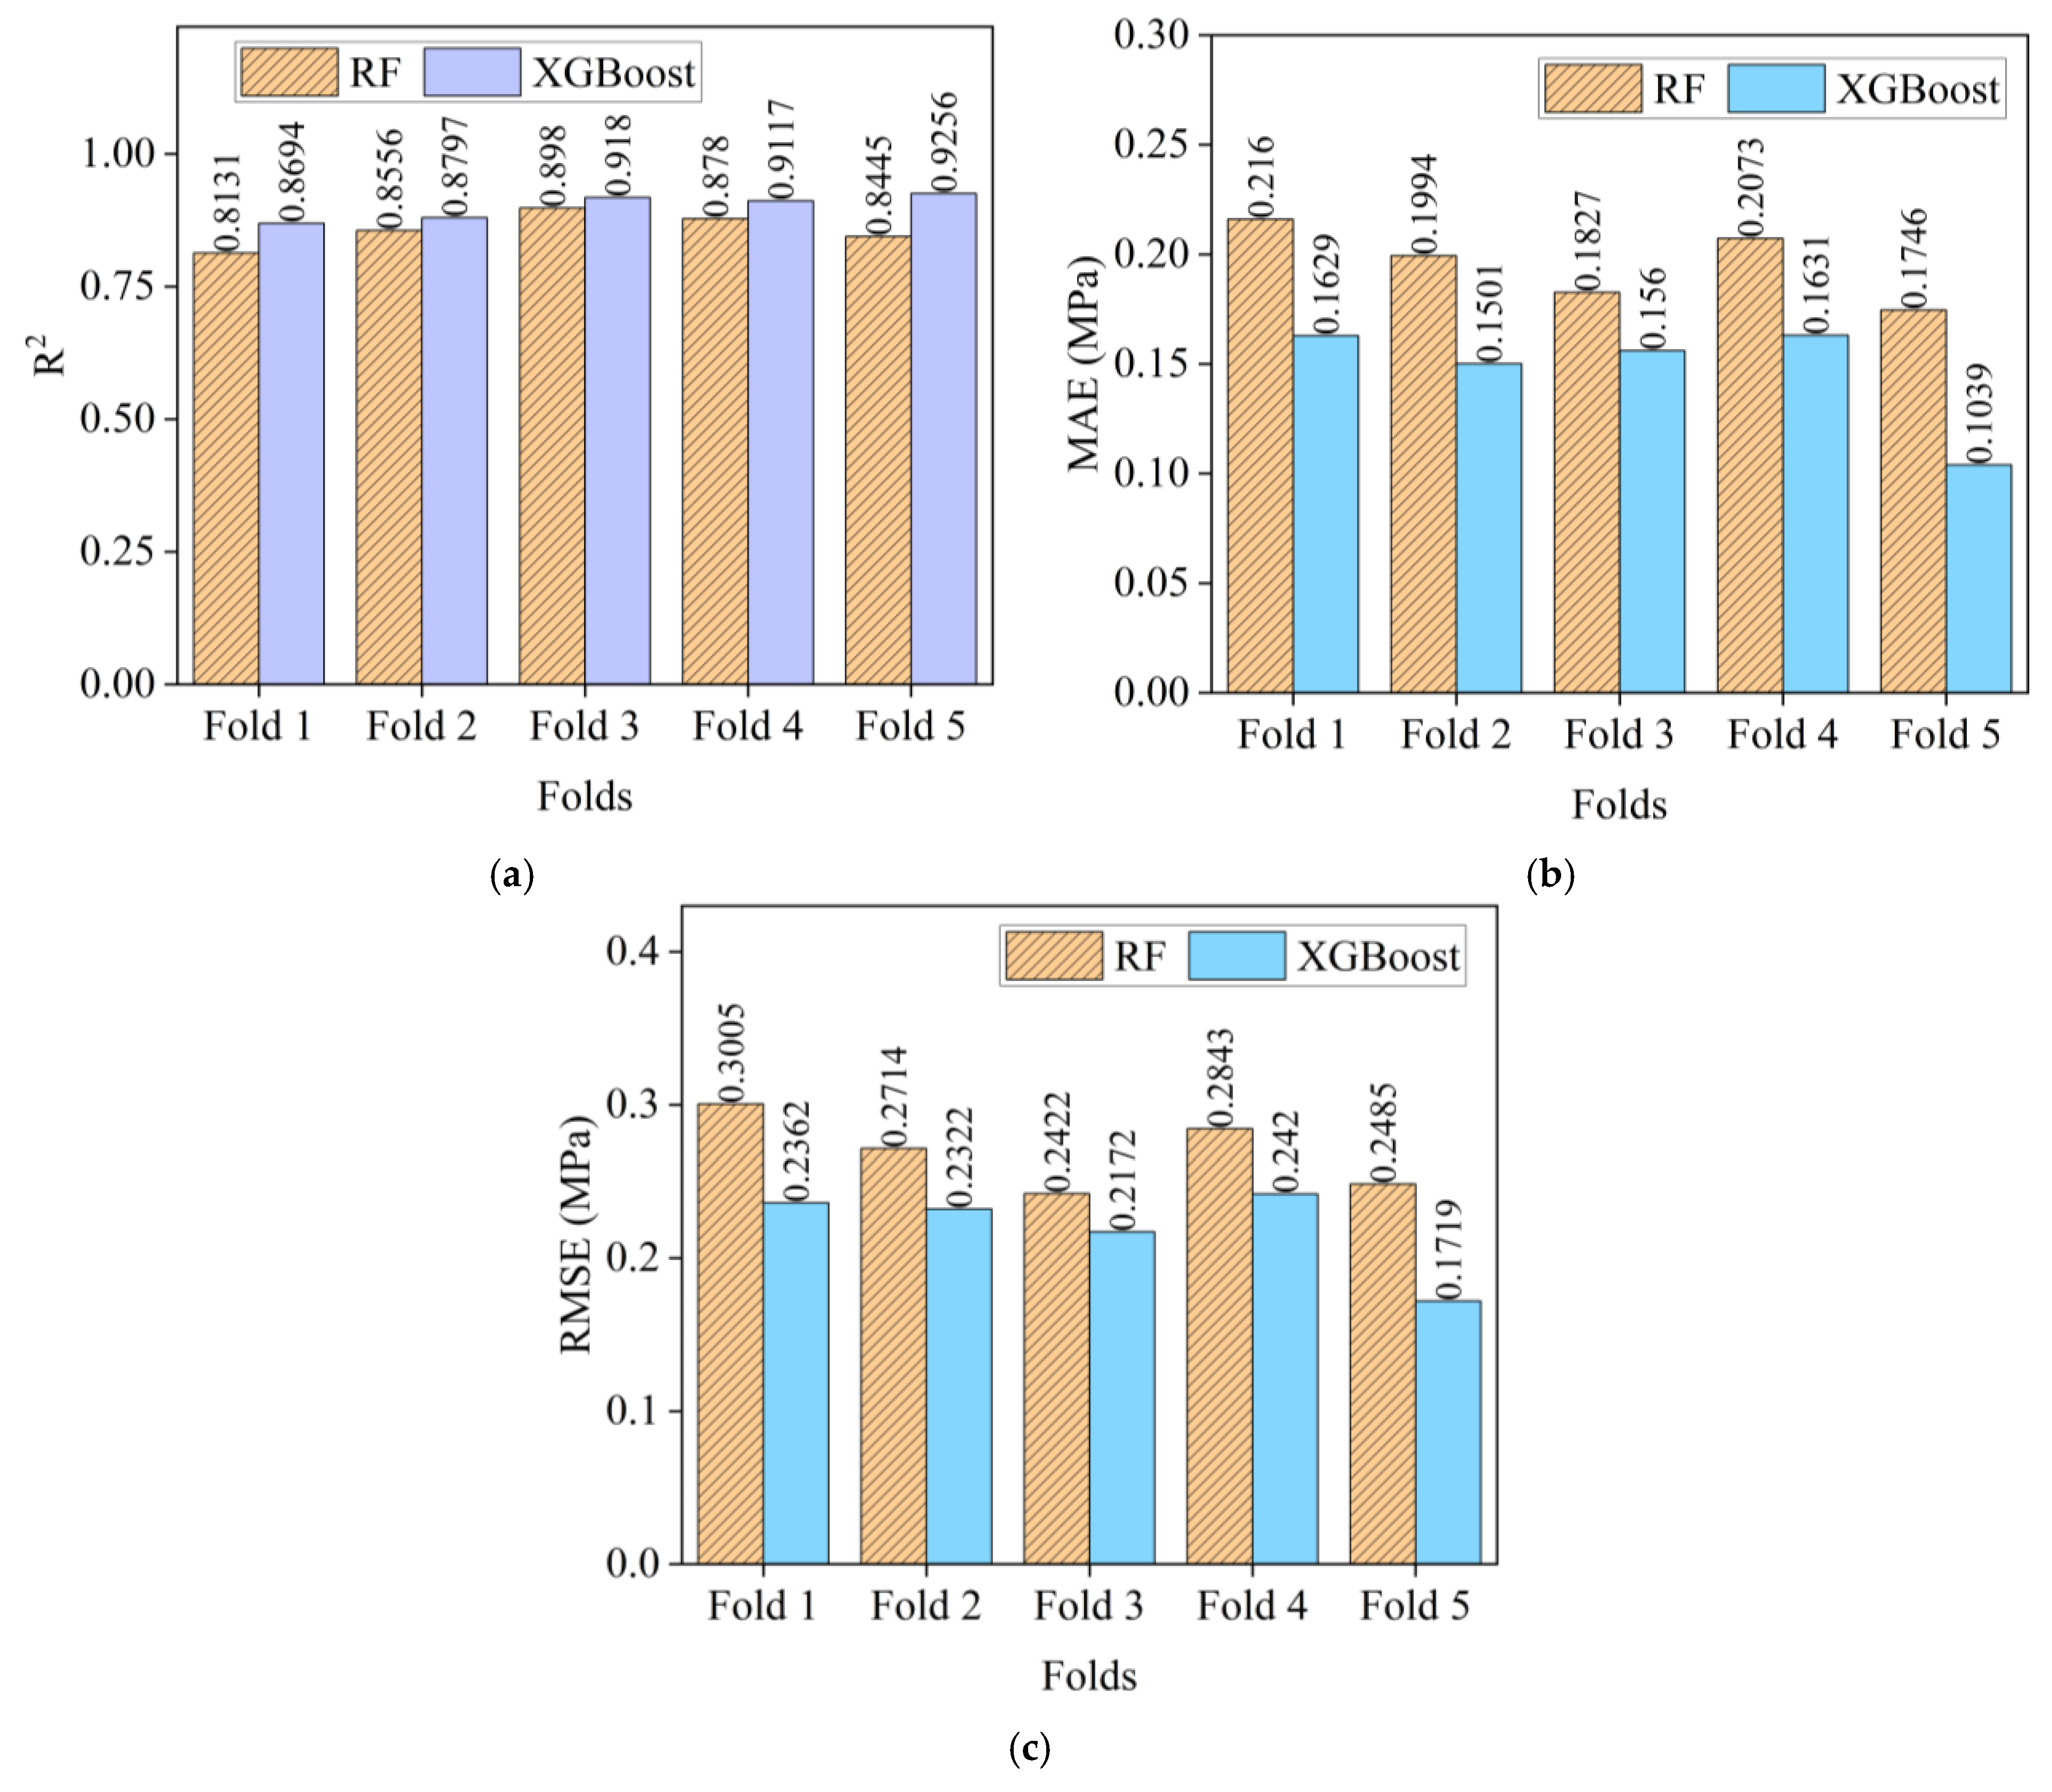
The cross-validation results for CS prediction models are shown in Figure 17. The 5-fold cross-validation results for predicting the tensile strength (TS) of concrete incorporating waste plastic indicate that both RF and XGBoost models are extremely efficient, with XGBoost displaying enhanced predictive accuracy and reliability. The XGBoost model attained a significantly superior mean R2 (0.9009 ± 0.0217) relative to the RF model (0.8578 ± 0.0296), demonstrating its expanded capacity to elucidate the variance in tensile strength. The performance superiority is further corroborated by the error metrics; XGBoost achieved a reduced mean MAE (0.1472 ± 0.0228) and a much lower mean RMSE (0.2199 ± 0.0256) compared to the RF model’s mean MAE (0.1960 ± 0.0147) and mean RMSE (0.2694 ± 0.0214). The superior mean R2 and reduced mean errors, along with competitive standard deviations, position XGBoost as the most robust and dependable algorithm for this tensile strength prediction problem.
Figure 17.
Cross-validation for TS models: (a) R2; (b) MAE; (c) RMSE.
3.2.4. Feature Importance for TS Models
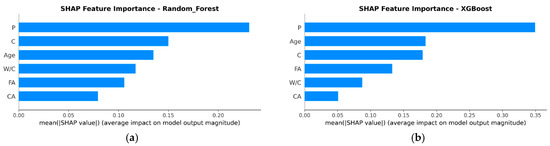
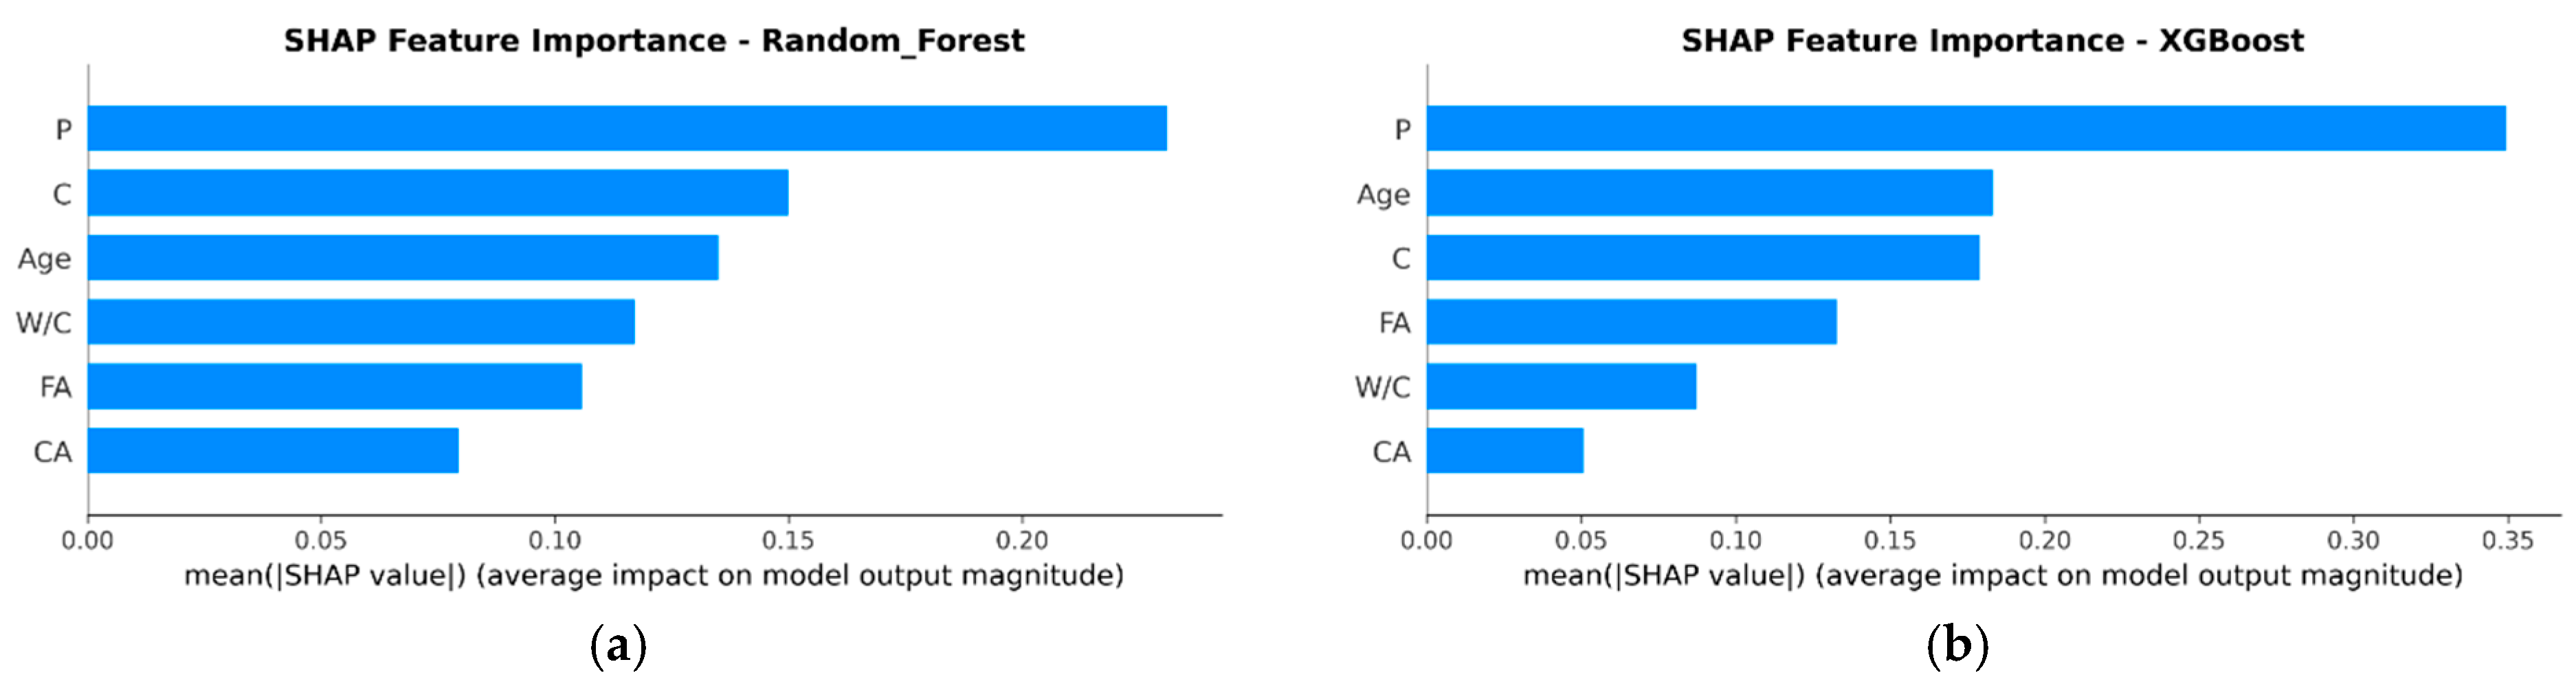
The SHAP features importance plots for tensile strength (TS) in Figure 18 identify the principal determinants for predicting the TS of P waste concrete in both the RF and XGBoost models. Both models consistently recognize plastic content (P) as the most significant feature, indicating that it exerts the highest average impact on the model’s prediction and is the principal determinant of tensile strength. Nonetheless, the models vary in their evaluations of supplementary features. The RF model designates cement content (C) as the second most significant element, succeeded by age, while the XGBoost model elevates age above cement content. This suggests that the XGBoost algorithm captures a stronger non-linear relationship between curing time and tensile strength development. The agreement on plastic content as the primary characteristic offers vital insight for mix design, highlighting that regulating the plastic waste replacement level is the most critical factor for influencing the tensile performance of P waste concrete.
Figure 18.
Feature importance for TS models: (a) RF; (b) XGBoost.
3.2.5. Enhanced Explainability of the Developed TS Models
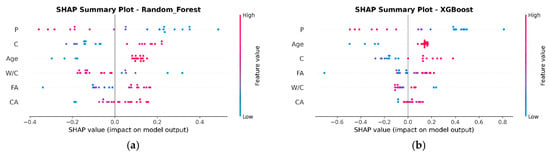
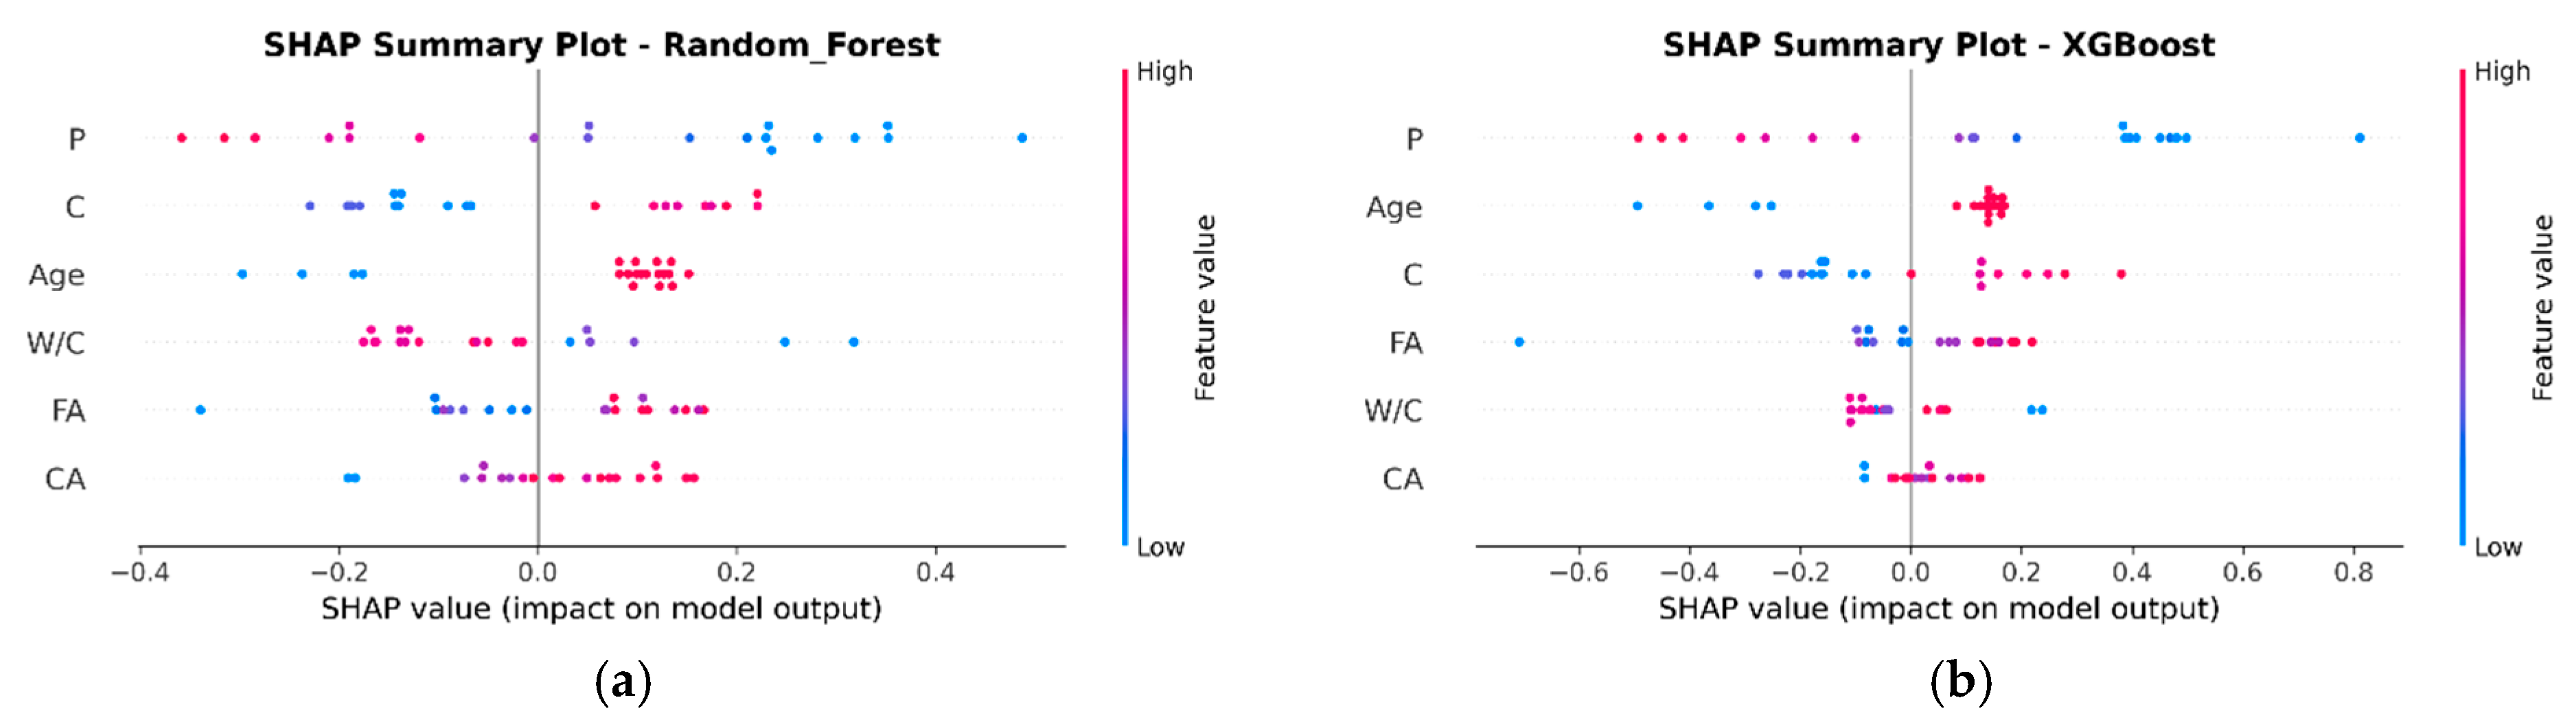
The SHAP summary graphs in Figure 19 distinctly illustrate the factors affecting TS predictions of P waste concrete and their corresponding implications for both developed models. In the RF model (a), the plastic content (P) emerges as the most significant feature, exhibiting mostly negative SHAP values, which suggest that increased plastic content typically results in a decrease in the tensile strength. This is succeeded by cement content (C) and age, which exhibit a combination of positive and negative effects. In the XGBoost model (b), the plastic content (P) has the same attribute as in the RF model. The plot designates the age of the concrete, exerting a substantial positive influence on tensile strength, markedly enhancing the model output. In this model, plastic content (P) is a significant determinant; however, it is subordinate to age.
Figure 19.
SHAP plot for TS: (a) RF; (b) XGBoost.
The SHAP analysis underscores the detrimental effect of plastic content as a vital design principle for sustainable concrete, illustrating how to modify other parameters, such as cement content, to mitigate strength loss while enabling greater plastic integration.
3.2.6. Comparison of Proposed TS Models with Previous Models
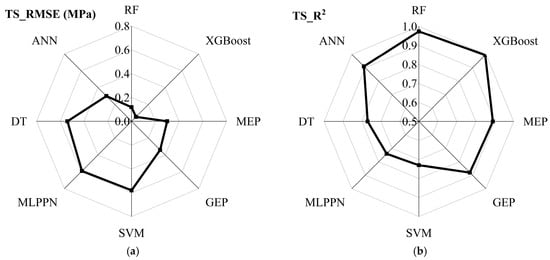
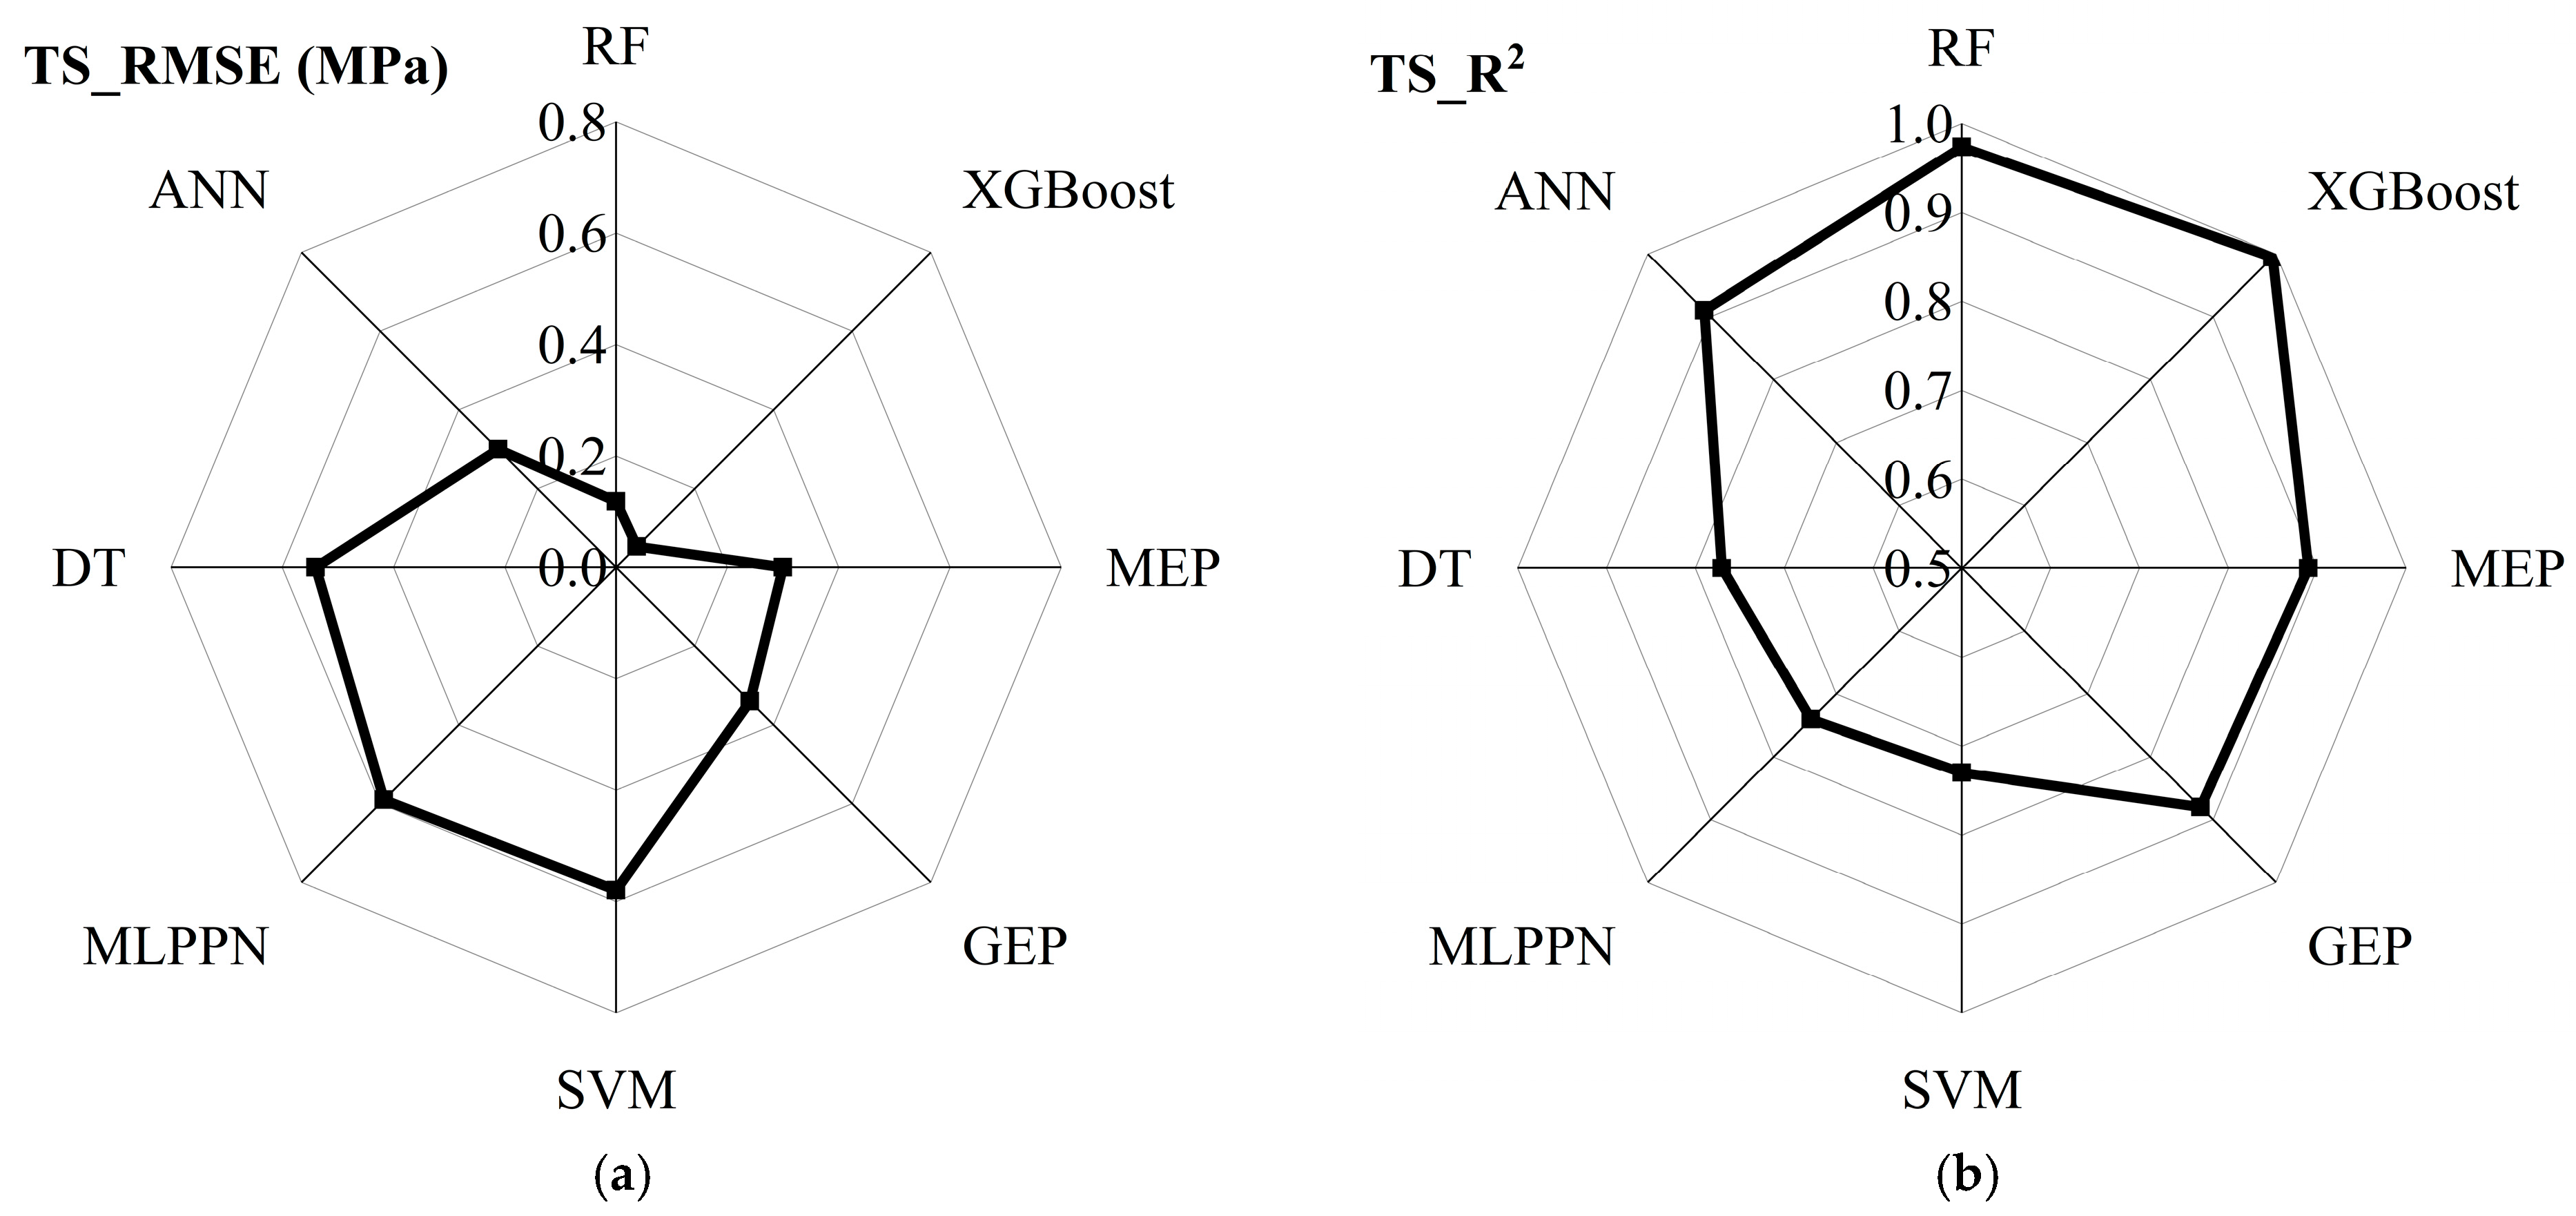
Figure 20 shows the comparison between developed models with existing models: GEP [40], MEP [40], DT [41], MLPNN [41], SVM [41], and ANN [42]. The performance metrics in Figure 20 indicate that the developed RF and XGBoost models with PSO using the dataset in this study significantly outperform the previous models in forecasting the tensile strength of plastic waste concrete but with their respective datasets. The XGBoost model stands out as the most precise and dependable, attaining an extraordinary R2 of 0.9947 and an impressively low RMSE of 0.0528, substantially surpassing all other methodologies. The RF model has exceptional performance (R2 = 0.9737, RMSE = 0.1182), positioning it as a robust second. Conversely, the preceding models, such as MEP, GEP, and a referenced ANN, demonstrate reasonable accuracy (R2: 0.88–0.91, RMSE: 0.3–0.34), but the DT, SVM, and MLPNN models from the literature display inferior performance, with R2 values falling below 0.77 and elevated RMSE values above 0.54. This comparison unequivocally demonstrates that the sophisticated ensemble methods, particularly RF and XGBoost, provide a substantial enhancement in predicting accuracy compared to conventional machine learning algorithms and other evolutionary and neural network techniques previously utilized for this issue.
Figure 20.
Comparison of proposed TS models with previous models: (a) RMSE; (b) R2.
3.3. Graphical User Interface (GUI)
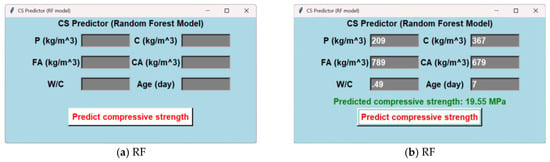
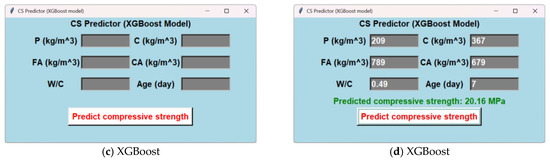
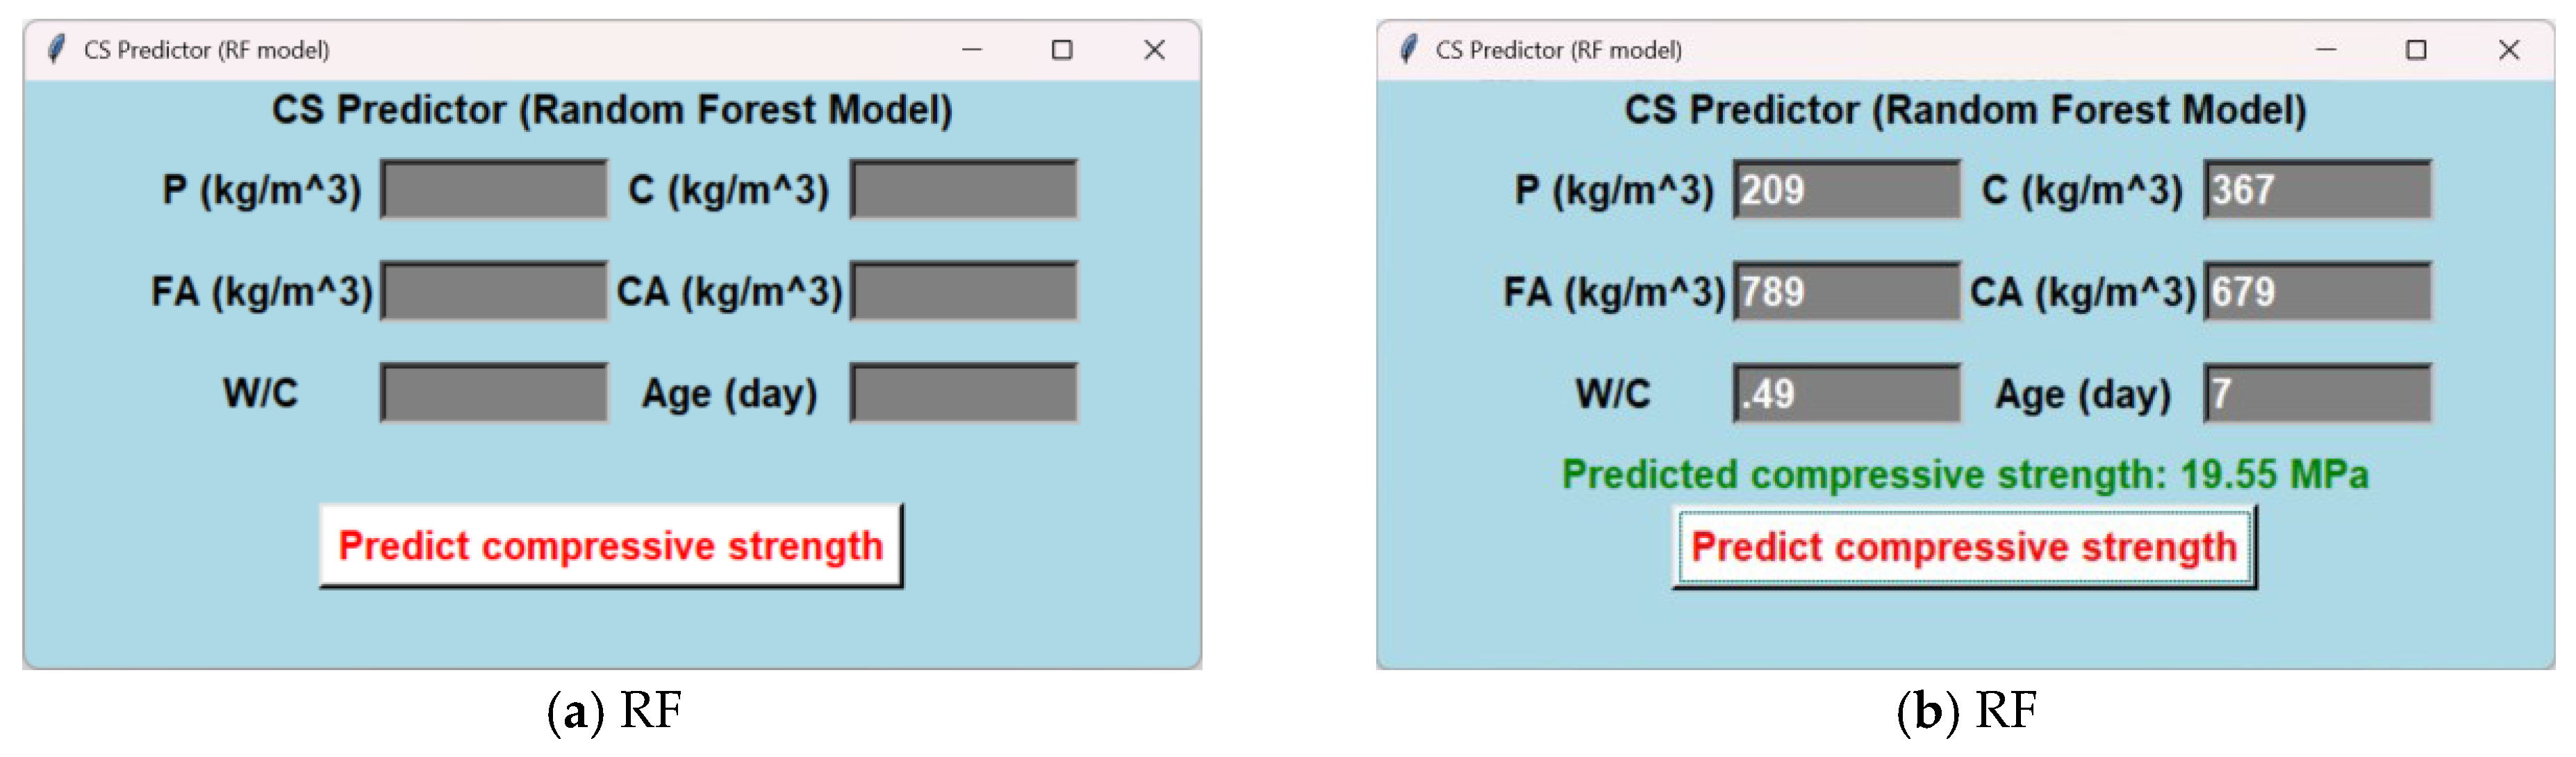
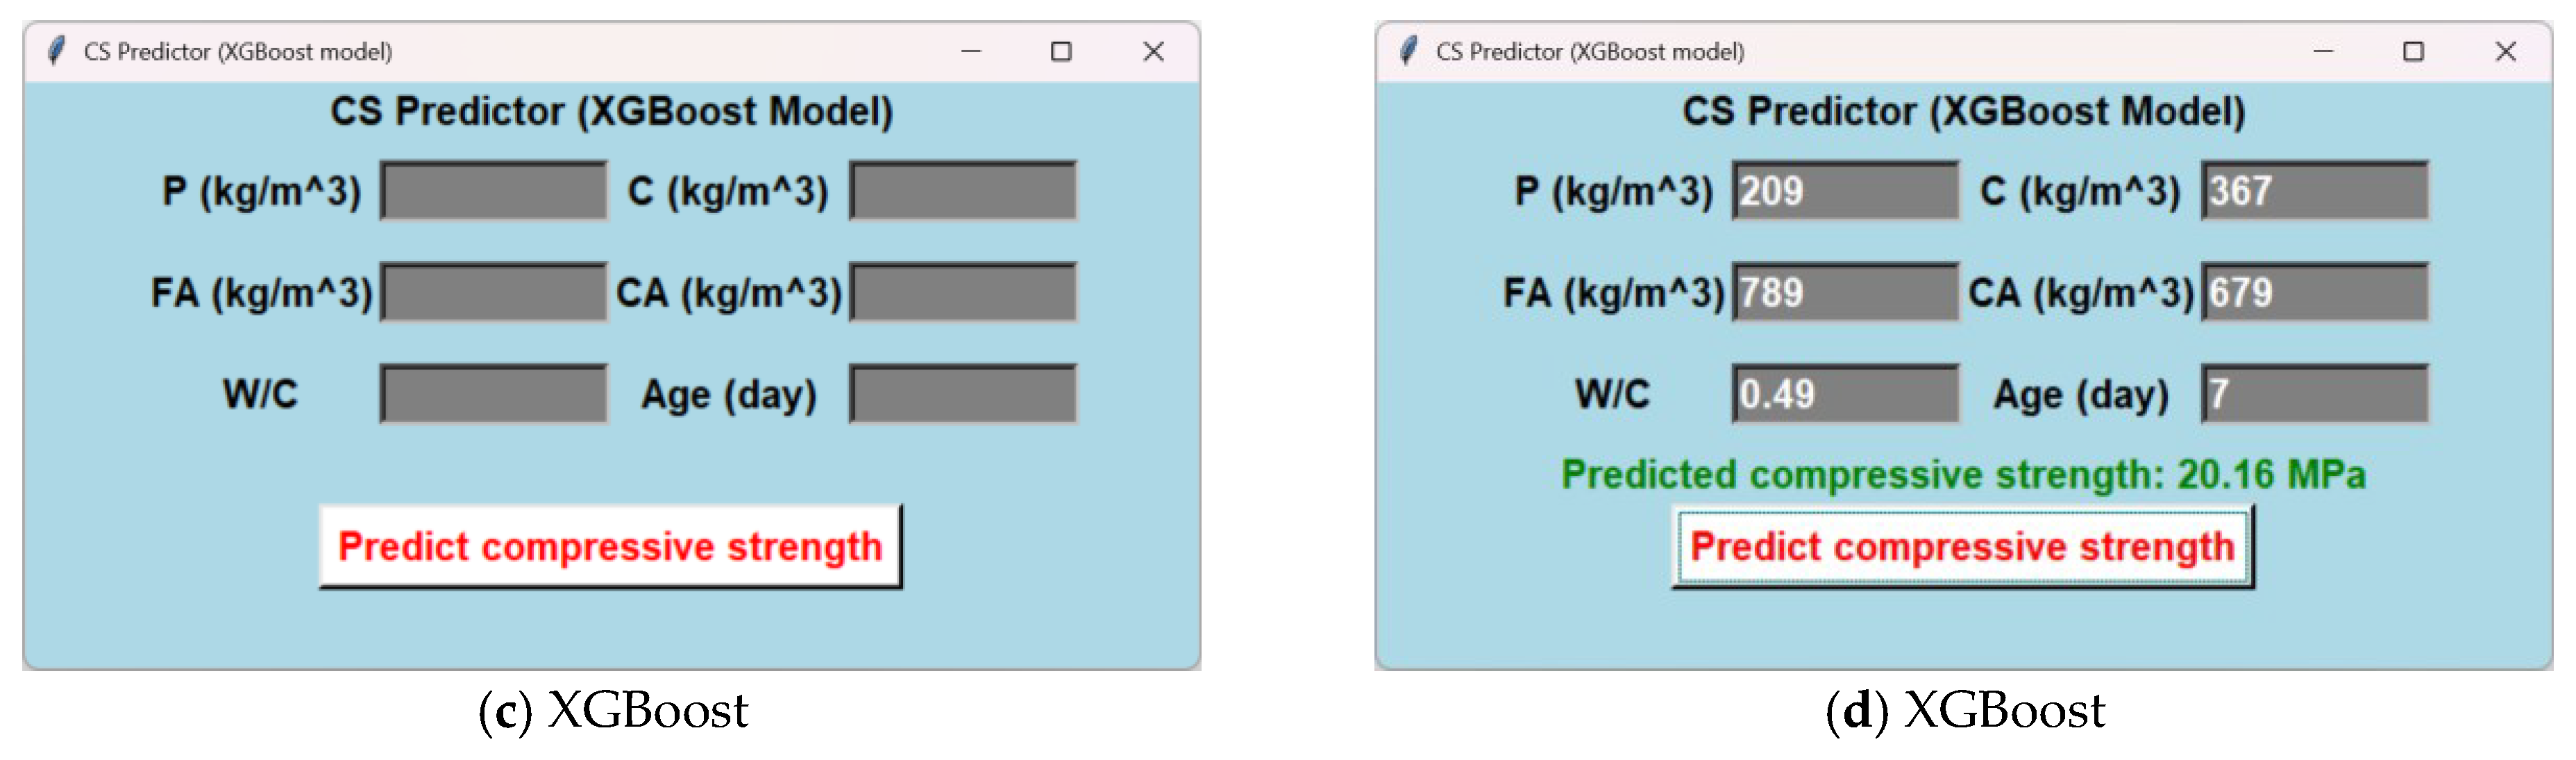
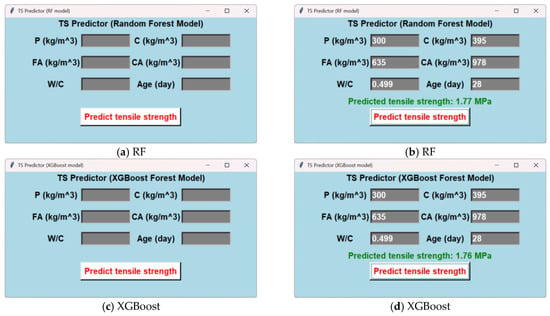
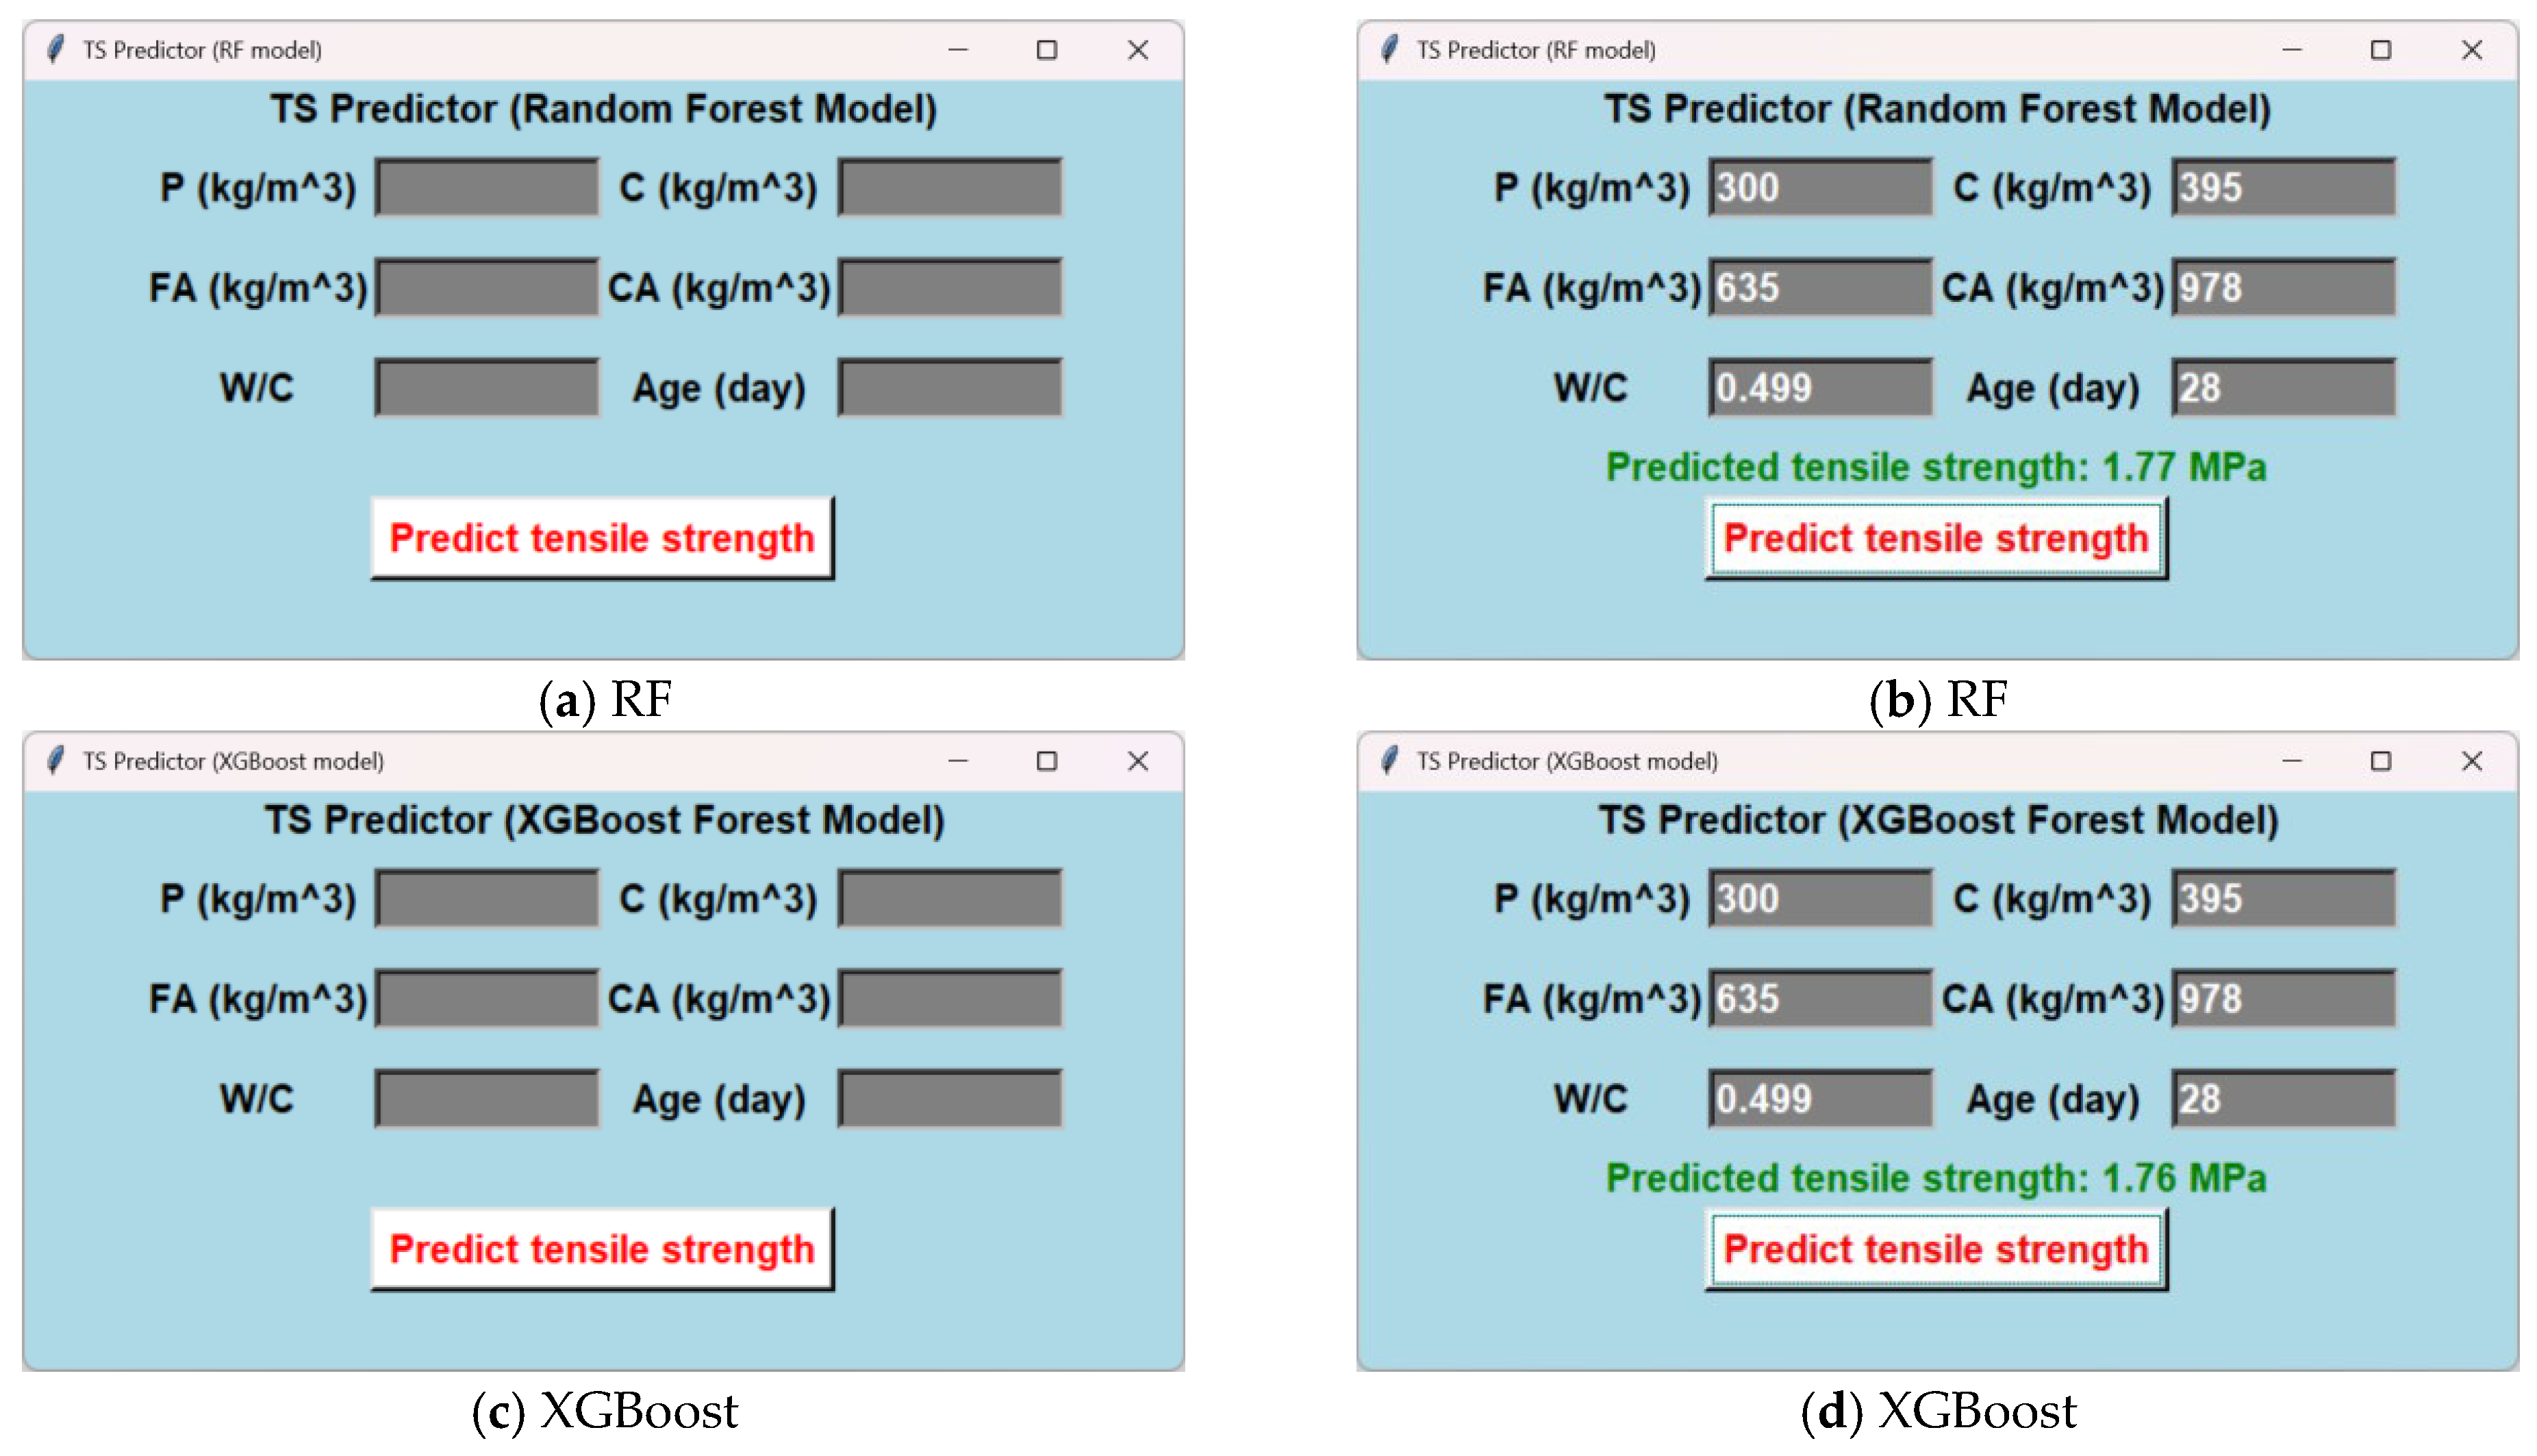
The developed Graphical User Interface (GUI) shown in Figure 21 and Figure 22 offers an intuitive and effective platform for predicting CS and TS of P waste concrete using the advanced machine learning models RF and XGBoost. The design is organized into separate, well-named sections for each strength property. The interface’s core has input fields for essential concrete mix parameters, including the amounts of plastic waste (P waste), cement (C), water-to-cement ratio (W/C), coarse aggregate (CA), fine aggregate (FA), and curing age of concrete (Age), allowing users to precisely specify their mixture design. Upon inputting the data and commencing the prediction, the resultant strength is dynamically computed and presented in a designated output field. This efficient and user-friendly GUI successfully connects intricate prediction models with practical application, enabling engineers and researchers to swiftly acquire data-driven strength estimations without necessitating specialist programming expertise.
Figure 21.
Graphical User Interface (GUI) for CS.
Figure 22.
Graphical User Interface (GUI) for TS.
4. Recommendations, Limitations, and Suggested Future Studies
This study establishes a robust predictive framework for the mechanical properties of concrete containing plastic waste; however, it has several limitations that suggest opportunities for future research. The primary limitations and associated recommendations for future research are detailed below. The prediction models created in this study are constrained by restrictions intrinsic to their dataset. The dataset was assembled from several literary sources, resulting in intrinsic heterogeneity. Despite being alleviated through data cleaning and preprocessing, it persists as a limitation. The principal proof for the XGBoost model’s advantage lies in its performance relative to our Random Forest benchmark and its exhibited higher generalization on our assembled dataset, rather than a direct comparison with models from various publications. Secondly, although plastic content was a crucial input feature, the models did not include specific parameters for plastic polymer type (e.g., PET, PE, PP), density, and particle geometry (e.g., shape, size) due to uneven reporting in the source data. These factors are known to substantially affect mechanical performance. Consequently, a vital recommendation is for future research to integrate comprehensive datasets that systematically encompass plastic taxonomy and material characteristics as explicit variables to create more refined and generally applicable models. A major constraint of this study is its exclusive emphasis on mechanical properties. The primary objective of sustainable mix design necessitates the concurrent evaluation of environmental performance. Consequently, a principal focus for future endeavors is the amalgamation of this machine learning predictive framework with a Life Cycle Assessment (LCA) module. The built machine learning framework functions as a fundamental tool for this subsequent phase. Subsequent efforts will entail integrating predictive models with a life cycle assessment database to develop a comprehensive design tool. This tool facilitates the development of multi-objective optimization problems, enabling a designer to ascertain mix proportions that attain a specified strength while concurrently reducing environmental impacts, such as by boosting waste plastic content and limiting cement usage. This approach would guarantee other essential attributes, such as tensile strength, adhere to permissible parameters and conform to structural design codes. This method would enable engineers to immediately optimize for the ‘lowest carbon mix that satisfies the required mechanical qualities,’ thereby integrating material informatics with sustainable engineering.
5. Conclusions
Waste plastic presents considerable environmental risks owing to its non-biodegradable characteristics, necessitating sustainable management methods. This study offers robust predictive models utilizing hybrid RF with PSO and XGBoost with PSO to assess CS and TS of plastic waste concrete. The results of this investigation are as follows:
- Statistical analyses indicated that XGBoost model with PSO outperforms the RF model with PSO, exhibiting superior accuracy along with desirable R2 values in both datasets.
- The XGBoost model demonstrates superior predictive accuracy and generalization capability for both CS and TS of plastic waste concrete when compared to the RF model. XGBoost achieved exceptional R2 values for compressive strength (0.9911 in training and 0.9081 in testing) and markedly diminished error metrics in MAE, RMSE, and MAPE across both datasets.
- The XGBoost model outperformed the RF in tensile strength, with an exceptional training R2 of 0.9947 and a superior testing R2 of 0.8947, along with significantly reduced errors. Although both models exhibited a discernible reduction in performance on the testing data, the XGBoost model consistently demonstrated diminished degradation, indicating its improved robustness and reliability.
- Error analysis indicates that most projected values from the RF and XGBoost models remain within acceptable error margins for CS and TS, hence affirming their dependability. Both the RF and XGBoost models exhibit remarkable predictive proficiency, with XGBoost showing superior accuracy. Thus, XGBoost is acknowledged as the preeminent and dependable machine learning technique for sustainable P waste concrete mechanical properties predictions.
- The used dual-target and dual-model explainability methodology provided profound and resilient insights into the governing factors. The SHAP analysis demonstrates the substantial impact of plastic content on the model’s predictions, highlighting its critical role in the precise estimation of CS and TS.
- The XGBoost model for CS demonstrated a significant performance enhancement, resulting in a 0.65 MPa reduction in RMSE and a 0.015 increase in R2 compared to RF, while markedly surpassing all other models, including GEP, MEP, DT, MLPNN, SVM, and ANN, with RMSE reductions ranging from 3.04 to 5.90 MPa and R2 improvements between 0.09 and 0.24.
- The XGBoost model for TS demonstrated a significant performance enhancement, resulting in a 0.0654 MPa reduction in RMSE and a 0.021 increase in R2 compared to RF, while markedly surpassing all other models, including GEP, MEP, DT, MLPNN, SVM, and ANN, with RMSE reductions ranging from 0.2472 to 0.5372 MPa and R2 improvements between 0.0847 and 0.2647.
- Although comparing models trained on different datasets presents inherent challenges, the proposed models, the RF and XGBoost models with PSO, exhibit superior predictive performance when applied to the entire dataset, surpassing the existing models, including GEP, MEP, DT, MLPNN, SVM, and ANN, on their respective datasets. This indicates that our modeling methodology, in conjunction with the attributes of our data, more effectively encapsulates the fundamental mechanics of CS and TS of concrete containing P waste.
Author Contributions
Conceptualization, H.A.D.; methodology, H.A.D. and M.K.A.; software, H.A.D.; validation, H.A.D. and M.K.A.; formal analysis, H.A.D.; investigation, H.A.D. and M.K.A.; resources, H.A.D. and M.K.A.; data curation, H.A.D.; writing—original draft preparation, H.A.D.; writing—review and editing, M.K.A.; visualization, H.A.D.; supervision, M.K.A.; project administration, H.A.D.; funding acquisition, M.K.A. All authors have read and agreed to the published version of the manuscript.
Funding
This research received no external funding.
Data Availability Statement
Data will be available on request.
Acknowledgments
The researchers would like to thank the Deanship of Graduate Studies and Scientific Research at Qassim University for financial support (QU-APC-2025).
Conflicts of Interest
The authors declare no conflicts of interest.
References
- Duis, K.; Coors, A. Microplastics in the Aquatic and Terrestrial Environment: Sources (with a Specific Focus on Personal Care Products), Fate and Effects. Environ. Sci. Eur. 2016, 28, 2. [Google Scholar] [CrossRef] [Scilit]
- Song, X.; Wang, W.; Deng, Y.; Su, Y.; Jia, F.; Zaheer, Q.; Long, X. Data-Driven Modeling for Residual Velocity of Projectile Penetrating Reinforced Concrete Slabs. Eng. Struct. 2024, 306, 117761. [Google Scholar] [CrossRef] [Scilit]
- Li, W.C.; Tse, H.F.; Fok, L. Plastic Waste in the Marine Environment: A Review of Sources, Occurrence and Effects. Sci. Total Environ. 2016, 566–567, 333–349. [Google Scholar] [CrossRef] [Scilit] [PubMed]
- Valderrama, C.; Granados, R.; Cortina, J.L.; Gasol, C.M.; Guillem, M.; Josa, A. Implementation of Best Available Techniques in Cement Manufacturing: A Life-Cycle Assessment Study. J. Clean. Prod. 2012, 25, 60–67. [Google Scholar] [CrossRef] [Scilit]
- Shiuly, A.; Hazra, T.; Sau, D.; Maji, D. Performance and Optimisation Study of Waste Plastic Aggregate Based Sustainable Concrete—A Machine Learning Approach. Clean. Waste Syst. 2022, 2, 100014. [Google Scholar] [CrossRef] [Scilit]
- Alqahtani, F.K.; Abotaleb, I.S.; Harb, S. LEED Study of Green Lightweight Aggregates in Construction. Sustainability 2021, 13, 1395. [Google Scholar] [CrossRef] [Scilit]
- Iftikhar, B.; Alih, S.C.; Vafaei, M.; Ali, M.; Javed, M.F.; Asif, U.; Ismail, M.; Umer, M.; Gamil, Y.; Amran, M. Experimental Study on the Eco-Friendly Plastic-Sand Paver Blocks by Utilising Plastic Waste and Basalt Fibers. Heliyon 2023, 9, e17107. [Google Scholar] [CrossRef] [Scilit]
- Dahish, H.A.; Alkharisi, M.K. Hybrid Fiber Reinforcement in HDPE–Concrete: Predictive Analysis of Fresh and Hardened Properties Using Response Surface Methodology. Buildings 2024, 14, 3479. [Google Scholar] [CrossRef] [Scilit]
- Marzouk, O.Y.; Dheilly, R.M.; Queneudec, M. Valorization of Post-Consumer Waste Plastic in Cementitious Concrete Composites. Waste Manag. 2007, 27, 310–318. [Google Scholar] [CrossRef] [Scilit] [PubMed]
- Rahmani, E.; Dehestani, M.; Beygi, M.H.A.; Allahyari, H.; Nikbin, I.M. On the Mechanical Properties of Concrete Containing Waste PET Particles. Constr. Build. Mater. 2013, 47, 1302–1308. [Google Scholar] [CrossRef] [Scilit]
- Ersan, Y.C.; Gulcimen, S.; Imis, T.N.; Saygin, O.; Uzal, N. Life Cycle Assessment of Lightweight Concrete Containing Recycled Plastics and Fly Ash. Eur. J. Environ. Civ. Eng. 2022, 26, 2722–2735. [Google Scholar] [CrossRef] [Scilit]
- Awoyera, P.O.; Adesina, A. Plastic Wastes to Construction Products: Status, Limitations and Future Perspective. Case Stud. Constr. Mater. 2020, 12, e00330. [Google Scholar] [CrossRef] [Scilit]
- Alyousef, R.; Rehman, M.F.; Khan, M.; Fawad, M.; Khan, A.U.; Hassan, A.M.; Ghamry, N.A. Machine Learning-Driven Predictive Models for Compressive Strength of Steel Fiber Reinforced Concrete Subjected to High Temperatures. Case Stud. Constr. Mater. 2023, 19, e02418. [Google Scholar] [CrossRef] [Scilit]
- Sun, H.; Amin, M.N.; Qadir, M.T.; Arifeen, S.U.; Iftikhar, B.; Althoey, F. Investigating the Effectiveness of Carbon Nanotubes for the Compressive Strength of Concrete Using AI-Aided Tools. Case Stud. Constr. Mater. 2024, 20, e03083. [Google Scholar] [CrossRef] [Scilit]
- Dahish, H.A.; Alkharisi, M.K. Predicting the Properties of Polypropylene Fiber Recycled Aggregate Concrete Using Response Surface Methodology and Machine Learning. Buildings 2025, 15, 3709. [Google Scholar] [CrossRef] [Scilit]
- Dahish, H.A.; Alturki, M. Predicting the Effects of Nano Additives and Elevated Temperatures on Concrete Compressive Strength Utilizing Machine Learning. Buildings 2025, 15, 3349. [Google Scholar] [CrossRef] [Scilit]
- Dahish, H.A.; Alfawzan, M.S.; Tayeh, B.A.; Abusogi, M.A.; Bakri, M. Effect of Inclusion of Natural Pozzolan and Silica Fume in Cement—Based Mortars on the Compressive Strength Utilizing Artificial Neural Networks and Support Vector Machine. Case Stud. Constr. Mater. 2023, 18, e02153. [Google Scholar] [CrossRef] [Scilit]
- Huang, T.; Liu, T.; Ai, Y.; Ren, Z.; Ou, J.; Li, Y.; Xu, N. Modelling the Interface Bond Strength of Corroded Reinforced Concrete Using Hybrid Machine Learning Algorithms. J. Build. Eng. 2023, 74, 106862. [Google Scholar] [CrossRef] [Scilit]
- Karim, R.; Islam, M.H.; Datta, S.D.; Kashem, A. Synergistic Effects of Supplementary Cementitious Materials and Compressive Strength Prediction of Concrete Using Machine Learning Algorithms with SHAP and PDP Analyses. Case Stud. Constr. Mater. 2024, 20, e02828. [Google Scholar] [CrossRef] [Scilit]
- Asif, U.; Javed, M.F.; Abuhussain, M.; Ali, M.; Khan, W.A.; Mohamed, A. Predicting the Mechanical Properties of Plastic Concrete: An Optimization Method by Using Genetic Programming and Ensemble Learners. Case Stud. Constr. Mater. 2024, 20, e03135. [Google Scholar] [CrossRef] [Scilit]
- Khan, A.; Khan, M.; Ali, M.; Khan, M.; Khan, A.U.; Shakeel, M.; Fawad, M.; Najeh, T.; Gamil, Y. Predictive Modeling for Depth of Wear of Concrete Modified with Fly Ash: A Comparative Analysis of Genetic Programming-Based Algorithms. Case Stud. Constr. Mater. 2024, 20, e02744. [Google Scholar] [CrossRef] [Scilit]
- Asif, U.; Javed, M.F.; Alyami, M.; Hammad, A.W. Performance Evaluation of Concrete Made with Plastic Waste Using Multi-Expression Programming. Mater. Today Commun. 2024, 39, 108789. [Google Scholar] [CrossRef] [Scilit]
- Anaconda Inc. Anaconda Individual Edition, Anaconda Website. Available online: https://www.anaconda.com/products/individual (accessed on 14 January 2025).
- Belmokaddem, M.; Mahi, A.; Senhadji, Y.; Pekmezci, B.Y. Mechanical and Physical Properties and Morphology of Concrete Containing Plastic Waste as Aggregate. Constr. Build. Mater. 2020, 257, 119559. [Google Scholar] [CrossRef] [Scilit]
- Juki, M.I.; Awang, M.; Annas, M.M.K.; Boon, K.H.; Othman, N.; binti Abdul Kadir, A.; Roslan, M.A.; Khalid, F.S. Relationship between Compressive, Splitting Tensile and Flexural Strength of Concrete Containing Granulated Waste Polyethylene Terephthalate (PET) Bottles as Fine Aggregate. Adv. Mat. Res. 2013, 795, 356–359. [Google Scholar] [CrossRef] [Scilit]
- Mohammed, A.A.; Mohammed, I.I.; Mohammed, S.A. Some Properties of Concrete with Plastic Aggregate Derived from Shredded PVC Sheets. Constr. Build. Mater. 2019, 201, 232–245. [Google Scholar] [CrossRef] [Scilit]
- Senthil Kumar, K.; Baskar, K. Recycling of E-Plastic Waste as a Construction Material in Developing Countries. J. Mater. Cycles Waste Manag. 2015, 17, 718–724. [Google Scholar] [CrossRef] [Scilit]
- Rai, B.; Rushad, S.T.; Kr, B.; Duggal, S.K. Study of Waste Plastic Mix Concrete with Plasticizer. ISRN Civ. Eng. 2012, 2012, 469272. [Google Scholar] [CrossRef] [Scilit]
- Thorneycroft, J.; Orr, J.; Savoikar, P.; Ball, R.J. Performance of Structural Concrete with Recycled Plastic Waste as a Partial Replacement for Sand. Constr. Build. Mater. 2018, 161, 63–69. [Google Scholar] [CrossRef] [Scilit]
- Bhogayata, A.C.; Arora, N.K. Fresh and Strength Properties of Concrete Reinforced with Metalized Plastic Waste Fibers. Constr. Build. Mater. 2017, 146, 455–463. [Google Scholar] [CrossRef] [Scilit]
- Mary Treasa Shinu, N.M.; Needhidasan, S. An Experimental Study of Replacing Conventional Coarse Aggregate with E-Waste Plastic for M40 Grade Concrete Using River Sand. Mater. Today Proc. 2020, 22, 633–638. [Google Scholar] [CrossRef] [Scilit]
- Jaivignesh, B.; Sofi, A. Study on Mechanical Properties of Concrete Using Plastic Waste as an Aggregate. IOP Conf. Ser. Earth Environ. Sci. 2017, 80, 012016. [Google Scholar] [CrossRef] [Scilit]
- Ahmad, F.; Jamal, A.; Mazher, K.M.; Umer, W.; Iqbal, M. Performance Evaluation of Plastic Concrete Modified with E-Waste Plastic as a Partial Replacement of Coarse Aggregate. Materials 2021, 15, 175. [Google Scholar] [CrossRef] [Scilit]
- Adnan, H.M.; Dawood, A.O. Recycling of Plastic Box Waste in the Concrete Mixture as a Percentage of Fine Aggregate. Constr. Build. Mater. 2021, 284, 122666. [Google Scholar] [CrossRef] [Scilit]
- Almeshal, I.; Tayeh, B.A.; Alyousef, R.; Alabduljabbar, H.; Mohamed, A.M. Eco-Friendly Concrete Containing Recycled Plastic as Partial Replacement for Sand. J. Mater. Res. Technol. 2020, 9, 4631–4643. [Google Scholar] [CrossRef] [Scilit]
- Tota-Maharaj, K.; Adeleke, B.O.; Nounu, G. Effects of Waste Plastics as Partial Fine-Aggregate Replacement for Reinforced Low-Carbon Concrete Pavements. Int. J. Sustain. Eng. 2022, 15, 192–207. [Google Scholar] [CrossRef] [Scilit]
- Alyami, M.; Khan, M.; Fawad, M.; Nawaz, R.; Hammad, A.W.A.; Najeh, T.; Gamil, Y. Predictive Modeling for Compressive Strength of 3D Printed Fiber-Reinforced Concrete Using Machine Learning Algorithms. Case Stud. Constr. Mater. 2024, 20, e02728. [Google Scholar] [CrossRef] [Scilit]
- Khan, M.; Nassar, R.-U.-D.; Anwar, W.; Rasheed, M.; Najeh, T.; Gamil, Y.; Farooq, F. Forecasting the Strength of Graphene Nanoparticles-Reinforced Cementitious Composites Using Ensemble Learning Algorithms. Results Eng. 2024, 21, 101837. [Google Scholar] [CrossRef] [Scilit]
- Eberhart, R.; Kennedy, J. A New Optimizer Using Particle Swarm Theory. In Proceedings of the MHS’95. Proceedings of the Sixth International Symposium on Micro Machine and Human Science, Nagoya, Japan, 4–6 October 1995; IEEE: Piscataway, NJ, USA; pp. 39–43. [Google Scholar]
- Asif, U.; Javed, M.F.; Alsekait, D.M.; Aslam, F.; Elminaam, D.S.A. Data-Driven Evolutionary Programming for Evaluating the Mechanical Properties of Concrete Containing Plastic Waste. Case Stud. Constr. Mater. 2024, 21, e03763. [Google Scholar] [CrossRef] [Scilit]
- Nafees, A.; Khan, S.; Javed, M.F.; Alrowais, R.; Mohamed, A.M.; Mohamed, A.; Vatin, N.I. Forecasting the Mechanical Properties of Plastic Concrete Employing Experimental Data Using Machine Learning Algorithms: DT, MLPNN, SVM, and RF. Polymers 2022, 14, 1583. [Google Scholar] [CrossRef] [Scilit]
- Sau, D.; Shiuly, A.; Hazra, T. Study on Green Concrete Replacing Natural Fine and Coarse Aggregate by Plastic Waste—An Experimental and Machine Learning Approach. Mater. Today Proc. 2023; in press. [CrossRef] [Scilit]

Disclaimer/Publisher’s Note: The statements, opinions and data contained in all publications are solely those of the individual author(s) and contributor(s) and not of MDPI and/or the editor(s). MDPI and/or the editor(s) disclaim responsibility for any injury to people or property resulting from any ideas, methods, instructions or products referred to in the content. |
© 2025 by the authors. Licensee MDPI, Basel, Switzerland. This article is an open access article distributed under the terms and conditions of the Creative Commons Attribution (CC BY) license (https://creativecommons.org/licenses/by/4.0/).