


Abstract
Understanding the relationship between urban fabrics and sustainability is essential for addressing contemporary urban challenges, as urban fabrics provide critical morphological and socio-economic data that enhance our understanding of the performance and spatial variability of urban systems. This study focuses on Cuenca, spatially divided into a 150 m radius hexagonal grid with 30 sustainability indicators and 18 urban fabric typologies. Using spatial, statistical, and visual analysis, relationships and patterns between sustainability indicators and urban fabric types are explored. The results reveal significant variation in sustainability across different fabric types, with built environment indicators playing a central role. There is marked spatial heterogeneity: inner-core areas exhibit higher sustainability, fringe areas lag behind, and transitional zones are also identified. Spatial clustering reveals that fabric types are homogeneous in terms of sustainability at both the high and low extremes but heterogeneous in mid-range sustainability areas. This quantitative analysis of Cuenca’s urban fabric typologies highlights substantial differences in sustainability and distinct spatial patterns, offering valuable insights for evidence-based urban planning. The open-source data and tools provided facilitate customisation and replication in other urban contexts.
1. Introduction
Urban sustainability is increasingly recognised as a key objective by planners, policymakers, and politicians, often framing it as a central feature of urban development models. Cities are the product of complex, evolving processes that span centuries of human and urban development, resulting in a diverse mosaic of urban fabric typologies, each characterised by distinct formal and functional attributes [1]. Urban fabrics contain crucial morphological and socio-economic data that deepen our understanding of urban system performance and spatial variability [1,2,3], making them essential for the study and advancement of urban sustainability [2].
Urban fabrics are defined as specific city areas with distinctive morphological characteristics that shape people’s experiences and behaviours, including perceptions of space, commuting choices, consumption patterns, and environmental performance [4]. Wheeler [4] classified urban fabrics into 27 types of “built landscapes”, defined as an “area of consistent form at a neighbourhood scale, often 1 square km or greater. This is an area large enough to determine much of a resident or user’s daily experience and has a significant influence on shaping resident behaviour” ([4], p. 167). However, urban fabrics alone do not directly indicate sustainability. Therefore, this paper aims to link urban fabric typologies with sustainability metrics, providing a more comprehensive framework for improving urban planning and quality of life. The granular scale of urban fabrics—spanning street, neighbourhood, and citizen levels—enables a more detailed analysis than city-wide studies, which often overlook the spatial heterogeneity of urban systems and populations. To this end, the study area is divided into 150 m radius hexagonal grid cells, adopting a spatially disaggregated approach.
Disaggregation is a central tenet of this study, aligned with the earlier definition of urban fabrics. The neighbourhood scale is widely regarded in the literature as a “suitable and self-sufficient” unit for analysing urban sustainability [5]. Additionally, the street, as a defining feature of urban fabric typologies [1], plays a crucial role in understanding urban form and function; some AI methods even derive typologies directly from street networks [6]. Street patterns, dating back to the ancient city of Uruk (circa 3000 BC) [7], have historically marked the boundaries between public and private spaces, a distinction preserved by the politics of collective ownership [8]. Streets embody the physical space where human scale is most directly experienced, and urban properties such as pedestrian traffic, neighbourhood form, and the complexity of urban design are deeply rooted in their spatial configuration. Furthermore, streetscape features—such as historic buildings, outdoor dining, and active uses—are integral to the daily lives of urban residents [9]. Thus, urban fabric typologies (UFTs) offer valuable insights into the street, neighbourhood, and human scales, reflecting the inherent heterogeneity and complexity of cities and their populations.
Addressing Sustainable Development Goals (SDGs) at the city level presents several challenges, including data collection, establishing indicators and metrics, monitoring, and implementation. A comprehensive assessment of urban sustainability must encompass quality of life factors, such as (dis)satisfaction with city living [10], urban imbalance and segregation [11,12], and evolving policies [13], among others. A common approach in urban sustainability research is the development of urban sustainability indicators (USIs) [14], covering areas from environmental and economic sustainability to equity and environmental justice at the city scale. USIs can be framed within the concept of “strong sustainability” [15], which focuses on “increasing the efficiency of resource consumption; (ii) harvesting renewable resources limited by their regeneration rates; (iii) reducing greenhouse gas emissions; (iv) reusing wastes as input in other processes; (v) replacing toxic inputs with organic ones; (vi) replacing energy from non-renewable sources with that from renewable ones; (vii) increasing affordability; and (viii) increasing sustainable manufacturing” [15].
Although substantial research has been conducted on urban sustainability indicators, the literature often overemphasises environmental factors at the expense of socio-economic dimensions [16,17], particularly in developing countries where social and economic issues are of greater concern [18]. Additionally, most global studies on urban sustainability treat the city as a homogeneous entity, using aggregate city-wide indicators that fail to account for spatial variability and the intrinsic heterogeneity of urban systems [19]. A more effective approach to addressing this limitation is to analyse urban sustainability at a disaggregated scale, focusing on urban fabrics. In this context, sustainability indicators must be applicable at the human scale, focusing on spatial units—such as streets and neighbourhoods—that people can recognise and relate to in their daily lives. This ensures that the metrics are meaningful and directed towards improving the quality of life for residents [19].
This paper focuses on Cuenca, Ecuador, as a case study of intermediate cities (with populations ranging from 100,000 to 500,000), as these cities represent the territories where most of the global urban population resides [20,21]. Intermediate cities are also a critical component of the “New Urban Agenda” established at Habitat III, recognised as essential for achieving the SDGs [22]. Moreover, selecting Cuenca addresses an important gap in the literature, as research on urban sustainability grounded in urban morphology is underrepresented in the Global South [23]. Given that cities are central to the 2030 Agenda, urban fabrics offer a valuable framework for assessing urban sustainability at the human scale, incorporating environmental, socio-cultural, and economic dimensions [3].
This paper aims to assess urban sustainability at the human scale, identifying spatially disaggregated intra-city sustainability patterns within Cuenca. By using a comprehensive set of sustainability indicators and urban fabric typologies, this study characterises and contrasts these patterns to provide a more nuanced understanding of sustainability at the neighbourhood and street level. The following subsection reviews the relevant literature to situate this study within the current body of knowledge. However, before delving into the literature, it is important to clarify the semantic framework used in this paper. Sustainability is considered here as a broader, more inclusive concept than terms like vitality, vibrancy, or resilience, which are commonly discussed in the literature. For example, a study on a Chinese city examines the relationship between urban vibrancy (a narrower concept) and the built environment (rather than broader urban fabric typologies) [24]. Similarly, the concept of liveability is often studied in relation to sustainability [25], albeit noting that liveability may conflict with environmental goals. Although assessing trade-offs among sustainability pillars is standard practice, liveability and sustainability are closely related, differing mainly in timeframes and scope, with liveability focusing on the short term [26].
The Related Literature
A key limitation in the broader literature is its overemphasis on environmental sustainability [16,17,27], a disproportionate focus on the built environment (often at the expense of biophysical or social dimensions) [23], and a failure to recognise the need for fine spatial disaggregation to capture the heterogeneity at the human scale [17,28]. While the reviewed literature touches on aspects relevant to this paper, none fully addresses the research gap identified. To the best of the authors’ knowledge, this paper is unique in exploring the relationships and patterns between a comprehensive set of 30 urban sustainability indicators (USIs) and a broad categorisation of 18 urban fabric typologies (UFTs) at a fine spatial granularity. While several studies have explored either USIs or UFTs in detail, none have simultaneously analysed both in depth. It is important to note that this paper does not aim to establish conceptual or methodological frameworks for constructing USIs [29] or UFTs [30]; these indicators and typologies are used here as input data developed in earlier research by the authors [31,32]. Similarly, this study does not seek to adopt standardised frameworks for sustainability indicators (such as “BREEAM-C”, “LEED-ND”, “iiSBE SBToolPT Urban”, or “iiSBE SNTool”) [29,33,34], as its focus is on identifying intra-city sustainability patterns in Cuenca and examining the relationships between sustainability and urban fabric rather than making inter-city comparisons. In fact, research has shown that global indicators may not always be applicable to diverse local contexts [18].
Four key aspects—urban morphology, urban sustainability, GIS, and composite indicators—were used to identify the relevant literature, along with variations of these keywords. Initial broad results were refined through relevance checks, excluding papers focused solely on specific topics such as water, energy, temperature, the built environment, or the environmental dimension of sustainability. A second selection criterion involved manually inspecting paper titles to retain only those that included at least one of the four key aspects. Finally, relevance was assessed by reviewing abstracts, selecting only those directly aligned with the aims and scope of this paper.
A study on resilience in the Madrid region [35] mapped 42 indicators across five dimensions—socio-cultural, economic, ecological, physical and technological, and governance systems—yet with a coarse spatial aggregation at the municipal level, with the smallest unit measuring 5 km2 and the largest 605.77 km2. Similarly, a study on urban vitality in Nanjing [36] mapped 71 indicators to social, economic, cyberspace, and cultural-tourism dimensions, employing a 500 m rectangular cellular automata grid for spatial disaggregation.
As a transition from related fields to formal urban sustainability, a study initially conducted in Australian cities and later expanded to global contexts explores spatial indicators for urban liveability and sustainability, with a focus on policy implementation [37]. Although lacking a clear distinction between liveability and sustainability, the definition of liveability provided is closely aligned with sustainability. The approach uses fine spatial granularity, calculating indicators based on point data at the address level. Moreover, it is also noted that grid cell data can effectively address the modifiable areal unit problem and facilitate scaling [37]. The study advocates for establishing policy-relevant reference values for indicators to provide standardised, comparable benchmarks, although it also acknowledges that these values may not be universally accepted or applicable across different contexts and policy goals [37]. Notably, the broader research project underpinning the paper proposed here does establish idealised optimal values based on assessments by local experts and global standards from secondary sources. Nevertheless, the primary objective of this paper is to conduct a comparative analysis of spatial patterns among urban fabrics, identifying interlinkages between urban sustainability and urban morphology. Such an analysis would lack statistical rigour if indicator measurements were restricted to idealised optimal values, which can be subjective and context-dependent.
A study explicitly focused on urban sustainability, with coarse spatial granularity at the level of Chinese cities and prefectures, is presented in [38]. The study employs a single layer of 12 high-level dimensions for the indicators, in contrast to most frameworks, which typically feature a lower layer of specific indicators mapped to broader dimensions.
A study of Spanish cities [39] also reports the use of composite indicators to measure urban sustainability. Its strength lies in representing indicators on a scale from strong to weak sustainability, where the lower bound corresponds to the worst performance (strong sustainability) and the upper bound to the arithmetic mean (weak sustainability). The concept of strong sustainability assumes that indicators aggregated into a composite index are non-compensatory—meaning the poor performance of one cannot be offset by the good performance of another—while weak sustainability allows for perfect substitution. A key limitation of the study lies in its coarse spatial granularity since intra-urban heterogeneity among urban fabrics would be overlooked at the level of municipalities.
A notable contribution to the literature is a review that assesses 67 indicator-led initiatives for urban sustainability, focusing on domains, themes, and their suitability for different applications [40]. The study highlights that the primary domains addressed are the three core pillars of sustainability—environment, society, and economy—along with additional “irreducible” domains (e.g., built environment, natural environment, and governance) and a wide range of lower-level indicators. These findings suggest that consensus on definitions, classifications, and conceptual boundaries remains elusive. In contrast, the approach presented in this paper builds on a comprehensive set of 30 indicators previously developed by the authors [31], expanding beyond the typical three pillars of sustainability (a full description is provided in Section 2.2). The indicators are structured in a bottom-up hierarchy, mapped to four high-level dimensions: (I) Built Environment, (II) Biophysical Environment, (III) Urban Systems, and (IV) Socio-Spatial Integration. This framework overlaps with many of the domains and themes identified in [40] while offering specific metrics for each indicator. Although the broader research project defines 58 indicators, only 30 were suitable for practical data collection. The framework can thus be labelled as a theme-based approach, aligning with the criteria in [40] for structuring information and contextualising metrics.
A GIS approach to identify relations between urban sustainability and urban morphology is proposed in [41]. The study achieves fine granularity by employing a rectangular grid with 100 × 100 m spatial units. Urban sustainability is characterised by a hierarchical structure with four high-level dimensions (land occupation, public space and habitability, mobility and services, and urban complexity), which are further broken down into 11 individual indicators: dwelling density, compactness (absolute and corrected), air quality, acoustic comfort, road accessibility, proximity to basic services, population movement mode, public road distribution, off-street parking, and the balance between activity and residency. However, this framework differs from the approach proposed in this paper in several key aspects. Firstly, it omits several important urban sustainability indicators, such as non-automobile-based mobility (which is only partially addressed through road accessibility), access to public space and green areas, essential services (e.g., electricity, wastewater), and key socio-economic indicators (e.g., education, housing quality, unemployment, safety). A subsequent study by the same authors [42] includes additional indicators, such as vacant urban lots and proximity to recycling facilities. Secondly, urban morphology is represented indirectly through specific indicators (e.g., land occupation, road accessibility, public road distribution) rather than as a distinct, independent variable. As a result, urban fabric typologies are not explicitly considered, limiting the potential for a direct mapping of sustainability to urban morphology.
A relevant contribution to the literature is the study of Mosquera, Colombia [28], which proposes an approach to measuring urban sustainability through indicators, metrics, and scoring. Although it incorporates fine spatial disaggregation at the neighbourhood level, the study does not explicitly link sustainability levels to urban fabric typologies. The authors argue that existing sustainability frameworks often lack three key aspects: adequate spatial granularity, comprehensive coverage of sustainability dimensions (usually restricted to the three “pillars”), and generalisability to other cities. The approach proposed in this paper addresses the first two aspects through fine-grained spatial units (a grid of 150 m hexagons) and a comprehensive set of sustainability indicators. Regarding the third aspect, the primary focus of this paper is on intra-city patterns within Cuenca, Ecuador, while inter-city comparisons and rankings [25,43] fall outside of scope and are left for future research. Even though inter-city assessments are beyond the scope, the open-source tools referenced later in this paper are designed to facilitate replication in other urban contexts. Notably, intra-city comparisons, enhanced by the integration of an urban fabric typology, offer valuable insights by distinguishing sustainability levels across different urban areas.
A study conducted in Shenzhen, China, explores urban vibrancy through urban morphology [2]. While vibrancy is closely related to urban sustainability, it is a narrower concept, as the study omits biophysical and environmental indicators. The study defines the built environment using a “formality” attribute and socio-economic aspects through a “function” attribute, which captures human activity through fine-grained point-of-interest spatiotemporal mobile data. A key difference with the approach in this paper is that vibrancy is directly measured through morphological features, whereas in this study, each analysis unit (hexagonal cell) is characterised by a set of USIs and by a unique UFT.
The study most closely aligned with the scope of this paper is presented in [44], which first conducts a comprehensive review of urban sustainability and typo-morphology frameworks. It then defines morphological characteristics at multiple scales (building, neighbourhood, block, and city) and sustainability dimensions (intensity, proximity, efficiency, accessibility, diversity, and permeability). While the study incorporates various scales, it lacks a fine level of spatial disaggregation, and it does not characterise urban fabrics as extensively as Wheeler’s framework [4], particularly at the neighbourhood scale, where it limits its focus to “buildings, plots, neighbourhood/local open space, and the local street system”. In contrast, the approach proposed in this paper evaluates 30 urban sustainability indicators (grouped into four high-level dimensions) against a typology of 18 distinct urban fabric types, using a fine spatial granularity.
A relevant concept in urban sustainability is urban metabolism, which views cities as complex systems that emerge from the adaptation of the natural environment to human needs. In this framework, cities exhibit metabolic processes—production, consumption, and waste—akin to those of biological organisms within ecosystems [45]. Sustainable urban management, approached through the lens of urban metabolism, requires context-specific solutions that address each city’s unique metabolic characteristics, aiming to reduce resource inputs and waste outputs while enhancing liveability [14]. Several scholars have proposed frameworks that explore urban sustainability through the principles of urban metabolism, often drawing analogies with the three pillars of sustainability [14,45,46,47]. However, while urban metabolism provides a valuable perspective, this paper adopts the conventional three-pillar model of sustainability without explicitly linking it to metabolic processes.
A final aspect explored in the literature is the assignment of weights to sustainability indices when calculating a composite sustainability index. The Analytical Hierarchical Process (AHP) is a commonly used method for determining these weights [18,33,34,43]. However, this paper adopts a different approach, deliberately avoiding weighting to prevent data manipulation and to circumvent arbitrary conventions regarding the relative importance of indicators or dimensions. While weighting may be useful for practical decision-making, it is less appropriate for statistical or pattern analyses. As defined by [31], the AHP is “a structured technique for organising and analysing a complex set of decision criteria”, highlighting that weighting is meaningful in contexts where decisions are required. In an inter-city study of 64 municipalities in Galicia, Spain, Gonzáles-García et al. [34] acknowledge the challenges posed by the subjectivity and arbitrariness inherent in expert-driven weighting. They also note that nearly half of the studies they reviewed do not use weights, citing a lack of conclusive evidence for or against this practice. Furthermore, they found no significant difference between weighted and non-weighted composite indices. This concludes the review of the relevant literature.
In summary, cities’ spatial (land distribution) and functional aspects (urban fabrics and population behaviour) are a source of considerable heterogeneity, which must be accounted for at an adequate spatial granularity in urban sustainability studies. This approach is particularly relevant for Latin American cities, where sustainability inequalities are pronounced, reflecting the region’s status as the most unequal in the world [48]. The contribution of this paper concerning the existing body of urban sustainability research lies in its novel assessment of the relationship among urban sustainability indicators and urban fabric typologies at a mesoscale (street and neighbourhood level, applied for city-wide analyses, using the case study of Cuenca, an intermediate city in the southern Andes of Ecuador). Interdisciplinary in nature, this study integrates data from urban morphology and sustainability, employing geographic and statistical analyses to connect and enhance both fields. Key findings indicate substantial variation in built environment indicators across urban fabrics, which significantly influence city-wide sustainability. The analysis reveals marked spatial heterogeneity, where inner-core areas exhibit high sustainability, fringe areas show low sustainability, and transition zones display mixed sustainability levels. Urban fabric clusters show homogeneity at the extremes (high/low sustainability) but greater diversity in mid-range sustainability clusters and transition areas. These findings offer valuable insights for urban planners and policymakers, highlighting how sustainability varies across urban fabrics and uncovering patterns shaped by historical urban development. Such insights can inform equity-based interventions and improve spatially sensitive urban planning.
2. Data and Methods
This section describes the study area, the available input data for the analyses, and the statistical methods, visualisation techniques, and GIS tools deployed for analyses.
2.1. Study Area
Cuenca is an intermediate city located in the southern Andes region of Ecuador at 2560 m.a.s.l.; its territory is geologically divided into three natural terraces marked by the Tomebamba and Yanuncay rivers. Founded by Spain in 1557, Cuenca´s urban layout followed the laws of the Indies and, thus, adopted the checkerboard grid still present in its downtown area. Since the 1950s, the city has experienced accelerated growth and is currently the third most populated city in Ecuador. Some key characteristics of the city are reported in Table 1 below.
Table 1.
Characteristics of the study area.
As a newly induced Habitat III intermediate city, back in 2015, Cuenca embarked on a focused effort to pursue Sustainable Development Goals (SDGs) [49], particularly SDG11: “Make cities and human settlements inclusive, safe, resilient and sustainable”. This designation highlighted the pressing need for formal sustainability assessments, prompting several studies in the field within the city.
The city of Cuenca offers potential transferability within the region, as it displays a heterogeneous urban morphology representative of modern expansions of Latin American intermediate cities [31,50]. The authors have developed tools to facilitate transference and replication, which are outside of the scope of this paper but will be mentioned in the Discussion and Conclusions section of this paper.
2.2. Data
Building on a sustainability framework that integrates quality of life and urban metabolic processes, a comprehensive set of indicators has been previously developed for Cuenca [31] based on the assumption of a compact city model. The original set included 58 indicators at a conceptual level, though full data are available for only 37, with additional indicators incorporated for this study. The primary focus of the data analysis efforts conducted in this paper lies in examining patterns and relationships between USIs and UFTs in Cuenca rather than on inter-city comparisons. For readers interested in the standardisation of sustainability indicators for global comparison, refer to [29,33].
The updated set of indicators is grouped into four higher-level dimensions: I: Built Environment; II: Biophysical Environment; III: Urban Systems; and IV: Socio-Spatial Integration (Table 2). This set of indicators is the first key input data source enabling the analyses conducted in this paper and is stored in an open-access geographic information systems layer (GeoLlactaLAB: http://201.159.223.152/layers/geonode_data:geonode:CompletoIndicad), spatially disaggregated by a regular grid with hexagons of 150 m radius.
Table 2.
Sustainability indicators for the city of Cuenca.
A brief exploratory data analysis revealed that certain USIs had all their records either 100% (B1 and C13) or 0% (A7, A9, B3, C4, and C8). While these extreme values have practical significance, the focus of this study is on assessing differential patterns rather than overall sustainability magnitudes. Hence, these indicators are removed from consideration, leaving 30 USIs for analysis.
A second key input data source consists of a typology of urban fabrics (UFTs), previously defined for the entire city of Cuenca [32] using the visual approach proposed by Wheeler [4] and adapted to the local context. Notably, the city’s four rivers—Tomebamba, Tarqui, Yanuncay, and Machángara—intersect Cuenca and contribute significantly to its green spaces. However, these areas have been excluded from the study, as they are not populated and, thus, many of the indicators are not applicable [32]. Eighteen distinct UFTs result from the adaptation to Cuenca, each briefly described in Table 3 and depicted in Figure 1. For a more detailed description, see [32]. An open-access QGIS layer (GeoLlactaLAB: Geonode LlactaLAB; http://201.159.223.152/layers/geonode_data:geonode:CompletoIndicad with the identified UFTs is openly available as well.
Table 3.
Urban fabrics for the city of Cuenca.
Figure 1.
Eighteen urban fabrics within the metropolitan area of the city of Cuenca.
The eighteenth type pertains to UNCLASSIFIED cells. Since these cells are located predominantly at expansion zones at the fringe of the study area, they can offer important insights regarding the sustainability of these zones.
A key analytical tool is the use of urban fabric clusters, defined as groups of adjacent hexagonal cells of the same urban fabric type. These clusters, delineated by black boundaries in Figure 1, are identified using QGIS geoprocessing tools, which dissolve contiguous cells of the same type into a single geometry. In cases where only a few cells are in proximity—sometimes isolated—the minimum threshold for cluster identification is set at seven cells.
2.3. Methods
The approach proposed in this paper aims to explore relationships and patterns of urban sustainability indicators (USIs) with respect to urban fabric typologies (UFTs) through data visualisation, geospatial analyses, and statistical methods. Both data sources (UFTs and USIs) are spatially disaggregated by the same 150 m radius hexagonal grid, granting a one-to-one correspondence that eliminates spatial mismatches. The fine spatial resolution of the hexagonal grid also offers a workaround for the modifiable areal unit problem and enhances scalability [37,52].
2.3.1. Initial Statistical Tests
Two statistical tests are conducted at a pre-analysis step. First, 30 individual one-way ANOVA tests are conducted for each USI to assess whether there is significant variation in the sustainability indicators across the 18 UFTs in Cuenca. This analysis evaluates whether the mean values of each USI, grouped by UFT, differ significantly. Note that spatial patterns are implicitly accounted for, as the mean values of USIs for each UFT category correspond to averaging the values of all hexagonal cells within that category across the study area.
In the second pre-step, a Principal Component Analysis (PCA) is employed due to the high dimensionality of the study, which involves 30 USIs analysed across 18 UFTs. The aim is to assess whether each of the 30 USIs contributes unique information or variability or whether some may be redundant. PCA is therefore used to examine the correlations between the USIs and to determine whether dimensionality reduction through linear transformations is appropriate. This approach aligns with the existing literature, which often employs factor analysis to construct composite indices [34].
2.3.2. Statistical and Geospatial Methods
Simultaneous spatial visualisation and subsequent analyses of 30 USIs contrasted against 18 UFTs can become challenging. In this context, since USIs represent aspects of a broader concept—urban sustainability—they can be aggregated into a composite index, which can be computed as follows:
- First, outliers for each USI are statistically treated based on the following criteria:
All values beyond these limits are truncated at the limit value.
- Then, each USI is normalised against its maximum value (upper limit, after truncation) within the [0, 1] domain. This normalisation process is chosen instead of Z-scores, as centring values around zero would not yield a meaningful additive sustainability index.
- The composite sustainability index consists of a linear combination (algebraic sum) of the 30 normalised USIs.
- ○
- Some USIs are defined as negatively contributing to sustainability (e.g., unemployment). Hence, they enter the algebraic sum with a negative sign. The negative USIs are A5, A10, D2, D3, D9, D11, D15, and D16.
- ○
- A linear combination of positive and negative indicators implies a compensatory composition because the contribution of negative indicators to composite sustainability can be partially offset by positive indicators and vice versa. While some approaches in the literature advocate for a non-compensatory method to prevent negative environmental impacts from being offset by well-performing indicators [25], this rationale carries an environmental bias. For example, alternative studies may prioritise social dimensions over environmental ones. Valcárcel et al. [25] also propose defining minimum thresholds for indicators, below which they are automatically set to zero. However, as discussed in Section “The Related Literature”, this paper avoids manipulating the data through weighting, truncation, or prioritisation of specific aspects in order to preserve the integrity of spatial and statistical analyses.
- ○
- D17 is a particular case since its optimal value is 1, and sustainability decreases for values greater than 1 and lower than 1 as well. Thus, normalisation for this index consists of subtracting 1 from all values (centring around 1) and then converting all resulting negative values to absolute positive values. The normalised version of D17 measures a bidirectional distance from the optimal value.
It is important to note that the purpose of the composite sustainability index is to provide a common metric for formal comparison and differential analysis of sustainability patterns across high-level sustainability dimensions and different urban fabric types. Consequently, the magnitude of the index itself is not the focus of analysis or interpretation in this study. This argument is also consistent with the rationale outlined in Section 2.2, which justifies the exclusion of USIs with all-100 or all-0 values.
Further, some indicator-based studies warn about colinearity among individual indicators, meaning that two or more indicators may capture the same attribute and, thus, be correlated. These studies propose adding specific weight coefficients at the level of high-level dimensions as a solution [35]. To evaluate the need for weighting, the PCA pre-step mentioned above aids in assessing how well-differentiated or uncorrelated USIs are.
Having computed the proposed composite index, several analyses are conducted. To begin, a faceted boxplot of the composite index values offers the first clear overview of intra- and inter-class sustainability patterns of each urban fabric typology. This visualisation offers simple yet succinct insights regarding how UFTs compare in terms of sustainability levels, but also on the variability within each UFT.
For statistical formality, an ANOVA test is conducted to assess significant variation of the composite sustainability index with respect to UFTs, accompanied by Tukey’s Honest Significant Differences test, to test whether pairwise combinations of UFTs significantly differ among themselves.
Analyses are then focused on spatial patterns, which are necessary to answer questions such as whether there are specific zones or areas in the city that display distinct composite sustainability levels or if cells from spatially clustered UFTs exhibit homogeneity or heterogeneity in their sustainability levels. To this end, geoprocessing techniques and methods such as choropleth maps are leveraged, along with data visualisation techniques for high-dimensional data, such as circular barplots (ggradar R package V2.0: https://r-graph-gallery.com/web-radar-chart-with-R.html (accessed on 10 September 2024)) and spider charts.
All spatial analyses presented in this paper are conducted in QGIS 3.34.2-Prizren, while statistical analyses and visualisations are performed in R Studio 2023.12.0, Build 369.
3. Results
This section presents four main findings: first, the identification of statistically significant variability in urban sustainability indicators (USIs) across different urban fabric typologies (UFTs); second, evidence confirming non-redundancy and low correlation of the selected USIs; third, statistical analyses and visualisation techniques that reveal both intra- and inter-class heterogeneity among UFTs in terms of sustainability levels; and fourth, choropleth maps and data visualisations unveiling distinct spatial patterns of sustainability across the various UFTs.
3.1. One-Way ANOVA Tests
Thirty ANOVA tests were conducted, one for each USI. The null hypothesis of these tests states that no statistically significant variation exists for each USI with respect to all UFT levels. All tests yield p-values < 0.0001, implying that the null hypothesis cannot be rejected, with high statistical significance.
Results are shown in Table 4 below. These results offer first-order evidence justifying further analyses, exploring these significant differences in further detail, both statistically and spatially.
Table 4.
Results from individual one-way ANOVA tests.
3.2. Principal Component Analysis
A different variable normalisation process is required by computing Z-scores, subtracting USIs’ mean, and dividing by the standard deviation. A first glance at the potential for dimensionality reduction can be seen in the correlation plot in Figure 2. Correlation is generally low, with some variables showing an expected higher correlation due to their conceptual definition, e.g., A8_Proximity to open public spaces and B4_Proximity to green spaces.
Figure 2.
Correlation plot among USIs.
PCA is then performed in R to identify principal components, which are linear transformations of the USI variables. The importance (relevance) of each principal component can be assessed by a scree plot created with the factoextra R package (factoextra R package V1.0.7: https://rpkgs.datanovia.com/factoextra/index.html (accessed on 10 September 2024)). Figure 3 below shows the top 10 components in terms of the percentage of variance explained by them (note that all remaining 20 components explain less than 3% of variance each).
Figure 3.
Scree plot for the top 10 components in terms of variance explained.
The results from the scree plot suggest that the linear transformations undertaken in the PCA procedure do not offer a justifiable reduction in dimensionality since the first principal component only captures 28% of the variance. The remaining components display an exponential decay pattern in variance explained, not even reaching 50% among the four best principal components.
All considered, the set of 30 USIs offers well-differentiated information, and it is best to maintain them in their original form. Further, these results support constructing a composite sustainability index as a non-weighted linear combination of USIs, as the low correlation and high degree of differentiation align with an idealised hypothesis of perfect substitution (albeit not fully, naturally). Since the main goal of this paper is to deliver a comparative intra-city examination of composite sustainability among different types of urban fabrics, its focus lies entirely on pattern identification and statistical/spatial analyses, deliberately avoiding the use of weights or idealised optimal reference values. Nonetheless, the Delphi method, an expert-validated assignment of weights and optimal values, is part of the broader research initiative to which this study contributes. Further details are available elsewhere (LlactaLAB: Ciudades Sustentables official website: https://llactalab.ucuenca.edu.ec/sisurbano/).
3.3. Composite Sustainability: Statistical Analyses
Results from Section 3.1 confirmed statistically significant variation of individual USIs among UFTs, but sustainability is an inherently complex multicriteria concept that cannot be reduced to individual USIs. In fact, this is a limitation of the existing literature reported in Section “The Related Literature”, as the literature commonly focuses on isolated aspects of urban morphology (e.g., built environment only) and/or urban sustainability (e.g., environment only). Variation must be assessed at the level of a composite sustainability index, as proposed in Section 2.3.2.
An ANOVA test assessing whether the composite sustainability index varies significantly with respect to UFTs yields an F-value of 86.32 and a significant p-value (≈0); thus, the null hypothesis of no statistically significant variation of the composite sustainability index with respect to all UFT levels cannot be rejected. This result complements and enhances results found at individual levels in Section 3.1.
Additionally, Tukey’s Honest Significant Differences test is conducted to assess significance at the level of UFT pairwise combinations. Results are shown in a matrix-table format in Table 5, generally showing that most pairwise combinations are statistically significant. Note that A, N, O, and P fabrics appear as non-significant due to a low number of observations —four, four, two, and seven hexagonal cells in the study area, respectively. The null hypothesis of no statistically significant variation in the composite sustainability index between UFT pairwise combinations cannot be rejected either. Results in Table 5 show that UFTs are significantly different from at least five other UFTs and, at most, from nine. These results offer further proof that heterogeneity and significant differences in sustainability also exist among UFTs at more disaggregate levels.
Table 5.
Results from Tukey’s Honest Significant Differences test.
3.4. Composite Sustainability: Data Visualisation and Analysis
A more focused and even practical question sought in this paper is as follows: are some UFTs in Cuenca distinctly more sustainable than others? A first illuminating visualisation consists of boxplots depicting the distributions of composite sustainability indexes of each UFT, as shown in Figure 4.
Figure 4.
Boxplots of the composite sustainability index by UFTs in ascending order.
Figure 4 displays boxplots of composite sustainability index in ascending order (read from left to right), clearly evidencing distinct sustainability levels among UFTs (inter-class variability), as well as considerable intra-class variation for several UFTs. While several contrasts can be made, the most interesting ones are arguably found at extreme values. Notably, the average composite sustainability index of the Rectangular Block Grid typology is around twice the Allotment Gardens index. Boxplots also convey important differences regarding intra-class variability, whereby UFTs with the highest variation are Upscale Enclave, Heavy Industry, and Garden Apartments. At the same time, the UFT with the lowest variation is Urban Grid. In other words, it can be stated that Urban Grid hexagonal cells are much more homogeneous in terms of their average composite sustainability index than the remaining UFTs.
Considering the results for UNCLASSIFIED shown in Figure 4, along with the results reported in Table 5, the inclusion of this UFT for analysis is fully justified, as these results collectively show a distinct pattern of low sustainability and significant variation with respect to most UFTs.
To complement the information provided thus far, a circular barplot is utilised next. It is worth mentioning that circular barplots are sometimes criticised for causing visual distortion, as the width of the bars representing a variable (UFT) increases with higher values and decreases with lower ones. This issue arises since one-dimensional variables are plotted as two-dimensional shapes, implying that a unitary value increase might appear visually smaller for low values, while larger for high values. To address this caveat, the bar width parameter in Figure 5 is reduced by 30% to approach a more rectangular form, and the ring corresponding to index = 0 is offset by three units from the centre (since distortion increases as the bar is closer to the circle centre). Conversely, the upside of a circular barplot lies in its ability to display and facet information from several variables in a single, condensed plot, facilitating comparative visualisation. While circular barplots rely on average values and do not convey intra-class variation (unlike boxplots), they offer a clear visualisation of the comparative influence of high-level dimensions [53].
Figure 5.
Circular barplot of composite sustainability classified by high-level dimension and by UFTs in ascending order (clockwise).
It is also essential to recall the rationale outlined in Section “The Related Literature”: weighting is not applied in this paper to avoid altering statistical and pattern analyses by adopting arbitrary conventions regarding the relative importance of indicators or dimensions. The number of indicators available for each high-level dimension varies considerably (nine, four, two, and fifteen, respectively), leading to an unbalanced contribution to the composite index. Nonetheless, at the individual USI level, it would be incorrect to artificially increase the contribution of two Urban Systems USIs while decreasing the contribution of fifteen Socio-Spatial Integration USIs. For instance, should D6_Use of time as an individual USI be disproportionately less impactful than C03_Public roads per inhabitant? Certainly not solely due to the circumstantial fact of a dimension having fewer indicators with available data.
All considered, Figure 5 reveals that, compared to other dimensions, Socio-Spatial Integration contributes homogeneously to composite sustainability among UFTs, yet also evidences its overrepresentation. Conversely, a distinct heterogeneous pattern among UFTs can be observed for Built Environment, which unveils a first strong piece of evidence, suggesting that this dimension alone can largely explain composite sustainability patterns (i.e., ranking UFTs by composite index or by Built Environment would generally yield similar results, aside from V, M, and N UFTs). While comparative variation can also be observed in Biophysical Environment, the pattern is not as marked, and differences are specific and intuitive (e.g., comparatively lower biophysical performance for Urban Grid while comparatively higher for Land of the Dead). The Urban Systems dimension is largely homogeneous among UFTs as well, with notable exceptions where this dimension is comparatively higher for Allotment Gardens and Upscale Enclave.
Considering the high dimensionality involved in this paper (30 USIs by 18 UFTs), a visualisation analysis focused on high/low-performing UFTs is deemed pertinent. To this end, a spider chart is shown in Figure 6, contrasting the three highest-sustainability UFTs (green-coloured polygons) versus the three lowest (pink-coloured polygons). The chart reports sustainability metrics for these six UFTs at a disaggregate level of individual USIs. Each spike of the chart maps the metric of a specific USI, whereby positively defined USIs values within the [0, 1] range are shown above the dashed inner circumference, and negatively defined USIs in the [0, −1] range are mapped below towards the centre of the plot. Moreover, areas enclosed by the polygons are shaded to enhance the visualisation of differences among UFTs.
Figure 6.
Spider chart of UFTs with the three highest and three lowest composite sustainability decomposed by USIs.
A logical expectation would be that polygons of high-performing UFTs would encompass polygons of the low-performing USIs (applies for both positive and negative USIs). While this rationale holds for several USIs, some other USIs reveal interesting patterns.
First, in terms of USIs from the Socio-Spatial Integration dimension, low-performing UFTs score quite close to high-performing UFTs for most USIs, further supporting the interpretation of Figure 5 that the city performs quite homogenously among UFTs in this aspect. Accentuated differences where vertices of green polygons appear higher than pink polygons (following logical expectation) include D01_Households fully covered by basic services, D02_Household with critical construction deficiencies, D03_Dwellings at risk zones, D06_Use of time, and D13_Economically active population with university degree. This clearly suggests that differences can be attributed to income segments of the population. Conversely, seemly counterintuitive patterns emerge, whereby low-performing USIs far surpass high-performing ones, as evidenced in D09_Thefts per year and D17_Spatial segregation; interestingly, both cases can also be explained by income and quality of life conditions—thefts are much more likely to happen and spatial segregation to take place at high-income segments.
Second, USIs from the Urban Systems dimension do not show very clear patterns, as high- and low-performing UFTs are intertwined. For instance, C09_Electricity consumption of households reveals that Allotment Gardens (worst-performing UFTs in composite sustainability) ranks second after Apartment Blocks (best-performing). In the case of C03_Public roads per inhabitant, an opposite pattern is unveiled, apparently suggesting that the most sustainable UFTs lack road networks. Assessing this indicator requires careful interpretation of extreme cases, as an insufficient road network would deteriorate both sustainable (e.g., public transit, bike) and unsustainable mobility (e.g., private vehicles), whereas cities where public space is disproportionately allocated to roads are the archetypical example of car-dependent unsustainability.
Third, USIs from Biophysical Environment show expected patterns. High-performing UFTs score considerably better than low-performing ones for B02_Nocturnal illumination of public streets and B04_Proximity to green spaces. Conversely, B05_Green area per inhabitant and B07_Soil permeability show an inverted pattern, which is clearly explained by the degree of urbanisation, as low-performing UFTs are expected to be located in less urbanised areas—the spatial analyses conducted in the next subsection provide evidence to support this argument.
Fourth, Built Environment USIs unveil the largest differences, following expected patterns of high-performing UFTs surpassing low-performing ones; this is strongly in line with the findings drawn from Figure 5, suggesting that most of the variability of the composite index is explained by the Built Environment dimension. Two exceptions emerge in this dimension: high- and low-performing UFTs are quite similar for A10_Relation between activity and residence, suggesting that mixed uses are generally achieved to a good degree in urban fabrics of the city, and an inversion in A01_Net population density indicates that UFTs that are ranked highest in overall composite sustainability are less dense in population than those ranked lowest. Again, the pattern found for A1 must be interpreted with attention to extreme cases, as high density can be sustainable in the context of compact, self-contained mixed-use neighbourhoods, but it can also imply the presence of unsustainable features such as “conventillos”—a Spanish term referring to residential overcrowding. These results highlight the complexity of the concept of urban sustainability and the necessity of multi-dimensional approaches.
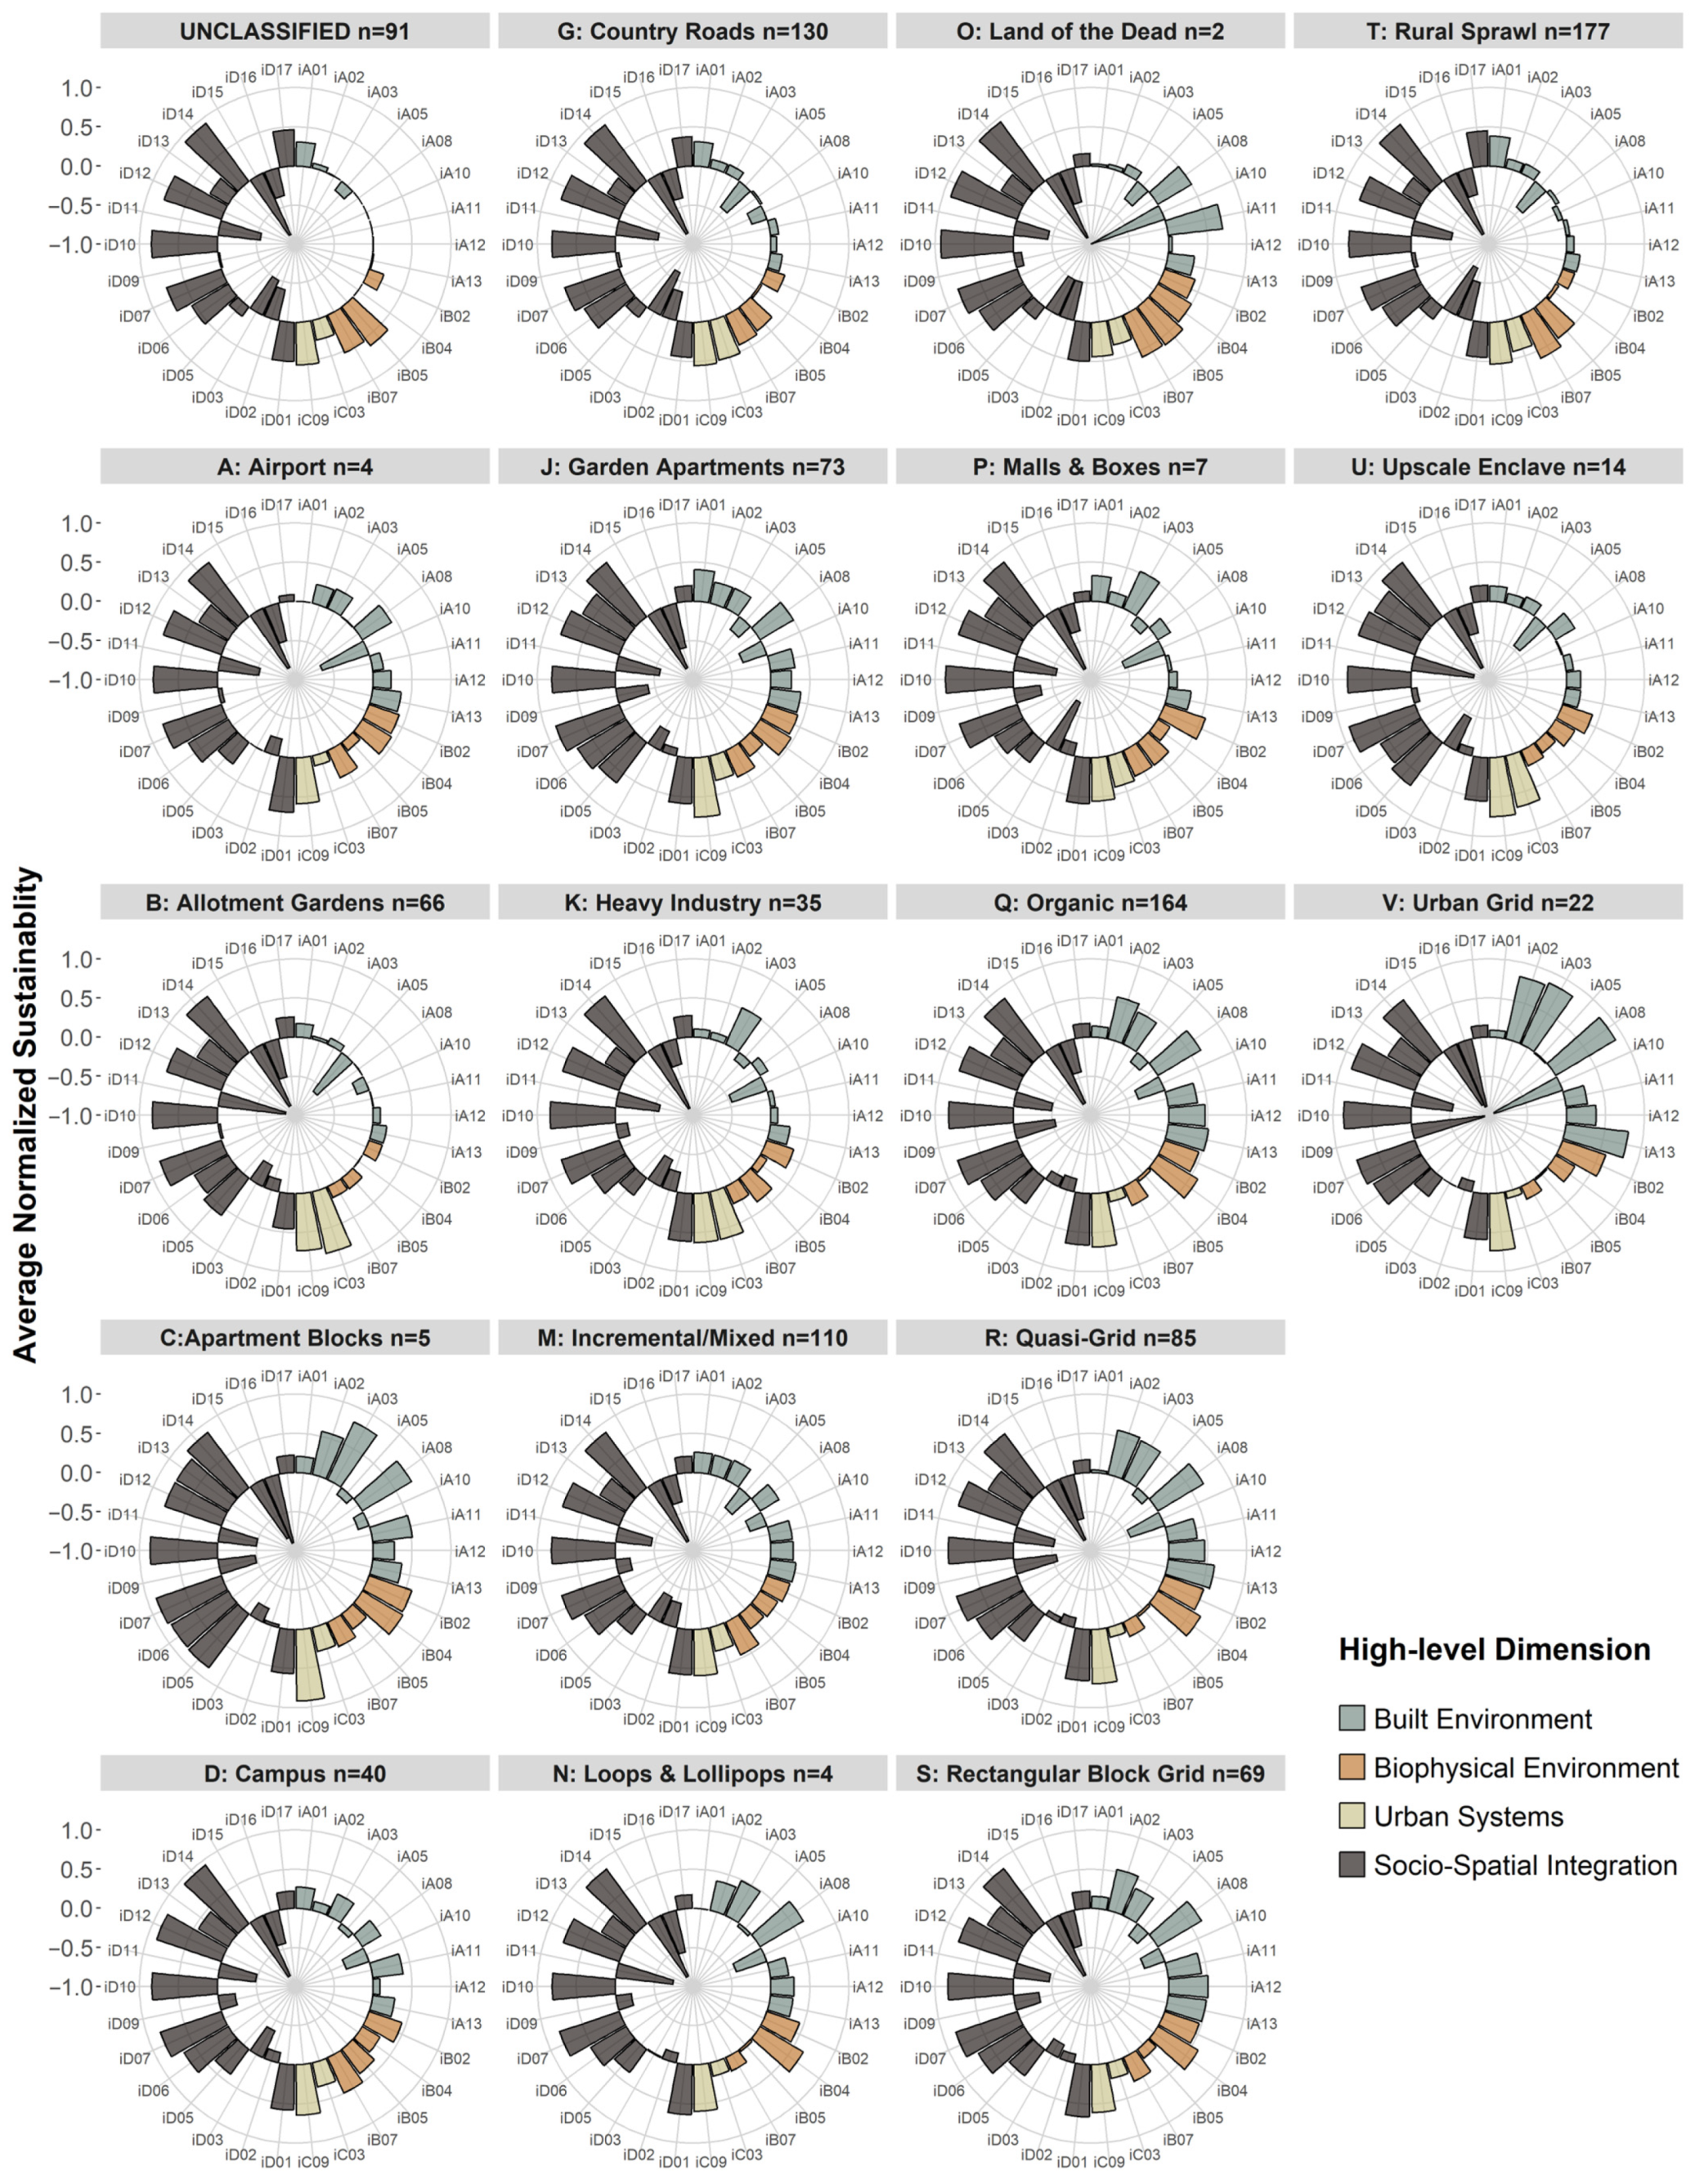
To complement statistical and visualisation analyses, a more complex and detailed visualisation is provided in Appendix A, even though an assessment at the level of individual UFTs by individual USIs is not the aim of this paper.
3.5. Spatial Analyses
The analyses conducted thus far have revealed statistically significant heterogeneity and distinct sustainability patterns among UFTs at different levels of aggregation—whether examined individually, by high-level dimensions, or through the composite index. The next crucial step is exploring these patterns from a spatial perspective, which brings forth different types of questions, such as the following: are cells of UFT clusters homogeneous or heterogeneous in their composite sustainability indexes? Do certain areas or UFT clusters display distinctly high or low sustainability?
While the following spatial analyses achieve a high level of disaggregation (i.e., 1098 150 m radius hexagons), urban fabric types A, C, N, O, and P are represented by only a few hexagons. As a result, meaningful spatial patterns for these UFTs cannot be effectively identified. Figure 7 presents a choropleth map of Cuenca spatially discretised by the hexagonal grid described earlier. A viridis colour scale characterises the range of values of the composite sustainability index of each cell, while the text labels overlaid on top of cells and cell clusters report urban fabric typologies.
Figure 7.
Choropleth of Cuenca´s composite sustainability index labelled by UFTs.
The first assessment of Figure 7 can be directed towards further elaboration of the analyses of extreme values of sustainability. It can be evidenced that several urban fabric clusters have similar composite sustainability indexes:
- For low-sustainability: B and K clusters at the northeastern boundary, K clusters at the northern–central area, G and T clusters towards the north, and UNCLASSIFIED, G, and T clusters towards the south.
- For high sustainability: R, Q, and S clusters in the southern–central area and a large Q cluster towards the southwest.
- These findings would suggest considerable homogeneity in the sustainability of urban clusters at extreme sustainability levels.
A second relevant analysis focuses on mid-range sustainability values (the four blue-green hues in the middle of the viridis scale). Several areas with relatively homogeneous sustainability indexes can be identified in this case: a clearly defined V cluster located at the historic centre of the city; a large J cluster towards the south; R, Q, and M clusters at the southwestern end; B and T clusters at the western expansion area; Q and M clusters at the north–central area; and a D cluster in the north–central area between the northern and northeastern expansion stripes.
In contrast to the patterns found thus far, several clusters can be identified with marked heterogeneity in their composite indexes: B clusters in the northeast but closer to the more urbanised area; Q clusters in the central–northern area; R clusters in the central area; J, G, and M clusters near the thin stripe connecting the northeast expansion with the urbanised core; M clusters in the south; and UNCLASSIFIED clusters at the northeastern and northwestern expansion stripes of the city. Interestingly, an S cluster “oasis” of high sustainability can be located at the onset of the northern–central expansion area of the city, lying amidst a very low sustainability area. The clusters identified in this analysis are considerably heterogeneous in their sustainability levels and can be considered as transitioning areas.
The analyses presented above leveraged urban fabric clusters as analysis units for exploring sustainability patterns of homogeneous morphological areas of the city. As a second step, the results from Figure 6 in Section 3.4 are complemented by addressing extreme sustainability levels from a spatial perspective. To this end, Figure 8 depicts the two highest versus the two lowest sustainability levels from the composite index range. The resulting image provides a marked pattern, evidencing complete spatial separation, with the sole exception of the “S cluster oasis” identified earlier in the central–northern area of the city. High and low sustainability areas are mutually exclusive, which denotes unsustainable patterns at sprawling zones along the fringe of the city.
Figure 8.
Choropleth of Cuenca’s composite sustainability index characterised by the two highest and two lowest sustainability index ranges and labelled by UFTs.
By complementarity, the greyed areas in Figure 8 represent mid-range sustainability, which are generally scattered randomly and uniformly across the study area, except for two specific patterns. First, the high sustainability area with Q, R, and S clusters in the southern–central area of the city. Conversely, a pattern of agglomeration of mid-range cells in expansion areas of the city towards the northeast, northwest, and southwest is evidenced, which may indicate that some smaller areas within expansion zones seem to be breaking the unsustainable trend at fringe areas identified earlier. Finally, a pattern worth mentioning can be observed in a “longitudinal chain” of J UFTs with high sustainability, deriving from the central Q, R, and S clusters, which seem to be progressing towards and connecting with the northeastern expansion stripe.
A final spatial analysis is conducted to complement the findings presented in Section 3.4 regarding high-level dimensions. Figure 5 shows that Built Environment patterns closely resemble composite sustainability patterns, while the other three dimensions are largely homogeneous across UFTs, with some specific exceptions. However, some lingering questions remain regarding the spatial patterns of high-level dimensions: do the trends observed in data analyses hold spatially? Are there additional patterns and comparative insights when data is spatially laid out? To answer these questions, USIs are partially aggregated at the level of each of their corresponding higher-level dimension and then plotted in faceted choropleths in Figure 9. UFT labels have been removed in Figure 9 to simplify visualisation since the focus is now on the differential influence of dimensions in the composite index or on comparison among dimensions.
Figure 9.
Spatial patterns for each high-level sustainability dimension.
Since aggregating USIs at high-level dimensions implies a different range of sustainability values for each dimension, a unified scale is necessary to guarantee an unbiased comparative standpoint. Note that the unified range of Figure 9 will be different from the one shown in previous figures; hence, index values are solely meant for comparison among dimensions and should not be compared directly to previous figures.
A simple inspection of Figure 9 confirms that the findings of Section 3.4 can be extended to the spatial aspect to a large degree. Clearly, the spatial patterns and heterogeneity observed in the choropleth of Dimension I strongly dominate the remaining (largely homogeneous) dimensions. Dimensions III and IV are largely homogeneous in their spatial distribution across the city and their sustainability levels. Dimension II is also confirmed to be homogeneous to a lesser extent, but the most interesting pattern that can be evidenced is that the index is quite homogeneous for mid-range sustainability cells at the urban inner core, while a dramatic decrease is observed at the northern and northeastern expansion stripes. This is a great example of how disaggregation can unveil patterns that would otherwise remain hidden, as the heterogeneity identified for Dimension II through data visualisation and analysis (circular barplot in Figure 5) arises from aggregating (quite homogeneous) mid-range values of the inner core with low values of the expansion stripes (quite homogeneous as well).
4. Discussion and Conclusions
The results reported in Section 3 confirm the main hypothesis of this study and highlight the spatial heterogeneity of sustainability within Cuenca. Results provide robust evidence that urban fabric typologies exhibit distinct sustainability patterns in their spatial distribution, with significant inter- and intra-class variability. Statistical tests demonstrate significant variability and differences, both at aggregate and disaggregate levels, while data visualisation and spatial analyses provide graphical aid to better comprehend the identified patterns. This heterogeneity suggests that urban fabric types significantly influence sustainability performance at the city level. In essence, urban sustainability, as measured by the indicators utilised for this study, is strongly linked to urban form at the mesoscale.
The analysis identifies the least sustainable urban fabric typologies (UFTs) as B: Allotment Gardens, G: Country roads, and UNCLASSIFIED, while C: Apartment Blocks, S: Rectangular Block Grid, and R: Quasi-Grid UFTs stand out as the most sustainable. These findings offer valuable insights for urban planners and decision-makers, enabling targeted interventions based on the specific characteristics of each urban fabric type. Such information can guide sustainability improvements in both high-density core areas and low-density expansion zones. Moreover, the study highlights the potential for equity-based interventions, particularly in fringe and transitional areas where sustainability lags.
Identified patterns provide an understanding of macro-level city sustainability computed from micro-level analysis units (cells capturing the neighbourhood scale). This is particularly important to overcome aggregation limitations in archetypal city-wide sustainability metrics. Urban fabrics characterised by extreme sustainability values—whether high or low—tend to exhibit greater spatial homogeneity with more predictable sustainability patterns. This aligns with the rationale proposed in [54], in that inner-core areas align with the compact city model, mixed-use development, and proximity to services, whereas fringe areas exhibit characteristics of unsustainable urban sprawl. A study conducted in the Latin American context in Argentina [55] has identified similar geographical patterns of high sustainability in urban areas and low in peri-urban areas yet lacks information regarding morphological patterns. An example of the benefit of adding a morphological layer of information can be found in analysing spatial patterns of urban fabrics within expansion (peri-urban) areas: while most cells in these areas expectedly are the ones found as the least sustainable in Figure 4 (B, G, UNCLASSIFIED, and T), several more sustainable urban fabrics (C, S, R, and Q) emerge within expansion areas, evidencing otherwise unknown heterogeneity and suggesting transition areas. This type of analysis can offer instrumental insights for urban planning, as they allow comparison among expansion areas, as well as set the ground for further analyses on the drivers behind these differences. Moreover, urban sustainability efforts could be targeted more efficiently in fringe areas where interventions might bring the most significant improvements toward higher sustainability. On the other hand, areas of mid-range sustainability exhibit much greater heterogeneity in their sustainability levels and do not relate to spatial agglomeration of UTFs compared to high and low sustainability areas. This result suggests that transition areas exist within the city with various types of spatially intertwined urban fabric typologies. While proximity and mixed-use patterns are desirable, transition areas may present challenges for sustainability planning. Streamlined generic solutions would likely be insufficient for these heterogeneous areas; instead, specifically tailored and adaptable urban planning strategies are recommended to improve sustainability levels across all UFTs involved.
The analysis further underscores the importance of Dimension I: Built Environment in explaining the variability of sustainability across Cuenca. This finding implies that built environment factors such as housing density, compactness, and proximity to basic services are the most heterogeneous across the city, playing a crucial role in determining the sustainability of urban fabrics. To design and manage urban growth aligned with sustainability, urban planners should aim at bridging the gap in built environment indicators among different UFTs, particularly in areas where the least sustainable fabric types are located.
Among the most relevant limitations of this study, the authors would like to acknowledge the following aspects:
(1) Data availability: While extensive data-gathering efforts were conducted in 2018, several indicators from the original set of 58 could not be gathered due to various constraints. Ideally, gathering data for additional indicators in Dimension II: Biophysical Environment and Dimension III: Urban Systems would result in a more balanced representation. Nonetheless, the reader is reminded of the rationale established earlier regarding weighting, which is deemed relevant for practice-oriented purposes, whereas this paper aims at establishing relations and identifying patterns among UFTs and USIs from unaltered data.
(2) Exclusion of river areas: While the criteria for removing the four rivers traversing the city of Cuenca is justified in [32] due to being non-habitable, it arguably impacts the sustainability values of Dimension II: Biophysical Environment. As this study focuses on the relationship between sustainability and urban fabric typologies, and most population-driven indicators would be null in the case of rivers, the reader is referred to the original dataset for further detail in this aspect.
(3) Segmentation analyses: Assessing the sustainability of individual or composite indicators with respect to transversal variables such as income [28], gender, age, mobility impediments, etc., would add interesting dimensions to this study. Nevertheless, an important consideration to bear in mind is the combinatorial challenge already implied in this research layout, exploring patterns of 30 sustainability indicators with respect to 18 urban fabrics. Overlaying transversal dimensions on top of this layout would render a combinatorial explosion in terms of managing visualisations, interpretations, and discussions. Finally, note that transversal factors such as income, gender, or age are indirectly captured by USIs, particularly those of Dimension IV: Socio-Spatial Integration, while heterogeneity of the population is also indirectly captured by the high granularity employed in the 150 m radius hexagonal grid.
Regarding future work, the authors would like to mention the following avenues:
(1) Addressing the data availability limitations discussed above, aiming for periodical data gathering to allow for monitoring and longitudinal analyses. However, an important challenge exists in data gathering efforts for such an extensive set of indicators (58 considering the complete set) and at a high level of disaggregation (150 m radius hexagons), as it can be quite resource intensive. Ideally, collaboration between academia and the public sector would confer economic feasibility and project sustainability over time. Also, while the study revealed critical patterns, certain sustainability indicators had extreme values (either 100% or 0%), which may not fully reflect the variability needed for deeper analysis in some dimensions, such as Biophysical Environment. Future work should aim to collect additional data to balance the representation across all sustainability dimensions.
(2) The exclusion of river areas from the study also presents a limitation, particularly in terms of their impact on the Biophysical Environment dimension. Future research could integrate measurement of the proximity to these areas to better capture their effect on urban sustainability.
(3) Segmentation analyses can certainly be conducted in future work, shifting focus from pattern identification. Reducing dimensionality in the research layout would be essential in this case, potentially by relying solely on the composite index or high-level dimensions. Moreover, assigning weights to indicators and balancing the number of indicators among high-level dimensions would be recommended for segmentation analyses, as the aim would shift from data analyses to a more practice- and policy-oriented focus.
(4) In addition to addressing limitations, future work is planned on pursuing a more complex methodological approach by employing econometric models in the branch of logistic regression, which would adjust well to the categorical–quantitative nature of the data (UFTs–USIs), and they would allow to further explore relations and effects among UFTs and USIs at a fully disaggregate level. A similar approach proposed in the literature relates urban morphology with urban vitality [56]. An estimated logistic model could also be applied for elasticity analyses to assess the effect of changes in metrics (increased/decreased performance of USIs) on sustainability, as well as for predictive and labelling purposes.
(5) In terms of flexibility and to address some of the limitations as well as future work, it is worth mentioning that LlactaLAB has developed an open-access tool available as a QGIS complement named MESUE V1.0 (Modelo de Evaluación de Sustentabilidad Urbana Espacial–MESUE: https://github.com/llactalab/mesue (accessed on 18 November 2024)), which offers specific functionality for exploring and customising different weightings in the construction of a composite index, as well as establishing policy-oriented optimal values for indicators. Moreover, a second open-source, open-access tool developed consists of a QGIS toolbox plugin labelled SISURBANO V1.0 (LlactaLAB: Ciudades Sustentables official website–SISURBANO: https://llactalab.ucuenca.edu.ec/sisurbano/ (accessed on 18 November 2024)), offering automated tools to calculate a wide array of urban sustainability indicators from standardised input data in QGIS or CSV format. These tools can be utilised as a “sandbox” for customisation and exploration purposes that can range from conceptual and methodological to practical scenario analyses or to test the methodological approach in other urban areas. This is an exciting research avenue, particularly for intermediate cities in the Andes and Latin America, to identify insightful similarities and differences.
The contributions of this paper are novel in terms of the level of disaggregation achieved, the comprehensiveness of the set of USIs, and the incorporation of UFTs to enhance sustainability analyses and pattern identification with a morphological perspective. Findings from this paper also bring forth new questions regarding the drivers behind spatial and data patterns. Urban planners should consider spatial heterogeneity when designing policy interventions, particularly in transition zones with mixed sustainability. Policies aimed at enhancing the sustainability of low-performing areas, such as the fringe expansion zones, could be prioritised for long-term urban sustainability strategies. Future research could include longitudinal analyses to track the evolution of urban fabric sustainability over time, allowing for more dynamic and predictive urban planning. Incorporating econometric models and other statistical tools could further explore the relationships between sustainability indicators and urban fabric typologies, providing deeper insights into the drivers of sustainability at both local and city-wide scales.
Author Contributions
Conceptualisation, writing—original draft preparation, F.C., D.O., M.I.C. and M.A.H.; methodology and investigation, F.C., D.O., M.I.C., J.A. and M.A.H.; software, J.A. and F.C.; formal analysis, data curation, and visualisation, F.C.; writing—review and editing, F.C. and D.O.; supervision, project administration, funding, and funding acquisition, D.O. and M.A.H. All authors have read and agreed to the published version of the manuscript.
Funding
This research is part of the project “Evaluación de sustentabilidad en tejidos urbanos: Sistema de Indicadores y herramienta de análisis espacial (SISURBANO)“, funded by Dirección de Investigación de la Universidad de Cuenca. The APC was funded by Vicerrectorado de Investigación de la Universidad de Cuenca.
Data Availability Statement
The original data presented in the study are openly available at the GeoLlactaLAB web repository: http://201.159.223.152.
Acknowledgments
We would like to express our gratitude to the institutions that facilitated access to the data for this research, including the GAD Municipal de Cuenca, Municipal Corporation, ETAPA, EMOV-EP, and Empresa Eléctrica Centro Sur. We are also grateful to technicians and experts who provided insights and feedback on the conceptualisation of sustainability indicators. Finally, we want to recognise the efforts of researchers at LlactaLAB UCuenca, as well as research assistants and undergrad students who participated in the data collection and processing.
Conflicts of Interest
The authors declare no conflicts of interest. The funders had no role in the design of the study; in the collection, analysis, or interpretation of data; in the writing of the manuscript; or in the decision to publish the results.
Appendix A
Figure A1.
Normalised USIs characterised by high-level dimension and faceted by UFTs.
References
- Boeing, G. Spatial information and the legibility of urban form: Big data in urban morphology. Int. J. Inf. Manag. 2021, 56, 102013. [Google Scholar] [CrossRef] [Scilit]
- Li, S.; Wu, C.; Lin, Y.; Li, Z.; Du, Q. Urban Morphology Promotes Urban Vibrancy from the Spatiotemporal and Synergetic Perspectives: A Case Study Using Multisource Data in Shenzhen, China. Sustainability 2020, 12, 4829. [Google Scholar] [CrossRef] [Scilit]
- Li, X.; Cheng, S.; Lv, Z.; Song, H.; Jia, T.; Lu, N. Data analytics of urban fabric metrics for smart cities. Future Gener. Comput. Syst. 2020, 107, 871–882. [Google Scholar] [CrossRef] [Scilit]
- Wheeler, S. Built Landscapes of Metropolitan Regions: An International Typology. J. Am. Plan. Assoc. 2015, 81, 167–190. [Google Scholar] [CrossRef] [Scilit]
- Garau, C.; Pavan, V.M. Evaluating Urban Quality: Indicators and Assessment Tools for Smart Sustainable Cities. Sustainability 2018, 10, 575. [Google Scholar] [CrossRef] [Scilit]
- Chen, W.; Wu, A.N.; Biljecki, F. Classification of urban morphology with deep learning: Application on urban vitality. Comput. Environ. Urban Syst. 2021, 90, 101706. [Google Scholar] [CrossRef] [Scilit]
- Aureli, P.; Turan, N. [Re]Form: New Investigations in Urban Form, Panel 1. Harvard GSD 2018. Available online: https://youtu.be/0L7Anlsu2A4 (accessed on 18 November 2024).
- Doug Allen Institute. Streets Lecture-Part 1. 2016. Available online: https://www.youtube.com/watch?v=NA2jpARqS7A&feature=youtu.be (accessed on 18 November 2024).
- Park, K.; Ewing, R.; Sabouri, S.; Larsen, J. Street life and the built environment in an auto-oriented US region. Cities 2019, 88, 243–251. [Google Scholar] [CrossRef] [Scilit]
- Valente, R.; Berry, B. Dissatisfaction with city life? Latin America revisited. Cities 2016, 50, 62–67. [Google Scholar] [CrossRef] [Scilit]
- Garcia-Ayllon, S. Rapid development as a factor of imbalance in urban growth of cities in Latin America: A perspective based on territorial indicators. Habitat Int. 2016, 58, 127–142. [Google Scholar] [CrossRef] [Scilit]
- Smets, P.; Salman, T. The multi-layered-ness of urban segregation. On the simultaneous inclusion and exclusion in Latin American cities. Habitat Int. 2016, 54, 80–87. [Google Scholar] [CrossRef] [Scilit]
- van Lindert, P. Rethinking urban development in Latin America: A review of changing paradigms and policies. Habitat Int. 2016, 54, 253–264. [Google Scholar] [CrossRef] [Scilit]
- Thomson, G.; Newman, P. Urban fabrics and urban metabolism–from sustainable to regenerative cities. Resour. Conserv. Recycl. 2018, 132, 218–229. [Google Scholar] [CrossRef] [Scilit]
- De Oliveira Neto, G.; Pinto, L.; Giannetti, A.; de Almeida, C. A framework of actions for strong sustainability. J. Clean. Prod. 2018, 196, 1629–1643. [Google Scholar] [CrossRef] [Scilit]
- Sharifi, A. Urban sustainability assessment: An overview and bibliometric analysis. Ecol. Indic. 2021, 121, 107102. [Google Scholar] [CrossRef] [Scilit]
- Kramer, C.; Wagner, M. Enhancing Urban Sustainable Indicators in a German City—Towards Human-Centered Measurements for Sustainable Urban Planning. World 2020, 1, 104–123. [Google Scholar] [CrossRef] [Scilit]
- Ameen, R.F.M.; Mourshed, M. Urban sustainability assessment framework development: The ranking and weighting of sustainability indicators using analytic hierarchy process. Sustain. Cities Soc. 2019, 44, 356–366. [Google Scholar] [CrossRef] [Scilit]
- Verma, P.; Raghubanshi, A. Urban sustainability indicators: Challenges and opportunities. Ecol. Indic. 2018, 93, 282–291. [Google Scholar] [CrossRef] [Scilit]
- González, L.G.; Siavichay, E.; Espinoza, J.L. Impact of EV fast charging stations on the power distribution network of a Latin American intermediate city. Renew. Sustain. Energy Rev. 2019, 107, 309–318. [Google Scholar] [CrossRef] [Scilit]
- Mackay, H. Mapping and characterising the urban agricultural landscape of two intermediate-sized Ghanaian cities. Land Use Policy 2018, 70, 182–197. [Google Scholar] [CrossRef] [Scilit]
- United Nations. The New Urban Agenda; United Nations: Quito, Ecuador, 2017; ISBN 978-92-1-132731-1. [Google Scholar]
- Zhang, P.; Ghosh, D.; Park, S. Spatial measures and methods in sustainable urban morphology: A systematic review. Landsc. Urban Plan. 2023, 237, 104776. [Google Scholar] [CrossRef] [Scilit]
- Fu, R.; Zhang, X.; Yang, D.; Cai, T.; Zhang, Y. The Relationship between Urban Vibrancy and Built Environment: An Empirical Study from an Emerging City in an Arid Region. Int. J. Environ. Res. Public Health 2021, 18, 525. [Google Scholar] [CrossRef] [Scilit] [PubMed]
- Valcárcel-Aguiar, B.; Murias, P.; Rodríguez-González, D. Sustainable Urban Liveability: A Practical Proposal Based on a Composite Indicator. Sustainability 2019, 11, 86. [Google Scholar] [CrossRef] [Scilit]
- United States Department of Transportation. What Do We Mean by Livability and Sustainability?-FHWA Operations. Available online: https://ops.fhwa.dot.gov/publications/fhwahop12004/c1.htm#:~:text=Both%20livability%20and%20sustainability%20address,are%20their%20timeframes%20and%20scope (accessed on 26 October 2024).
- Castillo-Cabrera, F.; Wellmann, T.; Haase, D. Urban Green Fabric Analysis Promoting Sustainable Planning in Guatemala City. Land 2021, 10, 18. [Google Scholar] [CrossRef] [Scilit]
- Jorge-Ortiz, A.; Braulio-Gonzalo, M.; Bovea, M.D. Assessing urban sustainability: A proposal for indicators, metrics and scoring—A case study in Colombia. Environ. Dev. Sustain. 2023, 25, 11789–11822. [Google Scholar] [CrossRef] [Scilit]
- Salati, M.; Bragança, L.; Mateus, R. Sustainability Assessment on an Urban Scale: Context, Challenges, and Most Relevant Indicators. Appl. Syst. Innov. 2022, 5, 41. [Google Scholar] [CrossRef] [Scilit]
- Çalışkan, O.; Mashhoodi, B.; Akay, M. Morphological indicators of the building fabric: Towards a Metric Typomorphology. J. Urban Int. Res. Placemaking Urban Sustain. 2022, 15, 1–30. [Google Scholar] [CrossRef] [Scilit]
- Hermida, M.; Calle, C.; Cabrera, N. La Ciudad Empieza Aquí: Metodología para la Construcción de Barrios Compactos Sustentables; Universidad de Cuenca: Cuenca, Ecuador, 2015; ISBN 978-9978-14-318-6. [Google Scholar]
- Hermida, M.; Cobo, D.; Neira, C. Challenges and Opportunities of Urban Fabrics for Sustainable Planning in Cuenca (Ecuador). In Proceedings of the IOP Conference Series: Earth and Environmental Science, Prague, Czech Republic, 2–4 July 2019; Volume 290. [Google Scholar] [CrossRef] [Scilit]
- Ragheb, G.; El-Wahab, M.A.; Ragheb, R.A. Sustainable indicators framework for strategic urban development: A case study of Abu Teeg city in Assiut, Egypt. Int. J. Sustain. Dev. Plan. 2022, 17, 91–107. [Google Scholar] [CrossRef] [Scilit]
- González-García, S.; Rama, M.; Cortés, A.; García-Guaita, F.; Núñez, A.; González Louro, L.; Moreira, M.T.; Feijoo, G. Embedding environmental, economic and social indicators in the evaluation of the sustainability of the municipalities of Galicia (northwest of Spain). J. Clean. Prod. 2019, 234, 27–42. [Google Scholar] [CrossRef] [Scilit]
- Suárez, M.; Benayas, J.; Justel, A.; Sisto, R.; Montes, C.; Sanz-Casado, E. A holistic index-based framework to assess urban resilience: Application to the Madrid Region, Spain. Ecol. Indic. 2024, 166, 112293. [Google Scholar] [CrossRef] [Scilit]
- Wang, Z.; Wang, X.; Liu, Y.; Zhu, L. Identification of 71 factors influencing urban vitality and examination of their spatial dependence: A comprehensive validation applying multiple machine-learning models. Sustain. Cities Soc. 2024, 108, 105491. [Google Scholar] [CrossRef] [Scilit]
- Higgs, C.; Alderton, A.; Rozek, J.; Adlakha, D.; Badland, H.; Boeing, G.; Both, A.; Cerin, E.; Chandrabose, M.; De Gruyter, C.; et al. Policy-Relevant Spatial Indicators of Urban Liveability And Sustainability: Scaling From Local to Global. Urban Policy Res. 2022, 40, 321–334. [Google Scholar] [CrossRef] [Scilit]
- Wang, C.; Quan, Y.; Li, X.; Yan, Y.; Zhang, J.; Song, W.; Lu, J.; Wu, G. Characterizing and analyzing the sustainability and potential of China’s cities over the past three decades. Ecol. Indic. 2022, 136, 108635. [Google Scholar] [CrossRef] [Scilit]
- Lo-Iacono-Ferreira, V.; Garcia-Bernabeu, A.; Hilario-Caballero, A.; Torregrosa-López, J. Measuring urban sustainability performance through composite indicators for Spanish cities. J. Clean. Prod. 2022, 359, 131982. [Google Scholar] [CrossRef] [Scilit]
- Halla, P.; Merino-Saum, A. Conceptual frameworks in indicator-based assessments of urban sustainability—An analysis based on 67 initiatives. Sustain. Dev. 2022, 30, 1056–1071. [Google Scholar] [CrossRef] [Scilit]
- Jiménez-Espada, M.; García, F.M.M.; González-Escobar, R. Urban Equity as a Challenge for the Southern Europe Historic Cities: Sustainability-Urban Morphology Interrelation through GIS Tools. Land 2022, 11, 1929. [Google Scholar] [CrossRef] [Scilit]
- Jiménez-Espada, M.; Martínez García, F.M.; González-Escobar, R. Sustainability Indicators and GIS as Land-Use Planning Instrument Tools for Urban Model Assessment. ISPRS Int. J. Geo-Inf. 2023, 12, 42. [Google Scholar] [CrossRef] [Scilit]
- Saeed, U.; Ahmad, S.R.; Mohey-ud-din, G.; Butt, H.J.; Ashraf, U. An Integrated Approach for Developing an Urban Livability Composite Index—A Cities’ Ranking Road Map to Achieve Urban Sustainability. Sustainability 2022, 14, 8755. [Google Scholar] [CrossRef] [Scilit]
- Mobaraki, A.; Oktay Vehbi, B. A Conceptual Model for Assessing the Relationship between Urban Morphology and Sustainable Urban Form. Sustainability 2022, 14, 2884. [Google Scholar] [CrossRef] [Scilit]
- Rojas, F.; Borthagaray, A.; Marques, A.; Chong, J.; Strobel, J.; Bonilla, L.; Mondino, M.; Pineda, M.; Ellinger, P.; Carrasco, P.; et al. La Ciudad Como Sistema: Metabolismo, Resiliencia y Sustentabilidad, 1st ed.; Ediciones Irradia: Buenos Aires, Argentina, 2023; ISBN 978-987-48044-3-3. [Google Scholar]
- Song, Y.; Timmeren, A.V.; Wandl, A. A literature review and categorisation of sustainability-aimed urban metabolism indicators: A context, indicator, mechanism, outcome analysis. Reg. Stat. 2019, 9, 54–71. [Google Scholar] [CrossRef] [Scilit]
- Ko, Y.-Y.; Chiu, Y.-H. Empirical Study of Urban Development Evaluation Indicators Based on the Urban Metabolism Concept. Sustainability 2020, 12, 7129. [Google Scholar] [CrossRef] [Scilit]
- ONU Habitat. Construcción de Ciudades más Equitativas, Políticas Públicas para la Inclusión en América Latina; Programa de las Naciones Unidas para los Asentamientos Humanos: Nairobi, Kenya, 2014; ISBN 978-92-1-132605-5. [Google Scholar]
- United Nations Cuenca Declaration for Habitat III “Intermediate Cities: Urban Growth and Renewal”. Available online: http://habitat3.org/wp-content/uploads/Declaration-Cuenca.pdf (accessed on 17 October 2019).
- Cabrera, N.; Hermida, M.; Orellana, D.; Osorio, P. Assessing the sustainability of urban density. Indicators in the case of Cuenca (Ecuador). Bitácora Urbano Territ. 2015, 25, 21–34. [Google Scholar] [CrossRef] [Scilit]
- Shannon, C.; Weaver, W. The Mathematical Theory of Communication; The University of Illinois Press: Urbana, IL, USA, 1964; Volume 14, pp. 306–317. Available online: https://www.ncbi.nlm.nih.gov/pubmed/9230594 (accessed on 18 November 2024).
- Openshaw, S. The Modifiable Areal Unit Problem; Geo Books: Norwick, UK, 1983; ISBN 0860941345. [Google Scholar]
- Burch, M.; Weiskopf, D. On the Benefits and Drawbacks of Radial Diagrams. In Handbook of Human Centric Visualization, 1st ed.; Springer: New York, NY, USA, 2014; pp. 429–451. ISBN 978-3-540-30750-1. [Google Scholar]
- Shawly, H. Evaluating Compact City Model Implementation as a Sustainable Urban Development Tool to Control Urban Sprawl in the City of Jeddah. Sustainability 2022, 14, 13218. [Google Scholar] [CrossRef] [Scilit]
- Zulaica, M.L. Is Mar del Plata (Argentina) a sustainable city? An evaluation of the sustainability of urban and peri-urban areas using indicators. Sustentabilidade Debate 2019, 10, 10–27. [Google Scholar] [CrossRef] [Scilit]
- Kang, C. Measuring Urban Form and Its Effects on Urban Vitality in Seoul, South Korea: Urban Morphometric Approach. J. Urban Plan. Dev. 2024, 150, 05024019. [Google Scholar] [CrossRef] [Scilit]
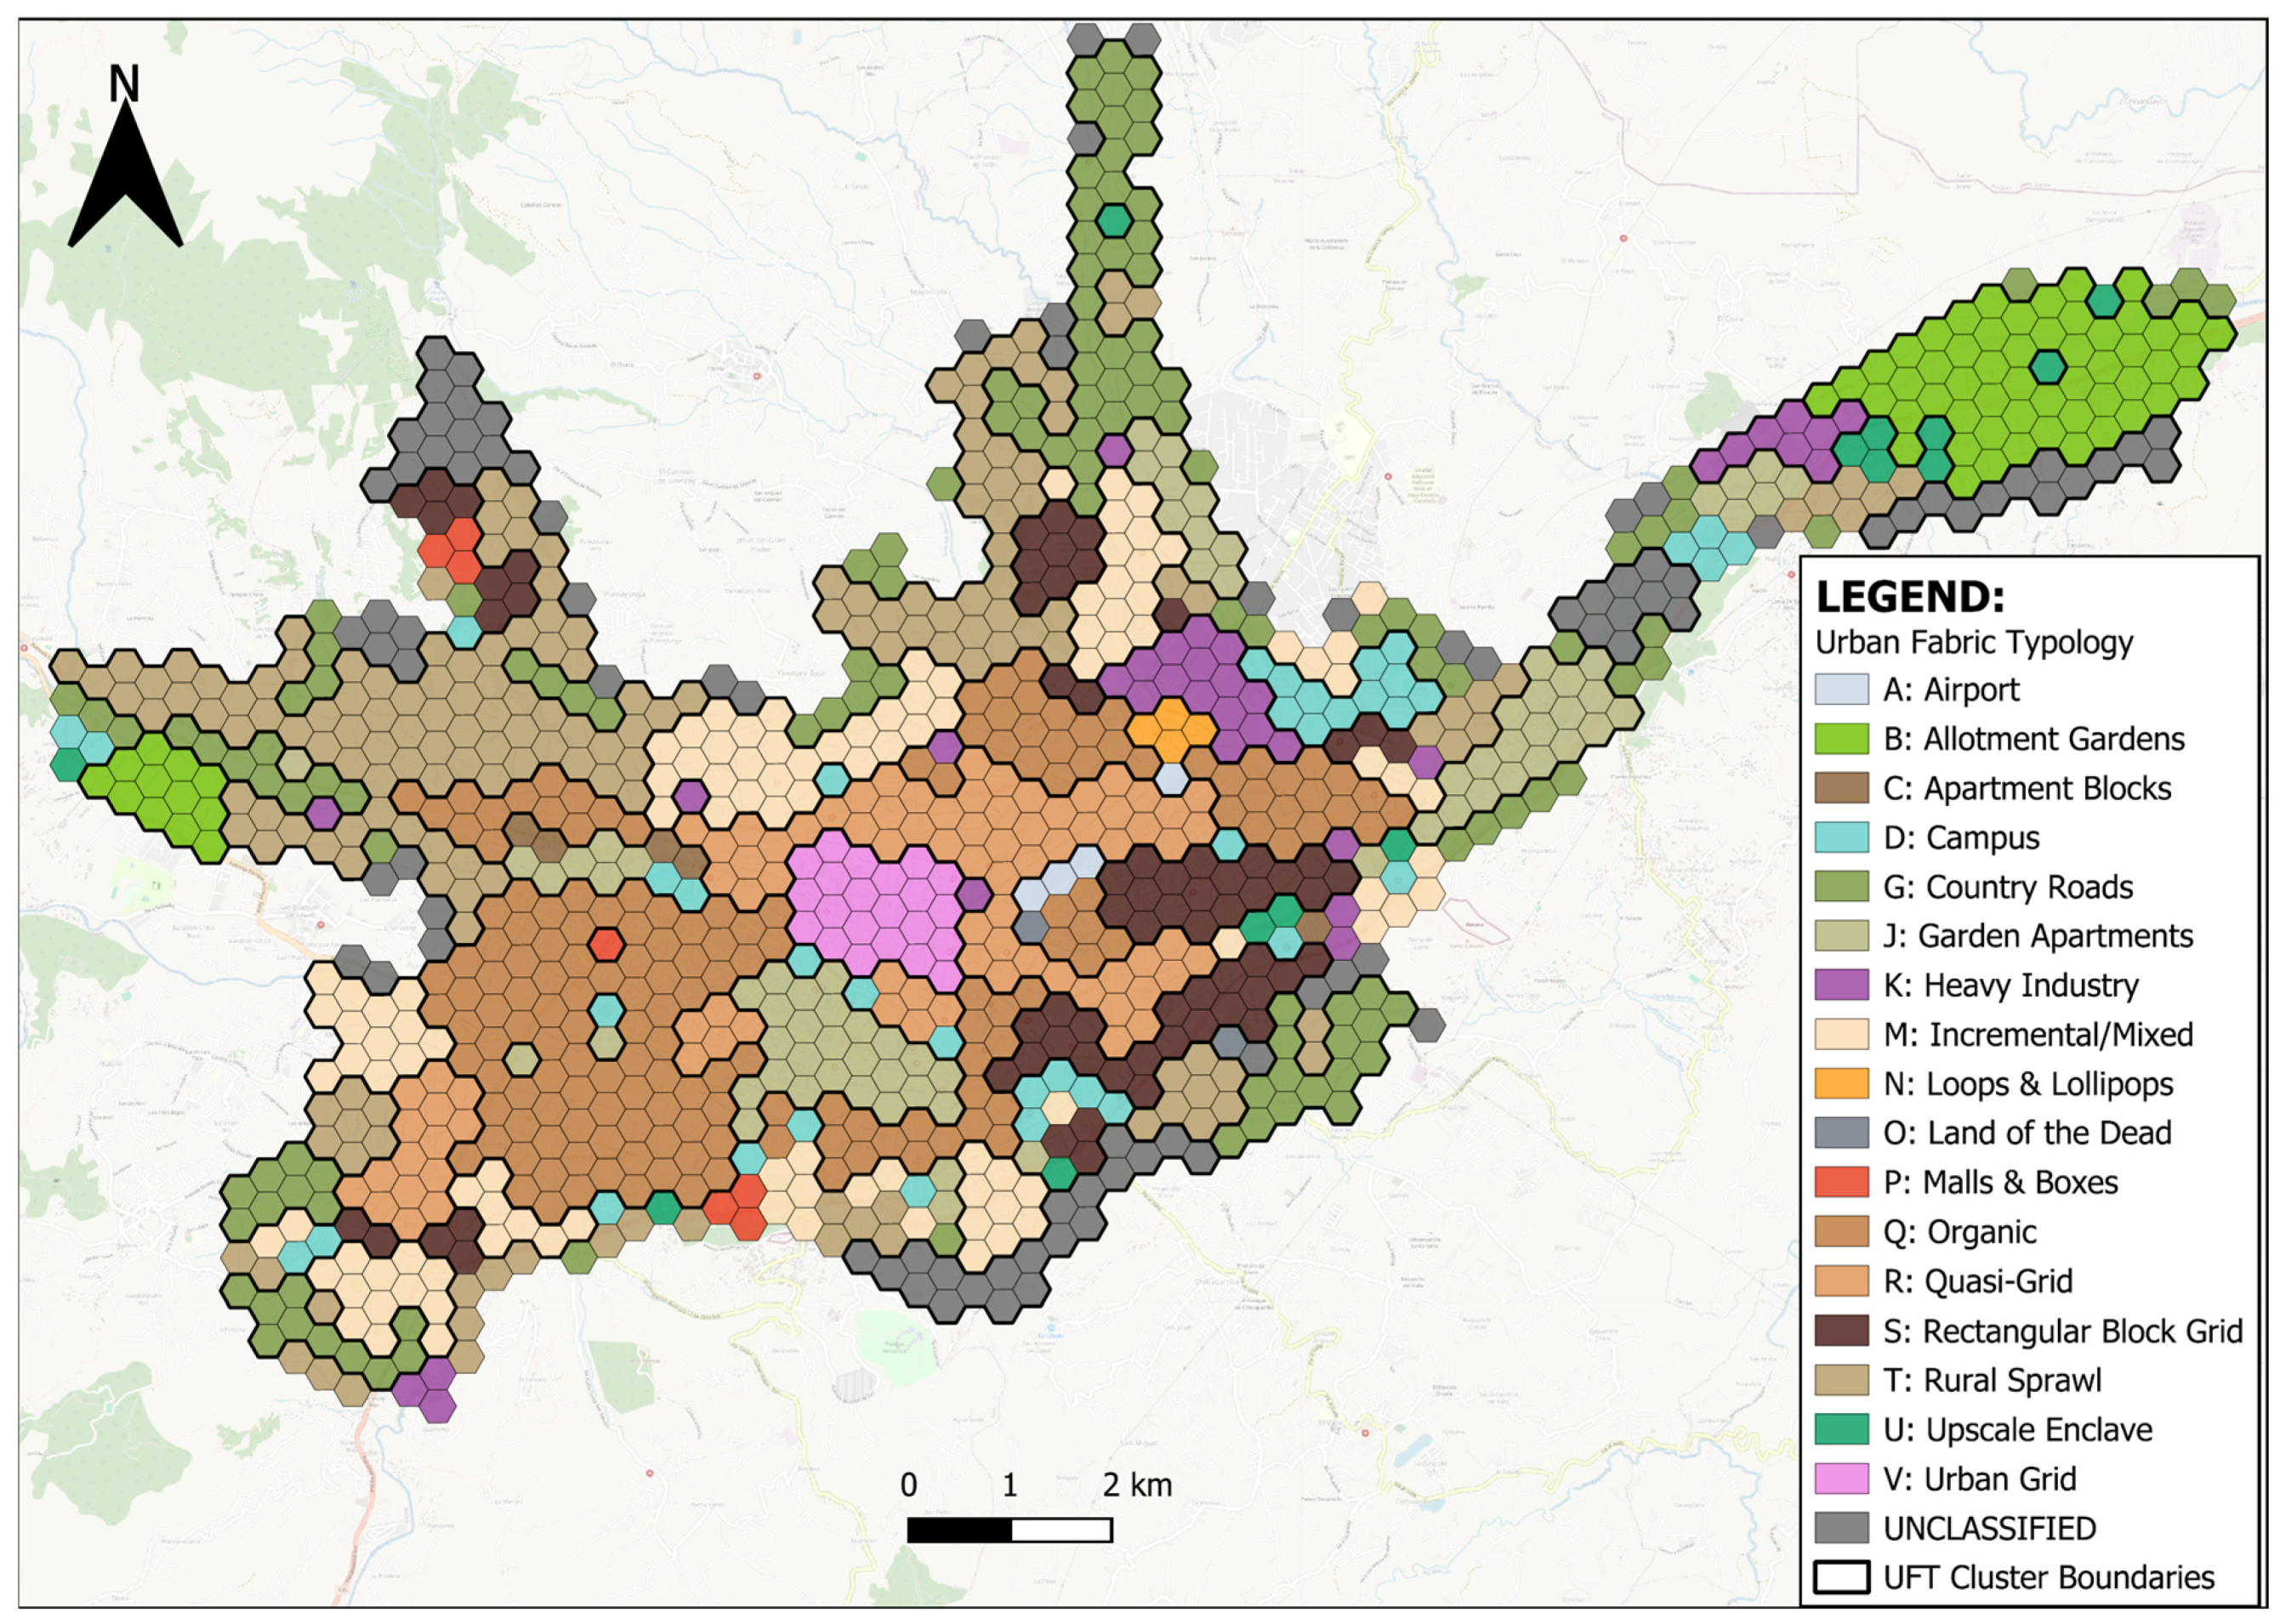
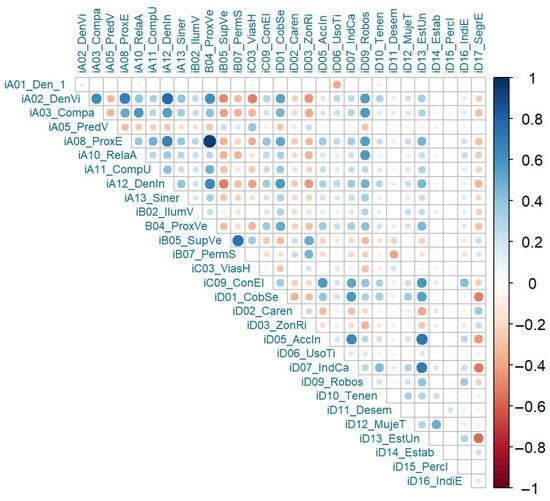
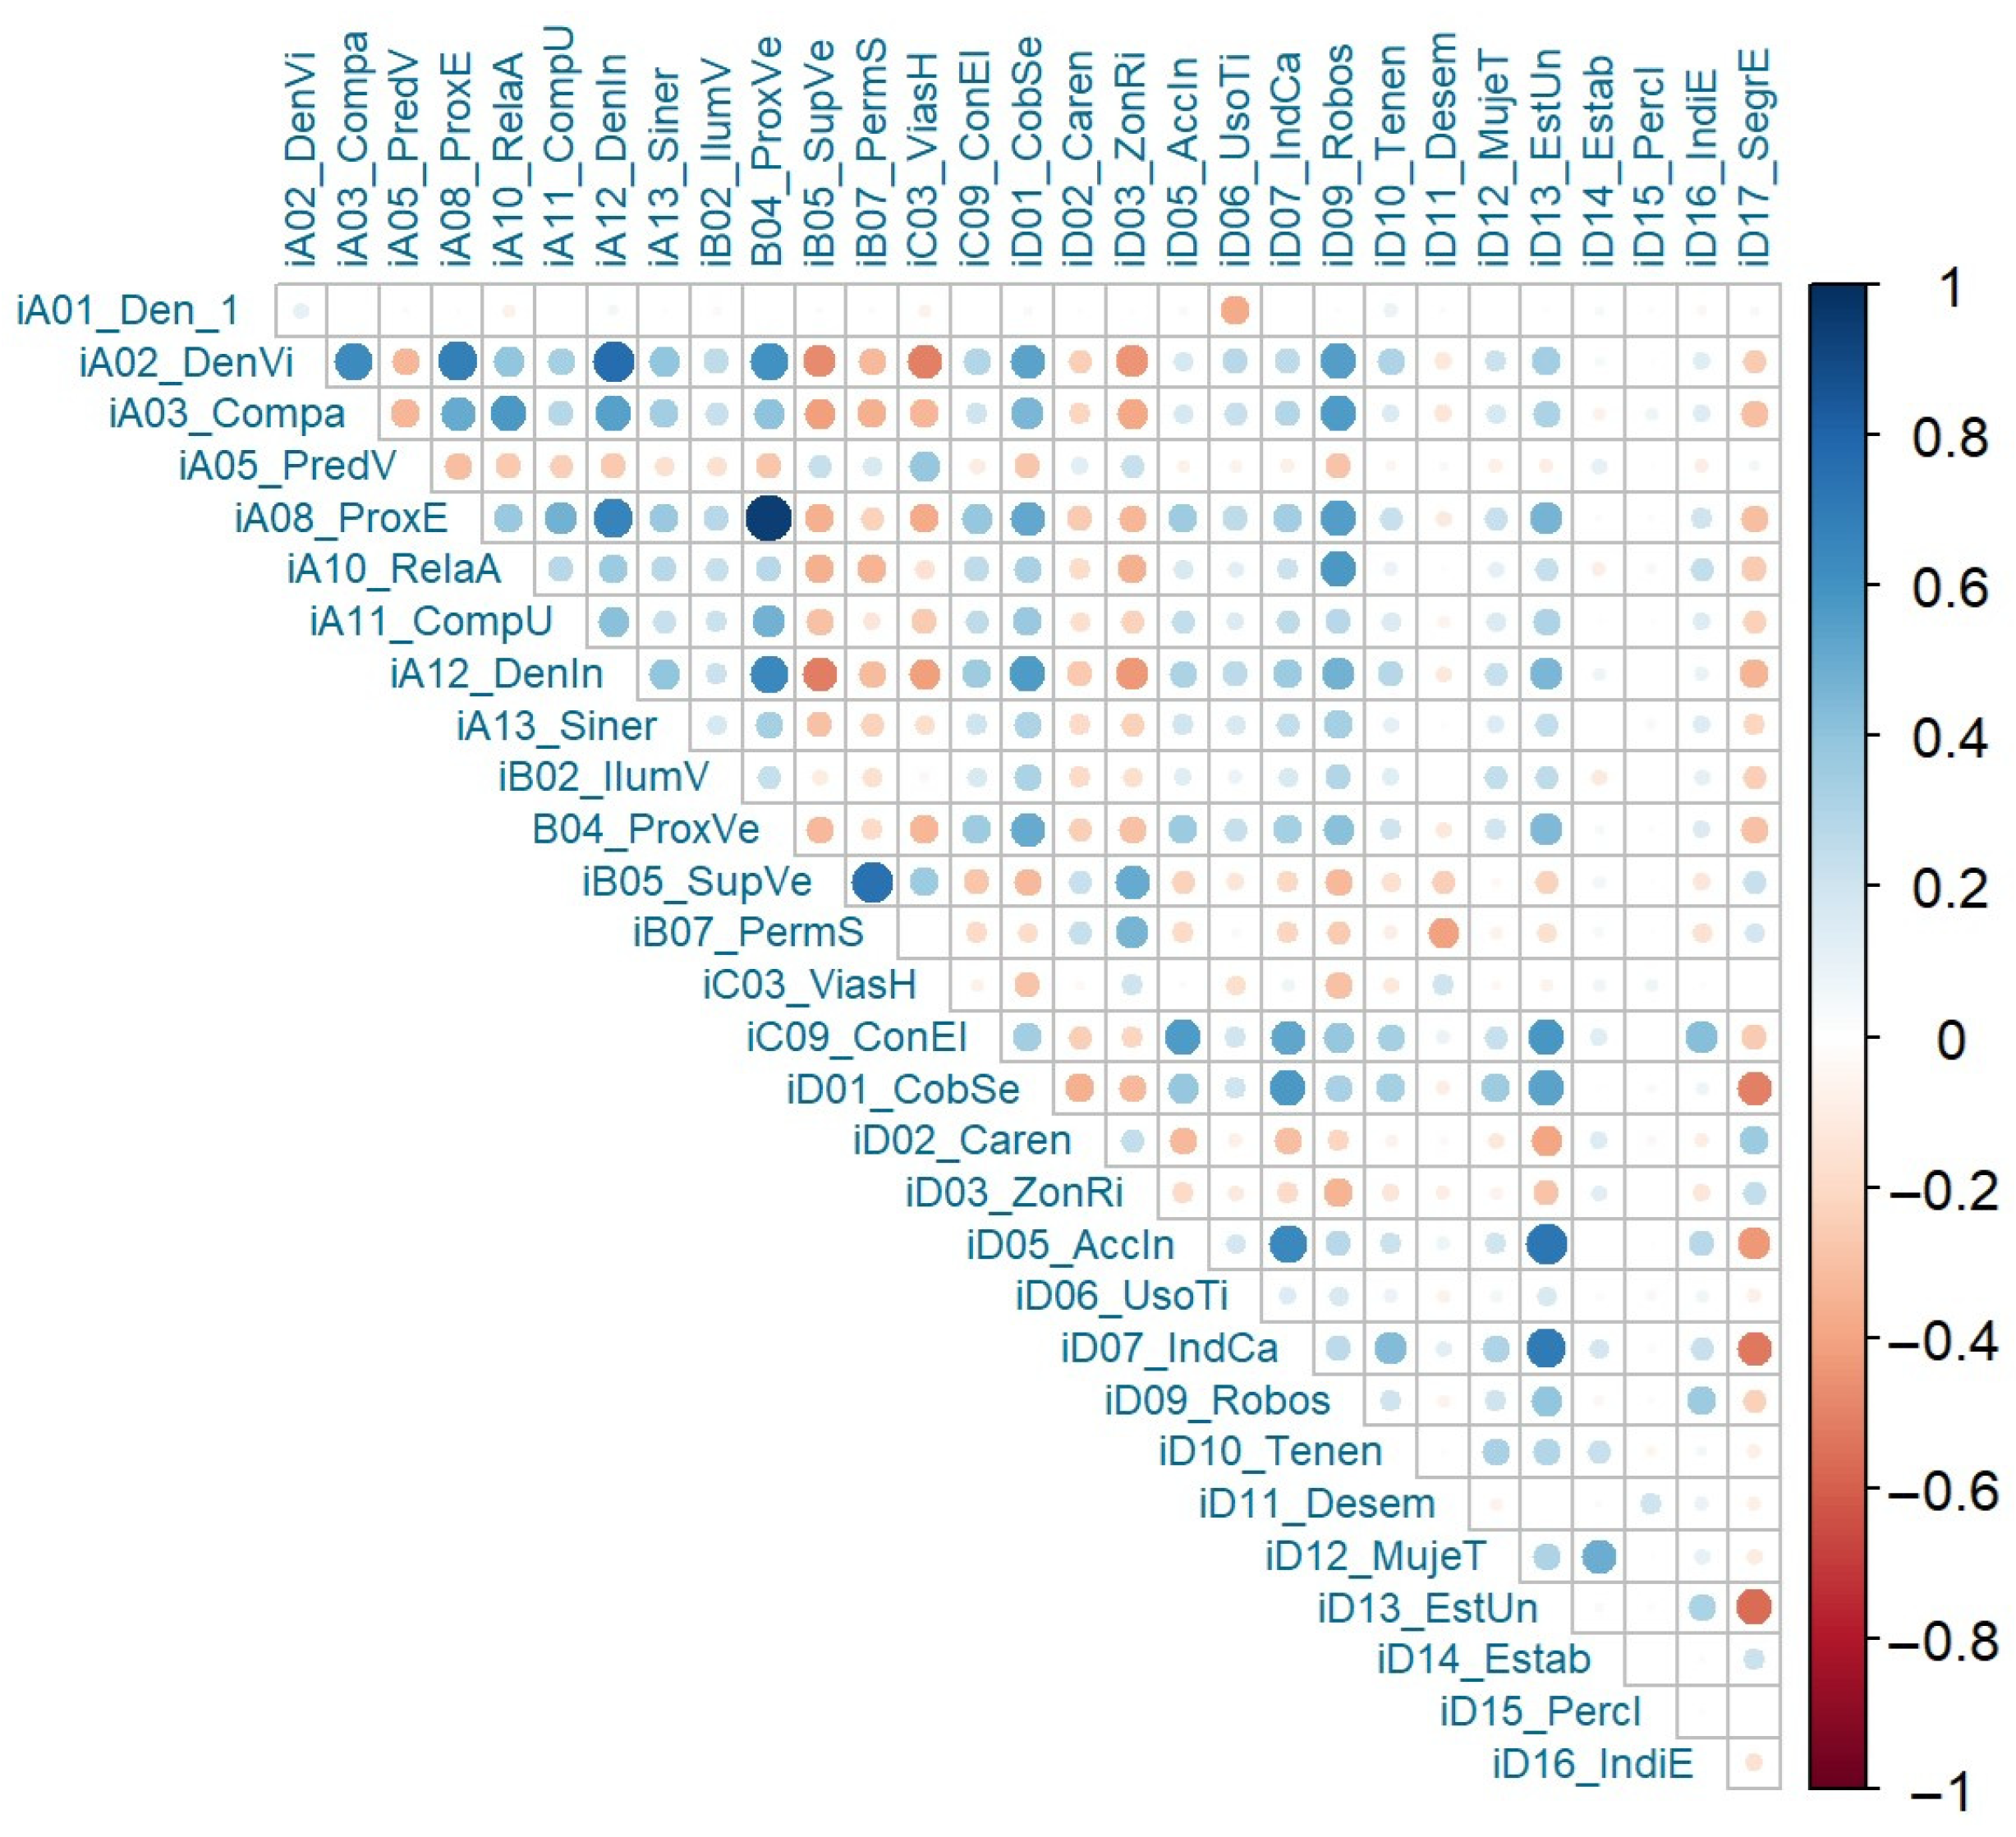
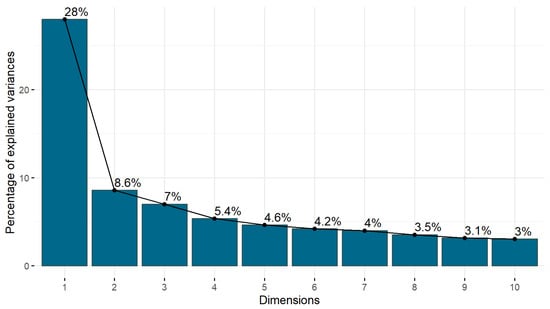
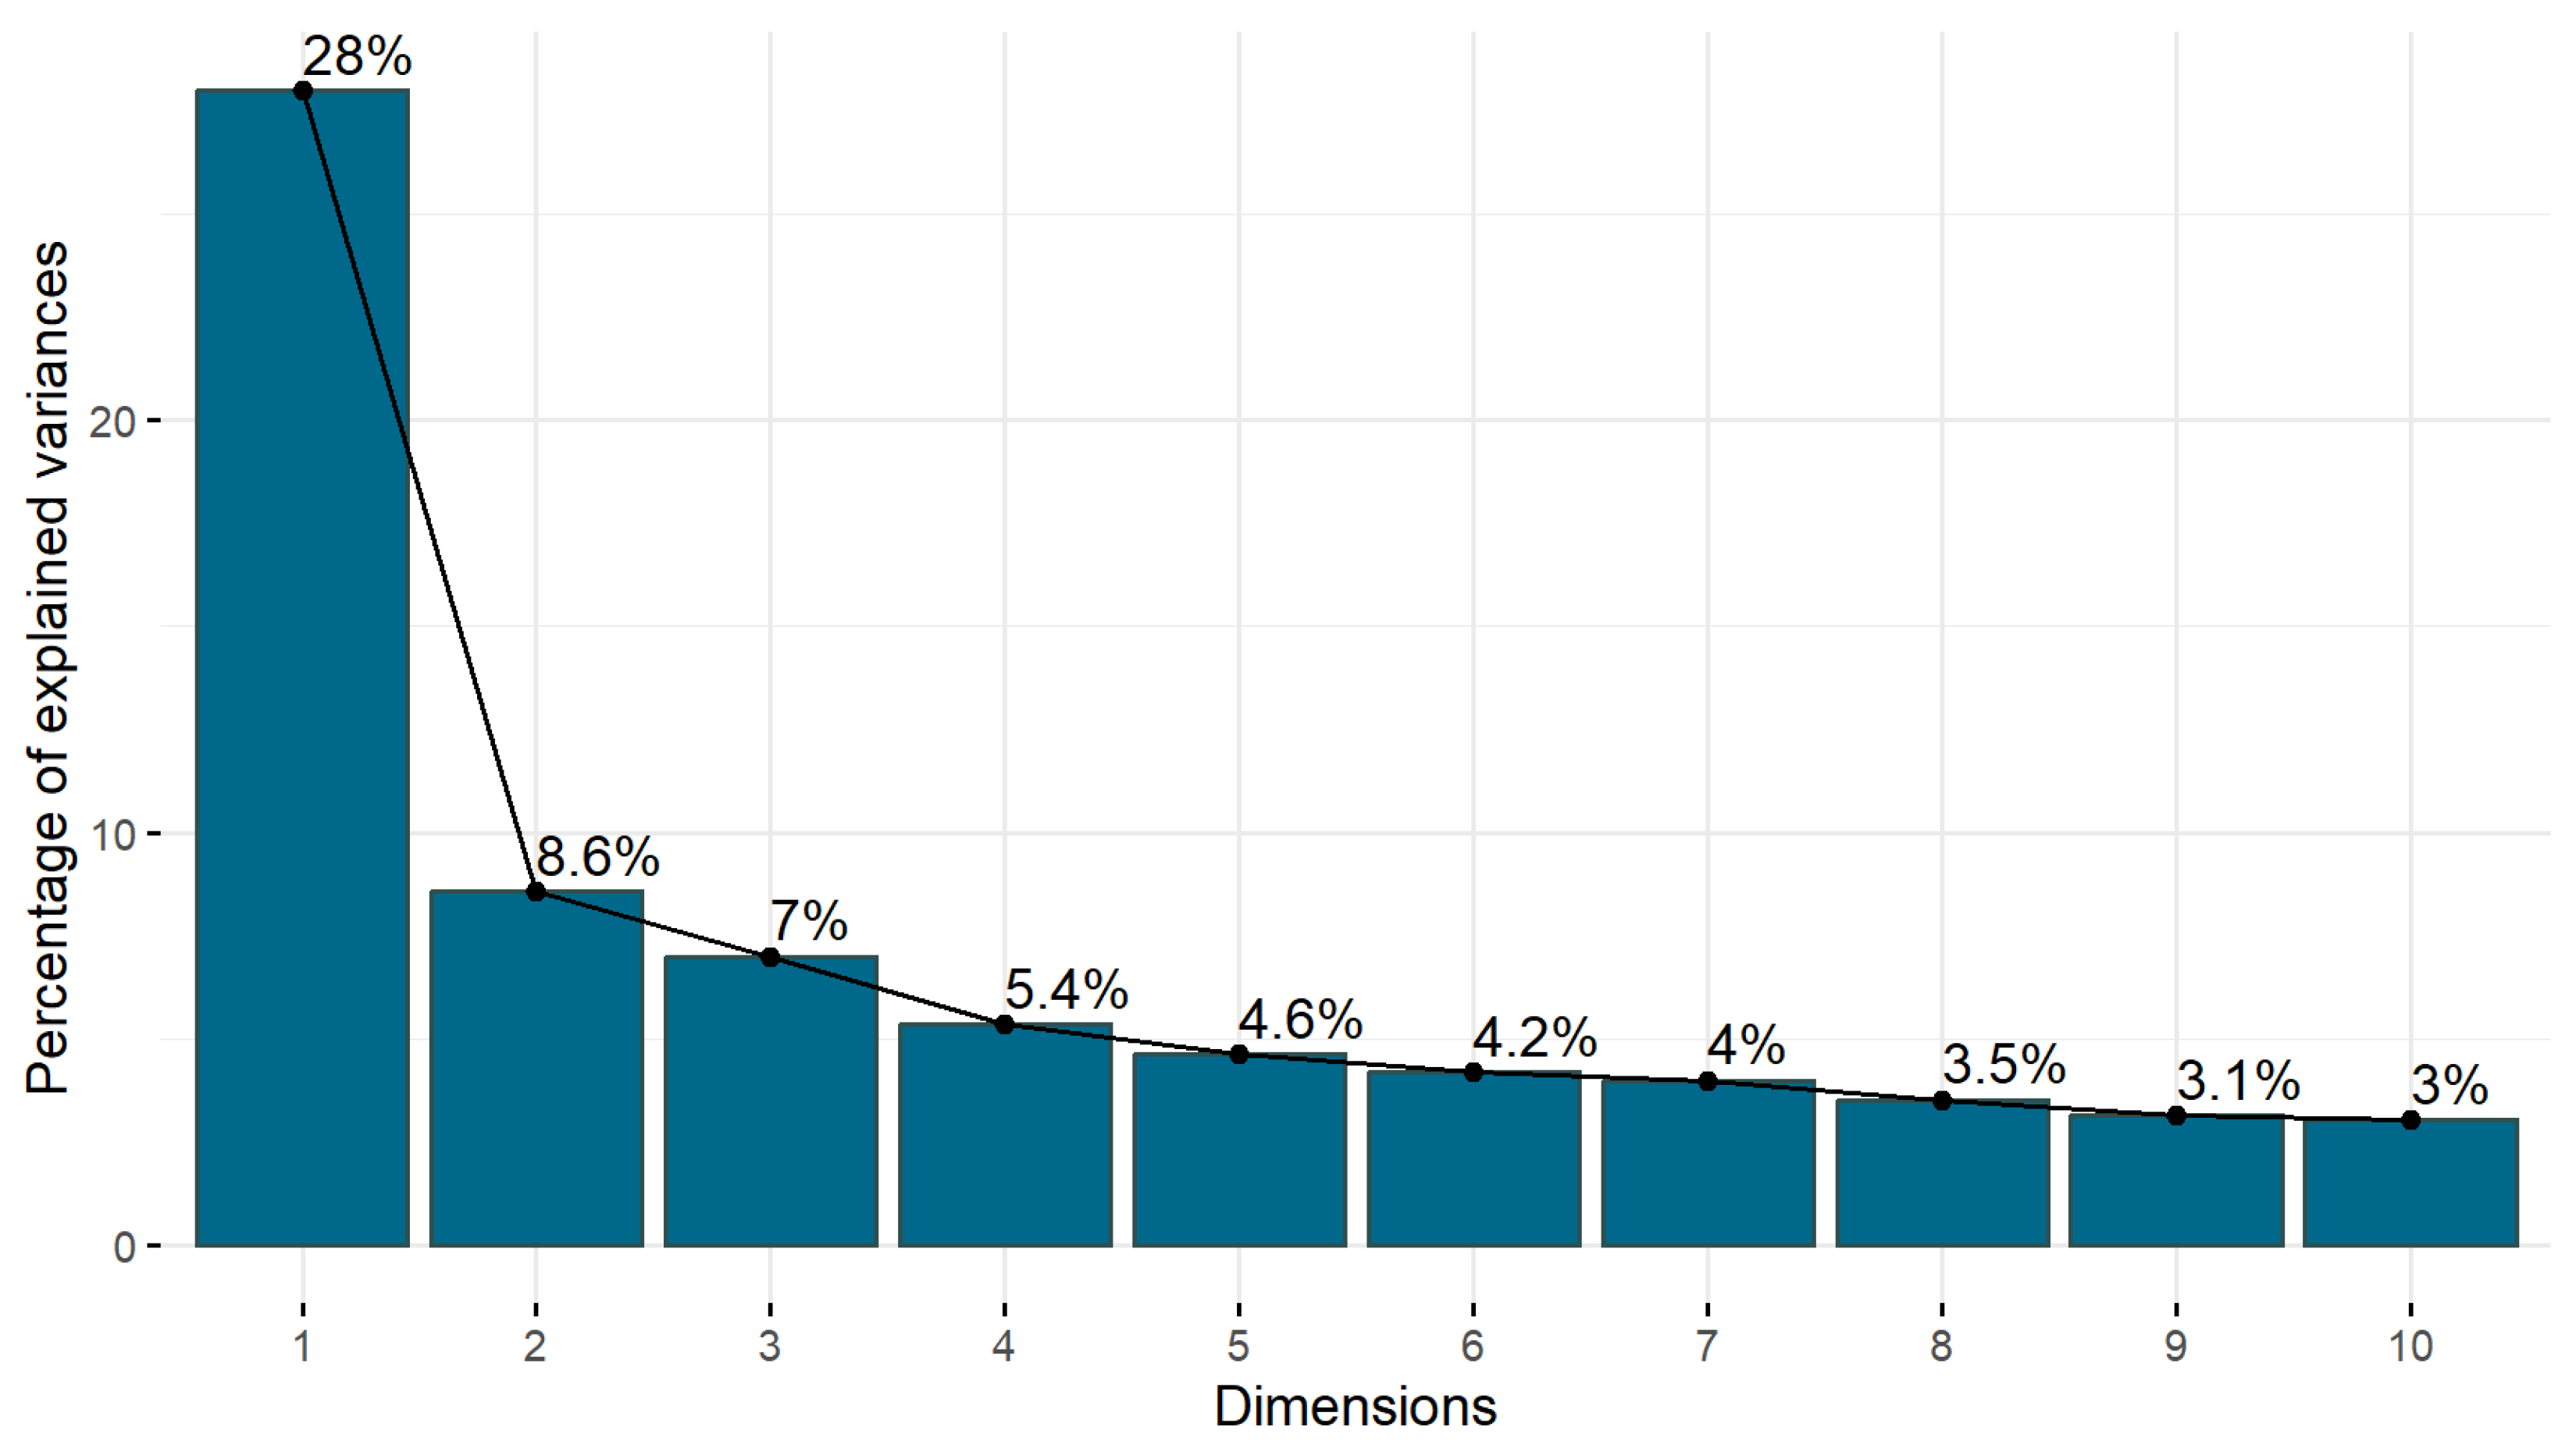
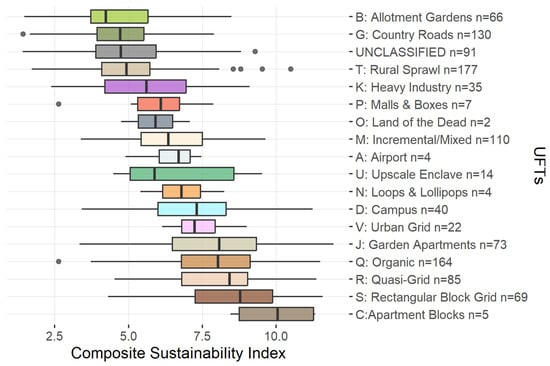
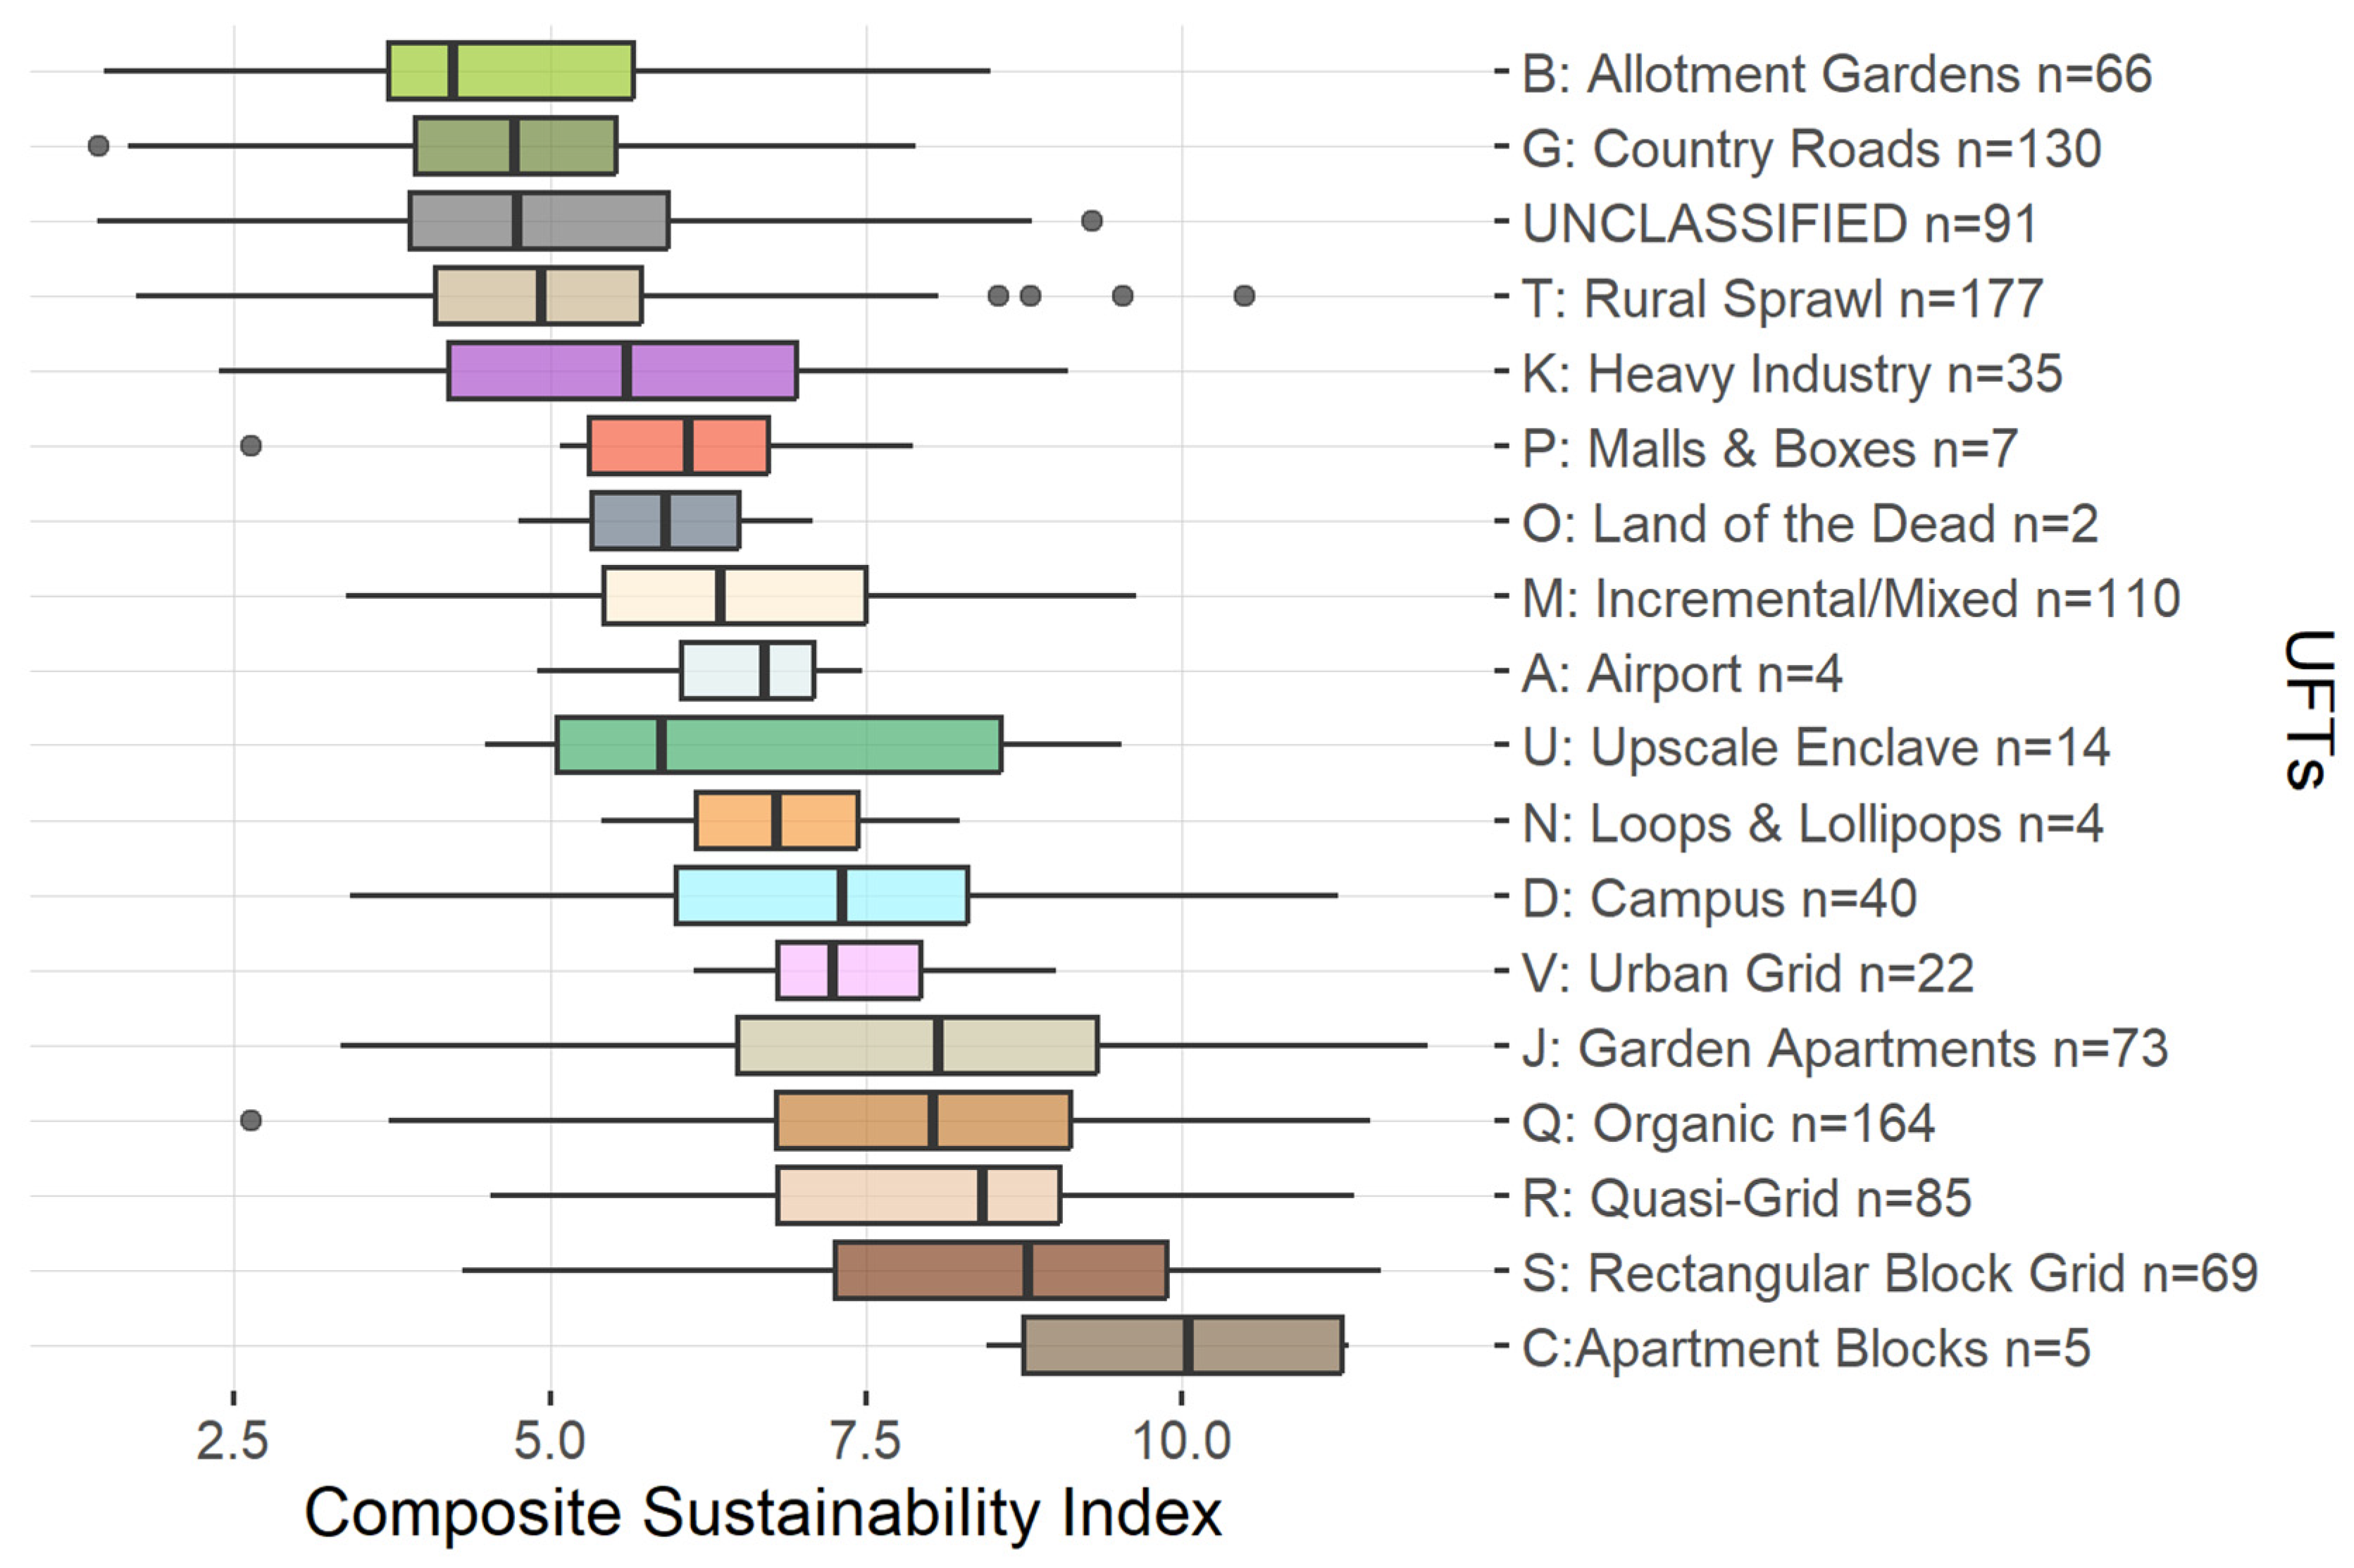
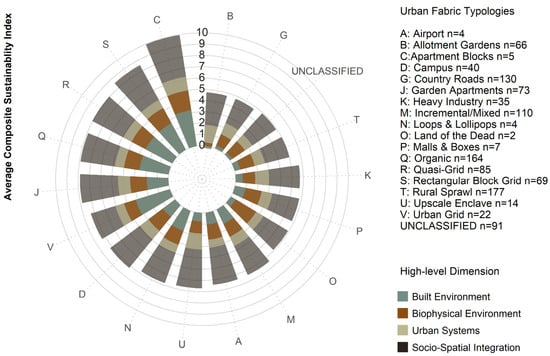
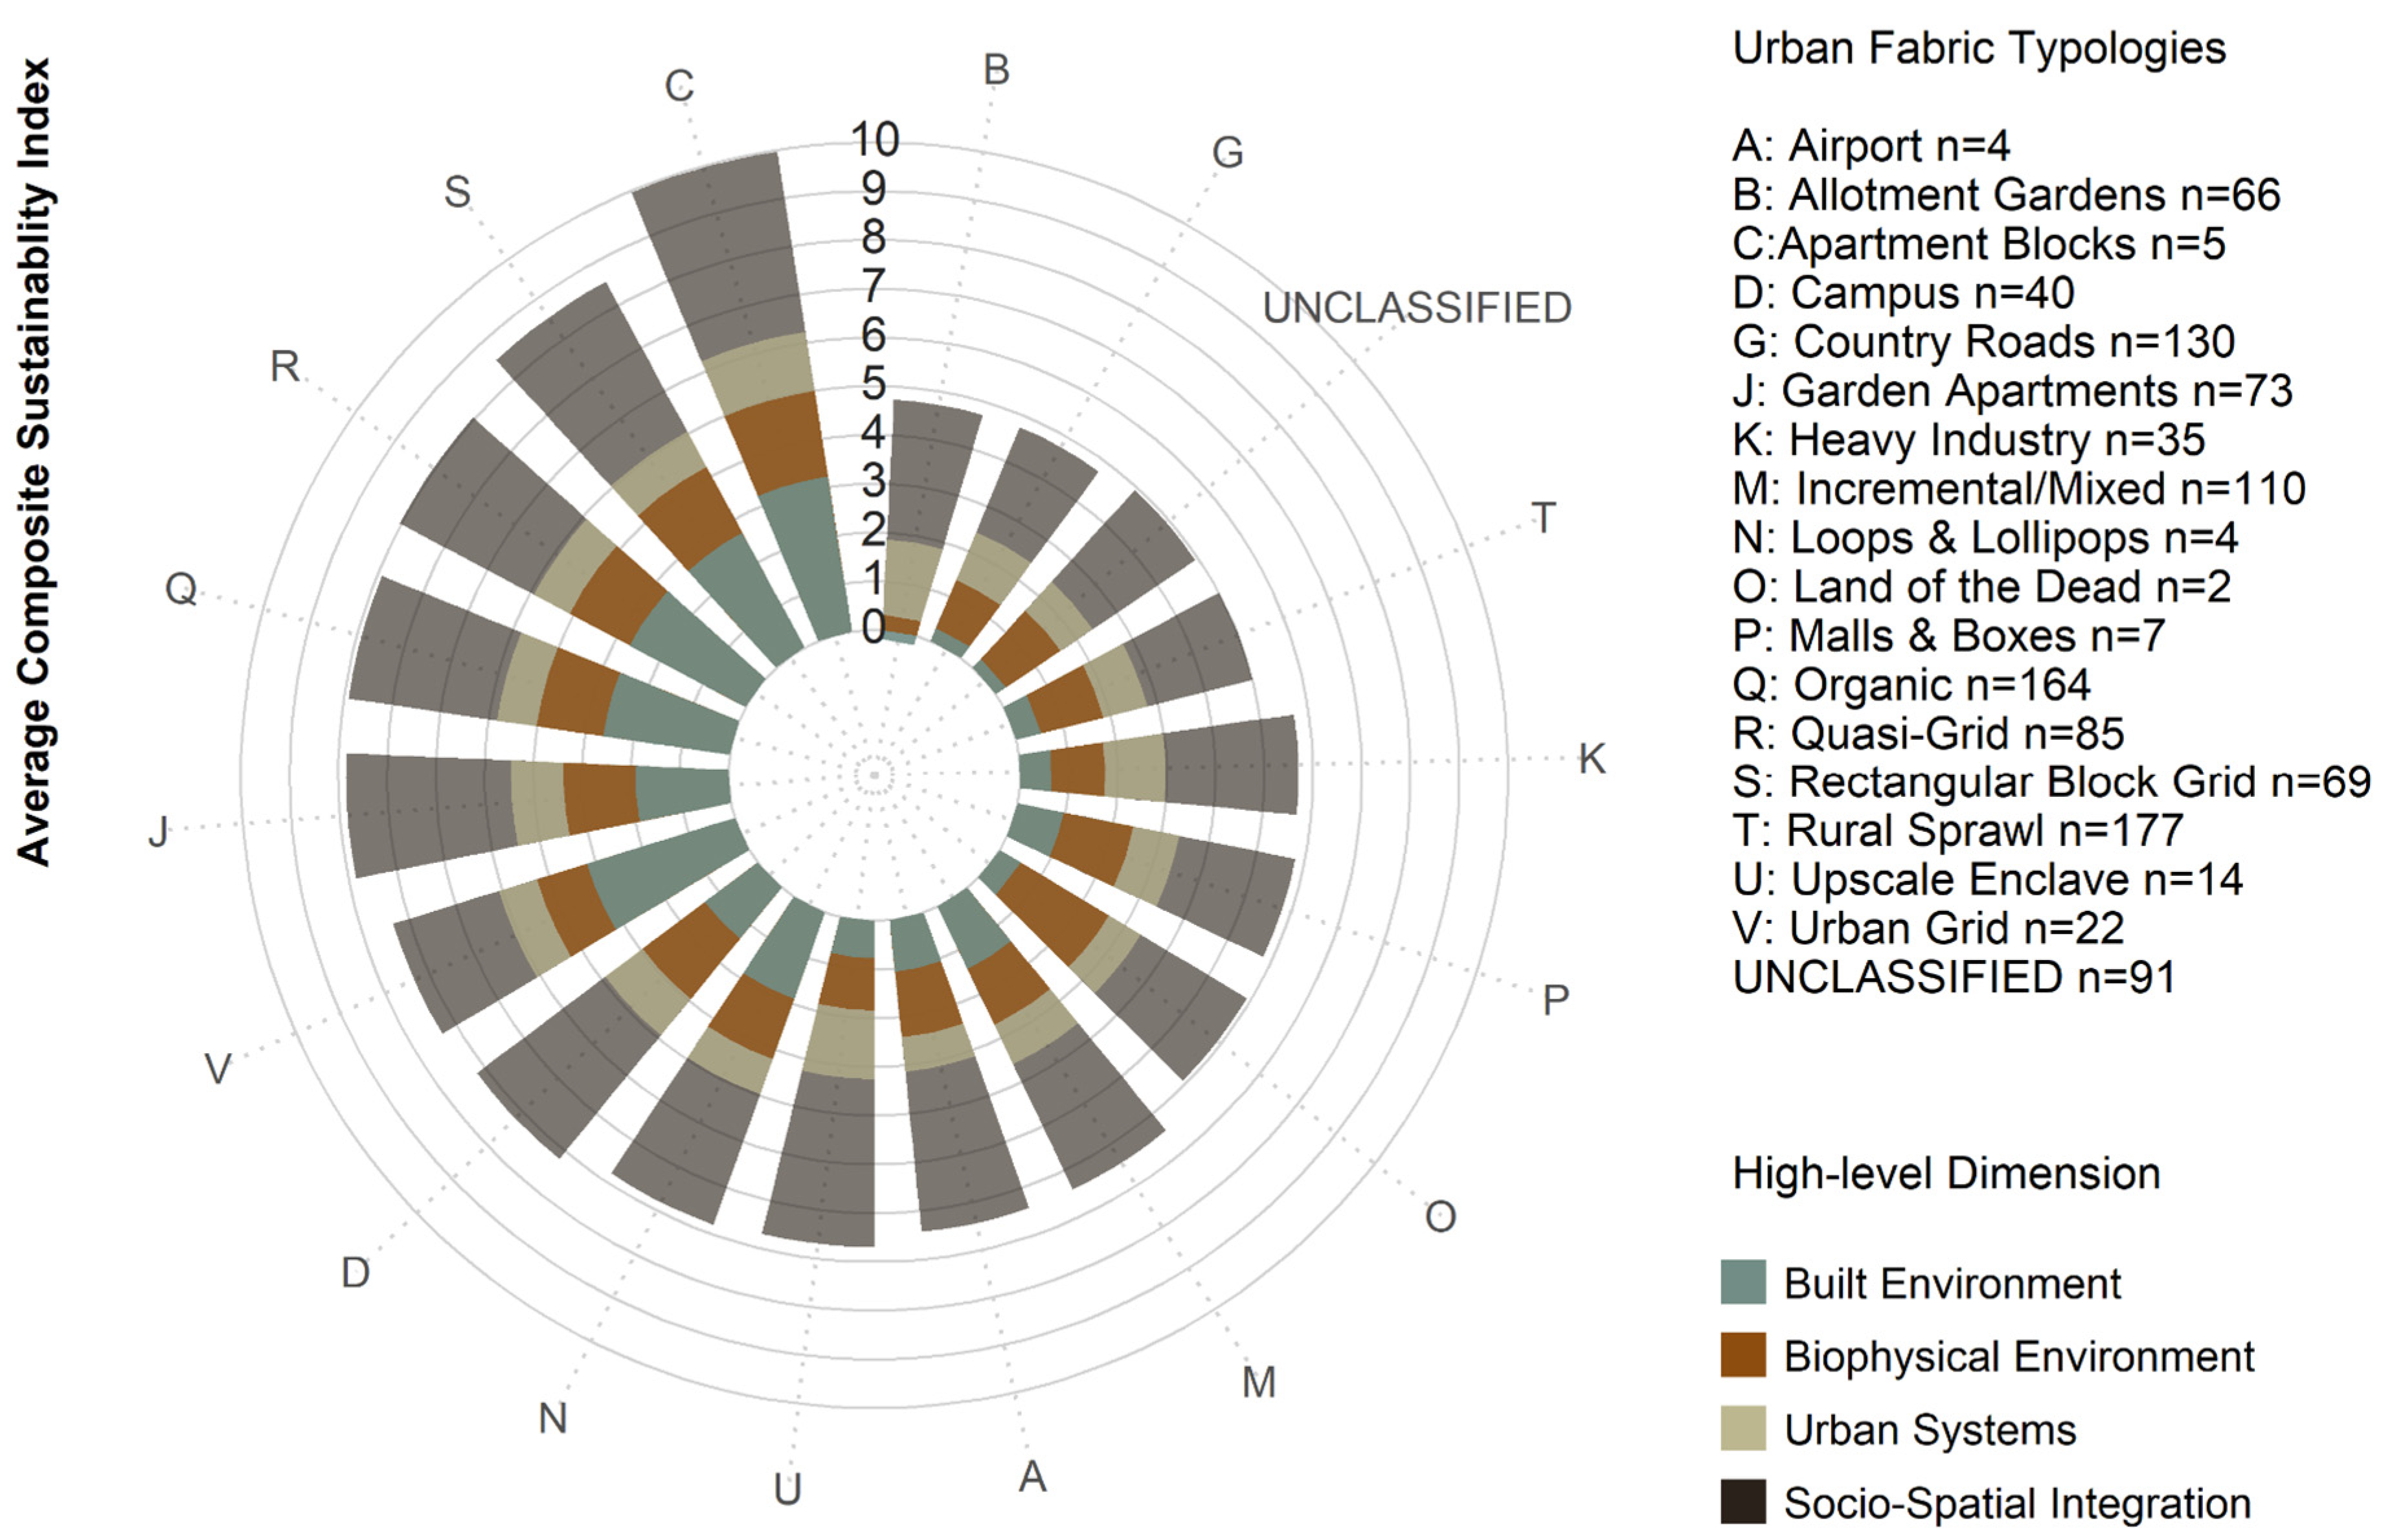
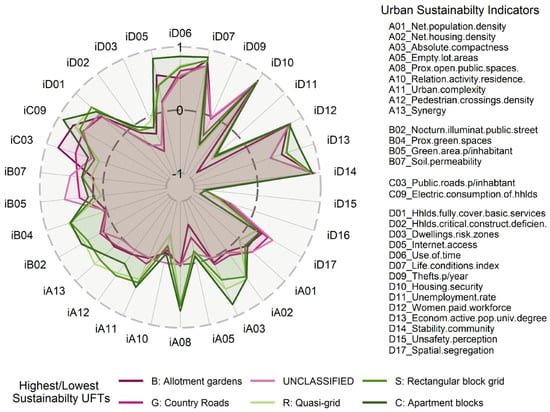
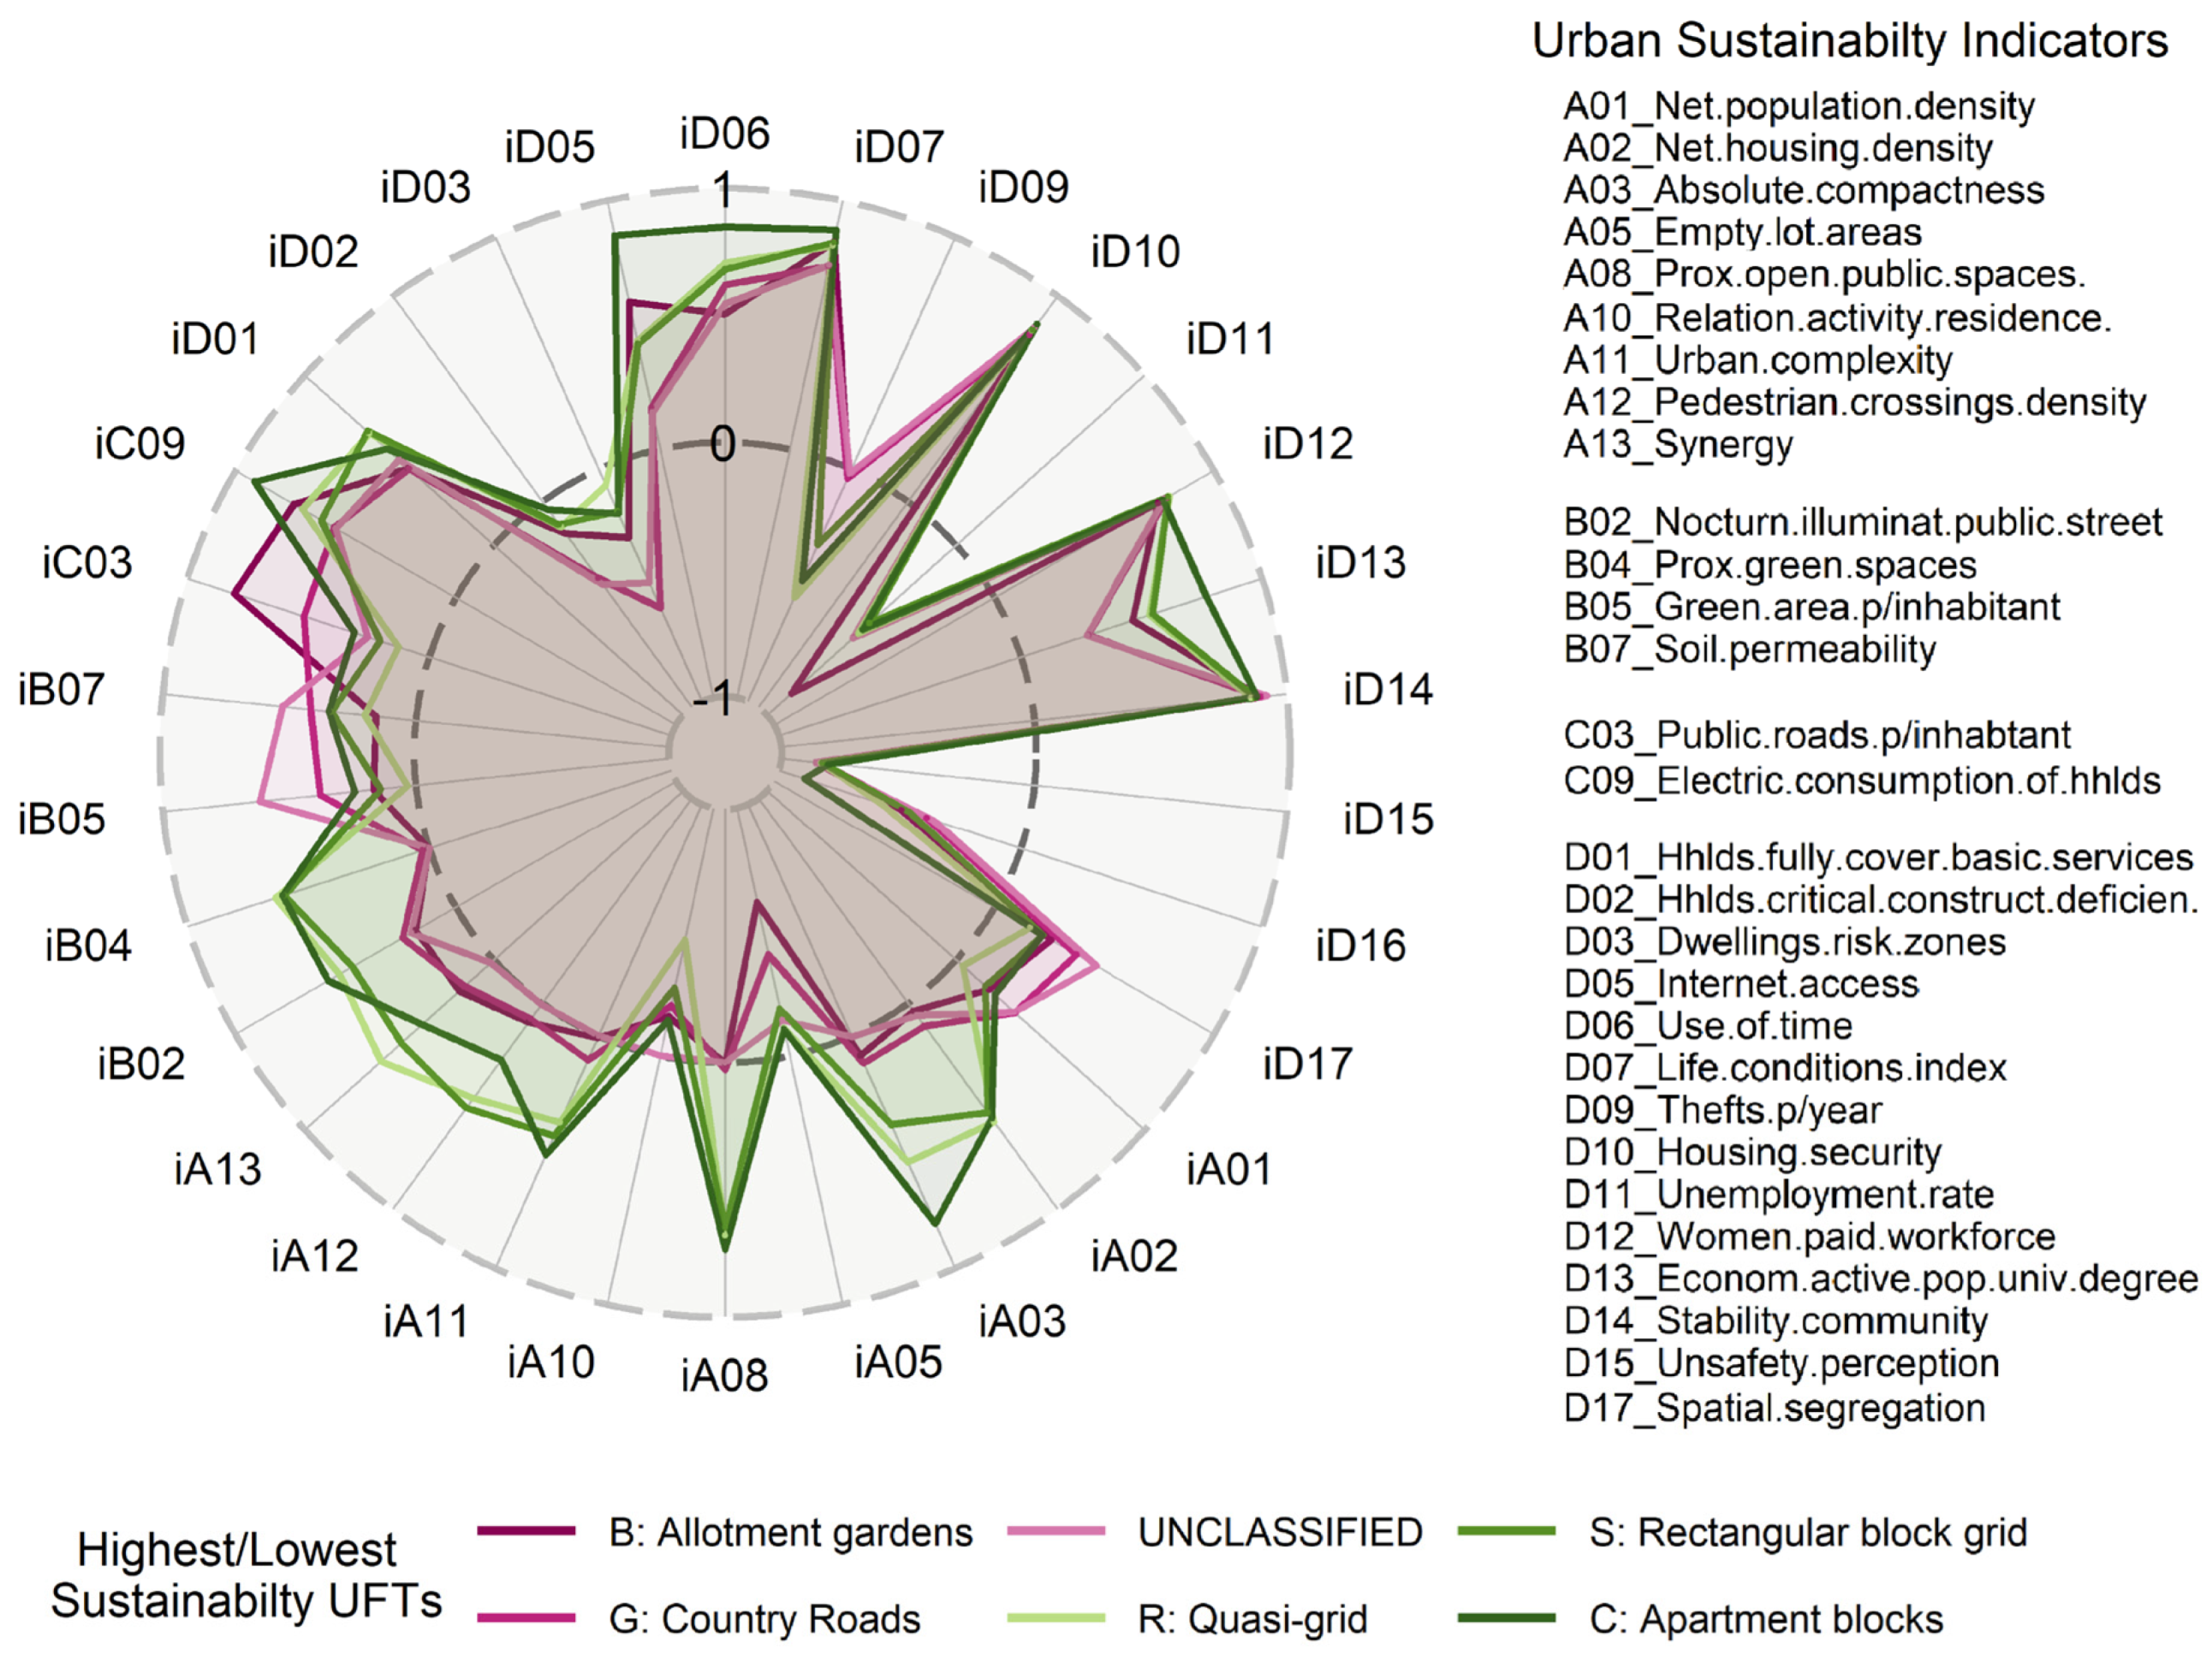
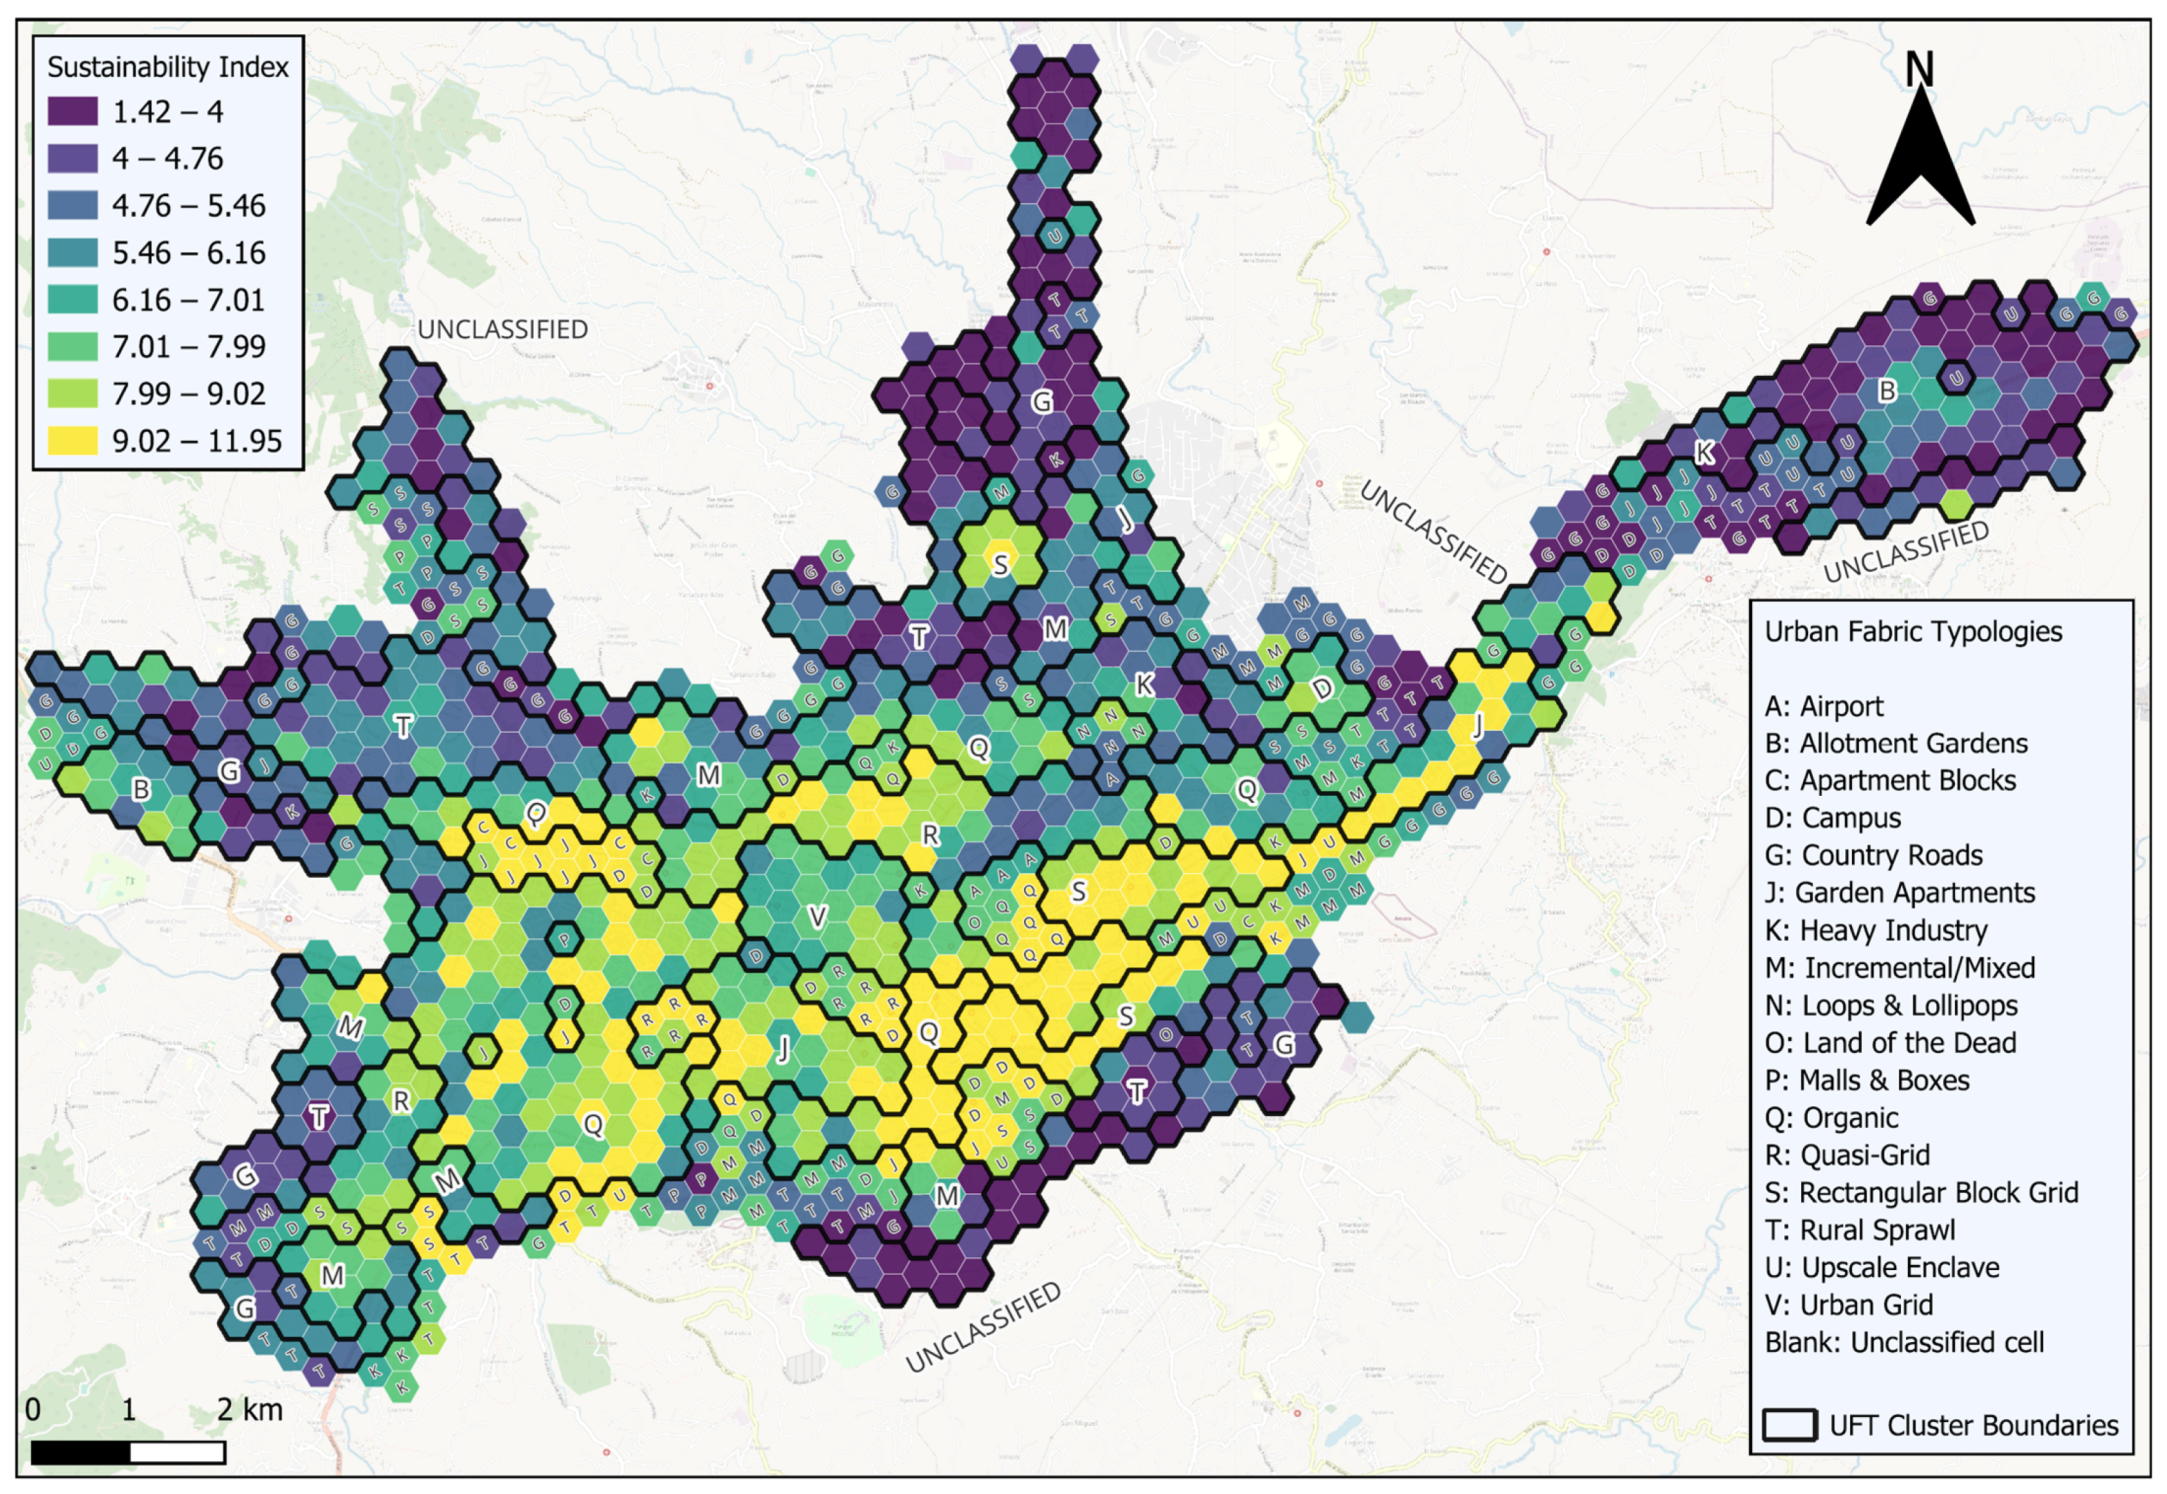
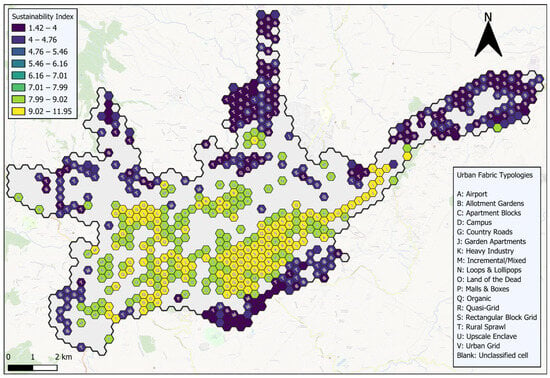
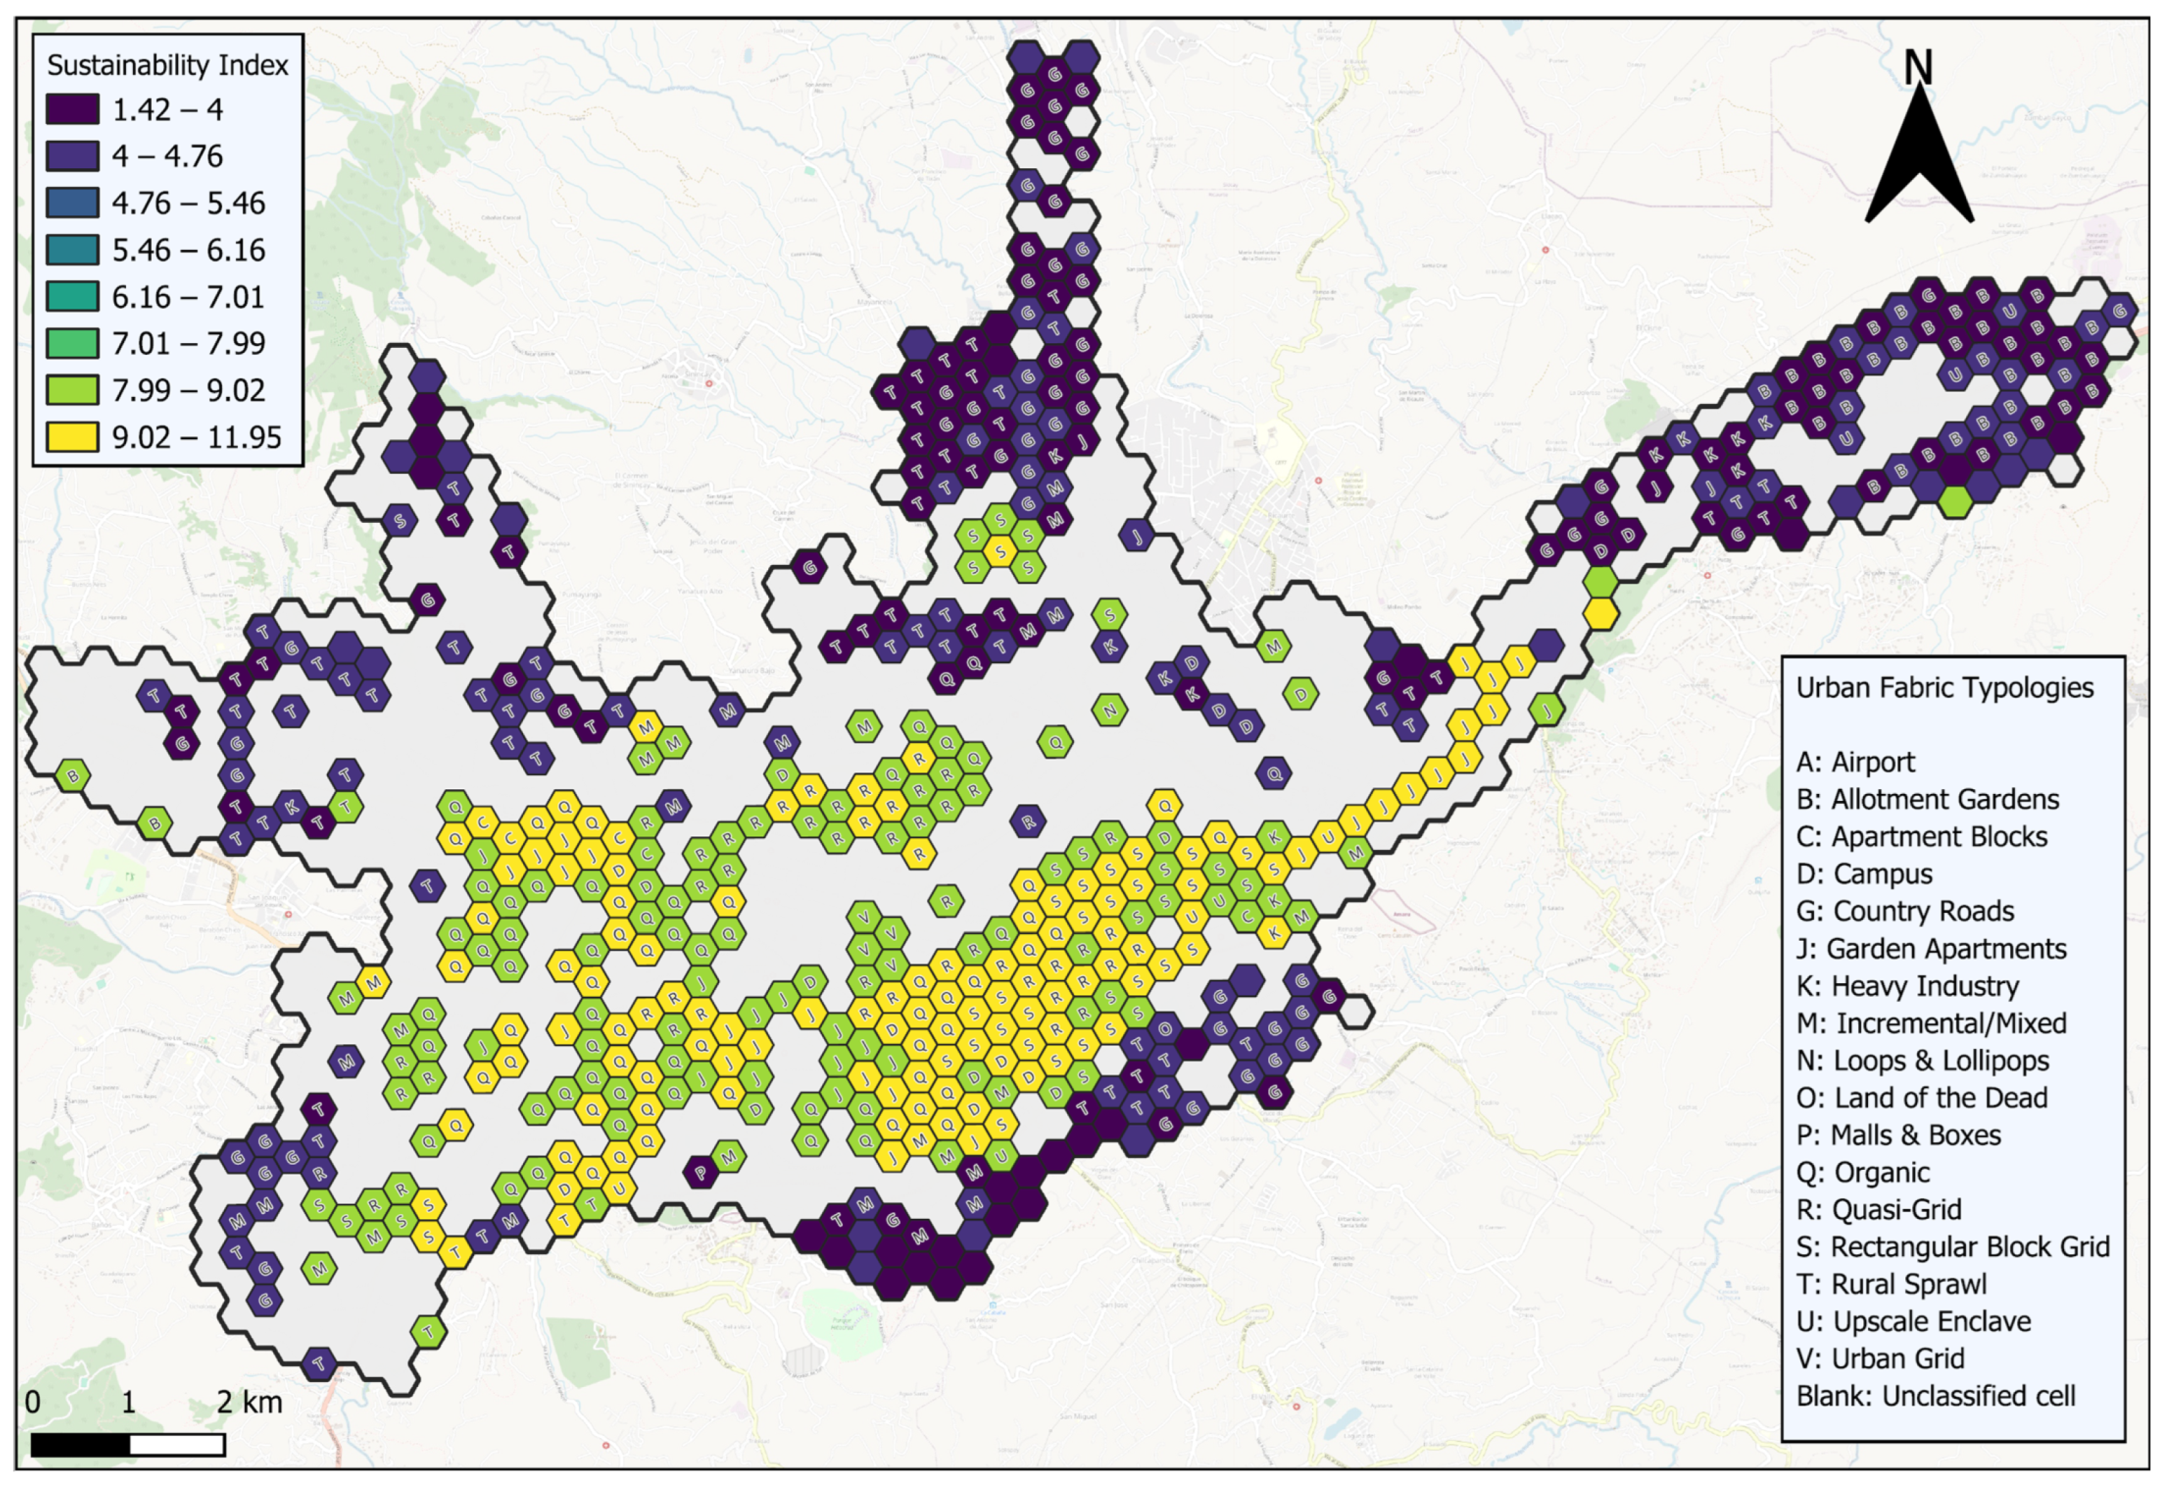
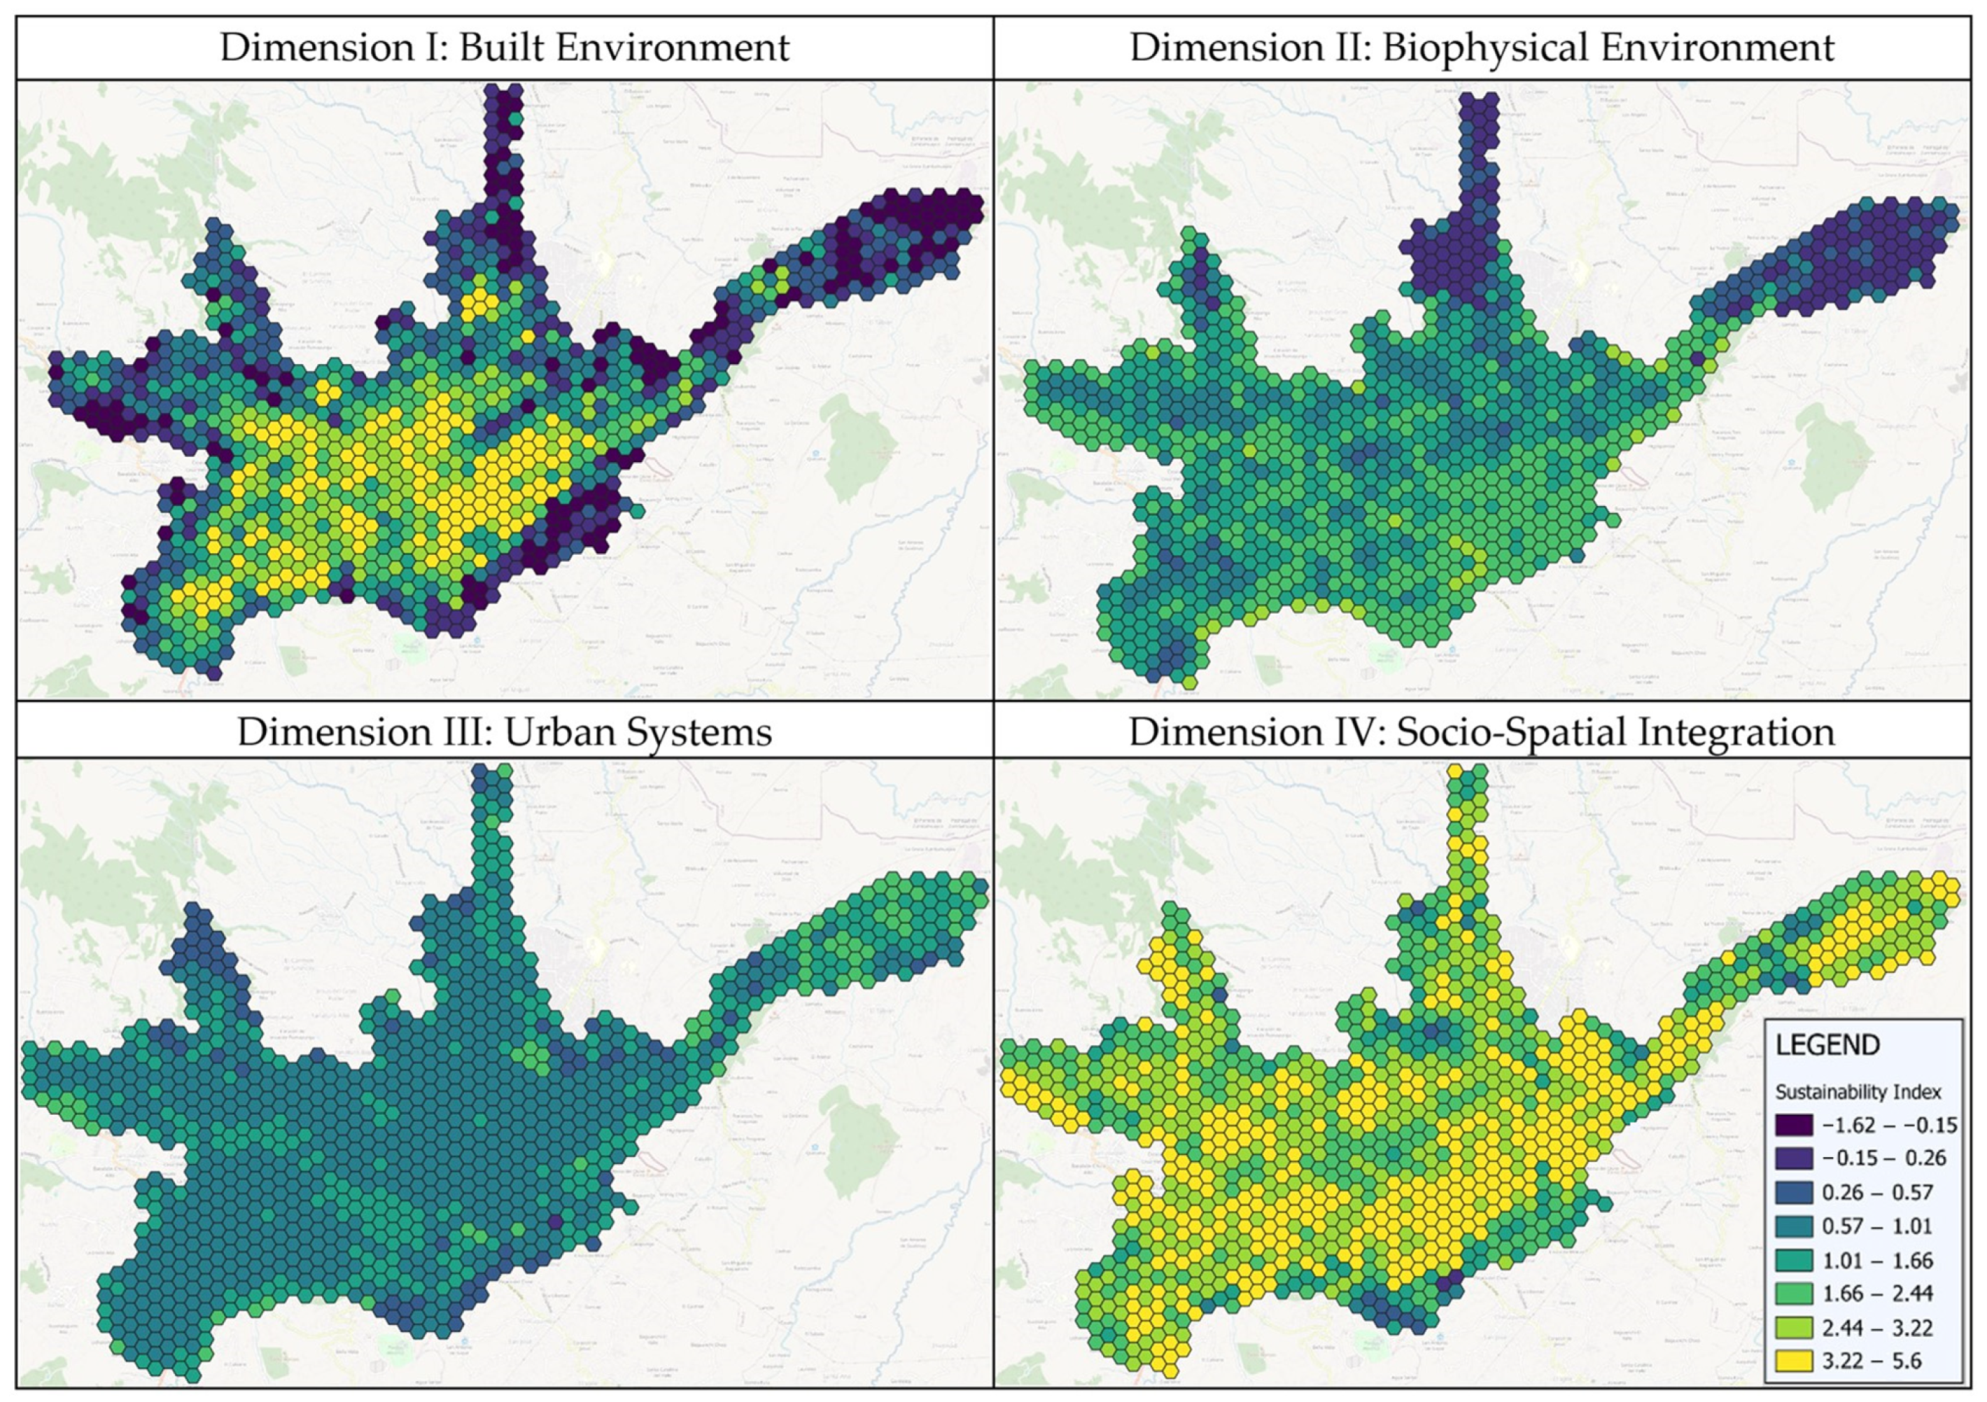

Disclaimer/Publisher’s Note: The statements, opinions and data contained in all publications are solely those of the individual author(s) and contributor(s) and not of MDPI and/or the editor(s). MDPI and/or the editor(s) disclaim responsibility for any injury to people or property resulting from any ideas, methods, instructions or products referred to in the content. |
© 2024 by the authors. Licensee MDPI, Basel, Switzerland. This article is an open access article distributed under the terms and conditions of the Creative Commons Attribution (CC BY) license (https://creativecommons.org/licenses/by/4.0/).