Abstract
For direct investment towards activities that significantly contribute to the achievement of the European Green Deal objectives, the European Union has adopted “Taxonomy Regulation”, which also applies disclosure requirements to financial institutions that finance the construction, renovation, or acquisition of buildings. For this reason, the financial sector needs methodologies and guidelines, adapted to the national situation, to define the primary energy thresholds to be used when assessing sustainability and financing the acquisition of real estate. This paper presents the methodology developed to identify 15% and 30% of the most energy-efficient national building stock in Lithuania based on EPC data. As a result, functional primary energy indicator (FPEI) threshold values are set for 17 distinct categories of existing buildings built by 31 December 2020. The 15% FPEI thresholds range from 81 kWh/m2 for warehouse buildings to 228 kWh/m2 for swimming pool buildings. Similarly, the 30% FPEI thresholds span from 104 kWh/m2 for warehouses to 303 kWh/m2 for foodservice buildings. The methodologies and threshold values are compared to other countries’ practice and recommendations are provided.
1. Introduction
Progress in the buildings sector to reduce energy consumption and achieve decarbonization remains insufficient due to political, economic, technological, and social challenges. Despite the sector’s ambition to reduce greenhouse gas emissions, efforts are insufficient, and action is too slow. Many countries around the world have yet to develop and implement robust climate action plans for the buildings sector. According to the Global Status Report for Buildings and Construction [1], as of 2023, as many as 161 countries have not yet implemented the necessary climate policy measures. The European Union, despite the existence of directives, faces challenges in the timely and effective transposition and implementation of these policies by Member States [2]. To achieve climate neutrality, the EU needs to ensure targeted policy interventions tailored to national contexts to reduce differences in effectiveness between countries, as seen in the Swedish and Greek cases [3].
Decarbonizing the buildings sector and improving energy efficiency requires significant investments. Economic barriers, such as the additional costs of retrofit projects and changing energy efficiency tariffs, reduce stakeholder confidence [1,4]. Financing schemes for energy efficiency projects are often limited and fundraising remains difficult. The cost of capital becomes an important barrier to the uptake of energy-efficient technologies [5].
Renovating existing buildings is necessary to reduce energy consumption, but the pace of renovation is insufficient. In the EU, renovation rates need to increase to meet energy efficiency targets [5]. Technological and infrastructural constraints also make it difficult to apply efficient technologies to existing infrastructure. Low-carbon technologies such as heat pumps and solar energy systems are important, but these technologies need to be economically attractive in different climate conditions [5].
Social factors have a significant impact. There is a lack of knowledge about sustainable practises among future building professionals [4], and there is a need to educate stakeholders about the potential of decarbonization and the circular economy. Cross-sectoral cooperation and the integration of sustainable practises can make a significant contribution to CO2 reduction targets [1]. Sub-national policy actions, such as retrofitting existing buildings and life-cycle CO2 reduction, are important for driving change [6].
The EU Taxonomy Regulation [7] is a key component of the European Green Deal to guide sustainable financing by providing a clear framework for classifying environmentally sustainable economic activities. The regulation impacts the building renovation, construction, and acquisition sectors, as well as the financial sector that supports these activities. The regulation aims to ensure that investments align with climate objectives, particularly the EU’s goal of achieving climate neutrality by 2050. The Taxonomy Regulation sets out the criteria for determining when an economic activity is environmentally sustainable. This includes activities in the construction sector, which must meet specific energy efficiency and emissions targets to be classified as sustainable [8,9]. The regulation highlights the importance of energy performance. Benchmarks chosen for sustainability assessment include the 15% most efficient buildings in terms of primary energy demand and CO2 emissions. This is to encourage the renovation and construction of high-energy performance buildings [8,10].
The Taxonomy Regulation aims to channel private finance into sustainable projects by providing clear guidance on what constitutes sustainable investment. This influences banks and financial institutions to prioritize lending to projects that meet these sustainability criteria, which can have an impact on loan terms and investment strategies [11]. While the regulation provides a framework for sustainable investments, it also poses challenges such as the need for reliable data and reporting.
The taxonomy requirements related to the assessment of the 15% most efficient buildings are relevant for the classification and comparison of buildings in different EU countries. The aim is to establish clear indicators for high-energy performance buildings (HEPBs) to ensure that investments are in line with sustainability objectives. However, the diversity of national regulations makes this uniformity difficult to achieve. It is therefore necessary to develop a consistent taxonomic framework to define and classify HEPBs, enhancing market confidence and understanding of energy efficiency targets [10].
The harmonization of energy performance indicators, listed in the Energy Performance of Buildings Directive (EPBD) [12], is particularly important for achieving uniform energy efficiency standards across EU countries. A harmonized framework can improve the quality, reliability, and availability of data, ensuring more accurate policy-making and implementation [13,14]. The classification of buildings according to primary energy performance also contributes to the development of Nearly Zero Energy Buildings (NZEBs) by supporting both national and regional efforts to reduce energy demand and greenhouse gas emissions [15].
The discrepancies in the accessibility and quality of operational energy data, the criteria employed in the evaluation of actual energy efficiency, and the methodologies utilized for assessing energy performance give rise to inconsistencies and a heightened complexity in the comparison of energy performance ratings of existing buildings in EU countries. Standardized methodologies and training of assessors are recommended to address these issues. The classification of buildings according to primary energy performance needs to consider technological and economic contexts, including the availability and feasibility of energy-saving technologies [16,17]. Integrated Urban Building Energy Model (UBEM) systems using data from energy performance certificates (EPCs) and other open sources contribute to a more accurate assessment of energy consumption at the national level, providing detailed insights into the energy performance of buildings [18]. Primary energy indicators help assess the impact of integrating renewable energy sources on building performance by encouraging energy-saving technologies such as heat pumps or solar energy systems. These indicators allow the prioritization of renovation strategies that contribute most to energy savings and emission reductions in line with national carbon reduction targets [19].
While the classification of buildings according to primary energy performance is important for sustainability and energy efficiency, the limitations of existing approaches need to be considered. The comparison of methodologies and criteria for identifying the top 15% of the most energy-efficient buildings in different EU countries is presented in Table 1.
Table 1.
The comparison of methodologies and criteria for identifying the top 15% of the most energy-efficient buildings in different EU countries.
As can be seen from Table 1, different countries use different data, methodologies, and criteria to evaluate energy performance, leading to inconsistencies between countries’ classification systems. This shortcoming makes it difficult to compare buildings, and the differences in methodologies between countries further complicate the uniformity of NZEB definitions. Thus, the lack of a common methodology for energy performance assessment and the different scopes of NZEB definitions create challenges for building comparability, which calls for improvements in data quality and availability [18,27].
The further standardization of EPCs is also necessary to allow comparisons of building energy performance across the EU [14]. Table 2 compares the methodologies of some countries with similar climates in terms of how buildings are categorized and what thresholds are set to define the most efficient buildings.
Table 2.
Comparison of threshold values between countries.
As can be seen from the literature review and the different approaches to setting up the top 15% of most energy-efficient buildings used by EU countries, harmonized EPCs, energy performance indicators, and methodologies are needed to ensure an accurate assessment.
The scope of the performed study was to develop a methodology to identify 15% and 30% of the most energy-efficient residential and non-residential buildings in Lithuania, enabling financial institutions to make environmentally sustainable investments as required by the Taxonomy Regulation. Key principles used in the study are as follows:
- -
- The methodology is based on reliable evidence;
- -
- The methodology uses data from available and reliable data sources;
- -
- The energy performance of the assets concerned must be comparable to the energy performance of the national building stock built by 31 December 2020; e.g., Nearly Zero Energy Buildings, which in the case of Lithuania are A++, are excluded.
Taking into account the concepts of primary energy [7,28,29,30,31] and the requirements for the determination of primary energy in the energy performance assessment methodologies of other EU countries, the threshold values for the assessment of 15% and 30% efficient buildings were selected according to the functional primary energy demand indicator. This indicator includes the share of primary energy from non-renewable sources (used for the assessment of the cost-optimal performance) and is in line with the methodology of the primary energy calculation in Guidelines 2012/C 115/01 [28].
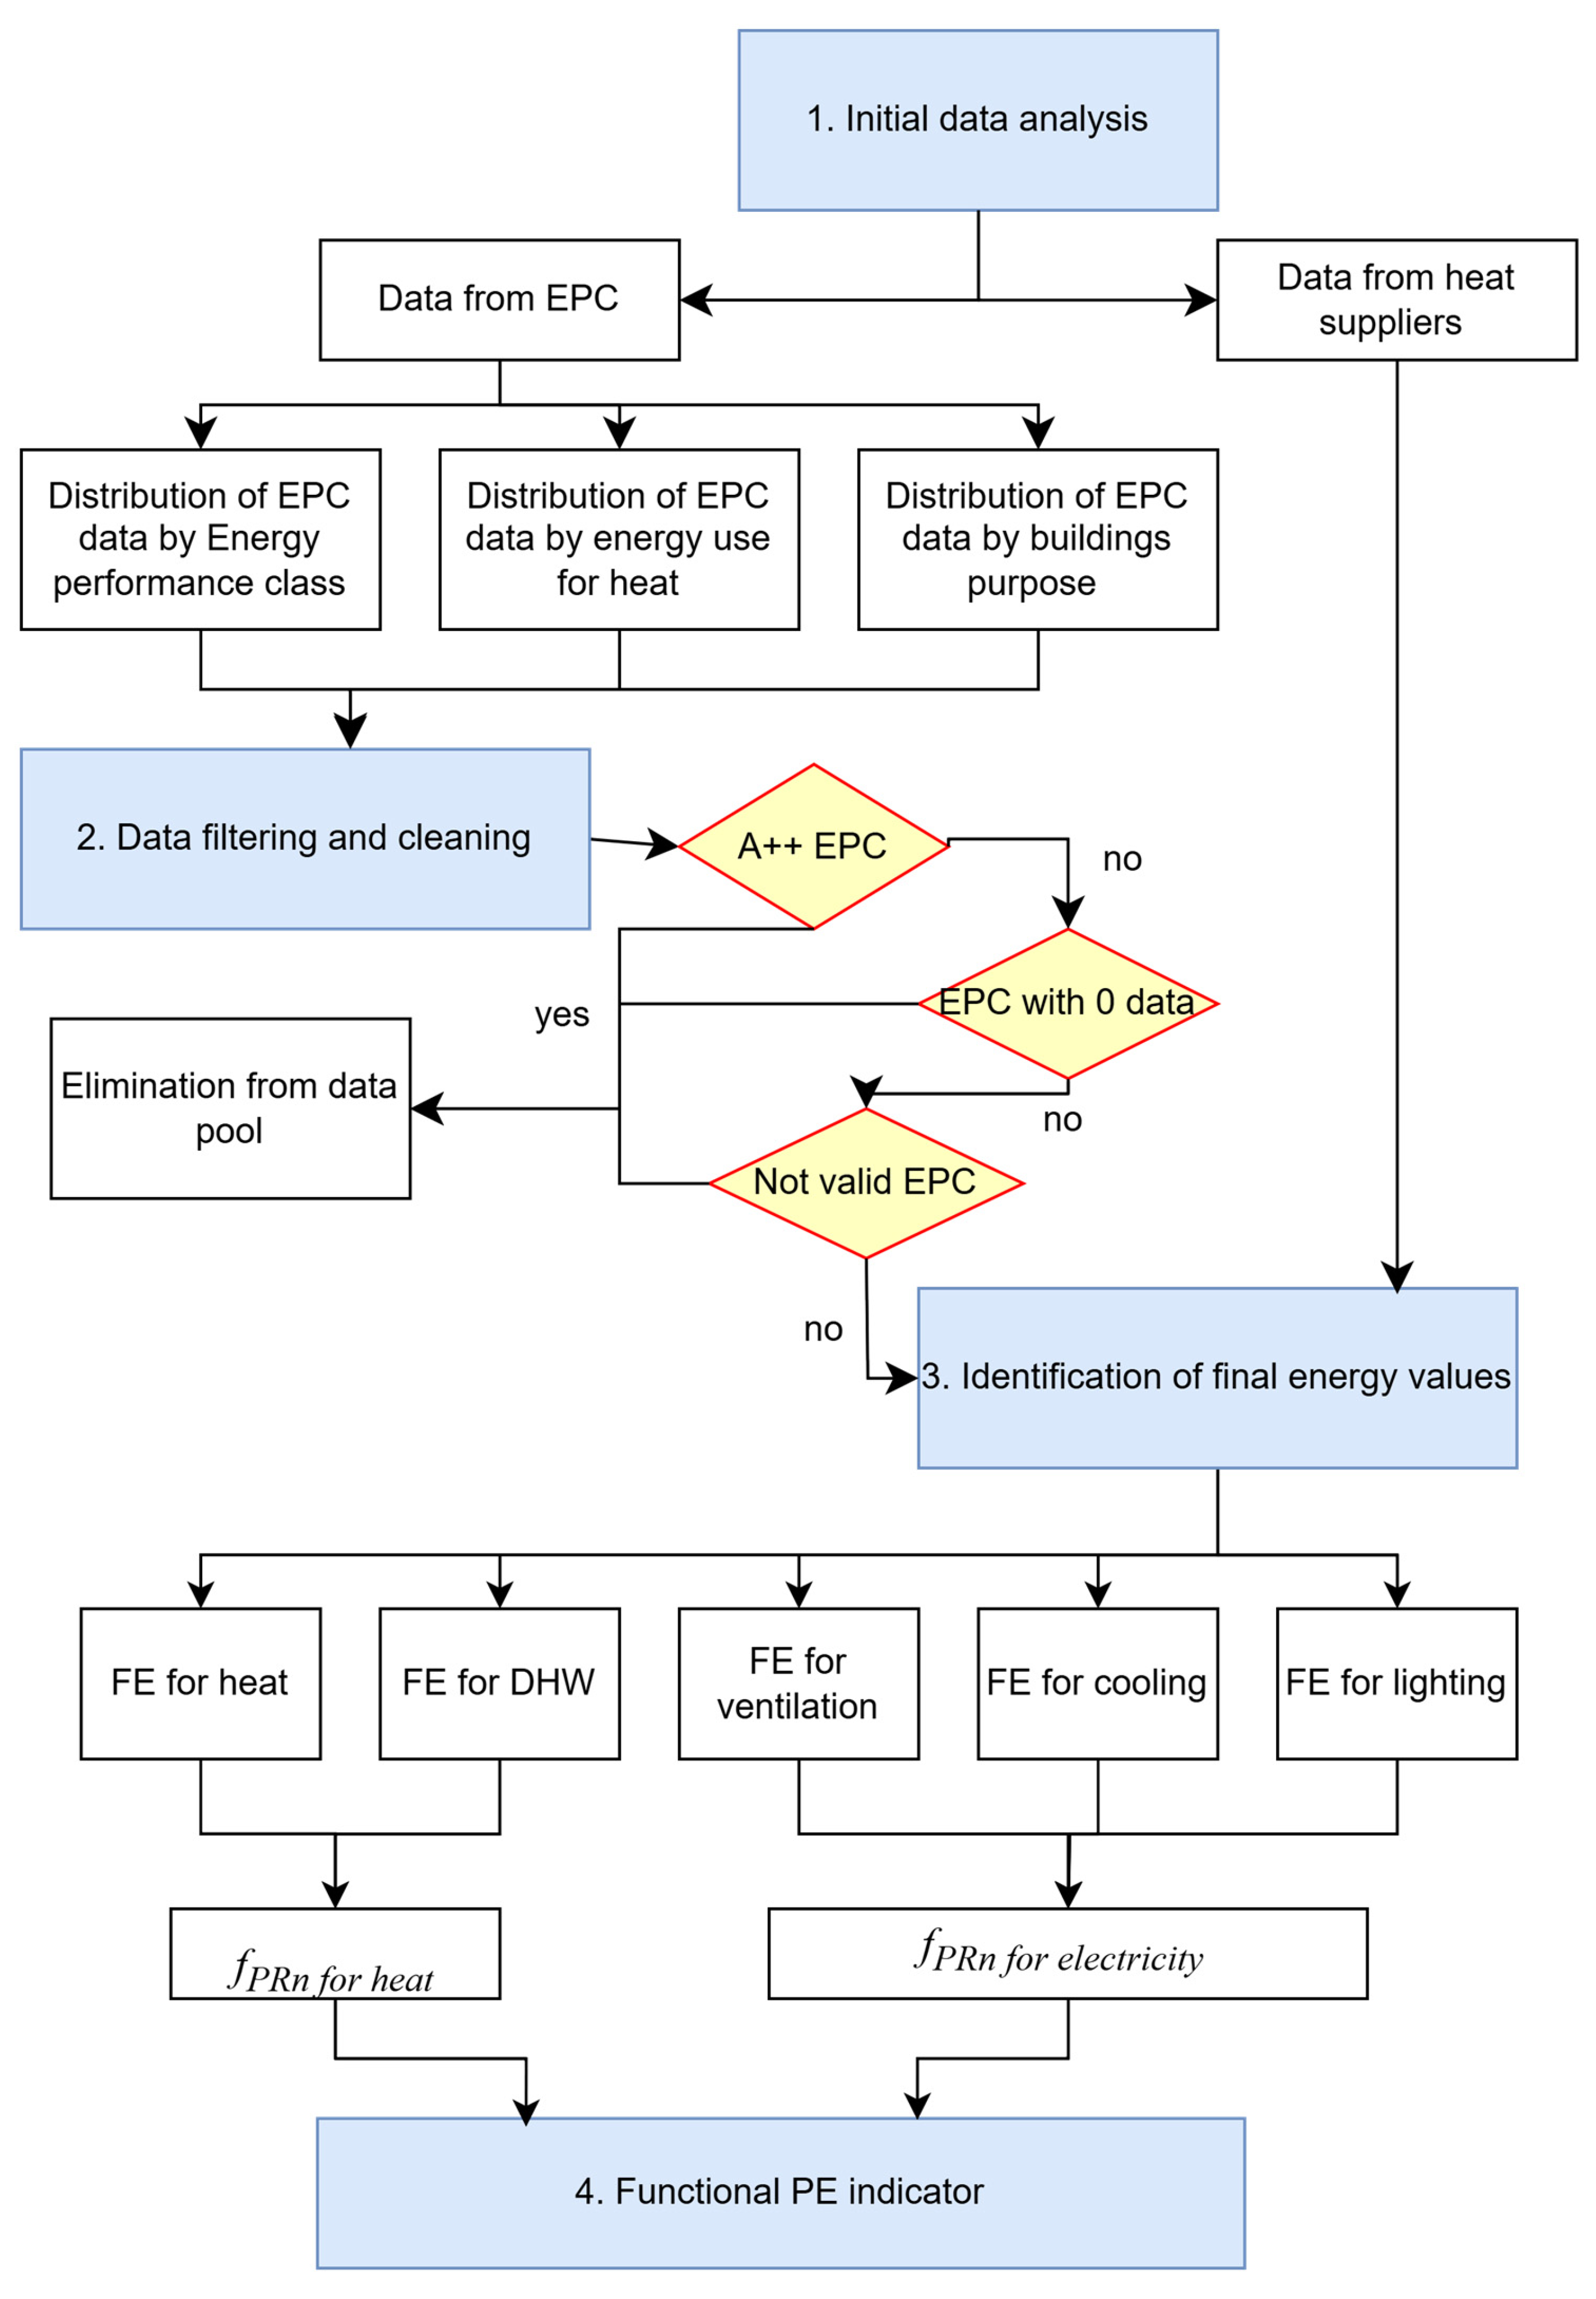
2. Materials and Methods
Based on the literature review, a functional primary energy indicator (FPEI) (kWh/m2/year) was adopted to define energy efficiency thresholds for the most efficient 15% and 30% of the Lithuanian national building stock. This indicator includes non-renewable primary energy consumed for the following purposes: heating, hot water, ventilation, and cooling, plus building electricity for lighting and other uses.
Buildings’ performance certification in Lithuania is based on calculations, not actual data, and the methodology is complex with a lot of indicators. The certification process in Lithuania started in 2006. At the beginning of certification, there were only 7 classes from G to A, and after 2012, it has 9 classes from G to A++. A++ is the highest class, which is obligatory for new buildings from 2021. Historically, in 2006, the C class was obligatory for new buildings. Since 2014, the obligatory energy performance class for new buildings has been increasing every 2 years: 2014—B; 2016—A; 2018—A+; and 2021—A++.
In 2012, the methodology of EPC was revised and primary energy calculations were integrated. But only in 2016 did renewable and non-renewable primary energy calculations become indicators for the energy performance class.
A direct analysis of the non-renewable primary energy indicator is not possible as this value is only available for newer buildings, certified since 2016. The only comparable indicator, calculated in the same way for all certified buildings, is the energy used for heating. This indicator is used as a basis for classifying buildings according to their energy efficiency to set threshold values for the functional primary energy indicator. The algorithm for identifying the threshold values of the functional primary energy indicators consists of 4 phases (Figure 1):
Figure 1.
The general algorithm of the methodology.
1. Initial data analysis—there is an analysis of the full data sample, gathered from the EPC register, energy performance class, energy consumption for heating, and heat source. An additional data analysis is carried out for the socially sensitive segment of buildings—multi-apartment buildings seeking to compare calculated indicators with real heating energy consumption declared by heat suppliers. As the sample of certified buildings includes buildings of different classes, it is assumed that the sample of certified buildings reflects the overall situation of the building stock and is sufficient to set the threshold values.
2. Data filtering and cleaning for sample preparation include the (1) elimination of A++ class buildings from the sample (according to the requirements of the Taxonomy Regulation), (2) elimination of buildings with missing or “0” energy consumption for heating, and elimination of buildings whose certificates have been updated; i.e., only data from the new EPCs are analyzed.
3. The identification of 15% and 30% of the best-performing buildings in terms of final energy: (1) from the sample of data produced, the number of buildings in the top 15% and 30% of the most efficient certified buildings are identified based on annual heating energy demand (kWh/m2/year) per each of the 17 groups of buildings; (2) final energy indicators for DHW, ventilation, cooling, lighting, and other purposes are defined per each group based on standard values and/or the literature.
4. The FPEI calculation is based on the defined heat and electricity consumption, and dominant energy production methods for the different building purposes, and expressed as a sum of primary non-renewable energy (Equation (1)).
Here,
—final heat consumption for heating, kWh/m2 per year;
—final heat consumption for hot water preparation, kWh/m2 per year;
—non-renewable primary energy factor of the heat source;
—final electricity consumption for the ventilation system, kWh/m2 per year;
—final electricity consumption for the cooling system, kWh/m2 per year;
—final electricity consumption for lighting, kWh/m2 per year;
—non-renewable primary energy factor of electricity production.
The FPEI is calculated by summing the building’s energy consumption for heating converted to primary energy using the non-renewable primary energy factor (fPRn) of the heat source, together with the electricity consumed in the building converted to primary energy.
2.1. Initial Data Analysis
For the assessment of the functional primary energy demand indicator, an analysis of the existing building stock and the situation of certified buildings was first carried out. This study assesses residential and non-residential buildings, which are divided into 17 purposes following STR 2.01.02:2016 [32] (hereinafter referred to as ‘the regulation’) (Table 3).
Table 3.
Distribution of buildings to categories by purpose.
The classification of buildings according to their purpose is necessary to take into account because of the different assumptions of the energy use in a building, which are determined by its specificity. The classification of buildings into 17 purposes has also allowed a corresponding sorting of the energy performance certificate data, which is also broken down into the purposes listed above (Table 3).
In Lithuania, energy supply companies collect actual energy consumption data for buildings, but much of these data are not publicly available. Only the monthly heat consumption of apartment buildings is publicly available on the websites of the heat supply companies.
In Lithuania, all certified buildings have energy demand (design) data, but not all the indicators in the certificate are made public. Primary energy needs, although calculated and included in the certificate since 2012, are not published in the register.
For the above reasons, it was chosen to identify the 15% and 30% most efficient buildings in Lithuania based only on the data provided in the energy performance certificate—the design energy demand, which is publicly available in the register of the Construction Sector Development Agency (SSDA). As of January 2023, 358,000 energy performance certificates have been registered in Lithuania. Meanwhile, the total number of registered buildings in Lithuania is approximately 2.6 million, including those that do not fall under the certification requirements. Of them, approximately 0.6 mln. buildings are residential and 0.2 mln. non-residential.
2.2. Data Filtering and Cleaning
As one of the key principles of the methodology is reliable data, the first step in data cleansing is to eliminate the so-called Standard Apartment Certificates (SACs), which are formally issued when apartments are sold or rented and do not provide reliable information on the energy performance of the building. They generally receive the worst possible energy efficiency class, G. Such certificates account for almost half of the certificates available in the register (176,000 out of 358,000) and are found only in the category of multi-family houses. There is a portion of certificates where heating values are missing or defined as “0”; therefore, these data are also excluded from the dataset. Finally, it is checked if the certificate has not been replaced by a newer one, in which case the data from the old certificate are also eliminated. The last step of data cleaning, which is related to the main principles of the methodology, is the exclusion of the A++ buildings from the dataset.
2.3. Final Energy Assessment
For each building use, the sample of data produced determines the number of buildings that are the 15% and 30% most efficient and sets a threshold value for heating energy consumption. The final energy threshold values for heating for 15% and 30% of buildings are based on energy data from certified buildings.
Both the 15% and the 30% most efficient buildings meet the same electricity consumption level, as the electricity demand for lighting and other equipment in existing buildings depends on consumer behaviour and not on the energy performance of the building and is not differentiated by class in the regulation.
The energy consumption for hot water production is assessed for each use according to the regulation. The energy values for hot water production for each use are given in Table 4 and Table 5.
Table 4.
Final energy (FE) data for 15% of the most efficient buildings for all buildings’ groups.
Table 5.
Final energy (FE) data for 30% of the most efficient buildings for all buildings’ groups.
The ventilation system in the building is one of the electricity consumers. For the assessment of the energy consumption for ventilation in the 15% most efficient buildings, it was assumed that the ventilation systems in such buildings meet the requirements of an energy efficiency class A ventilation system, where the power of the AHU (Air Handling Unit) fans must not exceed 0.75 Wh/m3 (according to the regulation).
A total of 30% of the most efficient buildings were rated as having a lower ventilation system efficiency, and the electricity consumption of the AHU fans was set to 1 Wh/m3 or less. The ventilation system air flow rates and other characteristics were evaluated in the same way for both the 15% and the 30% most efficient buildings and the evaluation indicators are shown in Table 4 and Table 5.
In Lithuania, there is no separate regulation of energy needs for cooling, so the values are based on Aalborg University’s 2022 report “Nordic and Baltic NZEB”, which puts the cooling demand for non-residential buildings at 30 kWh/m2/year. If the energy efficiency of cooling equipment for cooling is assumed to be EER = 3, then the electricity demand for cooling is 10 kWh/m2/year. Following the regulation, the application of fPRn—the non-renewable primary energy factor (2.3)—the primary energy demand for cooling is 23 kWh/m2/year. For residential buildings, the calculation is similar and presented in Table 6.
Table 6.
Electricity and PE consumption calculation for cooling demand.
Based on the analysis, the following values were used for the calculation of the final energy demand for cooling for both the top 15% and 30% of buildings:
- A total of 5 kWh/m2 of electricity per year for residential (and one-, two- and two-flat and other residential buildings), swimming pools, storage, garages, manufacturing and industrial buildings, and transport.
- A total of 10 kWh/m2/year for other groups of buildings, except sports buildings.
2.4. Functional PE Assessment
For 15% and 30% of the most efficient buildings in Lithuania, the primary energy assumptions were selected according to the energy sources dominant in the building groups.
For each building group, dominant heat sources were selected. For groups of buildings with district heating networks as the dominant heat source, the primary energy transformation factor was estimated based on the average data of all district heating networks in Lithuania. In all cases, the average factor of the different electricity generation methods used in Lithuania was taken to estimate the primary energy factor for electricity.
The values of the transformation factors of all energy sources used in the study are presented in Table 7.
Table 7.
Primary energy factor values used in this study.
The values of PE calculations were used from the regulation because the evaluation of thresholds should be performed from real EPCs, which are calculated according to regulation data.
For the primary energy calculations, the non-renewable energy conversion factors presented in Table 7 were used for FPEI.
The assumption for each group of buildings was made by the dominant and most polluting energy sources used for that purpose of the building. In the case of single-family buildings, the analysis involved the examination of different, but typical for this group of buildings, heat sources. The results of primary energy, presented separately for heat and hot water preparation, and total PE values are set out in Table 8.
Table 8.
Different scenarios of heat production to single-family buildings.
For single-family houses, the most common heat sources are biomass and natural gas boilers, but other heat sources used in family buildings were also analyzed. Heat sources such as coal and oil are rare in Lithuanian buildings and are usually only used in the least energy-efficient buildings, so they are not considered typical heat sources.
As the scope of the methodology is to define threshold values, the scenario with the highest value was chosen for threshold calculations. The results for the same building but with a gas boiler have the highest value, so the threshold was set up by the worst heat source sorting from the dominant ones.
3. Results
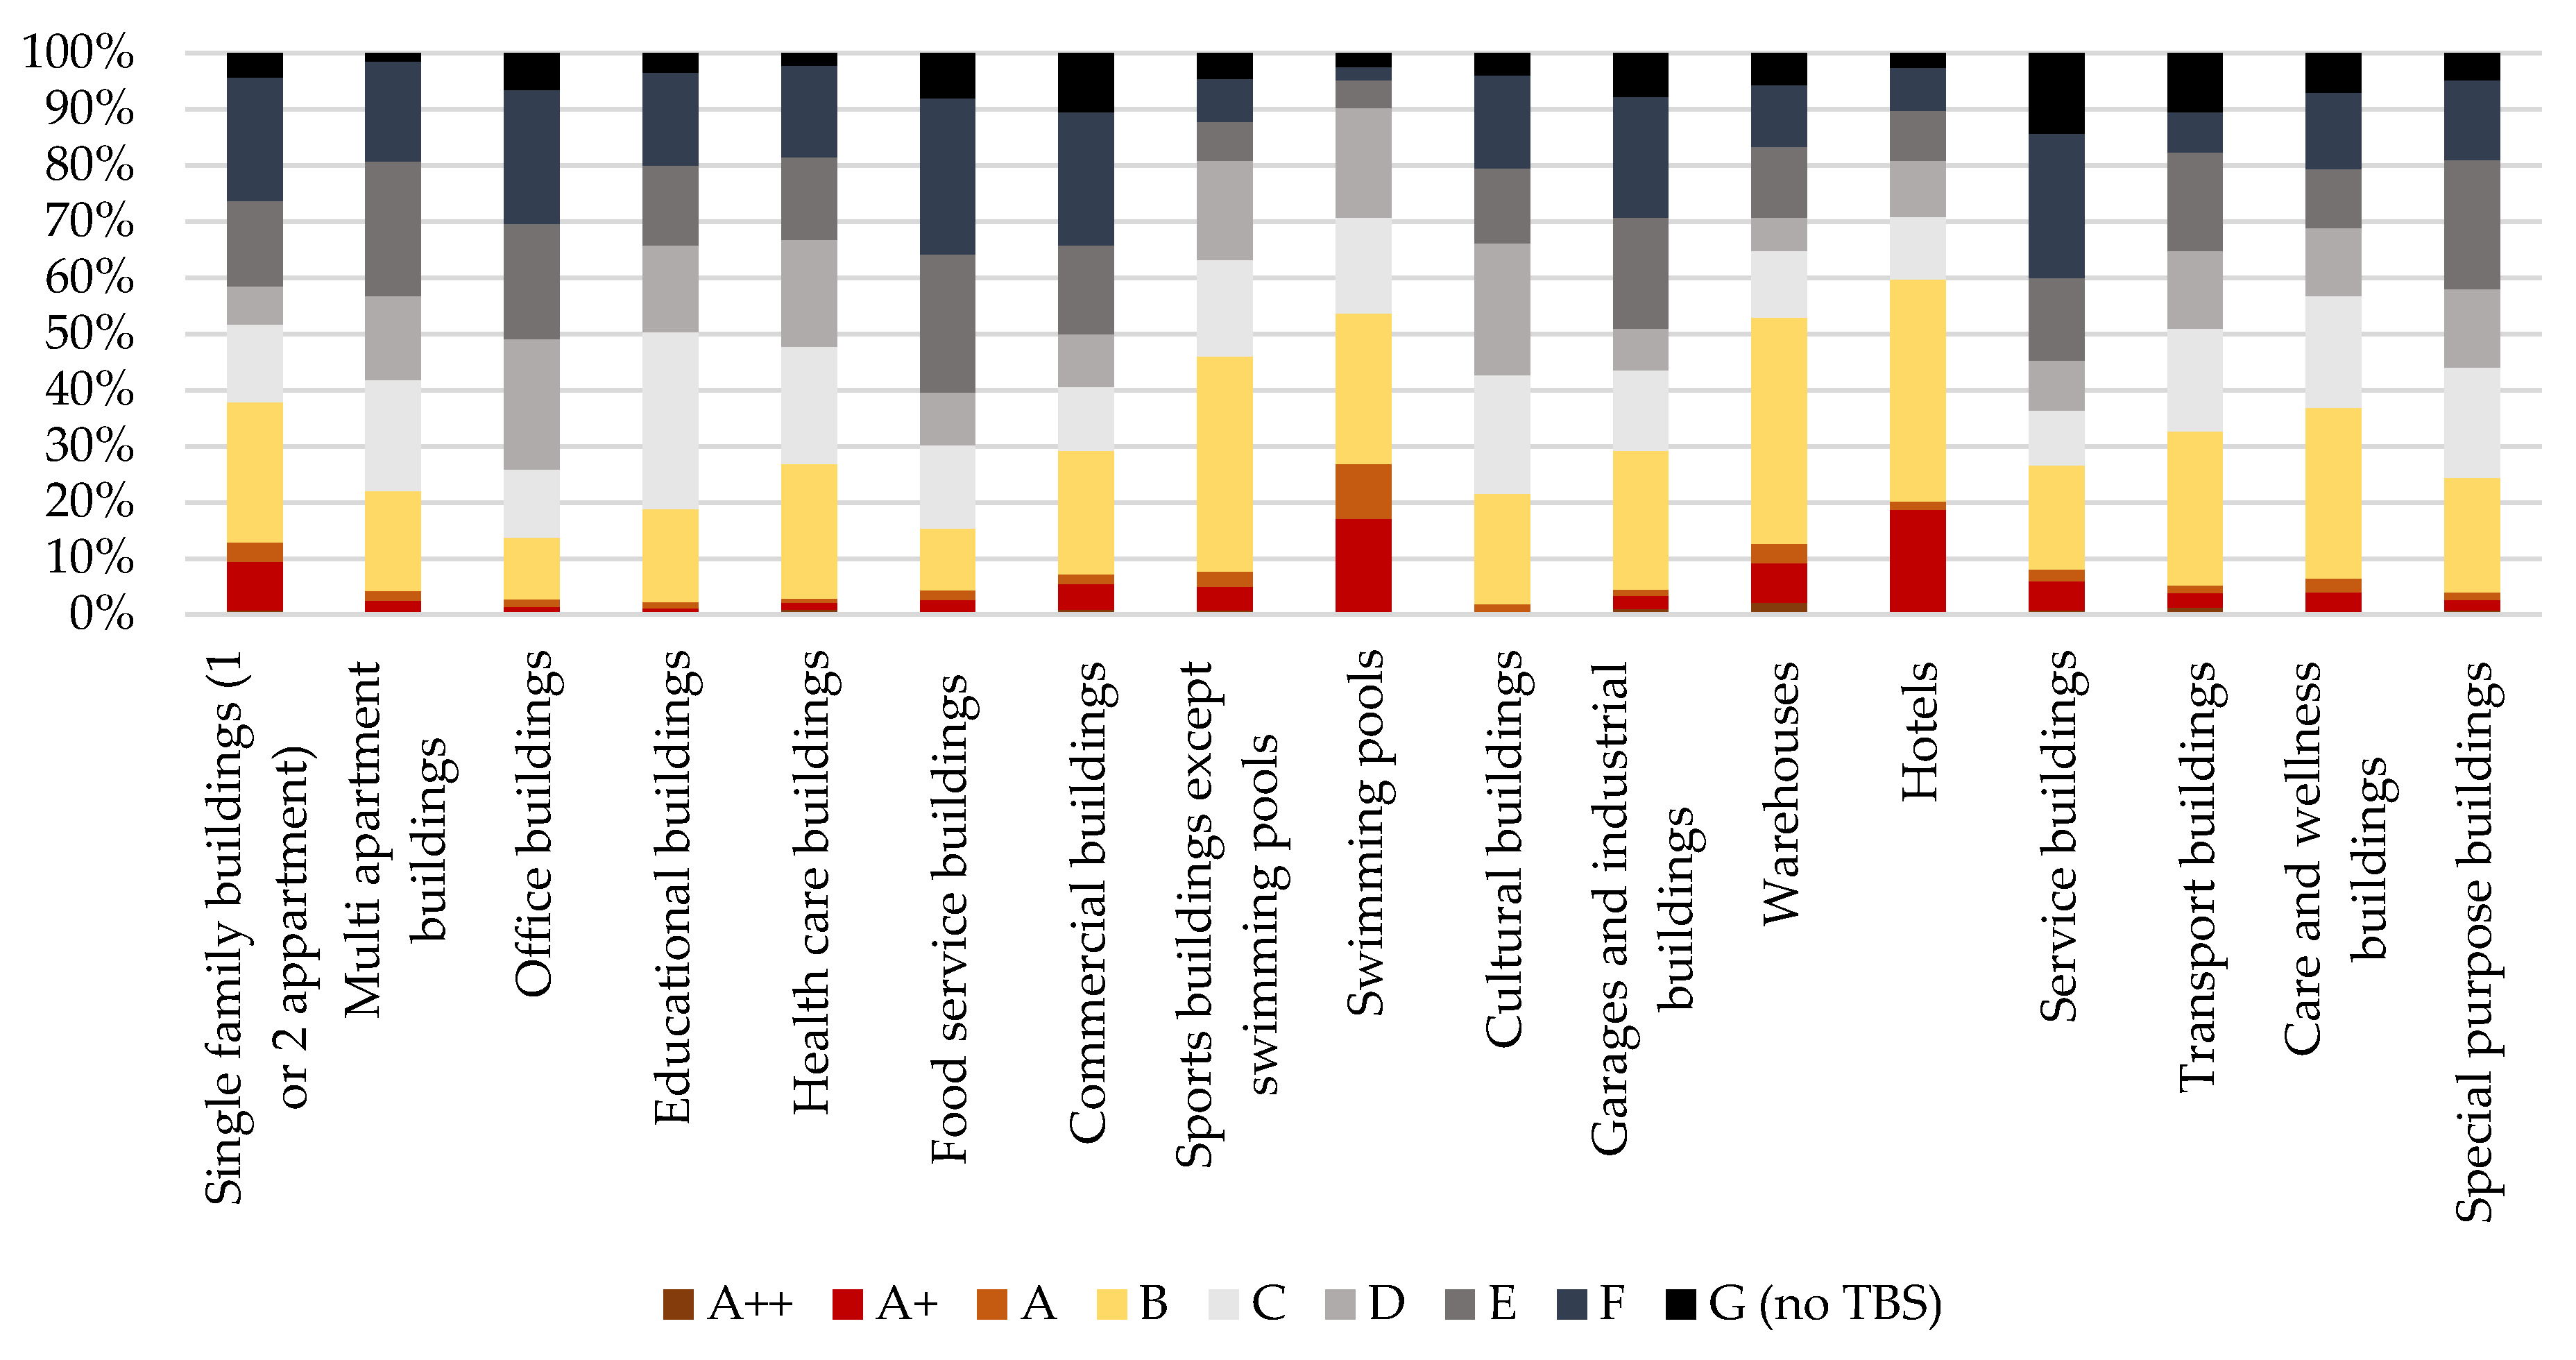
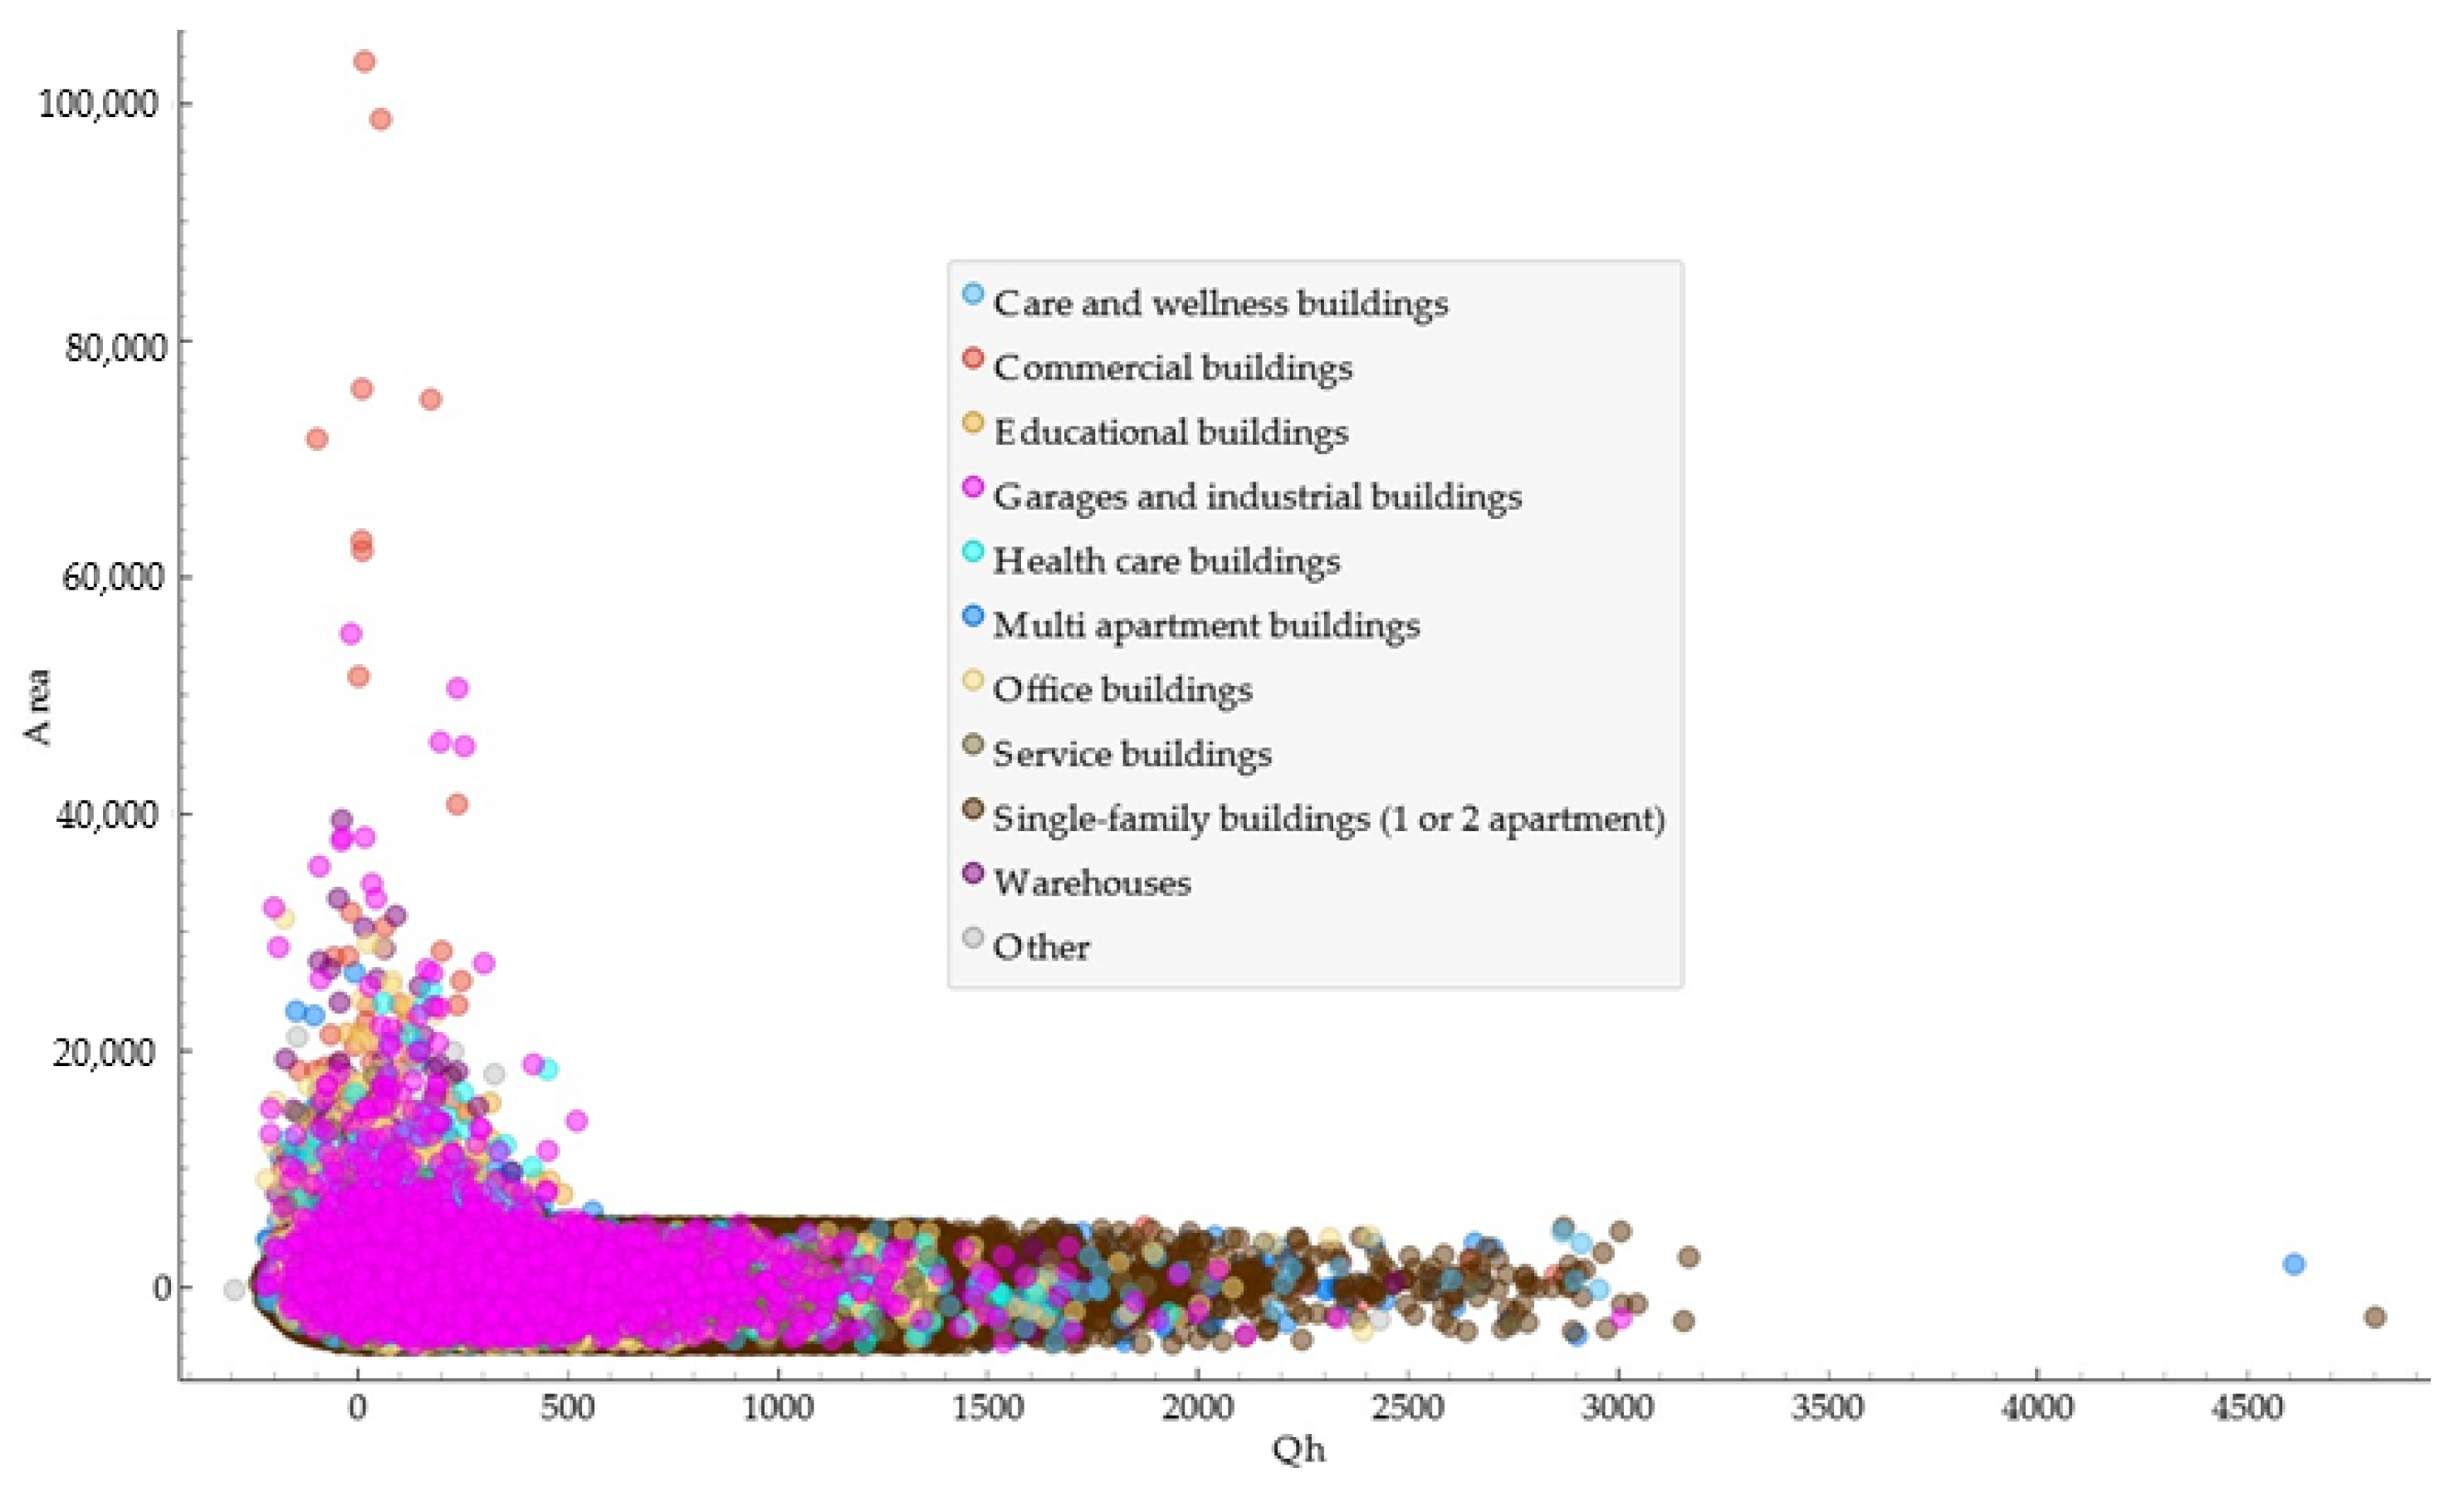
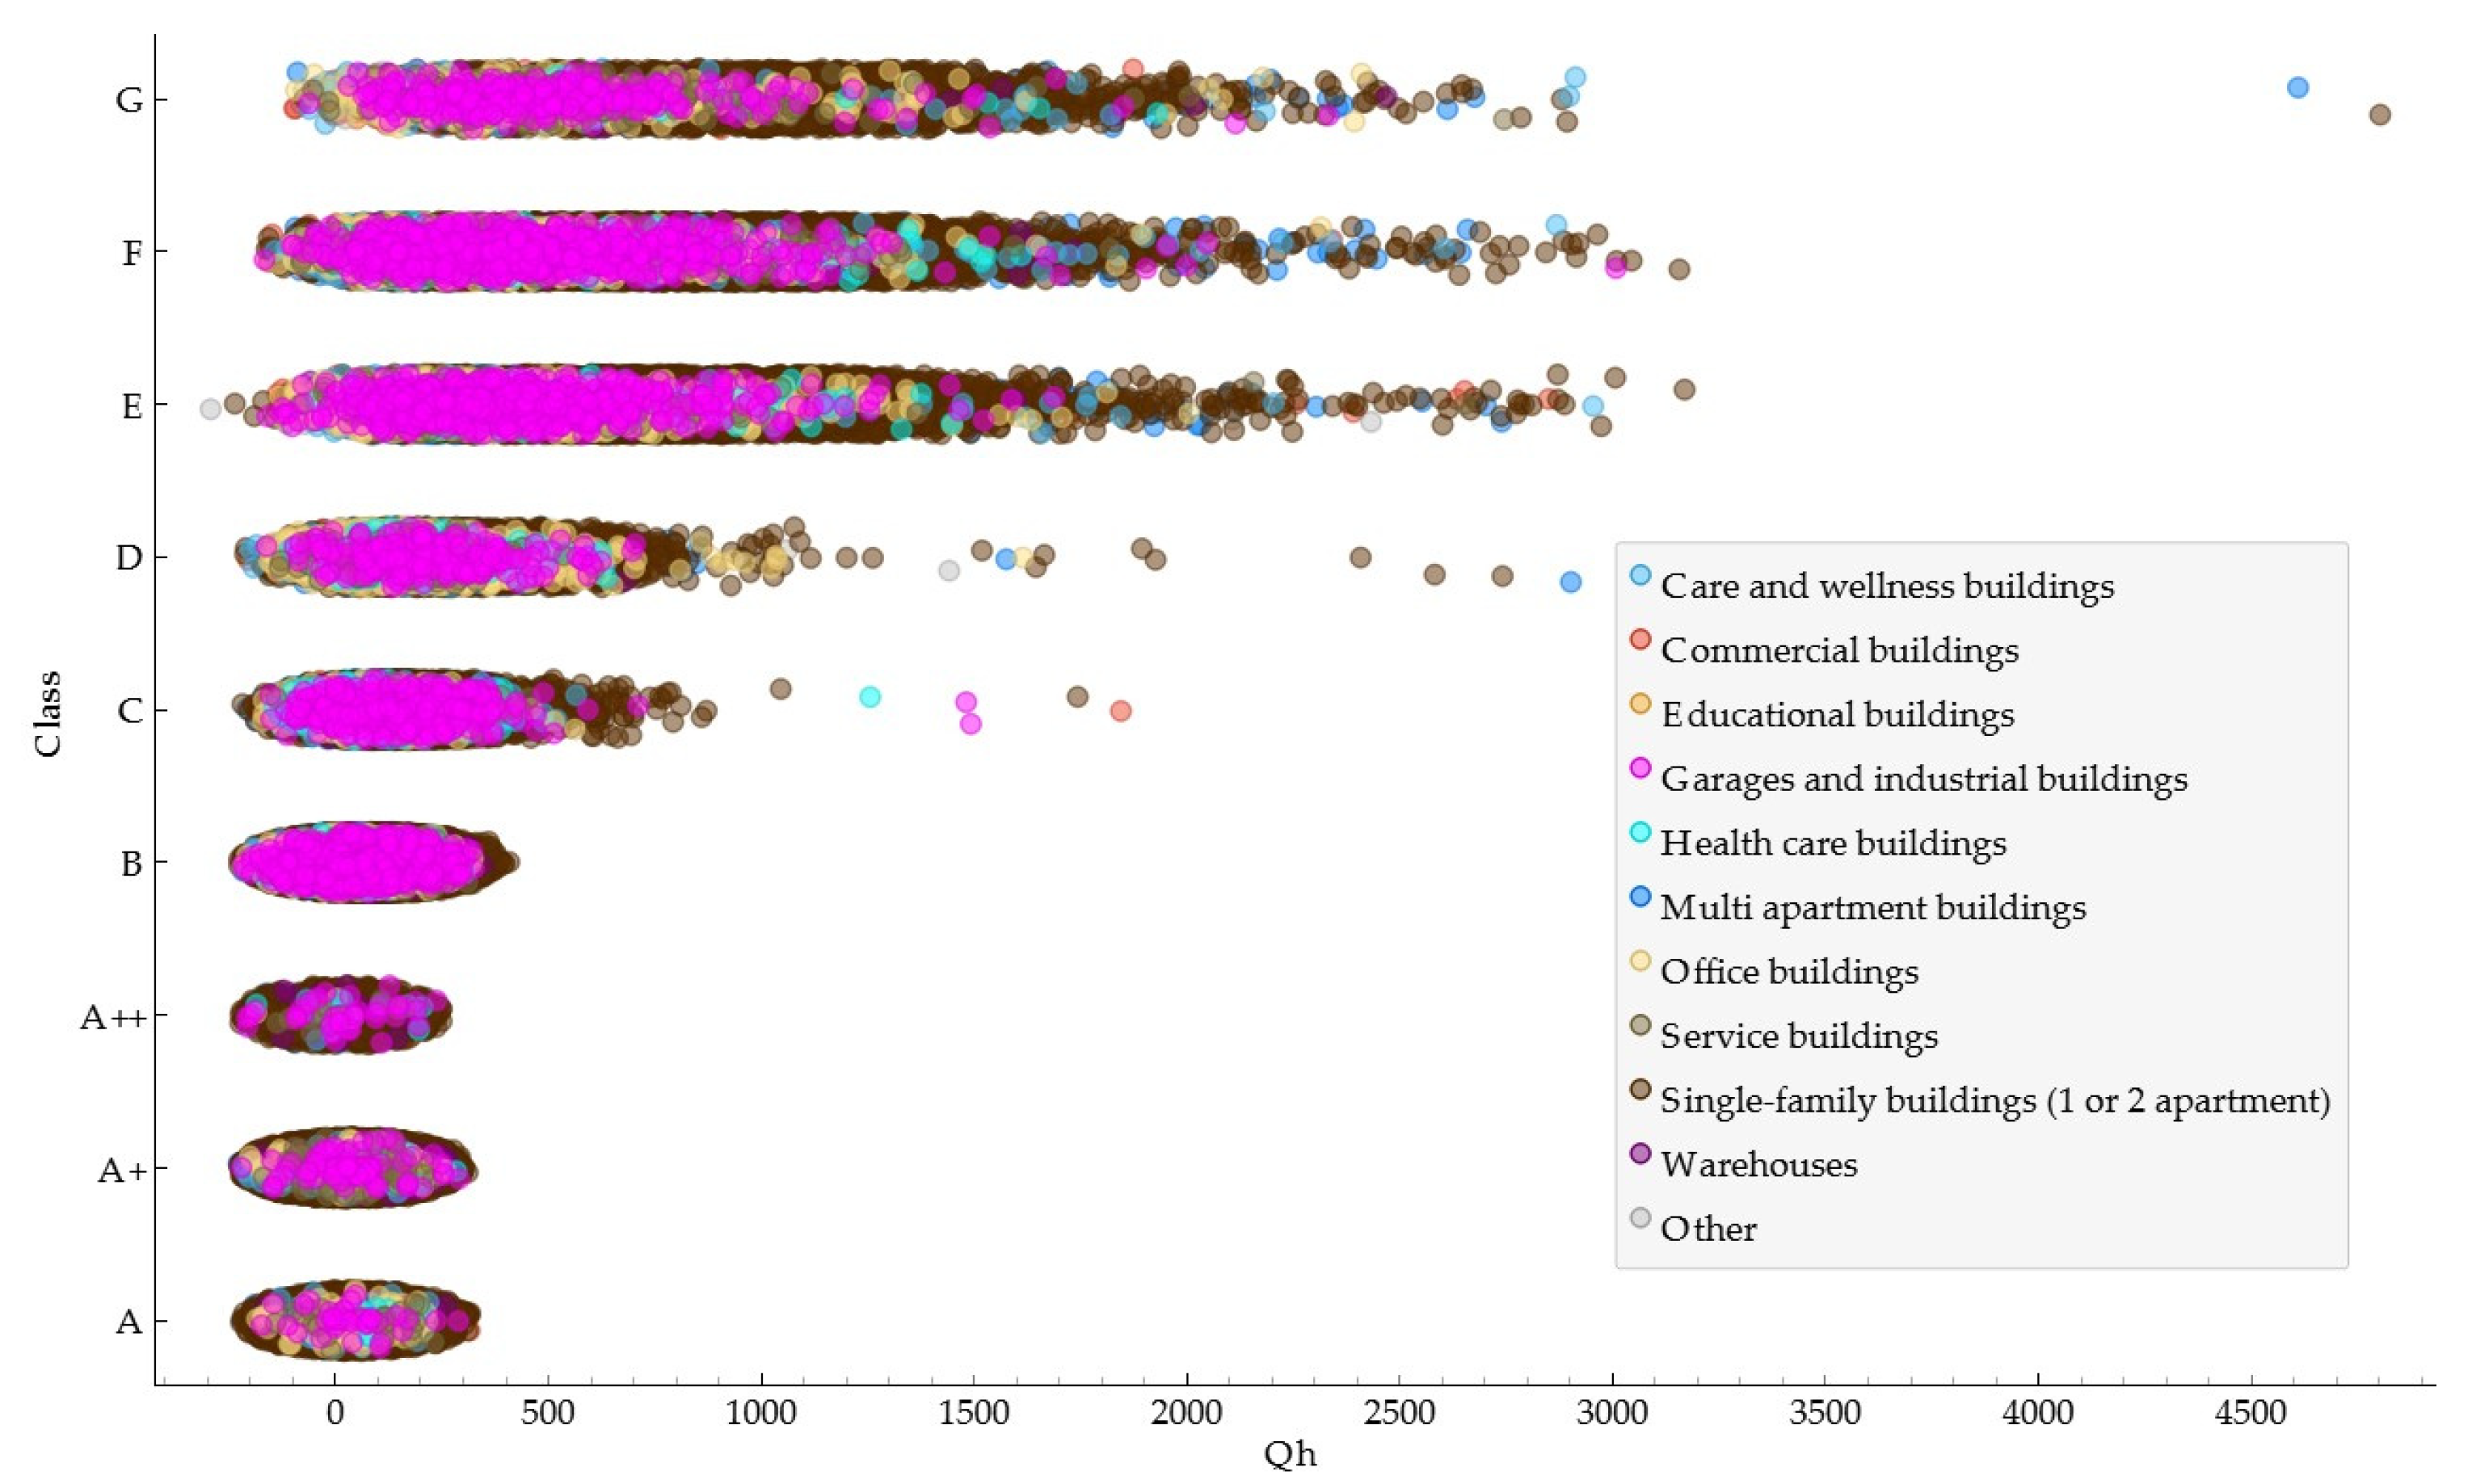
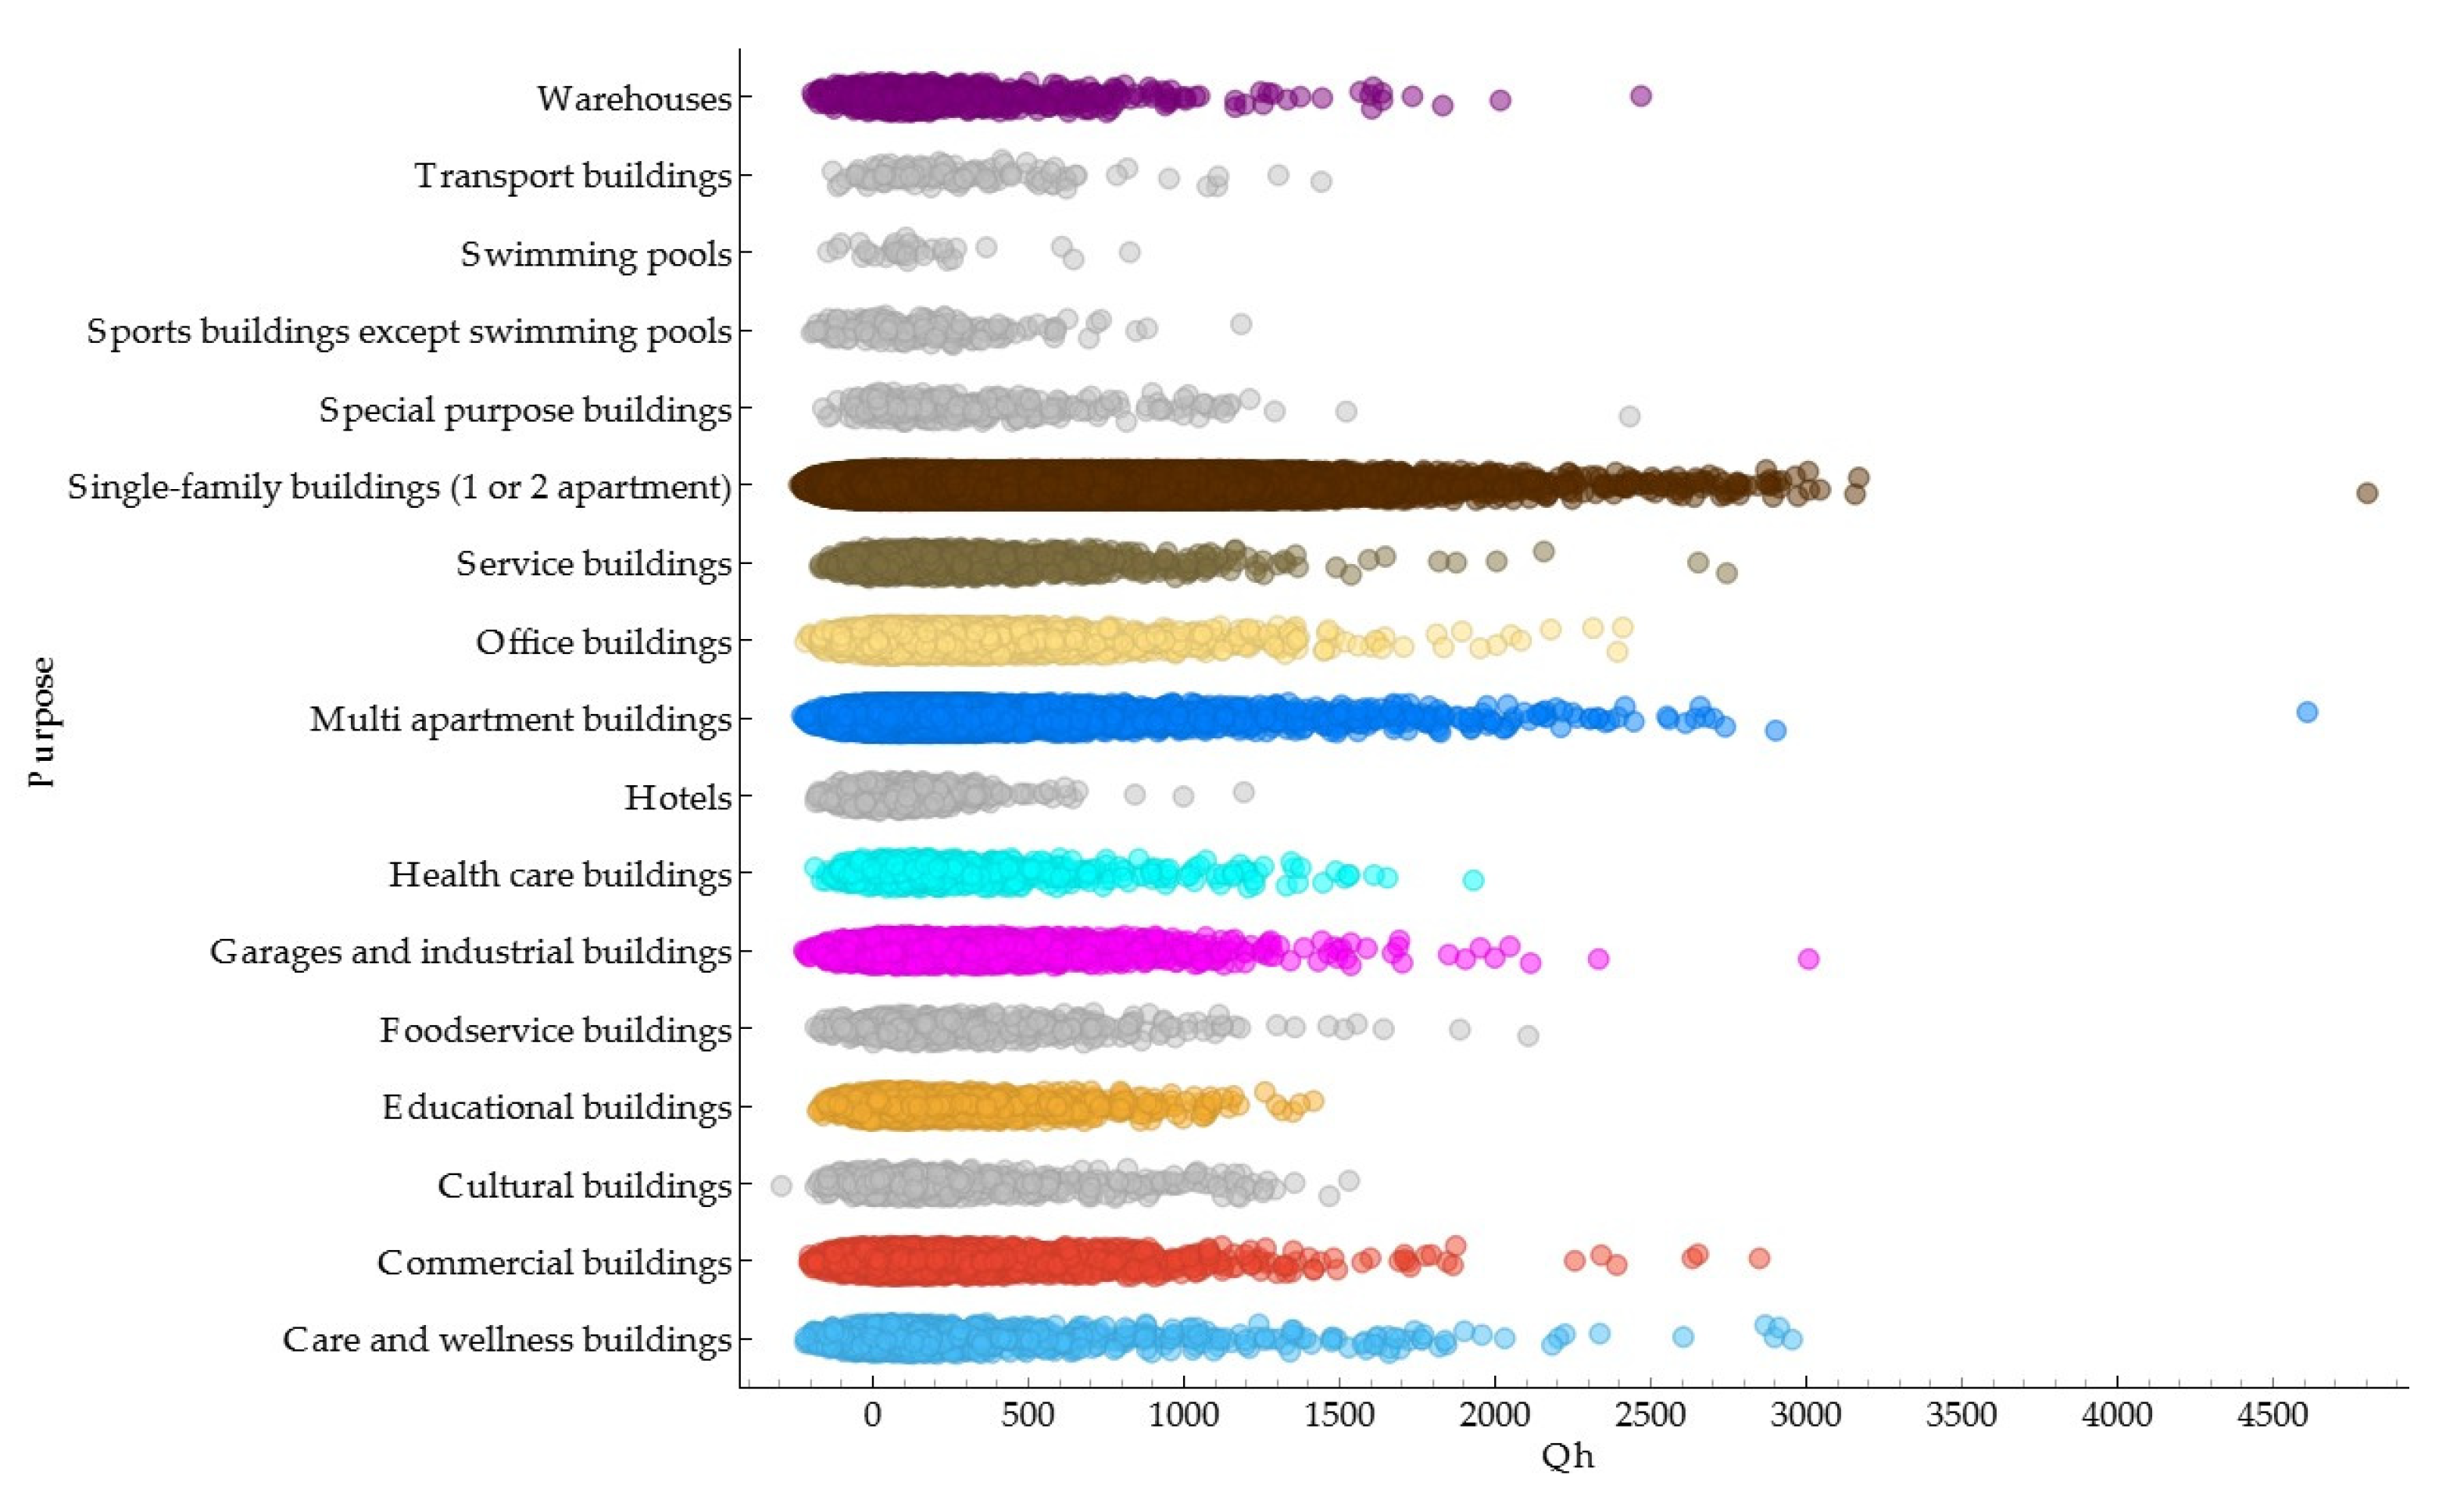
3.1. Results of Initial Data Analysis
Since it is assumed that the EPC register represents the overall situation of the Lithuanian building stock, an overall analysis of the data is carried out first. The aim is to show the distribution of energy efficiency labels for different building purposes, to analyze the calculated heating energy demand and its relation to different criteria, and also to analyze the dominant heat sources.
Figure 2 demonstrates the overall distribution of the EPCs within different categories of the buildings. If assuming that buildings from the B label and higher are energy efficient—then such buildings as swimming pools, warehouses, and hotels seem to be very efficient. However, it should be noted that the proportion of certified buildings varies from building group to building group, and such a comparison is not entirely fair. However, due to the different grouping of buildings in the real estate register and the register of certificates, it is not possible to make an exact comparison of the efficiency of the building stock; it shows just the distribution between certified buildings.
Figure 2.
Distribution of EPC data: energy performance class (A++ is most efficient).
Table 9 represents the overall number of issued certificates for residential and non-residential buildings before the cleansing procedure. It is obvious that the biggest share of certificates is issued for single-family buildings (1 or 2 apartments) and some categories of buildings have a very low number of certificates, e.g., transport buildings or swimming pools. If compared to the quantities of registered buildings in the real estate register, the certification rate for single-family buildings is just around 25%. The highest rate of certification is for offices—64%, and the lowest for buildings such as special purpose buildings—2% or garages, industrial buildings, and warehouses—6%.
Table 9.
Distribution of EPC data by building purpose and dominant heat sources.
When looking at the typical heat sources (Table 9), most of the buildings have district heating (DH) as a main or additional heat source. Different heat sources are found in single-family houses, where biomass and natural gas boilers are the main sources. It was also noticed during the analysis that this source is more common for buildings with very low energy efficiency classes. Natural gas as a dominant heat source is found for warehouses (approx. 1/3) and heat pumps are very typical in care and wellness buildings, but they are not strongly dominant compared to other sources. More information on the distribution of the main heat energy sources in Lithuanian buildings is provided in Figure 3.
Figure 3.
The distribution of EPC data: heating sources by the purpose of the building.
As the calculated heating energy demand is used in the methodology as the main criterion to define the threshold for the most efficient buildings, it was analyzed in more detail in order to extract some insights and trends from the available data.
It is well known that the larger the surface area of the building, the lower the energy consumption per m2. It can be seen from Figure 4 that a relatively small number of certified buildings are over 10,000 m2 in area with heating energy consumption typically up to 500 kWh/m2/year, although much higher values can be seen in the figure and univariable outliers in the figure are also obvious. As there is a low probability of an error in building size, only the heating energy demand as a variable can be considered anomalies or data errors. To understand where these errors occur, deeper insights can be found in Figure 5 and Figure 6, where the energy consumption is presented compared to the energy efficiency label and the building category.
Figure 4.
Distribution of EPC data: energy demand for heating (kWh/m2/year) vs. area of building (m2) (data are jittered for better representation of results).
Figure 5.
Distribution of EPC data: energy demand for heating (kWh/m2/year) vs. energy performance class of building (m2) (data are jittered for better representation of results).
Figure 6.
Distribution of EPC data: heating energy demand (kWh/m2/year) by purpose of building (data are jittered for better representation of results).
From Figure 5, it can be seen that outliers are very obvious in categories D and C, and less obvious but still noticeable in categories E to G; i.e., they occur in low-energy efficiency labels. This can be explained by the fact that when the certification process was launched in 2006, new buildings were generally built according to requirements corresponding to B. As a result, these new buildings, with more reliable data available, caused fewer errors and uncertainties in the certificates.
From the perspective of the purpose of the building (Figure 6), outliers are noticeable in different categories, with the highest values in both types of residential buildings. Some categories of buildings have no noticeable outliers, e.g., cultural and educational buildings. In comparison with Table 3, there is some correlation with the number of certified buildings—the outliers are more typical in the category where more certificates are issued.
3.2. Results of Data Filtering and Cleaning
Data were filtered and cleaned as described in the methodology of Section 2.2, and in Table 10, the final dataset from the EPC registry is provided for each purpose of the building, and then the amount of data (certificates) that were considered as the 15% and 30% most efficient were used to set the heating energy demand threshold values. Even 9% of certificates (SACs excluded) were eliminated because of missing values for heating energy demand.
Table 10.
Final datasets after cleansing and filtering.
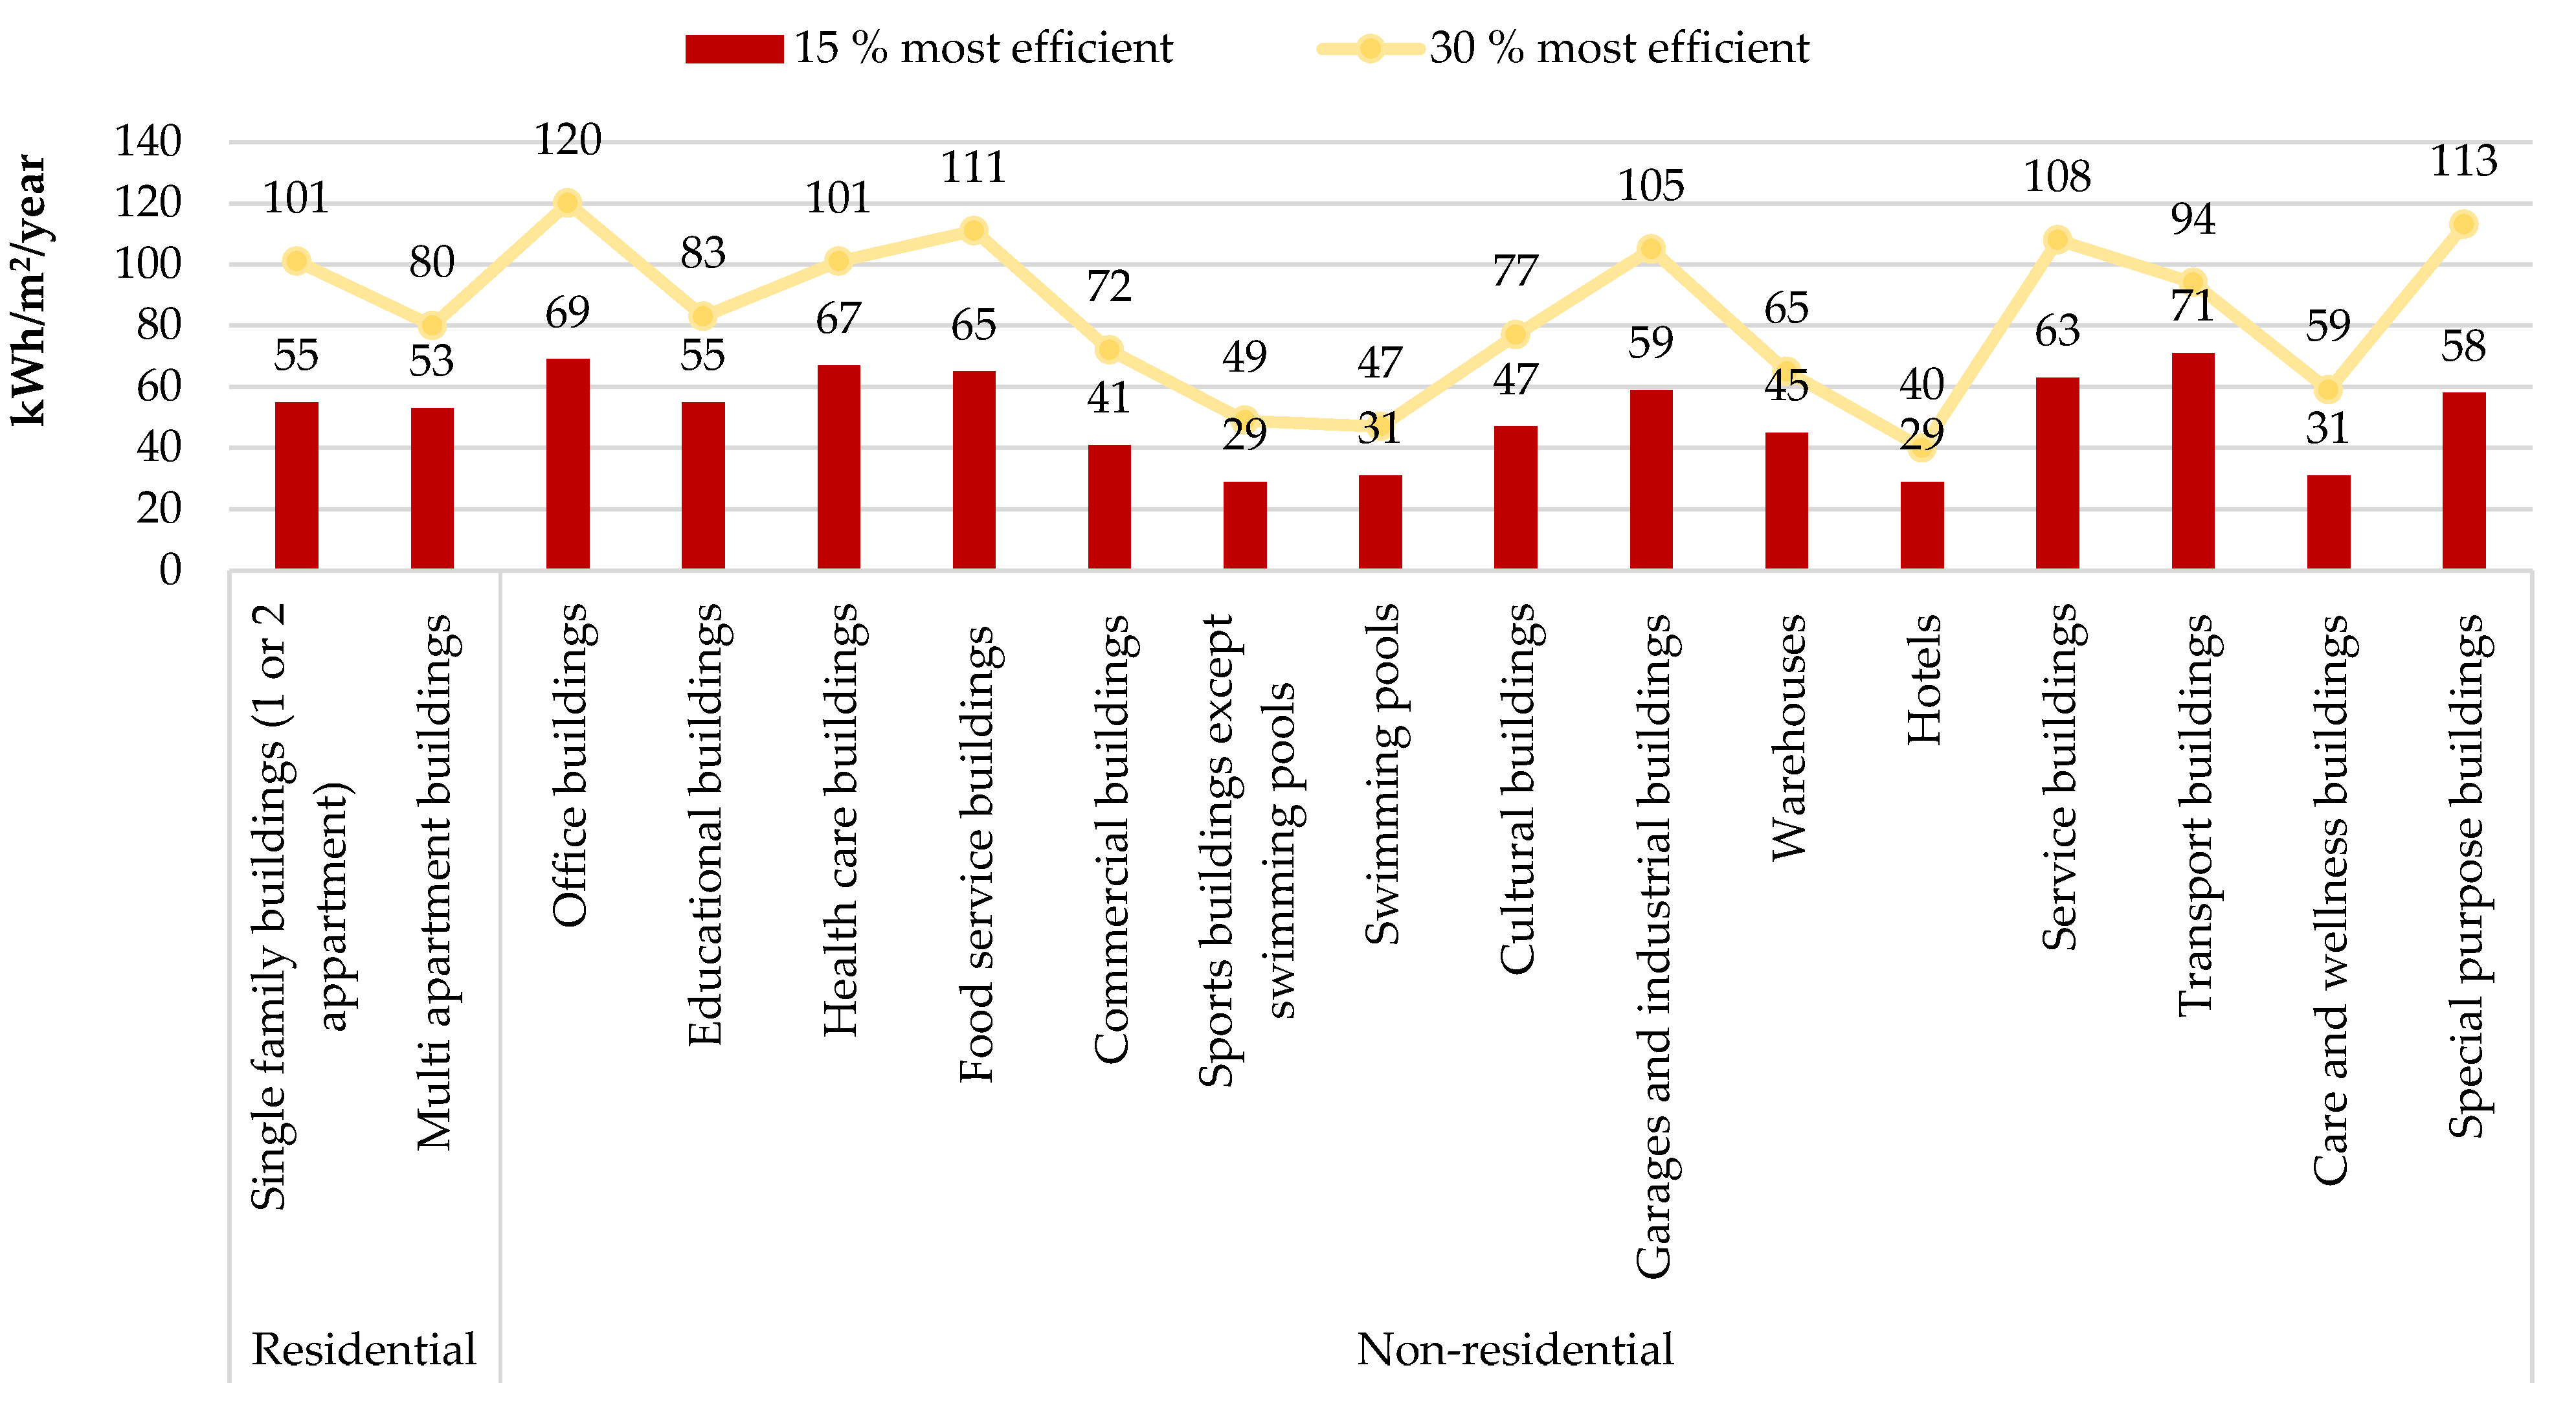
3.3. Final Energy Values
The final energy threshold values for heating were defined for each purpose of the building based on the dataset provided in Table 10. These values are presented in Figure 7 for both the 15% and 30% most efficient buildings. The top 15% threshold values exhibit a range of 29 to 67 kWh/m2/year, while the 30% most efficient buildings demonstrate a range of 47 to 120 kWh/m2/year. This variation illustrates that the classification of residential and non-residential buildings, as observed in some countries referenced in the literature review, would not be an accurate representation of Lithuania. Furthermore, the discrepancies between the threshold values for the top 15% and the top 30% are also markedly variable, with some values being almost double those of others and others being approximately 50% higher.
Figure 7.
Final heating energy demand threshold values by building purpose.
According to Eurostat [33], almost 60% of Lithuanians live in apartment blocks; therefore, this sector needs specific attention, to check if threshold values will not have some negative social impacts. According to the Centre of Registers [34], there are almost 42,000 apartment buildings in Lithuania, one of the country’s largest segments in terms of floor area. The vast majority of apartment buildings (about 88%) were built before 1993 without the use of insulation materials, and therefore a large part of the building stock in this segment is in poor technical condition. To prioritize and accelerate the renovation of the least energy-efficient buildings, the most inefficient blocks of flats in municipalities in 2013 were classified as those consuming more than 150 kWh/m2 of thermal energy per year [35].
Speaking of certification, the regulation allows multi-family buildings to be certified either individually or as a whole. Therefore, the number of multi-family buildings will never equal the number of certificates issued for this building category. As described above, in the EPC registry, most of the certificates in this category are SACs, which are formally issued without any calculations and their data cannot be included in the study. After filtering the data, only about 17,000 certificates are suitable for the analysis. It is assumed that the reliable sample of certificate data is limited to only those certified under the regulation and reflects the overall performance situation for this building group, as the sample is dominated by buildings in classes B to F (see Figure 2). In addition, the accuracy of the assumption is verified by using data from heat suppliers on actual energy consumption in multi-family houses. According to the Lithuanian District Heating Association [36], there are about 700,000 apartments supplied with district heating in Lithuania: 17% are in blocks of apartments in poor condition; 58% are in old, Soviet-built, uninsulated blocks of apartments; 7% are in partially modernized blocks of apartments; and 18% are in new or modernized blocks of apartments. Based on the condition, for these four categories, average actual energy consumption for heating is presented in Figure 8.
Figure 8.
Actual energy consumption in multi-apartment buildings by their condition.
Based on the actual energy consumption for heating, it can be assumed that buildings consuming more than 90 kWh/m2 for heating do not belong to the most efficient buildings. Comparing the threshold set for this category based on the EPC data, which are 53 kWh/m2/year for 15% of the most efficient buildings and 80 kWh/m2/year for 30% of the most efficient buildings, it can be concluded that most of the new, fully renovated apartment blocks will be in the top 15% and most of the less efficient new, partially renovated and other somewhat more efficient buildings will be in the top 30%. This means that even buildings that are not new or fully renovated but have some energy-saving measures can be considered in the top 30%.
3.4. FPEI Values for 15% and 30% Most Efficient Buildings in Lithuania
Based on the methodology, described in paragraph 2, and the analyzed data presented above, a functional primary energy indicator was calculated, which takes into account the non-renewable energy demand of the building.
The assumptions of energy sources were made according to dominant heat sources (Table 9, Figure 3) with exceptions for transport and care and wellness buildings. As it is mentioned above, heat pumps are typical in care and wellness buildings, but they are not strongly dominant compared to other sources, and the second dominant heat source is district heating. Evaluating the PE indicator for the average Lithuanian district heating is more comprehensive, and was chosen for FPEI calculations for care and wellness buildings. Transport buildings do not have a dominant heat source, so the natural gas boiler was chosen for FPEI calculations, as the most polluting heat source. This indicator was calculated for 15% and 30% of the most efficient buildings in Lithuania and is presented in Table 11.
Table 11.
FPEI values for 17 groups of buildings for 15% and 30% most efficient buildings in Lithuania.
Figure 9 presents a comparative analysis of the functional primary energy (non-renewable component) threshold values of the 15% most energy-efficient buildings in Lithuania with the primary energy efficiency threshold values of the 15% most energy-efficient buildings in Sweden, Denmark, and Germany. The energy performance assessment indicators in terms of non-renewable primary energy values for the EU countries selected for comparison are equivalent and can be compared.
Figure 9.
Threshold values of PE indicators for the top 15% of the most efficient buildings in Lithuania, Germany, Denmark, and Sweden.
Figure 9 shows that comparing the 15% most efficient buildings in Lithuania and Sweden, the primary non-renewable energy values for hotels and service buildings in Lithuania are 26% higher; for commercial buildings, 26.7% higher; for offices, 30.5% higher; and for residential buildings, on average about 47.2% higher. Compared to Denmark, Lithuania has higher PE values for 38.2% of residential buildings, 25.1% of offices, and 28.2% of commercial buildings. The higher primary non-renewable energy thresholds for Lithuania are due to the higher primary energy conversion factor for electricity in Lithuania (2.3) compared to Sweden (1.8). Sweden and Denmark also have a higher use of renewable energy, which results in a lower amount of delivered energy in the total energy balance, directly influencing the reduction in the value of primary non-renewable energy. Comparing Lithuania’s figures with those of Germany, only the PE values of the residential sector are higher, at around 46.2%. Other uses such as offices, commerce, and storage (logistics) have higher PE values in Germany. This difference is due to the characteristics of typical energy sources and the efficiency and complexity of the technical systems.
4. Discussion
The methodology for establishing the most efficient building thresholds presented in this article was based on the energy performance certificate (EPC) register, as it is the only official source that adheres to the principles of transparency and similar standards. The presented methodological approach, described in the article, demonstrates that it is possible to calculate the primary energy (PE) thresholds required by the Taxonomy Regulation even in the absence of direct data on primary energy indicators.
The methodology selected for the data analysis and cleaning serves to emphasize the significance of data quality in attaining reliable analytical outcomes. The comprehensive methodology not only establishes a rigorous standard for data integrity but also yields more precise and insightful results. This positions the presented methodological approach as a benchmark for similar studies about the implementation of taxonomy requirements for buildings and underscores the value of meticulous data handling in the field of energy analytics.
Special attention was paid to multi-family buildings, where the most vulnerable groups of citizens live. The additional validation of the thresholds by comparison with the actual data on energy consumption for heating made it possible to demonstrate that the defined thresholds apply not only to new buildings but also to multi-family houses that have been fully or partially renovated or that have implemented other energy-saving measures. This means that financial institutions will be able to offer lower interest rates for the purchase of apartments that are not new or fully renovated (cheaper). At the same time, it will be an incentive for clients to choose apartments with better efficiency and for owners to invest in increasing efficiency, as their property will become more attractive.
The methodology employed in this study is distinguished by its division of buildings into 17 distinct categories, a level of detailed subdivision that is uncommon in other countries. This detailed classification results in significant variations, up to 65%, within the top 15% and 30% most energy-efficient buildings. Specifically, the 15% FPEI thresholds range from 81 kWh/m2 for warehouse buildings to 228 kWh/m2 for swimming pool buildings. Similarly, the 30% FPEI thresholds span from 104 kWh/m2 for warehouses to 303 kWh/m2 for foodservice buildings. These substantial differences highlight the critical importance of considering the specific purpose and category of buildings when evaluating their energy efficiency.
It should be noted that the results of the study are subject to certain limitations, primarily related to the availability and, on occasion, the quality of the data, which could not be verified. As can be observed from the data presented in Section 3.1, some buildings consume thousands of kWh/m2 of energy solely for heating purposes. This figure appears to be implausible and is likely indicative of errors made during the certification process or the entry of data into the register. However, this is not a matter that can be verified. The exclusion of such buildings would have a negligible impact on the final thresholds; however, there is no reliable evidence to support the exclusion.
Additionally, there are categories of buildings with a notably low number of certificates, such as transport buildings and swimming pools. The proportion of certified buildings within this category is not discernible from the real estate register. Conversely, a relatively low proportion of buildings in certain categories have been certified, including special purpose buildings (2%) and garages, industrial buildings, and warehouses (6%). The thresholds for these types of buildings may be particularly susceptible to fluctuations in the number of certified buildings. Consequently, they may warrant more frequent revision, such as on an annual basis.
The adoption of the FPEI provides a robust framework for assessing and improving the energy efficiency of Lithuania’s building stock. The future expansion of the database with more primary energy data will allow for more accurate comparisons and a possible recalibration of thresholds. In addition, following the example of Germany, it may be possible to assess buildings based on actual energy consumption. However, this could be a challenging task for financial sector staff. To address such challenges, it would be relevant to develop programmes using AI. In addition, integrating AI-driven programmes into the environmental sustainability assessment of investments could streamline the process, ensuring dynamic updates and reducing the need for constant methodological revisions. However, challenges remain, particularly in obtaining actual energy consumption data for all buildings, which is critical to achieving real-world sustainability.
5. Conclusions
The presented methodology is created for the national Lithuanian buildings stock assessment and is applied by financial institutions to comply with the taxonomy requirements for the buildings and assessment of the sustainability of the investments. It was concluded that
- The methodology is compared with the methodologies published by other countries (Sweden, Germany, and Denmark) and they all use EPC registers as data sources, but different countries apply different approaches due to data availability—some use operational data, and some allow alternative use of operational or calculated data. Also, some countries provide flexibility by assuming efficiency based on the label or year of construction (if EPC is not available). Therefore, it is clear that there cannot be one common methodology for all EU countries, but we can compare methodologies and apply best practises.
- Despite the different definitions of primary energy provided by different EU regulations and directives and used by different countries, the PE indicator to be assessed by the Taxonomy Regulation must include only the non-renewable energy used for all purposes in the building (heating, ventilation, air conditioning, water heating, lighting, and other electricity) that is calculated or based on actual data.
- Primary energy indicators, if not directly available, can be derived from final energy data, as demonstrated by the methodology.
- A more detailed grouping of buildings by purpose is recommended as it provides more reliable thresholds and transparency.
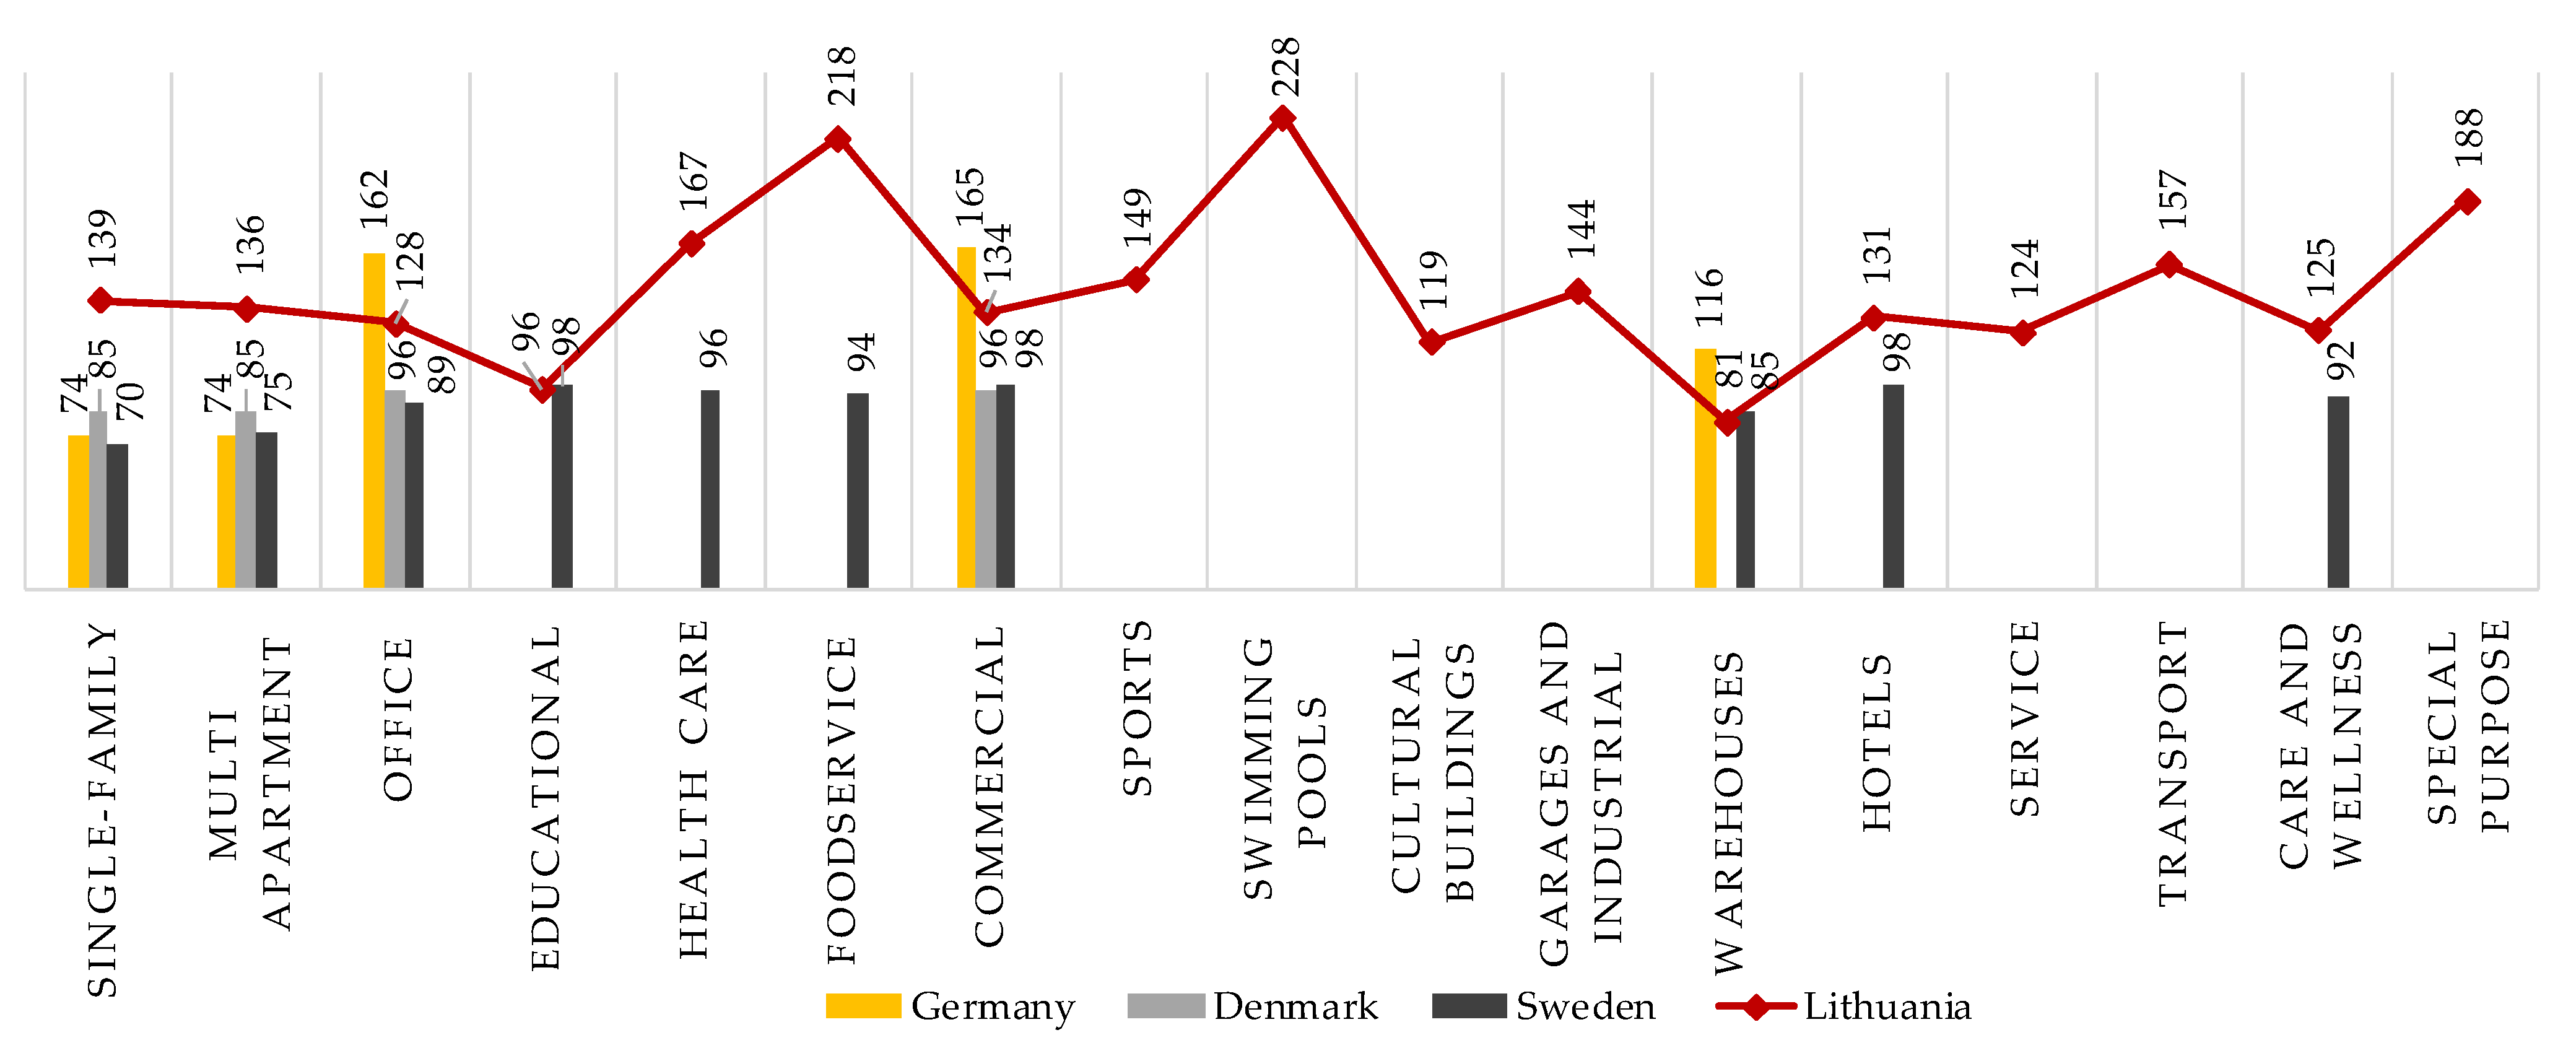
- The highest FPEI values are defined for foodservice buildings, swimming pools, and special purpose buildings and vary from 188 to 228 kWh/m2 per year. Different building uses that can be compared with other countries tend to have higher thresholds, but this is logical as these countries tend to have more renewables in their electricity balance.
- Lithuania’s 15% of the most efficient buildings exhibit significantly higher primary non-renewable energy values compared to those in Sweden, Denmark, and Germany. This disparity is largely attributed to Lithuania’s higher primary energy conversion factor for electricity and the lower use of renewable energy sources. These factors result in higher energy consumption values, particularly in the residential sector, highlighting the need for improved energy efficiency measures and an increased adoption of renewable energy in Lithuania.
Author Contributions
Conceptualization, R.D.-T., V.M. and R.M.; methodology, V.M. and R.M.; validation, R.D.-T., V.M. and R.M.; formal analysis, R.D.-T., V.M. and R.M.; investigation, R.D.-T. and V.M.; data curation, V.M.; writing—original draft preparation, R.D.-T., V.M. and R.M.; writing—review and editing, R.D.-T., V.M. and R.M.; visualization, R.D.-T. and V.M.; supervision, V.M.; funding acquisition, R.M. All authors have read and agreed to the published version of the manuscript.
Funding
This research was funded by the Lithuanian Banking Association, No. 10.13-2023-285.
Institutional Review Board Statement
Not applicable.
Informed Consent Statement
Not applicable.
Data Availability Statement
The original data presented in the study are openly available from the official EPC registry: https://www.ssva.lt/registrai/pensreg/pensert_list.php (accessed on 20 September 2024).
Conflicts of Interest
The authors declare no conflicts of interest.
References
- Global Alliance for Buildings and Construction. 2023 Global Status Report for Buildings and Construction: Beyond Foundations—Mainstreaming Sustainable Solutions to Cut Emissions from the Buildings Sector; United Nations Environment Programme: Nairobi, Kenya, 2024; ISBN 9789280741315. [Google Scholar]
- Haag, M.; Hurka, S.; Kaplaner, C. Policy Complexity and Implementation Performance in the European Union. Regul. Gov. 2024. [Google Scholar] [CrossRef]
- Fotiou, T.; Fragkos, P.; Zisarou, E. Decarbonising the EU Buildings|Model-Based Insights from European Countries. Climate 2024, 12, 85. [Google Scholar] [CrossRef]
- Hafez, F.S.; Sa’di, B.; Safa-Gamal, M.; Taufiq-Yap, Y.H.; Alrifaey, M.; Seyedmahmoudian, M.; Stojcevski, A.; Horan, B.; Mekhilef, S. Energy Efficiency in Sustainable Buildings: A Systematic Review with Taxonomy, Challenges, Motivations, Methodological Aspects, Recommendations, and Pathways for Future Research. Energy Strategy Rev. 2023, 45, 101013. [Google Scholar] [CrossRef]
- Fotiou, T.; de Vita, A.; Capros, P. Economic-Engineering Modelling of the Buildings Sector to Study the Transition towards Deep Decarbonisation in the EU. Energies 2019, 12, 2745. [Google Scholar] [CrossRef]
- Decarbonising Buildings in Cities and Regions; OECD Urban Studies; OECD: Paris, France, 2022; ISBN 9789264639683.
- European Commission. Commission Delegated Regulation (EU) 2021/2139 by Establishing the Technical Screening Criteria for Determining the Conditions under Which an Economic Activity Qualifies as Contributing Substantially to Climate Change Mitigation or Climate Change Adaptation and for Determining Whether That Economic Activity Causes No Significant Harm to Any of the Other Environmental Objectives. 2024. 349p. Available online: https://eur-lex.europa.eu/legal-content/EN/TXT/?uri=celex%3A32021R2139 (accessed on 20 November 2024).
- Jakob, M.; Ostermeyer, Y.; Nägeli, C.; Hofer, C. Overcome Data Gaps to Benchmark Building Stocks against Climate Targets Related to the EU Taxonomy and Other Decarbonisation Initiatives. IOP Conf. Ser. Earth Environ. Sci. 2022, 1085, 44DUMMY. [Google Scholar] [CrossRef]
- Koch, C.; Buser, M.; Andersson, R. The Impact of the EU Taxonomy of Sustainable Finance on the Building Field. In SDGs in Construction Economics and Organization; Springer Proceedings in Business and Economics; Springer Nature: Cham, Switzerland, 2023; pp. 283–296. [Google Scholar]
- Verhaeghe, C.; Verbeke, S.; Audenaert, A. A Consistent Taxonomic Framework: Towards Common Understanding of High Energy Performance Building Definitions. Renew. Sustain. Energy Rev. 2021, 146, 111075. [Google Scholar] [CrossRef]
- Kirschenmann, K. The EU Taxonomy’s (Potential) Effects on the Banking Sector and Bank Lending to Firms. Econ. Voice 2022, 19, 245–253. [Google Scholar] [CrossRef]
- European Parliament. Directive (EU) 2024/1275 on the Energy Performance of Buildings (Recast). 2024. Available online: https://eur-lex.europa.eu/legal-content/EN/TXT/?uri=CELEX%3A32024L1275 (accessed on 20 November 2024).
- Hitchin, R. Primary Energy Factors and the Primary Energy Intensity of Delivered Energy: An Overview of Possible Calculation Conventions. Build. Serv. Eng. Res. Technol. 2019, 40, 198–219. [Google Scholar] [CrossRef]
- Sesana, M.M.; Salvalai, G.; Della Valle, N.; Melica, G.; Bertoldi, P. Towards Harmonising Energy Performance Certificate Indicators in Europe. J. Build. Eng. 2024, 95, 110323. [Google Scholar] [CrossRef]
- Bilardo, M.; Kämpf, J.H.; Fabrizio, E. From Zero Energy to Zero Power Buildings: A New Paradigm for a Sustainable Transition of the Building Stock. Sustain. Cities Soc. 2024, 101, 105136. [Google Scholar] [CrossRef]
- Iunco, A.; Paduos, S.; Chiappero, M.; Corrado, V.; Santarelli, M. Technical-Economic and Financial Feasibility of New Technologies in the Energy Refurbishment of Residential Buildings. E3S Web Conf. 2024, 523, 03003. [Google Scholar] [CrossRef]
- Marino, C.; Nucara, A.; Panzera, M.F.; Pietrafesa, M. Towards the Nearly Zero and the plus Energy Building: Primary Energy Balances and Economic Evaluations. Therm. Sci. Eng. Prog. 2019, 13, 100400. [Google Scholar] [CrossRef]
- Beltrán-Velamazán, C.; Monzón-Chavarrías, M.; López-Mesa, B. A New Approach for National-Scale Building Energy Models Based on Energy Performance Certificates in European Countries: The Case of Spain. Heliyon 2024, 10, 128634. [Google Scholar] [CrossRef] [PubMed]
- Pastore, L.M.; Lo Basso, G.; de Santoli, L. How National Decarbonisation Scenarios Can Affect Building Refurbishment Strategies. Energy 2023, 283, 128634. [Google Scholar] [CrossRef]
- Nykredit Group & MOE Report Top 15% of the Most Energy-Efficient Buildings According to the EU Taxonomy. Available online: https://www.nykredit.com/siteassets/ir/files/bond-issuance/green-bonds/top-15_moe.pdf (accessed on 30 October 2024).
- Tschätsch, C. EU Taxonomy: Acquisition and Owner-Ship Of Buildings. Derivation of Top 15% of Existing Building Stock in Germany. Available online: https://www.vdpresearch.de/wp-content/uploads/2023/10/Drees_Sommer_Veroeffentlichung-VDP_top15_summary_update_2023.pdf (accessed on 30 October 2024).
- Wahlström, Å.; Sundström, T. Taxonomy Regulations—An Incentive to Improve the Building Stock Built Before 2020 in Sweden. Available online: https://www.eceee.org/library/conference_proceedings/eceee_Summer_Studies/2022/7-policies-and-programmes-for-better-buildings/taxonomy-regulations-an-incentive-to-improve-the-building-stock-built-before-2020-in-sweden/ (accessed on 30 October 2024).
- CFP Green Buildings EU Taxonomy Alignment Methodology Document for Green Commercial and Residential Buildings. Available online: https://www.asrnederland.nl/-/media/files/asrnederland-nl/investor-relations/schuldpapier/green-finance-framework/20220824-methodology-document-green-ommercial-residential-buildings.pdf?la=nl-nl (accessed on 20 November 2024).
- Borodiņecs, A.; Lebedeva, K. Methodology, on the Basis of Which 15% of the Most Energy-Efficient Residential and Non-Residential Buildings in Latvia Were Determined, Based on Taxonomy Regulation No. 2020/852 and the Requirements of Its Implementing Legislation (Commission Delegated Regulation (EU) 2021/2139). Available online: https://www.financelatvia.eu/wp-content/uploads/2024/06/R-taxon-EN-summary.pdf (accessed on 20 November 2024).
- Antonín, I.J. Methodology of Establishing the 15% Threshold of the Most Energy-Efficient Buildings in the Czech Republic Prepared in Cooperation with CZGBC and CPI Property Group. Available online: https://www.czgbc.org/files/2019/12/8dcda4fba36a9a298865ac8b56d6998a.pdf (accessed on 20 November 2024).
- Eiendomsverdi Green Homes and the EU Taxonomy. Available online: https://home.eiendomsverdi.no/assets/reports/Gr%C3%B8nn-bolig/greenHomes-2024-v1.1.pdf (accessed on 20 November 2024).
- Maduta, C.; D’Agostino, D.; Tsemekidi-Tzeiranaki, S.; Castellazzi, L.; Melica, G.; Bertoldi, P. Towards Climate Neutrality within the European Union: Assessment of the Energy Performance of Buildings Directive Implementation in Member States. Energy Build 2023, 301, 113716. [Google Scholar] [CrossRef]
- European Commission. Guidelines 2012/C 115/01 on the Energy Performance of Buildings by Establishing a Comparative Methodology Framework for Calculating Cost-Optimal Levels of Minimum Energy Performance Requirements for Buildings and Building Elements. 2012. Available online: https://eur-lex.europa.eu/legal-content/LV/TXT/?uri=uriserv%3AOJ.C_.2012.115.01.0001.01.ENG&toc=OJ%3A+C%3A2012%3A115%3ATOC (accessed on 20 November 2024).
- European Parliament. Directive 2010/31/EU on the Energy Performance of Buildings (Recast). 2021. Available online: https://eur-lex.europa.eu/eli/dir/2010/31/oj (accessed on 20 November 2024).
- European Parliament. Directive 2012/27/EU on Energy Efficiency. 2023. Available online: https://eur-lex.europa.eu/eli/dir/2012/27/oj (accessed on 20 November 2024).
- European Commission. Commission Delegated Regulation (EU) No 244/2012 on the Energy Performance of Buildings by Establishing a Comparative Methodology Framework for Calculating Cost-Optimal Levels of Minimum Energy Performance Requirements for Buildings and Building Elements. 2012. Available online: https://eur-lex.europa.eu/eli/reg_del/2012/244/oj (accessed on 20 November 2024).
- STR 2.01.02:2016; Energy Performance Design and Certification of Buildings. Ministry of Environment of the Republic of Lithuania: Vilnius, Lithuania, 2024.
- Eurostat House or Flat: Where Do You Live? Available online: https://ec.europa.eu/eurostat/web/main/home (accessed on 31 October 2024).
- Centre of Registers (SECR) Real Property Register and Cadastre. Available online: https://www.registrucentras.lt/ (accessed on 31 October 2024).
- Government of the Republic of Lithuania. Long-Term Renovation Strategy of Lithuania; Government of the Republic of Lithuania: Vilnius, Lithuania, 2021.
- Lithuanian District Heating Association Heat Consumption. Available online: https://lsta.lt/silumos-ukis/silumos-suvartojimas/ (accessed on 31 October 2024).
Disclaimer/Publisher’s Note: The statements, opinions and data contained in all publications are solely those of the individual author(s) and contributor(s) and not of MDPI and/or the editor(s). MDPI and/or the editor(s) disclaim responsibility for any injury to people or property resulting from any ideas, methods, instructions or products referred to in the content. |
© 2024 by the authors. Licensee MDPI, Basel, Switzerland. This article is an open access article distributed under the terms and conditions of the Creative Commons Attribution (CC BY) license (https://creativecommons.org/licenses/by/4.0/).