


Abstract
Background: Hypertrophic cardiomyopathy (HCM) exhibits clinical heterogeneity and age-related penetrance, yet its molecular basis across adulthood remains incompletely understood. This study aimed to characterize age-dependent transcriptomic signatures and identify conserved molecular features across adult HCM. Methods: Left ventricular RNA sequencing data from the GSE141910 dataset were analyzed by comparing three age-stratified HCM groups (18–39, 40–59, and ≥60 years) with corresponding age-matched controls. Differentially expressed genes (DEGs) were identified using GEO2R, followed by functional enrichment and protein–protein interaction (PPI) network analysis. Results: A total of 498 DEGs were shared across all age tertiles, while 439, 594, and 353 DEGs were specific to the youngest, middle-aged, and oldest groups, respectively. Shared DEGs exhibited an extracellular matrix (ECM)-related functional profile and formed PPI modules associated with ECM homeostasis and immune regulation. Age-specific analyses revealed enrichment of adaptive immune pathways in younger patients, cell cycle- and interferon-associated processes in the middle-aged group, and ECM remodeling together with senescence-associated processes in older patients. Hub gene analysis further highlighted distinct age-dependent molecular signatures. Conclusions: Our findings suggest that adult HCM is characterized by a conserved fibrotic core accompanied by age-dependent biological programs, providing a framework for future studies investigating age-informed biomarkers and therapeutic targets.
1. Introduction
Hypertrophic cardiomyopathy (HCM) is a common inherited cardiomyopathy, with an estimated prevalence ranging from 1:500 to 1:200 depending on the population studied, diagnostic criteria, and the inclusion of subclinical or clinically overt disease [1,2,3]. Increasing evidence indicates that HCM spans the entire adult lifespan, with substantial age-related differences in clinical presentation, disease progression, and outcomes [4]. Large contemporary registries, including the Hypertrophic Cardiomyopathy Registry (HCMR), the ESC EURObservational Research Programme (EORP) Cardiomyopathy Registry, and the Sarcomeric Human Cardiomyopathy Registry (SHaRe), have demonstrated that HCM is diagnosed across a broad age spectrum and that age at presentation is associated with distinct phenotypic characteristics and prognosis [5,6,7]. Recent analyses from the SHaRe registry, including comparisons of patients aged 18–39, 40–59, and ≥60 years, further demonstrated that the burden of ventricular arrhythmias, cardiac arrest, and sudden cardiac death is greatest in younger patients, whereas in a broader cohort with phenotypically mild disease, adverse cardiovascular outcomes were most consistently predicted by structural and hemodynamic markers of disease severity—larger left atrial diameter and outflow tract obstruction in particular—alongside demographic factors such as older age, female sex, and elevated body mass index [8,9].
The etiology of HCM is primarily attributed to pathogenic variants in sarcomeric genes [10,11], while epigenetic and genetic modifiers contribute to the marked variability in disease expression [12]. However, despite the well-recognized age-dependent clinical heterogeneity of HCM, it remains unclear whether these differences are accompanied by distinct molecular remodeling programs, as transcriptomic studies have largely analyzed HCM as a single entity without systematic age stratification. Therefore, we performed an age-stratified transcriptomic analysis of adult HCM to identify conserved molecular features shared across age groups and age-specific biological programs.
2. Materials and Methods
2.1. Data Source
The GSE141910 RNA sequencing dataset was downloaded from the Gene Expression Omnibus (GEO) database (https://www.ncbi.nlm.nih.gov/geo/query/acc.cgi?acc=GSE141910, accessed on 30 May 2026). The dataset was generated using the GPL16791 Illumina HiSeq 2500 platform and comprises left ventricular free-wall transcriptomes from patients with hypertrophic cardiomyopathy (HCM), dilated cardiomyopathy, peripartum cardiomyopathy, and non-failing donor hearts [13,14]. For the present study, only adult HCM patients (n = 27) and non-failing controls (n = 117) were included. HCM patients and age-matched controls were subsequently stratified into three age tertiles: T1 (18–39 years; HCM, n = 6; controls, n = 9), T2 (40–59 years; HCM, n = 15; controls, n = 57), and T3 (≥60 years; HCM, n = 6; controls, n = 51). These boundaries were selected to align with age thresholds established in large sarcomeric HCM cohorts rather than as an arbitrary equal division of the age range: SHaRe stratifies adult-onset HCM patients at 19–39 versus ≥40 years for sub-analyses of disease burden [15], corresponding to our T1/T2 boundary, while an age of ≥60 years has been used as a dedicated threshold for HCM risk stratification in a large single-center cohort [16], corresponding to our T2/T3 boundary.
2.2. Data Preprocessing and Differential Expression Analysis
Differential expression analysis was performed using the GEO2R web tool, which implements the DESeq2 package in R for RNA-seq count data. Differentially expressed genes (DEGs) were defined as transcripts with a false discovery rate (FDR) < 0.05 and an absolute log2 fold change (|log2FC|) ≥ 1, representing statistically significant and biologically meaningful expression changes. Volcano plots were generated using GEO2R. Differential expression analysis was conducted independently for each HCM age tertile (T1, T2, and T3) compared with its corresponding age-matched control group. Shared and tertile-specific DEGs were identified by Venn diagram analysis using the InteractiVenn web platform (https://www.interactivenn.net/, accessed on 31 May 2026).
2.3. Functional Enrichment Analysis of DEGs
To investigate the biological significance of the identified DEGs, functional enrichment analyses were performed separately for the shared DEGs and for the age tertile-specific DEGs. Gene Ontology (GO) enrichment analysis, including Biological Process (BP), Molecular Function (MF), and Cellular Component (CC), was performed using the PANTHER Classification System (https://geneontology.org/, accessed on 31 May 2026). GO terms with a false discovery rate (FDR) < 0.05 and fold enrichment >1 were considered significantly enriched. Kyoto Encyclopedia of Genes and Genomes (KEGG) and Reactome pathway enrichment analyses were performed using the g:Profiler web server (https://biit.cs.ut.ee/gprofiler/gost, accessed on 1 June 2026). Pathways with an adjusted p value < 0.05 were considered statistically significant. For graphical representation, enrichment significance was expressed as −log10(FDR) for GO analyses and −log10(adjusted p value) for KEGG and Reactome analyses.
2.4. Protein–Protein Interaction (PPI) Network Construction and Hub Genes Identification
Protein–protein interaction (PPI) networks were constructed using the Search Tool for the Retrieval of Interacting Genes/Proteins (STRING, version 2.2.0) [17] and visualized in Cytoscape (version 3.10.4) [18]. Network modules were identified using the Molecular Complex Detection (MCODE) [19] plugin with default parameters (degree cutoff = 2, node score cutoff = 0.2, k-core = 2, and maximum depth = 100). Hub genes were identified using the CytoHubba [20] plugin by applying five complementary topological algorithms: Maximal Clique Centrality (MCC), Maximum Neighborhood Component (MNC), Degree, Stress, and Betweenness. The top 20 genes ranked by each algorithm were extracted, and genes common to all five algorithms were defined as hub genes. Their overlap was visualized using an UpSet plot generated with the Intervene Shiny application (https://asntech.shinyapps.io/intervene/, accessed on 3 July 2026).
3. Results
3.1. Identification of Shared and Age Tertile-Specific DEGs
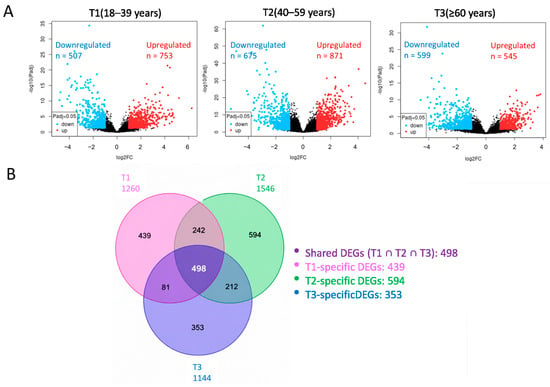
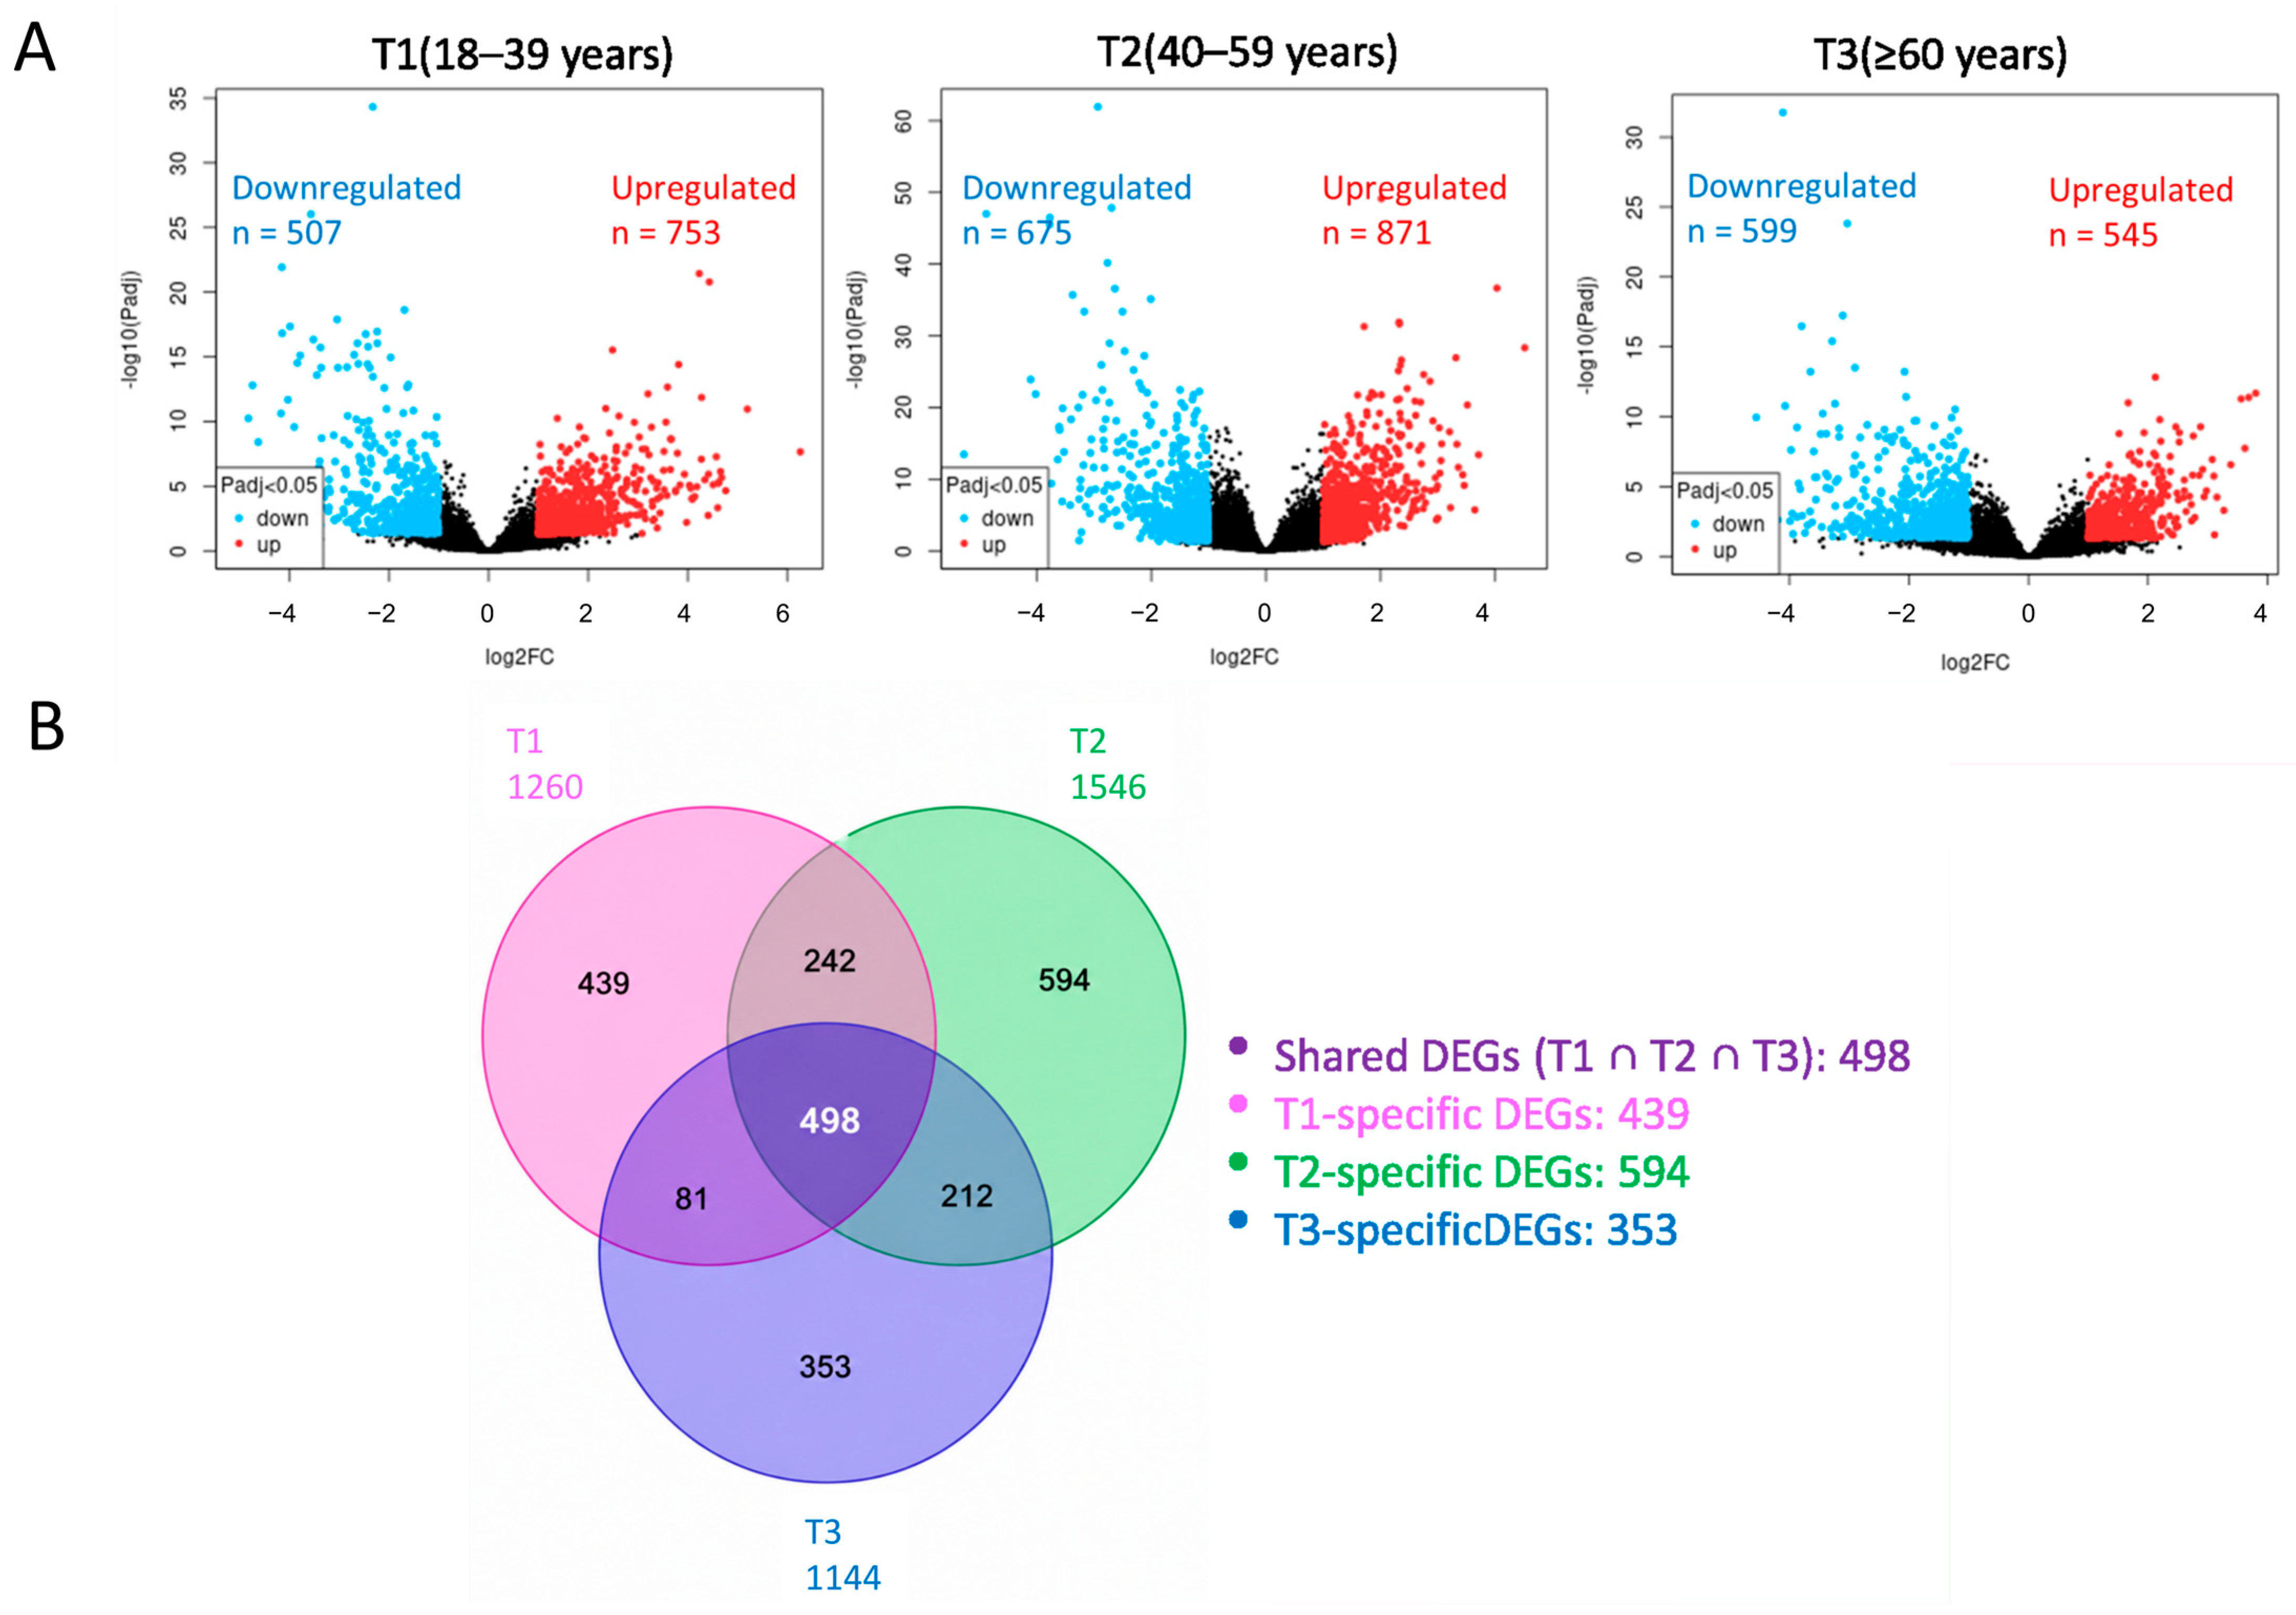
Comparison of each HCM age tertile with age-matched non-failing controls revealed distinct transcriptional profiles, as illustrated by volcano plots showing the distribution of significantly upregulated and downregulated genes (Figure 1A). Of the 19,340, 20,054, and 20,994 genes analyzed after preprocessing in T1, T2, and T3, respectively, 1260 (T1, ~6.5%), 1546 (T2, ~7.7%), and 1144 (T3, ~5.4%) were identified as DEGs (adjusted p < 0.05, |log2FC| ≥ 1). Overlap analysis revealed 498 genes that were shared among all three HCM age tertiles, whereas 439, 594, and 353 genes were uniquely detected in T1, T2, and T3, respectively. Pairwise overlaps included 242 DEGs shared between T1 and T2, 212 between T2 and T3, and 81 between T1 and T3 (Figure 1B).
Figure 1.
Identification of shared and age tertile-specific DEGs: (A) Volcano plots showing DEGs identified in HCM patients from the T1, T2, and T3 age tertiles compared with their corresponding age-matched control groups. Each point represents a gene. Red dots indicate upregulated genes (log2FC ≥ 1 and FDR < 0.05), blue dots indicate downregulated genes (log2FC ≤ −1 and FDR < 0.05), and black dots represent genes that did not meet the significance thresholds. The number of upregulated and downregulated genes is indicated for each tertile. (B) Venn diagram illustrating the overlap among DEGs identified in the three HCM age tertiles. A total of 498 shared DEGs constituted the shared HCM signature, whereas 439, 594, and 353 genes were unique to the T1, T2, and T3 groups, respectively. DEGs: differentially expressed genes.
3.2. Functional Enrichment Analysis of Shared and Age Tertile-Specific DEGs
3.2.1. Functional Enrichment Analysis of Shared DEGs
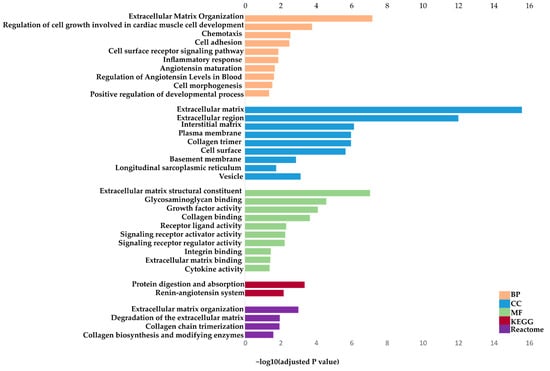
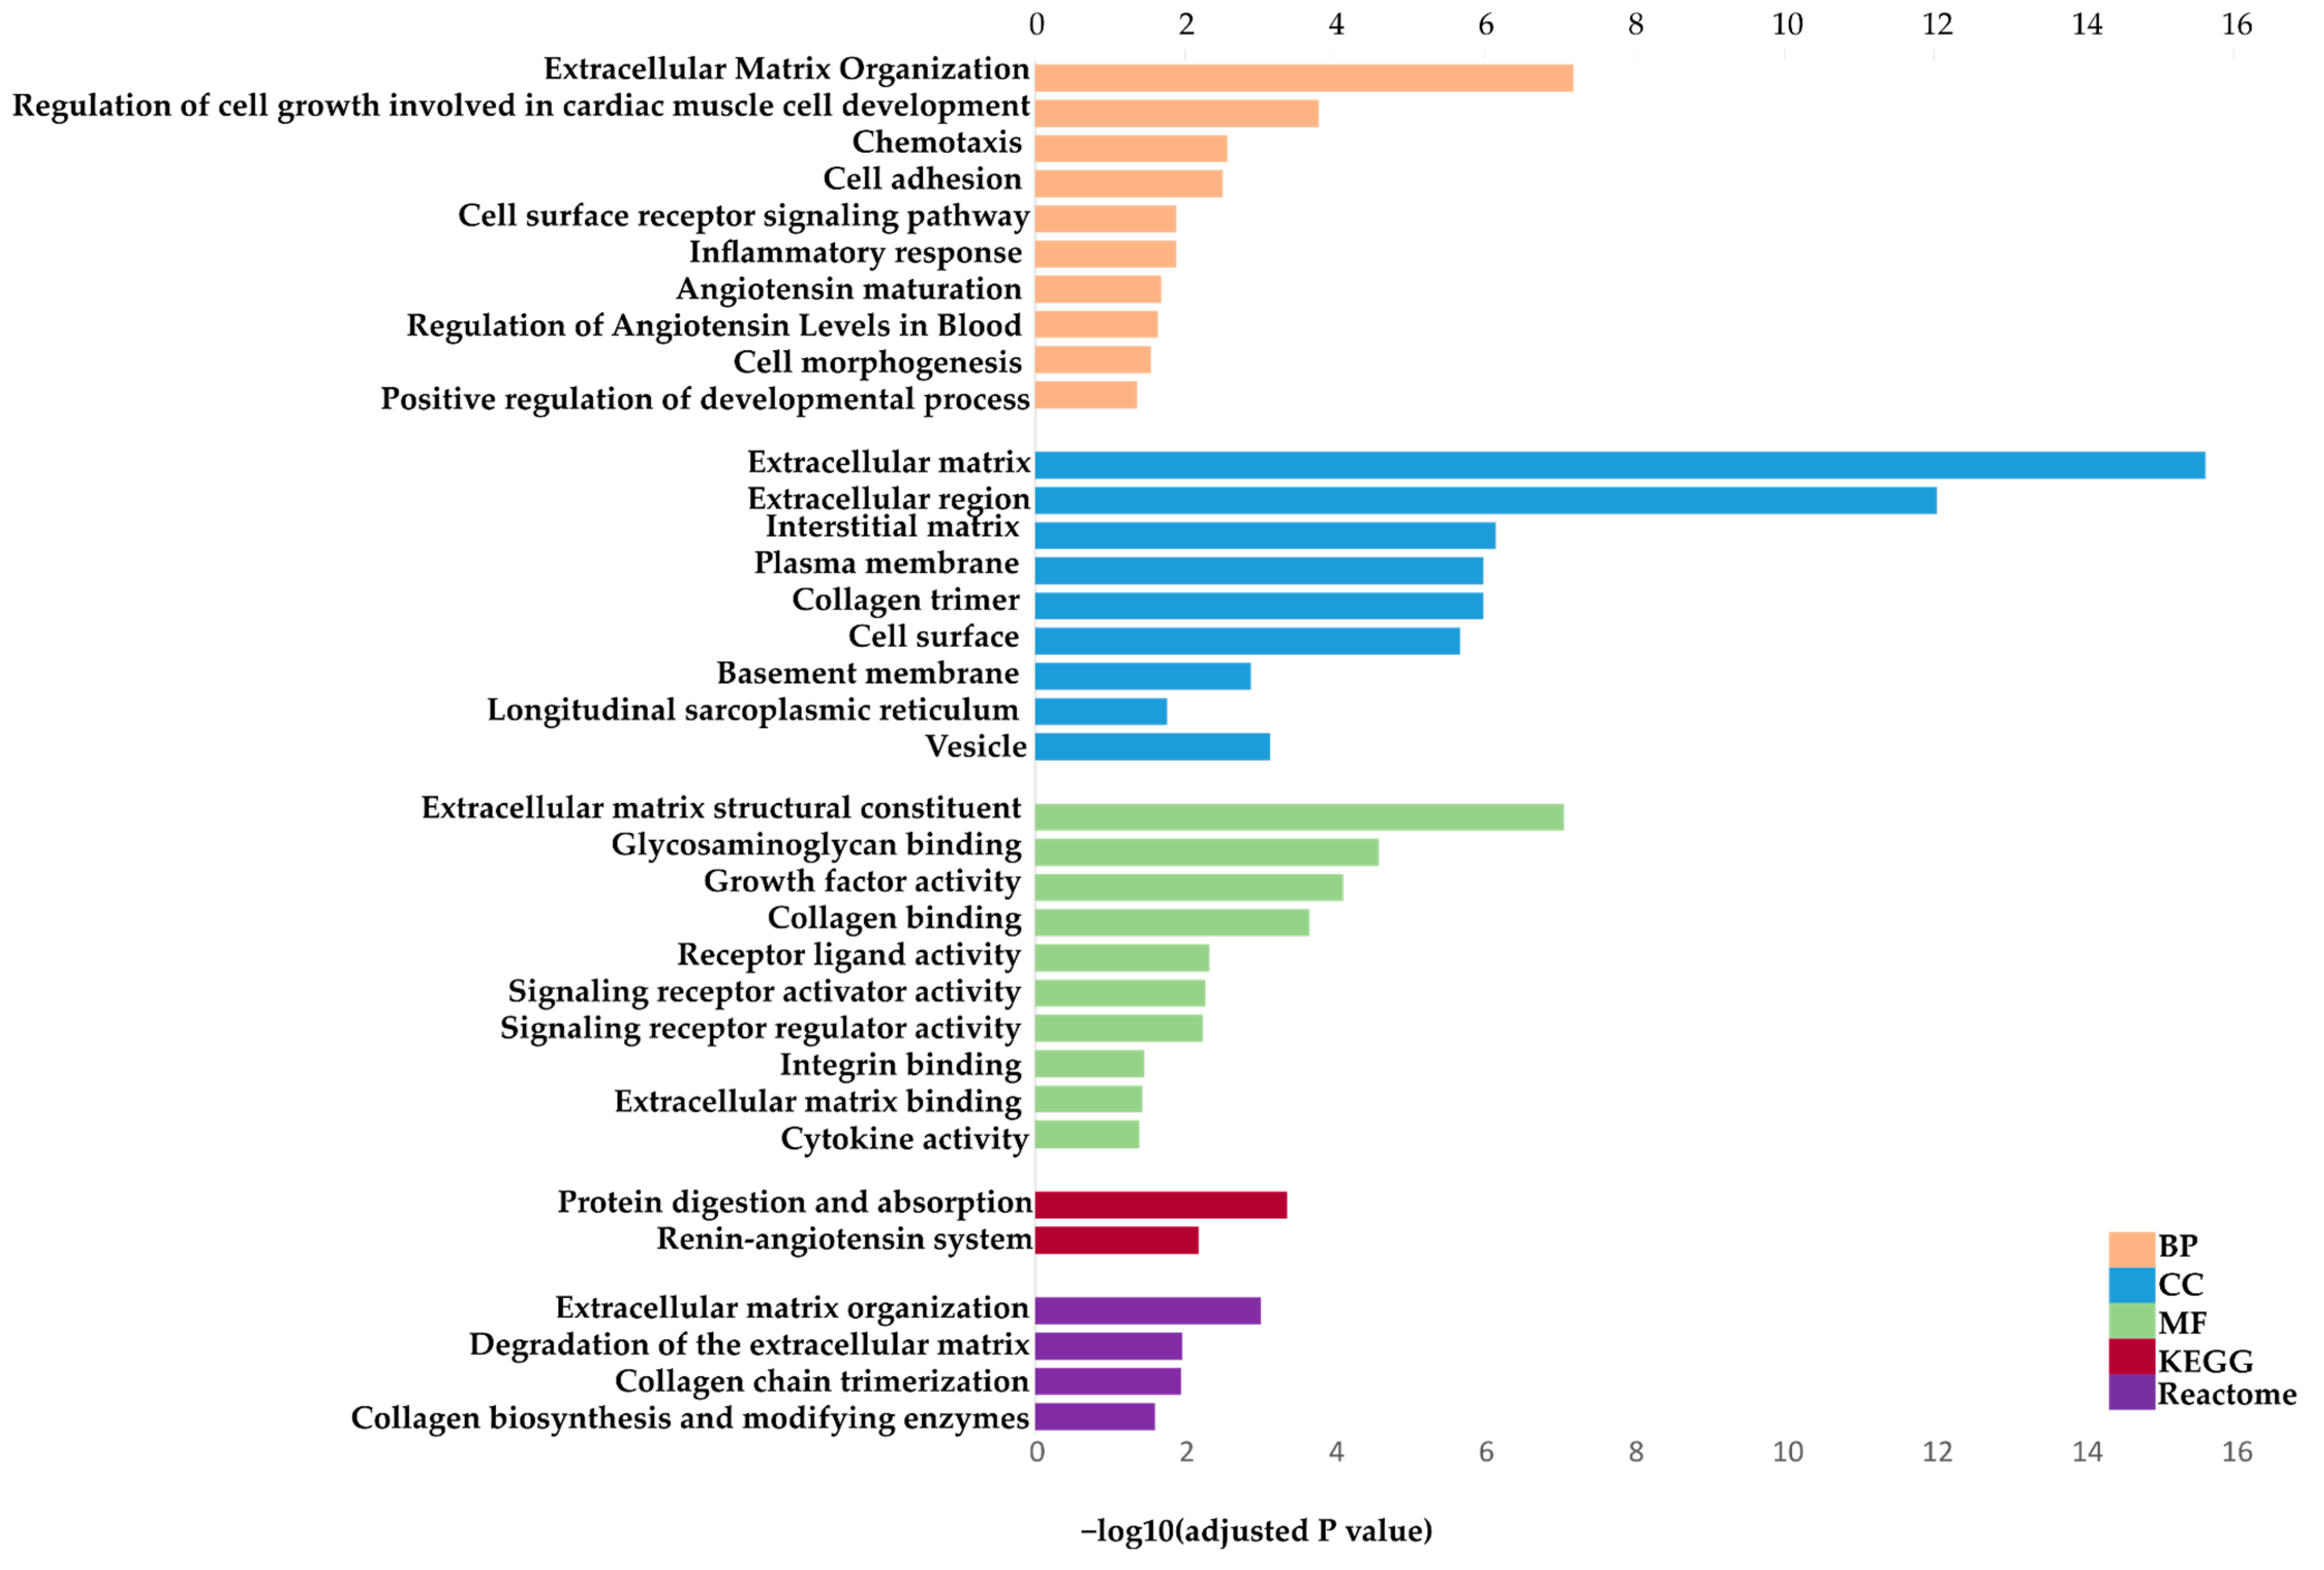
Functional enrichment analysis of the shared DEGs revealed a predominant ECM-related functional profile (Figure 2). The most significantly enriched GO BP terms included extracellular matrix organization, regulation of cell growth involved in cardiac muscle cell development, chemotaxis, cell adhesion, and inflammatory response. The enriched GO CC terms were mainly associated with the extracellular matrix, extracellular region, interstitial matrix, collagen trimer, and basement membrane. GO MF analysis identified extracellular matrix structural constituent, collagen binding, glycosaminoglycan binding, and growth factor activity as the most significantly enriched molecular functions. KEGG pathway analysis showed enrichment of protein digestion and absorption and the renin–angiotensin system, whereas Reactome analysis highlighted extracellular matrix organization, degradation of the extracellular matrix, collagen chain trimerization, and collagen biosynthesis and modifying enzymes.
Figure 2.
Functional enrichment analysis of shared DEGs. Enriched GO terms identified using PANTHER, together with enriched KEGG and Reactome pathways identified using g:Profiler. Terms are grouped by annotation source and ranked within each category according to enrichment significance. Bar length represents −log10(adjusted p value). Only significantly enriched terms and pathways (adjusted p < 0.05) are displayed. DEGs: differentially expressed genes; BP: biological process; CC: cellular component; MF: molecular function.
3.2.2. Functional Enrichment Analysis of Tertile-Specific DEGs
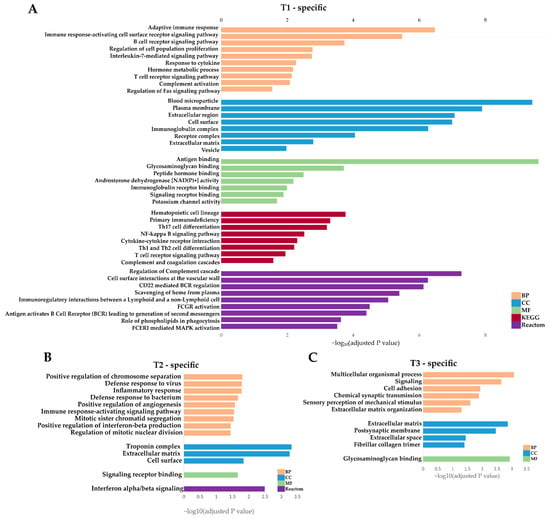
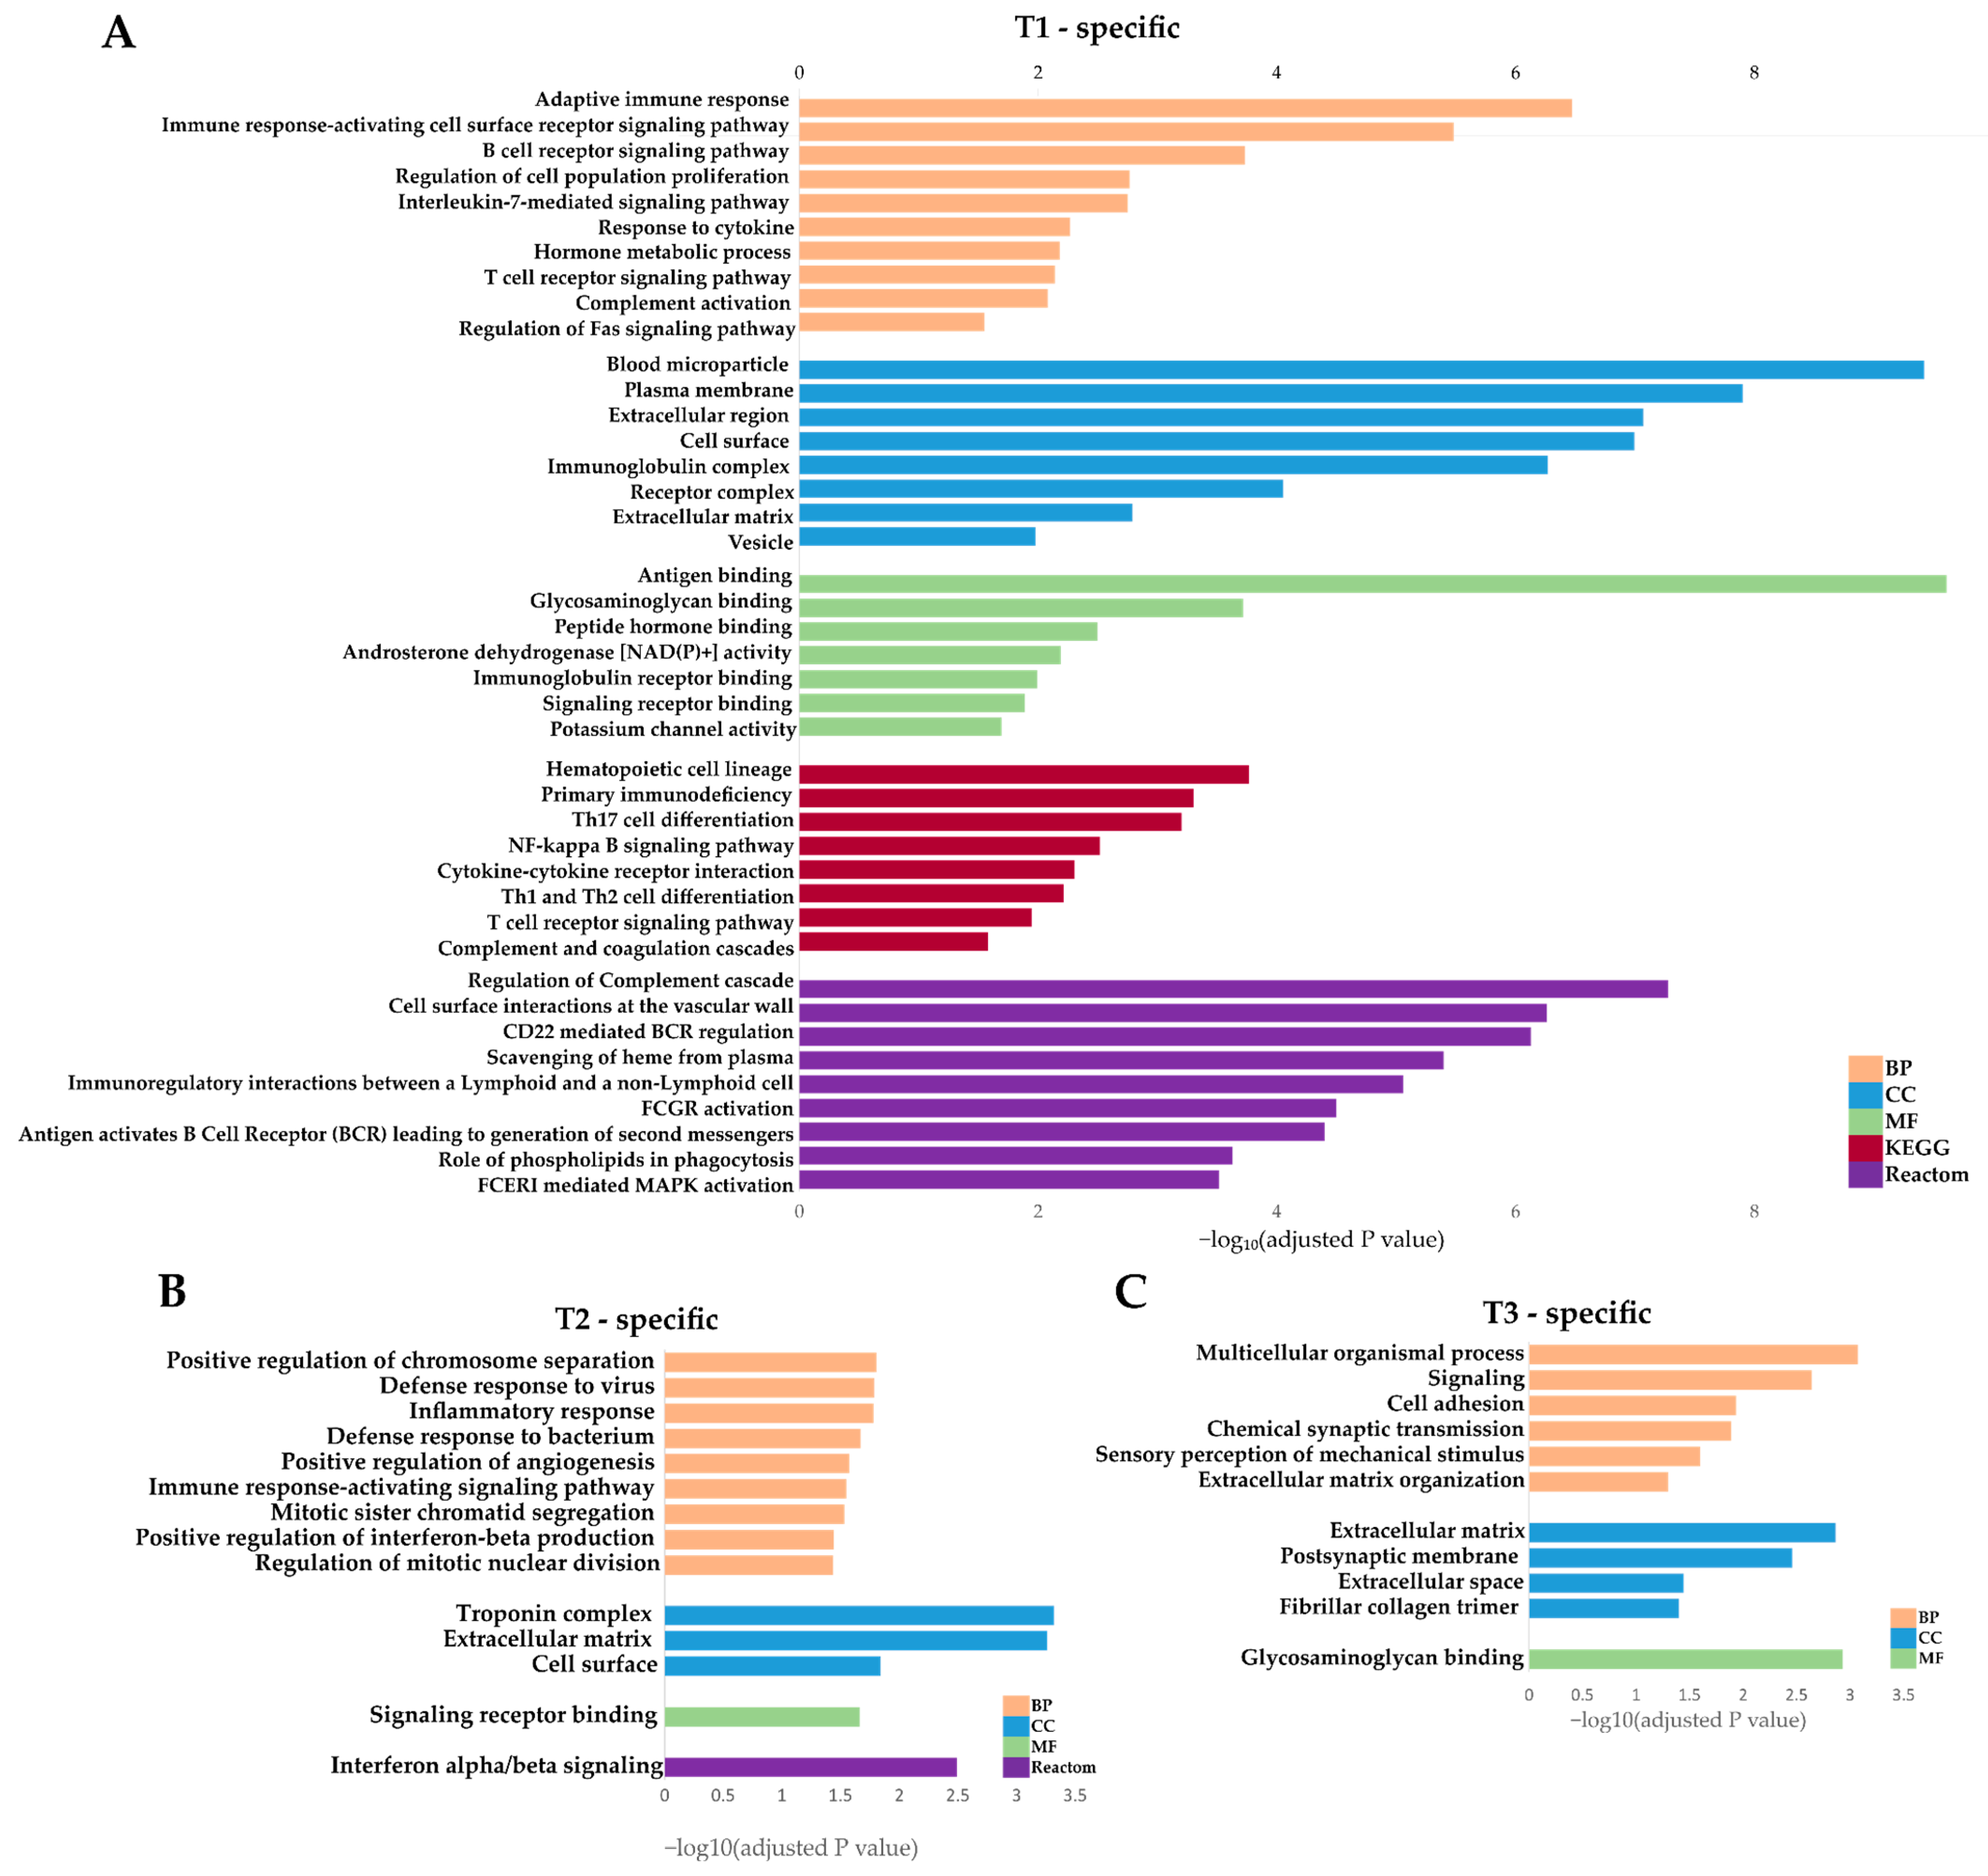
Functional enrichment analysis of the 439 T1-specific DEGs demonstrated enrichment of immune- and signaling-related processes (Figure 3A). The most significantly enriched GO BP terms included adaptive immune response, immune response-activating cell surface receptor signaling pathway, B-cell receptor signaling pathway, regulation of cell population proliferation, and interleukin-7-mediated signaling pathway. This immune-related profile was further supported by enrichment of GO CC terms blood microparticle, plasma membrane, extracellular region, cell surface, and immunoglobulin complex, as well as the GO MF terms antigen binding, glycosaminoglycan binding, peptide hormone binding, and immunoglobulin receptor binding. Consistent with these findings, KEGG pathway analysis identified hematopoietic cell lineage, primary immunodeficiency, Th1 cell differentiation, NF-kappa B signaling pathway, cytokine–cytokine receptor interaction, T-cell receptor signaling pathway, and complement and coagulation cascades, while Reactome analysis highlighted pathways associated with complement regulation, B-cell receptor signaling, immunoregulatory cell interactions, phagocytosis, and FCERI-mediated MAPK activation.
Figure 3.
Functional enrichment analysis of age tertile-specific DEGs: (A) T1-specific DEGs, (B) T2-specific DEGs, and (C) T3-specific DEGs. Enriched GO terms were identified using PANTHER. Significantly enriched KEGG and/or Reactome pathways, when present, were identified using g:Profiler. Terms are grouped by annotation source and ranked within each category according to enrichment significance. Bar length represents −log10(adjusted p value). Only significantly enriched terms and pathways (adjusted p < 0.05) are displayed. DEGs: differentially expressed genes; BP: biological process; CC: cellular component; MF: molecular function.
Functional enrichment analysis of the T2-specific DEGs revealed enrichment of cell cycle-, inflammatory response-, and host defense-related processes (Figure 3B). The predominant GO BP terms included positive regulation of chromosome organization, defense response to virus, inflammatory response, defense response to bacterium, positive regulation of angiogenesis, and mitotic sister chromatid segregation. The enriched GO CC terms comprised troponin complex, extracellular matrix, and cell surface, whereas signaling receptor binding was the most significantly enriched GO MF term. Reactome analysis identified interferon alpha/beta signaling as the only significantly enriched pathway. No KEGG pathways reached the predefined significance threshold.
Functional enrichment analysis of the T3-specific DEGs indicated enrichment of processes related to multicellular organization and ECM remodeling (Figure 3C). The most significantly enriched GO BP terms included multicellular organismal process, signaling, cell adhesion, chemical synaptic transmission, sensory perception of mechanical stimulus, and extracellular matrix organization. This enrichment pattern was further supported by the GO CC terms extracellular matrix, postsynaptic membrane, extracellular space, and fibrillar collagen trimer, together with glycosaminoglycan binding as the predominant GO MF term. No significantly enriched KEGG or Reactome pathways were identified.
3.3. PPI Network Construction and Hub Genes Identification
Hub genes, defined here as genes ranked among the top 20 by all five CytoHubba topological algorithms (MCC, MNC, Degree, Stress, and Betweenness; see Section 2.4), represent the nodes with the highest topological centrality within each PPI network and are therefore considered candidate key regulators of the corresponding molecular signature.
3.3.1. PPI Network Construction and Hub Gene Identification for Shared DEGs
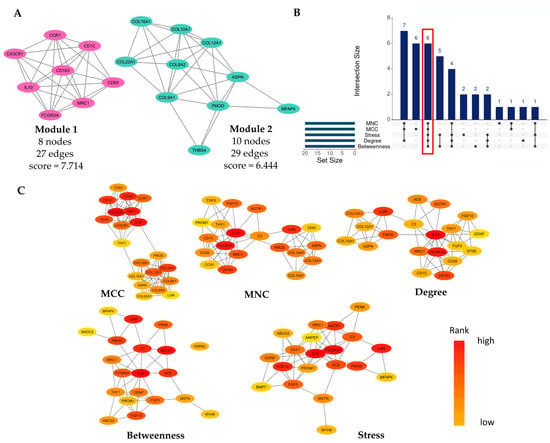
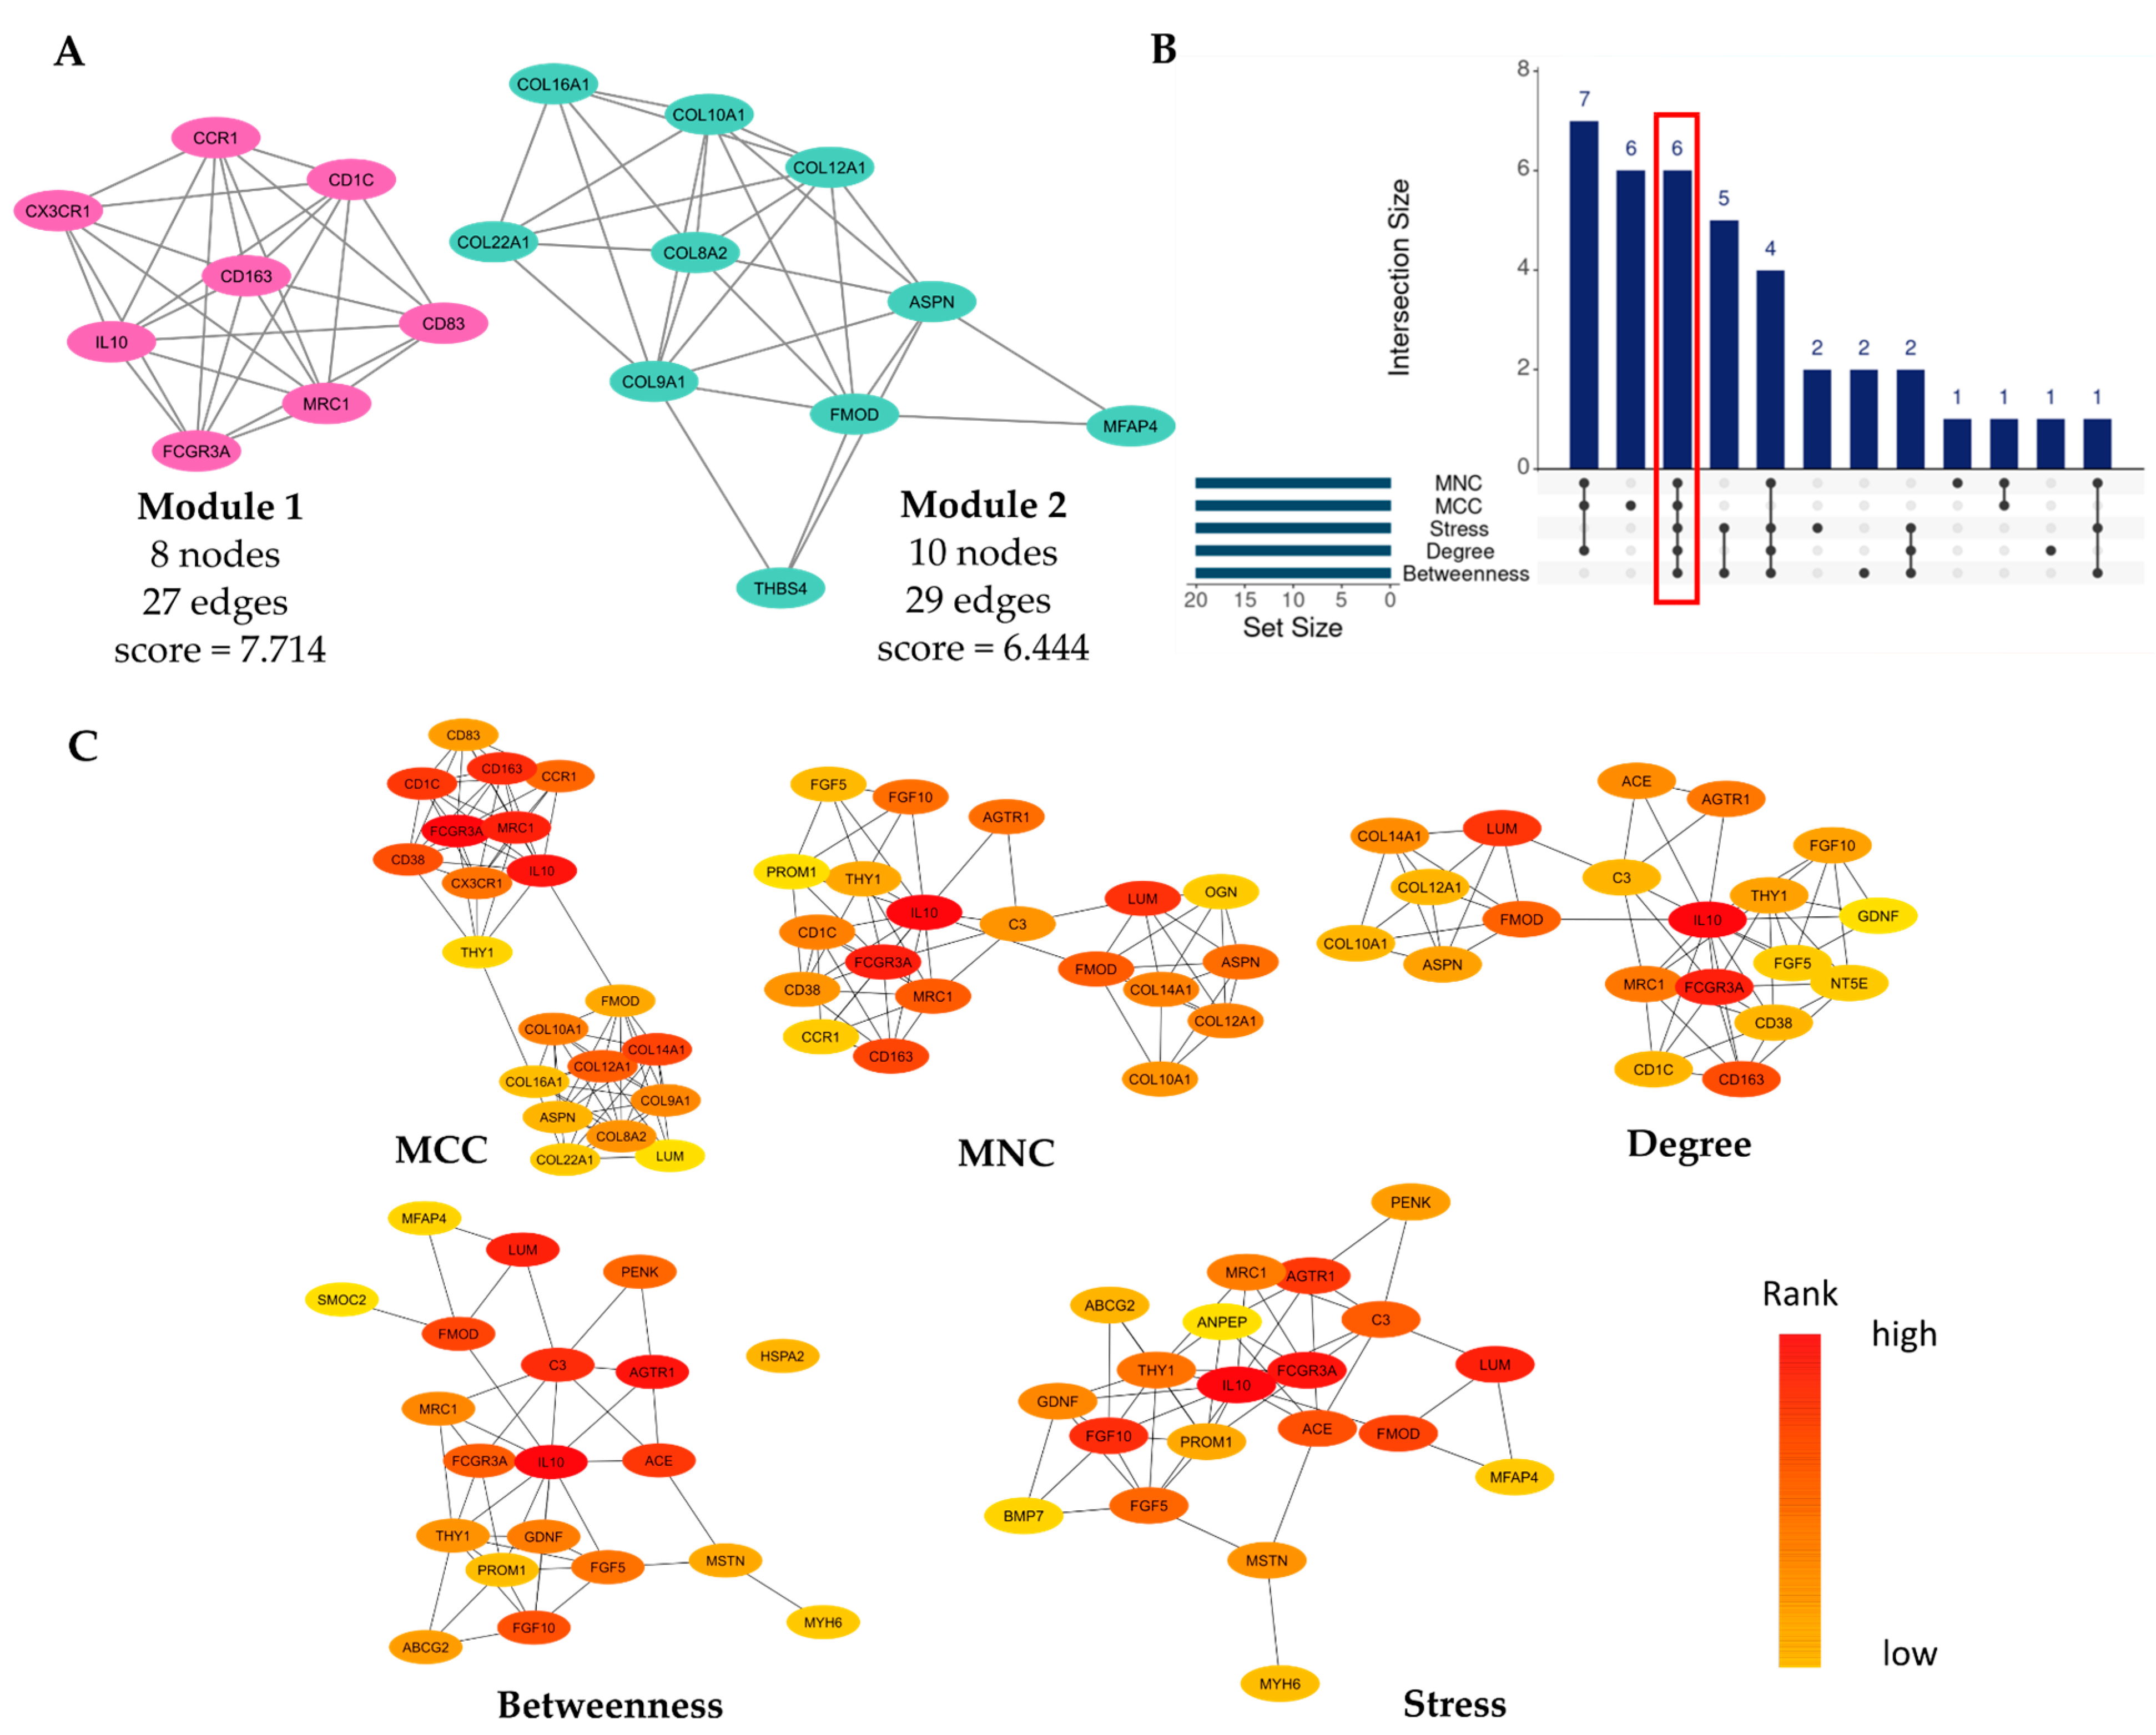
The PPI network constructed from the shared DEGs comprised 360 nodes and 655 edges (Figure S1). MCODE analysis identified two major modules (Figure 4A). The first module (8 nodes, 27 edges; score = 7.714) included FCGR3A, MRC1, IL10, CD163, CCR1, CX3CR1, CD83, and CD1C, representing genes involved in macrophage differentiation and activation, dendritic cell function, chemokine-mediated signaling, and innate immune regulation. The second module (10 nodes, 29 edges; score = 6.444) comprised FMOD, ASPN, COL8A2, COL9A1, COL10A1, COL12A1, COL16A1, COL22A1, MFAP4, and THBS4, corresponding to extracellular matrix organization, collagen fibril organization, extracellular structure organization, and connective tissue remodeling. Hub gene analysis identified six shared hub genes (FCGR3A, IL10, MRC1, FMOD, THY1, and LUM) common to all five CytoHubba algorithms (Figure 4B,C).
Figure 4.
Identification of key modules and shared hub genes: (A) The two key network modules identified using MCODE; (B) UpSet plot showing the overlap among the five CytoHubba algorithms, with genes common to all algorithms defined as shared hub genes; the red box highlights the intersection of the five algorithms; (C) Top 20 genes ranked by each of the five CytoHubba algorithms: MCC, MNC, Degree, Stress, and Betweenness algorithms of the CytoHubba plug-in. The PPI network, highlighting the key modules identified by MCODE, is provided in Supplementary Material Figure S1. PPI: protein–protein interaction; DEGs: differentially expressed genes; MCC: maximal clique centrality; MNC: maximum neighborhood component.
Detailed functional annotations of these six genes (regulation status, encoded protein, biological function, associated pathways, subcellular localization; source: GeneCards, https://www.genecards.org, accessed on 28 July 2026) are provided in Supplementary Table S2.
3.3.2. PPI Network Construction and Hub Gene Identification for Tertile-Specific DEGs
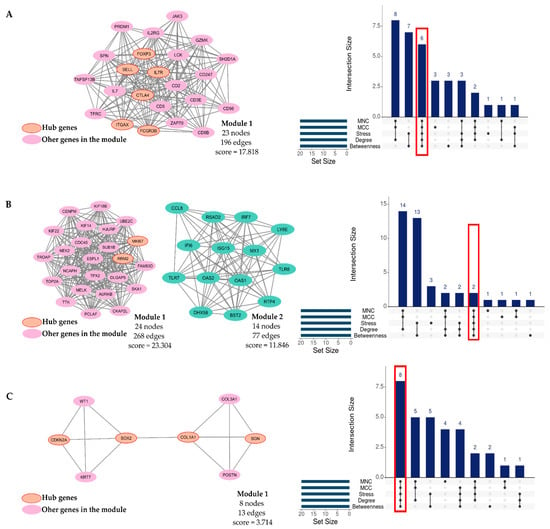
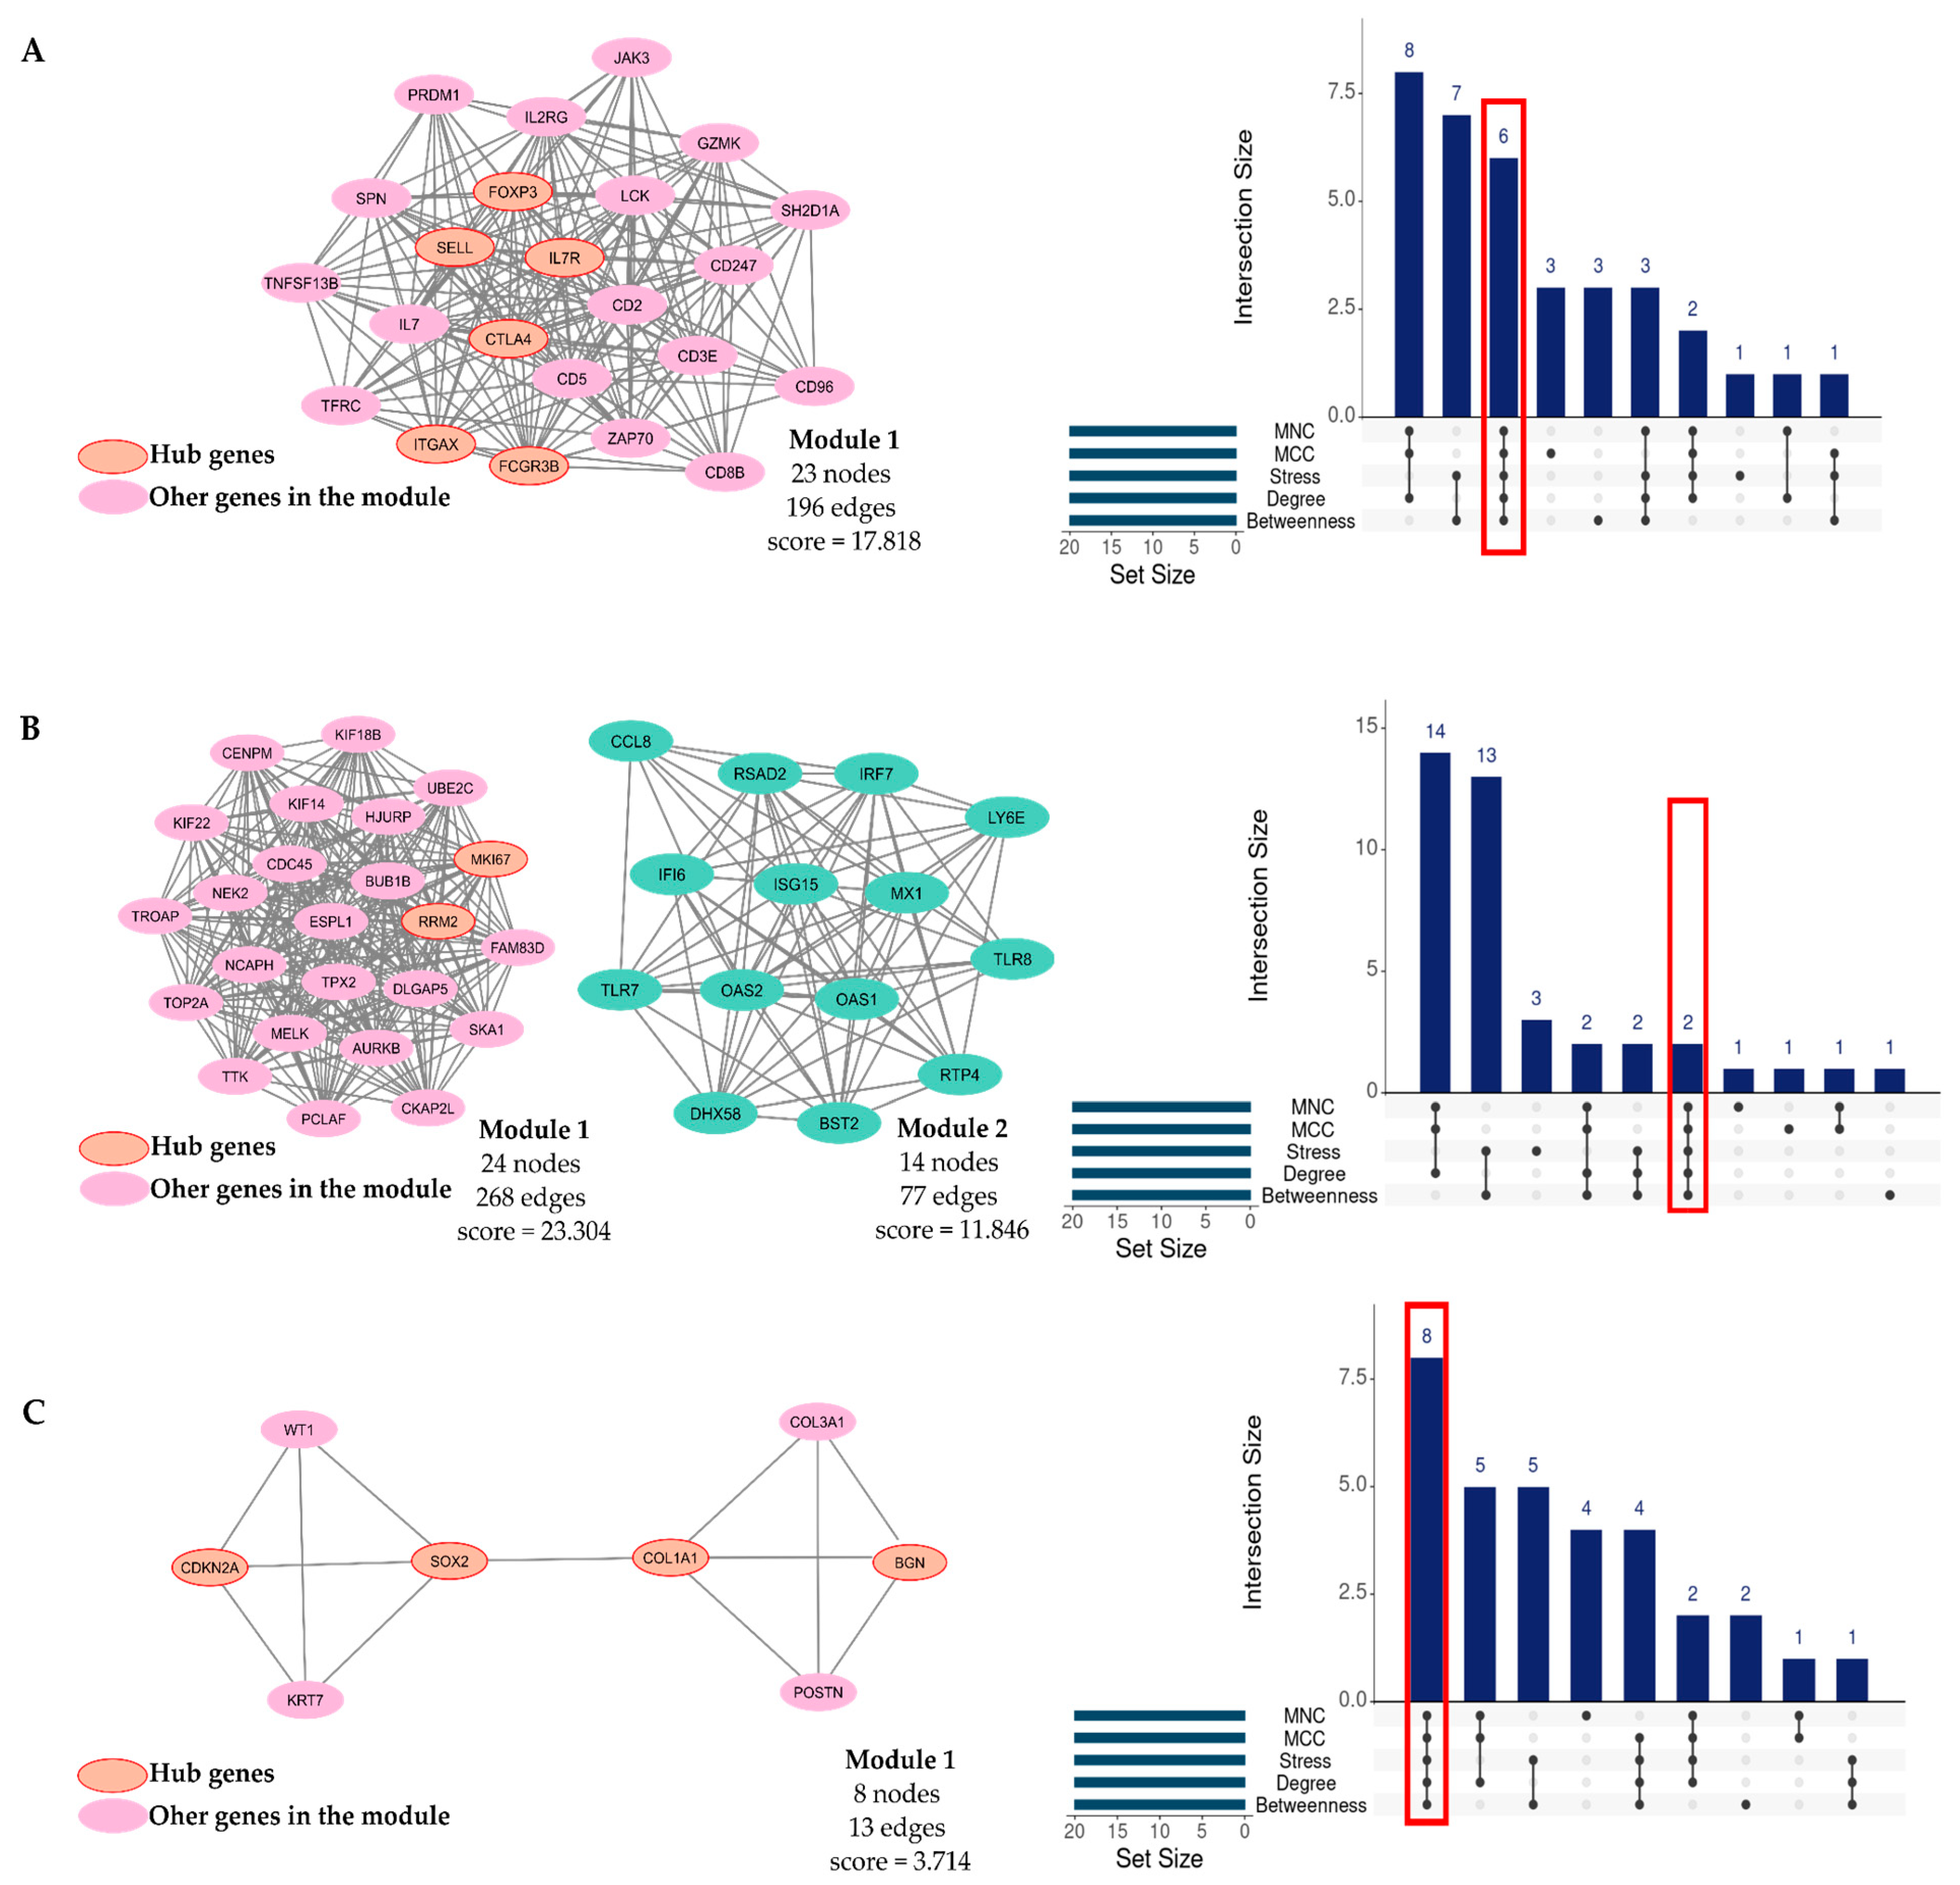
The T1-specific PPI network comprised 317 nodes and 697 edges (Figure S2). MCODE analysis identified one module (23 nodes, 196 edges; score = 17.818) containing JAK3, PRDM1, IL2RG, GZMK, SPN, FOXP3, LCK, SH2D1A, SELL, IL7R, CD247, TNFSF13B, IL7, CD2, CD3E, TFRC, CTLA4, CD5, CD96, ITGAX, FCGR3B, ZAP70, and CD8B, representing T-cell receptor signaling, T-cell activation, cytokine signaling, immune cell differentiation, and regulation of adaptive immune responses (Figure 5A, left panel). Hub gene analysis identified six T1-specific hub genes (CTLA4, IL7R, FOXP3, FCGR3B, SELL, and ITGAX) defined as genes common to all five complementary topological algorithms (Figure 5A, right panel); functional annotations of these genes are summarized in Supplementary Table S3.
Figure 5.
PPI network construction, module detection, and hub gene identification for age tertile-specific DEGs: (A) T1-specific DEGs, (B) T2-specific DEGs, and (C) T3-specific DEGs. Left panels: representative MCODE modules, with hub genes highlighted. Right panels: UpSet plots showing the overlap among the five CytoHubba algorithms (MCC, MNC, Degree, Stress, and Betweenness). Genes common to all five algorithms were defined as hub genes, and the red box highlights the intersection of the five algorithms. PPI networks and key modules for each tertile are provided in Supplementary Figures S2–S4. PPI: protein–protein interaction; DEGs: differentially expressed genes.
The T2-specific PPI network contained 358 nodes and 768 edges (Figure S3). MCODE analysis identified two major modules (Figure 5B, left panel). The first module (24 nodes, 268 edges; score = 23.304) comprised CENPM, KIF18B, UBE2C, KIF22, KIF14, HJURP, CDC45, MKI67, NEK2, BUB1B, TROAP, ESPL1, RRM2, FAM83D, NCAPH, TPX2, DLGAP5, SKA1, TOP2A, MELK, AURKB, TTK, PCLAF, and CKAP2L, representing cell cycle progression, mitotic cell division, chromosome segregation, spindle organization, and DNA replication. The second module (14 nodes, 77 edges; score = 11.846) included CCL8, RSAD2, IRF7, LY6E, IFI6, ISG15, MX1, TLR8, TLR7, OAS2, OAS1, RTP4, DHX58, and BST2, corresponding to type I interferon signaling, antiviral defense, innate immune responses, and viral RNA sensing. Hub gene analysis identified two T2-specific hub genes (MKI67 and RRM2) shared by all five CytoHubba algorithms (Figure 5B, right panel); the corresponding functional annotations are presented in Supplementary Table S4.
The T3-specific PPI network comprised 207 nodes and 153 edges (Figure S4). MCODE analysis identified one module (8 nodes, 13 edges; score = 3.714) composed of WT1, CDKN2A, KRT7, SOX2, COL1A1, COL34A1, BGN, and POSTN, representing ECM organization, tissue remodeling, cell differentiation, and senescence-related processes (Figure 5C, left panel). Hub gene analysis identified eight T3-specific hub genes (COL1A1, BGN, COMP, COL11A2, CDK1, SOX2, CDKN2A, and CEBPB) common to all five CytoHubba algorithms (Figure 5C, right panel); functional annotations of these genes are compiled in Supplementary Table S5.
4. Discussion
HCM is a genetically and clinically heterogeneous disorder; however, the molecular mechanisms that are consistently shared across different stages of adult life remain incompletely characterized. In the present study, age-stratified transcriptomic analysis identified both a conserved molecular core and distinct age-dependent molecular signatures. A total of 498 genes were consistently dysregulated across all tertiles. Functional enrichment analyses showed that these shared DEGs were predominantly associated with ECM organization and remodeling, while PPI network analysis further identified two major functional modules related to immune regulation and ECM homeostasis. Additionally, age-specific analyses revealed enrichment of immune-related pathways in younger patients, cell cycle- and interferon-associated processes in the middle-aged group, and ECM remodeling together with senescence-related pathways in older patients. These findings indicate that, despite substantial age-related transcriptomic heterogeneity, a common fibrotic program is preserved across adulthood, while additional biological processes emerge in an age-dependent manner.
To our knowledge, no previous transcriptomic study has systematically investigated age-stratified molecular signatures across adult HCM patients. Nevertheless, the biological processes identified in the present study are largely consistent with findings from bulk and single-cell transcriptomic, spatial transcriptomic, and proteomic studies, which have independently highlighted ECM remodeling, immune activation, and altered intercellular signaling as major components of HCM pathobiology.
The predominance of ECM-related pathways among the shared DEGs is consistent with the established role of myocardial fibrosis as a central pathological hallmark of HCM. Functional enrichment analysis demonstrated that ECM organization and remodeling represented the most consistently enriched biological processes across all age tertiles, while PPI network analysis further identified a distinct ECM-related module and three shared hub genes involved in matrix homeostasis (FMOD, LUM, and THY1). These findings indicate that fibrotic remodeling constitutes a conserved molecular feature of HCM throughout adult life. Previous experimental and clinical studies have consistently shown that excessive collagen deposition and ECM remodeling increase myocardial stiffness, impair ventricular relaxation, and promote progressive structural remodeling, ultimately contributing to disease progression and poor prognosis, including heart failure and sudden cardiac death [21,22,23,24]. Accordingly, myocardial fibrosis has emerged as an independent predictor of adverse clinical outcomes and disease severity in patients with HCM [25,26,27]. These observations are further supported by a recent multicenter integrative proteomic and transcriptomic study, which demonstrated that ECM remodeling, inflammatory signaling, and metabolic pathways represent the principal molecular programs dysregulated in HCM myocardium. Importantly, the concordance between myocardial proteomic and transcriptomic profiles confirmed that ECM-associated pathways remain among the most consistently altered biological processes and are associated with clinical markers of severe disease, reinforcing the central role of ECM remodeling in HCM pathogenesis [28].
Our findings are further supported by recent transcriptomic studies. Using single-nucleus RNA sequencing and spatial transcriptomics, Liu et al. demonstrated marked expansion of activated fibroblasts in HCM myocardium together with enrichment of ECM organization, TGF-β-responsive pathways, and Reactome ECM organization, confirming fibroblasts as major contributors to pathological myocardial remodeling [29]. Notably, the authors also identified ECM remodeling as one of the dominant transcriptional programs in fibrotic myocardial regions, supporting our observation that ECM organization represents the principal molecular signature shared across all adult age groups.
In line with these observations, altered ECM signaling has also been implicated as a major mechanism underlying pathological intercellular communication in HCM. Single-nucleus transcriptomic profiling of HCM myectomy tissue by Larson et al. identified integrin β1 as a central node of disrupted cell–cell signaling, with the sharpest losses in ligand-receptor connectivity affecting the cardiomyocyte–fibroblast and fibroblast–lymphocyte axes [30]. These findings suggest that ECM remodeling is not merely a structural consequence of sarcomeric dysfunction but also reflects impaired communication between cardiomyocytes and non-myocyte populations, thereby promoting progressive myocardial remodeling.
The shared hub genes identified in the present study further reinforce the central role of ECM homeostasis in HCM. Among the six shared hub genes, FMOD and LUM were upregulated and represent well-established ECM proteoglycans involved in collagen fibrillogenesis and matrix assembly. Integrating the GSE133054, GSE141910, and GSE36961 datasets, Ma et al. identified LUM among the principal HCM hub genes together with FRZB, COL14A1, CRISPLD1, and sFRP4, while functional enrichment analysis consistently highlighted ECM organization, fibrosis, and neurohormonal signaling as the dominant biological processes [31]. Experimental evidence further indicates that LUM regulates collagen fibril assembly, promotes fibrocyte differentiation, and contributes to fibroblast activation and cardiac remodeling, whereas partial LUM deficiency attenuates cardiac fibrosis and improves diastolic dysfunction in experimental models, supporting its potential as a profibrotic therapeutic target. Likewise, an independent transcriptomic analysis integrating the GSE89714 and GSE116250 datasets similarly identified FMOD, LUM, ASPN, BGN, and COL14A1 among the principal hub genes associated with HCM and heart failure, with enrichment of ECM organization, ECM–receptor interaction, focal adhesion, PI3K–Akt signaling, and TGF-β signaling pathways [32]. The overlap between the two studies, particularly for FMOD and LUM, supports the robustness of these genes as conserved molecular components of pathological ECM remodeling in HCM.
Besides ECM remodeling, our shared PPI network also identified an immune-related module centered on FCGR3A, MRC1, IL10, CD163, CCR1, CX3CR1, CD83, and CD1C, indicating that immune activation represents another conserved component of HCM pathobiology. Increasing evidence suggests that immune cells actively coordinate pathological cardiac remodeling by modulating both cardiomyocyte hypertrophy and fibroblast activation through reciprocal interactions within the myocardial microenvironment [33]. Supporting this concept, Liu et al. demonstrated activation of both innate and adaptive immune cell populations in HCM myocardium, accompanied by enrichment of immune-related pathways, including antigen processing and presentation and interferon signaling, together with enhanced immune-related transcriptional programs in multiple non-immune cardiac cell populations [29].
Among these shared hub genes, IL10 is of particular interest because it was consistently downregulated across all age tertiles, suggesting impaired anti-inflammatory regulation as a common molecular feature of HCM. This observation aligns with the recent work of Cao et al., who proposed that disruption of the IL-33/ST2–IL-6 regulatory axis compromises Treg stability, reduces IL-10 production, impairs M2 macrophage polarization, and decreases CD163 expression, collectively promoting persistent inflammation and myocardial fibrosis in HCM [34]. The concomitant downregulation of IL10, MRC1, and FCGR3A, together with the identification of CD163 within the principal immune-related MCODE module observed in our study, supports the concept that defective immunoregulatory mechanisms may coexist with ECM remodeling throughout adult life, linking chronic immune dysregulation to progressive myocardial fibrosis.
The involvement of immune dysregulation in HCM is further supported by studies highlighting the dynamic interplay between inflammation and myocardial remodeling. Experimental evidence suggests that the early stages of HCM are characterized by injury-associated inflammatory responses and neutrophil extracellular trap formation, whereas progressive ECM deposition, ventricular remodeling, and ultimately heart failure predominate during later disease stages [35]. Although our cross-sectional design does not permit assessment of temporal disease progression, the identification of a conserved immune-related module across all age tertiles, together with the enrichment of immune-associated pathways in younger patients, is consistent with the concept that immune activation represents an early component of HCM pathobiology, while ECM remodeling persists throughout adulthood.
Independent transcriptomic studies have likewise identified macrophage-associated genes, particularly CD163, as central regulators of the HCM immune microenvironment. Gao et al. identified CD163, FCER1G, and CYP2J2 as immune-related hub genes correlated with macrophage and regulatory T-cell infiltration [36], while a separate independent analysis of the GSE36961 and GSE141910 datasets identified CD163 as the principal downregulated hub gene alongside FMOD as a major upregulated fibrosis-related hub gene, with concurrent suppression of innate immune pathways, reduced macrophage/monocyte/Treg infiltration, and proposed roles for STAT3 and LYVE1+CD163+ macrophages in HCM pathogenesis [37]. These observations closely parallel our findings, in which IL10 emerged as a shared hub gene, CD163 was identified within the principal immune-related MCODE module, and FMOD was consistently detected as a shared ECM hub gene, collectively supporting a coordinated interaction between impaired immune regulation and progressive ECM remodeling in HCM.
Mechanistically, these findings are biologically plausible given the close functional relationship between IL-10 and CD163. CD163 is a scavenger receptor selectively expressed by monocytes and M2-polarized macrophages, where it mediates the clearance of hemoglobin–haptoglobin complexes and contributes to the resolution of inflammation. Its expression is strongly induced by IL-10, while CD163 signaling, in turn, promotes anti-inflammatory macrophage polarization and further IL-10 production, establishing a regulatory feedback loop that limits excessive inflammatory responses and supports tissue repair [38,39]. Therefore, the concomitant downregulation of IL10 and CD163 observed in our study may reflect disruption of this immunoregulatory axis, potentially contributing to persistent inflammation and facilitating the transition toward maladaptive myocardial fibrosis.
The age-stratified analyses further refined this conserved immune signature by revealing a distinct predominance of immune-related pathways in the youngest HCM patients. Functional enrichment analysis of T1-specific DEGs demonstrated significant enrichment of adaptive immune response, T-cell receptor signaling, B-cell receptor signaling, complement activation, and IL-7-mediated signaling, whereas the corresponding PPI network identified immune-regulatory hub genes, including CTLA4, FOXP3, IL7R, FCGR3B, SELL, and ITGAX. A previous study proposed a biphasic model of HCM progression, in which the initial stage is characterized by injury-associated inflammation and neutrophil extracellular trap formation, followed by progressive myocardial fibrosis, ventricular remodeling, and ultimately heart failure [35]. While our cross-sectional design does not permit assessment of temporal disease progression, the predominance of immune-related pathways in the youngest patient group, together with the persistence of ECM remodeling across all age tertiles, is compatible with this proposed sequence of pathological events. Together, these findings suggest that adaptive immune responses are particularly prominent in younger adults with HCM, complementing the shared immunoregulatory alterations identified across all age groups.
These observations are supported by recent single-cell transcriptomic analyses demonstrating that immune dysregulation extends across multiple cardiac cell populations in HCM. Analysis of the GSE181764 and GSE161921 datasets revealed widespread transcriptional alterations involving cardiomyocytes, fibroblasts, macrophages, neutrophils, B cells, T cells, NK cells, endothelial cells, and pericytes, with functional enrichment analyses consistently identifying immune-related biological processes, including immunoglobulin binding, positive regulation of inflammatory responses, leukocyte proliferation, ECM organization, and complement and coagulation cascades [40]. KEGG pathway analysis further highlighted dysregulation of MAPK signaling, TNF signaling, and complement-related pathways, collectively implicating macrophage activation and myocardial fibrosis as central mechanisms of adverse cardiac remodeling. Notably, the enrichment of complement activation observed specifically in our youngest patient group is consistent with these findings and supports the concept that complement-mediated immune responses may represent an important component of the early molecular landscape of adult HCM.
Further evidence supporting the involvement of immune dysregulation in HCM comes from recent integrative transcriptomic studies and comprehensive reviews that challenge the traditional view of HCM as a purely sarcomeric disorder. Menezes Junior et al. summarized accumulating evidence supporting an immunogenetic component of HCM, highlighting coordinated dysregulation of immune-related hub genes involved in innate immunity, complement activation, macrophage function, and inflammatory signaling [41]. Likewise, Wu et al. identified a conserved panel of downregulated immune hub genes, including CD14, ITGB2, C1QB, CD163, HCLS1, ALOX5AP, PLEK, C1QC, FCER1G, and TYROBP, which were enriched in pathways related to complement and coagulation cascades [42]. The recurrence of immune-associated hub genes across independent transcriptomic studies, together with the identification of IL10 as a shared hub gene and CD163 within the principal immune-related module in our analysis, further supports the concept that immune dysregulation constitutes an integral component of HCM pathobiology rather than a secondary consequence of structural remodeling.
In contrast to the immune-dominated molecular signature observed in younger patients, the middle-aged subgroup exhibited a distinct transcriptional profile characterized by enrichment of cell cycle-related biological processes, including mitotic cell cycle, chromosome segregation, and nuclear division, together with interferon signaling. This pattern was further supported by the identification of a main MCODE module enriched for mitotic regulators and a second module associated with interferon signaling and innate immune responses. Consistent with these findings, PPI network analysis identified MKI67 and RRM2 as the only T2-specific hub genes consistently ranked by all five CytoHubba algorithms. Although both genes were downregulated in our dataset, they are well-established regulators of cell cycle progression and DNA replication, suggesting that the enriched GO terms reflect coordinated dysregulation of cell cycle-associated transcriptional networks rather than increased cellular proliferation per se. While age-stratified transcriptomic studies investigating these processes in adult HCM are currently lacking, emerging multi-omics evidence supports the involvement of signaling pathways regulating cellular growth and cell cycle control in HCM pathogenesis. In a comprehensive proteomic study validated by myocardial transcriptomic profiling, dysregulation of Ras–MAPK signaling and related pathways was associated with clinical indicators of severe HCM, providing indirect support for the altered cell cycle-related transcriptional program identified in our middle-aged subgroup [28]. The enrichment of interferon signaling observed in this age group is also noteworthy, although this pathway has received limited attention in HCM. Recent single-cell transcriptomic analyses have similarly detected interferon-related signaling within immune-associated transcriptional programs in HCM myocardium [29], suggesting that interferon-mediated responses may contribute to disease pathobiology in specific cellular contexts. Together, these findings indicate that dysregulation of cell cycle regulatory networks and interferon signaling may represent age-related molecular features of middle-aged patients with HCM, although their precise biological significance warrants further investigation.
The transcriptomic profile of older patients was characterized by enrichment of ECM organization together with pathways related to multicellular organization and cell adhesion, while PPI analysis identified a module containing COL1A1, BGN, POSTN, SOX2, and CDKN2A, genes associated with ECM remodeling, tissue repair, and senescence-associated processes. Hub gene analysis further highlighted ECM components (COL1A1, BGN, COMP, and COL11A2) together with SOX2, CDKN2A, CDK1, and CEBPB, indicating a distinct molecular signature compared with the younger age groups. These findings are consistent with the concept that ECM remodeling becomes increasingly prominent with advancing age in HCM. In agreement with our observations, Chen et al. reported that, relative to pediatric disease, adult HCM myocardium shows preferential upregulation of calcium-handling and cytoskeletal remodeling pathways (regulation of cytosolic calcium ion concentration and actin filament organization) alongside TGF-β-driven and ECM-related transcriptional programs [43]. Together, these findings support the concept that advancing age is accompanied by progressive reinforcement of ECM remodeling superimposed on the conserved fibrotic core identified across all adult HCM age tertiles.
Among the T3-specific hub genes, CDKN2A is of particular interest because it is one of the well-established molecular markers of cellular senescence. Although cellular senescence has not yet been extensively investigated in transcriptomic studies of HCM, increasing evidence suggests that age-related impairment of proteostasis, including alterations in proteasomal activity and chaperone-mediated autophagy, contributes to the accumulation of mutant sarcomeric proteins and may exacerbate disease severity in older patients [44]. In parallel, telomere shortening, a fundamental hallmark of biological aging, promotes irreversible cell-cycle arrest through activation of tumor suppressor pathways, including the CDKN2A/p16 axis, and has been implicated in genetic cardiomyopathies [45,46,47,48]. The identification of CDKN2A among the T3-specific hub genes therefore raises the possibility that senescence-associated mechanisms contribute to age-related myocardial remodeling in HCM. However, given the cross-sectional design of the present study and the limited transcriptomic evidence currently available, this observation should be considered hypothesis-generating and warrants further experimental validation.
Taken together, the age-dependent molecular signatures identified in this study may reflect a continuum of immunological and cellular aging processes superimposed on a conserved fibrotic core. The predominance of adaptive immune and complement-related pathways in the youngest patients is compatible with an early, immunologically active phase of disease, whereas the shift toward cell cycle and interferon-related dysregulation in middle-aged patients may represent an intermediate state linking early immune activation to the senescence-associated ECM remodeling observed in the oldest patients, given the established mechanistic link between type I interferon signaling and the induction of cellular senescence [49]. This proposed sequence is consistent with the general biology of tissue aging, in which chronic low-grade inflammation (“inflammaging”) and cumulative cellular senescence progressively drive fibrotic remodeling [45], and with the biphasic model of HCM progression from inflammation to fibrosis described above [35].
From a clinical perspective, these findings raise the possibility that the shared fibrotic core and its hub genes (FMOD, LUM, IL10, and CD163) represent biomarkers or targets applicable across the adult HCM population, while the age-specific signatures identified above may support age-tailored therapeutic strategies. In a murine model of familial HCM, adoptive transfer of regulatory T cells and low-dose interleukin-2 therapy reduced cardiac fibrosis and improved systolic function [50], supporting immunomodulatory approaches as a plausible direction for younger patients; conversely, the senolytic/antifibrotic agent dasatinib reduced pressure overload-induced cardiac fibrosis in a murine model of pathological hypertrophy [51], suggesting a possible rationale for such strategies in older patients.
4.1. Limitations
First, the analysis was based on a single publicly available RNA sequencing dataset, and the relatively small number of HCM samples, particularly in the youngest and oldest age tertiles, may have limited the statistical power to identify additional age-specific transcriptional alterations. Second, an independent external validation cohort was not available, as no publicly accessible myocardial transcriptomic dataset with sufficient HCM samples and detailed age information was identified to enable comparable age-stratified analyses; cross-species validation using animal HCM models was likewise not performed within the current design. Third, the study was based exclusively on transcriptomic data and bioinformatic analyses; therefore, the identified pathways, network modules, and hub genes require experimental validation at both the RNA and protein levels. Furthermore, the use of bulk RNA sequencing precluded cell type-specific resolution of gene expression changes, preventing attribution of the identified molecular signatures to individual cardiac cell populations. Additionally, the cross-sectional design of the dataset does not permit assessment of longitudinal molecular changes associated with aging or disease progression. Finally, the present study was designed to focus exclusively on HCM; consequently, whether the fibrotic signature identified here is HCM-specific or reflects a more general, convergent molecular response shared across cardiomyopathies remains unaddressed by the current design and warrants dedicated comparative investigation.
4.2. Future Perspectives
Future studies should validate the identified age-dependent molecular signatures and hub genes in independent patient cohorts and through experimental approaches, including quantitative gene expression and protein-level analyses. Integration of transcriptomic data with complementary multi-omics approaches, such as proteomics, epigenomics, and single-cell or spatial transcriptomics, may provide a more comprehensive understanding of the cellular and molecular mechanisms underlying HCM across different stages of life. In addition, longitudinal studies are warranted to determine whether the conserved fibrotic core and age-specific molecular signatures identified in the present study are associated with disease progression, clinical phenotype, or therapeutic response. Such investigations may facilitate the development of age-informed biomarkers and personalized therapeutic strategies for patients with HCM. Comparative analyses across cardiomyopathy phenotypes, using dilated cardiomyopathy as a positive control, would help determine whether the fibrotic core and age-related signatures identified in this study are HCM-specific or represent a broader, phenotype-independent response, and constitute a natural extension of the present work. Future work could also incorporate cross-species validation using animal models of HCM, such as transgenic mouse models carrying sarcomeric mutations, to determine which components of the identified molecular signatures are evolutionarily conserved versus human-specific.
5. Conclusions
Using an integrative age-stratified transcriptomic approach, we identified a conserved fibrotic core shared across all HCM age tertiles, characterized by ECM organization and remodeling, together with distinct age-dependent molecular signatures. While immune-related pathways predominated in younger patients, middle-aged patients exhibited enrichment of cell cycle- and interferon-associated processes, whereas older patients displayed transcriptional features associated with ECM remodeling and cellular senescence. Collectively, these findings provide novel insights into the age-dependent molecular landscape of HCM and establish a foundation for future studies aimed at validating age-informed biomarkers and identifying potential therapeutic targets.
Supplementary Materials
The following supporting information can be downloaded at https://www.mdpi.com/article/10.3390/cardiogenetics16040019/s1, Table S1: Demographic characteristics of HCM patients and non-failing controls included in each age tertile (GSE141910); Table S2: Description of the identified core hub genes; Table S3: Description of the identified specific HCM-T1 hub genes; Table S4: Description of the identified specific HCM-T2 hub genes; Table S5. Description of the identified specific HCM-T3 hub genes; Figure S1: PPI network of the shared DEGs, constructed using STRING; Figure S2: PPI network of the T1-specific DEGs, constructed using STRING; Figure S3: PPI network of the T2-specific DEGs, constructed using STRING; Figure S4: PPI network of the T3-specific DEGs, constructed using STRING. Data used to generate Table S2–S5 were retrieved from the GeneCards database (https://www.genecards.org).
Author Contributions
Conceptualization, M.M.M.; methodology, I.-D.B. and M.M.M.; investigation, I.-D.B., M.P., M.-A.P. and M.M.M.; writing—original draft preparation, I.-D.B., M.P., M.-A.P. and M.M.M.; writing—review and editing, I.-D.B., M.P., M.-A.P. and M.M.M.; supervision, M.M.M. and M.-A.P.; project administration, M.M.M.; funding acquisition, M.M.M. All authors have read and agreed to the published version of the manuscript.
Funding
This work was supported by a grant from the Ministry of Education and Research, CCCDI—UEFISCDI, project number PN-IV-PCB-RO-MD-2024-0303, within PNCDI IV.
Institutional Review Board Statement
We would like to clarify that the present study is a secondary bioinformatic analysis of an existing, publicly available dataset and did not involve the recruitment, enrollment, or direct study of human participants. No new biological samples, experimental data, or sequencing data were generated for this study. All analyses were performed exclusively using the publicly available RNA sequencing dataset GSE141910, obtained from the Gene Expression Omnibus (GEO) database (https://www.ncbi.nlm.nih.gov/geo/, accessed on 30 May 2026).
Informed Consent Statement
The study did not involve any new patient enrollment, collection of human material, or access to newly generated individual-level clinical data but consisted exclusively of the computational reanalysis of an existing public dataset.
Data Availability Statement
The data analyzed in this study are available in the Gene Expression Omnibus (GEO) database under accession number GSE141910 (https://www.ncbi.nlm.nih.gov/geo/, accessed on 30 May 2026). These data were derived from the Gene Expression Omnibus (GEO) repository maintained by the National Center for Biotechnology Information (NCBI).
Acknowledgments
The authors acknowledge the use of the AI language model ChatGPT (GPT-5.5, OpenAI) to assist with language editing, improving clarity and readability. All content was carefully reviewed and verified by the authors, who take full responsibility for the scientific accuracy and integrity of the final text.
Conflicts of Interest
The authors declare no conflicts of interest.
Abbreviations
The following abbreviations are used in this manuscript:
| ALOX5AP | Arachidonate 5-lipoxygenase-activating protein |
| ASPN | Asporin |
| AURKB | Aurora kinase B |
| BUB1B | Budding uninhibited by benzimidazole-related 1 |
| BGN | Biglycan |
| BP | Biological process |
| BST2 | Bone marrow stromal cell antigen 2 |
| C1QB | Complement C1qB chain |
| C1QC | Complement C1qC chain |
| CC | Cellular component |
| CCL8 | C-C motif chemokine ligand 8 |
| CCR1 | C-C chemokine receptor type 1 |
| CD2 | Cluster of differentiation 2 |
| CD3E | Cluster of differentiation 3 epsilon subunit of T-cell receptor complex |
| CD5 | Cluster of differentiation 5 |
| CD8B | Cluster of differentiation 8 subunit beta |
| CD14 | Cluster of differentiation 14 |
| CD83 | Cluster of differentiation 83 |
| CD96 | Cluster of differentiation 96 |
| CD163 | Cluster of differentiation 163 |
| CD247 | Cluster of differentiation 247 |
| CD1C | Cluster of differentiation 1c molecule |
| CDC45 | Cell division cycle 14 |
| CDK1 | Cyclin-dependent kinase 1 |
| CDKN2A | Cyclin-dependent kinase inhibitor 2A |
| CEBPB | CCAAT enhancer-binding protein beta |
| CENPM | Centromere protein M |
| CKAP2L | Cytoskeleton-associated protein 2-like |
| COL1A1 | Collagen Type I Alpha 1 chain |
| COL8A2 | Collagen Type VIII Alpha 2 Chain |
| COL9A1 | Collagen Type IX Alpha 1 Chain |
| COL10A1 | Collagen Type X Alpha 1 Chain |
| COL11A2 | Collagen Type XI Alpha 2 Chain |
| COL12A1 | Collagen Type XII Alpha 1 Chain |
| COL14A1 | Collagen Type XIV Alpha 1 Chain |
| COL16A1 | Collagen Type XVI Alpha 1 Chain |
| COL22A1 | Collagen Type XXII Alpha 1 Chain |
| COL34A1 | Collagen Type XXXIV Alpha 1 Chain |
| COMP | Cartilage oligomeric matrix protein |
| CRISPLD1 | Cysteine-rich secretory protein LCCL domain-containing 1 |
| CTLA4 | Cytotoxic T-lymphocyte-associated protein 4 (CD152) |
| CX3CR1 | C-X3-C motif chemokine receptor 1 |
| CYP2J2 | Cytochrome P450 family 2 subfamily J member 2 |
| DEGs | Differentially expressed genes |
| DHX58 | DExH-Box Helicase 58 |
| DLGAP5 | Disks large-associated protein 5 |
| DNA | Deoxyribonucleic acid |
| ECM | Extracellular matrix |
| EORP | ESC EURObservational Research Programme |
| ESPL1 | Extra Spindle Pole Bodies Like 1, Separase |
| FAM83D | Family with sequence similarity 83 member D |
| FCER1G | Fc fragment of IgE, high-affinity I, receptor for gamma polypeptide |
| FCGR3A | Fc gamma receptor IIIa (CD16a) |
| FCGR3B | Fc gamma receptor IIIb (CD16b) |
| FDR | False discovery rate |
| FMOD | Fibromodulin |
| FOXP3 | Forkhead box protein P3 |
| sFRP4 | Secreted frizzled-related protein 4 |
| FRZB | Frizzled-related protein |
| GEO | Gene Expression Omnibus |
| GO | Gene Ontology |
| GZMK | Granzyme K |
| HCLS1 | Hematopoietic cell-specific Lyn substrate 1 |
| HCM | Hypertrophic cardiomyopathy |
| HCMR | Hypertrophic Cardiomyopathy Registry |
| HJURP | Holliday junction recognition protein |
| IFI6 | Interferon gamma inducible protein 16 |
| IL7 | Interleukin 7 |
| IL7R | Interleukin 7 receptor (CD127) |
| IL10 | Interleukin 10 |
| IL2RG | Interleukin 2 receptor subunit gamma |
| IRF7 | Interferon Regulatory Factor 7 |
| ISG15 | Interferon-Stimulated Gene 15 |
| ITGAX | Integrin Subunit Alpha X (CD11C) |
| ITGB2 | Integrin Subunit Beta 2 |
| JAK3 | Janus Kinase 3 |
| KEGG | Kyoto Encyclopedia of Genes and Genomes |
| KIF14 | Kinesin Family Member 14 |
| KIF18B | Kinesin Family Member 18 B |
| KIF22 | Kinesin Family Member 22 |
| KRT7 | Keratin 7 |
| LCK | Lymphocyte cell-specific protein–tyrosine kinase |
| LUM | Lumican |
| LY6E | Lymphocyte Antigen 6 Family Member E |
| MAPK | Mitogen-activated protein kinase |
| MCC | Maximal clique centrality |
| MELK | Maternal embryonic leucine zipper kinase |
| MFAP4 | Microfibril-associated protein 4 |
| MNC | Maximum neighborhood component |
| MCODE | Molecular complex detection |
| MF | Molecular function |
| MKI67 | Marker of proliferation Ki-67 |
| MRC1 | Mannose receptor C-Type 1 |
| MX1 | MX dynamin-like GTPase 1 |
| NCAPH | Non-SMC condensin I complex subunit H |
| NEK2 | NIMA-related kinase 2 |
| OAS1 | 2″-5″-Oligoadenylate synthetase 1 |
| OAS2 | 2″-5″- Oligoadenylate synthetase 2 |
| PCLAF | PCNA clamp-associated factor |
| PI3K | Phosphoinositide 3-Kinase |
| PLEK | Pleckstrin |
| POSTN | Periostin |
| PPI | Protein–protein interaction |
| PRDM1 | PR domain zinc finger protein 1 |
| RNA | Ribonucleic acid |
| RRM2 | Ribonucleotide reductase regulatory subunit M2 |
| RSAD2 | Radical S-adenosylmethionine domain-containing 2 |
| RTP4 | Receptor-transporting protein 4 |
| SHaRe | Sarcomeric Human Cardiomyopathy Registry |
| SH2D1A | SH2 domain-containing 1A |
| SELL | Selectin L (CD62L) |
| SKA1 | Spindle and kinetochore-associated complex subunit 1 |
| SOX2 | SRY-box transcription factor 2 |
| SPN | Sialophorin |
| STAT3 | Signal transducer and activator of transcription 3 |
| STRING | Search Tool for the Retrieval of Interacting Genes/Proteins |
| TFRC | Transferrin receptor gene |
| THBS4 | Thrombospondin |
| THY1 | Thy-1 cell surface antigen |
| TLR7 | Toll-like receptor 7 |
| TLR8 | Toll-like receptor 8 |
| TNFSF13B | Tumor necrosis factor ligand superfamily member 13b |
| TOP2A | DNA Topoisomerase II Alpha |
| TGF-β | Transforming Growth Factor Beta |
| TPX2 | TPX2 microtubule nucleation factor |
| TROAP | Trophinin-associated protein |
| TTK | Dual-specificity protein kinase TTK |
| TYROBP | Transmembrane immune signaling adaptor TYROBP |
| UBE2C | Ubiquitin-conjugating enzyme E2C |
| WT1 | Wilms tumor 1 gene |
| ZAP70 | Zeta chain of T cell receptor-associated protein kinase 70 |
References
- Ommen, S.R.; Ho, C.Y.; Asif, I.M.; Balaji, S.; Burke, M.A.; Day, S.M.; Dearani, J.A.; Epps, K.C.; Evanovich, L.; Ferrari, V.A.; et al. 2024 AHA/ACC/AMSSM/HRS/PACES/SCMR Guideline for the Management of Hypertrophic Cardiomyopathy. JACC 2024, 83, 2324–2405. [Google Scholar] [CrossRef] [Scilit] [PubMed]
- Maron, B.J. Clinical Course and Management of Hypertrophic Cardiomyopathy. N. Engl. J. Med. 2018, 379, 655–668. [Google Scholar] [CrossRef] [Scilit] [PubMed]
- Burns, J.; Jean-Pierre, P. Disparities in the Diagnosis of Hypertrophic Obstructive Cardiomyopathy: A Narrative Review of Current Literature. Cardiol. Res. Pract. 2018, 2018, 3750879. [Google Scholar] [CrossRef] [Scilit] [PubMed]
- Silajdzija, E.; Vissing, C.R.; Christensen, E.B.; Mills, H.L.; Kock, T.O.; Andersen, L.J.; Snoer, M.; Thune, J.J.; Bartels, E.D.; Axelsson Raja, A.; et al. Hypertrophic Cardiomyopathy: The Impact of Age at Diagnosis of the Proband on Genetic Yield, Clinical Presentation, Outcomes, and Yield of Family Screening. J. Am. Heart Assoc. 2025, 14, e043711. [Google Scholar] [CrossRef] [Scilit] [PubMed]
- Neubauer, S.; Kolm, P.; Ho, C.Y.; Kwong, R.Y.; Desai, M.Y.; Dolman, S.F.; Appelbaum, E.; Desvigne-Nickens, P.; DiMarco, J.P.; Friedrich, M.G.; et al. Distinct Subgroups in Hypertrophic Cardiomyopathy in the NHLBI HCM Registry. J. Am. Coll. Cardiol. 2019, 74, 2333–2345. [Google Scholar] [CrossRef] [Scilit] [PubMed]
- Charron, P.; Elliott, P.M.; Gimeno, J.R.; Caforio, A.L.P.; Kaski, J.P.; Tavazzi, L.; Tendera, M.; Maupain, C.; Laroche, C.; Rubis, P.; et al. The Cardiomyopathy Registry of the EURObservational Research Programme of the European Society of Cardiology: Baseline Data and Contemporary Management of Adult Patients with Cardiomyopathies. Eur. Heart J. 2018, 39, 1784–1793. [Google Scholar] [CrossRef] [Scilit] [PubMed]
- Ho, C.Y.; Day, S.M.; Ashley, E.A.; Michels, M.; Pereira, A.C.; Jacoby, D.; Cirino, A.L.; Fox, J.C.; Lakdawala, N.K.; Ware, J.S.; et al. Genotype and Lifetime Burden of Disease in Hypertrophic Cardiomyopathy: Insights From the Sarcomeric Human Cardiomyopathy Registry (SHaRe). Circulation 2018, 138, 1387–1398. [Google Scholar] [CrossRef] [Scilit] [PubMed]
- Wang, W.; Varfaj, B.; Robertson, L.; Harrison, W.; Haroldson, J.; Tingley, W.; Lakdawala, N.K.; Owens, A.T.; Saberi, S.; Lin, K.Y.; et al. Differences in Patient Characteristics and Burden of Disease in Adults with MYBPC3-Associated HCM. J. Am. Coll. Cardiol. 2025, 85, 1513. [Google Scholar] [CrossRef] [Scilit]
- Topriceanu, C.-C.; Balakrishnan, I.D.; Vissing, C.R.; Raja, A.A.; Parikh, V.N.; Zwetsloot, P.-P.; Michels, M.; Argiro, A.; Maurizi, N.; Stendahl, J.C.; et al. Natural History of Asymptomatic Phenotypically Mild HCM. JACC 2026. Epub ahead of printing. [Google Scholar] [CrossRef] [Scilit] [PubMed]
- Maron, B.A.; Wang, R.-S.; Carnethon, M.R.; Rowin, E.J.; Loscalzo, J.; Maron, B.J.; Maron, M.S. What Causes Hypertrophic Cardiomyopathy? Am. J. Cardiol. 2022, 179, 74–82. [Google Scholar] [CrossRef] [Scilit] [PubMed]
- Micheu, M.M.; Popa-Fotea, N.-M.; Oprescu, N.; Bogdan, S.; Dan, M.; Deaconu, A.; Dorobantu, L.; Gheorghe-Fronea, O.; Greavu, M.; Iorgulescu, C.; et al. Yield of Rare Variants Detected by Targeted Next-Generation Sequencing in a Cohort of Romanian Index Patients with Hypertrophic Cardiomyopathy. Diagnostics 2020, 10, 1061. [Google Scholar] [CrossRef] [Scilit] [PubMed]
- Micheu, M.M.; Catlabuga, E.; Leahu, A.; Ciorbă, D.; Munteanu, V. Epigenetics, Modifiers, and Molecular Noise: Rethinking Pathophysiology in Dilated and Hypertrophic Cardiomyopathies. Int. J. Mol. Sci. 2026, 27, 3159. [Google Scholar] [CrossRef] [Scilit] [PubMed]
- Flam, E.; Jang, C.; Murashige, D.; Yang, Y.; Morley, M.P.; Jung, S.; Kantner, D.S.; Pepper, H.; Bedi, K.C.; Brandimarto, J.; et al. Integrated Landscape of Cardiac Metabolism in End-Stage Human Nonischemic Dilated Cardiomyopathy. Nat. Cardiovasc. Res. 2022, 1, 817–829. [Google Scholar] [CrossRef] [Scilit] [PubMed]
- Doan, K.V.; Luongo, T.S.; Ts’olo, T.T.; Lee, W.D.; Frederick, D.W.; Mukherjee, S.; Adzika, G.K.; Perry, C.E.; Gaspar, R.B.; Walker, N.; et al. Cardiac NAD+ Depletion in Mice Promotes Hypertrophic Cardiomyopathy and Arrhythmias Prior to Impaired Bioenergetics. Nat. Cardiovasc. Res. 2024, 3, 1236–1248. [Google Scholar] [CrossRef] [Scilit] [PubMed]
- Marston, N.A.; Han, L.; Olivotto, I.; Day, S.M.; Ashley, E.A.; Michels, M.; Pereira, A.C.; Ingles, J.; Semsarian, C.; Jacoby, D.; et al. Clinical Characteristics and Outcomes in Childhood-Onset Hypertrophic Cardiomyopathy. Eur. Heart J. 2021, 42, 1988–1996. [Google Scholar] [CrossRef] [Scilit] [PubMed]
- Maron, B.J.; Rowin, E.J.; Casey, S.A.; Haas, T.S.; Chan, R.H.M.; Udelson, J.E.; Garberich, R.F.; Lesser, J.R.; Appelbaum, E.; Manning, W.J.; et al. Risk Stratification and Outcome of Patients With Hypertrophic Cardiomyopathy ≥60 Years of Age. Circulation 2013, 127, 585–593. [Google Scholar] [CrossRef] [Scilit] [PubMed]
- Szklarczyk, D.; Franceschini, A.; Wyder, S.; Forslund, K.; Heller, D.; Huerta-Cepas, J.; Simonovic, M.; Roth, A.; Santos, A.; Tsafou, K.P.; et al. STRING V10: Protein–Protein Interaction Networks, Integrated over the Tree of Life. Nucleic Acids Res. 2015, 43, D447–D452. [Google Scholar] [CrossRef] [Scilit] [PubMed]
- Cline, M.S.; Smoot, M.; Cerami, E.; Kuchinsky, A.; Landys, N.; Workman, C.; Christmas, R.; Avila-Campilo, I.; Creech, M.; Gross, B.; et al. Integration of Biological Networks and Gene Expression Data Using Cytoscape. Nat. Protoc. 2007, 2, 2366–2382. [Google Scholar] [CrossRef] [Scilit] [PubMed]
- Bader, G.D.; Hogue, C.W. An Automated Method for Finding Molecular Complexes in Large Protein Interaction Networks. BMC Bioinform. 2003, 4, 2. [Google Scholar] [CrossRef] [Scilit] [PubMed]
- Chin, C.-H.; Chen, S.-H.; Wu, H.-H.; Ho, C.-W.; Ko, M.-T.; Lin, C.-Y. cytoHubba: Identifying Hub Objects and Sub-Networks from Complex Interactome. BMC Syst. Biol. 2014, 8, S11. [Google Scholar] [CrossRef] [Scilit] [PubMed]
- Lombardi, R.; Betocchi, S.; Losi, M.A.; Tocchetti, C.G.; Aversa, M.; Miranda, M.; D’Alessandro, G.; Cacace, A.; Ciampi, Q.; Chiariello, M. Myocardial Collagen Turnover in Hypertrophic Cardiomyopathy. Circulation 2003, 108, 1455–1460. [Google Scholar] [CrossRef] [Scilit] [PubMed]
- Ho, C.Y.; López, B.; Coelho-Filho, O.R.; Lakdawala, N.K.; Cirino, A.L.; Jarolim, P.; Kwong, R.; González, A.; Colan, S.D.; Seidman, J.G.; et al. Myocardial Fibrosis as an Early Manifestation of Hypertrophic Cardiomyopathy. N. Engl. J. Med. 2010, 363, 552–563. [Google Scholar] [CrossRef] [Scilit] [PubMed]
- Ibrahim, A.M.; Elfawy, H.A.; Terracciano, C.M.; Yacoub, M. Matrisome Remodeling in the Myocardium of Hypertrophic Cardiomyopathy; Novel Targets for Molecular Diagnostics. Front. Cell Dev. Biol. 2025, 13, 1641584. [Google Scholar] [CrossRef] [Scilit] [PubMed]
- Galati, G.; Leone, O.; Pasquale, F.; Olivotto, I.; Biagini, E.; Grigioni, F.; Pilato, E.; Lorenzini, M.; Corti, B.; Foà, A.; et al. Histological and Histometric Characterization of Myocardial Fibrosis in End-Stage Hypertrophic Cardiomyopathy: A Clinical-Pathological Study of 30 Explanted Hearts. Circ. Heart Fail. 2016, 9, e003090. [Google Scholar] [CrossRef] [Scilit] [PubMed]
- O’Hanlon, R.; Grasso, A.; Roughton, M.; Moon, J.C.; Clark, S.; Wage, R.; Webb, J.; Kulkarni, M.; Dawson, D.; Sulaibeekh, L.; et al. Prognostic Significance of Myocardial Fibrosis in Hypertrophic Cardiomyopathy. J. Am. Coll. Cardiol. 2010, 56, 867–874. [Google Scholar] [CrossRef] [Scilit] [PubMed]
- Arbelo, E.; Protonotarios, A.; Gimeno, J.R.; Arbustini, E.; Barriales-Villa, R.; Basso, C.; Bezzina, C.R.; Biagini, E.; Blom, N.A.; De Boer, R.A.; et al. 2023 ESC Guidelines for the Management of Cardiomyopathies. Eur. Heart J. 2023, 44, 3503–3626. [Google Scholar] [CrossRef] [Scilit] [PubMed]
- Siddiqi, A.K.; Maniya, M.T.; Bilen, O.; Abdou, M.; De Cecco, C.N.; Naeem, M. Prognostic Value of Late Gadolinium Enhancement on Cardiac Magnetic Resonance Imaging for Non-Sustained Ventricular Tachycardia and Sudden Cardiac Death in Hypertrophic Cardiomyopathy: A Meta-Analysis. Eur. Radiol. 2025, 36, 1158–1169. [Google Scholar] [CrossRef] [Scilit] [PubMed]
- Lumish, H.S.; Sherrid, M.V.; Janssen, P.M.L.; Ferrari, G.; Hasegawa, K.; Castillero, E.; Adlestein, E.; Swistel, D.G.; Topkara, V.K.; Maurer, M.S.; et al. Comprehensive Proteomic Profiling of Human Myocardium Reveals Signaling Pathways Dysregulated in Hypertrophic Cardiomyopathy. J. Am. Coll. Cardiol. 2024, 84, 1999–2011. [Google Scholar] [CrossRef] [Scilit] [PubMed]
- Liu, X.; Yin, K.; Chen, L.; Chen, W.; Li, W.; Zhang, T.; Sun, Y.; Yuan, M.; Wang, H.; Song, Y.; et al. Lineage-Specific Regulatory Changes in Hypertrophic Cardiomyopathy Unraveled by Single-Nucleus RNA-Seq and Spatial Transcriptomics. Cell Discov. 2023, 9, 6. [Google Scholar] [CrossRef] [Scilit] [PubMed]
- Larson, A.; Codden, C.J.; Huggins, G.S.; Rastegar, H.; Chen, F.Y.; Maron, B.J.; Rowin, E.J.; Maron, M.S.; Chin, M.T. Altered Intercellular Communication and Extracellular Matrix Signaling as a Potential Disease Mechanism in Human Hypertrophic Cardiomyopathy. Sci. Rep. 2022, 12, 5211. [Google Scholar] [CrossRef] [Scilit] [PubMed]
- Ma, Z.; Wang, X.; Lv, Q.; Gong, Y.; Xia, M.; Zhuang, L.; Lu, X.; Yang, Y.; Zhang, W.; Fu, G.; et al. Identification of Underlying Hub Genes Associated with Hypertrophic Cardiomyopathy by Integrated Bioinformatics Analysis. Pharmacogenomics Pers. Med. 2021, 14, 823–837. [Google Scholar] [CrossRef] [Scilit] [PubMed]
- Dong, H.; Yin, C.; Xiao, D.; Tang, Y. Identification of Differentially Expressed Genes to Predict the Risk of Heart Failure in Older Patients with Hypertrophic Cardiomyopathy. Aging 2024, 16, 10860–10867. [Google Scholar] [CrossRef] [Scilit] [PubMed]
- Frieler, R.A.; Mortensen, R.M. Immune Cell and Other Noncardiomyocyte Regulation of Cardiac Hypertrophy and Remodeling. Circulation 2015, 131, 1019–1030. [Google Scholar] [CrossRef] [Scilit] [PubMed]
- Cao, X.; Wang, H.; Hu, Z.; Ma, W.; Ding, P.; Sun, H.; Guo, X. Interplay of ST2 Downregulation and Inflammatory Dysregulation in Hypertrophic Cardiomyopathy Pathogenesis. Front. Cardiovasc. Med. 2025, 12, 1511415. [Google Scholar] [CrossRef] [Scilit] [PubMed]
- Becker, R.C.; Owens, A.P.; Sadayappan, S. Tissue-Level Inflammation and Ventricular Remodeling in Hypertrophic Cardiomyopathy. J. Thromb. Thrombolysis 2020, 49, 177–183. [Google Scholar] [CrossRef] [Scilit] [PubMed]
- Gao, R.; Liu, M.; Yang, H.; Zha, L.; Xia, N. Construction of a Competitive Endogenous RNA Network and Identification of Potential Regulatory Axes in Hypertrophic Cardiomyopathy. Front. Cardiovasc. Med. 2026, 12, 1552060. [Google Scholar] [CrossRef] [Scilit] [PubMed]
- Zhang, X.-Z.; Zhang, S.; Tang, T.-T.; Cheng, X. Bioinformatics and Immune Infiltration Analyses Reveal the Key Pathway and Immune Cells in the Pathogenesis of Hypertrophic Cardiomyopathy. Front. Cardiovasc. Med. 2021, 8, 696321. [Google Scholar] [CrossRef] [Scilit] [PubMed]
- Philippidis, P.; Mason, J.C.; Evans, B.J.; Nadra, I.; Taylor, K.M.; Haskard, D.O.; Landis, R.C. Hemoglobin Scavenger Receptor CD163 Mediates Interleukin-10 Release and Heme Oxygenase-1 Synthesis: Antiinflammatory Monocyte-Macrophage Responses In Vitro, in Resolving Skin Blisters In Vivo, and After Cardiopulmonary Bypass Surgery. Circ. Res. 2004, 94, 119–126. [Google Scholar] [CrossRef] [Scilit] [PubMed]
- Etzerodt, A.; Moestrup, S.K. CD163 and Inflammation: Biological, Diagnostic, and Therapeutic Aspects. Antioxid. Redox Signal. 2013, 18, 2352–2363. [Google Scholar] [CrossRef] [Scilit] [PubMed]
- Zhao, J.; Su, X.; Wu, J.; Qin, Y.; Song, C.; Li, Y.; Liu, C.; Li, R.; Wang, Q.; Liang, C. Integrative Transcriptomics and Machine Learning Identify Macrophage-Associated Biomarkers in Hypertrophic Cardiomyopathy. Int. J. Mol. Sci. 2026, 27, 5102. [Google Scholar] [CrossRef] [Scilit] [PubMed]
- Menezes Junior, A.D.S.; De Oliveira, H.L.; De Lima, K.B.A.; Botelho, S.M.; Wastowski, I.J. T-Cell-Driven Immunopathology and Fibrotic Remodeling in Hypertrophic Cardiomyopathy: A Translational Scoping Review. Cells 2025, 15, 61. [Google Scholar] [CrossRef] [Scilit] [PubMed]
- Wu, S.; Ud Din, I.; Sadiq, F.M.; Abdel-Maksoud, M.A.; Haris, M.; Mubarak, A.; Farrag, M.A.; Alghamdi, S.; Almekhlafi, S.; Akram, M.; et al. Dysfunctional Network of Hub Genes in Hypertrophic Cardiomyopathy Patients. Am. J. Transl. Res. 2022, 14, 8918–8933. [Google Scholar] [PubMed]
- Chen, S.; Hu, J.; Xu, Y.; Yan, J.; Li, S.; Chen, L.; Zhang, J. Transcriptome Analysis of Human Hypertrophic Cardiomyopathy Reveals Inhibited Cardiac Development Pathways in Children. iScience 2024, 27, 108642. [Google Scholar] [CrossRef] [Scilit] [PubMed]
- Ananthamohan, K.; Stelzer, J.E.; Sadayappan, S. Hypertrophic Cardiomyopathy in MYBPC3 Carriers in Aging. J. Cardiovasc. Aging 2024, 4, 9. [Google Scholar] [CrossRef] [Scilit] [PubMed]
- López-Otín, C.; Blasco, M.A.; Partridge, L.; Serrano, M.; Kroemer, G. Hallmarks of Aging: An Expanding Universe. Cell 2023, 186, 243–278. [Google Scholar] [CrossRef] [Scilit] [PubMed]
- Chang, A.C.Y.; Chang, A.C.H.; Kirillova, A.; Sasagawa, K.; Su, W.; Weber, G.; Lin, J.; Termglinchan, V.; Karakikes, I.; Seeger, T.; et al. Telomere Shortening Is a Hallmark of Genetic Cardiomyopathies. Proc. Natl. Acad. Sci. USA 2018, 115, 9276–9281. [Google Scholar] [CrossRef] [Scilit] [PubMed]
- Pegoli, G.; Milan, M.; Manti, P.G.; Bianchi, A.; Lucini, F.; Santarelli, P.; Bearzi, C.; Rizzi, R.; Lanzuolo, C. Role of Cdkn2a in the Emery–Dreifuss Muscular Dystrophy Cardiac Phenotype. Biomolecules 2021, 11, 538. [Google Scholar] [CrossRef] [Scilit] [PubMed]
- Zheng, P.; Yan, W.; Ding, Y.; Zhang, Y.; Chen, Z.; Qian, J.; Ge, J. Cardiovascular Ageing: Hallmarks, Signaling Pathways, Diseases and Therapeutic Targets. Signal Transduct. Target. Ther. 2026, 11, 142. [Google Scholar] [CrossRef] [Scilit] [PubMed]
- Frisch, S.M.; MacFawn, I.P. Type I Interferons and Related Pathways in Cell Senescence. Aging Cell 2020, 19, e13234. [Google Scholar] [CrossRef] [Scilit] [PubMed]
- Wang, Y.-J.; Singh, K.; Lokman, A.B.; Deng, S.; Sunitha, B.; Coelho Lima, J., Jr.; Beglov, J.; Kelly, M.; Blease, A.; Fung, J.C.K.; et al. Regulatory T Cells Attenuate Chronic Inflammation and Cardiac Fibrosis in Hypertrophic Cardiomyopathy. Sci. Transl. Med. 2025, 17, eadq3516. [Google Scholar] [CrossRef] [Scilit] [PubMed]
- Balasubramanian, S.; Pleasant, D.L.; Kasiganesan, H.; Quinones, L.; Zhang, Y.; Sundararaj, K.P.; Roche, S.; O’Connor, R.; Bradshaw, A.D.; Kuppuswamy, D. Dasatinib Attenuates Pressure Overload Induced Cardiac Fibrosis in a Murine Transverse Aortic Constriction Model. PLoS ONE 2015, 10, e0140273. [Google Scholar] [CrossRef] [Scilit] [PubMed]
Disclaimer/Publisher’s Note: The statements, opinions and data contained in all publications are solely those of the individual author(s) and contributor(s) and not of MDPI and/or the editor(s). MDPI and/or the editor(s) disclaim responsibility for any injury to people or property resulting from any ideas, methods, instructions or products referred to in the content. |
© 2026 by the authors. Licensee MDPI, Basel, Switzerland. This article is an open access article distributed under the terms and conditions of the Creative Commons Attribution (CC BY) license.