Article

Mosaic Loss of Y Chromosome: Temporal Variance and Association with Various Features in Patients at High Risk of Cardiovascular Disease


1
Faculty of Fundamental Medicine, Lomonosov Moscow State University, 119992 Moscow, Russia
2
University Clinic, Lomonosov Moscow State University, 119992 Moscow, Russia
*
Author to whom correspondence should be addressed.
Cardiogenetics 2026, 16(4), 20; https://doi.org/10.3390/cardiogenetics16040020
Submission received: 29 June 2026 / Revised: 14 September 2026 / Accepted: 18 September 2026 / Published: 23 September 2026
(This article belongs to the Section Molecular & Translational Genetics)

Abstract

Mosaic loss of the Y chromosome (mLOY) is a common karyotype alteration. The accumulation of LOY cells leads to genetic mosaicism and affects the development of pathological conditions in elderly men. Emerging data suggest that this phenomenon might be associated with an increased risk of cardiovascular disease (CVD) and several clinical and demographic parameters. However, the short-term dynamics of mLOY remain insufficiently investigated. Therefore, this study aimed to evaluate the short-term dynamics of mLOY in peripheral blood and its association with various features in men with high CVD risk. The study included healthy young volunteers (control group; n = 48) and male patients with a high risk of cardiovascular disease (HCR group; n = 65). Peripheral blood was obtained for the mLOY analysis from the HCR group at two time points: initially and after 6 months. mLOY was analyzed using a self-designed assay targeting SRY and EIF2C1 as a reference for digital droplet PCR. This assay demonstrated a high degree of linearity for Y chromosome copy numbers (CNs) from 0.9 to 0.6 (R2 = 0.9986) in mLOY models. In the control group, the CNs varied from 0.9 to 1.1. mLOY was detected in 6 of 65 patients in the HCR group (CNs below 0.9). This study revealed preliminary, hypothesis-generating associations between mLOY and sedentary lifestyle and family history of early-onset CVDs (p < 0.05; however, the former did not retain significance after adjusting for age). Analysis of temporal variations of mLOY demonstrated heterogeneous dynamics: in some patients, mLOY resolved, whereas in others, Y chromosome CN decreased even further with time. However, given the low mLOY incidence rate in the investigated cohort, these results should be considered preliminary and exploratory. Further studies are warranted to determine the potential utility of mLOY and its temporal dynamics for assessing CVD risk.

1. Introduction

The Y chromosome, which plays a key role in determining male sex and spermatogenesis, does not determine the survival and proliferation of somatic cells in the organism [1]. Thus, somatic cells might continue their life cycle even with a complete loss of the Y chromosome, thereby causing an accumulation of cells with the 45, X0 genotype in tissues [2]. Cells that have undergone somatic mutations and have lost the Y chromosome can enter the clonal expansion process, which leads to genetic mosaicism in the organism. This phenomenon is called mosaic loss of the Y chromosome (mLOY) [3].
Previously, mLOY was regarded as a natural age-related process occurring in peripheral blood cells; however, it is currently considered a significant factor that affects the development of pathological conditions in elderly men [4]. mLOY is the most common karyotype alteration in elderly men, which progresses nonlinearly with age [5].
mLOY is a biomarker of clonal hematopoiesis and cellular senescence [6]. Therefore, its analysis is of high importance for identifying the increased risks of age-associated diseases. According to recent studies, mosaic loss of the Y chromosome is associated with an increased risk of mortality, cardiovascular diseases (CVD), and neurodegenerative and oncological diseases, and can also correlate with various clinical and demographic parameters [5,7]. The association between mLOY and CVD has been noted in several studies that have shown that infiltration of cardiac tissue by macrophages carrying mLOY leads to hyperactivation of signaling pathways that promote fibrosis, increased extracellular matrix production, and excessive activation of fibroblasts, ultimately resulting in reduced cardiac function [8,9].
Telomeres located at the ends of eukaryotic chromosomes are repetitive DNA sequences. Each cell division cycle is accompanied by a progressive shortening of telomere length, which serves as an indicator of cellular senescence [10]. Telomere shortening is significantly influenced by oxidative stress, inflammation, and various clinical and demographic factors, which are also the main causes of cardiovascular disease [11]. Y chromosome telomeres undergo a more rapid age-associated shortening compared to other chromosomes [3]. Telomere shortening in normal non-senescent cells is compensated by telomerase (an enzyme that forms telomeric sequences), the activity of which might be decreased in the peripheral blood cells of patients with mLOY, although this has not yet been proven experimentally [12]. Telomere length and mLOY can be considered as biomarkers of cellular aging and an indicator of an increased risk of developing age-associated diseases, including cardiovascular disease [11,13]. Various studies have confirmed the association between telomere shortening and the development of CVD [13,14]. Therefore, it is relevant to study the association between telomere length and telomerase activity and CVD.
mLOY can occur in young men, most likely indicating pathologies of intrauterine development, but these cases are extremely rare [9]. As this alteration is infrequent in non-elderly men, the typical age of mLOY onset is approximately 65 years [15,16]. However, little is known regarding the process’s temporal dynamics, as most studies on the topic focus on an analysis of mLOY at a single time point [16,17,18,19,20]. What is the fate of these aneuploid clones? Do they continue to expand or are they being eliminated? To date, there is only one study dedicated to a longitudinal (intervals of 4–11 years) analysis of this alteration in elderly men, which demonstrated quite heterogeneous dynamics: in most cases, the degree of mLOY was increasing, yet it was either stable or decreasing [9]. Unfortunately, data on the short-term variability of mLOY are lacking.
Therefore, this study aimed to evaluate the short-term dynamics of mLOY in peripheral blood and its association with various clinical and demographic characteristics of men with high CVD risk.
Y chromosome loss can be detected using various molecular genetic techniques, such as karyotyping, whole-genome sequencing (WGS), quantitative polymerase chain reaction (qPCR), and digital droplet PCR (ddPCR). However, it is known that in the case of the mLOY analysis in peripheral blood, the degree of Y chromosome loss is often below 15%, requiring the use of the most precise techniques available [16,21,22]. In our study, ddPCR was the analytical method of choice due to its superiority compared with other forms of PCR for copy number variation (CNV) analysis and its lower cost compared with sequencing-based approaches [23].

2. Materials and Methods

2.1. General Information

This study was approved by the local ethics committee of the institution (#5/25 by 15 September 2025) and was conducted in accordance with the Declaration of Helsinki. Biological material was obtained from the biobank of the institution. The inclusion criteria for the high cardiovascular disease (HCR) group (n = 65) comprised the following:
  • male patients aged 50–85 years;
  • a high or very high cardiovascular risk according to the SCORE scale (for patients without CVD);
  • statin therapy;
  • any of the following CVDs: ischemic heart disease, peripheral artery disease, hypertensive heart disease, type 2 diabetes mellitus with target organ damage, chronic kidney disease (CKD) 3b+, post-infarction cardiosclerosis, anamnesis of stroke, and history of myocardial infarction.
For study participants from the HCR group, frozen peripheral blood for the mLOY analysis was obtained at two time points: initially and after 6 months.
The inclusion criteria for the control group (n = 48), which was enrolled only for technical assay validation and threshold definition, comprised the following:
  • Absence of any type of CVD;
  • Low cardiovascular risk according to the SCORE scale;
  • Absence of any known karyotype alterations.
For study participants from the control group, frozen peripheral blood for the mLOY analysis was obtained at a single time point.
This study did not include age-matched low-cardiovascular-risk control group. All biological and clinical comparisons were performed only within the HCR cohort at Visit 1. Table 1 presents the demographic and clinical characteristics of the study participants.

2.2. Genomic DNA Isolation and Processing

The study material consisted of peripheral blood samples obtained from recruited patients. These samples were stored for up to 5 years at −80 °C. Genomic DNA was extracted from 0.2 mL of biomaterials using the QIAamp DNA Blood Mini Kit (Qiagen, Hilden, Germany) according to the manufacturer’s instructions. DNA was extracted using a vacuum protocol. The elution volume was 50 µL. The samples containing purified DNA were immediately frozen at −80 °C for up to two weeks. Following thawing at room temperature, the samples were thoroughly mixed by pulse vortexing and centrifuged at 3000× g for 1 min. None of the samples underwent more than one freeze–thaw cycle. The purity of the extracted DNA was assessed using spectrophotometric analysis on the NanoDrop 2000 instrument (Thermo Fisher Scientific, Waltham, MA, USA).

2.3. DNA Analysis

Before amplification, DNA restriction was implemented to fragment genomic DNA and improve the quality of copy number analysis. Restriction was performed using the FastDigest Enzyme restriction endonuclease and FastDigest Buffer (ThermoFisher Scientific, Inc., Waltham, MA, USA) on the Eppendorf Mastercycler Personal instrument (Eppendorf, Inc., Hamburg, Germany) according to the manufacturer’s protocol. The optimal restriction enzyme-reaction input for further ddPCR analysis was established during a set of experiments with serial mixture dilutions. DNA amplification was performed using the Veriti Thermal Cycler (ThermoFisher Scientific, Inc., Waltham, MA, USA). The QX200 AutoDG ddPCR System (Bio-Rad Laboratories, Inc., Hercules, CA, USA) was used for droplet generation and readings. All ddPCR-related experiments were performed according to the manufacturer’s instructions. Optimal amplification conditions were determined in an experiment with gradient annealing/extension temperatures. The following thermocycling protocol was implemented: incubation at 95 °C (10 min); 40 cycles of denaturation at 94 °C (30 s) and annealing/extension at 54.7 °C (1 min); and incubation at 98 °C (10 min).
CNV-based analysis of mLOY was performed using a self-designed assay (Table 2) paired with ddPCR Supermix for Probes (Bio-Rad Laboratories, Inc., Hercules, CA, USA). The EIF2C1 gene located on chromosome 1 was selected as a copy number reference, and the SRY gene located on the Y chromosome was chosen to assess mLOY by comparing haploid sets of the corresponding genes. Each DNA sample was analyzed in a single technical replicate. A minimum of 10,000 accepted droplets per well was required for analysis. ddPCR results were analyzed using QuantaSoft 1.7 software (Bio-Rad Laboratories, Inc., Hercules, CA, USA).
To assess the range of linearity and the lowest detectable mosaicism level for the in-house ddPCR assay in accordance with dMIQE2020 Guidelines, mLOY models were created using mixtures of random biobanked female and young male genomic DNA at varying ratios to replicate different degrees of mLOY with Y chromosome copy numbers of 0.9, 0.8, 0.7, and 0.6. Limit of blank was calculated using samples from the control group and the following CLSI EP17 formula (the equation was reversed, as the analyte is expected to decrease in patients with mLOY):
L o B = x ¯ b l a n k − 1.645   ×   S D b l a n k ,
where “LoB” is the limit of blank, “ x ¯ b l a n k ” is the mean for Y chromosome copy number (CN) in the control group, and “ S D b l a n k ” is the standard deviation of this variable in the control group. Copy-number measurements below this boundary were considered distinguishable from the distribution of the control samples. dMIQE2020 checklist for presenting quantitative ddPCR experiments is available in Table S1.
The results of the CNV-based detection of mLOY in the genomic DNA of peripheral blood cells were presented using the following formula:
C N S R Y = ( C S R Y / C E I F 2 C 1 ) × 2 ,
where “C” is the DNA concentration of the corresponding gene in copies per μL of ddPCR reaction mixture and “CN” is the copy number.

2.4. Determination of Telomerase Activity and Telomere Length

The determination of telomerase activity in peripheral blood mononuclear cells (isolated using a density gradient) was conducted using the Telomerase Activity Quantification qPCR Assay Kit (TAQ), whereas the determination of telomere length was performed using the Absolute Human Telomere Length Quantification qPCR Assay Kit (ScienCell Research Laboratories, Inc., Carlsbad, CA, USA). The qPCR required to determine the telomerase activity and telomere length was performed using the thermocycling protocol recommended by the manufacturer. The amplification was performed using a CFX-96 instrument (Bio-Rad Laboratories, Inc., Hercules, CA, USA).

2.5. Statistical Analysis

Data were analyzed using IBM SPSS Statistics 26.0 (IBM Corp., Armonk, NY, USA). Continuous data are presented as medians [quartile 1; quartile 3], unless stated otherwise. Percentiles were calculated using the weighted-average method (HAVERAGE). Due to the absence of a normal distribution and the small sample size in the mLOY group, non-parametric statistical tests were performed. Fisher’s exact test was used to compare categorical data (as a more accurate alternative to the chi-square test for small groups) between the two groups. Due to limited sample size, adjustments for confounding factors using conventional maximum-likelihood logistic regression were considered unreliable. Thus, Firth bias-reduced logistic regression was used. Confounding effects are reported as relative change of odds ratios logarithm after the adjustment (∆%logOR). The unpaired continuous data were compared using the Mann–Whitney U test. Correlation analysis was performed using the Spearman rank coefficient.
A p value < 0.05 was considered statistically significant. Because of the exploratory design of the study, strict correction for multiple comparisons (e.g., Bonferroni correction) was not applied. Instead, we assessed the false discovery rate (FDR) using Benjamini–Hochberg procedure at an FDR of 0.2. p values below 0.05 that did not pass the threshold for this correction for multiple comparisons are marked with an asterisk “*”.

3. Results

3.1. Assay Development and Validation

DNA restriction is crucial for the analysis of CNVs. The restriction digestion of genomic DNA before CN measurement using ddPCR enables optimal accuracy and separates tandem gene copies, ensuring proper random distribution into droplets. It also reduces sample viscosity and increases assay efficiency by improving matrix accessibility. However, restriction enzyme buffers contain high salt concentrations, which may inhibit PCR. To select the optimal dilution of the mixture after restriction, a set of ddPCR experiments was performed with various dilutions of the mixture (2-, 4-, 5-, and 10-fold dilutions; Figure 1). At the lowest dilution (2-fold) of the restriction mixture, a strong inhibition of the reaction and non-disjunction of droplet clusters was observed. Optimal results were obtained using a 4-fold dilution of the restriction mixture. Therefore, a 4-fold dilution of the restriction mixture was used in all subsequent ddPCR experiments.
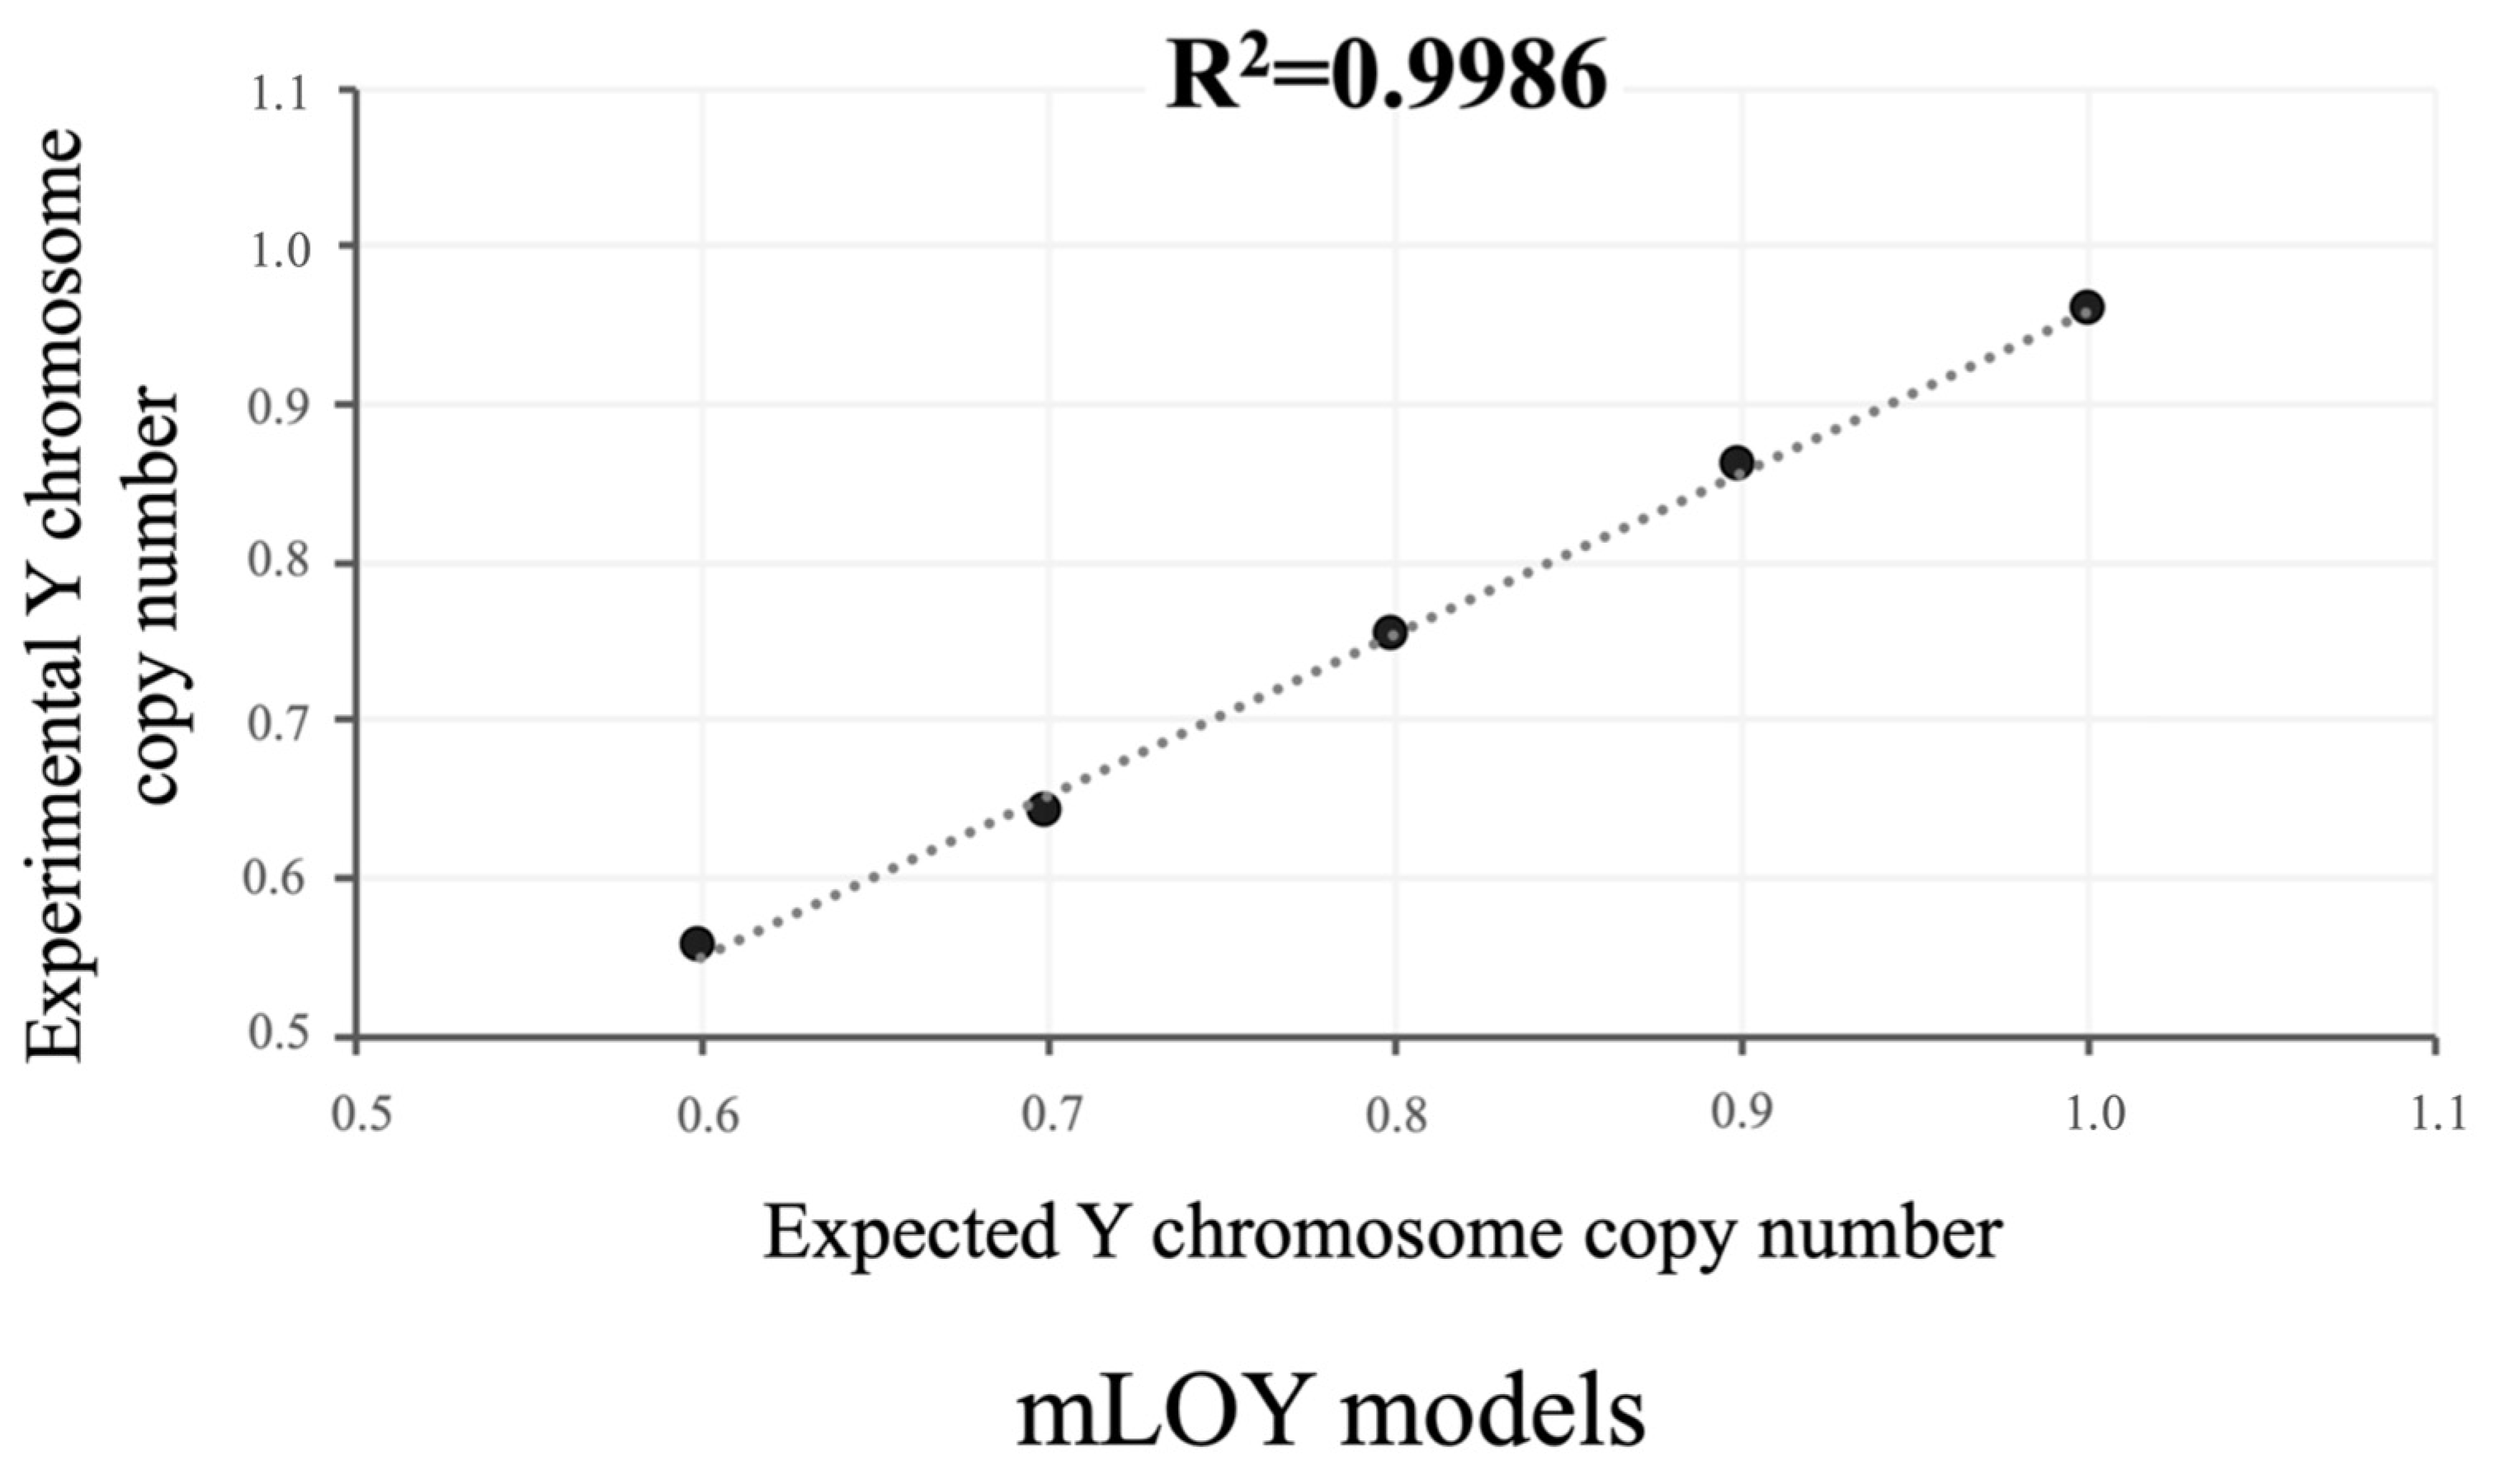
mLOY models with varying degrees of Y chromosome loss were generated by mixing biobanked genomic DNA of young men and women to assess the range of linearity of the assay. Pools of 15 male and female DNA samples were created, and their concentrations were measured. The expected Y chromosome CNs in these models were 1.0, 0.9, 0.8, 0.7, and 0.6, respectively. Their analysis revealed a linear relationship between the experimentally obtained and expected CN values, with the correlation coefficient (R2) of 0.9986, which is close to unity (Figure 2). This indicates a high degree of agreement between the expected and experimental CN values, confirming the accuracy of the assay for mLOY quantification. Analysis of mLOY models in different batches revealed an exceptionally low assay variability of ±0.031 CN.
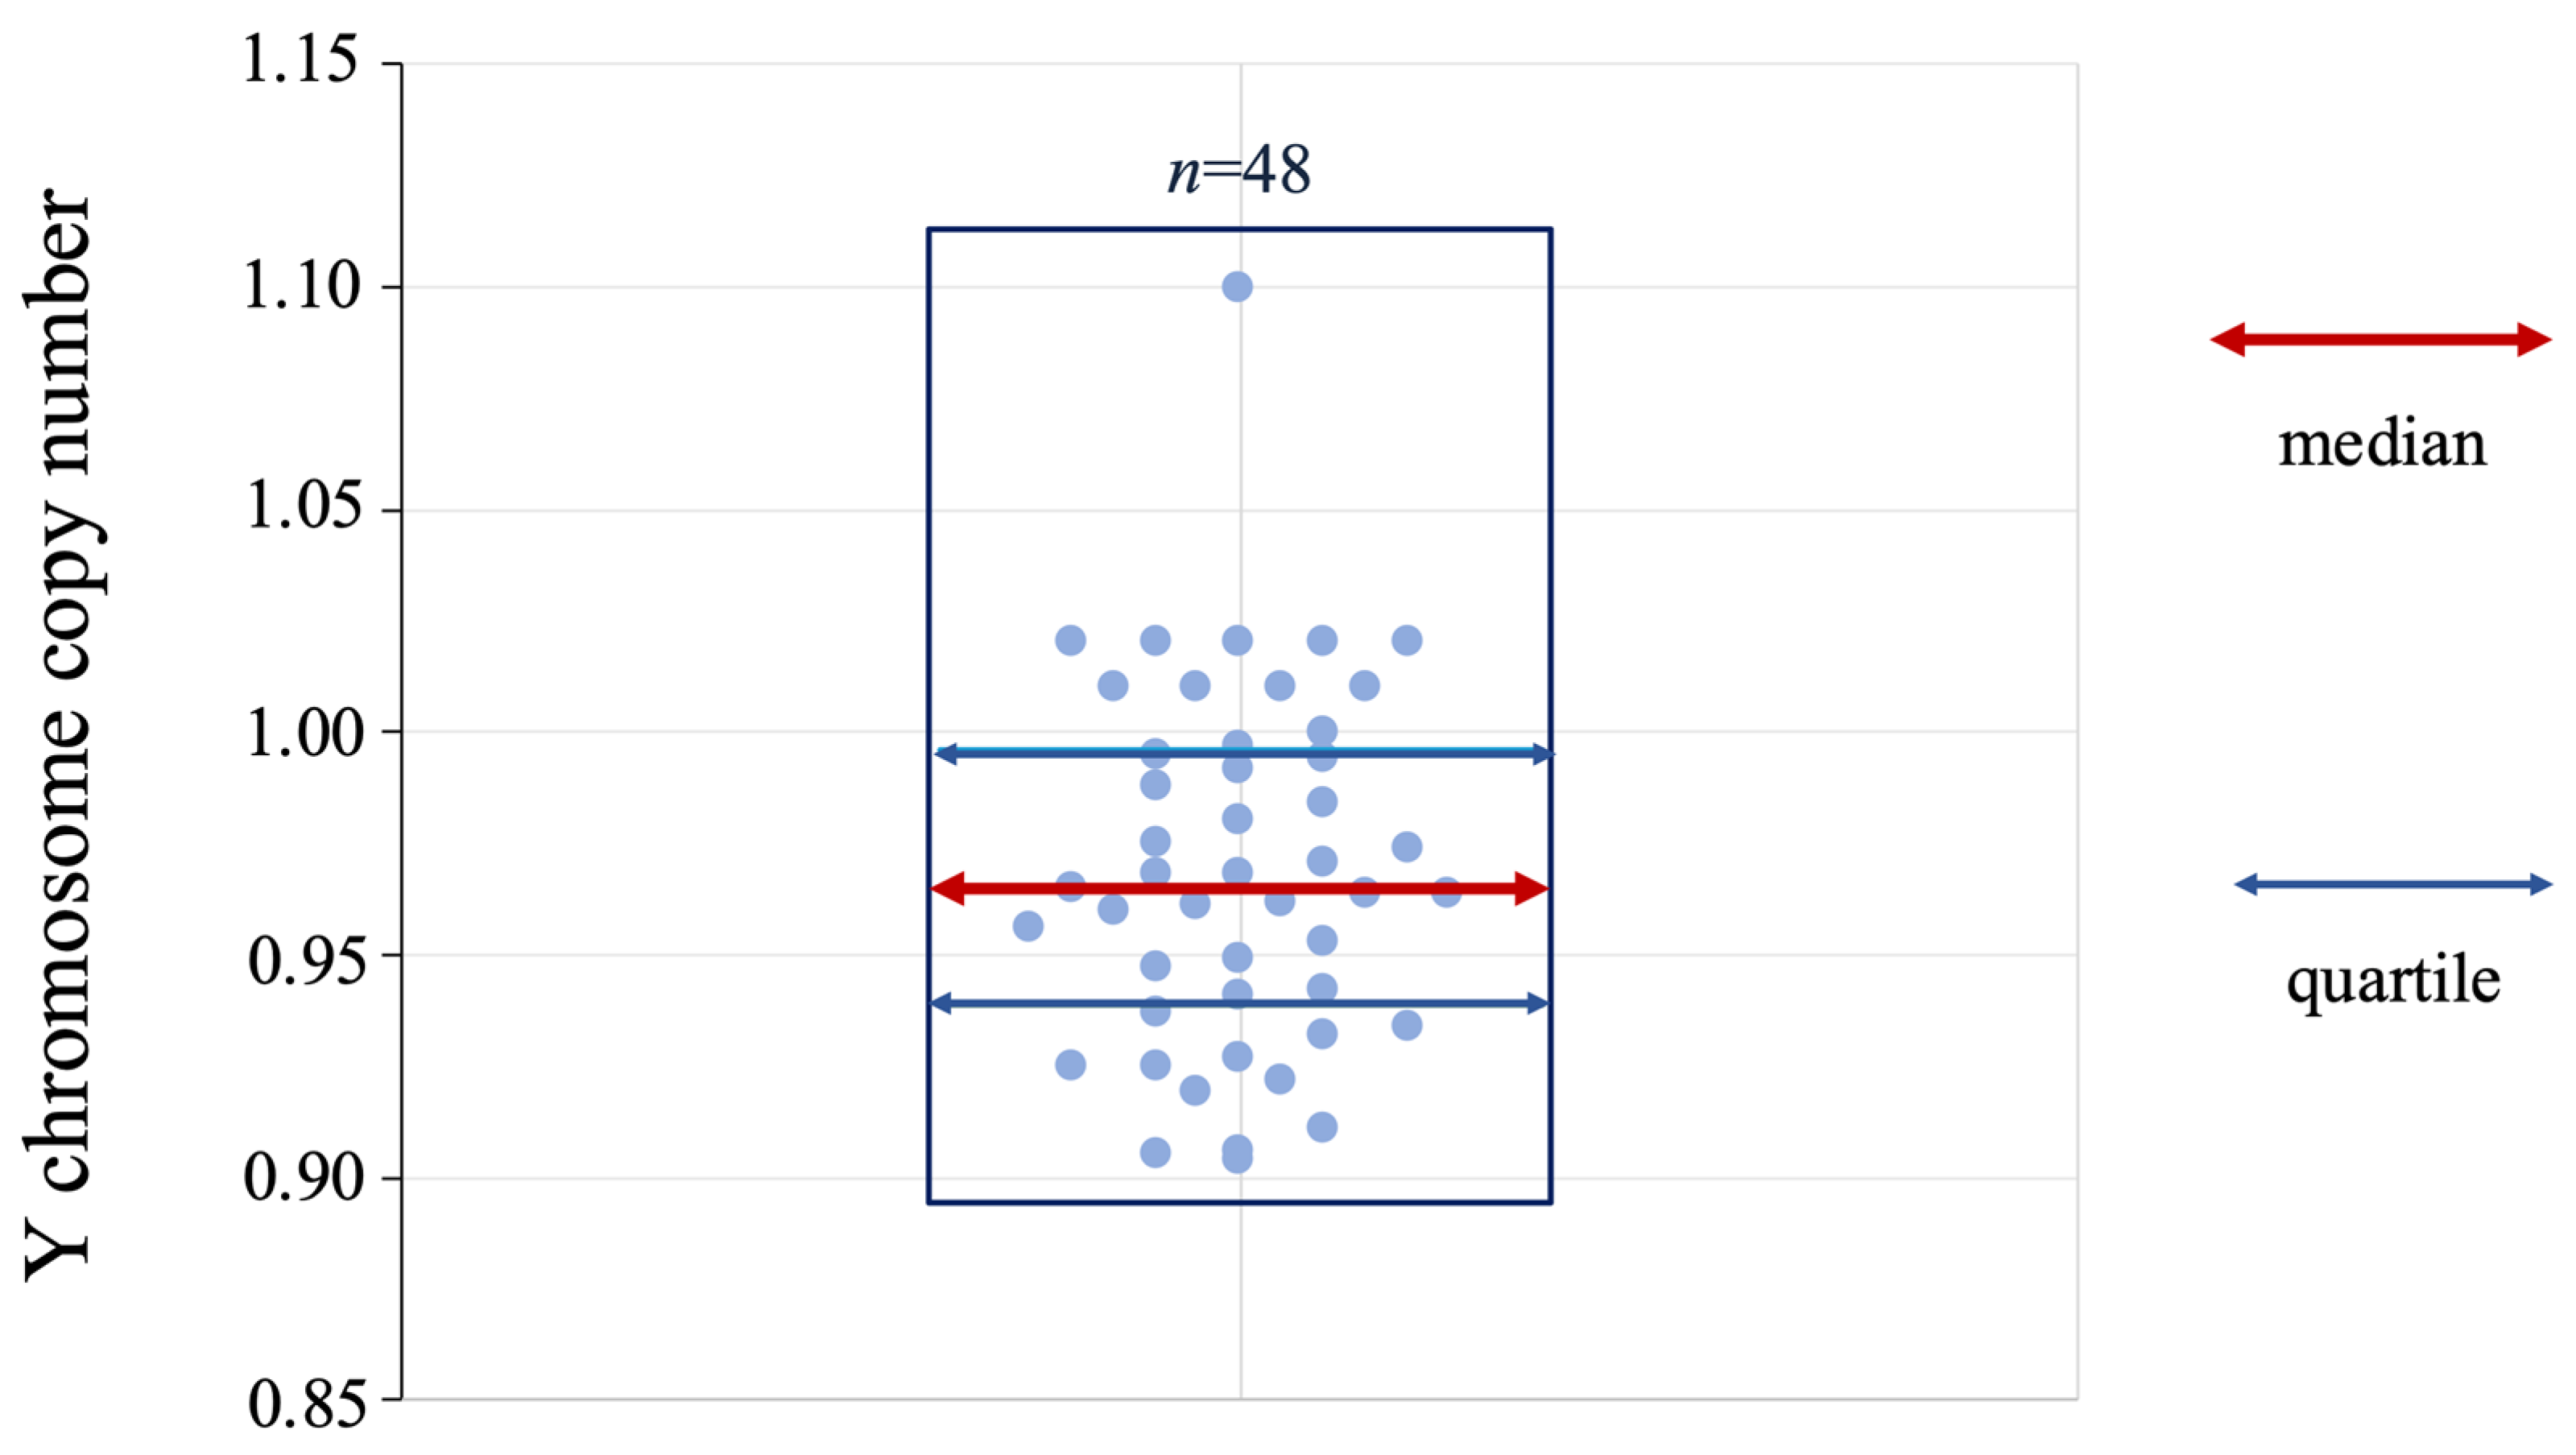
The control group comprised 48 healthy young male volunteers aged 18–30 years without any known karyotype alterations. In the absence of mLOY, the analytical range of the ratio of the CN of the SRY gene on the Y chromosome to the EIF2C1 gene on chromosome 1 varied from 0.904 to 1.100, with a median of 0.965 [0.937–0.997] (Figure 3). The lower limit of blank boundary calculated from the control samples was 0.904. The model with an expected Y-chromosome CN of 0.90, corresponding to nominal 10% mLOY, produced an experimentally measured CN below 0.904. The relationship between expected and measured CNs was linear over the tested range from 0.9 to 0.6 (R2 = 0.9986). These results demonstrate detection of the 10% mLOY model; accordingly, 10% mLOY was considered the lowest experimentally evaluated mosaicism level rather than a formally established limit of detection.

3.2. mLOY Analysis in Men at High Risk of CVD

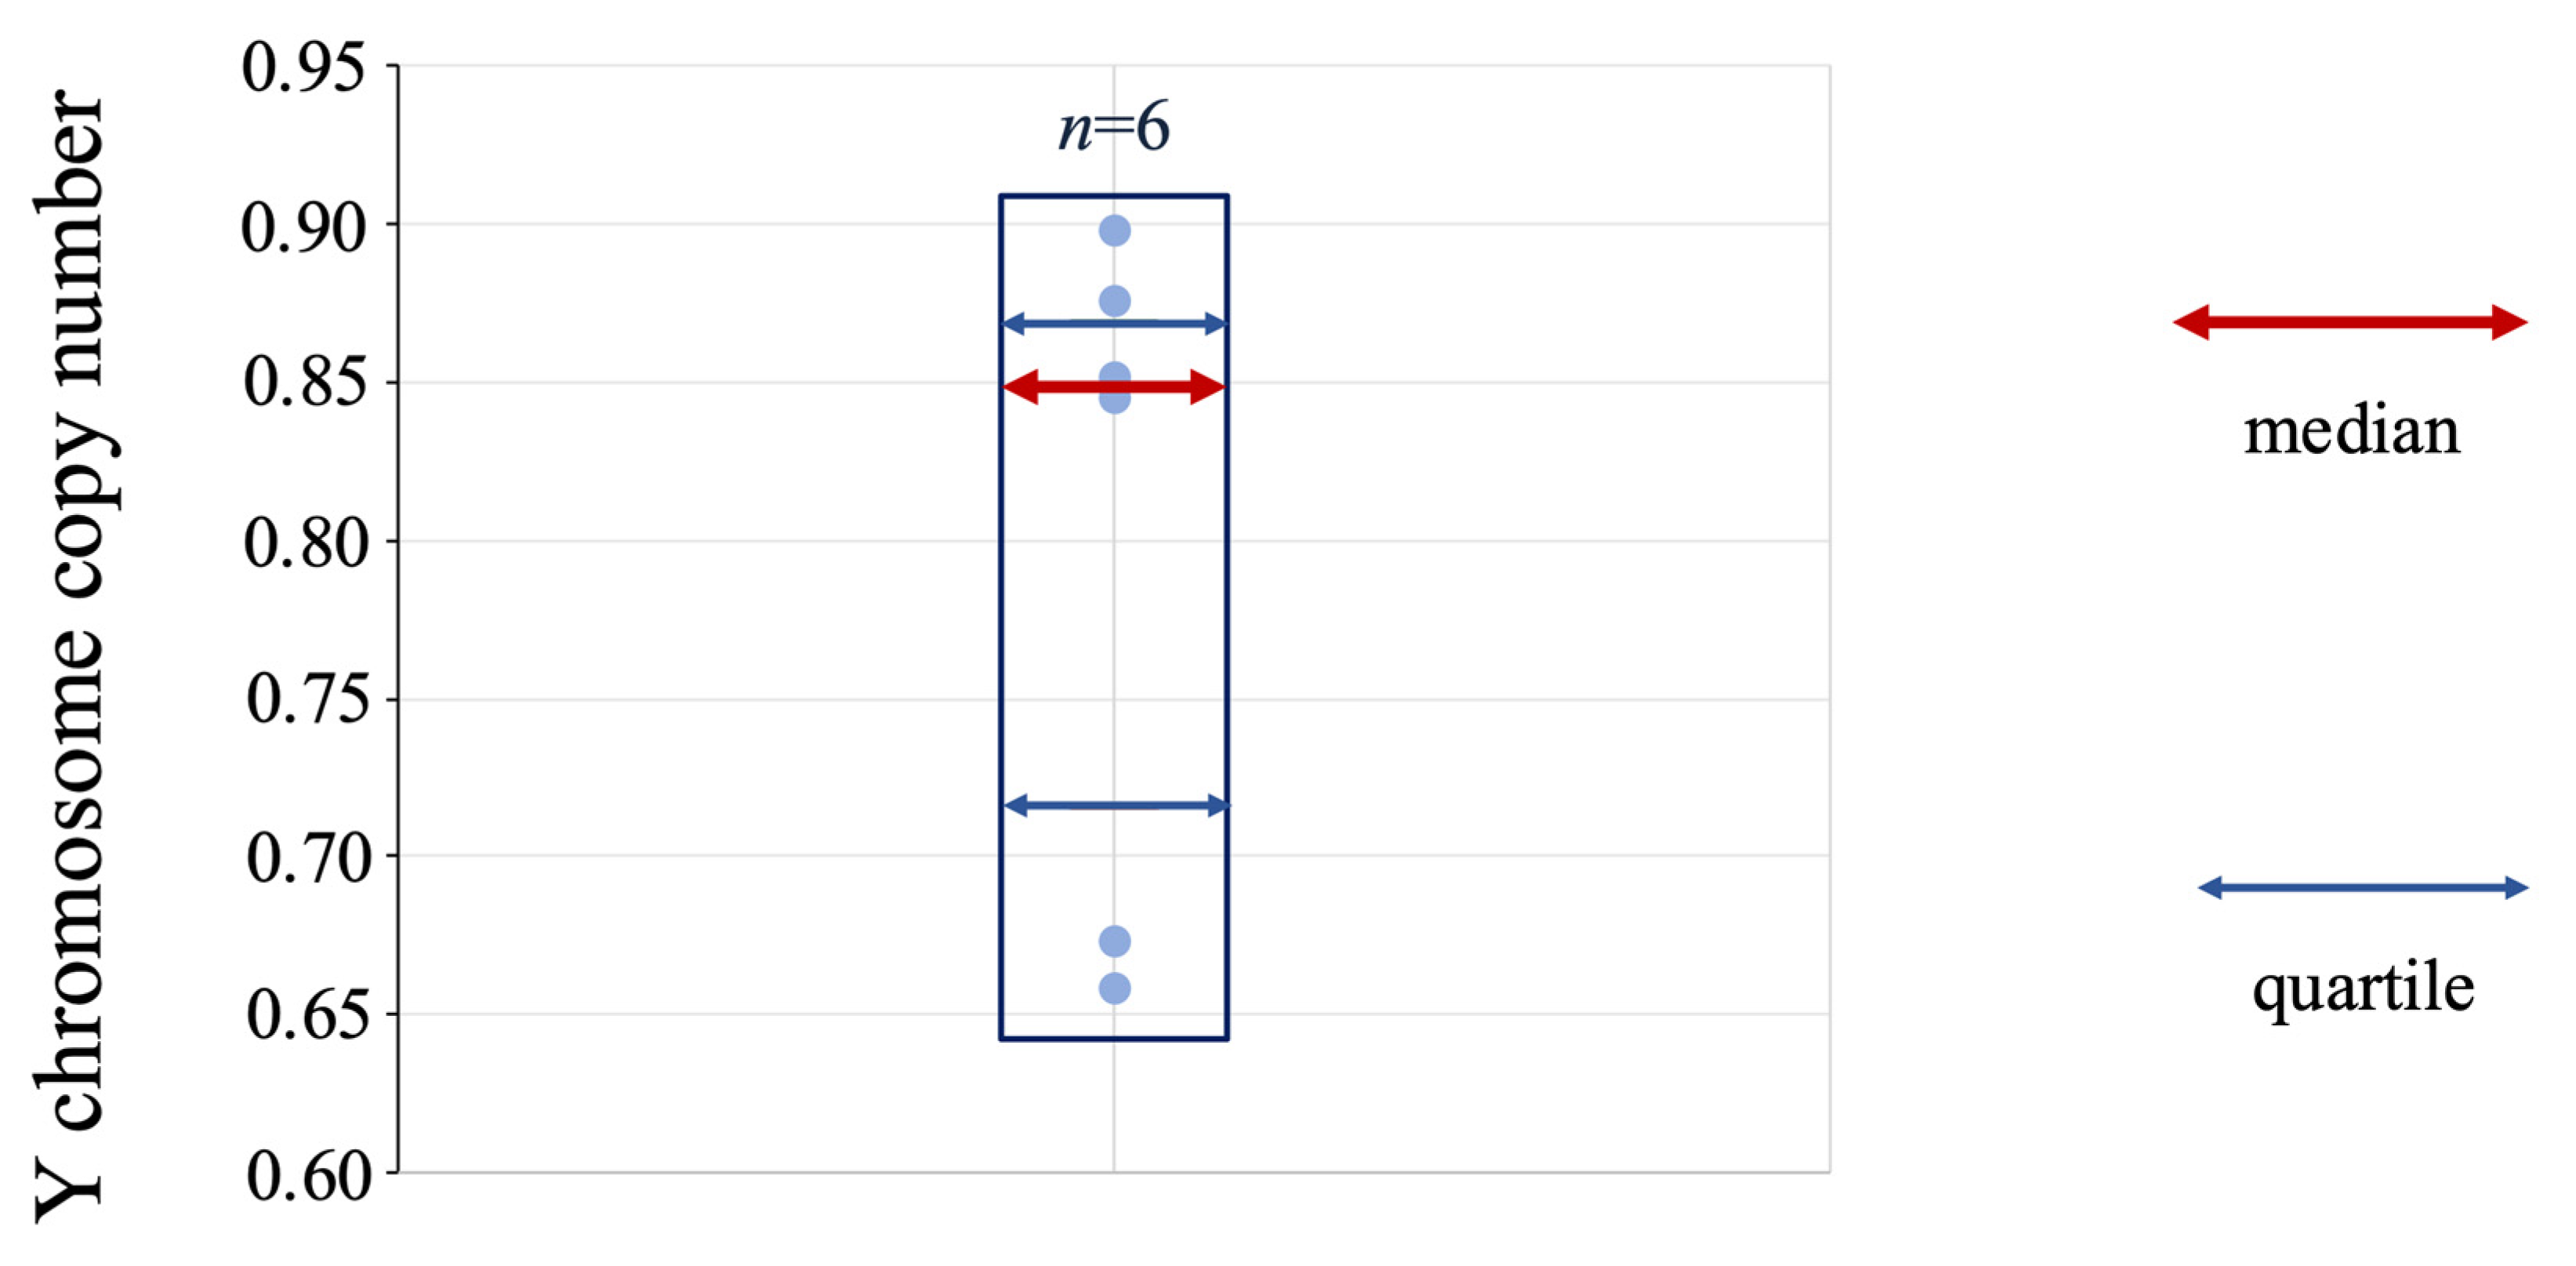
mLOY analysis was successfully performed in all samples included in the study, which were collected from 65 participants. Results of DNA analysis in each sample are presented in Table S2, whereas examples of representative 2D ddPCR plots are available in Figure S1. mLOY was measured at baseline (Visit 1) and after 6 months (Visit 2) in the HCR group. At Visit 1, mLOY was detected in six samples; Figure 4 shows the distribution of Y chromosome CN. The mLOY values ranged from 0.658 to 0.898, with a median of 0.848 (0.669; 0.881).
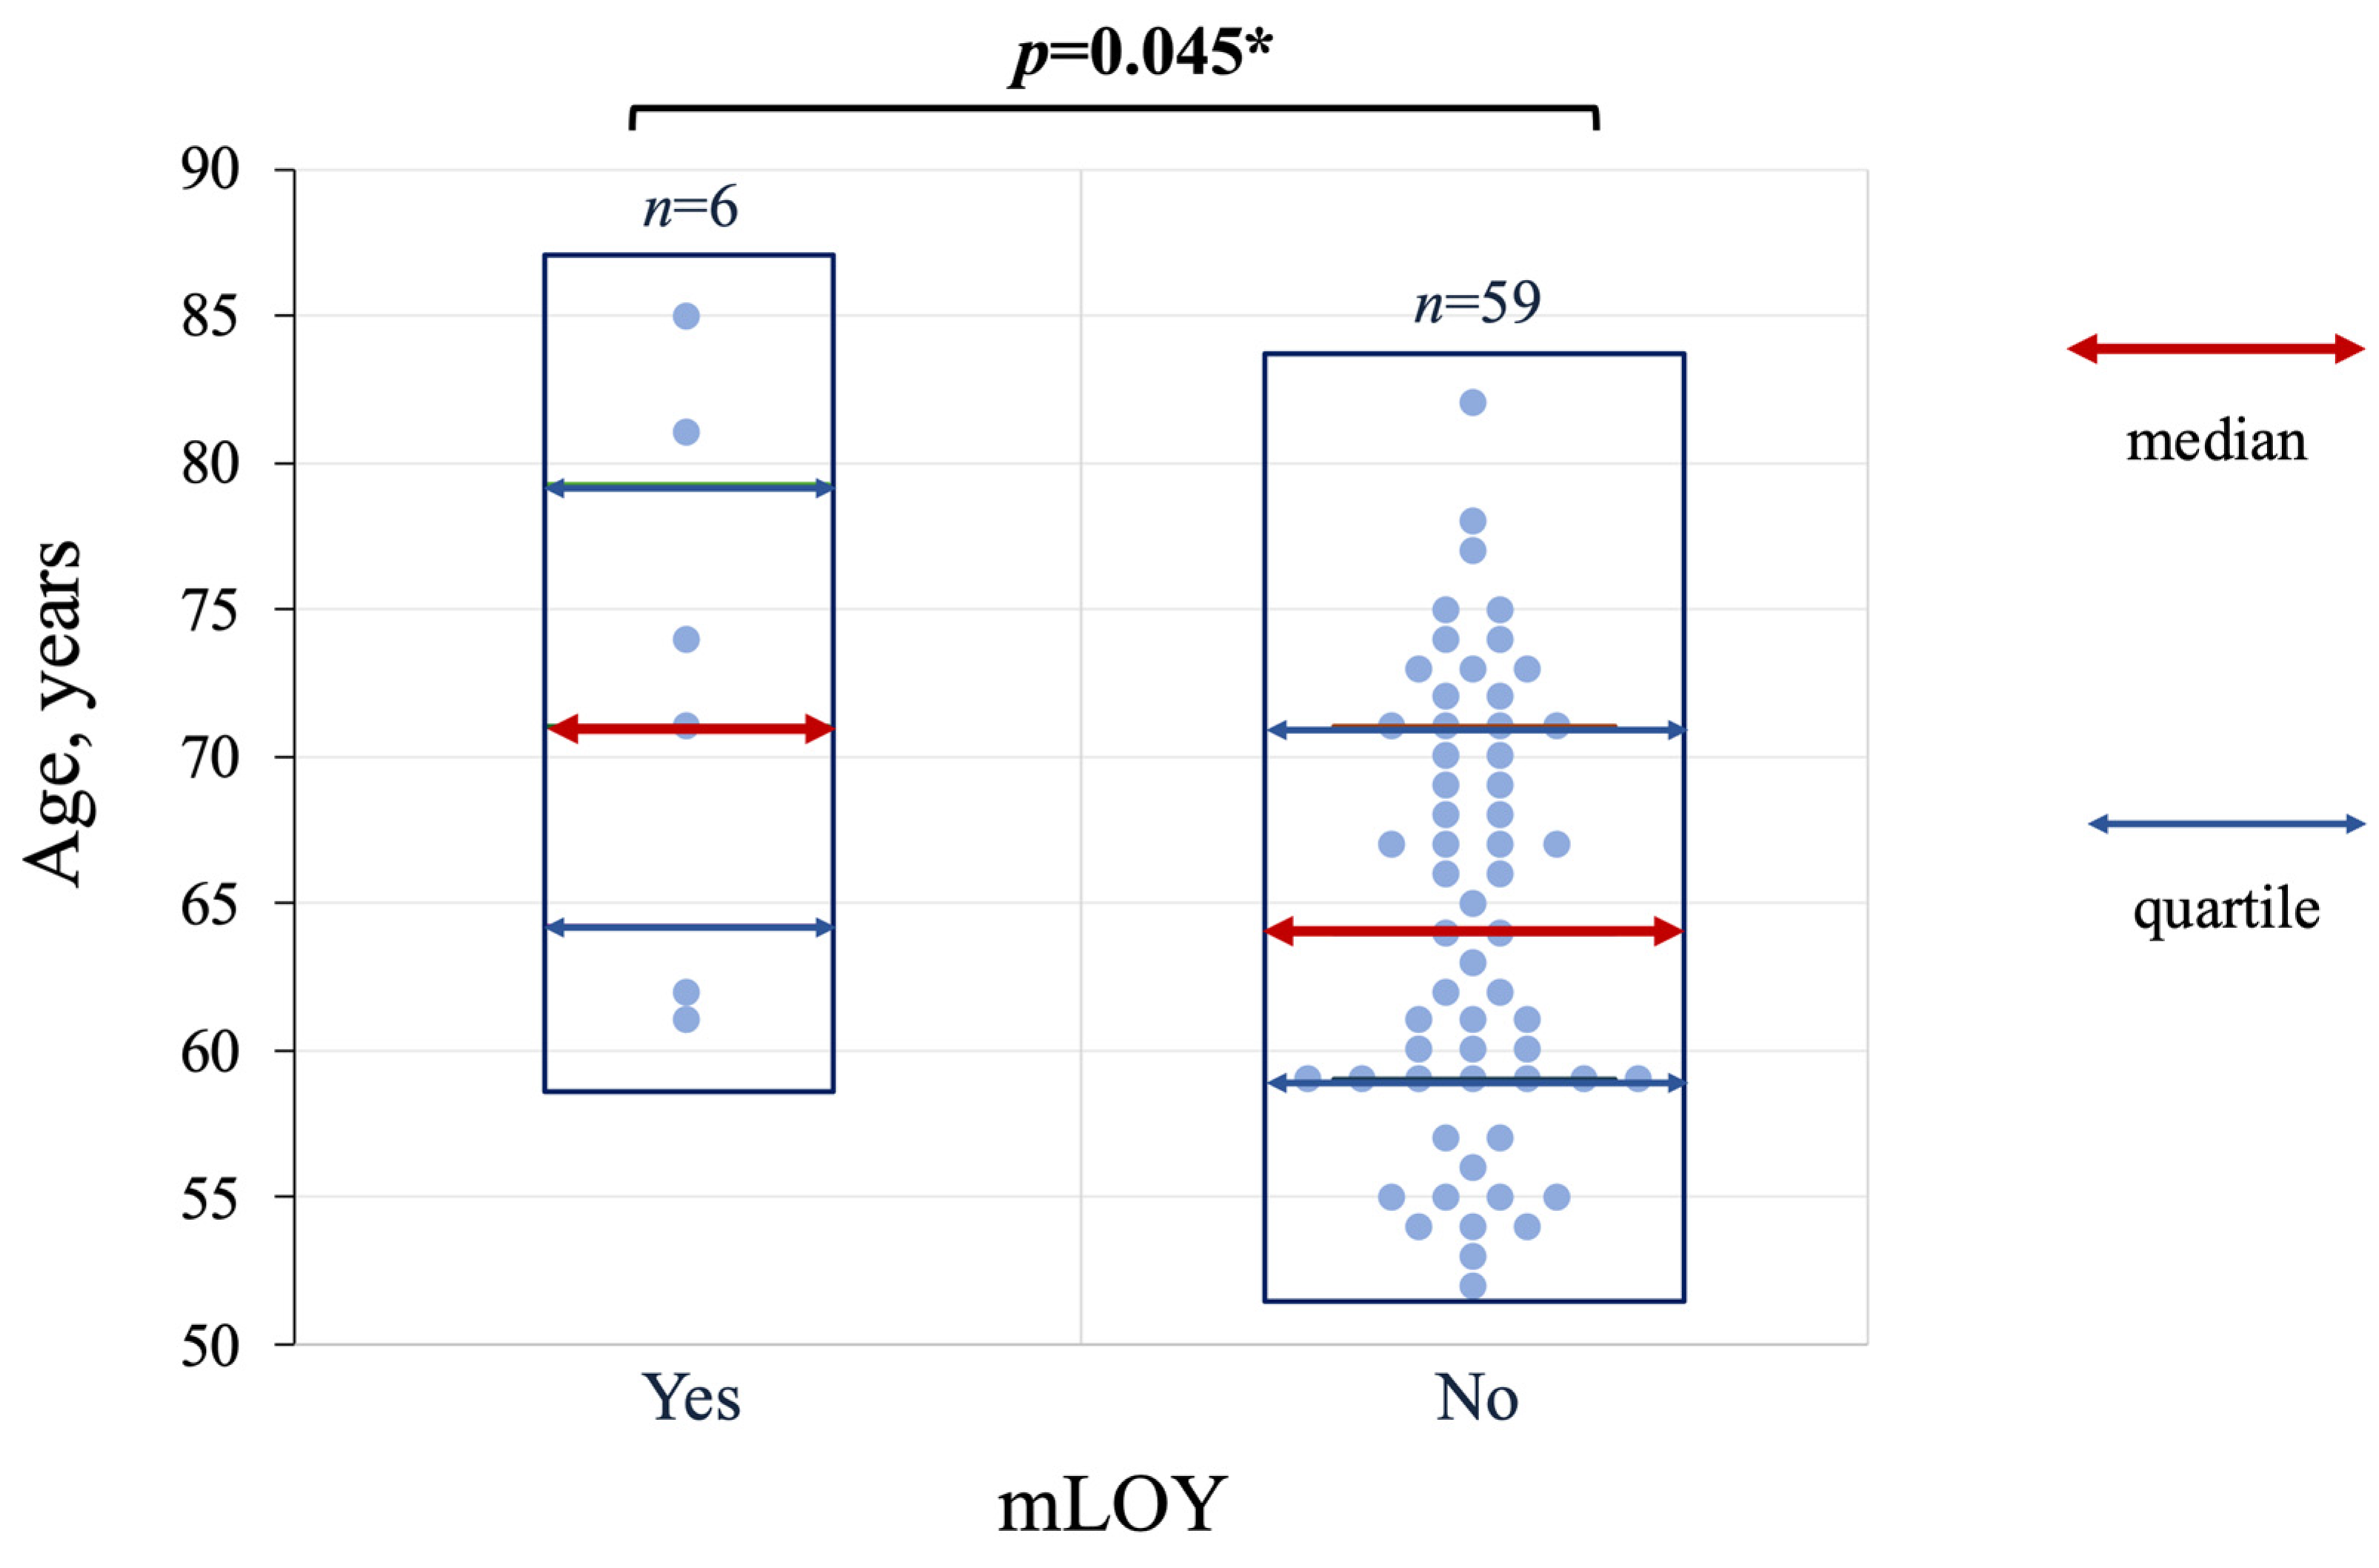
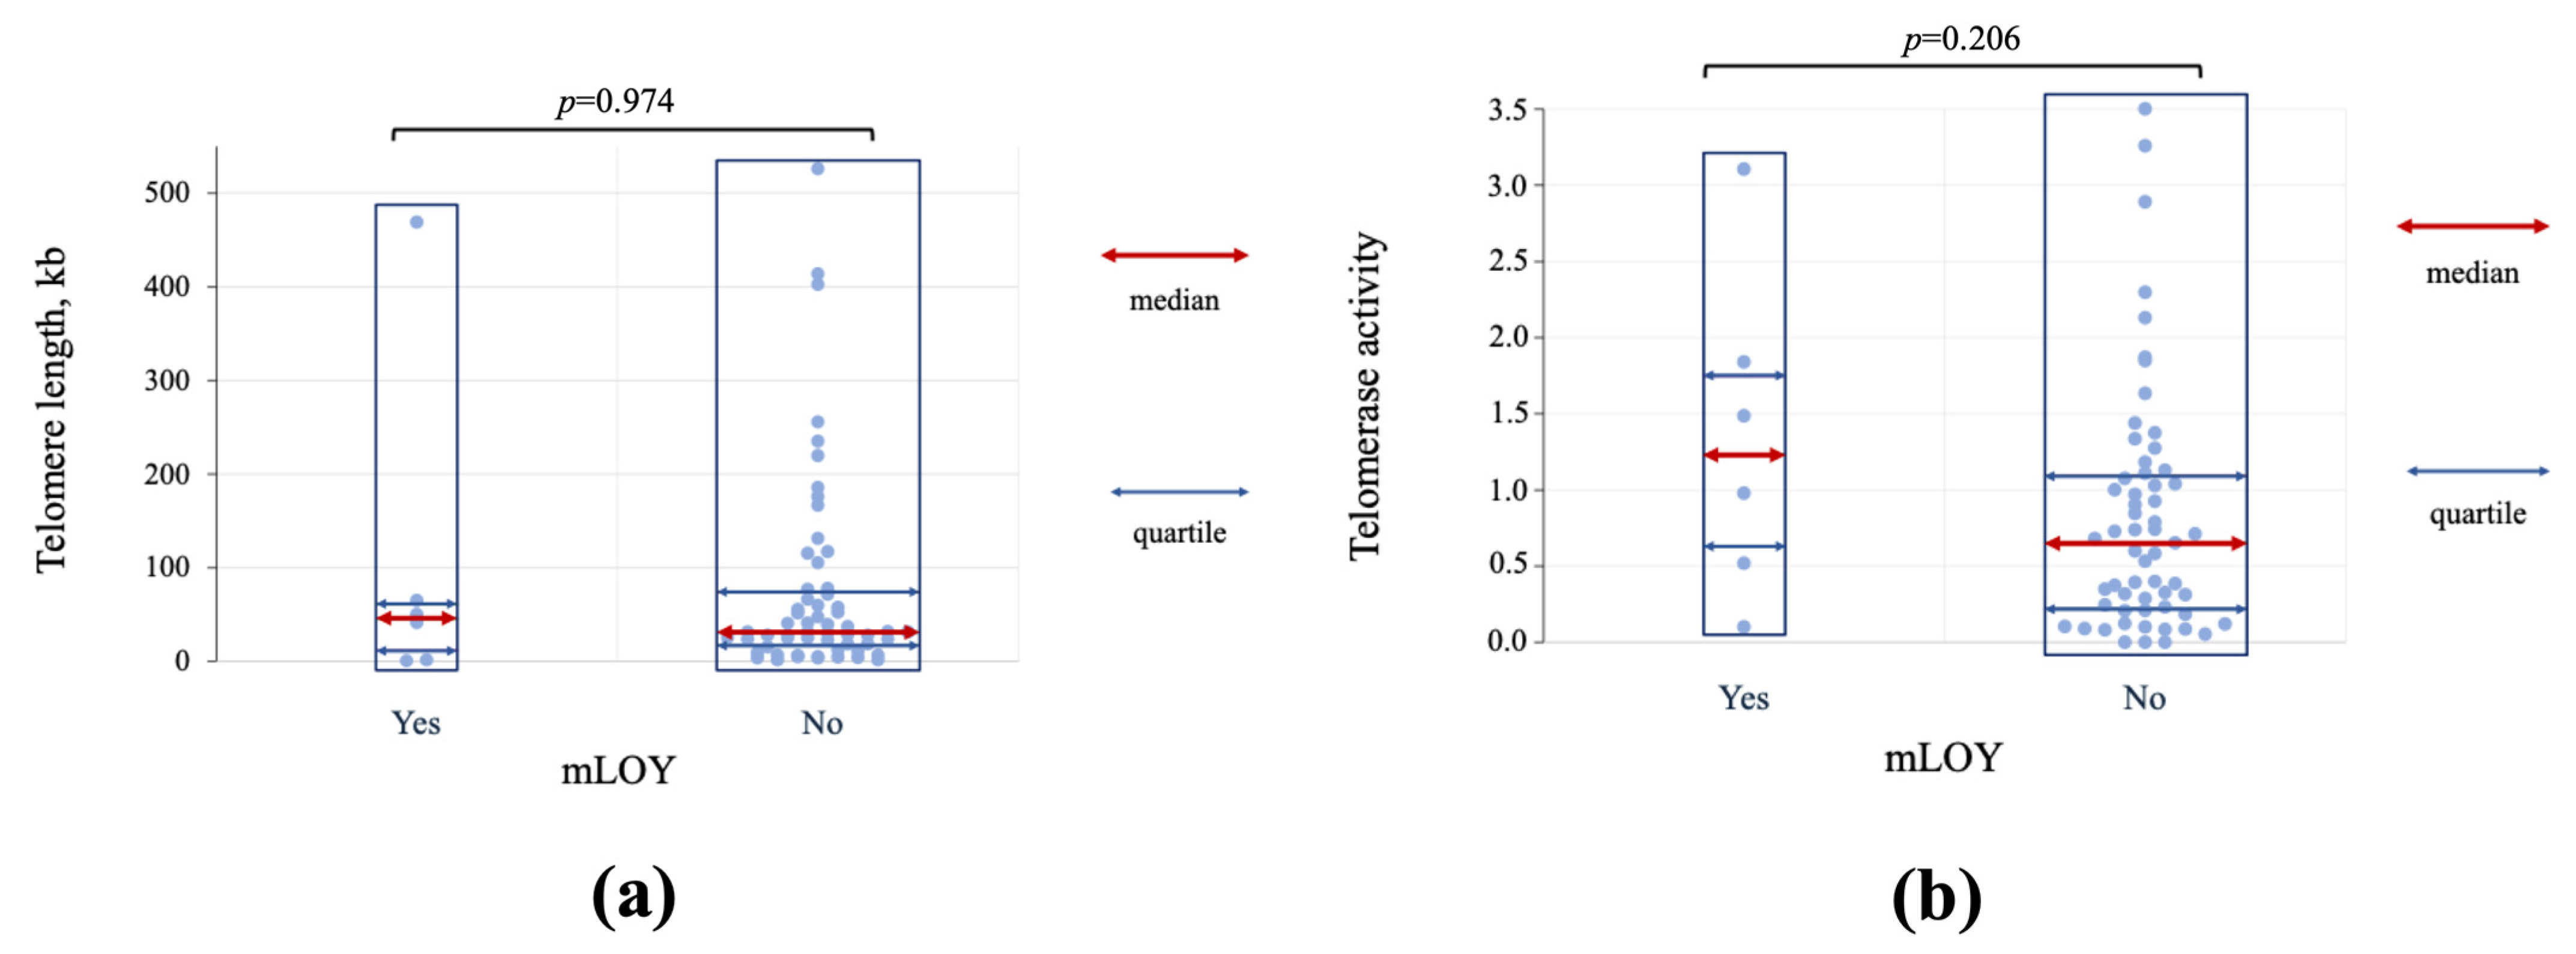
Patients with mLOY did not differ from the rest of the HCR group regarding continuous variables, such as body mass index (BMI) (p = 0.457), duration of hypertension (HTN) (p = 0.682), levels of high-density lipoproteins (HDL) (p = 0.348), low-density lipoproteins (LDL) (p = 0.363), triglycerides (p = 0.604), or cholesterol (p = 0.467) (Figures S2–S7). There was also no association with telomere length or telomerase activity (p = 0.974 and p = 0.206, respectively, Figure 5). However, patients with mLOY were older than those without mLOY (73 (62; 82) vs. 64 (59; 71) years, respectively, p = 0.045 *, Figure 6). There was no correlation between mLOY-positive cases and any other clinical or demographic parameters (p > 0.05).
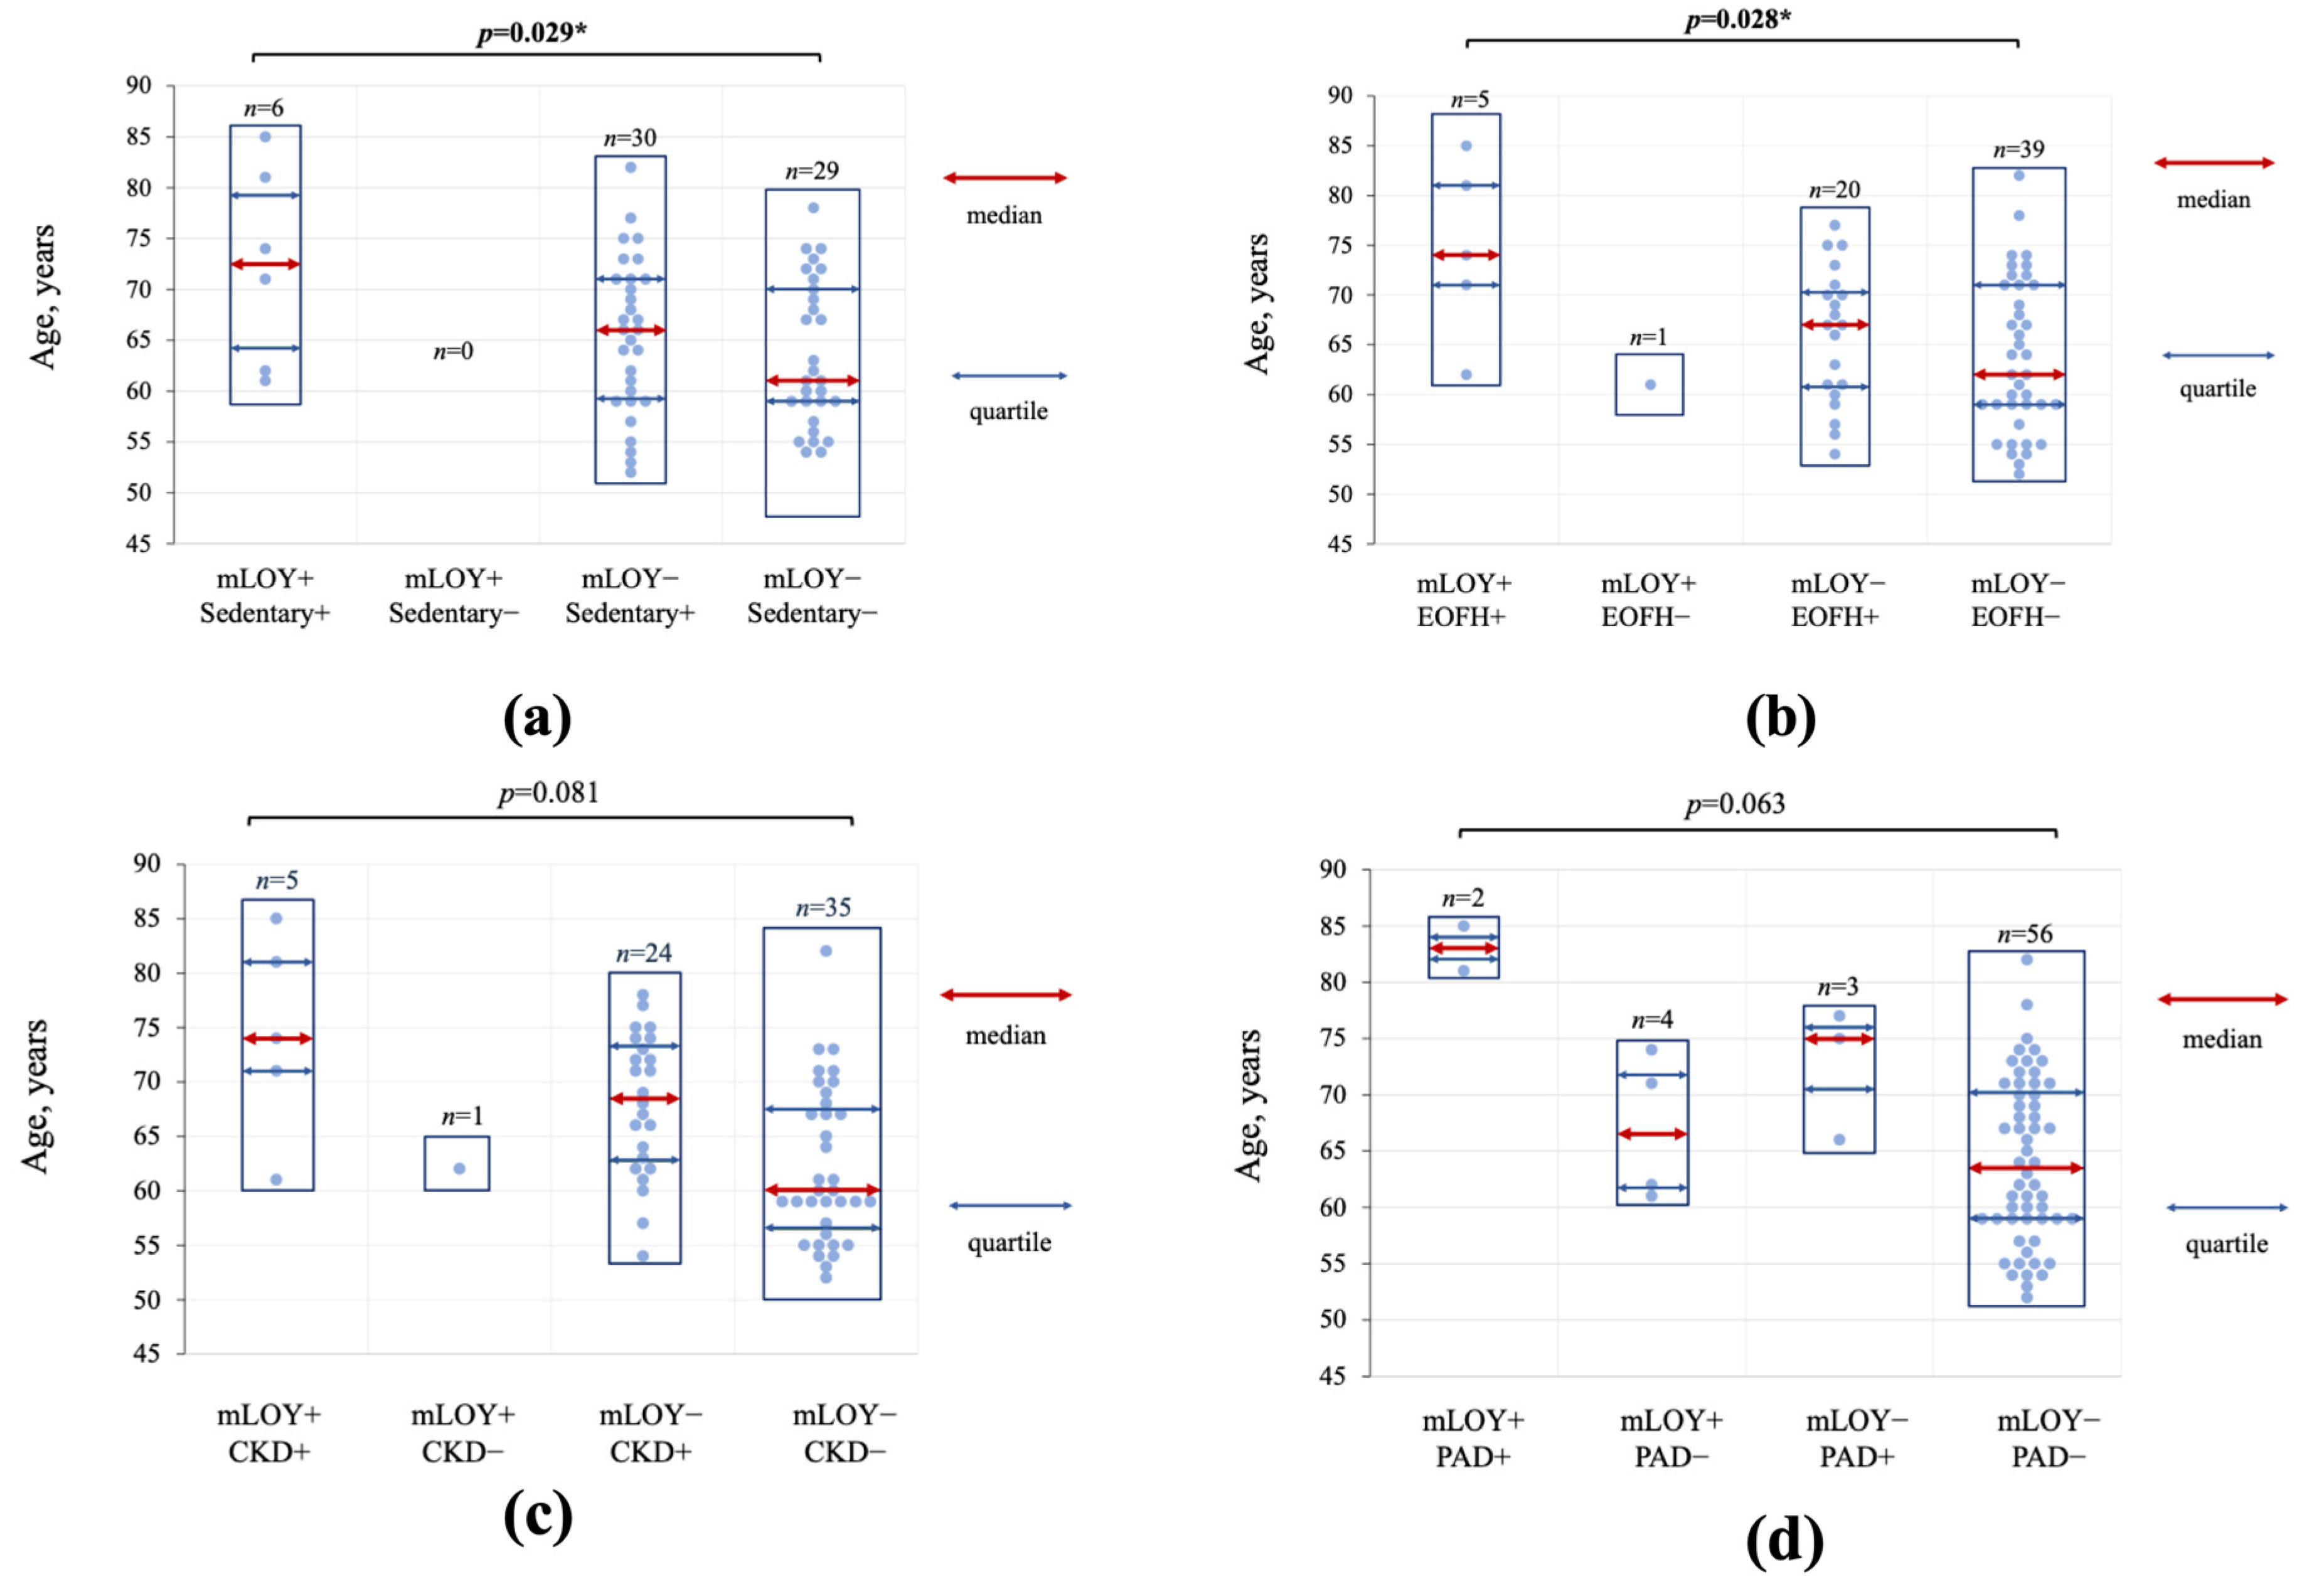
Categorical data analysis revealed several statistically significantly differing variables. Patients with mLOY were more likely to have sedentary lifestyle (6/6 (100%) vs. 30/59 (50.85%), p = 0.029 *, Figure 7a) and family history of early onset of CVDs (5/6 (83.33%) vs. 20/59 (33.90%), p = 0.028 *, Figure 7b) compared to individuals without mLOY. It is worth noting that age moderately attenuated the association of mLOY with sedentary lifestyle (∆%logOR = 10.7%). Patients with mLOY tended to have a higher proportion of CKD (5/6 (83.33%) vs. 24/59 (40.68%), Figure 7c) and peripheral artery disease (2/6 (33.3%) vs. 3/59 (5.1%), Figure 7d), although the differences did not reach the threshold for statistical significance (p = 0.081 and p = 0.063, respectively). Age was a substantial confounder for these trends (∆%logOR = 46.4% and ∆%logOR = 36.0%, respectively). No association was found between mLOY and ischemic heart disease, smoking, postinfarction cardiosclerosis, cerebrovascular accident and SCORE (p > 0.05, Figures S8–S12). Given the limited sample size and apparent influence of age, these findings should be interpreted as hypothesis-generating rather than confirmatory.
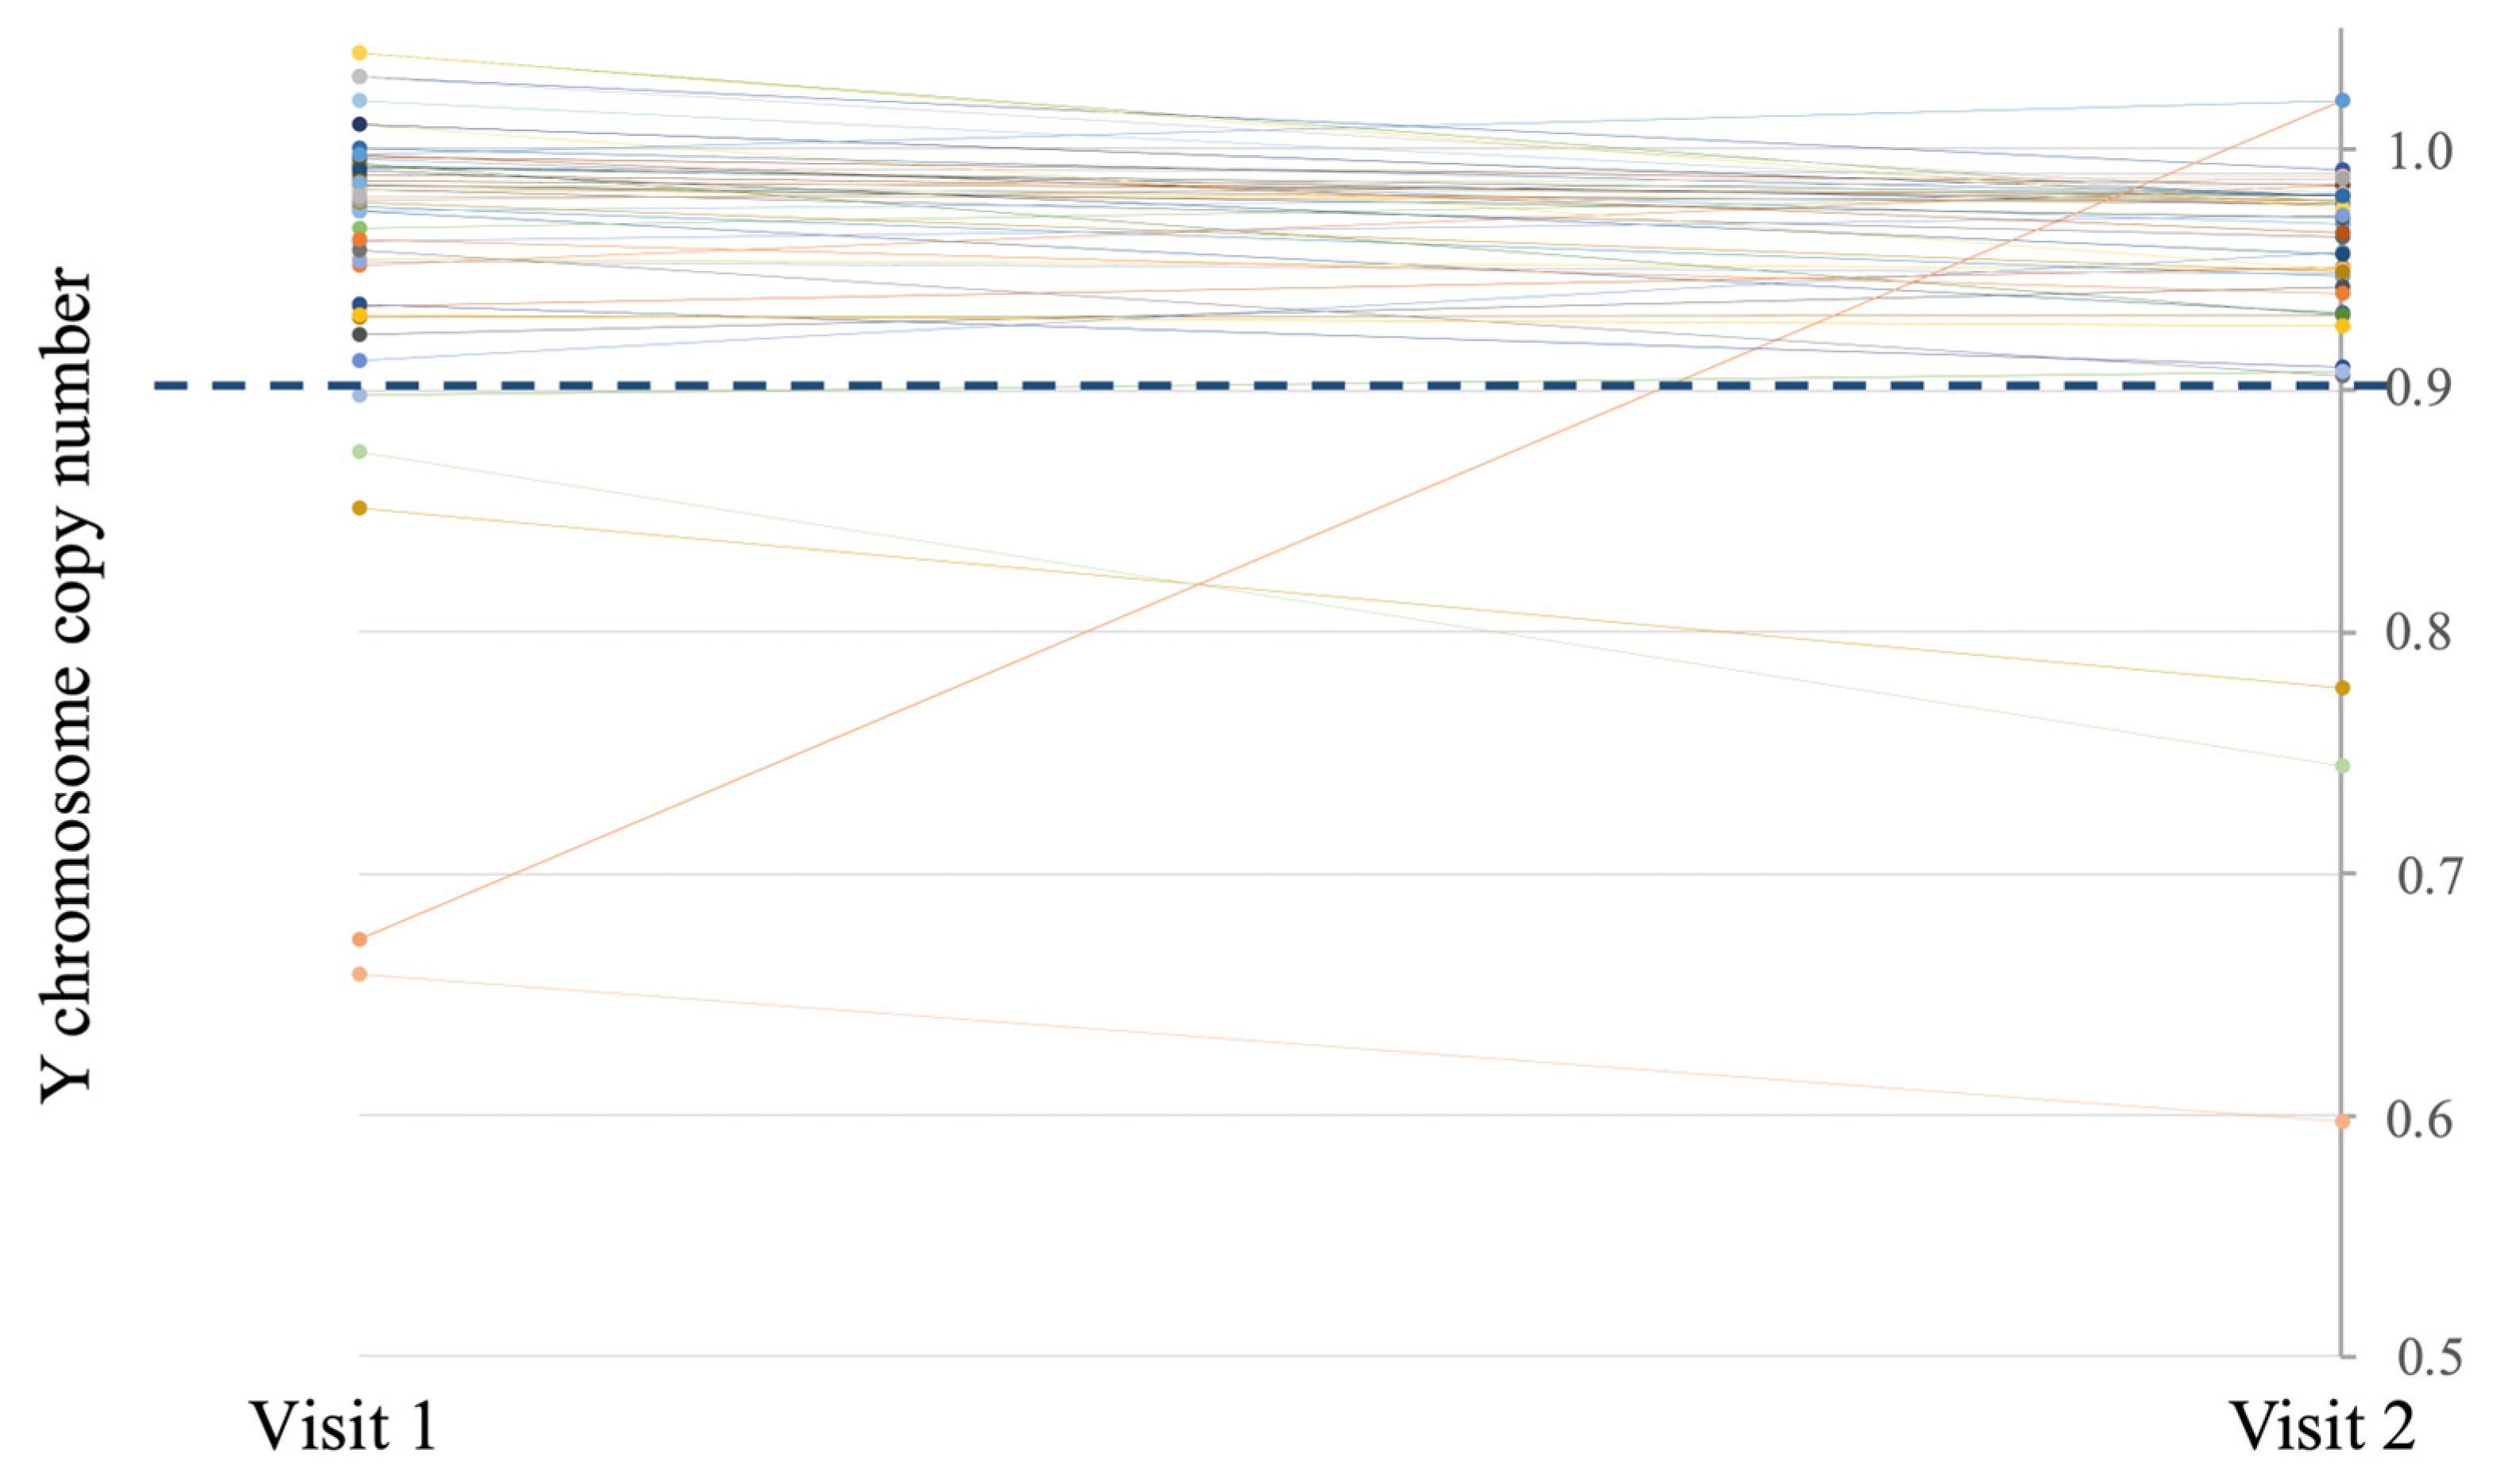
Figure 8 presents data for the change in the Y chromosome CN at Visit 2. It appeared that this parameter changed in a heterogenous pattern among patients positive for mLOY at Visit 1. A decrease in Y chromosome CN was observed in three cases, whereas in two cases, it had crossed above the predefined threshold and mLOY was no longer detectable. It is worth noting that in these five cases the CN changes were significantly higher than the established previously assay variability of ±0.031 CN. None of the patients in the rest of the HCR group had gained mLOY at Visit 2.

4. Discussion

mLOY is the most common karyotype alteration in men. The frequency of mLOY increases with age and can reach 20–40% by the age of 80 years [24,25]. Although mLOY has a high potential for medical research and is associated with an increased risk of developing various diseases [5], its analysis remains a significant limitation. Several assays have been designed to facilitate this process. In early studies, cytogenetic techniques, such as karyotyping and fluorescence in situ hybridization (FISH), were performed for mLOY detection [2]; however, they had some limitations, including accessibility, expensive reagents, and high time costs [26]. Methods such as WGS [17], qPCR [27], or ddPCR [24] were used in more recent studies. Nevertheless, each of these approaches has its limitations. Although next generation sequencing-based methods are highly informative, they are expensive, time-consuming, and require bioinformatic analysis for reliable interpretation [28]. qPCR is a more rapid assay than ddPCR, but it is less sensitive in detecting low-level mosaicism [29]. Thus, the most suitable analysis method is ddPCR, which was chosen in our study. In most studies employing ddPCR, targets with gametologous genes located on both sex chromosomes, such as AMELY and AMELX, were selected [8,24]. The advantage of using such targets is that one set of primers can be used for both loci, but this is less relevant in ddPCR due to the reaction mixture compartmentalization. Moreover, a certain percentage of men may have a deletion in the AMELY sequence, so false results may occur [30]. In this regard, we designed an assay that would target the SRY gene normalized by the EIF2C1 gene.
The analysis of mLOY models, which was performed to assess the range of linearity of the assay, demonstrated an exceptional correlation with the expected mLOY (R2 = 0.9986). However, there were certain discrepancies regarding the absolute values, which might be explained by the fact that genomic DNA was diluted based on spectrophotometry findings during the creation of mLOY models. Although spectrophotometry can be used to estimate the number of genome copies, its accuracy is limited because mononucleotides and oligonucleotides (which are smaller than our amplicon) absorb in the same range.
Our assay demonstrated a substantial variability in Y chromosome CN from 0.904 to 1.100 among young men. These results confirm the findings of other studies that established the threshold for Y chromosome loss (for the Y/X ratio) of 0.9, with values below 0.9 classified as LOY and those ≥0.9 considered normal [25,31,32]. In addition, some studies have used a threshold of mLRR (median of logR-ratio of the Y chromosome) < −0.15, representing approximately 10% of cells affected by LOY, which is also in line with our findings [33,34]. Several studies have demonstrated that the Y/X ratio does not always equal 1.0 in control cohorts but may vary within a range of approximately 0.9–1.1, reflecting both methodological variability and biological differences [35]. To the best of our knowledge, no other studies have provided precise data for Y chromosome CN variability in control cohorts, but one report indicated that men with mLRR > 0.15 could possibly have extra copy or mosaic gain of Y chromosome and were excluded from analysis [33]. This finding corresponds to our data for Y chromosome CN variability of up to 1.1 among young men.
In our study, the overall prevalence of mLOY was 9.23% in the HCR group aged 50–85 (6 mLOY-positive cases out of 65 participants). The proportion of patients with mLOY nonlinearly increases to 85 years [15,17]. In our cohort, mLOY was observed in 18.2% of patients aged ≥70 years, which is lower than that reported in some studies, where this condition affected over 30–40% of men in this age group [7,15]. However, in a large population-based study by Zhou et al., mLOY was detected in 7% of men overall, with prevalence increasing with age and reaching 18.7% among men over 80 years old [27].
mLOY is a prevalent somatic genetic alteration that may be associated with different clinical and demographic parameters. All studies investigating mLOY in cohorts of elderly men have reported a strong association between its progression and age [15,16,18,33,36], which is also in line with our results. Several studies have focused on the association between mLOY and smoking [20,36,37]. Although patients with mLOY in our study showed a higher proportion of smokers, the difference compared with the control group did not reach statistical significance, which may be explained by the limited sample size. Smoking is among the most frequently reported modifiable factors associated with mLOY [36,37]. In our cohort, all patients with mLOY had a history of smoking, compared with approximately 69.5% (41/59) of participants without mLOY. Although this difference did not reach statistical significance (p = 0.060), its direction was consistent with previous reports [20,36,37]. Given the small number of mLOY-positive cases and the resulting inability to adjust reliably for multiple potential confounders, this finding should be regarded as preliminary and should not be interpreted as evidence of an independent association.
Our study also identified a potential association between mLOY and a family history of early-onset CVDs. However, this association may reflect shared environmental and familial exposures, including lifestyle factors such as smoking, which has been consistently associated with mLOY [18,37]. Genetic susceptibility to mLOY has been demonstrated in a large-scale study [7], and mLOY has also been associated with the development of clonal hematopoiesis [6]. Collectively, these findings suggest that a shared familial predisposition to clonal hematopoiesis may also contribute to the observed association between mLOY and a family history of early-onset CVDs.
The BMI has previously been reported to be associated with mLOY status [38], but we were unable to confirm this finding in our study. Similarly, a significant correlation between mLOY and shorter telomere length has been shown in published studies [22,39], which was also not supported by our results. Given the low incidence of mLOY in the HCR group, the absence of statistically significant associations should not be interpreted as evidence of the absence of a biological association. Mendelian randomization revealed that telomere shortening might be a causal pathway for mLOY, although the exact mechanistic relationship between these two genomic processes is yet to be uncovered [39]. The association between mLOY and telomere length has not yet been fully elucidated, and more detailed validation on a larger cohort is required. Our study presented the first assessment of telomerase activity relationships with mLOY. Therefore, due to the lack of such measurements, the proposed association should also be confirmed or refuted in a larger cohort. Furthermore, research indicated an association between mLOY and hypertension [40,41], whereas it was absent in our study. In addition, mLOY demonstrates a positive correlation with LDL level [41], which was not confirmed in our analysis. However, there are no reports regarding associations with HDL, triglycerides, or cholesterol levels, and our findings did not reveal such associations (p > 0.05, Figures S1–S6). The association between mLOY and an increased risk of CKD has previously been established [40], and although our findings may provide some support for this relationship, the observed association was substantially confounded by age, which is strongly associated with both mLOY and CKD.
To the best of our knowledge, this is the first study to examine the association between sedentary lifestyle and mLOY. Our findings suggest a possible positive association between mLOY and this parameter. However, it is worth noting that age was a moderate confounder for this association and the p-value did not pass the multiple comparisons correction. A recent study unveiled the relationship between frailty and mLOY and the role of mLOY in the frailty-mortality association among older males aged ≥65 years [42]. However, its direct link to hypodynamia and age-related muscle mass loss remains elusive. The associations of mLOY with various clinical and demographic characteristics of males found in the available literature were derived from large-scale WGS-based studies, often using the same datasets. Therefore, partial discordance with our data does not undermine it, but highlights the need for further validation of these associations in different cohorts.
To our knowledge, this is the first study to examine the association between mLOY and telomerase activity. Previously, it was shown that telomere length might be connected to the occurrence of mLOY [22,39]. Given the scarcity of data on this topic, further research is warranted.
CN assessment at Visit 2 demonstrated a heterogeneous dynamic, with significant progression in three cases, whereas mLOY was no longer detectable in two cases. As it was stated previously, differences in CN values for these paired samples were above the assay variability of ±0.031 CN, highlighting that these observations could potentially be of biological nature. Currently, the possible mechanisms underlying such changes are unknown, but this could be related to the differences driven by the functioning of mLOY-positive cells and various clinical and demographic parameters. In the rest of the HCR group, Y chromosome CN did not change significantly over time. Given the small sample size, the observed 6-month dynamics should be considered hypothesis-generating. These observations must be confirmed in a larger cohort prior to drawing any conclusions. However, similar findings were reported in a study of longitudinal dynamics of mLOY, where it was shown that in some individuals, mLOY clearly progressed over time, whereas the proportion of LOY cells remained relatively stable with age or followed alternative clonal trajectories [24].
Our study had certain limitations. Given the exploratory design of the study, the number of participants was quite low, rendering some comparisons (namely, regarding smoking, family history of early CVD onset, and chronic kidney disease) underpowered at α = 0.05 and β = 0.20. The small number of mLOY-positive cases (n = 6) is a principal factor that substantially limits statistical power and increases the risk of false-positive and false-negative findings. The HCR cohort included patients with multiple cardiovascular and cardiorenal phenotypes. The combination of these conditions may mask disease specific associations with mLOY and the small number of mLOY-positive patients precluded robust stratified analysis. Blood samples for Visit 2 after 6 months were not available for a few patients, which could negatively influence the estimation of the mLOY temporal variability. The 6-month dynamics of mLOY should be considered as hypothesis-generating and require confirmation on a larger sample size. Due to the limited availability of clinical data for some patients, it was not possible to analyze some clinical parameters explicitly. Another limitation is the lack of external and orthogonal validation of mLOY results obtained using ddPCR. Although the assay demonstrated high linearity in predefined models of male–female DNA mixtures and low interbatch variability, mLOY status in samples from the HCR group was not independently confirmed using targeted sequencing, SNP array analysis, or other copy number determination methods. Finally, this study did not include an age-matched control group, as it did not seek to establish an overall association between mLOY and HCR. The young control group was used only for technical assay validation and threshold definition. All biological and clinical comparisons in the HCR group were performed based solely on within-cohort comparisons.

5. Conclusions

mLOY is one of the most common yet underexplored karyotype alterations in the peripheral blood cells of elderly men. It is associated with various conditions, including CVD, neurodegenerative and oncological diseases, and other clinical and demographic parameters. Some of these parameters can significantly affect mLOY progression. As a biomarker of clonal expansion and cellular senescence, mLOY analysis might become useful for identifying elevated risks of various diseases. Nevertheless, the clinical implications of the mLOY analysis require further investigation.
The ddPCR-based assay for Y chromosome CN analysis presented in this work can be easily implemented in any laboratory equipped with a ddPCR instrument, and ensures the precise quantitative assessment of mLOY. We hope that this study will be useful for other studies dedicated to this topic.
Our study revealed some potentially significant associations between mLOY and several clinical and demographic parameters, although these results should be considered preliminary given the low incidence of mLOY in the HCR group and the apparent confounding effect of age. The exploratory findings regarding temporal variations of mLOY require confirmation in a larger cohort. Further investigation of these dynamics might uncover the elusive nature of this genetic alteration.

Supplementary Materials

The following supporting information can be downloaded at: https://www.mdpi.com/article/10.3390/cardiogenetics16040020/s1, Figure S1: Representative 2D plots for detection of mLOY; Figure S2: Beeswarm plot for the BMI distribution in samples positive and negative for mLOY; Figure S3: Beeswarm plot for the duration of HTN distribution in samples positive and negative for mLOY; Figure S4: Beeswarm plot for the level of HDL distribution in samples positive and negative for mLOY; Figure S5: Beeswarm plot for the level of LDL distribution in samples positive and negative for mLOY; Figure S6: Beeswarm plot for the level of triglycerides distribution in samples positive and negative for mLOY; Figure S7: Beeswarm plot for the level of cholesterol distribution in samples positive and negative for mLOY; Figure S8: Column charts for the incidence of SCORE ≥ 5 in patients positive and negative for mLOY; Figure S9: Column charts for the incidence of IHD in patients positive and negative for mLOY; Figure S10: Column charts for the incidence of PICS in patients positive and negative for mLOY; Figure S11: Column charts for the incidence of CVA in patients positive and negative for mLOY; Figure S12: Column charts for the incidence of smoking in patients positive and negative for mLOY; Table S1: dMIQE2020 checklist for presenting quantitative ddPCR experiments; Table S2: ddPCR results and clinical data for patients in the HCR group.

Author Contributions

Conceptualization, M.J. and I.O.; methodology, M.J., M.G. and D.A.; software, M.J.; validation, M.J., M.G., D.A. and L.S.; formal analysis, M.J., M.G., D.A. and P.P.; investigation, M.J. and P.P.; resources, I.O., Y.B. and L.S.; data curation, M.J.; writing—original draft preparation, M.J., M.G., D.A. and Y.B.; writing—review and editing, M.J., Y.B. and I.O.; visualization, M.J., M.G. and D.A.; supervision, I.O.; project administration, L.S. and I.O.; funding acquisition, I.O. All authors have read and agreed to the published version of the manuscript.

Funding

The study was conducted under the state assignment of Lomonosov Moscow State University.

Institutional Review Board Statement

The study was conducted in accordance with the Declaration of Helsinki and approved by the Institutional Ethics Committee of Lomonosov University Clinic (protocol 5/25, 15 September 2025).

Informed Consent Statement

Written informed consent was obtained from all participants at enrollment in the institutional biobanking program and covered the serial collection, storage, and future research use of biological samples, including samples collected at baseline and at the 6-month follow-up. Because the present study used previously collected, de-identified biobanked samples, the Local Ethics Committee waived the requirement for additional study-specific informed consent.

Data Availability Statement

The original contributions presented in this study are included in the article/Supplementary Material. Further inquiries can be directed to the corresponding author.

Conflicts of Interest

The authors declare no conflicts of interest.

Abbreviations

The following abbreviations are used in this manuscript:
mLOYMosaic loss of Y chromosome
CVDCardiovascular disease
WGSWhole-genome sequencing
qPCRQuantitative polymerase chain reaction
ddPCRDigital droplet polymerase chain reaction
FISHFluorescence in situ hybridization
CNVCopy number variation
HCRHigh cardiovascular risk
BMIBody mass index
IHDIschemic heart disease
PICSPostinfarction cardiosclerosis
CVACerebrovascular accident
PADPeripheral artery disease
HTNHypertension
CKDChronic kidney disease
HDLHigh-density lipoproteins
LDLLow-density lipoproteins
CNCopy number

References

  1. Subrini, J.; Turner, J. Y chromosome functions in mammalian spermatogenesis. eLife 2021, 10, e67345. [Google Scholar] [CrossRef] [Scilit] [PubMed]
  2. Gutiérrez-Hurtado, I.A.; Sánchez-Méndez, A.D.; Becerra-Loaiza, D.S.; Rangel-Villalobos, H.; Torres-Carrillo, N.; Gallegos-Arreola, M.P.; Aguilar-Velázquez, J.A. Loss of the Y Chromosome: A Review of Molecular Mechanisms, Age Inference, and Implications for Men’s Health. Int. J. Mol. Sci. 2024, 25, 4230. [Google Scholar] [CrossRef] [Scilit] [PubMed]
  3. Guo, X.; Dai, X.; Zhou, T.; Wang, H.; Ni, J.; Xue, J.; Wang, X. Mosaic loss of human Y chromosome: What, how and why. Hum. Genet. 2020, 139, 421–446. [Google Scholar] [CrossRef] [Scilit] [PubMed]
  4. Sano, S.; Horitani, K.; Ogawa, H.; Halvardson, J.; Chavkin, N.W.; Wang, Y.; Sano, M.; Mattisson, J.; Hata, A.; Danielsson, M.; et al. Hematopoietic loss of Y chromosome leads to cardiac fibrosis and heart failure mortality. Science 2022, 377, 292–297. [Google Scholar] [CrossRef] [Scilit] [PubMed]
  5. Abou Abdallah, F.; Abdel Massih, C.; Attieh, C.; Chebly, A. The impact of mosaic Loss of the Y Chromosome (mLOY) in men of advanced age. Biogerontology 2024, 25, 943–955. [Google Scholar] [CrossRef] [Scilit] [PubMed]
  6. Zhang, Q.; Zhao, L.; Yang, Y.; Li, S.; Liu, Y.; Chen, C. Mosaic loss of chromosome Y promotes leukemogenesis and clonal hematopoiesis. JCI Insight 2022, 7, e153768. [Google Scholar] [CrossRef] [Scilit] [PubMed]
  7. Thompson, D.J.; Genovese, G.; Halvardson, J.; Ulirsch, J.C.; Wright, D.J.; Terao, C.; Davidsson, O.B.; Day, F.R.; Sulem, P.; Jiang, Y.; et al. Genetic predisposition to mosaic Y chromosome loss in blood. Nature 2019, 575, 652–657. [Google Scholar] [CrossRef] [Scilit] [PubMed]
  8. Mas-Peiro, S.; Abplanalp, W.T.; Rasper, T.; Berkowitsch, A.; Leistner, D.M.; Dimmeler, S.; Zeiher, A.M. Mosaic loss of Y chromosome in monocytes is associated with lower survival after transcatheter aortic valve replacement. Eur. Heart J. 2023, 44, 1943–1952. [Google Scholar] [CrossRef] [Scilit] [PubMed]
  9. Bernstein, N.; Spencer Chapman, M.; Nyamondo, K.; Chen, Z.; Williams, N.; Mitchell, E.; Campbell, P.J.; Cohen, R.L.; Nangalia, J. Analysis of somatic mutations in whole blood from 200,618 individuals identifies pervasive positive selection and novel drivers of clonal hematopoiesis. Nat. Genet. 2024, 56, 1147–1155. [Google Scholar] [CrossRef] [Scilit] [PubMed]
  10. Eppard, M.; Passos, J.F.; Victorelli, S. Telomeres, cellular senescence, and aging: Past and future. Biogerontology 2024, 25, 329–339. [Google Scholar] [CrossRef] [Scilit] [PubMed]
  11. Yeh, J.-K.; Wang, C.-Y. Telomeres and Telomerase in Cardiovascular Diseases. Genes 2016, 7, 58. [Google Scholar] [CrossRef] [Scilit] [PubMed]
  12. Wang, X.; Deng, H.; Lin, J.; Zhang, K.; Ni, J.; Li, L.; Fan, G. Distinct roles of telomerase activity in age-related chronic diseases: An update literature review. Biomed. Pharmacother. 2023, 167, 115553. [Google Scholar] [CrossRef] [Scilit] [PubMed]
  13. Fitzpatrick, A.L.; Kronmal, R.A.; Gardner, J.P.; Psaty, B.M.; Jenny, N.S.; Tracy, R.P.; Walston, J.; Kimura, M.; Aviv, A. Leukocyte telomere length and cardiovascular disease in the cardiovascular health study. Am. J. Epidemiol. 2007, 165, 14–21. [Google Scholar] [CrossRef] [Scilit] [PubMed]
  14. Gruber, H.-J.; Semeraro, M.D.; Renner, W.; Herrmann, M. Telomeres and Age-Related Diseases. Biomedicines 2021, 9, 1335. [Google Scholar] [CrossRef] [Scilit] [PubMed]
  15. Hozakowska-Roszkowska, D.M.; Mengel-From, J.; Hristozova, T.K.; Pedersen, J.K.; Jeune, B.; Andersen-Ranberg, K.; Hjelmborg, J.V.B.; Christensen, K.; Röttger, R.; Nygaard, M. Mosaic loss of Y chromosome and the association to mortality in Danish men aged 56–100 years. Mech. Ageing Dev. 2024, 222, 111979. [Google Scholar] [CrossRef] [Scilit] [PubMed]
  16. Lin, S.-H.; Loftfield, E.; Sampson, J.N.; Zhou, W.; Yeager, M.; Freedman, N.D.; Chanock, S.J.; Machiela, M.J. Mosaic chromosome Y loss is associated with alterations in blood cell counts in UK Biobank men. Sci. Rep. 2020, 10, 3655. [Google Scholar] [CrossRef] [Scilit] [PubMed]
  17. Jakubek, Y.A.; Ma, X.; Stilp, A.M.; Yu, F.; Bacon, J.; Wong, J.W.; Aguet, F.; Ardlie, K.; Arnett, D.K.; Barnes, K.; et al. Genomic and phenotypic correlates of mosaic loss of chromosome Y in blood. Am. J. Hum. Genet. 2025, 112, 276–290. [Google Scholar] [CrossRef] [Scilit] [PubMed]
  18. Guan, X.; Meng, X.; Zhong, G.; Zhang, Z.; Wang, C.; Xiao, Y.; Fu, M.; Zhao, H.; Zhou, Y.; Hong, S.; et al. Particulate matter pollution, polygenic risk score and mosaic loss of chromosome Y in middle-aged and older men from the Dongfeng-Tongji cohort study. J. Hazard. Mater. 2024, 471, 134315. [Google Scholar] [CrossRef] [Scilit] [PubMed]
  19. Weyrich, M.; Cremer, S.; Gerster, M.; Sarakpi, T.; Rasper, T.; Zewinger, S.; Patyna, S.R.; Leistner, D.M.; Heine, G.H.; Wanner, C.; et al. Loss of Y Chromosome and Cardiovascular Events in Chronic Kidney Disease. Circulation 2024, 150, 746–757. [Google Scholar] [CrossRef] [Scilit] [PubMed]
  20. Lim, J.; Hubbard, A.K.; Blechter, B.; Shi, J.; Zhou, W.; Loftfield, E.; Machiela, M.J.; Wong, J.Y.Y. Associations Between Mosaic Loss of Sex Chromosomes and Incident Hospitalization for Atrial Fibrillation in the United Kingdom. J. Am. Heart Assoc. 2024, 13, e036984. [Google Scholar] [CrossRef] [Scilit] [PubMed]
  21. Zhou, W.; Huang, W.-Y.; Freedman, N.D.; Machiela, M. Estimation of mosaic loss of Y chromosome cell fraction with genotyping arrays lacking coverage in the pseudoautosomal region. BMC Bioinform. 2025, 26, 60. [Google Scholar] [CrossRef] [Scilit] [PubMed]
  22. Bjurling, J.; Chavkin, N.W.; Halvardson, J.; Thel, M.C.; Mattisson, J.; Kim, J.S.; Zaghlool, A.; Ma, S.-F.; Martinez, F.J.; Anstrom, K.; et al. Mosaic loss of chromosome Y in blood is associated with male susceptibility for idiopathic pulmonary fibrosis. Commun. Med. 2025, 5, 246. [Google Scholar] [CrossRef] [Scilit] [PubMed]
  23. Bharuthram, A.; Paximadis, M.; Picton, A.C.P.; Tiemessen, C.T. Comparison of a quantitative Real-Time PCR assay and droplet digital PCR for copy number analysis of the CCL4L genes. Infect. Genet. Evol. 2014, 25, 28–35. [Google Scholar] [CrossRef] [Scilit] [PubMed]
  24. Danielsson, M.; Halvardson, J.; Davies, H.; Torabi Moghadam, B.; Mattisson, J.; Rychlicka-Buniowska, E.; Jaszczyński, J.; Heintz, J.; Lannfelt, L.; Giedraitis, V.; et al. Longitudinal changes in the frequency of mosaic chromosome Y loss in peripheral blood cells of aging men varies profoundly between individuals. Eur. J. Hum. Genet. 2020, 28, 349–357. [Google Scholar] [CrossRef] [Scilit] [PubMed]
  25. Dumanski, J.P.; Lambert, J.-C.; Rasi, C.; Giedraitis, V.; Davies, H.; Grenier-Boley, B.; Lindgren, C.M.; Campion, D.; Dufouil, C.; Pasquier, F.; et al. Mosaic Loss of Chromosome Y in Blood Is Associated with Alzheimer Disease. Am. J. Hum. Genet. 2016, 98, 1208–1219. [Google Scholar] [CrossRef] [Scilit] [PubMed]
  26. Huber, D.; Voith von Voithenberg, L.; Kaigala, G.V. Fluorescence in situ hybridization (FISH): History, limitations and what to expect from micro-scale FISH? Micro Nano Eng. 2018, 1, 15–24. [Google Scholar] [CrossRef] [Scilit]
  27. Zhou, W.; Machiela, M.J.; Freedman, N.D.; Rothman, N.; Malats, N.; Dagnall, C.; Caporaso, N.; Teras, L.T.; Gaudet, M.M.; Gapstur, S.M.; et al. Mosaic loss of chromosome Y is associated with common variation near TCL1A. Nat. Genet. 2016, 48, 563–568. [Google Scholar] [CrossRef] [Scilit] [PubMed]
  28. Bagger, F.O.; Borgwardt, L.; Jespersen, A.S.; Hansen, A.R.; Bertelsen, B.; Kodama, M.; Nielsen, F.C. Whole genome sequencing in clinical practice. BMC Med. Genom. 2024, 17, 39. [Google Scholar] [CrossRef] [Scilit] [PubMed]
  29. Baker, D.; Hirst, A.J.; Gokhale, P.J.; Juarez, M.A.; Williams, S.; Wheeler, M.; Bean, K.; Allison, T.F.; Moore, H.D.; Andrews, P.W.; et al. Detecting Genetic Mosaicism in Cultures of Human Pluripotent Stem Cells. Stem Cell Rep. 2016, 7, 998–1012. [Google Scholar] [CrossRef] [Scilit] [PubMed]
  30. Cheng, J.B.; Liu, Q.; Long, F.; Huang, D.X.; Yi, S.H. Analysis of the Yp11.2 Deletion Region of Phenotypically Normal Males with an AMELY-Null Allele in the Chinese Han Population. Genet. Test. Mol. Biomark. 2019, 23, 359–362. [Google Scholar] [CrossRef] [Scilit] [PubMed]
  31. Kimura, A.; Hishimoto, A.; Otsuka, I.; Okazaki, S.; Boku, S.; Horai, T.; Izumi, T.; Takahashi, M.; Ueno, Y.; Shirakawa, O.; et al. Loss of chromosome Y in blood, but not in brain, of suicide completers. PLoS ONE 2018, 13, e0190667. [Google Scholar] [CrossRef] [Scilit] [PubMed]
  32. Forsberg, L.A. Loss of Chromosome Y (LOY) in blood cells is associated with increased risk for disease and mortality in aging men. Hum. Genet. 2017, 136, 657–663. [Google Scholar] [CrossRef] [Scilit] [PubMed]
  33. Loftfield, E.; Zhou, W.; Graubard, B.I.; Yeager, M.; Chanock, S.J.; Freedman, N.D.; Machiela, M.J. Predictors of mosaic chromosome Y loss and associations with mortality in the UK Biobank. Sci. Rep. 2018, 8, 12316. [Google Scholar] [CrossRef] [Scilit] [PubMed]
  34. Hachiya, T.; Kobayashi, T.; Tsutae, W.; Gan, P.H.P.; Baran, I.S.; Horie, S. Evaluation of the usefulness of saliva for mosaic loss of chromosome Y analysis. Sci. Rep. 2021, 11, 3769. [Google Scholar] [CrossRef] [Scilit] [PubMed]
  35. Suzuki, E.; Kobori, Y.; Katsumi, M.; Ushijima, K.; Uchiyama, T.; Okada, H.; Miyado, M.; Fukami, M. Copy-number analysis of Y-linked loci in young men with non-obstructive azoospermia: Implications for the rarity of early onset mosaic loss of chromosome Y. Reprod. Med. Biol. 2020, 19, 178–181. [Google Scholar] [CrossRef] [Scilit] [PubMed]
  36. Weng, C.; Zhao, Y.; Song, M.; Shao, Z.; Pang, Y.; Yu, C.; Pei, P.; Yang, L.; Millwood, I.Y.; Walters, R.G.; et al. Mosaic loss of chromosome Y, tobacco smoking and risk of age-related lung diseases: Insights from two prospective cohorts. Eur. Respir. J. 2024, 64, 2400968. [Google Scholar] [CrossRef] [Scilit] [PubMed]
  37. Dumanski, J.P.; Rasi, C.; Lönn, M.; Davies, H.; Ingelsson, M.; Giedraitis, V.; Lannfelt, L.; Magnusson, P.K.E.; Lindgren, C.M.; Morris, A.P.; et al. Smoking Is Associated with Mosaic Loss of Chromosome Y. Science 2015, 347, 81–83. [Google Scholar] [CrossRef] [Scilit] [PubMed]
  38. Loftfield, E.; Zhou, W.; Yeager, M.; Chanock, S.J.; Freedman, N.D.; Machiela, M.J. Mosaic Y Loss Is Moderately Associated with Solid Tumor Risk. Cancer Res. 2019, 79, 461–466. [Google Scholar] [CrossRef] [Scilit] [PubMed]
  39. Wang, D.; Hadad, N.; Moss, S.; Lopez-Jimenez, E.; Johnson, S.R.; Maher, T.M.; Molyneaux, P.L.; Zhao, Y.; Perry, J.R.B.; Wolters, P.J.; et al. Association between mosaic loss of chromosome Y and pulmonary fibrosis susceptibility and severity. bioRxiv 2024. [Google Scholar] [CrossRef] [Scilit] [PubMed]
  40. Weyrich, M.; Windschmitt, J.; Abplanalp, W.T.; Ware, A.; Sarakpi, T.; Zewinger, S.; Zanders, L.; Dimmeler, S.; Zeiher, A.M.; Speer, T. Loss of Y chromosome: Proteomic signatures in human cardiovascular disease. Eur. Heart J. 2025, 46, 5237–5239. [Google Scholar] [CrossRef] [Scilit] [PubMed]
  41. Chavkin, N.W. Age-related cardiovascular disease and mosaic hematopoietic loss of the Y chromosome. J. Cardiovasc. Aging 2025, 5, 14. [Google Scholar] [CrossRef] [Scilit] [PubMed]
  42. Wu, T.; You, Y.; Zhou, Y.; Hong, S.; Bai, Y.; Guo, H. Frailty, mosaic loss of Y chromosome, and mortality in older Chinese males. J. Gerontol. Ser. A Biol. Sci. Med. Sci. 2025, 80, glaf178. [Google Scholar] [CrossRef] [Scilit] [PubMed]
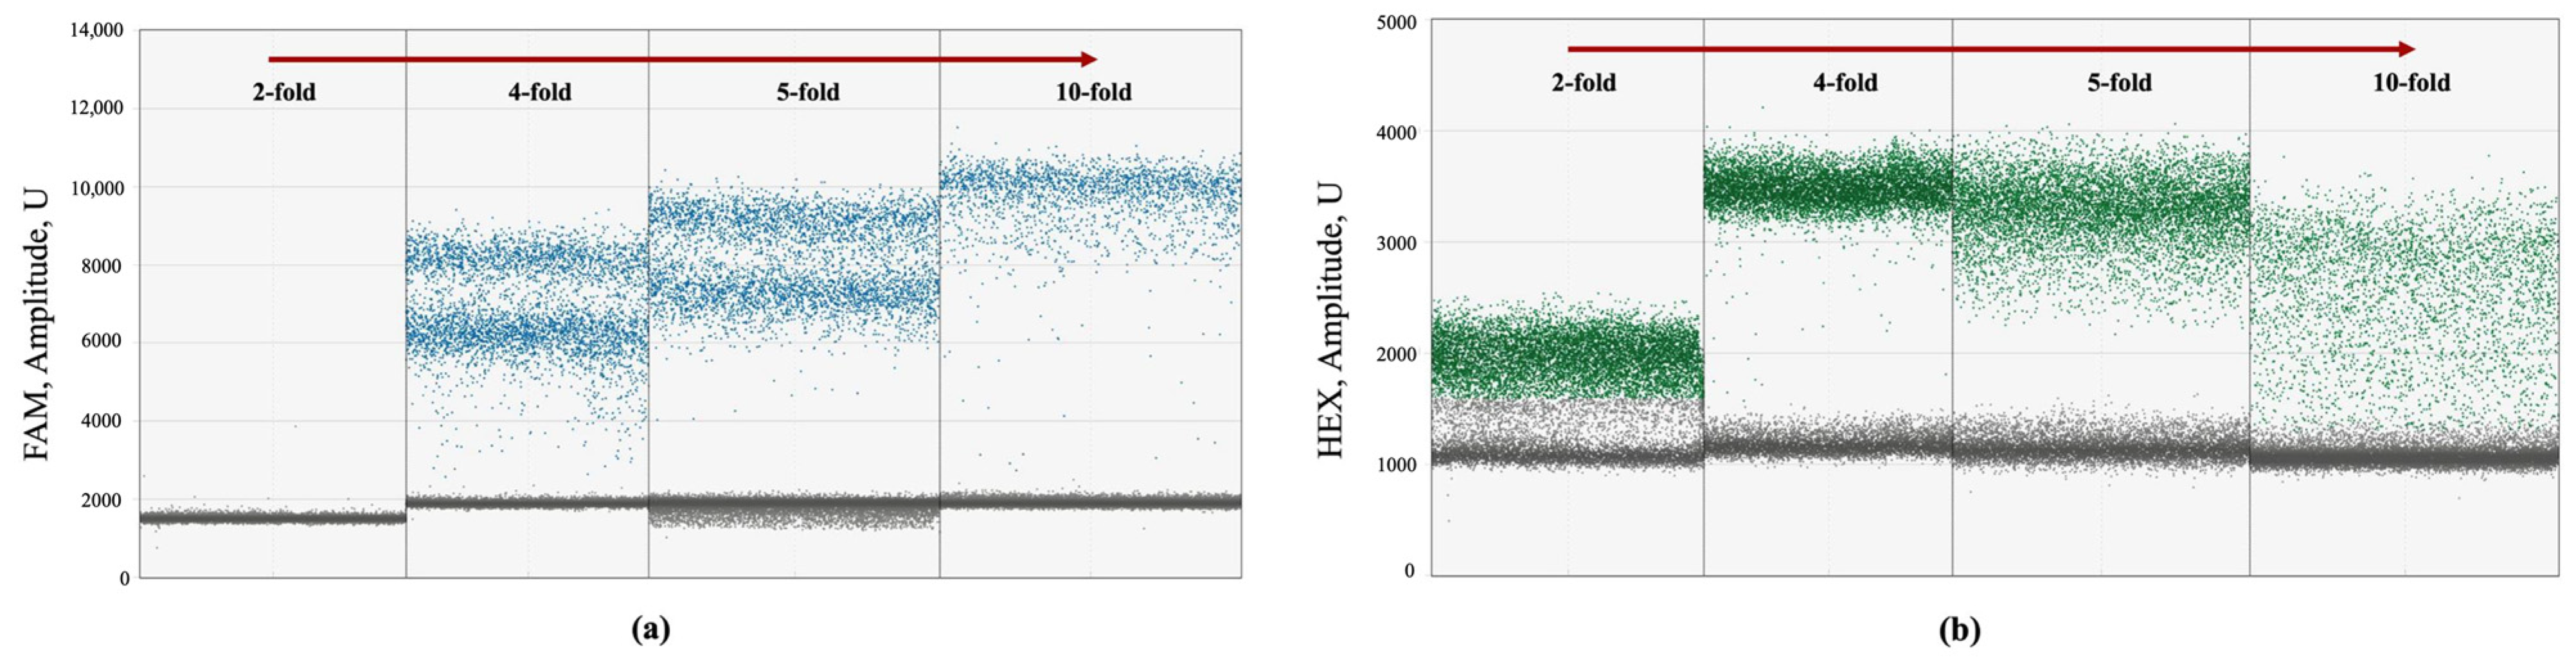
Figure 1. Representative 1D ddPCR plots illustrating the effect of restriction mixture dilution on cluster separation. (a) Distribution of FAM-positive (blue) droplets corresponding to the Y chromosome. (b) Distribution of HEX-positive (green) droplets corresponding to chromosome 1. 2-, 4-, 5-, and 10-fold dilutions were performed. FAM, 6-carboxyfluorescein; HEX, hexachlorofluorescein.
Cardiogenetics 16 00020 g001
Figure 2. Results of the linearity assessment of the developed mLOY detection assay. The analysis was performed using ddPCR. mLOY models with an expected copy number range of 0.6–1.0 were generated by mixing pooled male and female DNA samples at various ratios.
Cardiogenetics 16 00020 g002
Figure 3. Beeswarm plot for Y chromosome copy number in the control group (n = 48). Each dot represents a data point, red horizontal arrows indicate the median values, and blue horizontal arrows indicate the first and third quartiles (Q1 and Q3). The rectangular outlines surrounding each beeswarm are used only as visual guides to group individual data points. The median was 0.965 (0.937–0.997).
Cardiogenetics 16 00020 g003
Figure 4. Beeswarm plot for mLOY-positive cases (n = 6) in the HCR group at Visit 1. Each dot represents a data point, red horizontal arrows indicate the median values, and blue horizontal arrows indicate the first and third quartiles (Q1 and Q3). The rectangular outlines surrounding each beeswarm are used only as visual guides to group individual data points. The threshold for the mLOY call was set to 0.9 based on preclinical validation. HCR, high cardiovascular risk.
Cardiogenetics 16 00020 g004
Figure 5. Distribution of telomere length and telomerase activity in mLOY-positive and -negative samples (a) Beeswarm plot for telomere length distribution. (b) Beeswarm plot for telomerase activity distribution. Each dot represents a data point, red horizontal arrows indicate the median values, and blue horizontal arrows indicate the first and third quartiles (Q1 and Q3). The rectangular outlines surrounding each beeswarm are used only as visual guides to group individual data points.
Cardiogenetics 16 00020 g005
Figure 6. Beeswarm plot for age distribution in patients positive and negative for mLOY. Each dot represents a data point, red horizontal arrows indicate the median values, and blue horizontal arrows indicate the first and third quartiles (Q1 and Q3). The rectangular outlines surrounding each beeswarm are used only as visual guides to group individual data points. * p value did not pass the threshold for Benjamini–Hochberg correction at an FDR of 0.2.
Cardiogenetics 16 00020 g006
Figure 7. Beeswarm plots for categorical data analysis in patients positive and negative for mLOY. (a) Beeswarm plot for sedentary lifestyle. (b) Beeswarm plot for family history of early-onset CVD. (c) Beeswarm plot for CKD. (d) Beeswarm plot for the peripheral artery disease. “mLOY+”: patients positive for mLOY; “mLOY−”—patients negative for mLOY. Each dot represents a data point, red horizontal arrows indicate the median values, and blue horizontal arrows indicate the first and third quartiles (Q1 and Q3). The rectangular outlines surrounding each beeswarm are used only as visual guides to group individual data points. The reported p-value refers to the comparison of the frequencies of the corresponding characteristic between the mLOY-positive and mLOY-negative groups (Fisher’s exact test). Age did not differ significantly between the corresponding subgroups defined by the clinical characteristic (p > 0.05). Analysis of confounding factors revealed that age moderately attenuated the association of mLOY with sedentary lifestyle (∆%logOR = 10.7%), and substantially influenced the trend towards the association with CKD and PAD (∆%logOR = 36.0% and ∆%logOR = 46.4%). * p values below 0.05 that did not pass the threshold for Benjamini–Hochberg correction at an FDR of 0.2. CVD, cardiovascular disease; CKD, chronic kidney disease; PAD, peripheral artery disease; EOFH, for family history of early-onset CVD.
Cardiogenetics 16 00020 g007
Figure 8. Y chromosome copy number dynamics over a 6-month period. The dotted line indicates the threshold set to identify mLOY. Biomaterial was not available for several patients at Visit 2, including one who had previously tested positive for mLOY.
Cardiogenetics 16 00020 g008
Table 1. Demographic and clinical characteristics of the study participants.
ParametersHCR Group
(n = 65)
Control Group
(n = 48)
Age, years, median (Q1–Q3)65.00 (59.00–71.00)25.00 (24.00–28.00)
BMI, kg/m 2, median (Q1–Q3)29.45 (26.51–33.99)N/A
IHD, % (n) 148.44% (31)0.00% (0)
PICS, % (n)29.23% (19)0.00% (0)
CVA, % (n)9.23% (6)0.00% (0)
PAD, % (n)7.69% (5)0.00% (0)
HTN duration, years, median (Q1–Q3)10.00 (4.00–15.00)0.00
HTN, stage N/A
stage 1, % (n)41.54% (27)
stage 2, % (n)32.31% (21)
stage 3, % (n)26.15% (17)
Smoking
never smokers, % (n)27.69% (18)100.00% (48)
former smokers, % (n)55.38% (36)0.00% (0)
smokers, % (n)16.92% (11)0.00% (0)
Type 2 diabetes, % (n)33.85% (22)0.00% (0)
CKD, stage
no, % (n)55.38% (36)100.00% (48)
stage 1, % (n)6.15% (4)0.00% (0)
stage 2, % (n)27.69% (18)0.00% (0)
stage 3, % (n)9.23% (6)0.00% (0)
stage 4, % (n)1.54% (1)0.00% (0)
stage 5, % (n)0.00% (0)0.00% (0)
Family history of early-onset CVD, % (n) 238.46% (25)N/A
Sedentary lifestyle, % (n)55.38% (36)0.00% (0)
CVD, % (n)66.15% (43)0.00% (0)
HDL, mmol/L, median (Q1–Q3) 31.20 (1.00–1.43)N/A
LDL, mmol/L, median (Q1–Q3) 32.95 (2.08–4.10)N/A
Cholesterol level, mmol/L, median (Q1–Q3) 35.05 (4.00–6.70)N/A
Triglycerides, mmol/L, median (Q1–Q3) 32.20 (1.78–3.30)N/A
Omega-3 Index, %, median (Q1–Q3)7.00 (6.00–7.50)N/A
SCORE ≥ 5%, % (n) 433.85% (22)0.00% (0)
Note: Data were collected at the time of study enrollment. CVD, cardiovascular disease; BMI, body mass index; IHD, ischemic heart disease; PICS, postinfarction cardiosclerosis; CVA, cerebrovascular accident; PAD, peripheral artery disease; HTN, hypertension; CKD, chronic kidney disease; HDL, high-density lipoproteins; LDL, low-density lipoproteins; N/A, not available/not applicable; 1: data were not available for 1/65 patients; 2: Family history of early-onset CVD < 55 years in men, <65 years in women; 3: data were not available for 7/65 patients; 4: the scale was not applied to 43 patients with CVD.
Table 2. Primers and probes used for detecting mLOY based on CNV.
GeneAmplicon SizeOligonucleotideSequence (5′-3′)Concentration 1
SRY82 bpForward primerGGG ATT CTC TAG AGC CA0.9 μM
Reverse primerCCA GGA TAG AGT GAA GC0.9 μM
ProbeFAM-CGC ATT CA TCG TGT GGT CTC G-BHQ10.25 μM
EIF2C181 bpForward primerGTT CGG CTT TCA CCA GTC T0.9 μM
Reverse primerCTC CAT AGC TCT CCC CAC TC0.9 μM
ProbeHEX-CGC CCT GCC ATG TGG AAG AT-BHQ10.25 μM
1 Concentration in the final ddPCR mixture. FAM, 6-carboxyfluorescein; HEX, hexachlorofluorescein; BHQ1, black hole quencher 1.
Disclaimer/Publisher’s Note: The statements, opinions and data contained in all publications are solely those of the individual author(s) and contributor(s) and not of MDPI and/or the editor(s). MDPI and/or the editor(s) disclaim responsibility for any injury to people or property resulting from any ideas, methods, instructions or products referred to in the content.